
Environmental and Economic Assessment of Portable Systems: Production of Wood-Briquettes and Torrefied-Briquettes to Generate Heat and Electricity

 , ,
, ,
Abstract
:
1. Introduction
2. Materials and Methods
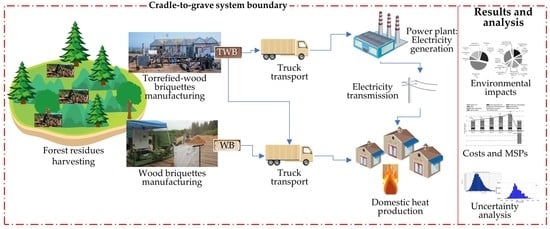
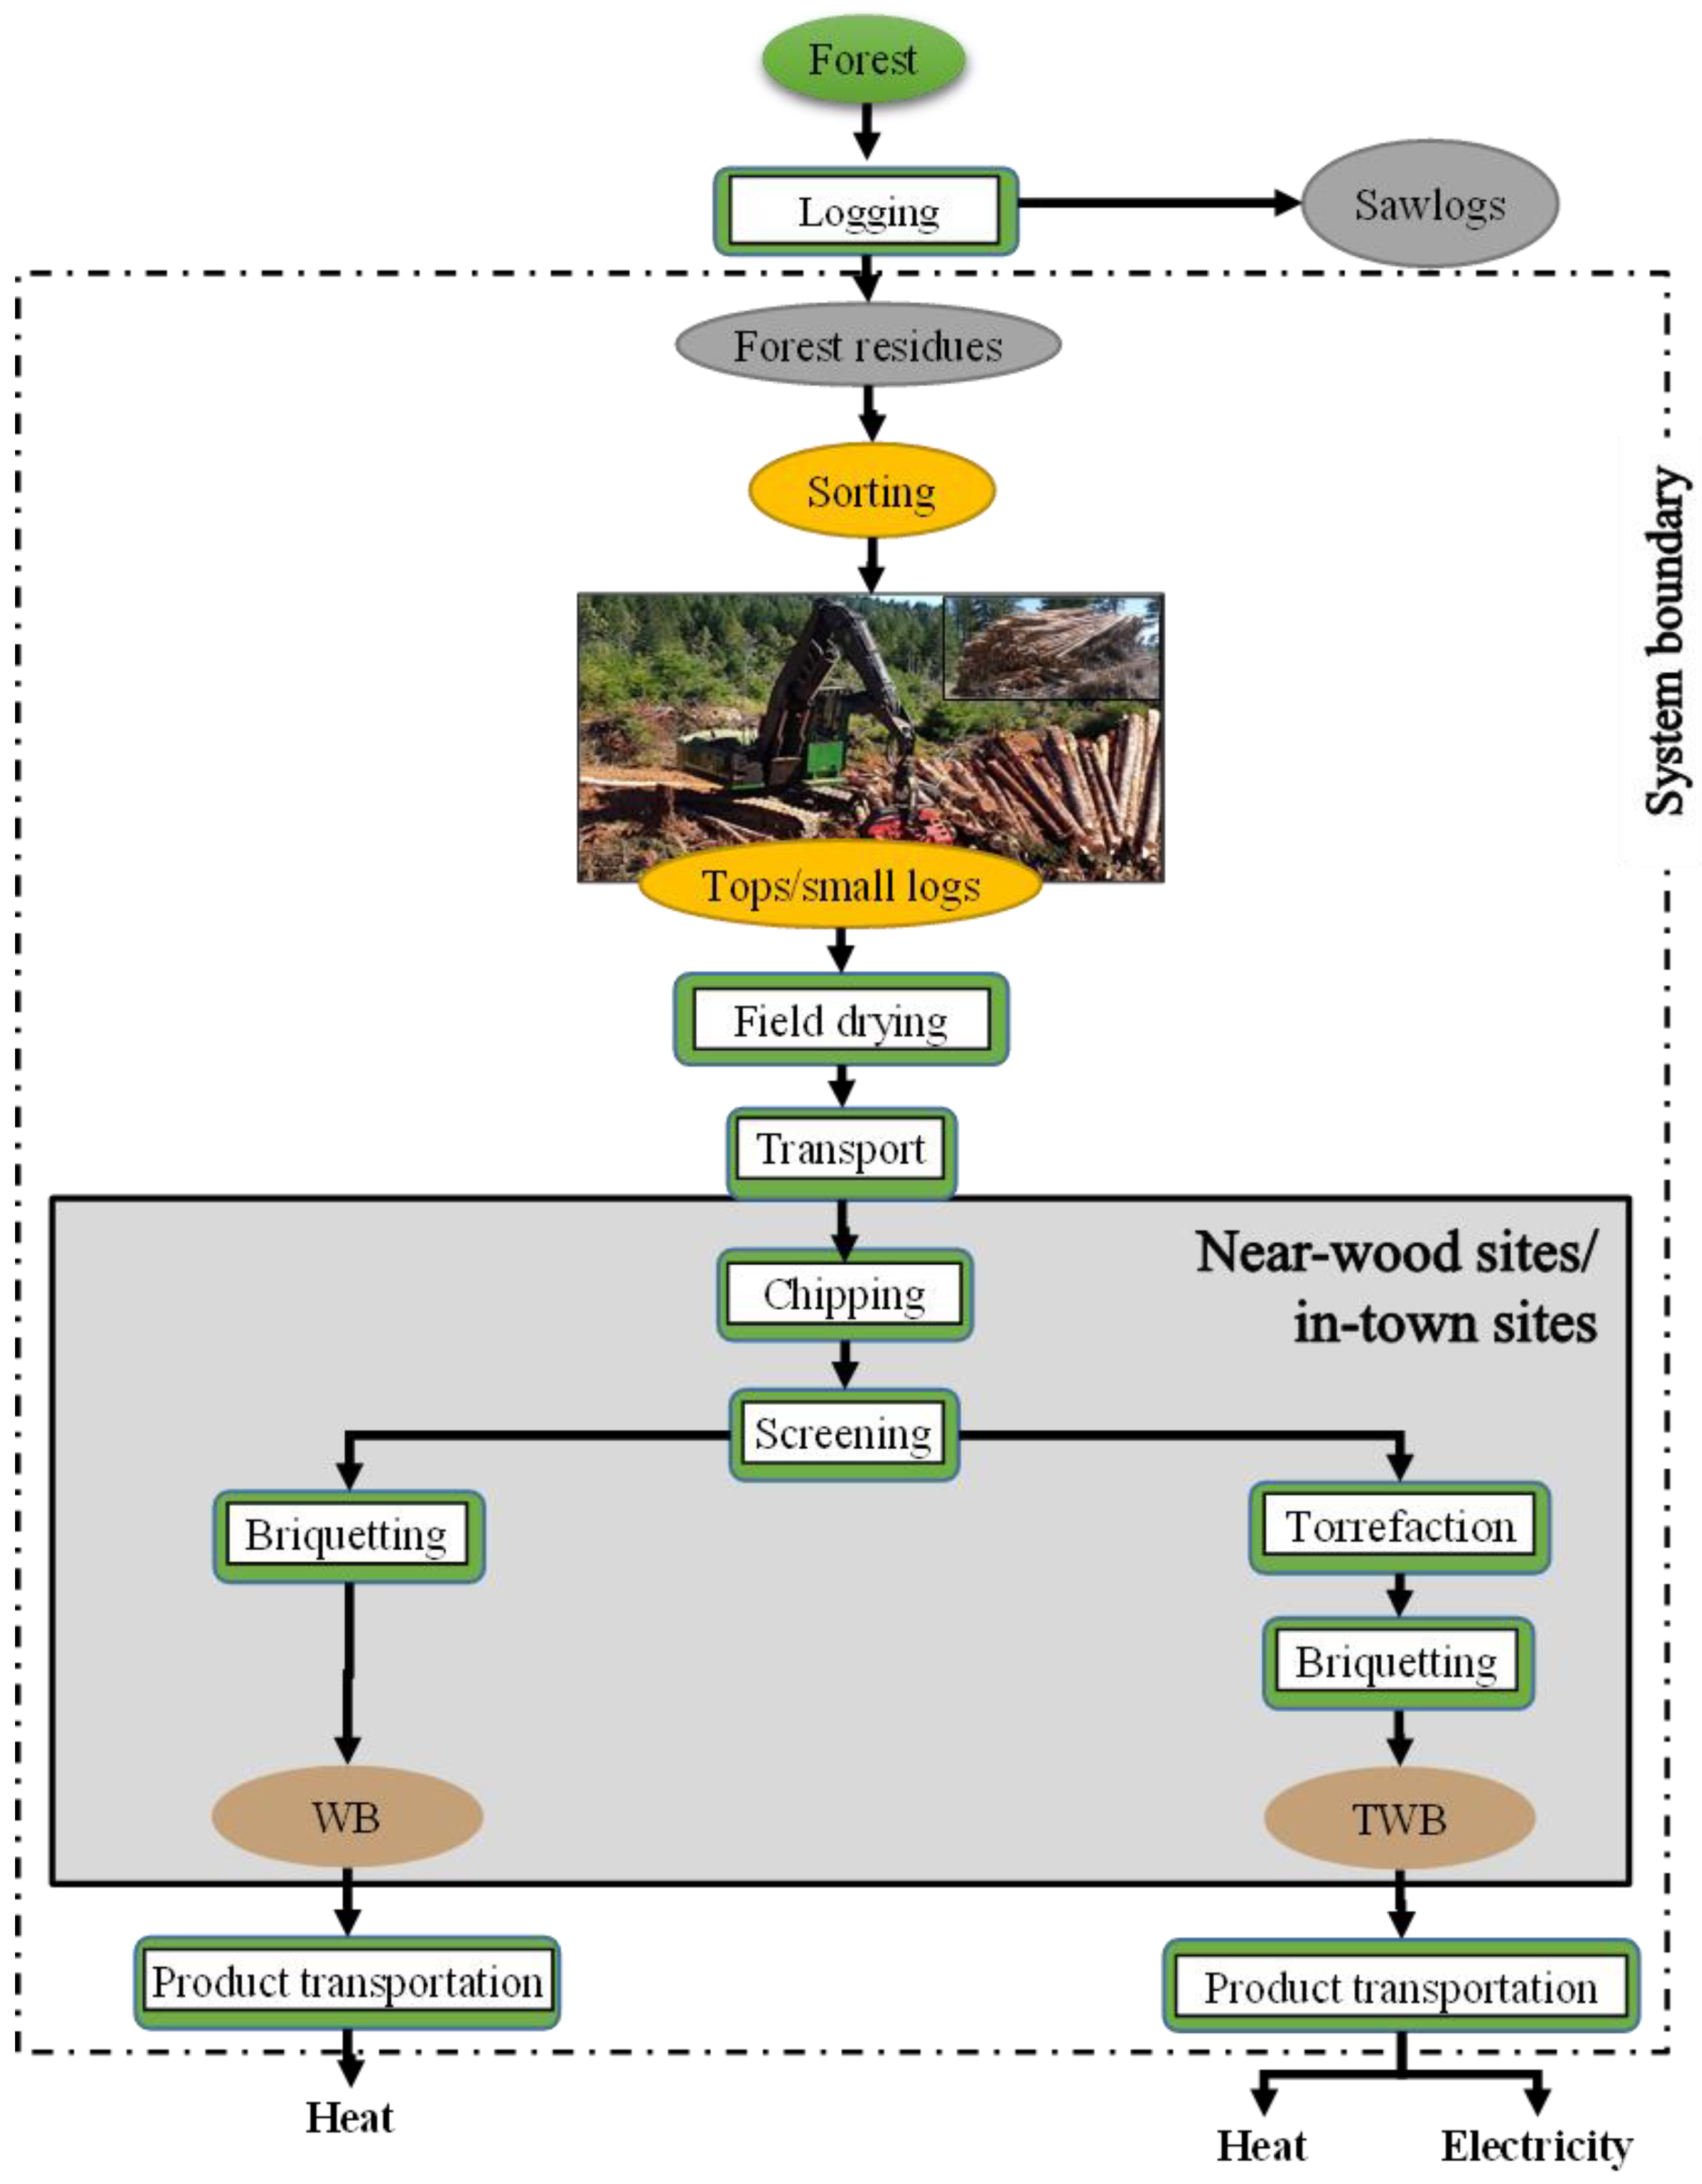
2.1. System Boundary and Description
2.1.1. Biomass Feedstock Supply Chain
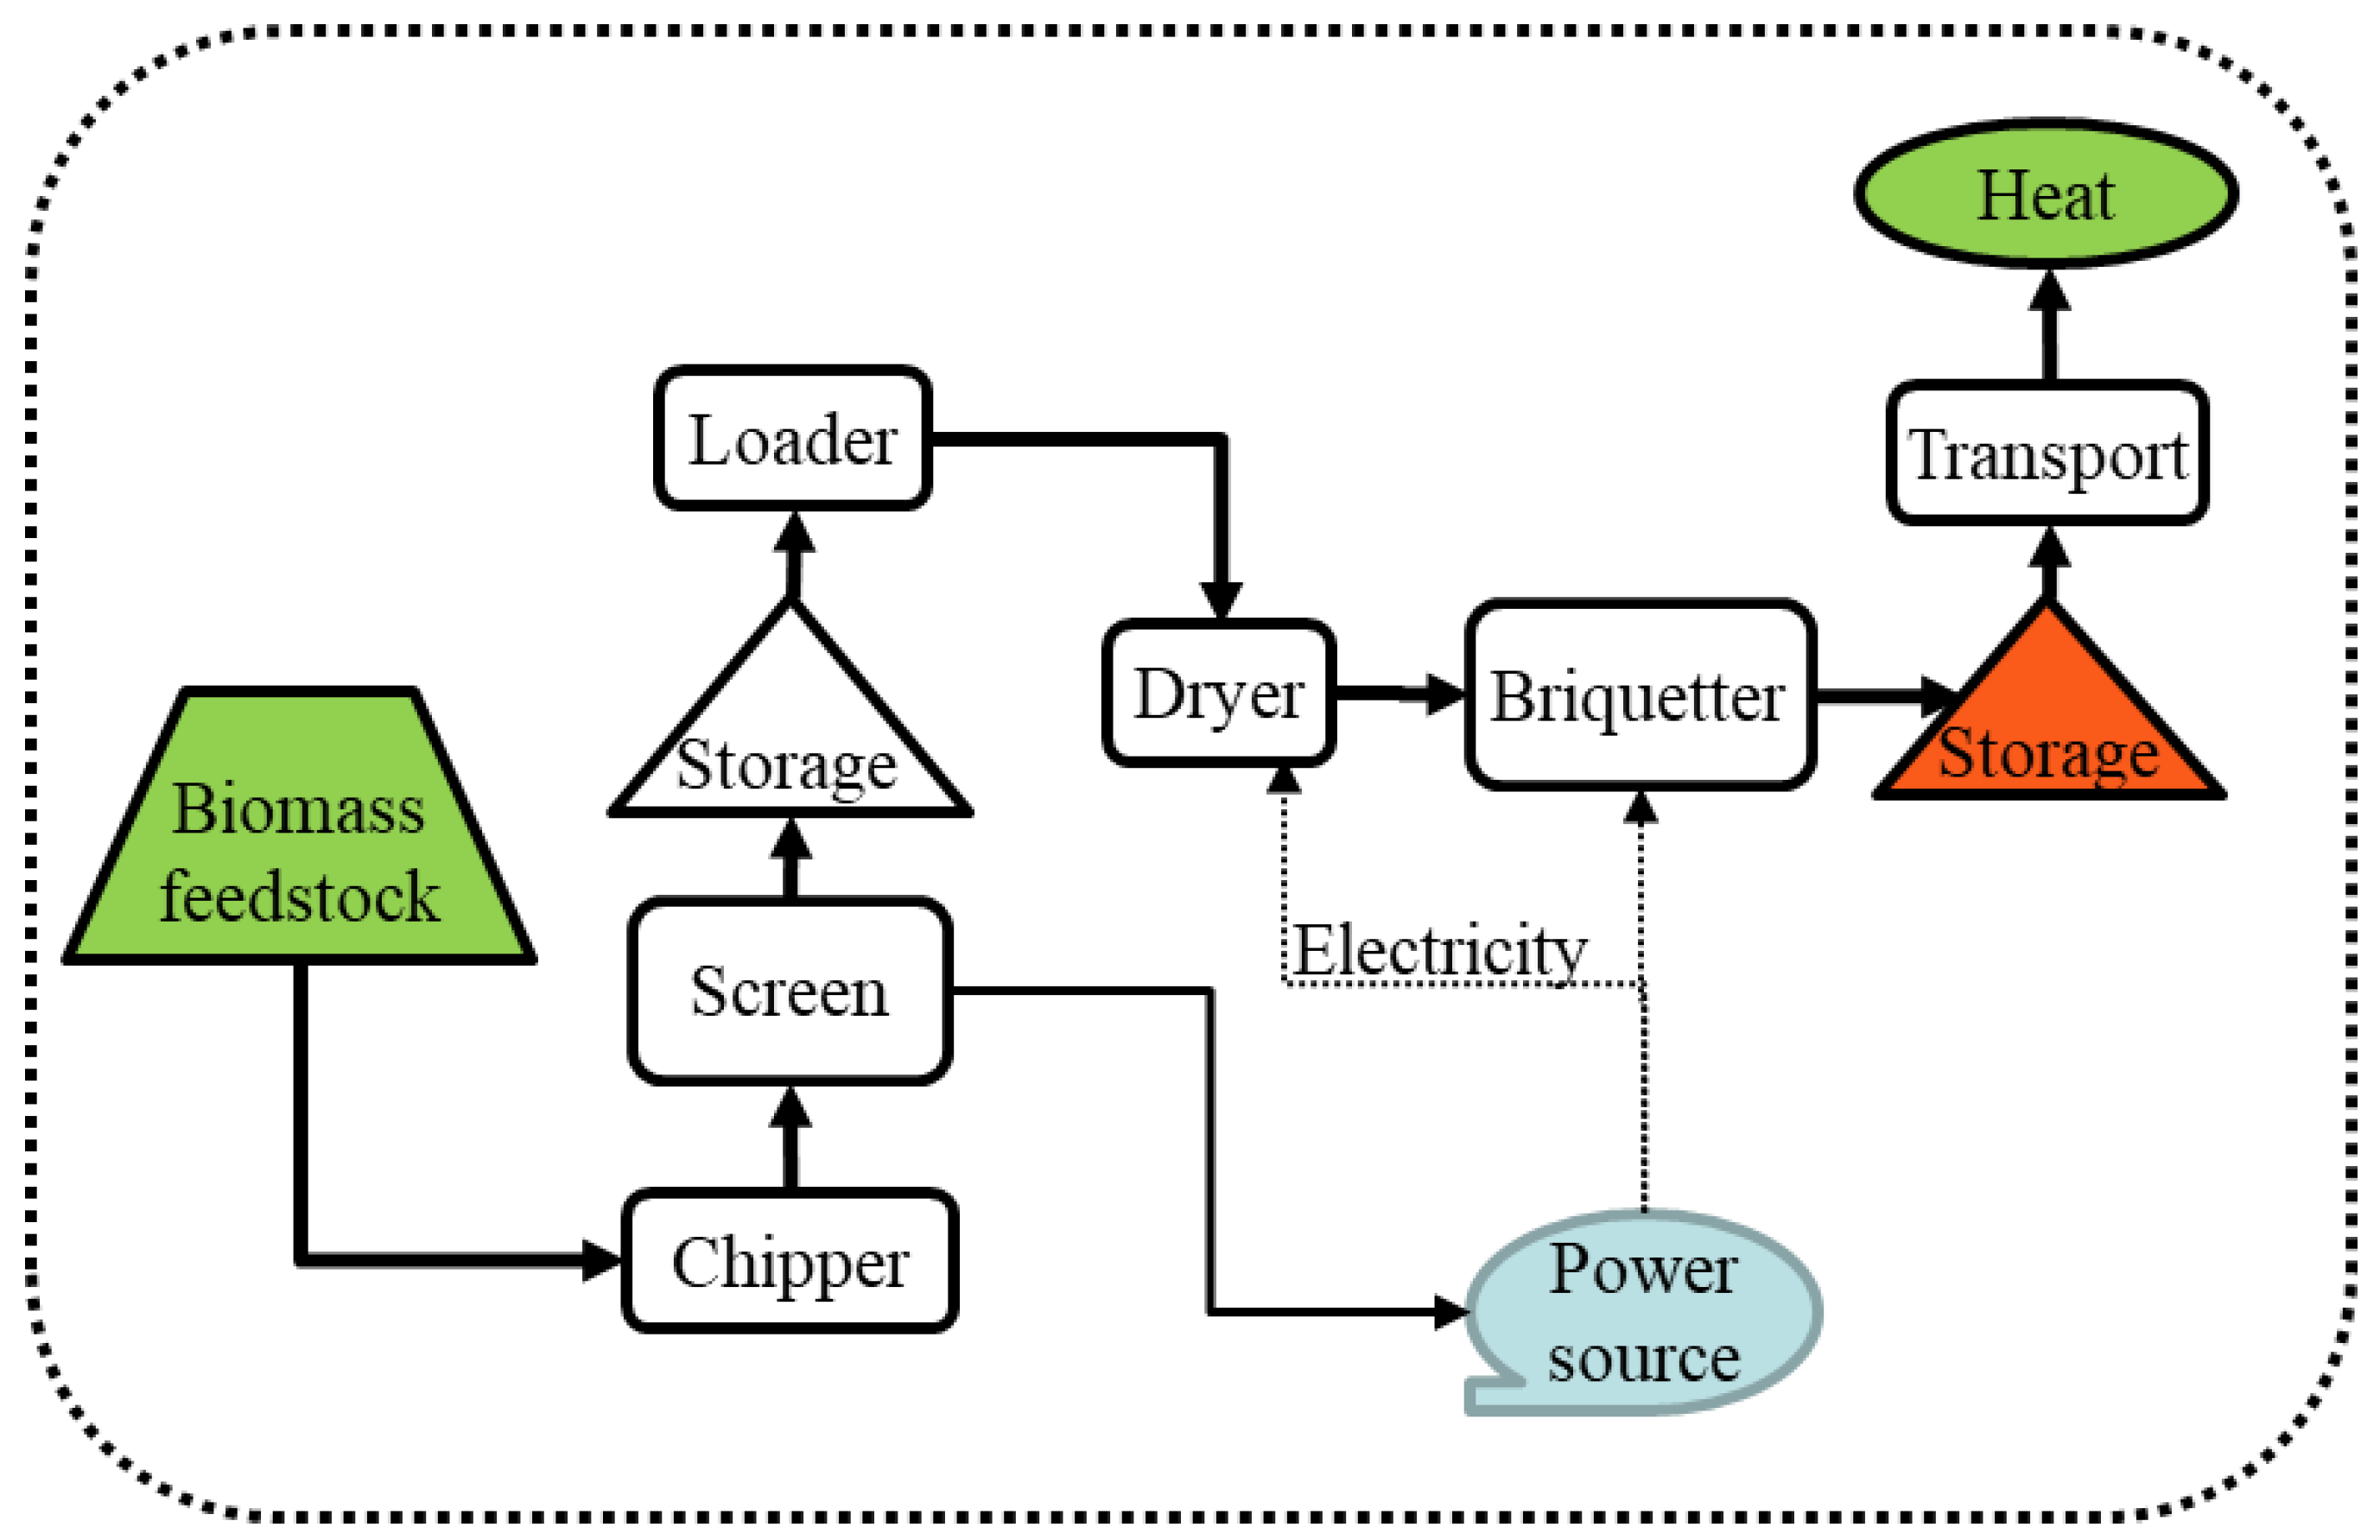
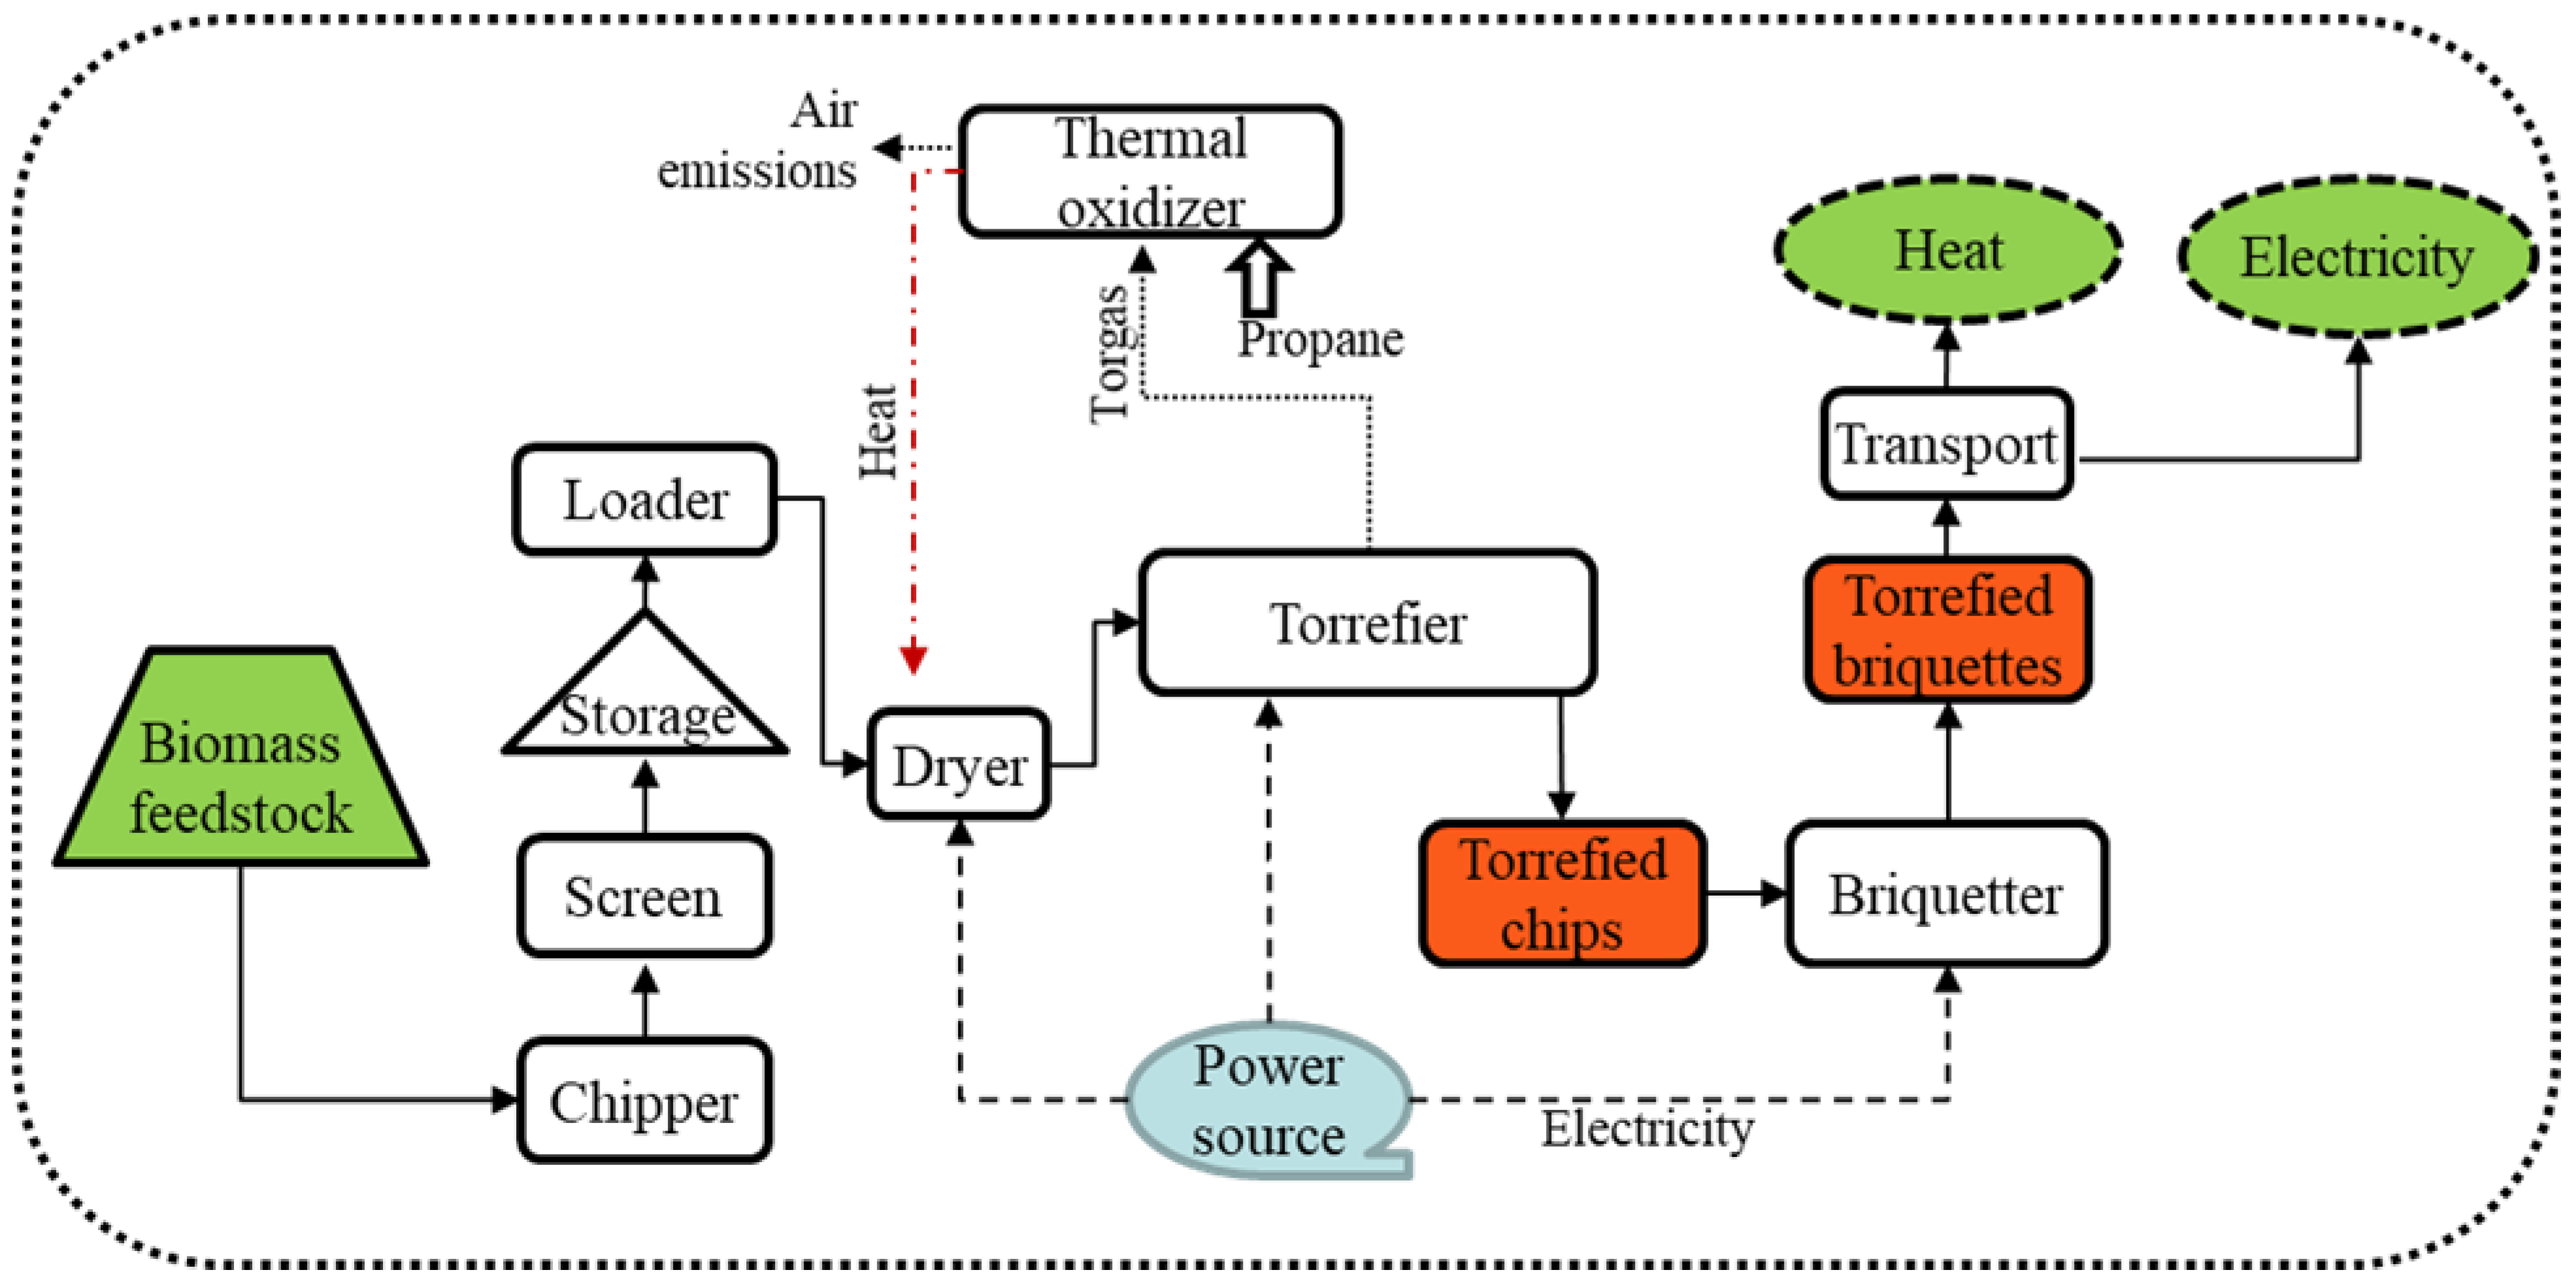
2.1.2. Product Manufacturing at Near-Woods Site
2.1.3. Scenario Analysis
2.2. LCA Method
2.3. TEA Method
2.4. Uncertainty Analysis
3. Results
3.1. Life Cycle Environmental and Economic Impacts
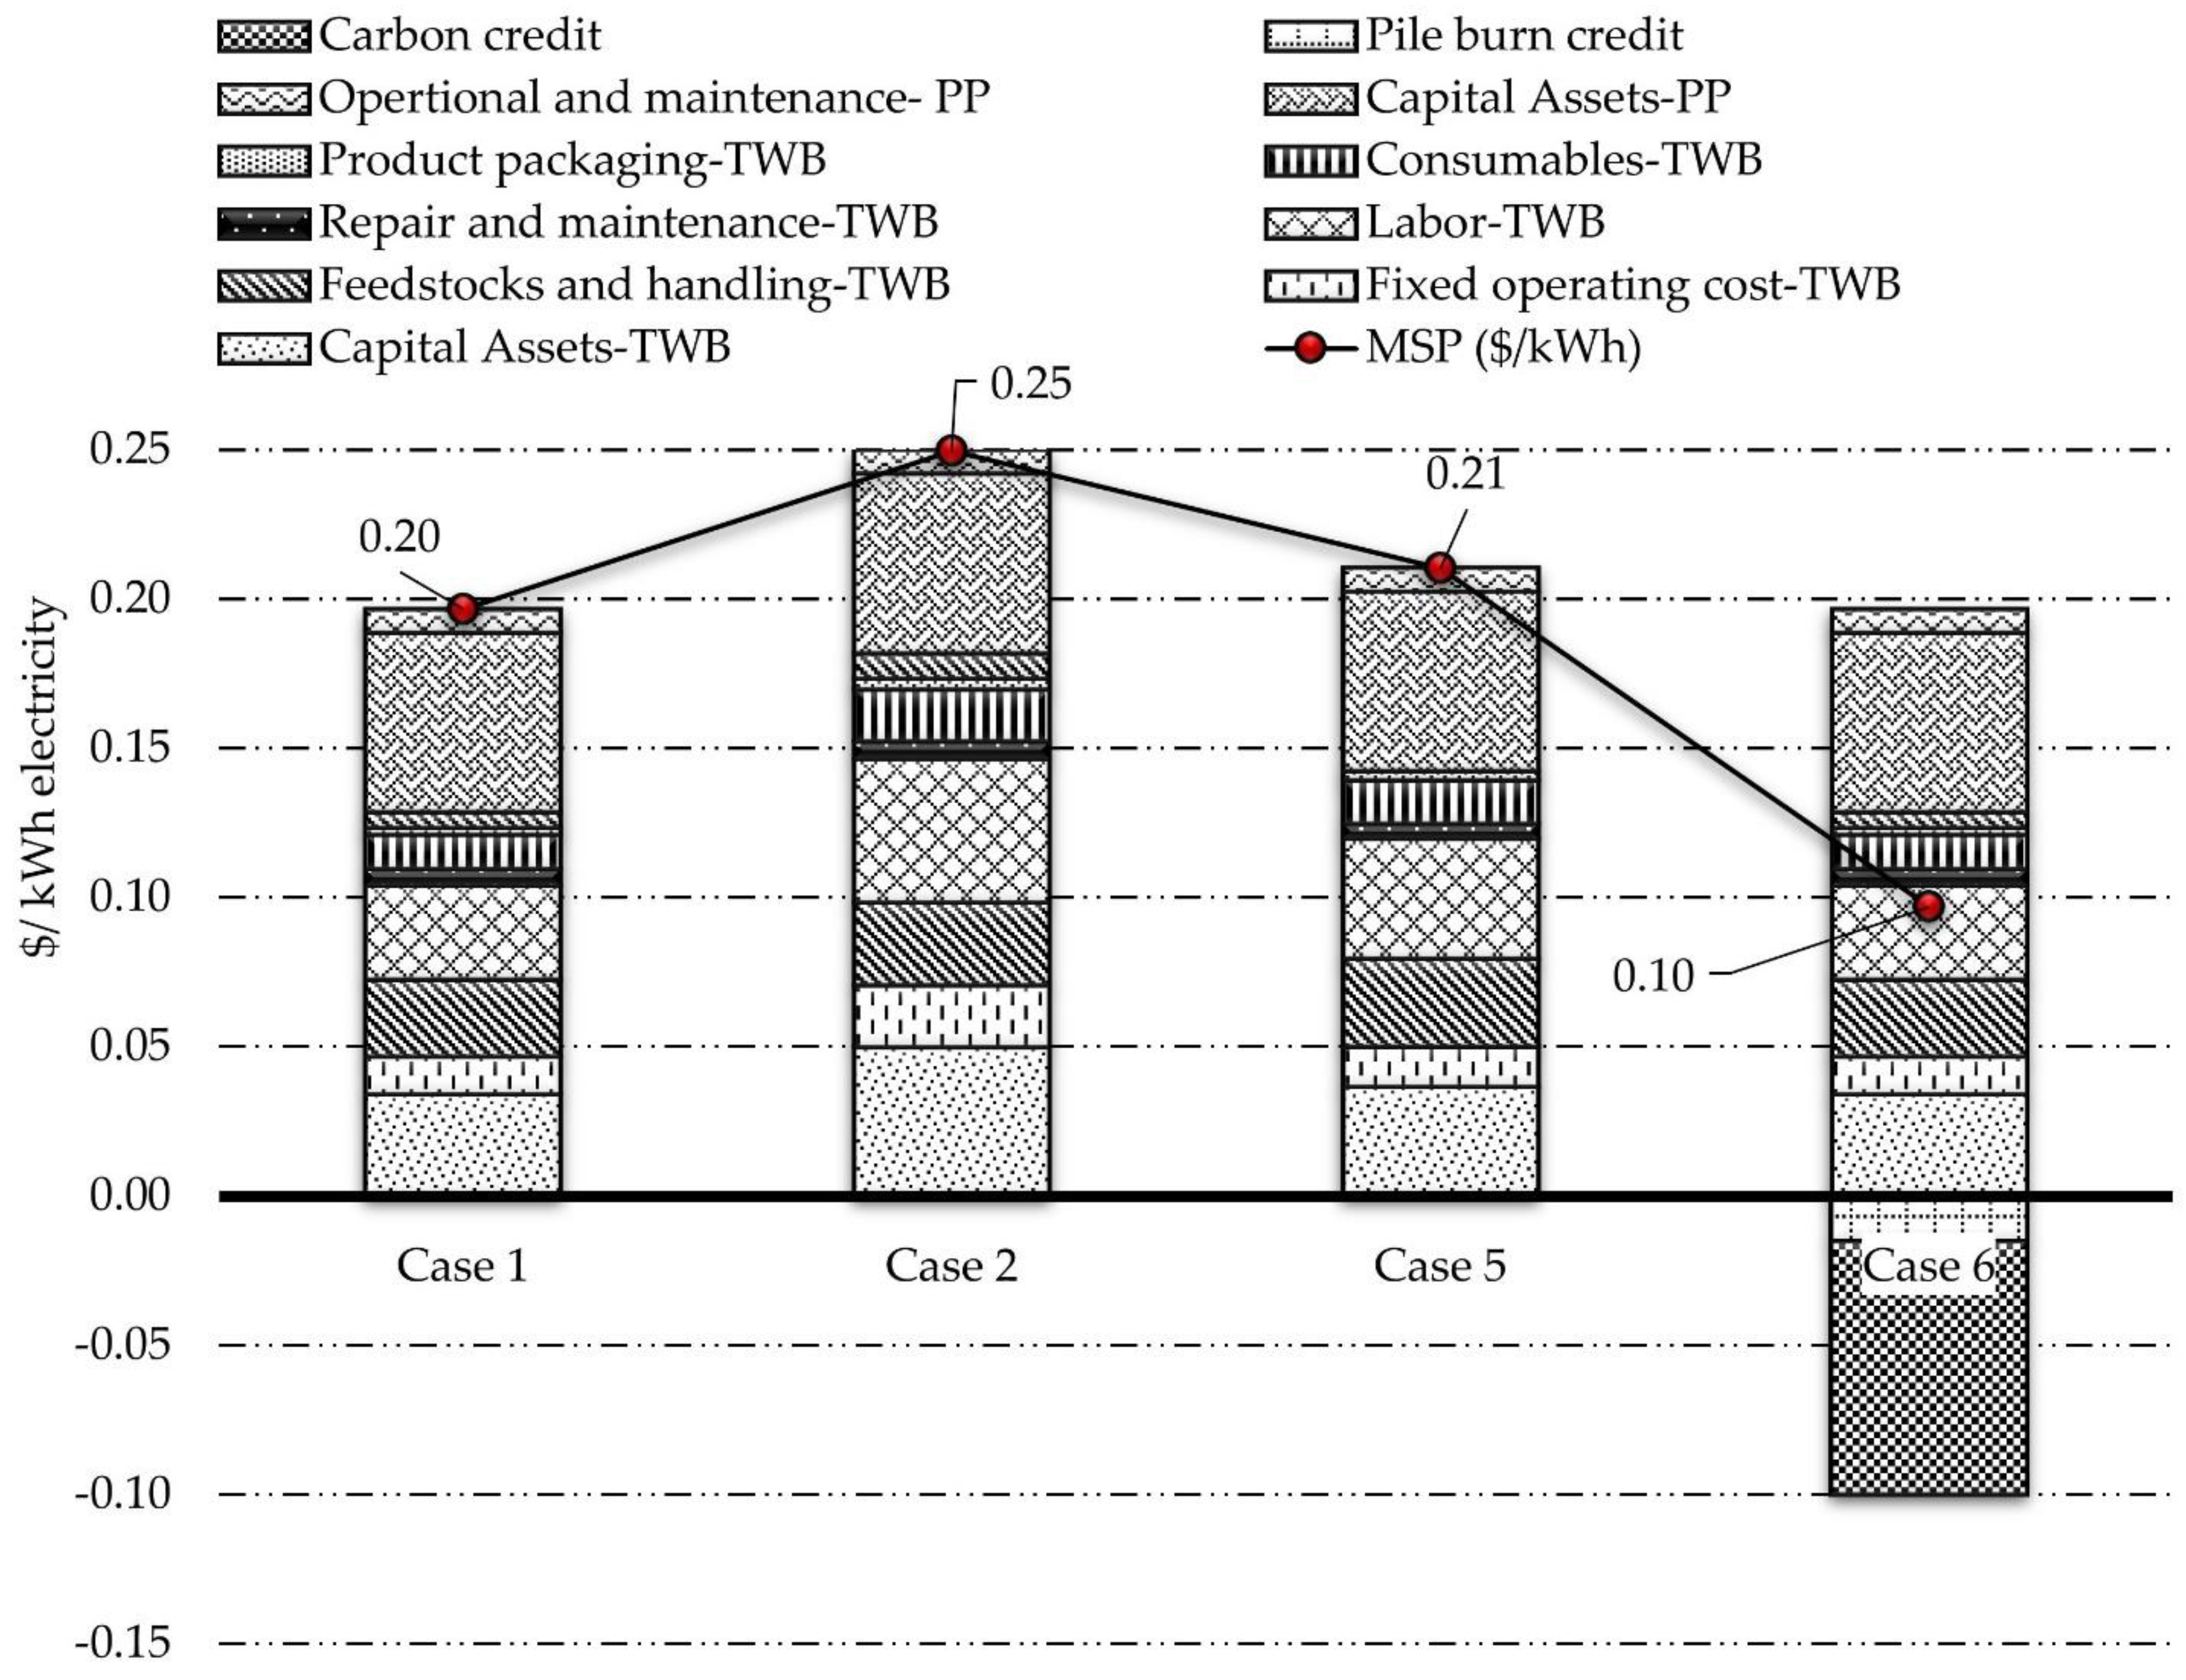
3.2. LCA and TEA Analysis of Different Scenarios
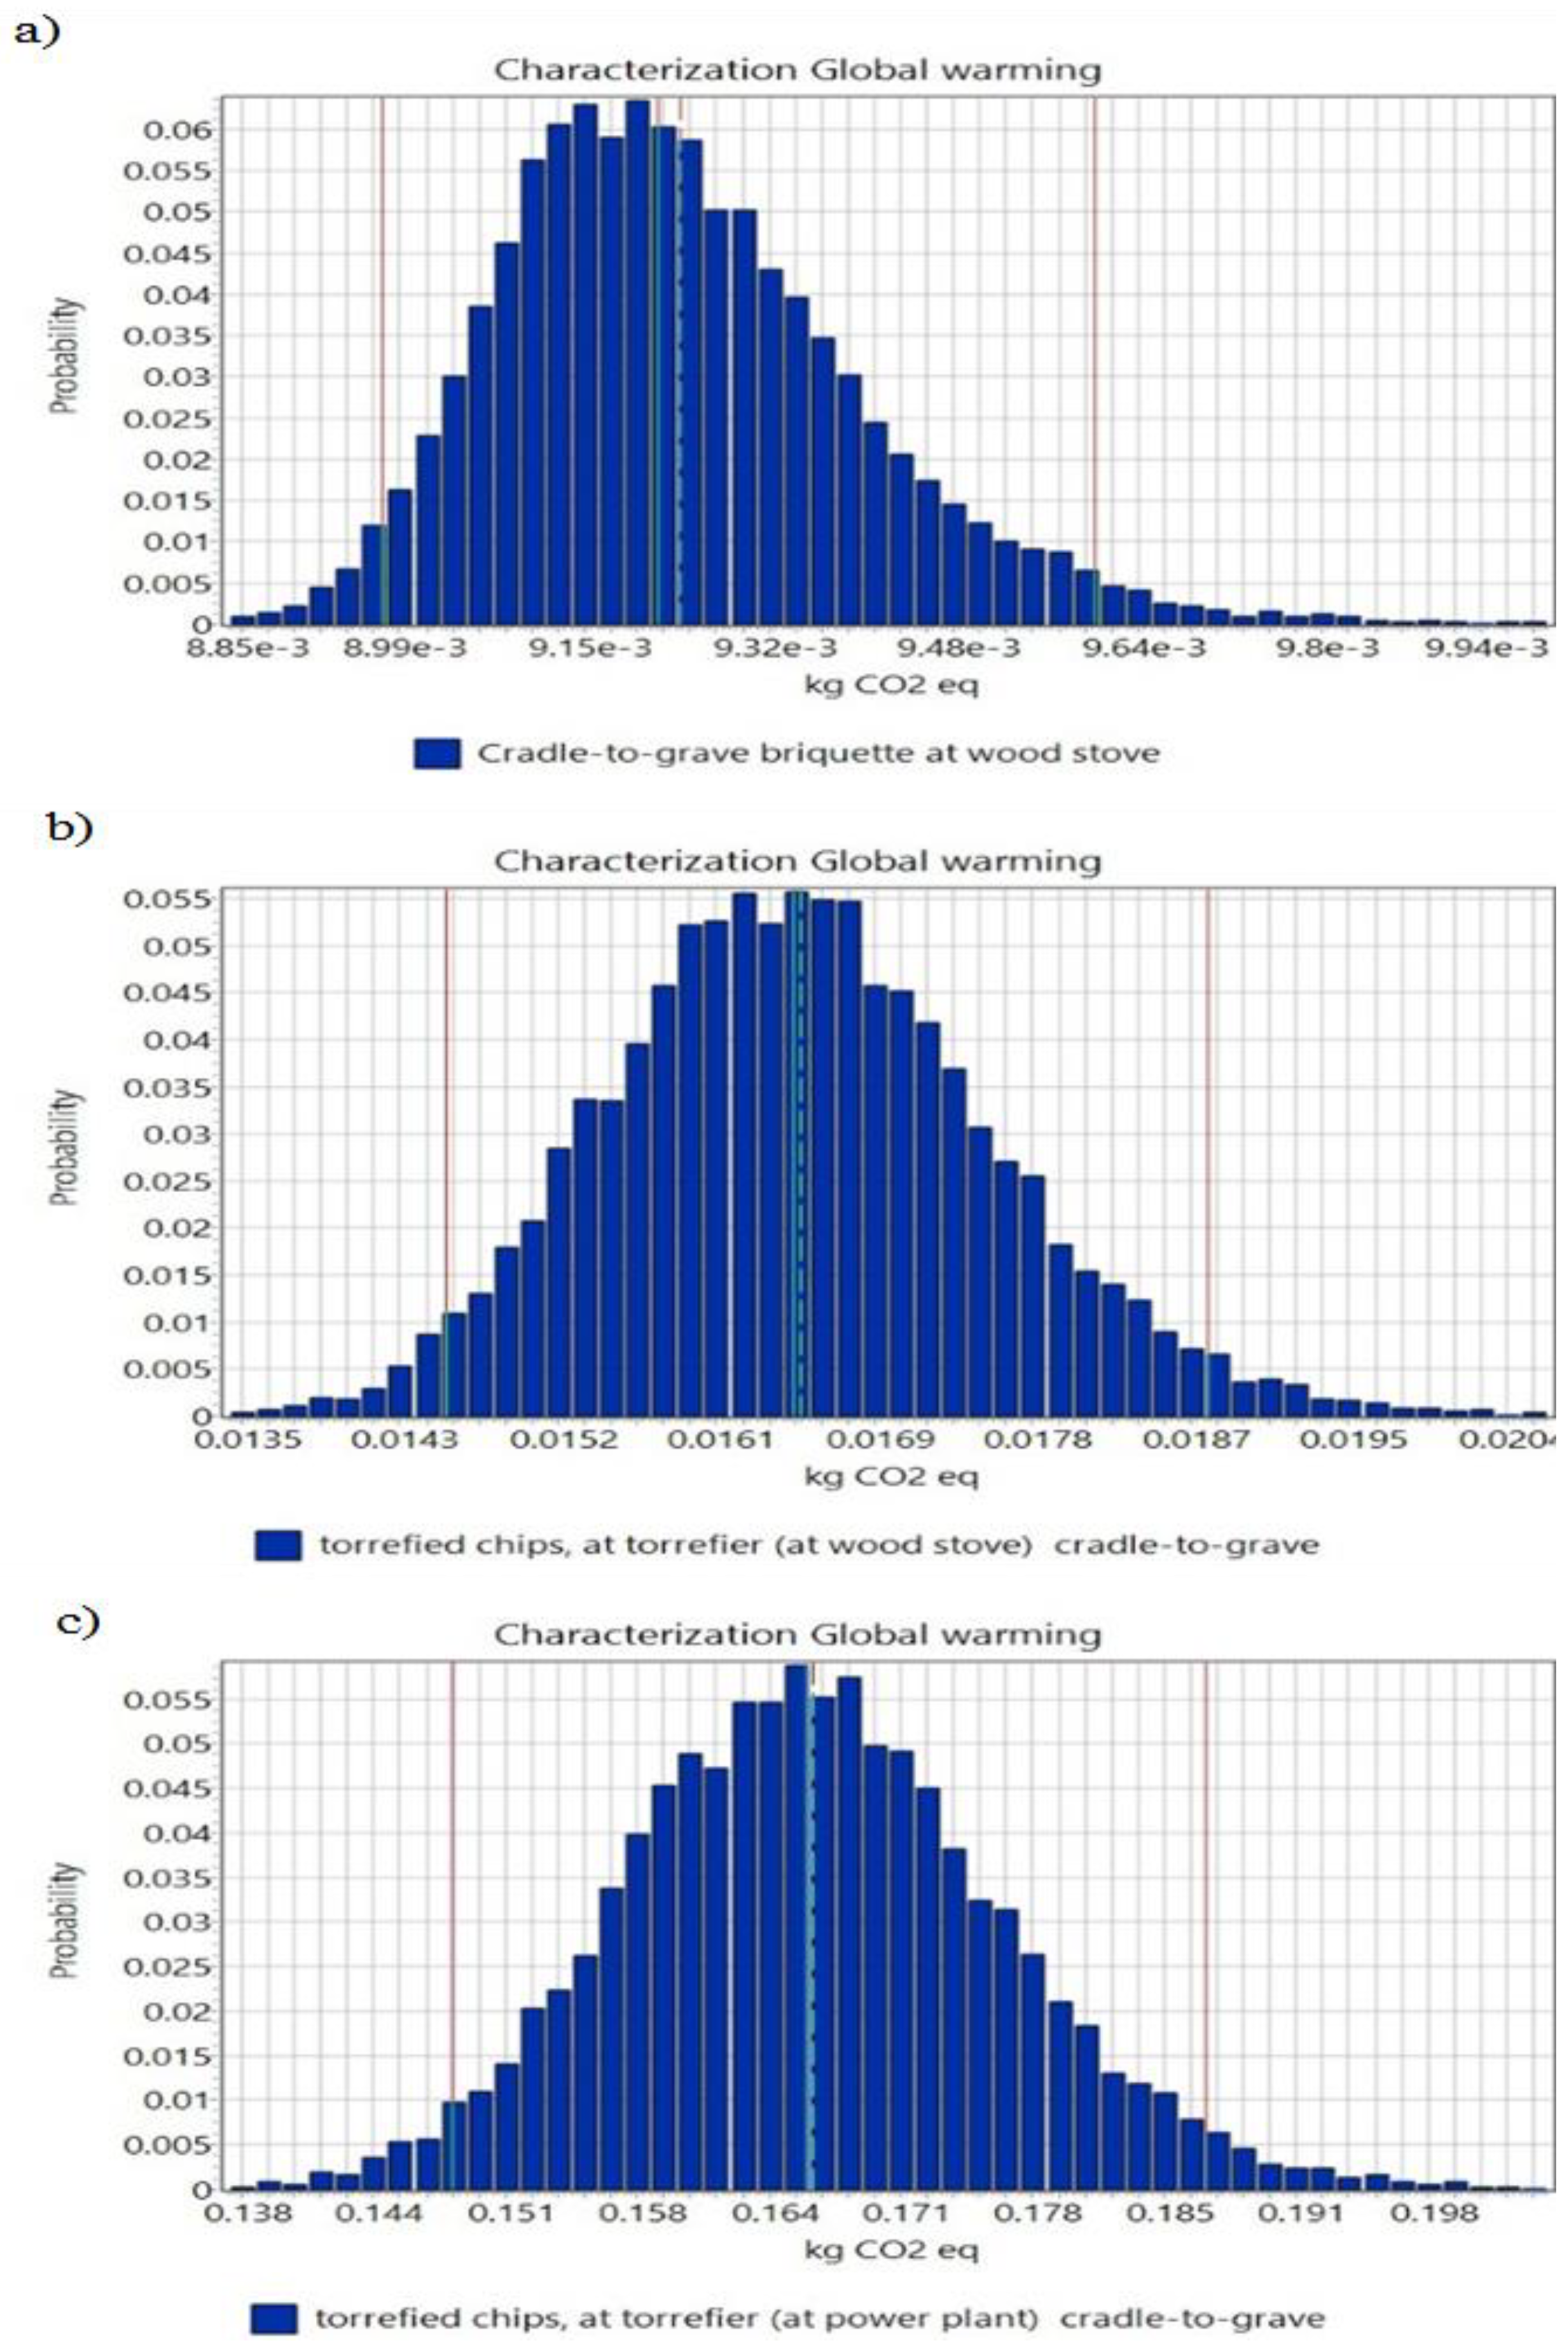
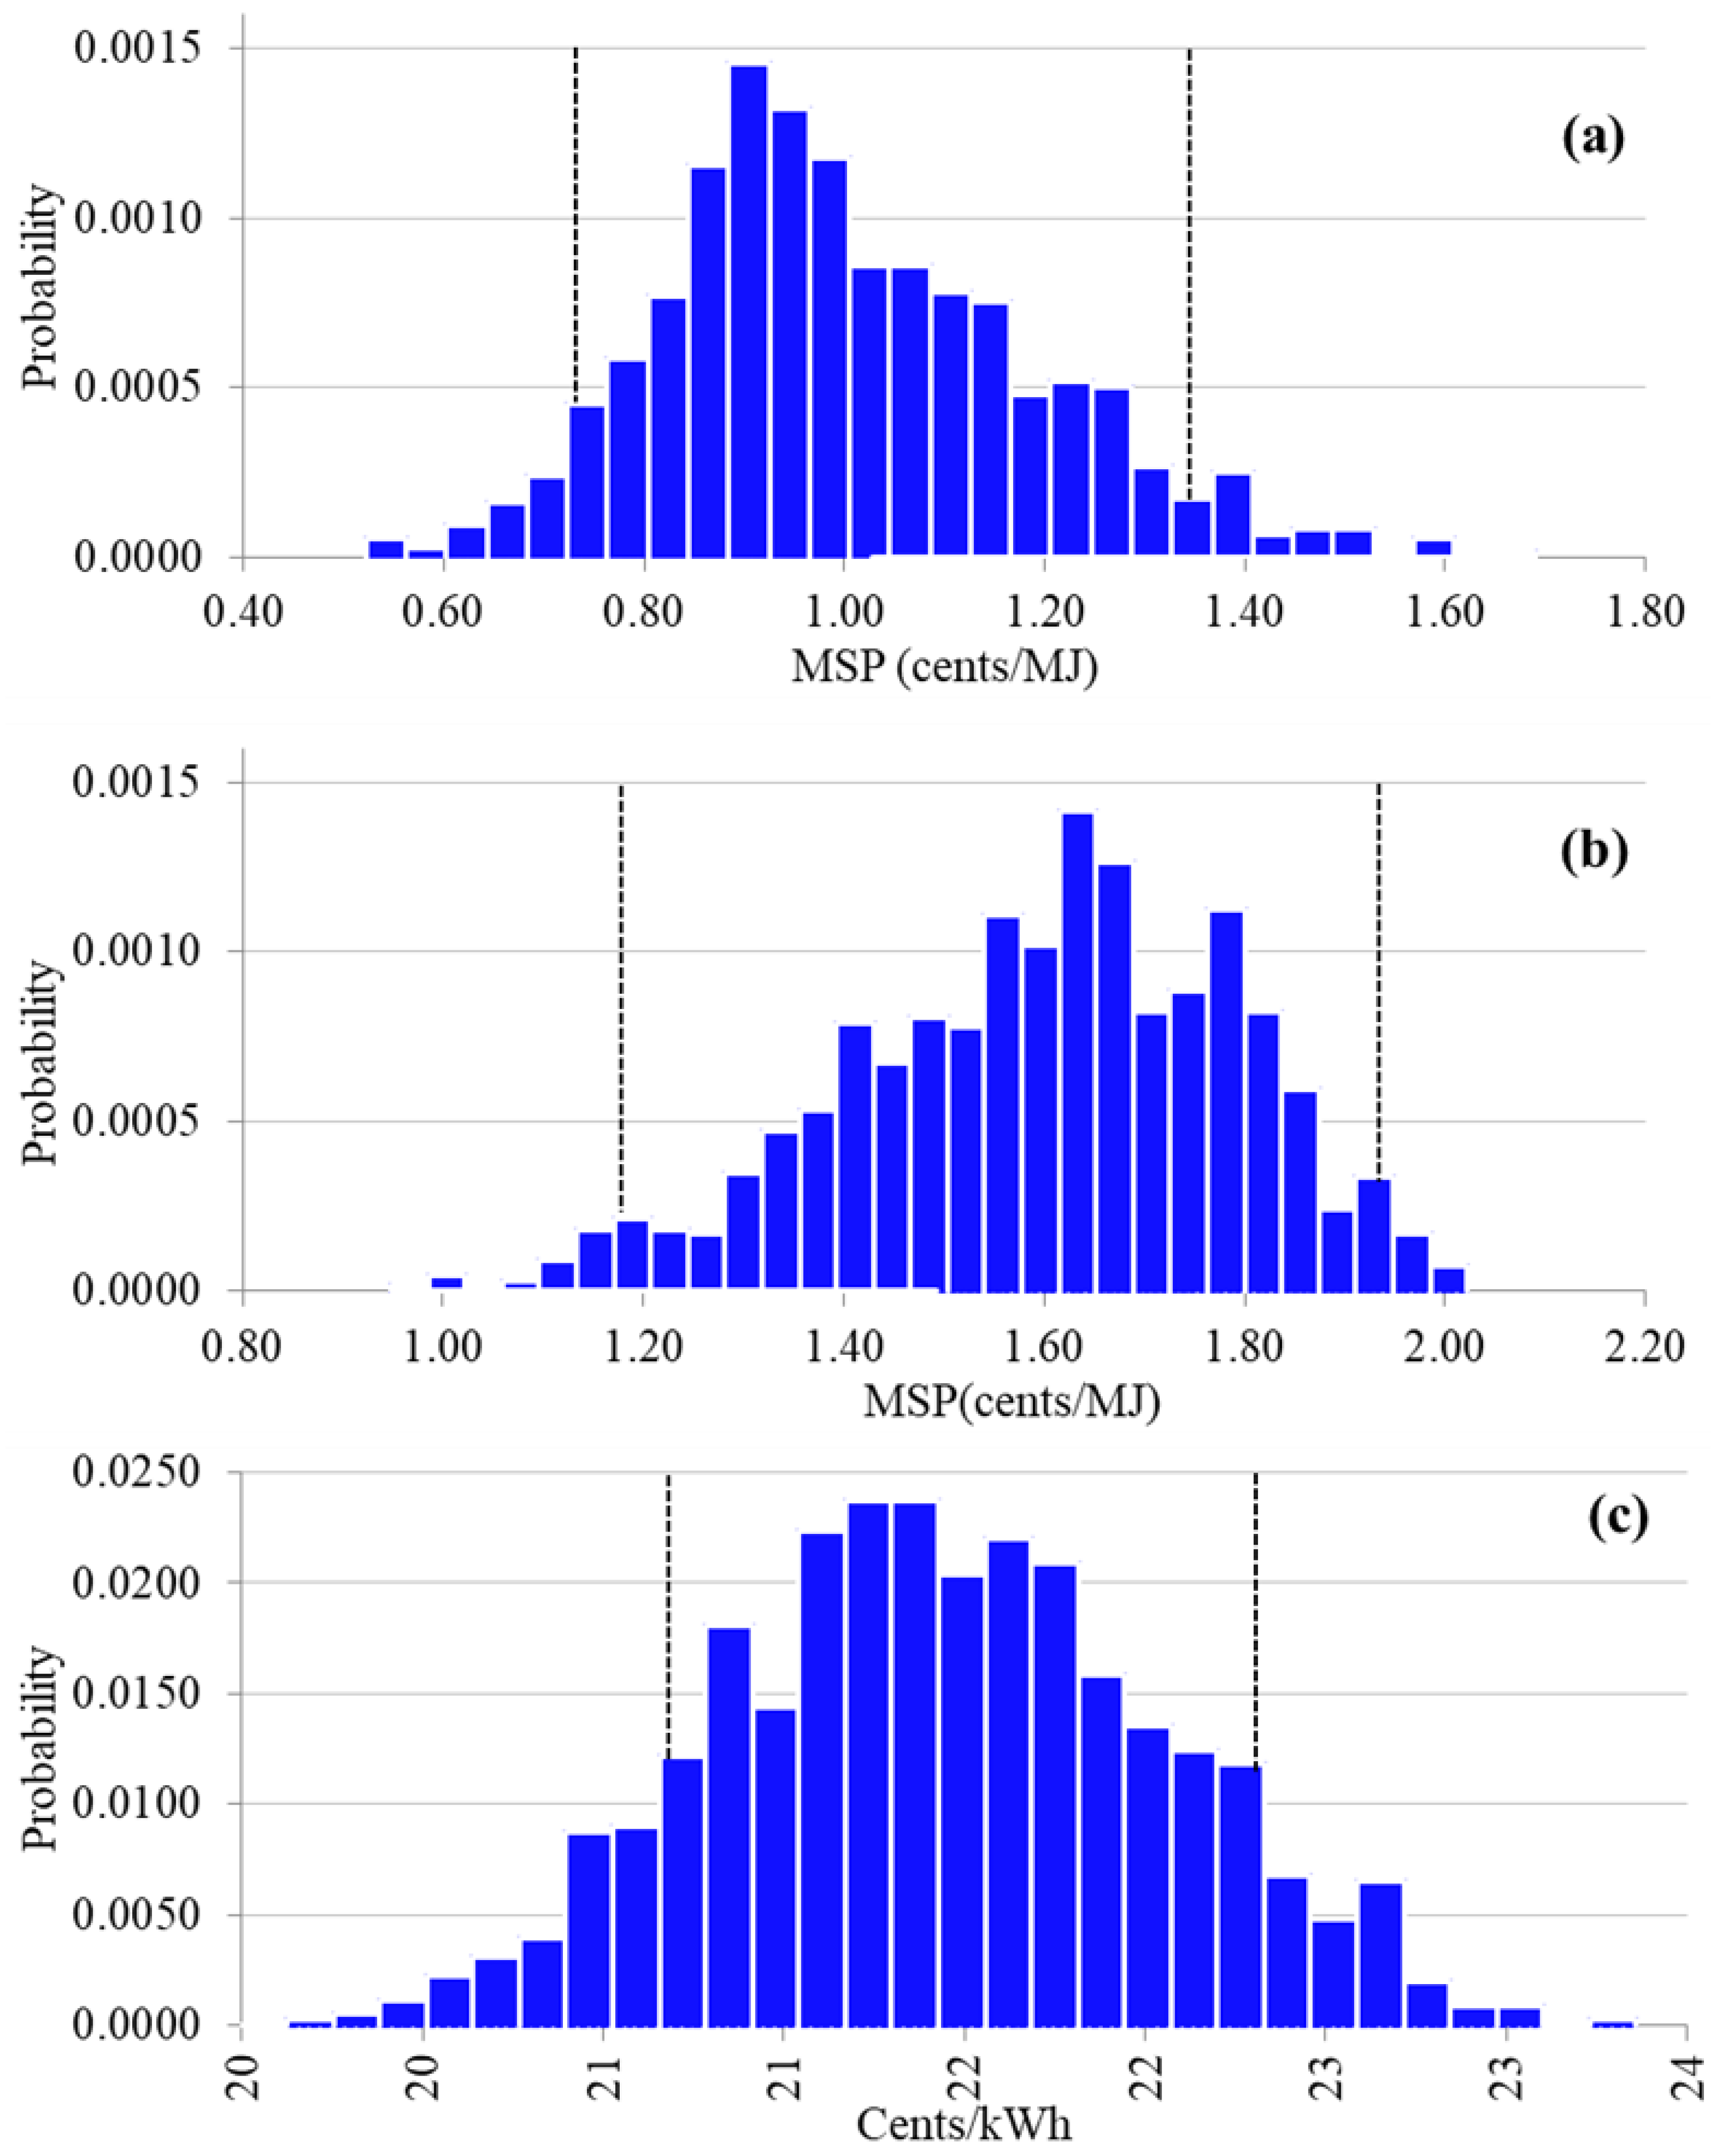
3.3. Results of Uncertainty Analysis of the Base Case
4. Discussion
5. Conclusions
Supplementary Materials
Author Contributions
Funding
Institutional Review Board Statement
Informed Consent Statement
Data Availability Statement
Acknowledgments
Conflicts of Interest
References
- IPCC. Climate Change 2021: The Physical Science Basis. Contribution of Working Group I to the Sixth Assessment Report of the Intergovernmental Panel on Climate Change; United Nations Intergovernmental Panel on Climate Change, Cambridge University Press: Cambridge, UK, 2021; Available online: https://www.ipcc.ch/report/ar6/wg1/#SPM (accessed on 15 August 2021).
- REN21. Renewables 2020 Global Status Report; 2020; p. 367. Paris, France; Available online: https://www.ren21.net/wp-content/uploads/2019/05/GSR2021_Full_Report.pdf (accessed on 15 May 2021).
- Looney, B. Statistical Review of World Energy; BP: London, UK, 2020; p. 66. Available online: https://www.bp.com/content/dam/bp/business-sites/en/global/corporate/pdfs/energy-economics/statistical-review/bp-stats-review-2020-full-report.pdf (accessed on 15 May 2021).
- Chen, L.; Xing, L.; Han, L. Renewable energy from agro-residues in China: Solid biofuels and biomass briquetting technology. Renew. Sustain. Energy Rev. 2009, 13, 2689–2695. [Google Scholar] [CrossRef]
- EIA. Annual Energy Outlook 2020; U.S. Energy Information Administration: Washington, DC, USA, 2020. Available online: https://www.eia.gov/outlooks/aeo/ (accessed on 15 May 2021).
- EIA. U.S. Energy Facts Explained; U.S. Energy Information Administration: Washington, DC, USA, 2020. Available online: https://www.eia.gov/energyexplained/us-energy-facts/ (accessed on 15 June 2021).
- EIA. How Much of U.S. Carbon Dioxide Emissions are Associated with Electricity Generation? Available online: https://www.eia.gov/tools/faqs/faq.php?id=77&t=11 (accessed on 15 March 2021).
- Sahoo, K.; Bilek, E.; Bergman, R.; Kizha, A.R.; Mani, S. Economic analysis of forest residues supply chain options to produce enhanced-quality feedstocks. Biofuels Bioprod. Biorefining 2019, 13, 514–534. [Google Scholar] [CrossRef]
- Abbas, D.; Current, D.; Ryans, M.; Taff, S.; Hoganson, H.; Brooks, K.N. Harvesting forest biomass for energy—An alternative to conventional fuel treatments: Trials in the Superior National Forest, USA. Biomass Bioenergy 2011, 35, 4557–4564. [Google Scholar] [CrossRef]
- Langholtz, M.; Stokes, B.; Eaton, L. 2016 Billion-ton Report: Advancing Domestic Resources for a Thriving Bioeconomy, Volume 1: Economic Availability of Feedstock; ORNL/TM-2016/160; Oak Ridge National Laboratory: Oak Ridge, TN, USA, 2016; 448p. Available online: https://www.energy.gov/sites/default/files/2016/12/f34/2016_billion_ton_report_12.2.16_0.pdf (accessed on 15 May 2021).
- Moriarty, K.L.; Milbrandt, A.R.; Warner, E.; Lewis, J.E.; Schwab, A.A. 2017 Bioenergy Industry Status Report; National Renewable Energy Lab. (NREL): Golden, CO, USA, 2017. Available online: https://www.nrel.gov/docs/fy20osti/75776.pdf (accessed on 15 May 2021).
- Carvalho, R.L.; Jensen, O.M.; Tarelho, L.A.C. Mapping the performance of wood-burning stoves by installations worldwide. Energy Build. 2016, 127, 658–679. [Google Scholar] [CrossRef]
- Carvalho, R.L.; Vicente, E.D.; Tarelho, L.A.C.; Jensen, O.M. Wood stove combustion air retrofits: A low cost way to increase energy savings in dwellings. Energy Build. 2018, 164, 140–152. [Google Scholar] [CrossRef]
- Sanches-Pereira, A.; Tudeschini, L.G.; Coelho, S.T. Evolution of the Brazilian residential carbon footprint based on direct energy consumption. Renew. Sustain. Energy Rev. 2016, 54, 184–201. [Google Scholar] [CrossRef]
- IPCC. Mitigation of Climate Change; Intergovernmental Panel on Climate Chage, Cambridge University Press: Cambridge, UK, 2014; Available online: https://www.ipcc.ch/report/ar5/wg3/ (accessed on 15 June 2021).
- Espinoza Pérez, A.T.; Camargo, M.; Narváez Rincón, P.C.; Alfaro Marchant, M. Key challenges and requirements for sustainable and industrialized biorefinery supply chain design and management: A bibliographic analysis. Renew. Sustain. Energy Rev. 2017, 69, 350–359. [Google Scholar] [CrossRef]
- Yun, H.; Clift, R.; Bi, X. Environmental and economic assessment of torrefied wood pellets from British Columbia. Energy Convers. Manag. 2020, 208, 112513. [Google Scholar] [CrossRef]
- Hatt, R.; Rodgers, D.A.T.; Curtis, R. 100% Test Burn of Torrefied Wood Pellets at a Full-Scale Pulverized Coal Fired Utility Steam Generator. In Proceedings of the ASME 2018 12th International Conference on Energy Sustainability Collocated with the ASME 2018 Power Conference and the ASME 2018 Nuclear Forum, Lake Buena Vista, FL, USA, 24–28 June 2018. [Google Scholar]
- Han, H.-S.; Jacobson, A.; Bilek, E.M.; Sessions, J. Waste To Wisdom: Utilizing Forest Residues for the Production of Bioenergy and Biobased Products. Appl. Eng. Agric. 2018, 34, 5–10. [Google Scholar] [CrossRef]
- Berry, M.; Sessions, J. The Economics of Biomass Logistics and Conversion Facility Mobility: An Oregon Case Study. Appl. Eng. Agric. 2018, 34, 57–72. [Google Scholar] [CrossRef] [Green Version]
- Langholtz, M.; Stokes, B.; Eaton, L. 2016 Billion-Ton Report: Advancing Domestic Resources for a Thriving Bioeconomy (Executive Summary). Ind. Biotechnol. 2016, 12, 282–289. [Google Scholar] [CrossRef]
- Sahoo, K.; Bilek, E.M.; Mani, S. Techno-economic and environmental assessments of storing woodchips and pellets for bioenergy applications. Renew. Sustain. Energy Rev. 2018, 98, 27–39. [Google Scholar] [CrossRef]
- Sasatani, D.; Eastin, I.L. Demand Curve Estimation of Locally Produced Woody Biomass Products. Appl. Eng. Agric. 2018, 34, 145. [Google Scholar] [CrossRef]
- Kpalo, S.Y.; Zainuddin, M.F.; Manaf, L.A.; Roslan, A.M. A Review of Technical and Economic Aspects of Biomass Briquetting. Sustainability 2020, 12, 4609. [Google Scholar] [CrossRef]
- Tumuluru, J.S.; Wright, C.T.; Hess, J.R.; Kenney, K.L. A review of biomass densification systems to develop uniform feedstock commodities for bioenergy application. Biofuels Bioprod. Biorefining 2011, 5, 683–707. [Google Scholar] [CrossRef]
- Bergman, R.D.; Zerbe, J.I. Primer on Wood Biomass for Energy; USDA Forest Service, State and Private Forestry, Technology Marketing Unit: Madison, WI, USA, 2008; p. 10.
- Kaliyan, N.; Vance Morey, R. Factors affecting strength and durability of densified biomass products. Biomass Bioenergy 2009, 33, 337–359. [Google Scholar] [CrossRef]
- Grover, P.; Mishra, S. Biomass Briquetting: Technology and Practices. Regional Wood Energy Development Program in Asia; Food and Agriculture Organization of the United Nations: Bangkok, Thailand, 1996; Available online: http://leehite.org/biomass/documents/Biomass%20Briquetting%20Technology%20and%20Practices%20FAO.pdf (accessed on 15 June 2021).
- Hein, T. Briquettes on Fire: Look Out Pellets—Briquettes Are Stealing Some of Your Limelight. Canadian Biomass, Simcoe, ON, Canada. 2010. Available online: https://www.canadianbiomassmagazine.ca/briquettes-on-fire-2022/ (accessed on 15 June 2021).
- Roy, M.M.; Corscadden, K.W. An experimental study of combustion and emissions of biomass briquettes in a domestic wood stove. Appl. Energy 2012, 99, 206–212. [Google Scholar] [CrossRef]
- Oladeji, J. Theoretical aspects of biomass briquetting: A review study. J. Energy Technol. Policy 2015, 5, 72–81. [Google Scholar]
- Stelte, W.; Clemons, C.; Holm, J.K.; Sanadi, A.R.; Ahrenfeldt, J.; Shang, L.; Henriksen, U.B. Pelletizing properties of torrefied spruce. Biomass Bioenergy 2011, 35, 4690–4698. [Google Scholar] [CrossRef] [Green Version]
- Nemeth, G.; Varga, M.; Kocsis, Z. Energy Demand of Briquetting and Pelleting of Wood Based By-product. In Proceedings of the International Scientific Conference on Sustainable Development & Ecological Footprint, Lisbon, Portugal, 20–21 September 2012. [Google Scholar]
- Kumar, L.; Koukoulas, A.A.; Mani, S.; Satyavolu, J. Integrating Torrefaction in the Wood Pellet Industry: A Critical Review. Energy Fuels 2017, 31, 37–54. [Google Scholar] [CrossRef]
- Chen, W.-H.; Peng, J.; Bi, X.T. A state-of-the-art review of biomass torrefaction, densification and applications. Renew. Sustain. Energy Rev. 2015, 44, 847–866. [Google Scholar] [CrossRef]
- Peng, J.H.; Bi, H.T.; Lim, C.J.; Sokhansanj, S. Study on Density, Hardness, and Moisture Uptake of Torrefied Wood Pellets. Energy Fuels 2013, 27, 967–974. [Google Scholar] [CrossRef]
- Maheshwari, P.; Singla, S.; Shastri, Y. Resiliency optimization of biomass to biofuel supply chain incorporating regional biomass pre-processing depots. Biomass Bioenergy 2017, 97, 116–131. [Google Scholar] [CrossRef]
- ISO-Standard ISO14044:2006. Environmental Management—Life Cycle Assessments—Requirements and Guidelines; International Standardization Organization: Geneva, Switzerland, 2006. [Google Scholar]
- ISO-Standard ISO14040:2006. Environmental Management—Life Cycle Assessment—Principles and Framework; International Organization for Standardization: Geneva, Switzerland, 2006. [Google Scholar]
- Sahoo, K.; Bilek, E.; Bergman, R.; Mani, S. Techno-economic analysis of producing solid biofuels and biochar from forest residues using portable systems. Appl. Energy 2019, 235, 578–590. [Google Scholar] [CrossRef]
- Bergman, R.; Berry, M.; Bilek, E.M.T.; Bower, T.; Eastin, I.; Ganguly, I.; Han, H.-S.; Hirth, K.; Jacobson, A.; Karp, S.; et al. Waste to Wisdom: Utilizing Forest Residues for the Production of Bioenergy and Biobased Products. 2018. Available online: https://www.fs.fed.us/rm/pubs_journals/2018/rmrs_2018_bergman_r001.pdf (accessed on 15 July 2021).
- LTS (Long Trail Sustinability). DATASMART LCI Package. 2019. Available online: https://ltsexperts.com/services/software/datasmart-life-cycle-inventory/ (accessed on 10 January 2021).
- Severy, M.; Chamberlin, C.; Eggink, A.; Jacobson, A. Briquetter Testing and Results: Testing in a Commercial Setting. 2016. Available online: http://box2343.temp.domains/~wastetow//////wp-content/uploads/2018/08/Briquetter-testing-and-results-testing-in-a-commercial-setting.pdf (accessed on 15 May 2021).
- Severy, M.A.; Chamberlin, C.E.; Eggink, A.J.; Jacobson, A.E. Demonstration of a Pilot-Scale Plant for Biomass Torrefaction and Briquetting. Appl. Eng. Agric. 2018, 34, 85–98. [Google Scholar] [CrossRef]
- Kizha, A.R.; Han, H.-S. Processing and sorting forest residues: Cost, productivity and managerial impacts. Biomass Bioenergy 2016, 93, 97–106. [Google Scholar] [CrossRef] [Green Version]
- Oneil, E.E.; Comnick, J.M.; Rogers, L.W.; Puettmann, M.E. Waste to Wisdom: Integrating Feedstock Supply, Fire Risk and Life Cycle Assessment into a Wood to Energy Framework. Final Report on Task 4.2, 4.7 and 4.8. 2017. Available online: http://box2343.temp.domains/~wastetow//////wp-content/uploads/2018/08/4.7.6-W2W-Integrating-feedstock-supply-LCA-and-wildfire.pdf (accessed on 15 May 2021).
- Kizha, A.R.; Han, H.-S.; Paulson, J.; Koirala, A. Strategies for Reducing Moisture Content in Forest Residues at the Harvest Site. Appl. Eng. Agric. 2018, 34, 25–33. [Google Scholar] [CrossRef]
- Alanya-Rosenbaum, S.; Bergman, R. Using Life-Cycle Assessment to Evaluate Environmental Impacts of Torrefied Briquette Production from Forest Residues; US Department of Agriculture, Forest Service, Forest Products Laboratory: Madison, WI, USA, 2018; pp. 1–26. Available online: https://www.fs.usda.gov/treesearch/pubs/57598 (accessed on 15 May 2021).
- Alanya-Rosenbaum, S.; Bergman, R. Using Life-Cycle Assessment to Evaluate Environmental Impacts of Briquette Production from Forest Residues; US Department of Agriculture, Forest Service, Forest Products Laboratory: Madison, WI, USA, 2018; pp. 2–24. Available online: https://www.fs.usda.gov/treesearch/pubs/57594 (accessed on 15 May 2021).
- Palmer, K.D.; Severy, M.A.; Chamberlin, C.E.; Eggink, A.J.; Jacobson, A.E. Performance Analysis of a Biomass Gasifier Genset at Varying Operating Conditions. Appl. Eng. Agric. 2018, 34, 135–143. [Google Scholar] [CrossRef] [Green Version]
- Adams, P.W.R.; Shirley, J.E.J.; McManus, M.C. Comparative cradle-to-gate life cycle assessment of wood pellet production with torrefaction. Appl. Energy 2015, 138, 367–380. [Google Scholar] [CrossRef] [Green Version]
- RUF-Inc. RUF Briquetting Systems- Wood Biomass. Available online: https://www.ruf-briquetter.com/content/documents/29682-RUF-Wood-Bi-Fold-Broc-No-crops.pdf (accessed on 15 March 2021).
- Alanya-Rosenbaum, S.; Bergman, R.D. Life-cycle impact and exergy based resource use assessment of torrefied and non-torrefied briquette use for heat and electricity generation. J. Clean. Prod. 2019, 233, 918–931. [Google Scholar] [CrossRef]
- Alanya-Rosenbaum, S.; Bergman, R.D.; Ganguly, I.; Pierobon, F. A comparative life-cycle assessment of briquetting logging residues and lumber manufacturing coproducts in Western United States. Appl. Eng. Agric. 2018, 34, 11. [Google Scholar] [CrossRef] [Green Version]
- PRé-Consultants. Life-Cycle Assessment Software Package, Version 9. Available online: www.pre.nl/ (accessed on 10 January 2021).
- Bare, J. TRACI 2.0: The tool for the reduction and assessment of chemical and other environmental impacts 2.0. Clean Technol. Environ. Policy 2011, 13, 687–696. [Google Scholar] [CrossRef]
- Manouchehrinejad, M.; Sahoo, K.; Kaliyan, N.; Singh, H.; Mani, S. Economic and environmental impact assessments of a stand-alone napier grass-fired combined heat and power generation system in the southeastern US. Int. J. Life Cycle Assess. 2020, 25, 89–104. [Google Scholar] [CrossRef]
- Moriarty, P.; Honnery, D. Feasibility of a 100% Global Renewable Energy System. Energies 2020, 13, 5543. [Google Scholar] [CrossRef]
- Moriarty, K. Feasibility Study of Biopower in East Helena, Montana. A Study Prepared in Partnership with the Environmental Protection Agency for the RE-Powering America’s Land Initiative: Siting Renewable Energy on Potentially Contaminated Land and Mine Sites; National Renewable Energy Lab. (NREL): Golden, CO, USA, 2013. Available online: https://www.nrel.gov/docs/fy13osti/57610.pdf (accessed on 15 June 2021).
- NETL. Power Plant Flexible Model. Available online: https://www.netl.doe.gov/energy-analysis/details?id=785 (accessed on 15 June 2021).
- Gonzalez-Salazar, M.A.; Kirsten, T.; Prchlik, L. Review of the operational flexibility and emissions of gas- and coal-fired power plants in a future with growing renewables. Renew. Sustain. Energy Rev. 2018, 82, 1497–1513. [Google Scholar] [CrossRef]
- Bergman, R.; Gu, H.; Alanya-Rosenbaum, S.; Liang, S. Comparative Life-Cycle Assessment of Biochar Activated Carbon and Synthesis Gas Electricity with Commercially Available Alternatives; Gen. Tech. Rep. FPL-GTR-270; US Department of Agriculture, Forest Service, Forest Products Laboratory: Madison, WI, USA, 2019; Volume 270, pp. 1–32.
- Bergman, R.D.; Falk, R.H.; Gu, H.; Napier, T.R.; Meil, J. Life-Cycle Energy and GHG Emissions for New and Recovered Softwood Framing Lumber and Hardwood Flooring Considering End-of-Life Scenarios; FPL-RP-672; USDA Forest Service, Forest Products Laboratory: Madison, WI, USA, 2013; p. 35. Available online: https://www.fs.usda.gov/treesearch/pubs/43547 (accessed on 15 June 2021).
- Sahoo, K.; Upadhyay, A.; Runge, T.; Bergman, R.; Puettmann, M.; Bilek, E. Life-cycle assessment and techno-economic analysis of biochar produced from forest residues using portable systems. Int. J. Life Cycle Assess. 2021, 26, 189–213. [Google Scholar] [CrossRef]
- Gu, H.; Bergman, R. Life-cycle assessment of a distributed-scale thermochemical bioenergy conversion system. Wood Fiber Sci. 2016, 48, 129–141. [Google Scholar]


| Wood Briquette (WB) | Torrefied Wood Briquette (TWB) | |
|---|---|---|
| Packing density, kg/m3 | 861.67 | 1005 |
| Moisture content (wet basis), % | 6.13 | 0.6 |
| Energy density (HHV) a, MJ/kg, db b | 17.78 | 23.0 |
| Ash content (%), db | - | 2.5 |
| Volatile matter (%), db | 81 | 71 |
| Durability (%) DU | 96 | 93 |
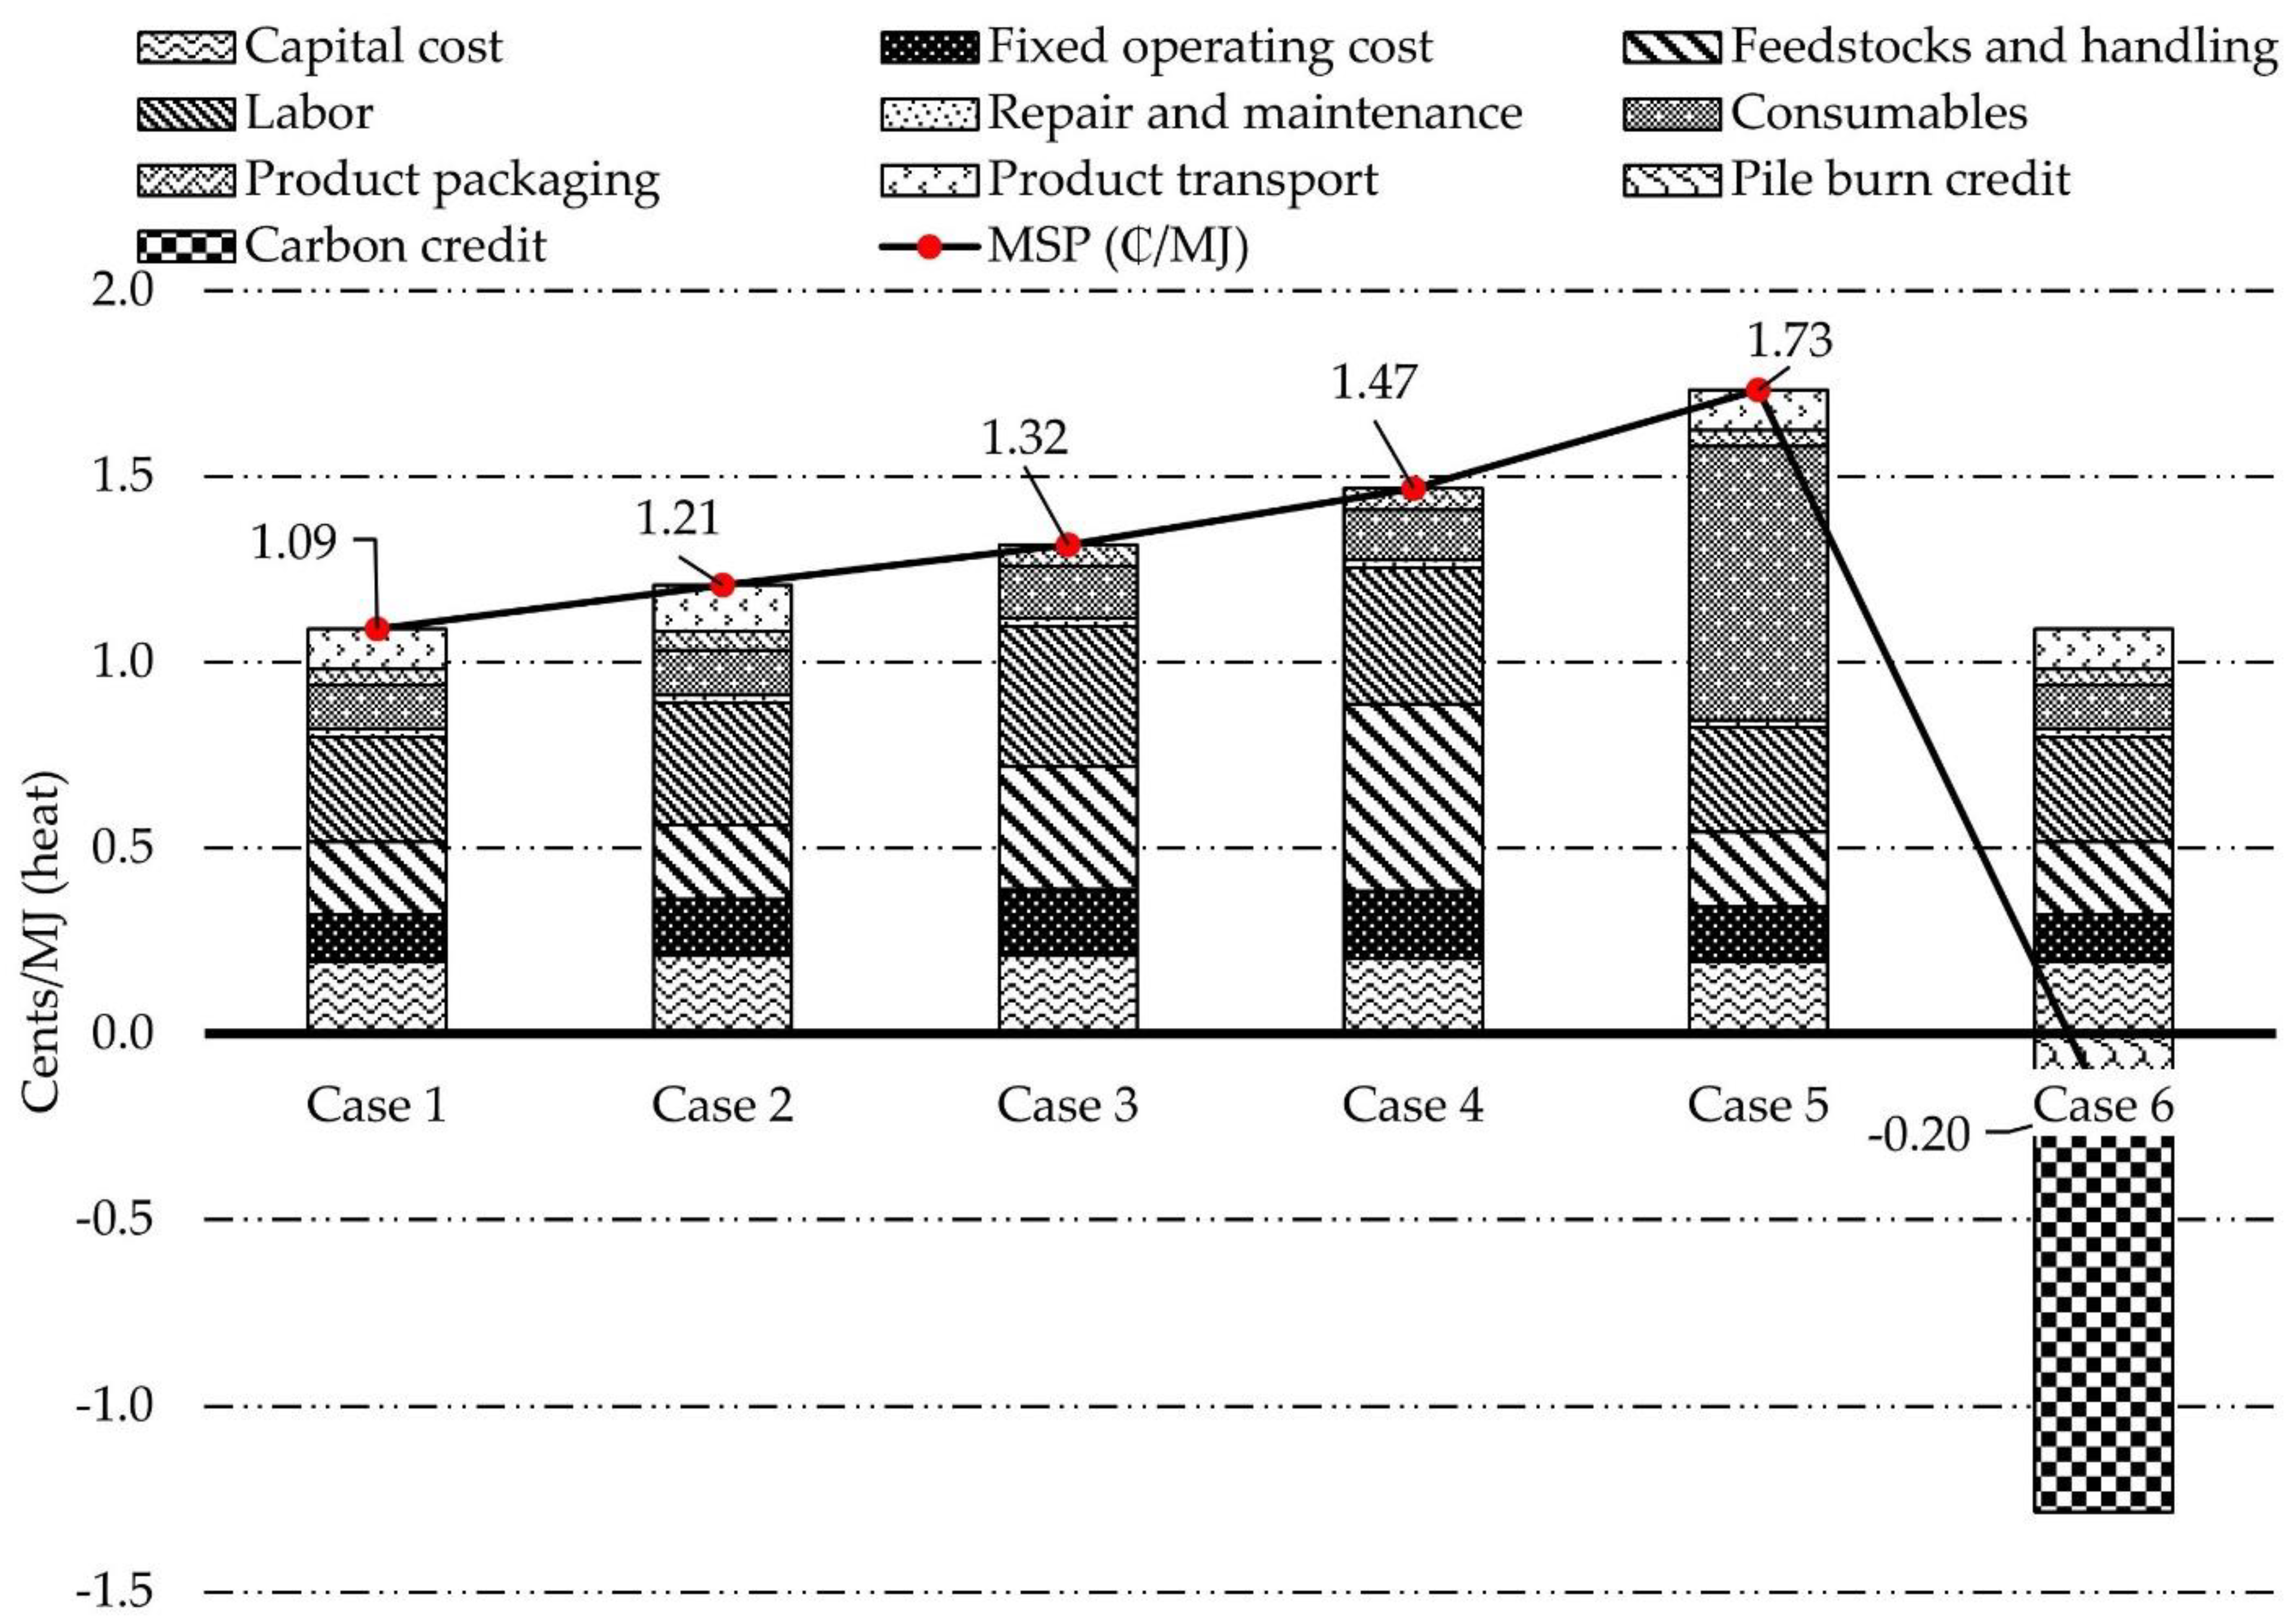
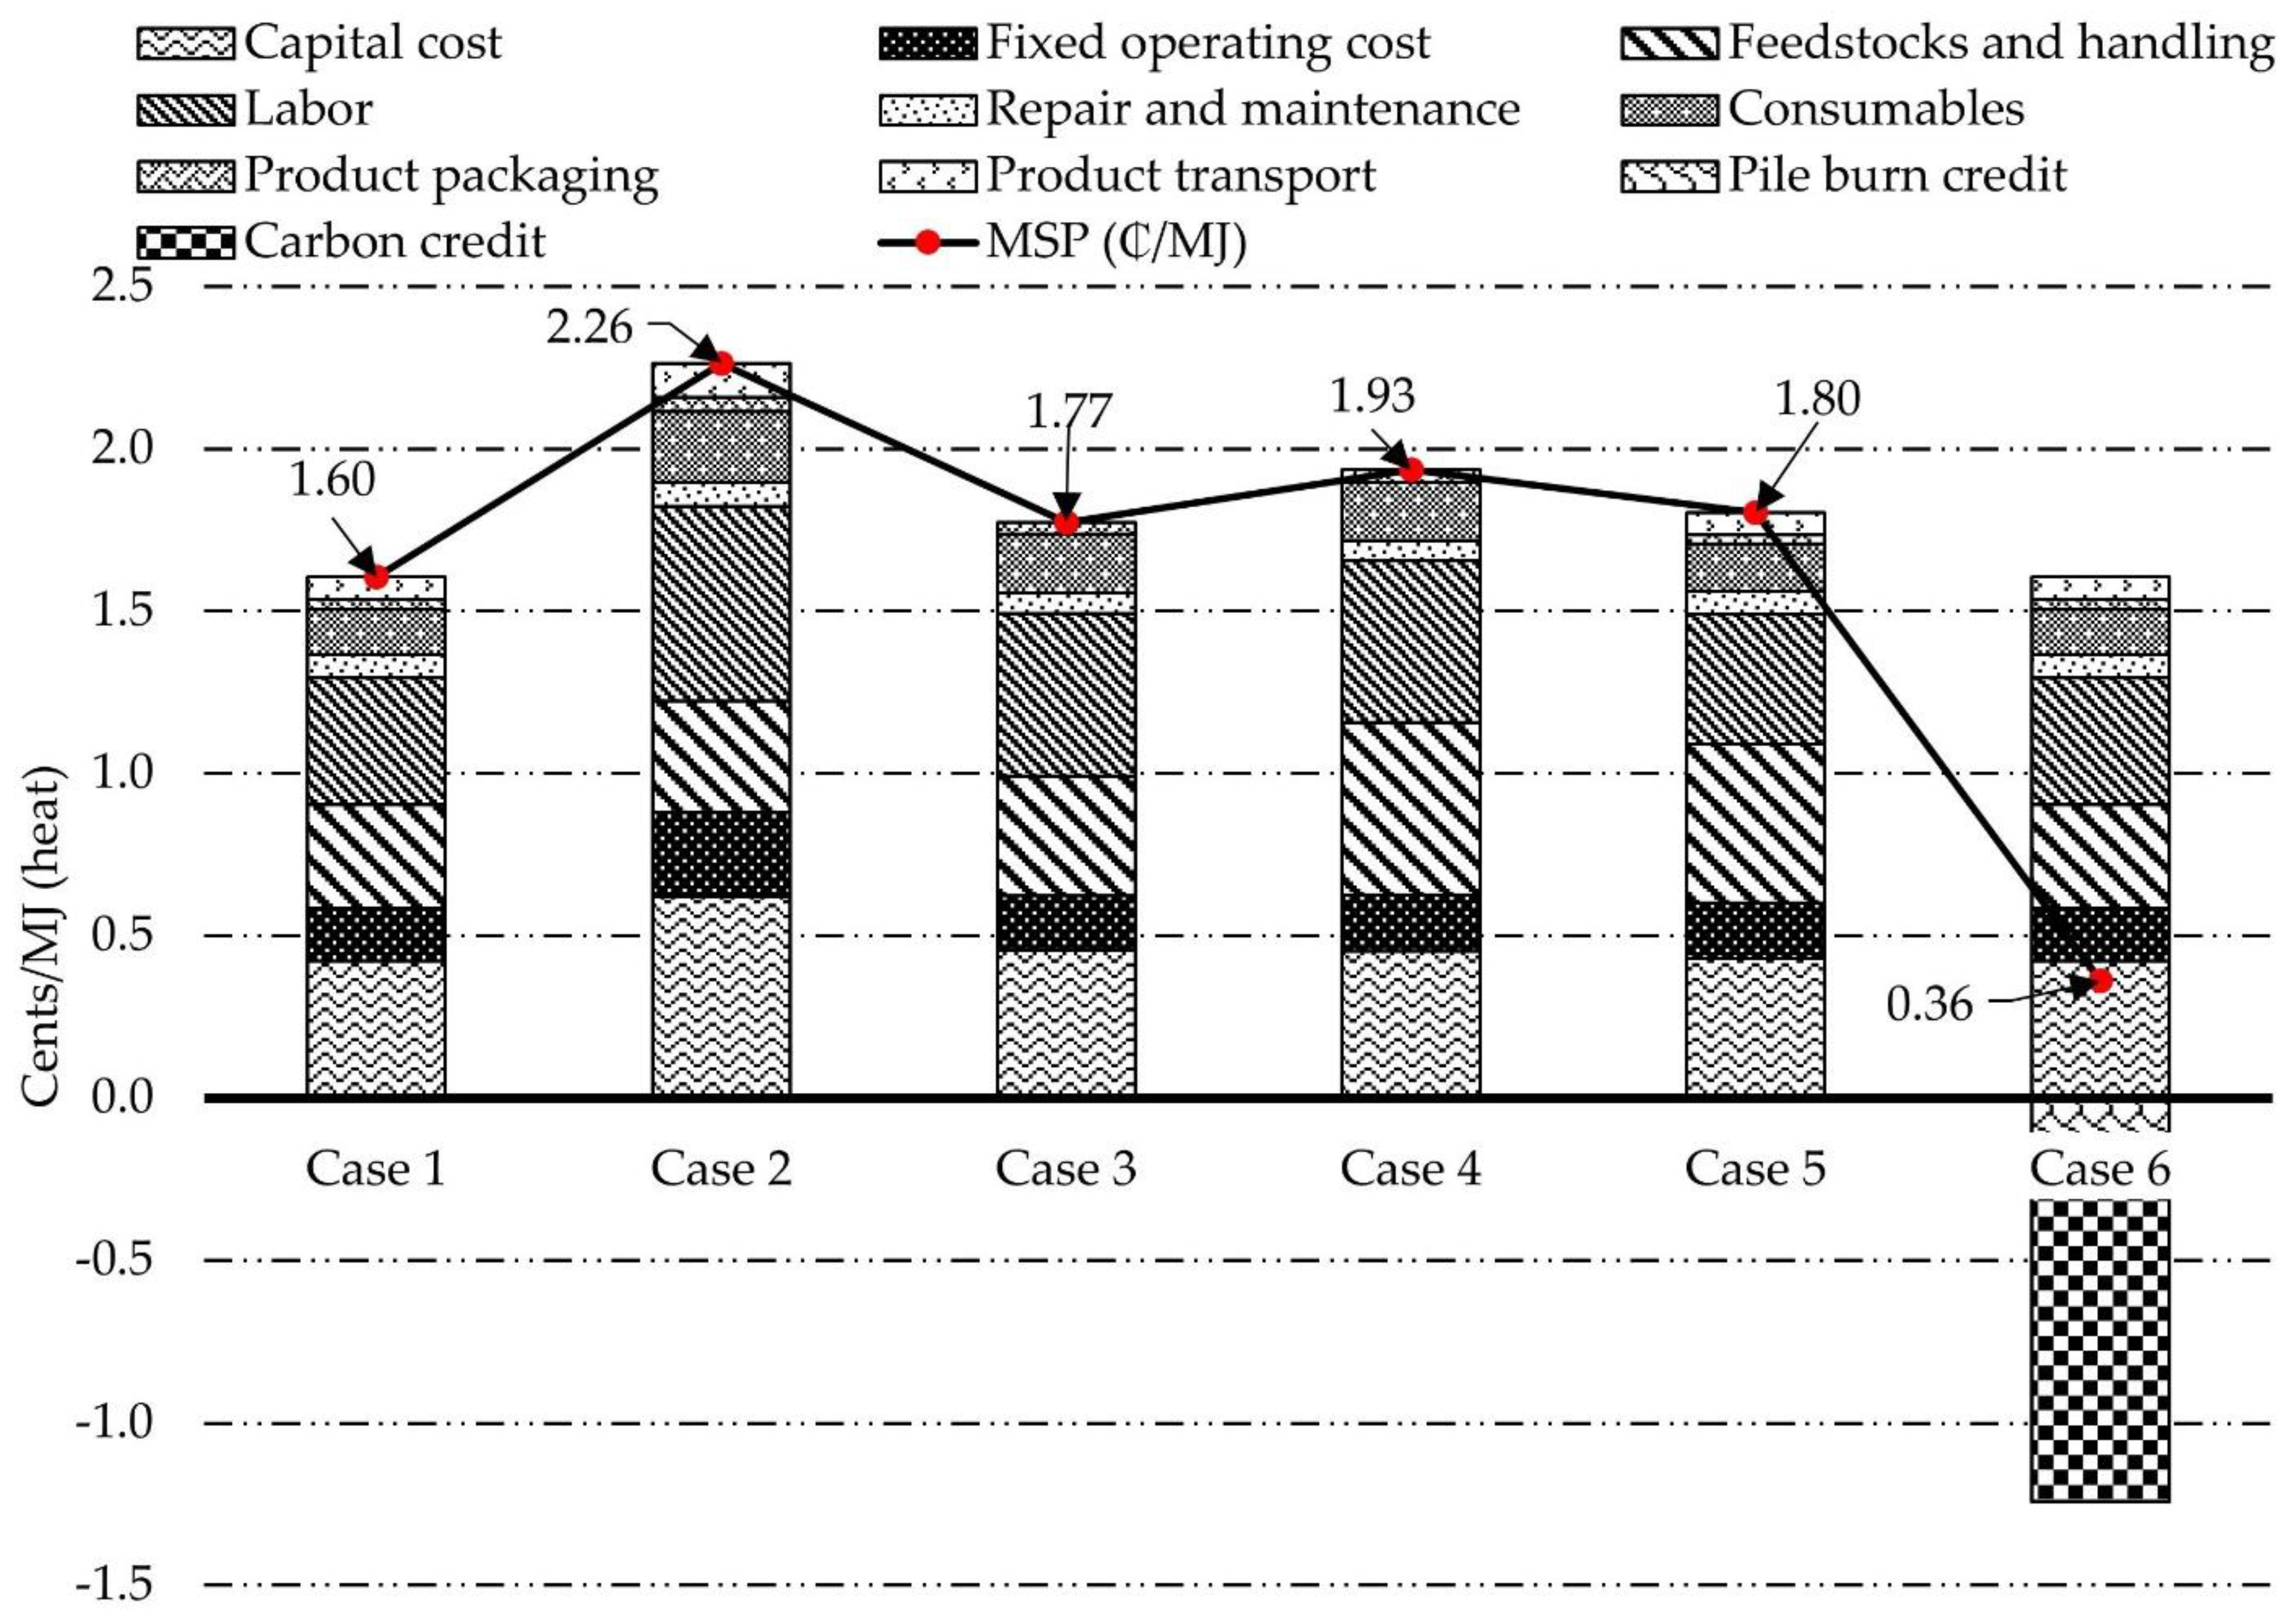
| Scenarios | Description | |
|---|---|---|
| Manufacturing of WBs and TWBs | End Use a | |
| Case 1 (Base case) | near-woods operation with woody biomass gasifier power (gasifier was used to power the equipment) | Heat/ electricity |
| Case 2 | near-woods operation with diesel power (diesel generator was used to power the equipment) | Heat/ electricity |
| Case 3 | in-town operation (2 h travel distance) with grid power (residues were hauled to 2 h travel distance, and grid electricity was used to power the equipment) | Heat |
| Case 4 | in-town operation (4 h travel distance) with grid power (residues were hauled to 4 h travel distance, and grid electricity was used to power the equipment) | Heat |
| Case 5 | 50% MC feedstock, near-woods operation with wood gasifier power (input residue MC was 50% instead of air-dried residue) | Heat/ electricity |
| Case 6 | near-woods operation with wood gasifier power with pile and burn credit | Heat/ electricity |
| Parameter | Unit | Value | Reference | |
|---|---|---|---|---|
| Feedstock procurement | Moisture content (wb) 1 of air-dried forest residues | % | 20 | [46] |
| Diesel for sorting, processing, loading | L/bdt 2 | 2.109 | ||
| Lubricant for sorting, processing, loading | L/bdt | 0.038 | ||
| Hauling distance | km/bdt | 18 | ||
| Chipping | Diesel use | L/bdt | 0.5461 | [46] |
| Lubricant use | L/bdt | 0.0098 | ||
| Screening | Diesel use | L/bdt | 1.5939 | |
| Lubricant use | L/bdt | 0.0287 | ||
| Drying | Heat required | MJ/kg water | 5 | [51,53] |
| Electricity | kWh/bdt | 7.14 | ||
| Briquetting | Electricity | kWh/bdt | 33.79 | Operational data |
| Torrefaction and briquetting | Mass yield | % | 69 | [44,53] |
| Energy yield | % | 81 | ||
| Lubricants | mL/MJ TWB | 0.002 | ||
| Electricity | kWh/MJ TWB | 0.023 | ||
| NaOH | gr/MJ TWB | 0.667 | ||
| Bio-oil | L/MJ TWB | 0.011 | ||
| Torgas | m3/MJ TWB | 0.043 | ||
| Packaging | Low-density polyethylene | kg/kg packed product | 0.7 | [53] |
| Grinding | Electricity, WB | Wh/kg (wb) | 323 | [44] |
| Electricity, TWB | Wh/kg (wb) | 123 |
| WB System 1 | TWB System 1 | Power Plant (PP) 2 | |
|---|---|---|---|
| Plant capacity (ODMT/year) | 2657 | 2035 | - |
| Plant capacity (MW) | - | - | 10 |
| Capital cost ($) | 315,000–390,000 | 810,000–960,000 | 42,645,000 |
| Feedstock cost ($/ODMT) | 14.5–34.3 | 26.4–50.2 | 242.0 |
| Operational cost ($/year) | 208,963–397,582 | 261,358–474,943 | 2,670,941 |
| Product transport ($/DOMT) | 0–15.2 | 0–14.21 | - |
| Project life (years) | 10.0 | 10.0 | 20.0 |
| Discount rate (nominal, before finance and tax) | 16.5% | 16.5% | 12.0% |
| Debt-to-equity ratio | 60/40 | 60/40 | 80/20 |
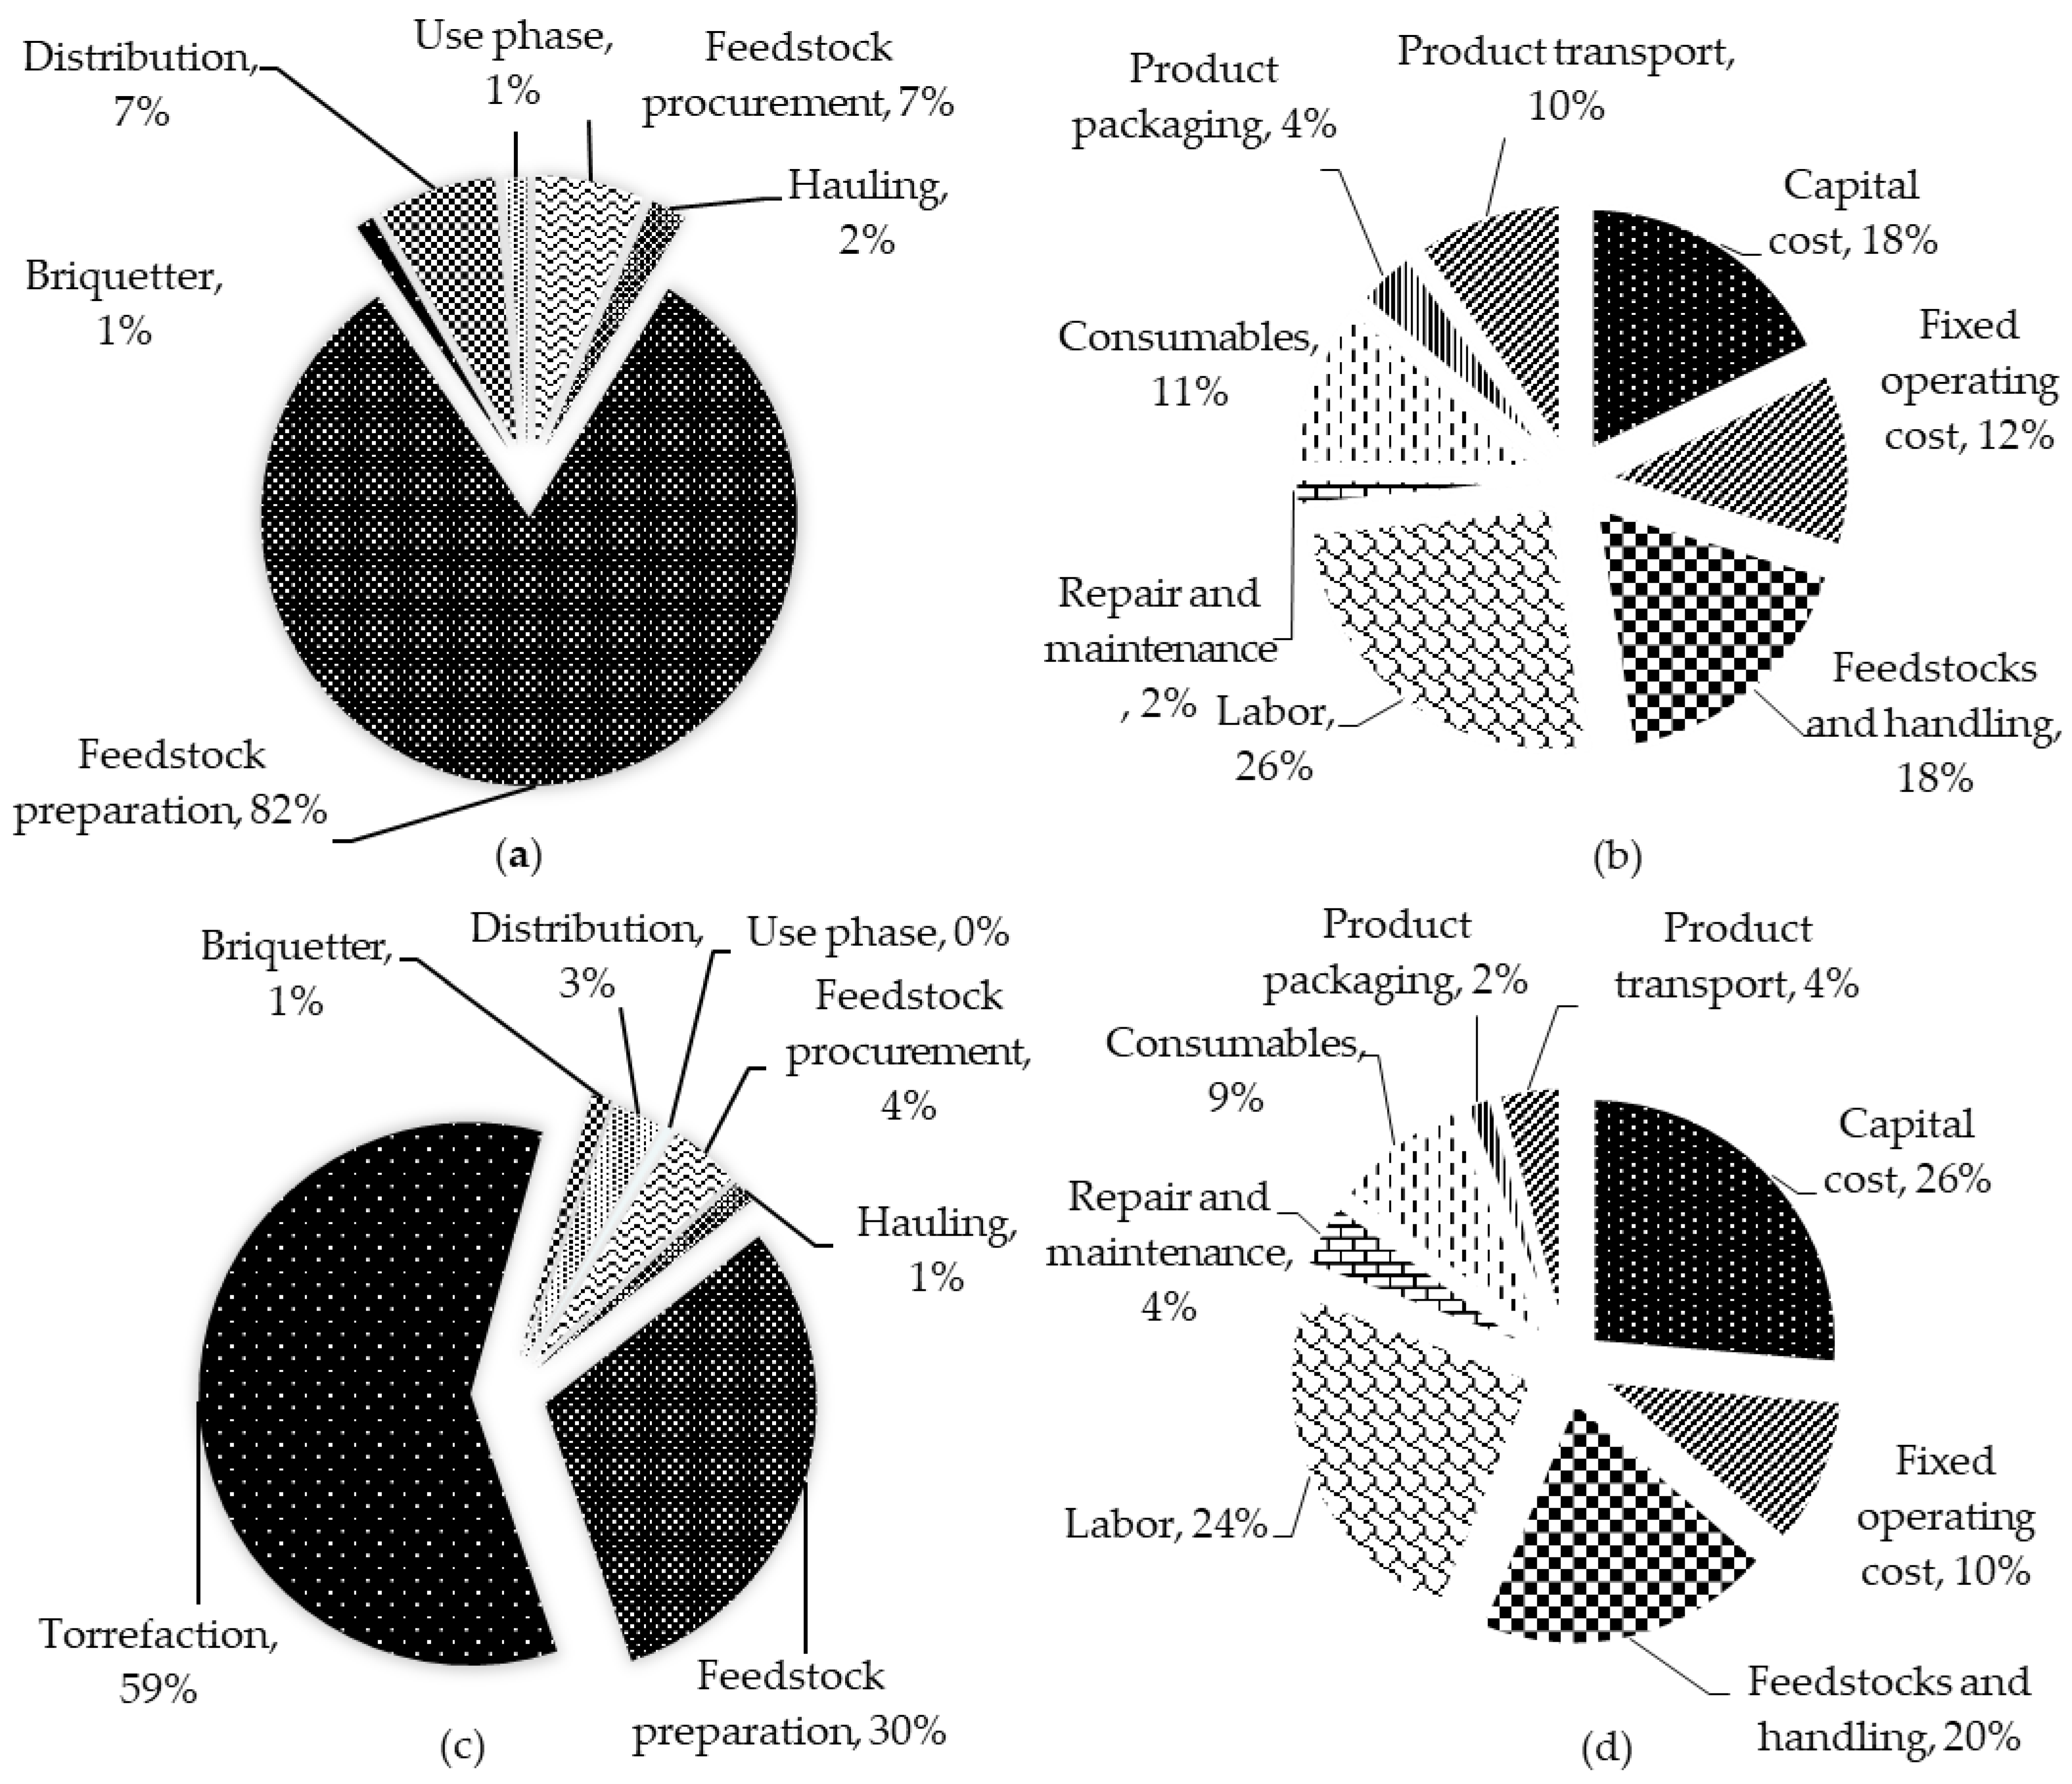
| 1 MJ Heat from Wood Briquette ( WBheat) | |||||||||
| Feedstock Procurement | Hauling | Feedstock Preparation | Briquetter | Distribution | Use Phase | Pile and Burn | Total (g CO2 eq/MJ) | ||
| Case 1 | 7% | 2% | 82% | 1% | 7% | 1% | - | 9.3 | |
| Case 2 | 5% | 2% | 65% | 23% | 5% | 1% | - | 12.6 | |
| Case 3 | 6% | 9% | 71% | 12% | 1% | 1% | - | 11.0 | |
| Case 4 | 5% | 18% | 64% | 11% | 1% | 1% | - | 12.3 | |
| Case 5 | 2% | 1% | 95% | 0% | 2% | 0% | - | 36.8 | |
| Case 6 | 7% | 2% | 82% | 1% | 7% | 1% | −25% | 7.0 | |
| 1 MJ Heat from Torrefied Wood Briquette ( TWBheat) | |||||||||
| Feedstock Procurement | Hauling | Feedstock Preparation | Torrefaction | Briquetter | Distribution | Use Phase | Pile and Burn | Total (g CO2 eq/MJ) | |
| Case 1 | 4% | 1% | 30% | 59% | 1% | 3% | 0% | - | 16.5 |
| Case 2 | 1% | 0% | 14% | 72% | 11% | 1% | 0% | - | 50.8 |
| Case 3 | 2% | 3% | 20% | 66% | 8% | 0% | 0% | - | 31.5 |
| Case 4 | 2% | 8% | 19% | 64% | 7% | 0% | 0% | - | 32.9 |
| Case 5 | 2% | 1% | 55% | 34% | 7% | 1% | 0% | - | 37.1 |
| Case 6 | 4% | 1% | 30% | 59% | 1% | 3% | 0% | −16% | 13.9 |
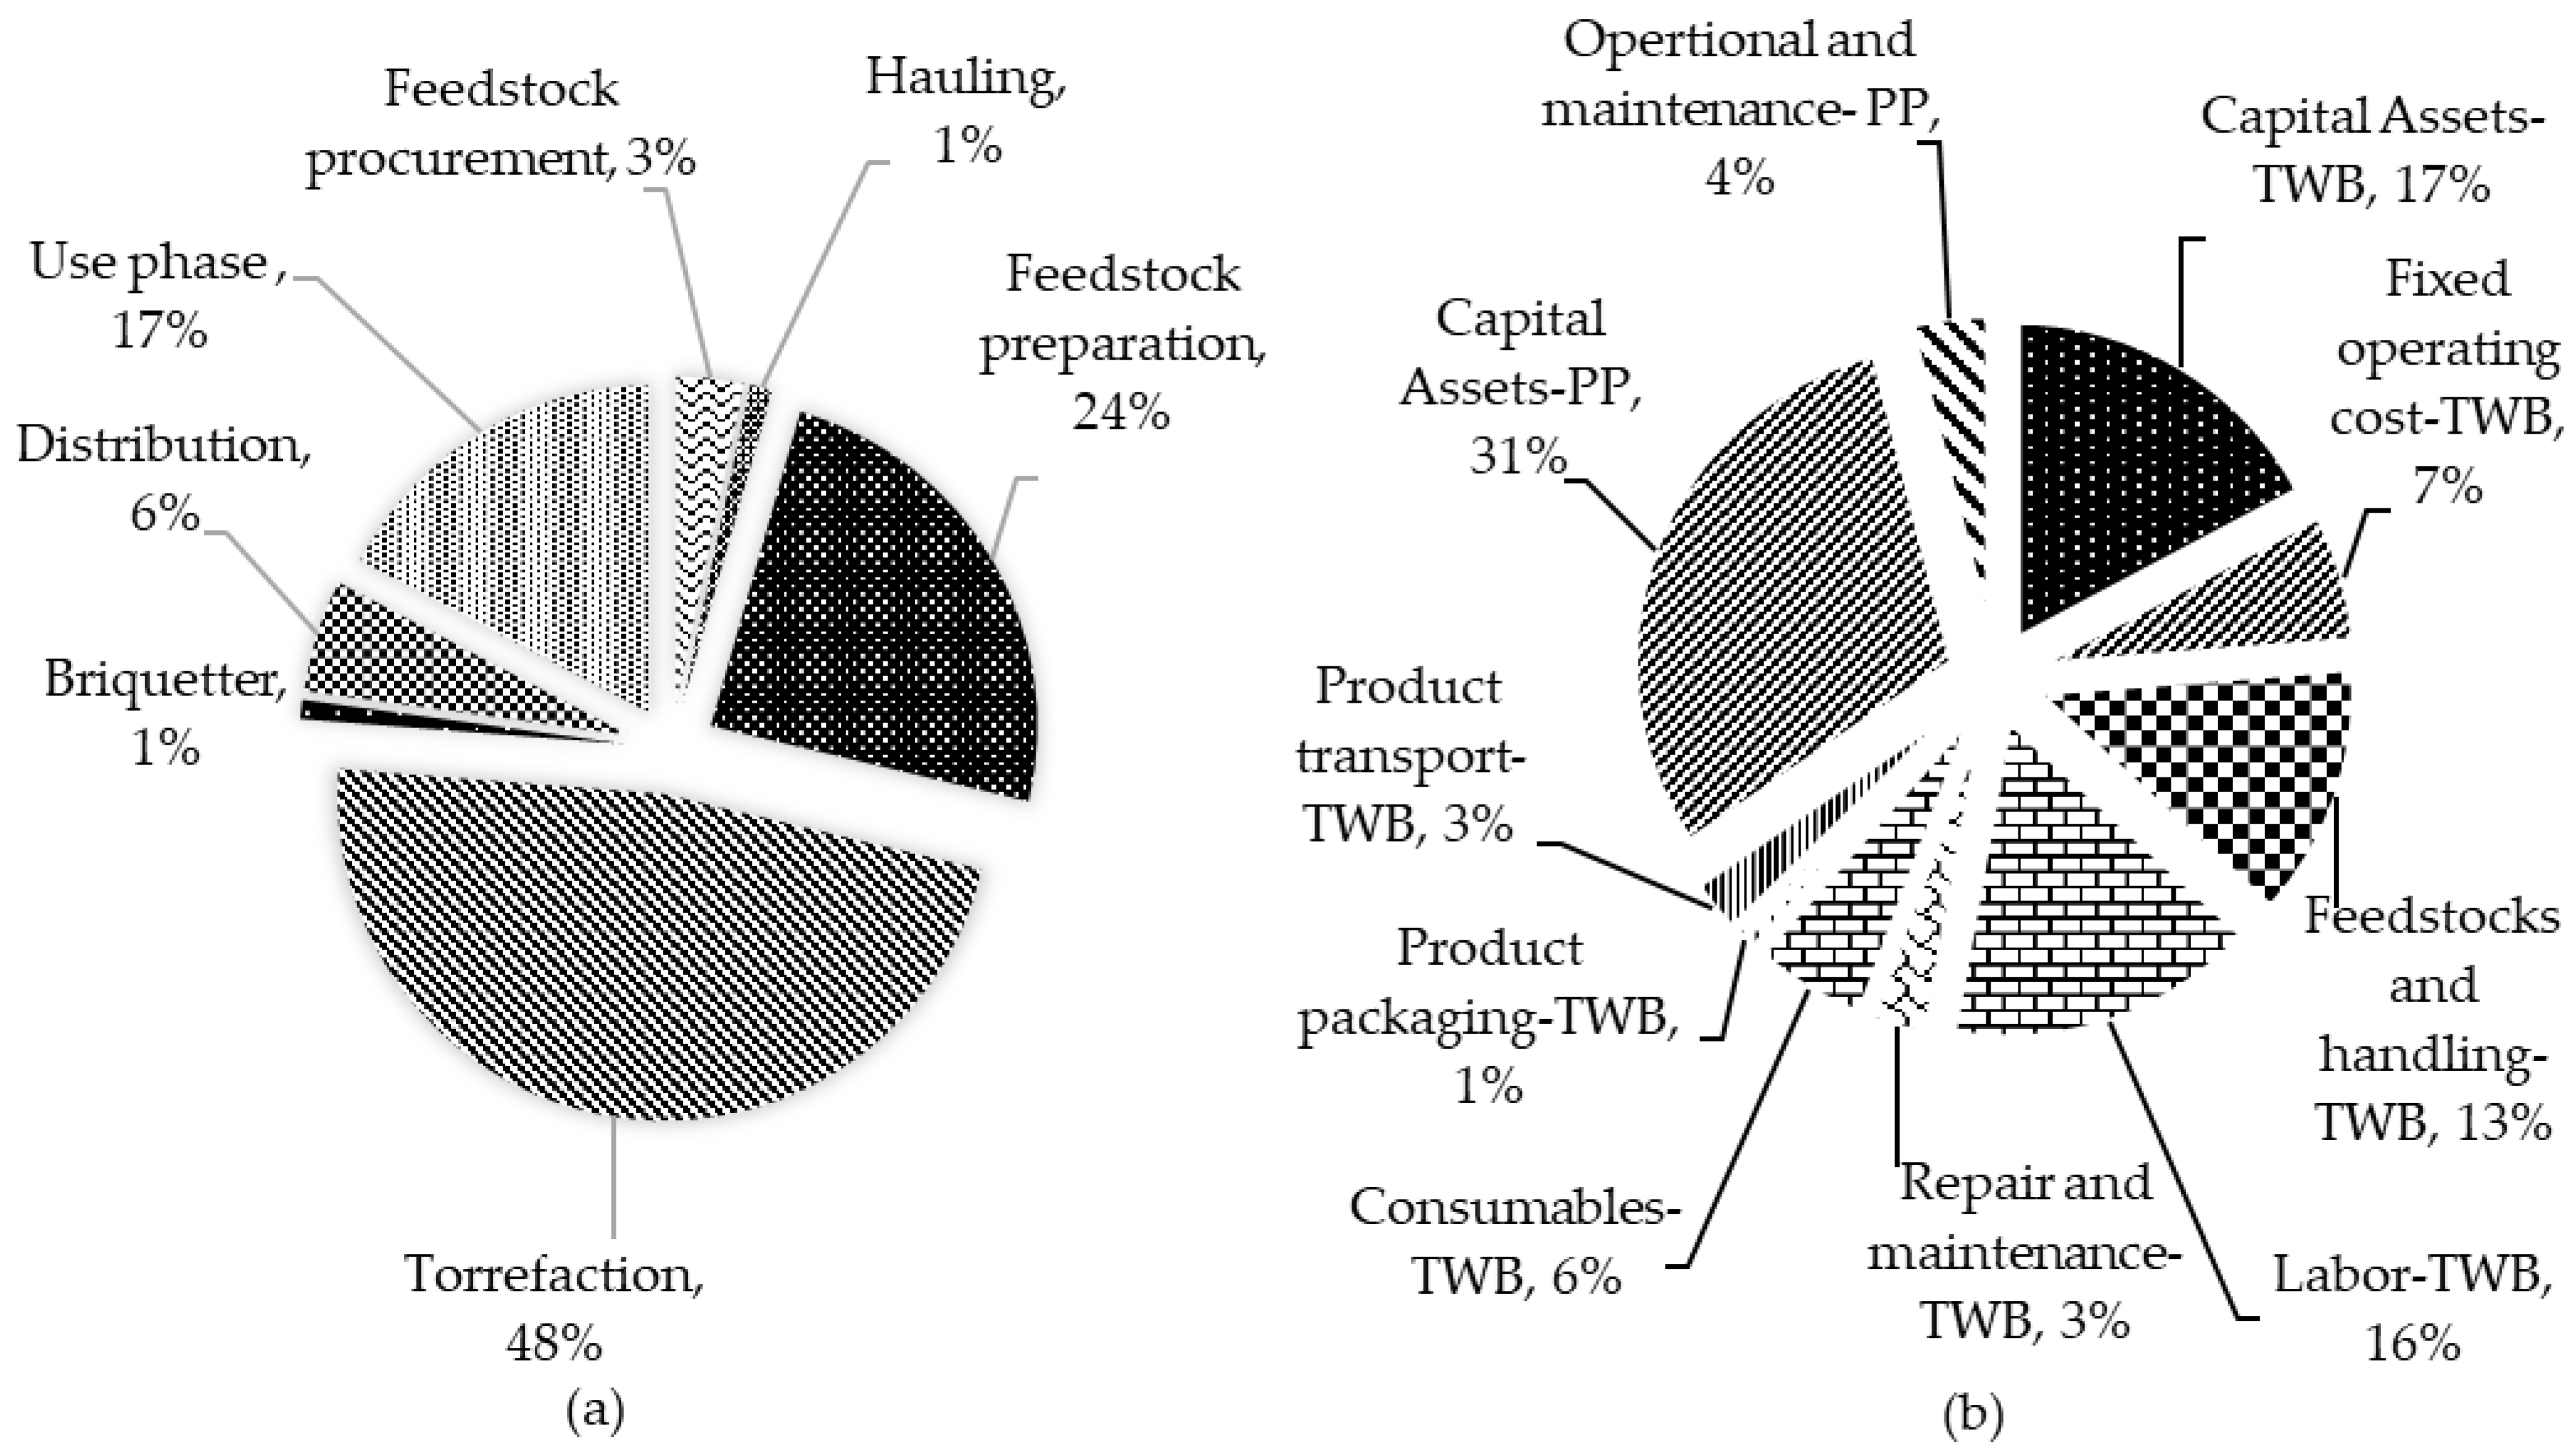
| 1 kWhe from TWB (TWBelectricity) | |||||||||
| Feedstock Procurement | Hauling | Feedstock Preparation | Torrefaction | Briquetter | Distribution | Use Phase | Pile and Burn | Total (g CO2 eq/kWh) | |
| Case 1 | 3% | 1% | 24% | 48% | 1% | 6% | 17% | - | 166.8 |
| Case 2 | 1% | 0% | 13% | 66% | 10% | 2% | 7% | - | 443.0 |
| Case 5 | 2% | 1% | 50% | 30% | 6% | 3% | 9% | - | 332.7 |
| Case 6 | 4% | 1% | 28% | 54% | 1% | 6% | 20% | −13% | 145.7 |
Publisher’s Note: MDPI stays neutral with regard to jurisdictional claims in published maps and institutional affiliations. |
© 2021 by the authors. Licensee MDPI, Basel, Switzerland. This article is an open access article distributed under the terms and conditions of the Creative Commons Attribution (CC BY) license (https://creativecommons.org/licenses/by/4.0/).
Share and Cite
Sahoo, K.; Alanya-Rosenbaum, S.; Bergman, R.; Abbas, D.; Bilek, E.M. Environmental and Economic Assessment of Portable Systems: Production of Wood-Briquettes and Torrefied-Briquettes to Generate Heat and Electricity. Fuels 2021, 2, 345-366. https://0-doi-org.brum.beds.ac.uk/10.3390/fuels2030020
Sahoo K, Alanya-Rosenbaum S, Bergman R, Abbas D, Bilek EM. Environmental and Economic Assessment of Portable Systems: Production of Wood-Briquettes and Torrefied-Briquettes to Generate Heat and Electricity. Fuels. 2021; 2(3):345-366. https://0-doi-org.brum.beds.ac.uk/10.3390/fuels2030020
Chicago/Turabian StyleSahoo, Kamalakanta, Sevda Alanya-Rosenbaum, Richard Bergman, Dalia Abbas, and E. M. (Ted) Bilek. 2021. "Environmental and Economic Assessment of Portable Systems: Production of Wood-Briquettes and Torrefied-Briquettes to Generate Heat and Electricity" Fuels 2, no. 3: 345-366. https://0-doi-org.brum.beds.ac.uk/10.3390/fuels2030020