
An IoT-Based Encapsulated Design System for Rapid Model Identification of Plant Development


1
Innovation Centre Nikola Tesla, Unska 3, HR-10000 Zagreb, Croatia
2
Urban Oasis Ltd., Avenija Dubrovnik 15, HR-10000 Zagreb, Croatia
*
Author to whom correspondence should be addressed.
Telecom 2022, 3(1), 70-85; https://0-doi-org.brum.beds.ac.uk/10.3390/telecom3010004
Submission received: 25 October 2021
/
Revised: 19 December 2021
/
Accepted: 29 December 2021
/
Published: 6 January 2022
(This article belongs to the Special Issue Applications of Communication Technologies in Agriculture: IoT, Machine Learning, and Big Data)
Abstract
:Actual and upcoming climate changes will evidently have the largest impact on agriculture crop cultivation in terms of reduced harvest, increased costs, and necessary deviations from traditional farming. The aggravating factor for the successful applications of precision and predictive agriculture is the lack of granulated historical data due to slow, year-round cycles of crops, as a prerequisite for further analysis and modeling. A methodology of plant growth observation with the rapid performance of experiments is presented in this paper. The proposed system enables the collection of data with respect to various climate conditions, which are artificially created and permuted in the encapsulated design, suitable for further correlation with plant development identifiers. The design is equipped with a large number of sensors and connected to the central database in a computer cloud, which enables the interconnection and coordination of multiple geographically distributed devices and related experiments in a remote, autonomous, and real-time manner. Over 40 sensors and up to 24 yearly harvests per device enable the yearly collection of approximately 750,000 correlated database entries, which it is possible to independently stack with higher numbers of devices. Such accumulated data is exploited to develop mathematical models of wheat in different growth stages by applying the concepts of artificial intelligence and utilizing them for the prediction of crop development and harvest.
1. Introduction
Artificial intelligence (AI) today has a significant focus on increasing the efficiency of different sectors and reducing negative impacts on the environment. The agriculture sector started adopting AI only recently, following the development of the Internet of Things (IoT), i.e., distributed networks of sensors and other devices [1,2] that enable precision agriculture and formation of large datasets [3]. The number of IoT in use was projected to increase from 30 million in 2015 to 75 million in 2020 [4] and to offer significant precision farming opportunities such as crop monitoring, disease detection, storage optimization, treatment optimization, irrigation, and weeding [5,6]. Successful examples of precision agriculture analytics include plant disease detection [7,8], crop prediction through fruit counting or estimation from crop images with different spectra with 70–90% reliability of estimation accuracy [9], or modeling and forecasting of corn yields using neural networks depending on soil treatment [10]. A wider application of these methods is still in its infancy, as research began only a few years ago, aided primarily by climate change concerns. The biggest aggravating factor for the successful application of AI is the lack of large amounts of data as a prerequisite for further analysis and modeling. Due to slow, year-round cycles and the distinct specificity of individual locations (soil and weather conditions), it is not possible to promptly create a significant database of historical data. In addition, it is necessary to install a large number of sensors on different fields, which is one of the most propulsive areas of modern agriculture [11]. Moreover, climate change is one of the most expressed aggravating factors for obtaining the relevant datasets.
Existing datasets today are obtained from drones or satellites covering whole fields rather than individual plants and via observing the conditions using various spectra [12]. The most precise kinds of datasets are gained from the perspectives of microbiological identifiers, which imply scarce numbers of often invasive samples that are periodically analyzed with specialized equipment and expensive devices (in the range of EUR 100,000) [13]. The IoT approach implies cheap sensors (in range of EUR 10–100) while the low measurement quality is compensated for by the data size [14]. However, these cheap sensors mostly monitor weather and soil conditions, while the development of sensors capable of monitoring plant status is an ongoing field of research, with examples existing that can capture electrophysiological measurements [15] or plant acoustic emissions [16].
The issue of the slow collection of large amounts of relevant historical data is tackled here by creating specially designed bioreactors that serve as rapid plant-model identification systems for multiple simultaneous climate zones, supported by autonomous real-time data acquisition and archiving. Instead of the usual observed annual life cycles in nature, the system introduces equipment that can be used for the rapid, simultaneous implementation of a number of different experiments in a climate-encapsulated system with control loops of light, temperature, humidity, pH, and nutrient profiles, with an extensive network of sensors and with the help of multi-spectral cameras. The equipment is supported by software in the form of the autonomous storage of identifiers in a central database. For the exemplary case of wheat crops, a single encapsulated design enables 8–12 simultaneous plant groups, each one as an individual field emulation capable of squeezing up to two yield cycles in a single year, resulting in a total of 16–24 harvests per year per device; each device is the size of a computer server cabinet. With four available devices, the number rises almost up to 100 harvests per year.
With a significant amount of historical data available, mathematical models of several different stages of wheat crop development are developed using machine learning (ML) approaches (e.g., artificial neural networks, boosting ensemble methods, etc.) with respect to different, artificially created and permuted microclimate conditions correlated with identified plant growth and development indicators at different stages. A prerequisite for such a mathematical model is a large archive of correlated input and output data (i.e., climate conditions) and measurements of plant development indicators. The models are identified based on their inputs: photosynthetic photon flux density (PPFD), light spectrum, temperature, humidity, CO, and nutrients selected according to defined scenarios and maintained by corresponding control loops. The observed outputs are: stem segment length, yield, grain number and size, and spectra observed in an incremental way with regards to historical trends, aimed to be captured by high-resolution and multi-spectral cameras, then analyzed, archived, statistically processed, and, finally, modeled by ML algorithms. This is the main premise of the project AgroSPARC–Smart and Predictive Agriculture for Resilience to Climate Change.
This paper presents an extension of the previously published conference paper [17] through the inclusion of relevant device design information, both on construction and software architecture, as well as additional details regarding the overall methodology for rapid plant modeling and collected dataset dissemination. The main contribution of this paper is the holistic system for the rapid modeling of plant development. The models are envisioned to be utilized in a smart agriculture setting, for support in wheat crop production and analysis of wheat culture development under climate changes. The proposed system includes the following highlights:
- An encapsulated design (apparatus) for accelerated experiments of plant growth in an isolated environment with autonomous permutations of artificial climatic conditions.
- Cloud-based software support for remote autonomous real-time data monitoring, acquisition, and archiving, suitable for AI data processing and modeling.
- A methodology of plant-growth observation with rapid performance of experiments for the collection of relevant measurements and plant development model identification.
The paper is organized as follows. The overall methodology of the proposed approach is presented in Section 2. Encapsulated design and its basic features are described in Section 3, while the architecture of the supporting IT system is described in Section 4. Finally, the paper is concluded in Section 5.
2. Rapid Plant Modeling System
The proposed methodology aims to isolate plant physiognomy identifiers that are related to faster or slower plant development at different stages. There are hundreds of phenological stages of wheat growth (BBCH scale) [18], and the system separates the data for three generalized ones: (i) germination, (ii) plant formation and maturation, and (iii) grain maturation, which are general approximated stages for many plants, with the open possibility for the concept to be transferable to other species. Physiological identifiers, such as stomatal transpiration, the photosynthetic effect, night respiration, intercellular carbon dioxide concentration, evaporation, etc., are associated with physical and more accessible (i.e., measurable) identifiers, such as water and nutrient absorption, measured by multi-spectral cameras, precise growth measurements, images in different spectra in certain modes (day and night), etc. The implementation of experiments aims to be significantly accelerated by the simultaneous possibility of providing different conditions and the use of cameras and a mesh grid network of sensors with autonomous archival of data in real time, which is then a suitable starting point for determining the correlations between conditions and plant growth through advanced machine learning algorithms.
The individual relevant parameters, which are measurable by sensors, and the correlation with the growth and development of the plant are autonomously archived in real time together with the given climatic conditions in which the plant is located, gradually forming a very large database suitable for determining correlation relationships using advanced machine learning algorithms. Thus obtained, accurate data about isolated and artificially created climatic conditions and consequent plant development are archived and, over time, are used to build a large data set of 6 million records collected about 5000 climate scenarios over a period of two years, which is suitable for applying algorithms in mathematical modeling and then predicting future plant developments upon the onset of climate change. The obtained mathematical models will be checked on a separate set of data, with the identification of the reliability of the estimate based on the forecasted conditions to provide a prognostic illustration of expected plant development. To significantly increase the reliability of prediction, models are classified into and reduced to three parts depending on the plant stage: (i) germination, (ii) plant formation and maturation, and (iii) grain maturation, and research is conducted on such divided data sets.
The cycle of germination is approximated to 5–7 days in favorable and 17–20 days in unfavorable conditions. The cycle of each experiment, not counting the germination stage, is estimated to take an average of 10 weeks (with the preparation of the initial phase occurring with seedlings in large number of cases outside the chambers). After the appropriate period, the data is sent in batches to the data analysis center for further processing. With four separate zones and eight plants, or a possible eight partially separated zones, the aim is to implement a total of 5000 climate scenarios over 24 months, where some will be repeated several times to obtain the relevance of data repeatability. The result indicators are: 10 temperature permutation scenarios, 5 humidity permutations, 10 lighting profile permutations, etc. After the planned system operation over the two year period, a report on conducted experiments and scenarios is envisioned to conclude the improvement. The results imply the optimization of scenario selection: permutation ranges and resolutions of different climatic conditions, adaptation of growth, and development scenarios with available equipment, spatial distribution, and climate zones.
Following from the above, the objectives of the system are:
- To develop the IoT-based apparatus for rapid collection of plant growth data, storage, and processing.
- To conduct experiments across 5000 climate scenarios over a period of 2 years.
- To obtain a relevant dataset of 6 mil. entries for the chosen wheat crop.
- To apply machine learning algorithms to three different growth stages to obtain various use-case models of wheat crop development.
- To structure the dataset and the models to be exploited for prediction of crop maturation, grain moisture, and optimization of pest treatments.
The scheduled climate scenarios imply a single set of the following range of identifiers, together with their combination, for every BBCH stage:
- Temperature [C]: [4, 4.5, 5, …, 39.5, 40],
- Humidity [%]: [10, 15, 20, …, 95, 100],
- PPFD [mol/m]: [0, 25, 50, …, 1725, 1750],
- Nutrients [pH]: [4, 4.5, 5, …, 9.5, 10].
Furthermore, each individual set of microclimate conditions (i.e., the climate scenario) is fixed around the real outside conditions, then permuted to positive and negative offset in order to reach all the required scenarios while minimizing the cost of operation. Therefore, e.g., outside light is exploited through the transparent barrier or dimmed by rotating the observed plant in the shaded area.
The validity of the conditions is continuously monitored and maintained by control loops such that disturbances are compensated for or at least known, measured, and archived. The soil is conditioned equally on a much larger scale, out of which the small portions are taken and placed in the cups together with the seeds. The pH value is measured at the beginning of the process, then kept intact during the whole experiment period. Changing the pH value implies initiating a new experiment. Additionally, the number of plant groups (cups), with circa 5 plants per group, was doubled for the same climate scenarios.
Once the planned experiments have been conducted, the entire collected dataset consisting of both chamber measurements and camera-based plant development identifiers will be made publicly available to facilitate future research on the topic of wheat plant development modeling.
The web API was envisioned as being a form of a public portal, which serves as an interface for information and interaction with potential users who will be able to choose their climate and enter simple entry conditions such as sowing times, periods of treatment with different preparations, geographical location, soil indicators, etc., and as generate outputs consisting of indicators of the predictive analytic.
3. Encapsulated Design Plant Growth Devices
The proposed methodology utilizes the developed encapsulated design (apparatus) for accelerated experiments observing plant growth in an isolated environment with autonomous permutation of artificial climatic conditions (light profile, temperature, humidity, airflow, pH, and nutrient level) and archiving plant growth and development indicators collected by different sensors and multi-spectral cameras. The apparatus, i.e., the prototype of the system, implies constructional, assembly, and electronic preconditions, as well as corresponding control loops for achieving the desired stated conditions in real time and, at the same time, regulating several different climatic conditions in an isolated environment. The constructional prerequisite of the system ensures isolation from external conditions and enables a spatially compact design suitable for separating several different climatic conditions. The isolated environment also allows the simulation of conditions that are not yet present in the considered climates but are expected to occur under the influence of climate changes. Plants, in individual phases, react differently to nine basic external conditions: air humidity, photosynthetic light exposure, air temperature, wind, CO air concentration, soil temperature, soil nutrients, dissolved oxygen in saturated soil, and soil humidity [19]. Based on this, the constructional prerequisite includes a system for irrigation and nutrient supply through pumps and tubes to each individual plant, artificial LED lighting of different spectra, and a heating and cooling system. The electronic prerequisites include electronic support, sensors, and control hardware for the regulation of the aforementioned climatic conditions, as well as support for the easy adjustment of the parameters for future experiments.
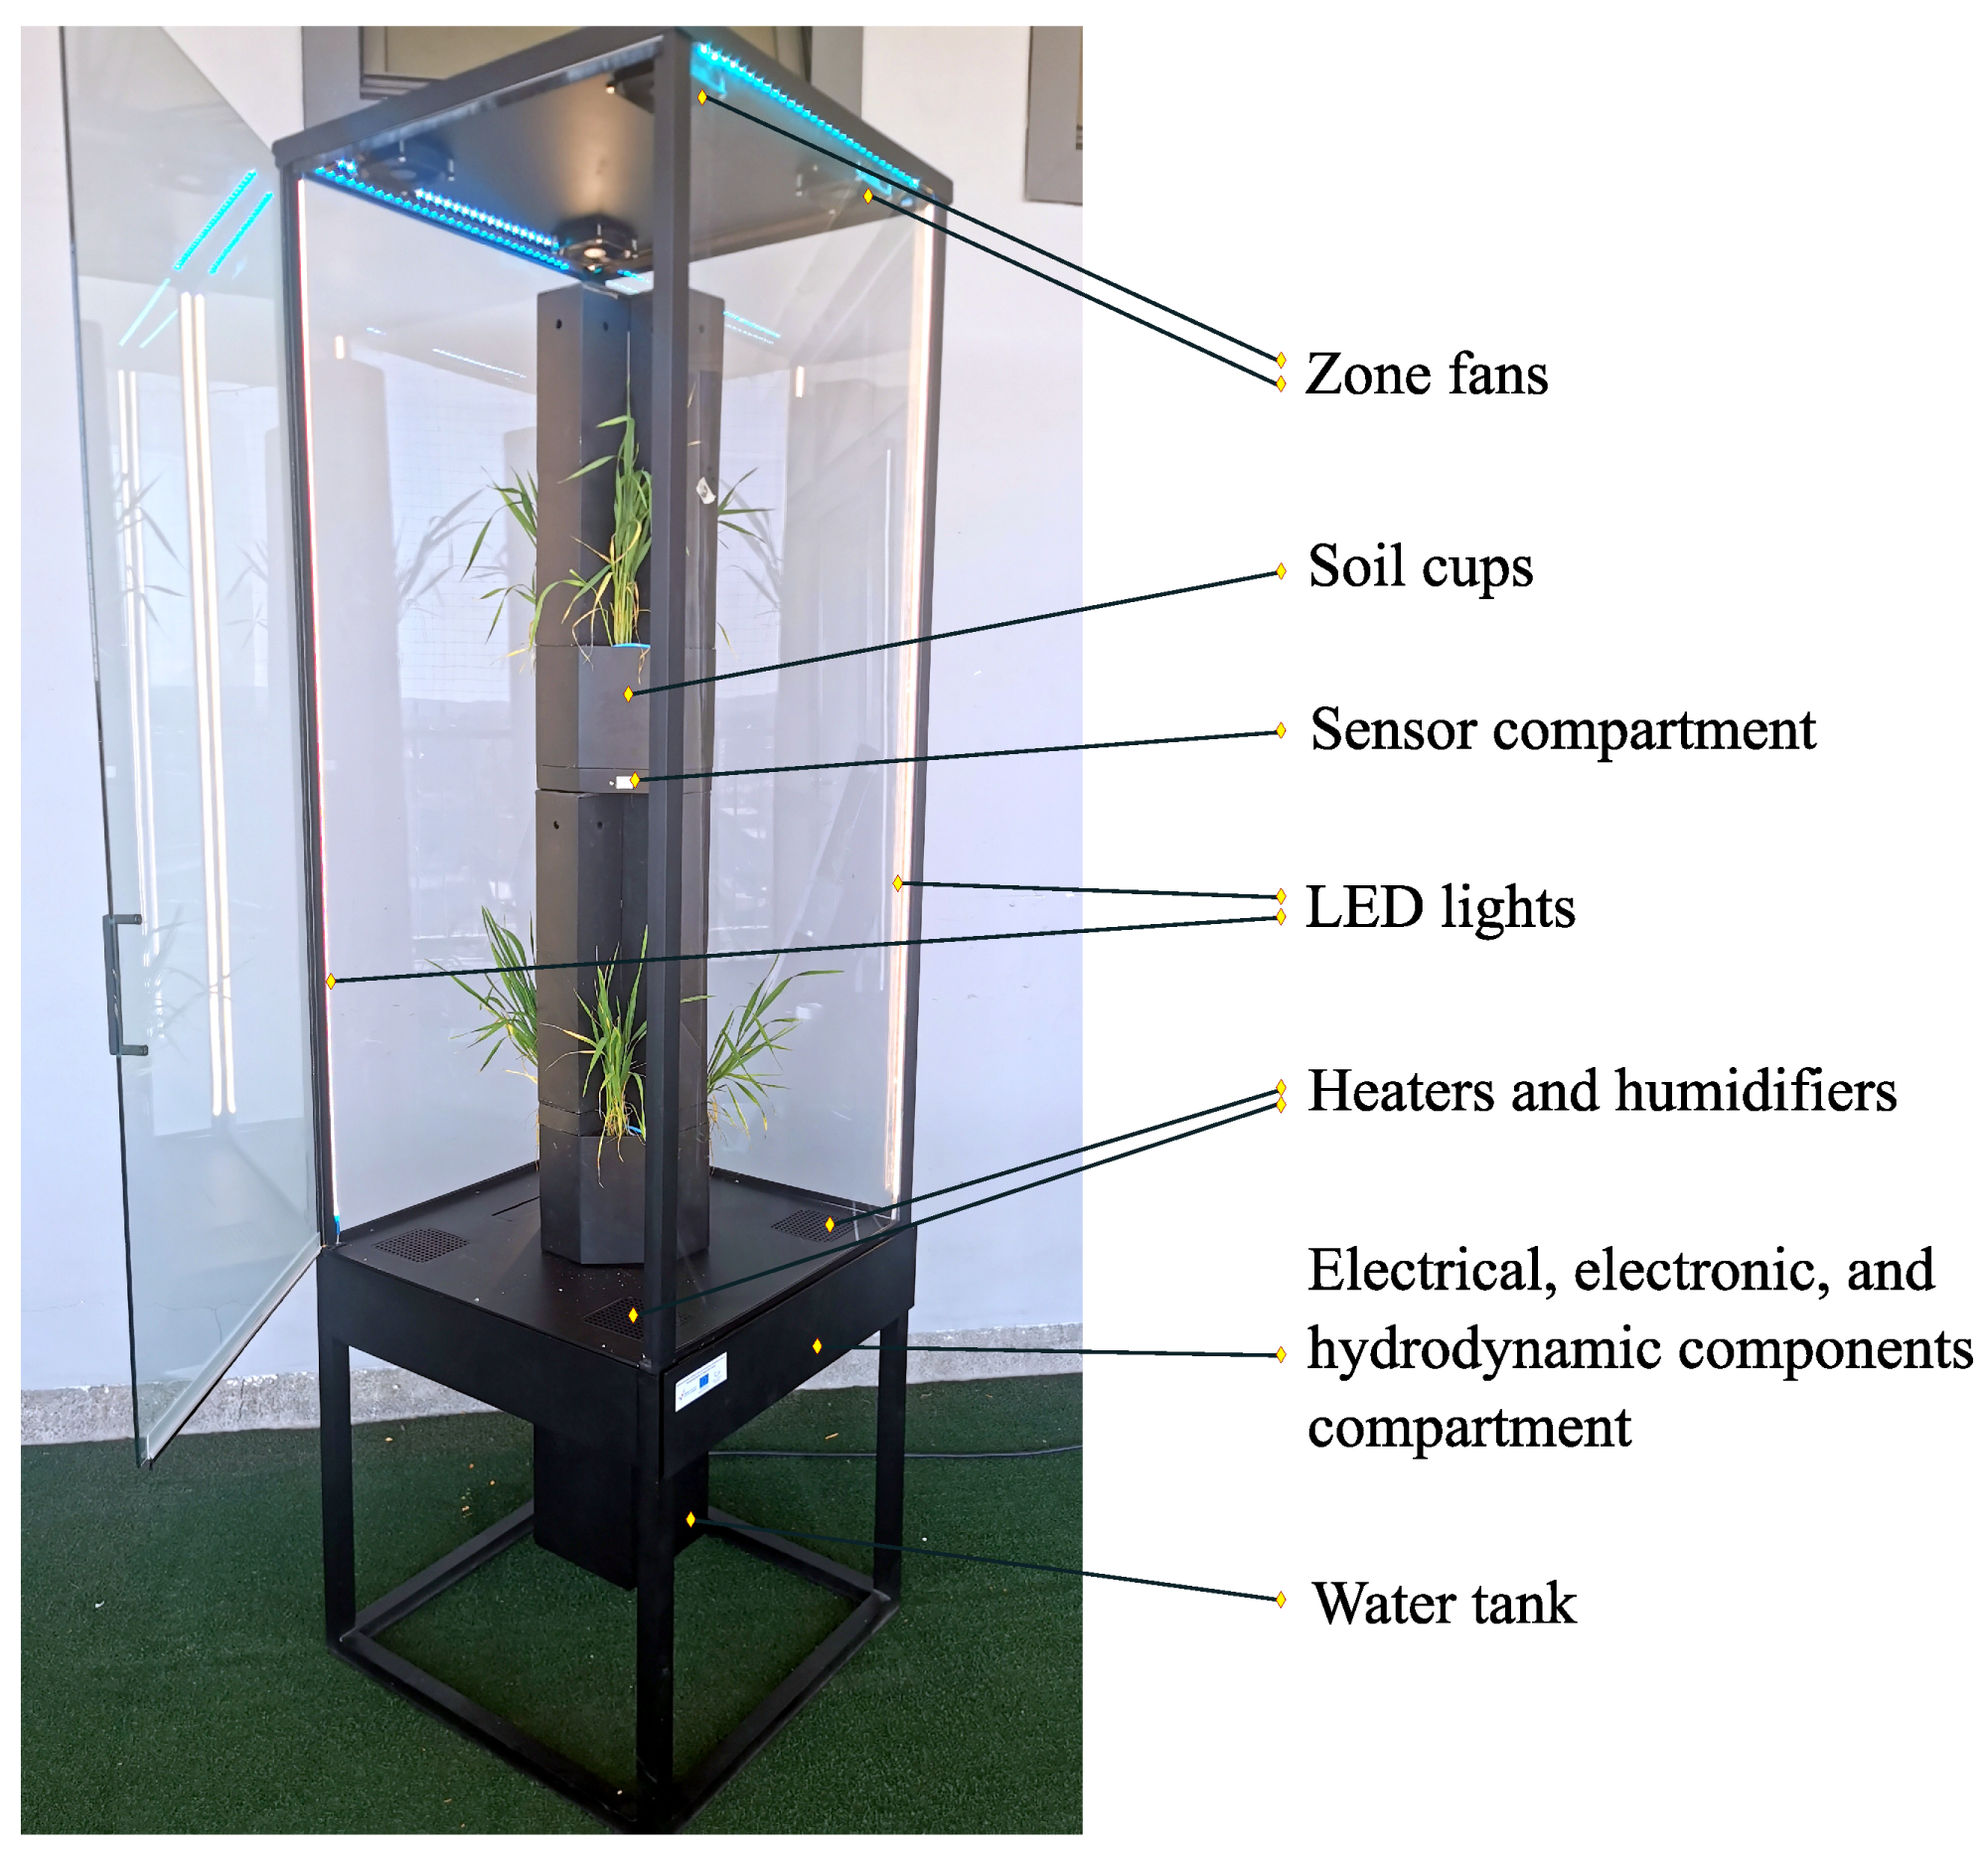
By being able to control the microclimate environment, the encapsulated design exploits the outdoor environment and further superposes the desired artificial environment (temperature, soil humidity, air humidity, photosynthetic lighting, and CO and O concentration and aeration) to experiment on plant growth and development under different (sometimes extreme) microclimate conditions and to collect and analyze data to build artificial models that are further used for large-scale harvesting predictions. The structure of the encapsulated design is shown in Figure 1; the upper part of the device was designed for plant growth and environment control, and the electronic support is located within the enclosed drawer. It is important to note that, within a single device, it is possible to achieve four separate microclimatic zones with corresponding sensors and actuators in each zone. The devices considered in this paper are based on the intelligent, self-sustainable home gardens manufactured by Urban Oasis and additionally modified by the research team to enable a rapid plant development modeling system.
A list of all the measured microclimate parameters and plant development indicators is provided in Table 1 with a more detailed description given in the following sections.
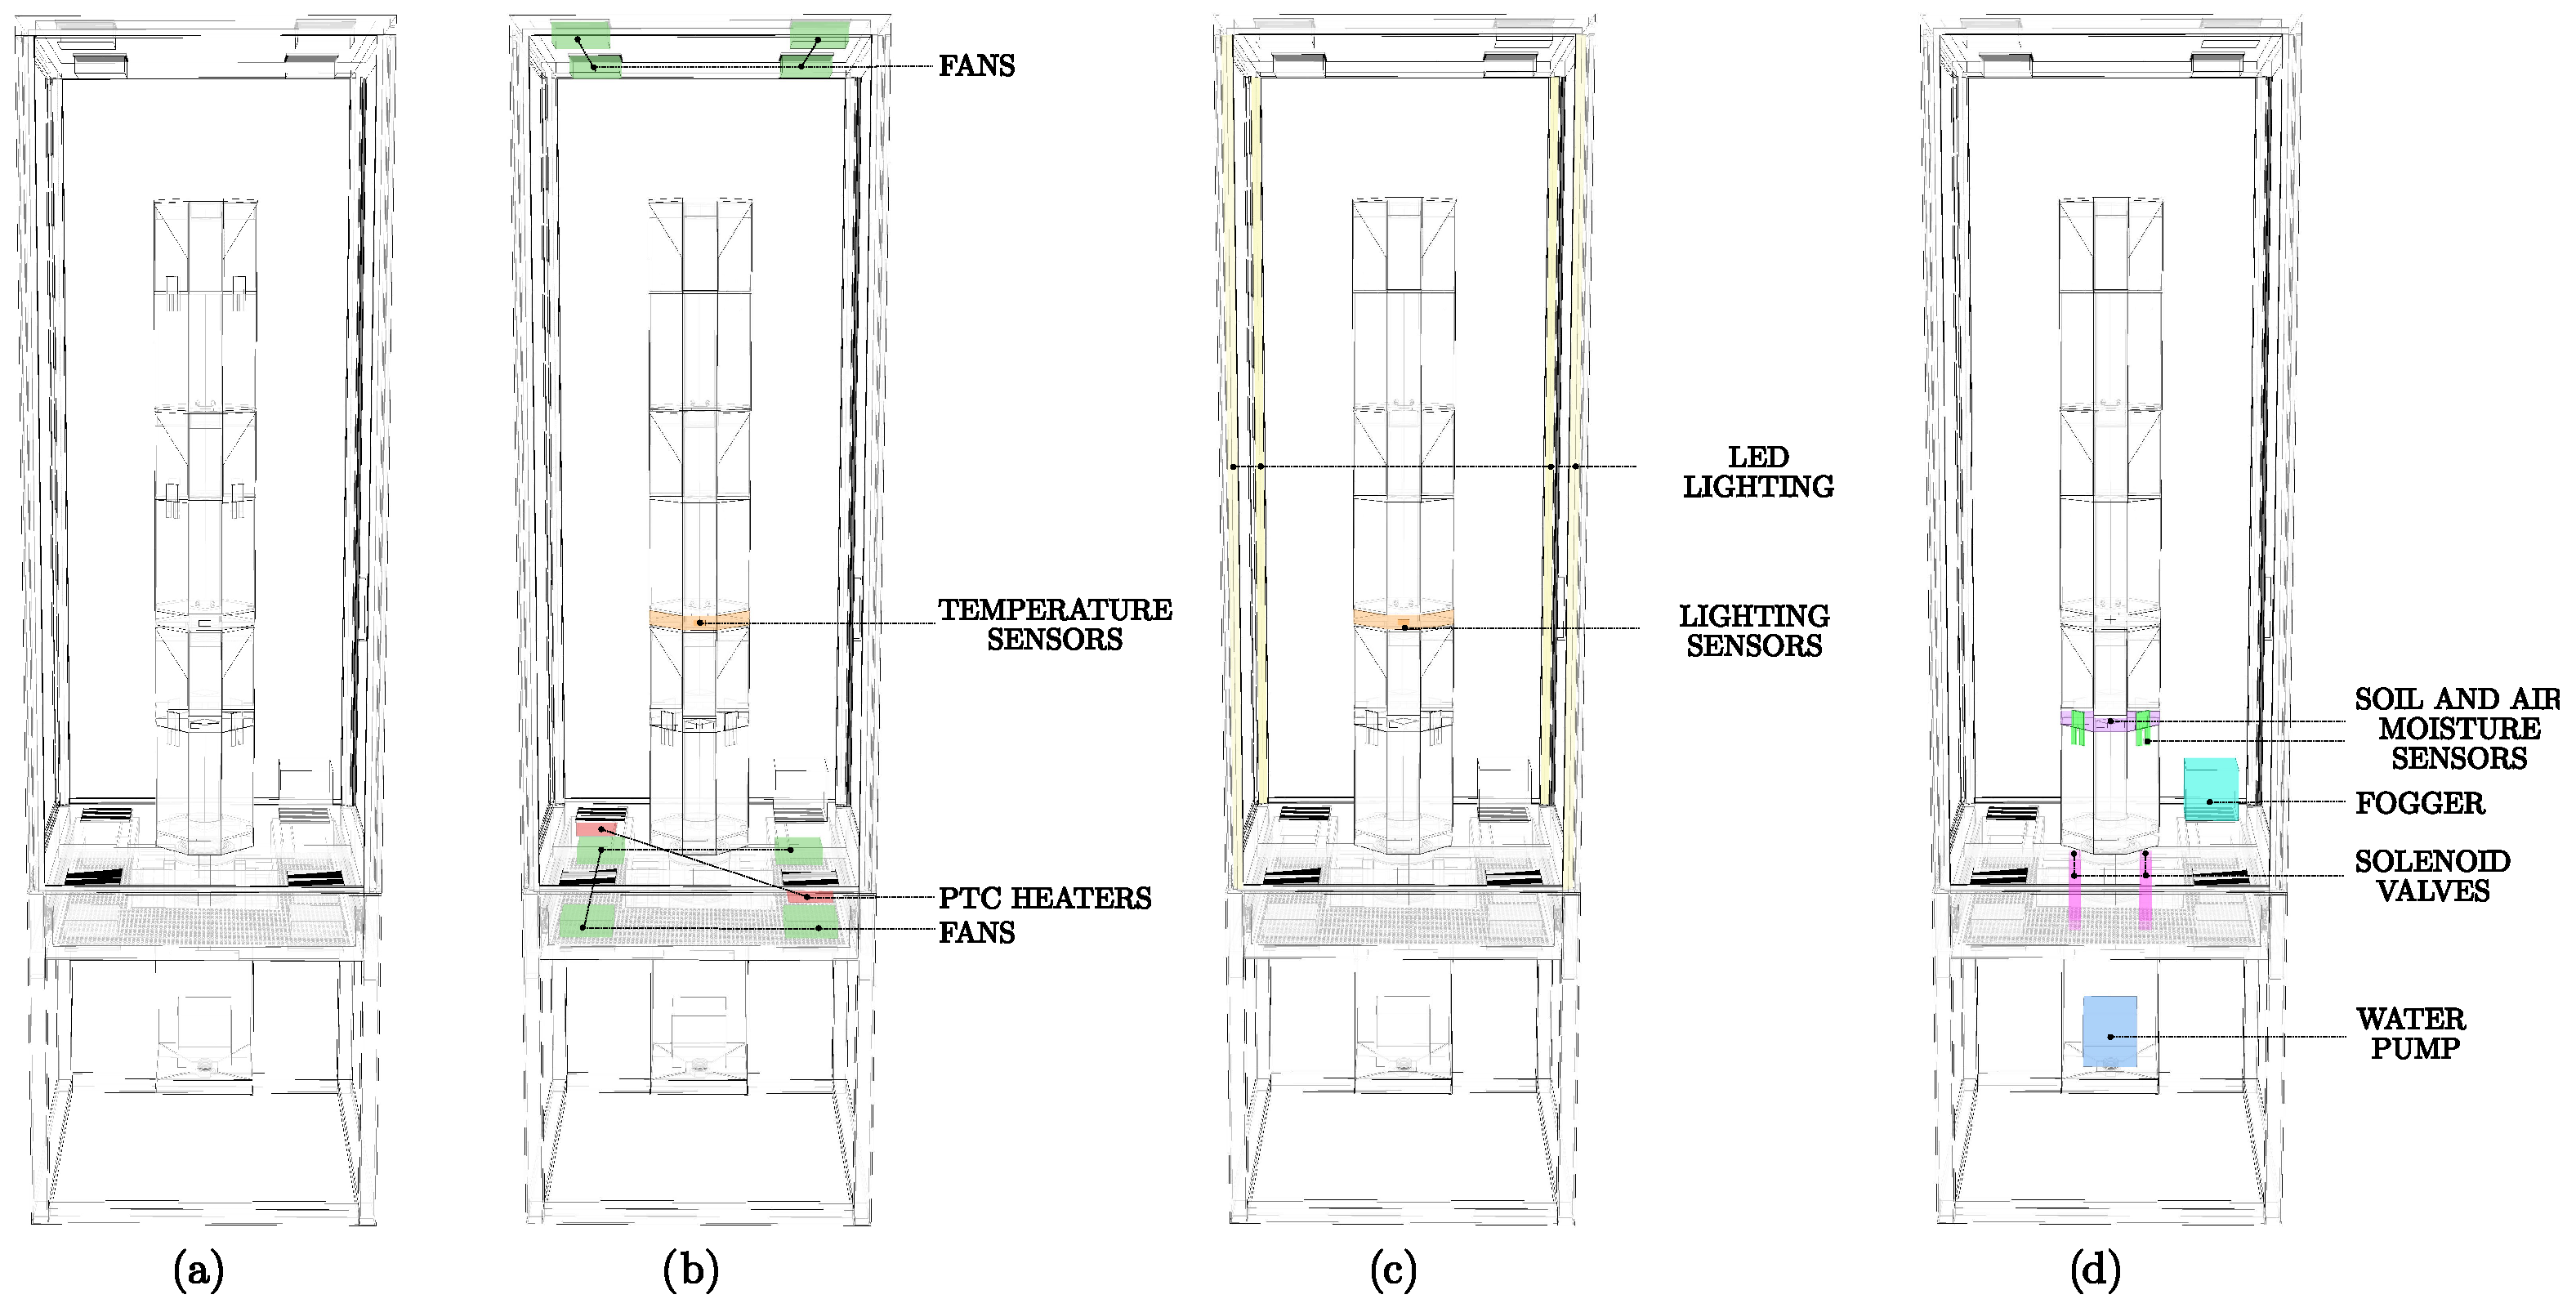
3.1. Climate Parameter Regulation
A detailed construction scheme of the encapsulated plant growth device is depicted in Figure 2, showing separate diagrams for specific control systems with the respective system components highlighted. The considered control systems were designed for control of: (i) air temperature, (ii) CO concentration, (iii) lighting, (iv) soil moisture and air humidity, and (v) soil nutrients.
3.1.1. Air Temperature
Proper distribution of temperature values is extremely important for the vernalization stage. In wheat, this stage coincides with the phenological stages of germination and sowing, as well as the first and second stages of organogenesis. During the vernalization stage, crops produce only vegetative organs. Plants at this stage must be exposed to low temperatures in order to pass into the reproductive period.
Temperature control is achieved using temperature sensors, positive temperature coefficient (PTC) ceramic insulated heaters, a ventilation system, and the influence of disturbances such as LED lights, solar irradiance through the glass cabinet, or the electronic device’s residual heating. The heating element is used in combination with fans to control the air flow, as depicted in Figure 2. The role of the heating element is to reach the maximum temperature in the operating mode and to heat until the set reference is reached. This type of heater was chosen primarily due to its relatively large heating surface, compared with the tile of the same dimensions, and the property that a certain level of air flow will dissipate heat into the encapsulated design.
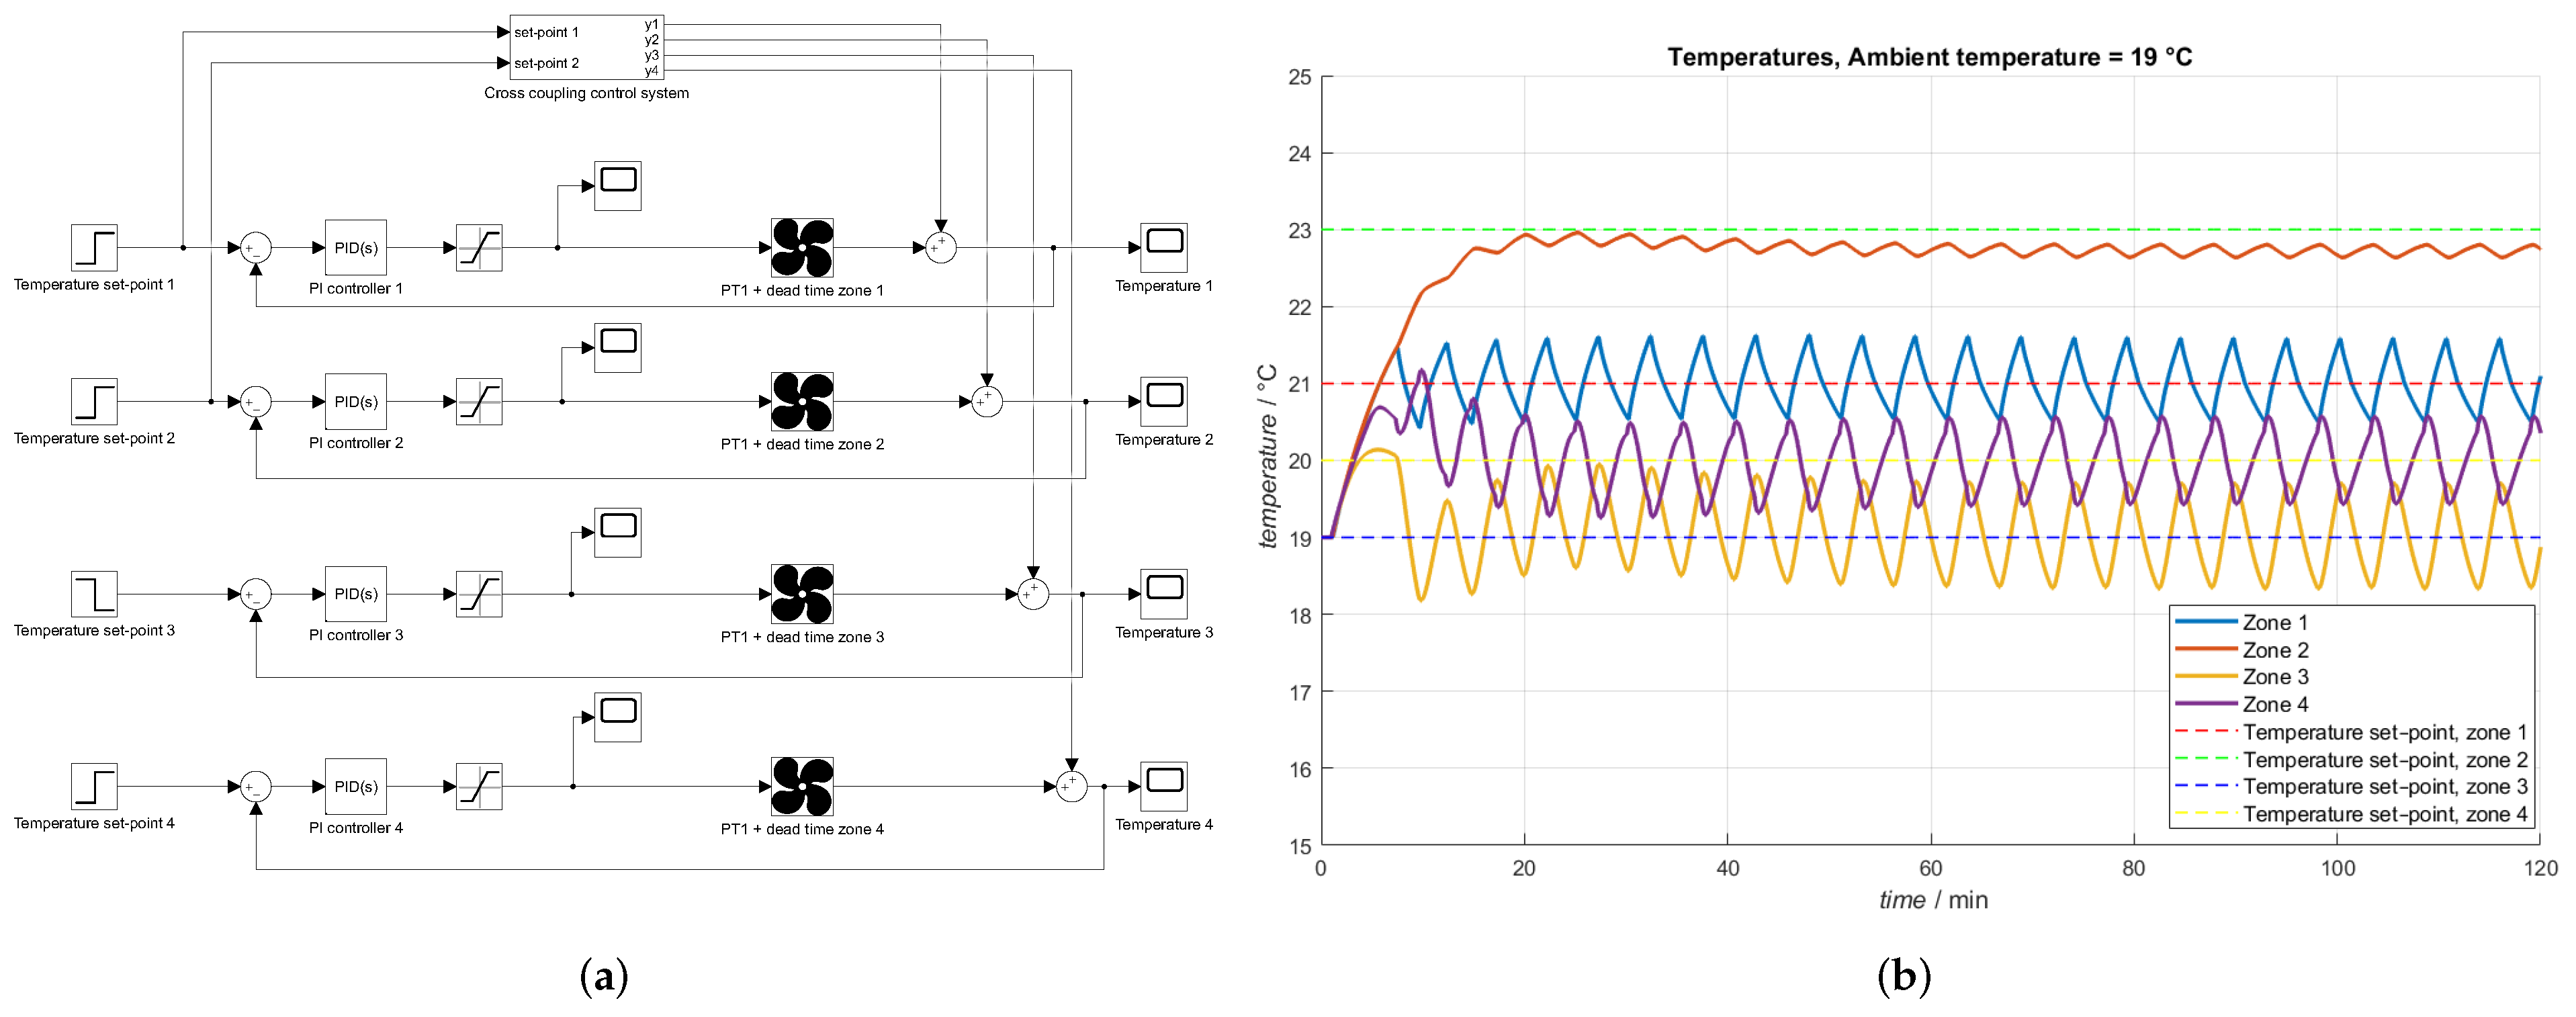
The control system design scheme is presented in Figure 3a, together with an exemplary temperature response in four different zones, as in Figure 3b. The fan speed (air flow) is controlled by pulse-width modulation (PWM) to enable wide air flow span. The speed, as well as the heater’s on and off periods, are regulated within a closed control loop with an individual proportional-integral (PI) controller for each zone. The four zones share the same encapsulated air in the upper compartment of the device (see Figure 1), but the airflow imposed by the fans, solar irradiance, and artificial lighting intensity can ensure the individual temperature-setting of the zone, with cross-coupled dependency in the remaining zones. In particular, up to C difference may be achieved between the coolest and warmest zones.
The control system is therefore designed with decoupling controllers that compensate for the influence of temperatures from other microclimate zones on the observed ones. Based on obtained open-loop step responses, system identification is carried out, wherein the zone temperature dynamics are described as a first-order lag system with a time delay. The transfer function of the exemplary zone 1 describes the influence of the heater from zone 2 () on the temperature in zone 1 ():
Similarly, the identification process is carried out for all four zones with respect to the two heaters with bottom fans and the four top fans. The heaters with bottom fans are controlled using relay controllers following a hysteresis function with an activation band of 0.2 °C. The integrated overheating protection of the heater prevents PI fan-speed control beneath the heaters themselves. The hysteresis band can be tuned to reduce temperature deviations from the set-point or to reduce energy consumption. The decoupling (compensation) controllers are designed as:
where and are the transfer functions for the temperature dynamics of zone 1 and 2 with respect to the heaters for zone 2 and 1, respectively. The controller gain, K, ranging from [0, 1], is used to attenuate the compensation signals from other zones and fine-tune the response.
As shown in Figure 1 and Figure 2, the fan system on the top of the chamber, with the separation of four different zones, directly affects each temperature value, with the capability of reducing it down to the ambient temperature. The top fans are used for more precise control and set-point reference tracking. The corresponding control loops with PI controllers are designed to ensure the reference temperature in the zone, i.e., reduce the temperature by taking away the excess heat.
In total, there are 30 such developed control loops to ensure the internal microclimate conditions in each zone, tower rotation, and positions of the cameras.
3.1.2. CO Concentration
The usual concentration of carbon dioxide in the outdoor air is 350 to 400 ppm, corresponding to regular field conditions. Through the cabinet ventilation depicted in Figure 1 and Figure 2, the plants have access to the surrounding CO concentration and photosynthesized oxygen is removed from the encapsulated design. Increased CO concentrations are achieved by putting the devices in a populated environment (faculty offices) where the concentration can reach up to 3,000 ppm. There are two modes of operation: night (respiratory) and day (photosynthetic). Both are regulated with the inflow and outflow of the external air and CO sensors in the individual zones and corresponding control loops with PI controllers for fan speeds, which also cover the transitional period of resting. In addition to direct CO regulation, the air flow itself is a significant contributor that emulates wind, which tests stem strength and affects the success of cellular respiration and photosynthesis by facilitating the exchange of gas molecules. The system can establish a maximum air flow of 38 CFM (cubic feet per minute), i.e., 64.56 m/h. The control system is directly related to temperature control since it uses the same set of actuators, so each microclimate zone receives the optimal amount of oxygen and carbon dioxide in every cycle, while taking into account the zone temperature set-point. This process is monitored in every step, and it is ensured that other control systems are not interfered with.
3.1.3. Lighting
Sunlight, or, more accurately, photosynthetic light, is one of the limiting climatic factors of the closed environment that determines the growth and development of the plant population. It implies light intensity, spectral composition, and luminance duration. Plants absorb most of the visible spectrum (400–700 nm), i.e., the photosynthetically active radiation (PAR) range, and parts of ultraviolet and far-red radiation (FAR), while the green pigment, chlorophyll, reflects green light (the reason for the green color of leaves) [20,21]. The radiation of the sun travels to the Earth in the form of energy packets (photons), whose energy is inversely proportional to their wavelength. The part of the spectrum used by plants for the photosynthesis process contains low specific energy (compared to, e.g., or X-rays) and compose the majority of the sun’s energy that reaches the ground due to the large number of photons at approximately 500 nm.
According to photoperiodism, wheat culture belongs to long-day plant types. One of the goals of the system is, therefore, to emulate the conditions of the daily sunlight required to achieve the conditions for the photosynthesis process. For normal growth, plants require approximately 500–1500 mol/m/s of PPFD, which is the amount of PAR spectrum photons that reach the plant [21]. This correlates with the required 200–500 W per m of LED light power of the PAR spectrum, which is additionally increased to compensate for the distance of the light source to the plant. Rather than having a multi-kilowatt lighting system, incident sunlight is fully exploited by the glass structure of the encapsulated design, and artificial lighting is also used to increase the intensity, permute the outside conditions, and extend the luminance duration, as depicted in Figure 1 and Figure 2. Artificial lighting is controlled by the PI controller of the LED lighting intensity by the PWM and a corresponding photosensor, in each of the four zones individually. Artificial photosynthetic light can not only improve photosynthesis with intensity, but also increase the duration of the cycle, instead of letting the plants turn to their respiration regimes.
3.1.4. Soil Moisture and Air Humidity
Water is delivered to the soil by pumps and valves to each of the four zones individually and controlled by corresponding hysteresis controllers based on the information gathered from the electrical conductivity sensors placed in the soil, as depicted in Figure 2. Valve on/off durations transform the water flow in the tubes that supply water to the soil from within of the central tower. In the plant area of the encapsulated design, the humidity control loop consists of a humidity sensor, an ultrasonic humidifier, and a corresponding fan that distributes the created mist to the leaves. The set-point of 10–100% humidity is achieved by a PI controller for fan speed.
3.1.5. Nutrients
The amount of required nutrient chemicals for plant growth has a significantly slower dynamic than other systems, with a measurable difference occurring after a few months with a real-time embedded pH sensor grade. Therefore, the soil is preconditioned prior to conducting the experiments in a laboratory environment using highly accurate pH level sensors. Each zone of the device implies two soil samples, i.e., eight per device.
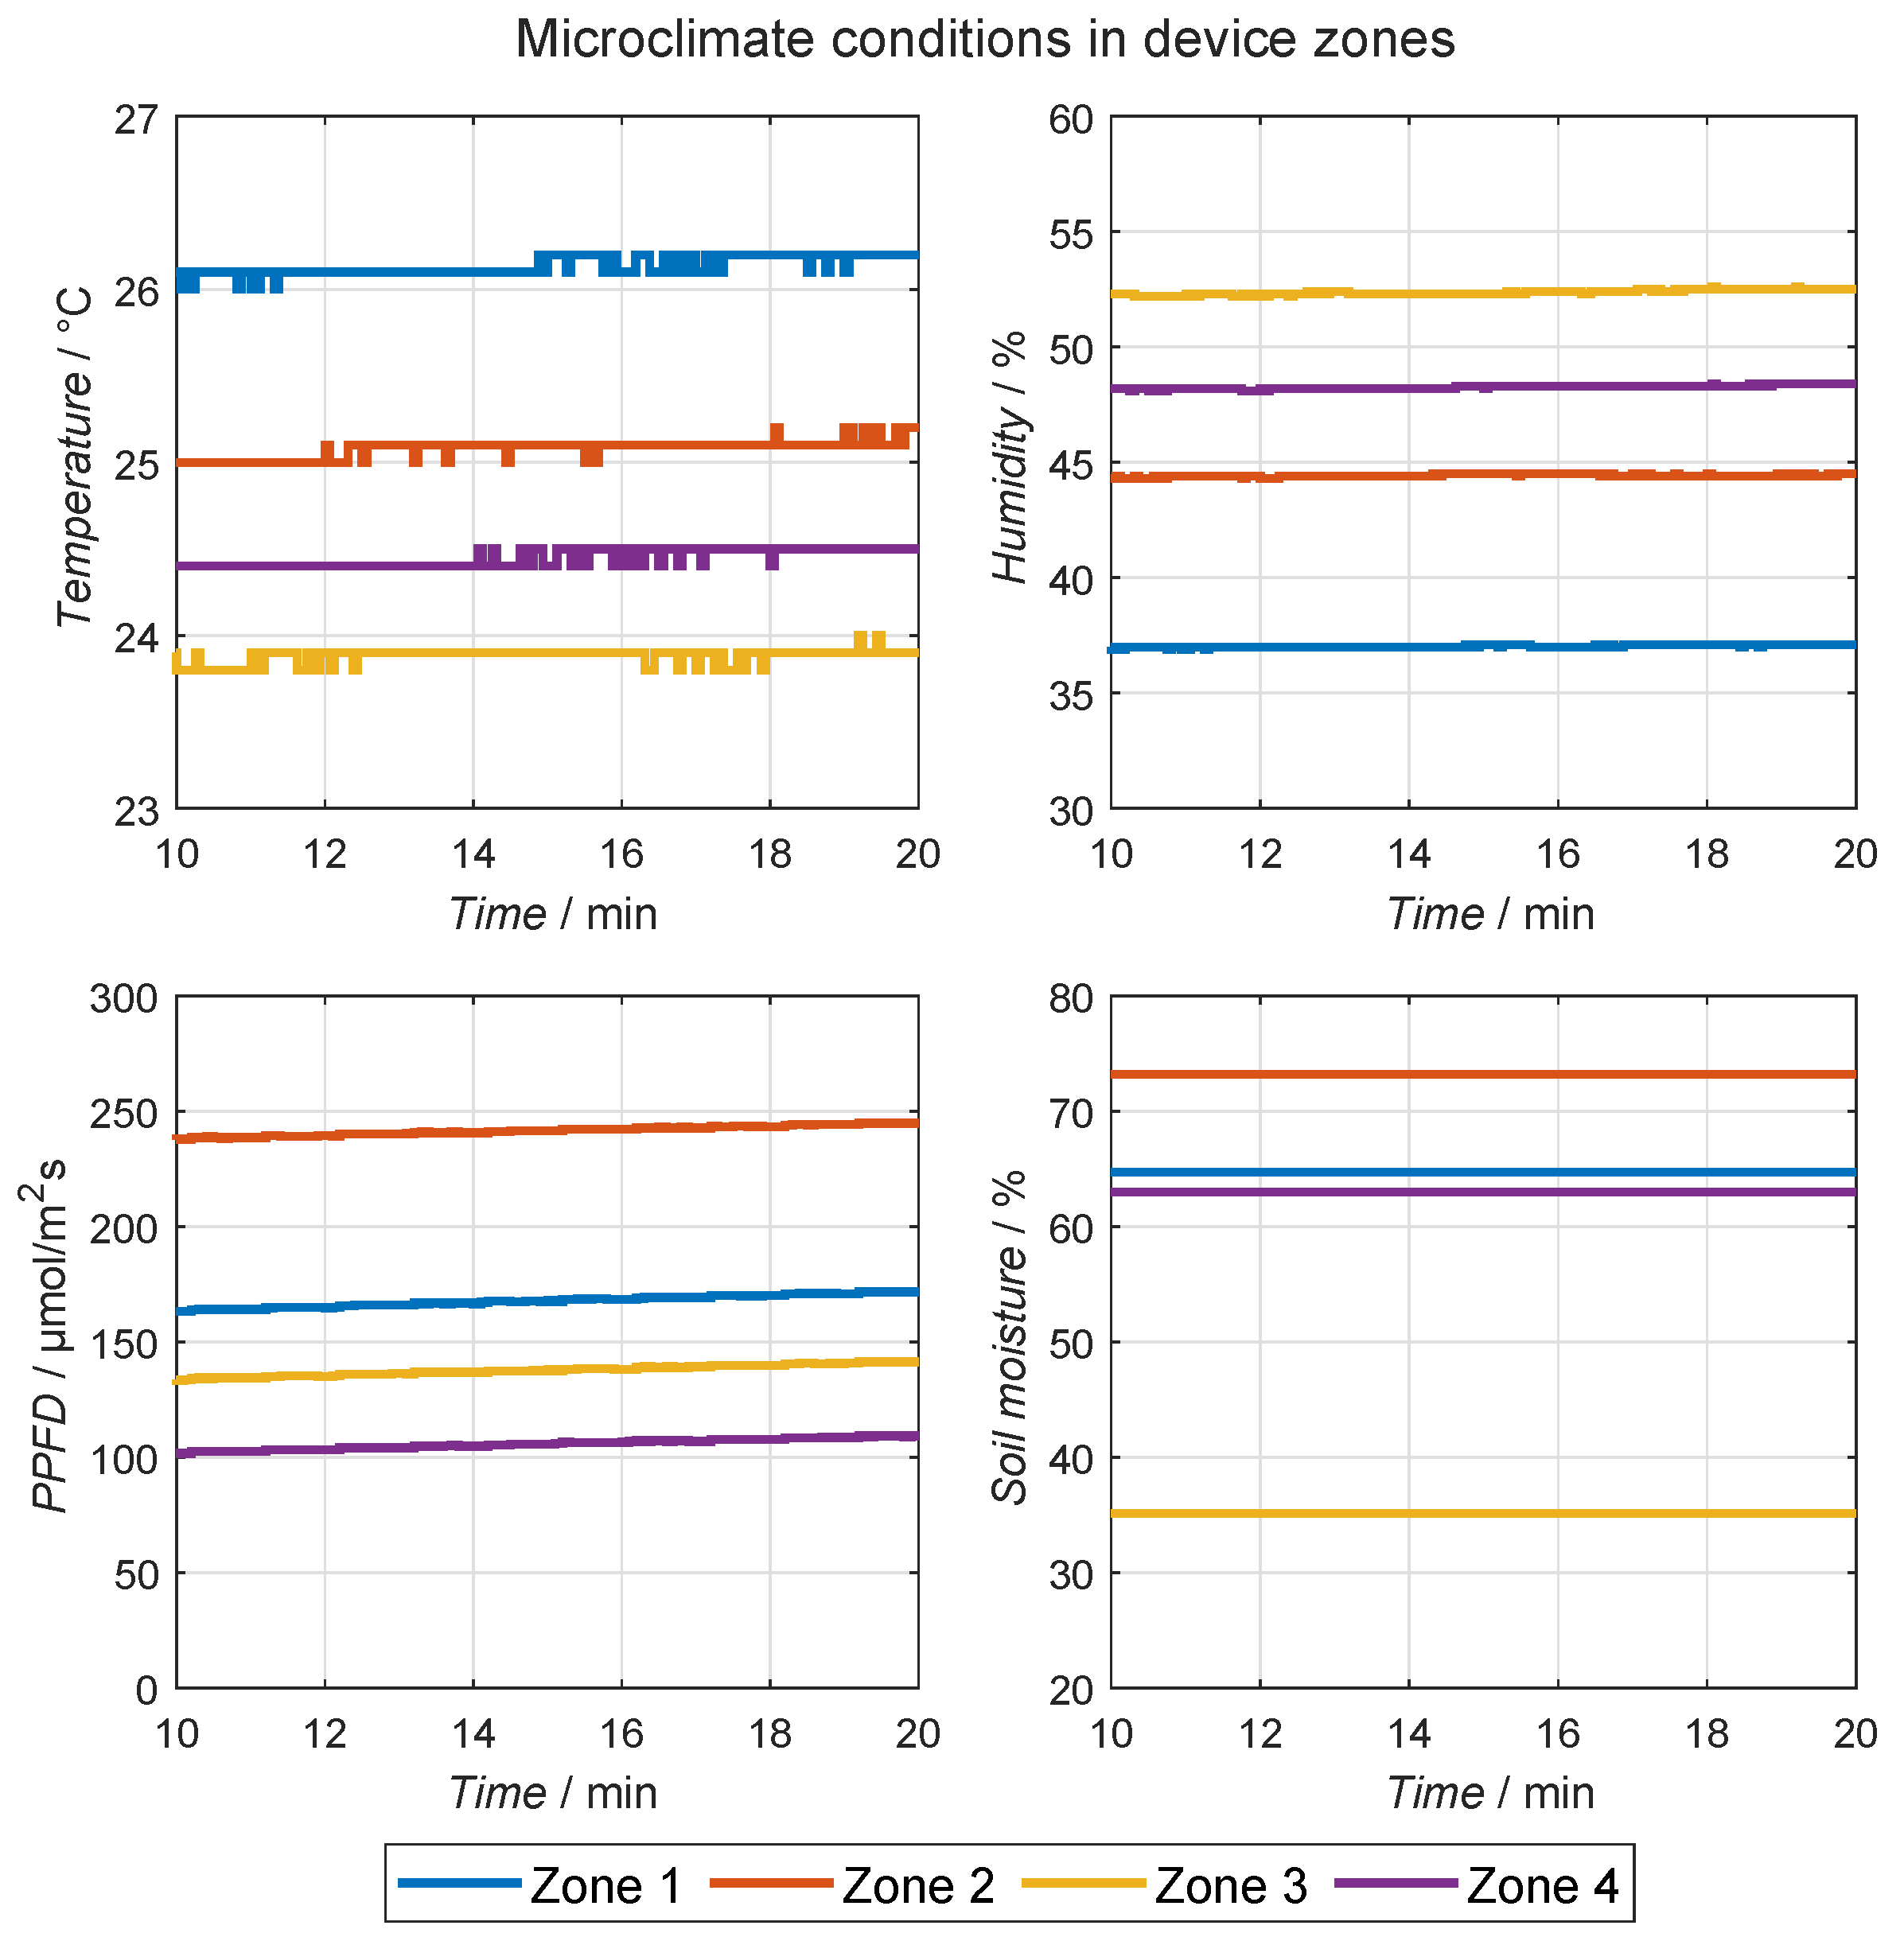
The exemplary established microclimates in the four zones of the device are shown in Figure 4 as time-responses of temperature, humidity, light intensity, and soil moisture during a chosen period of 30 min. Although the zones are not separated into compartments by barriers, the figure clearly shows the microclimate differentiation possibility achieved by the above-mentioned controllers. The zones are not completely independent, but even a slight differentiation is required to simultaneously cover various permutation scenarios throughout the year, e.g., with a temperature span of [4, 40] C with a 0.5 C resolution. Similarly, such differentiation is imposed on lighting, humidity, and soil moisture, where soil is watered independently in each zone while the rest of the conditions are coupled. Additional independence of the zones may be achieved by introducing vertical bulkheads if required.
3.2. Measured Identifiers
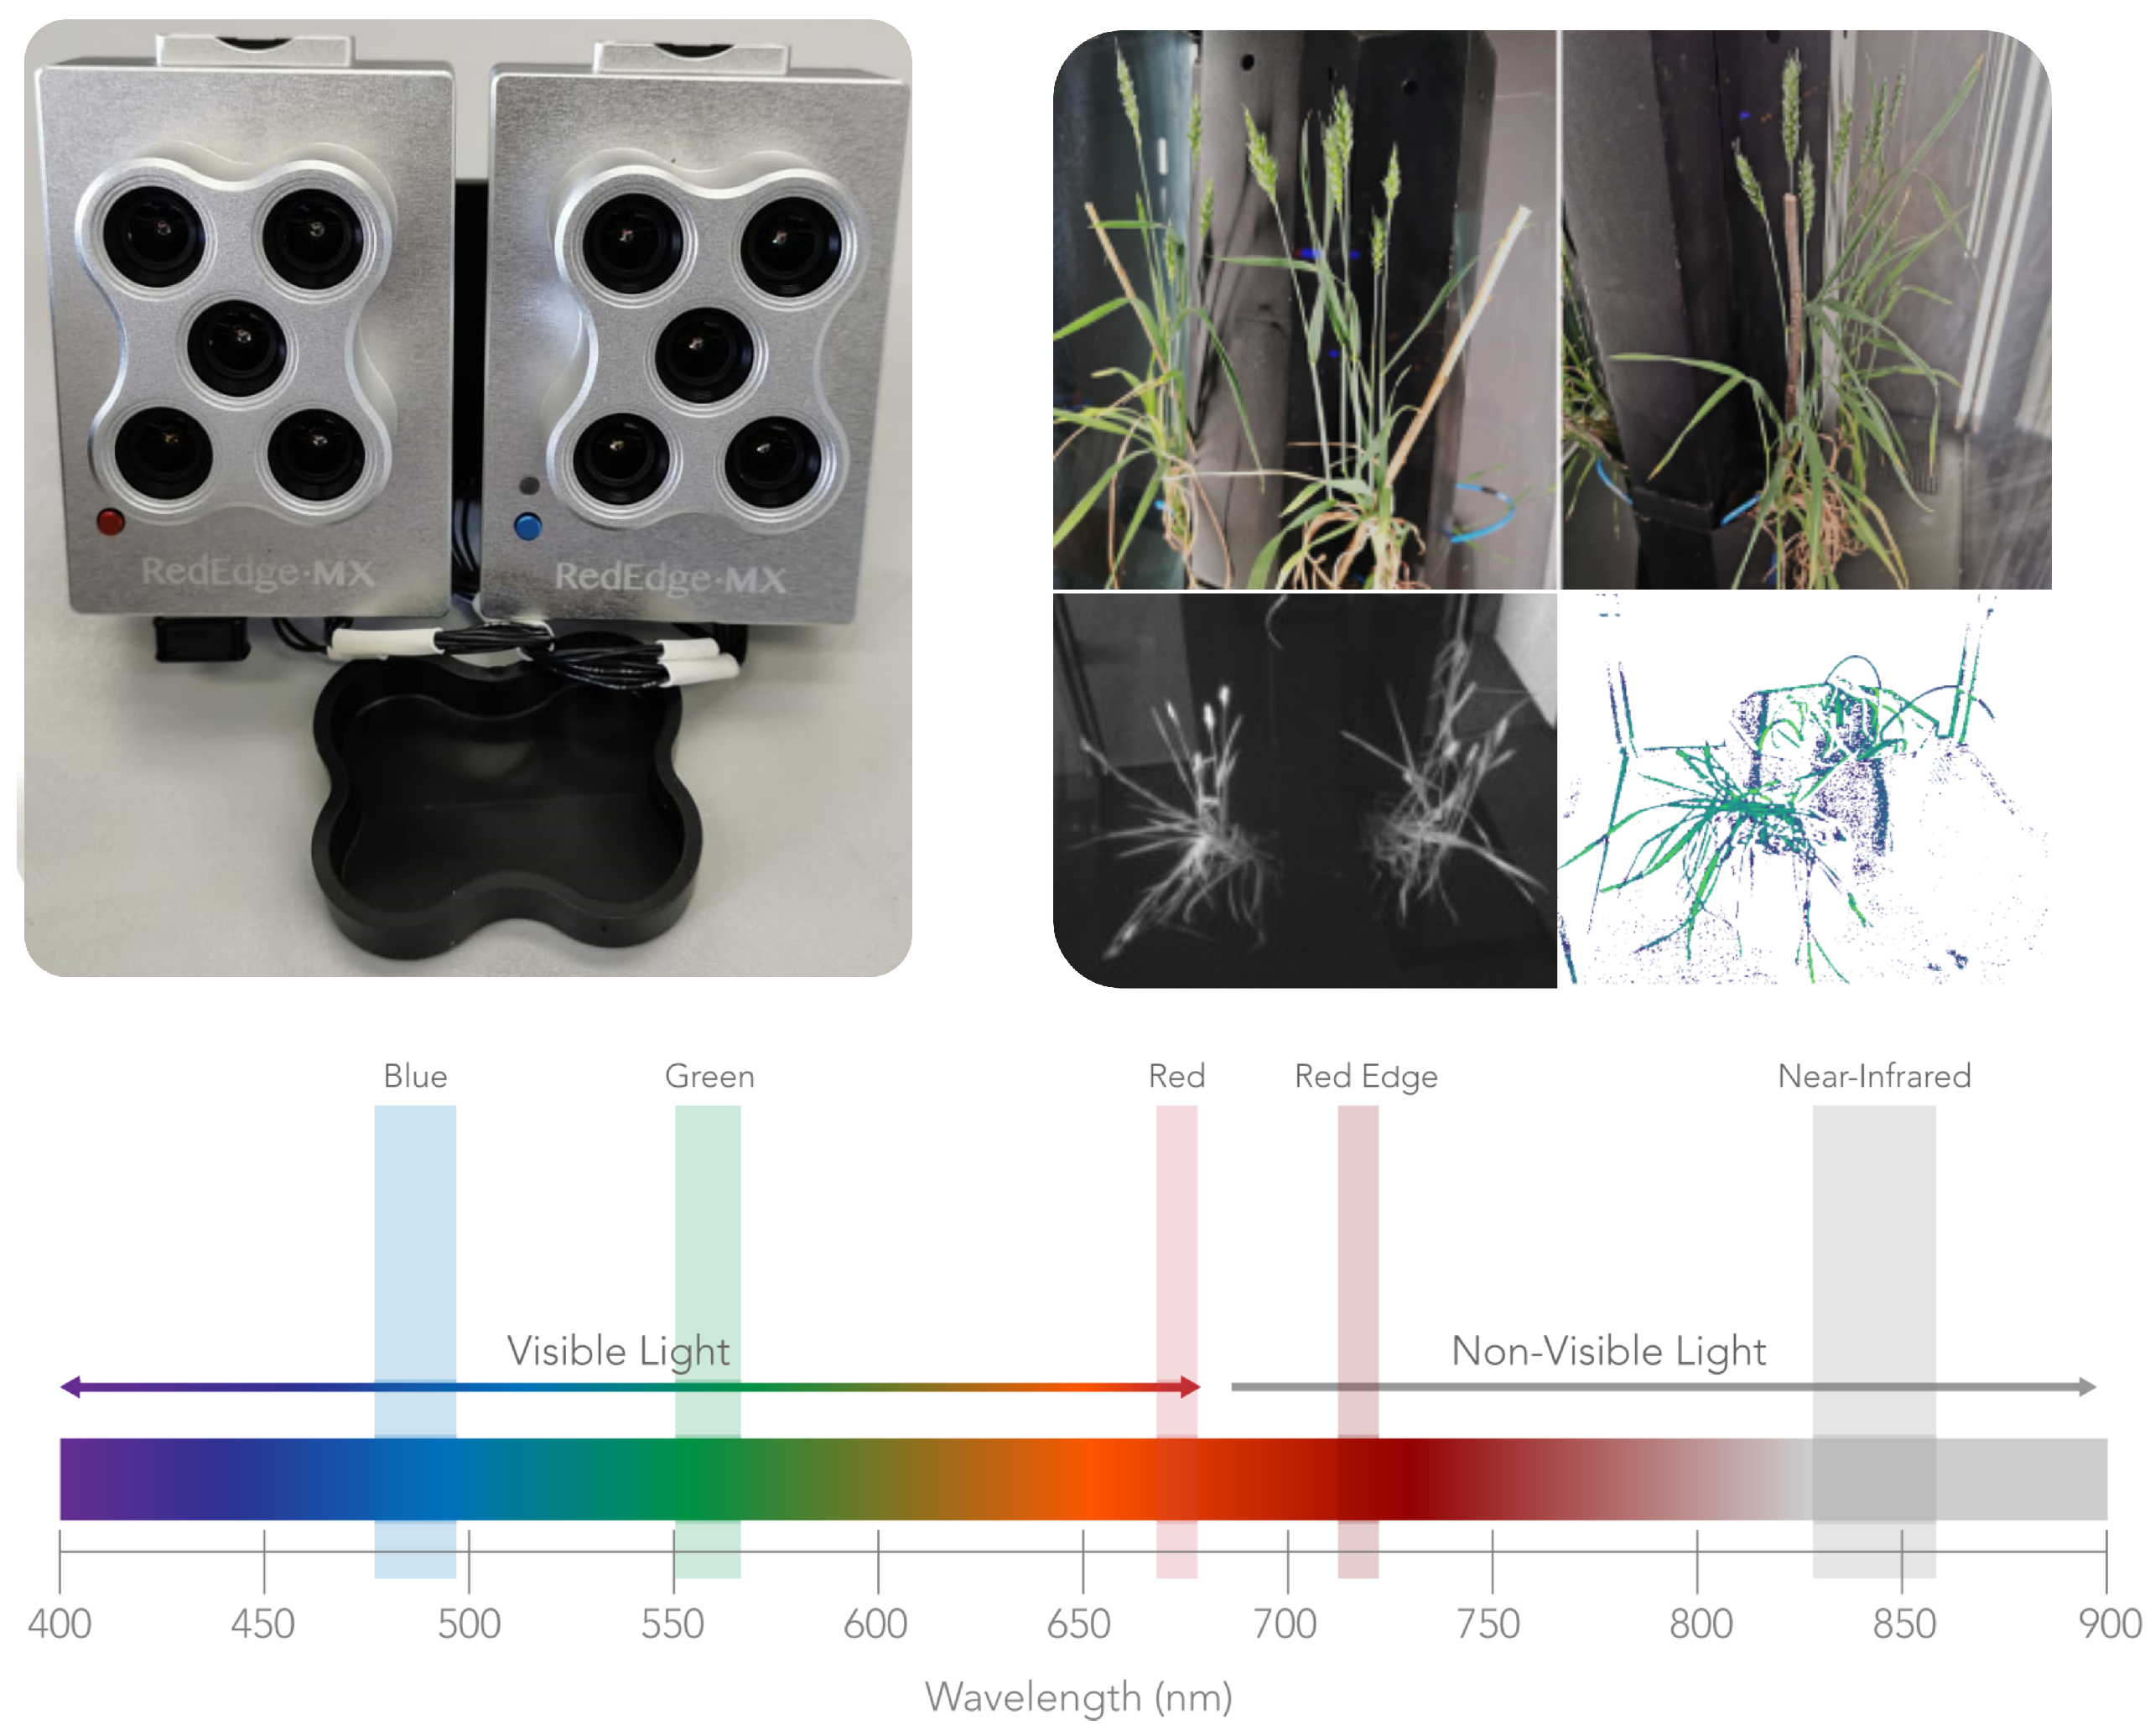
Physiological identifiers such as stomatal transpiration, photosynthetic effect, night respiration, intercellular carbon dioxide concentration, evaporation, etc., are associated indirectly with physical and more accessible measurable vegetation indices, which rely mostly on multi-spectral cameras as sensors. This is necessary to enable a large number of measurements, as accurate plant status identifiers from the domain of molecular biology are both timely and costly and possibly contain a correlation delay with respect to other input–output data. In order to capture both the spectral bands required for basic vegetation indices, as well as additional bands to power further analytics, a RedEdge-MX multi-spectral sensor [22] was chosen (see Figure 5).
Plant physiology is observed in various growth stages: BBCH classification, stem segment length, and leaf area. The vegetation indices are measured with a high resolution stereo camera in correlation with the central tower rotation angles. Details about camera image analysis in such applications can be found in [23]. For wheat culture in particular, emphasis is placed on the tillering phase (BBCH 20–30), as the stalk and future kernels already form in this stage, which is depicted as a stress-sensitive period. Therefore, the microclimate conditions’ permutations are imposed here with an enhanced resolution. A multi-spectral camera was used to detect the water content of the plants with near-infrared bands (possible diseases were shown by a red-edged band and photosynthesis level by a green band), which were pre-calibrated with a CO sensor (measuring the CO assimilation).
A list of all the calculated plant development indicators is provided in Table 2 along with the expected range of each indicator.
The choice of the vegetation indices listed in Table 2 is a result of the interdisciplinary collaboration between the modeling, robotics, and agriculture experts, made after meetings and field visits with experts from the wheat cultivation domain and an extensive literature overview [24,25,26]. This constitutes ongoing research, and additional correlations and corresponding identifiers are expected to be confirmed during the data processing stage following the collection of the dataset.
4. Software Architecture
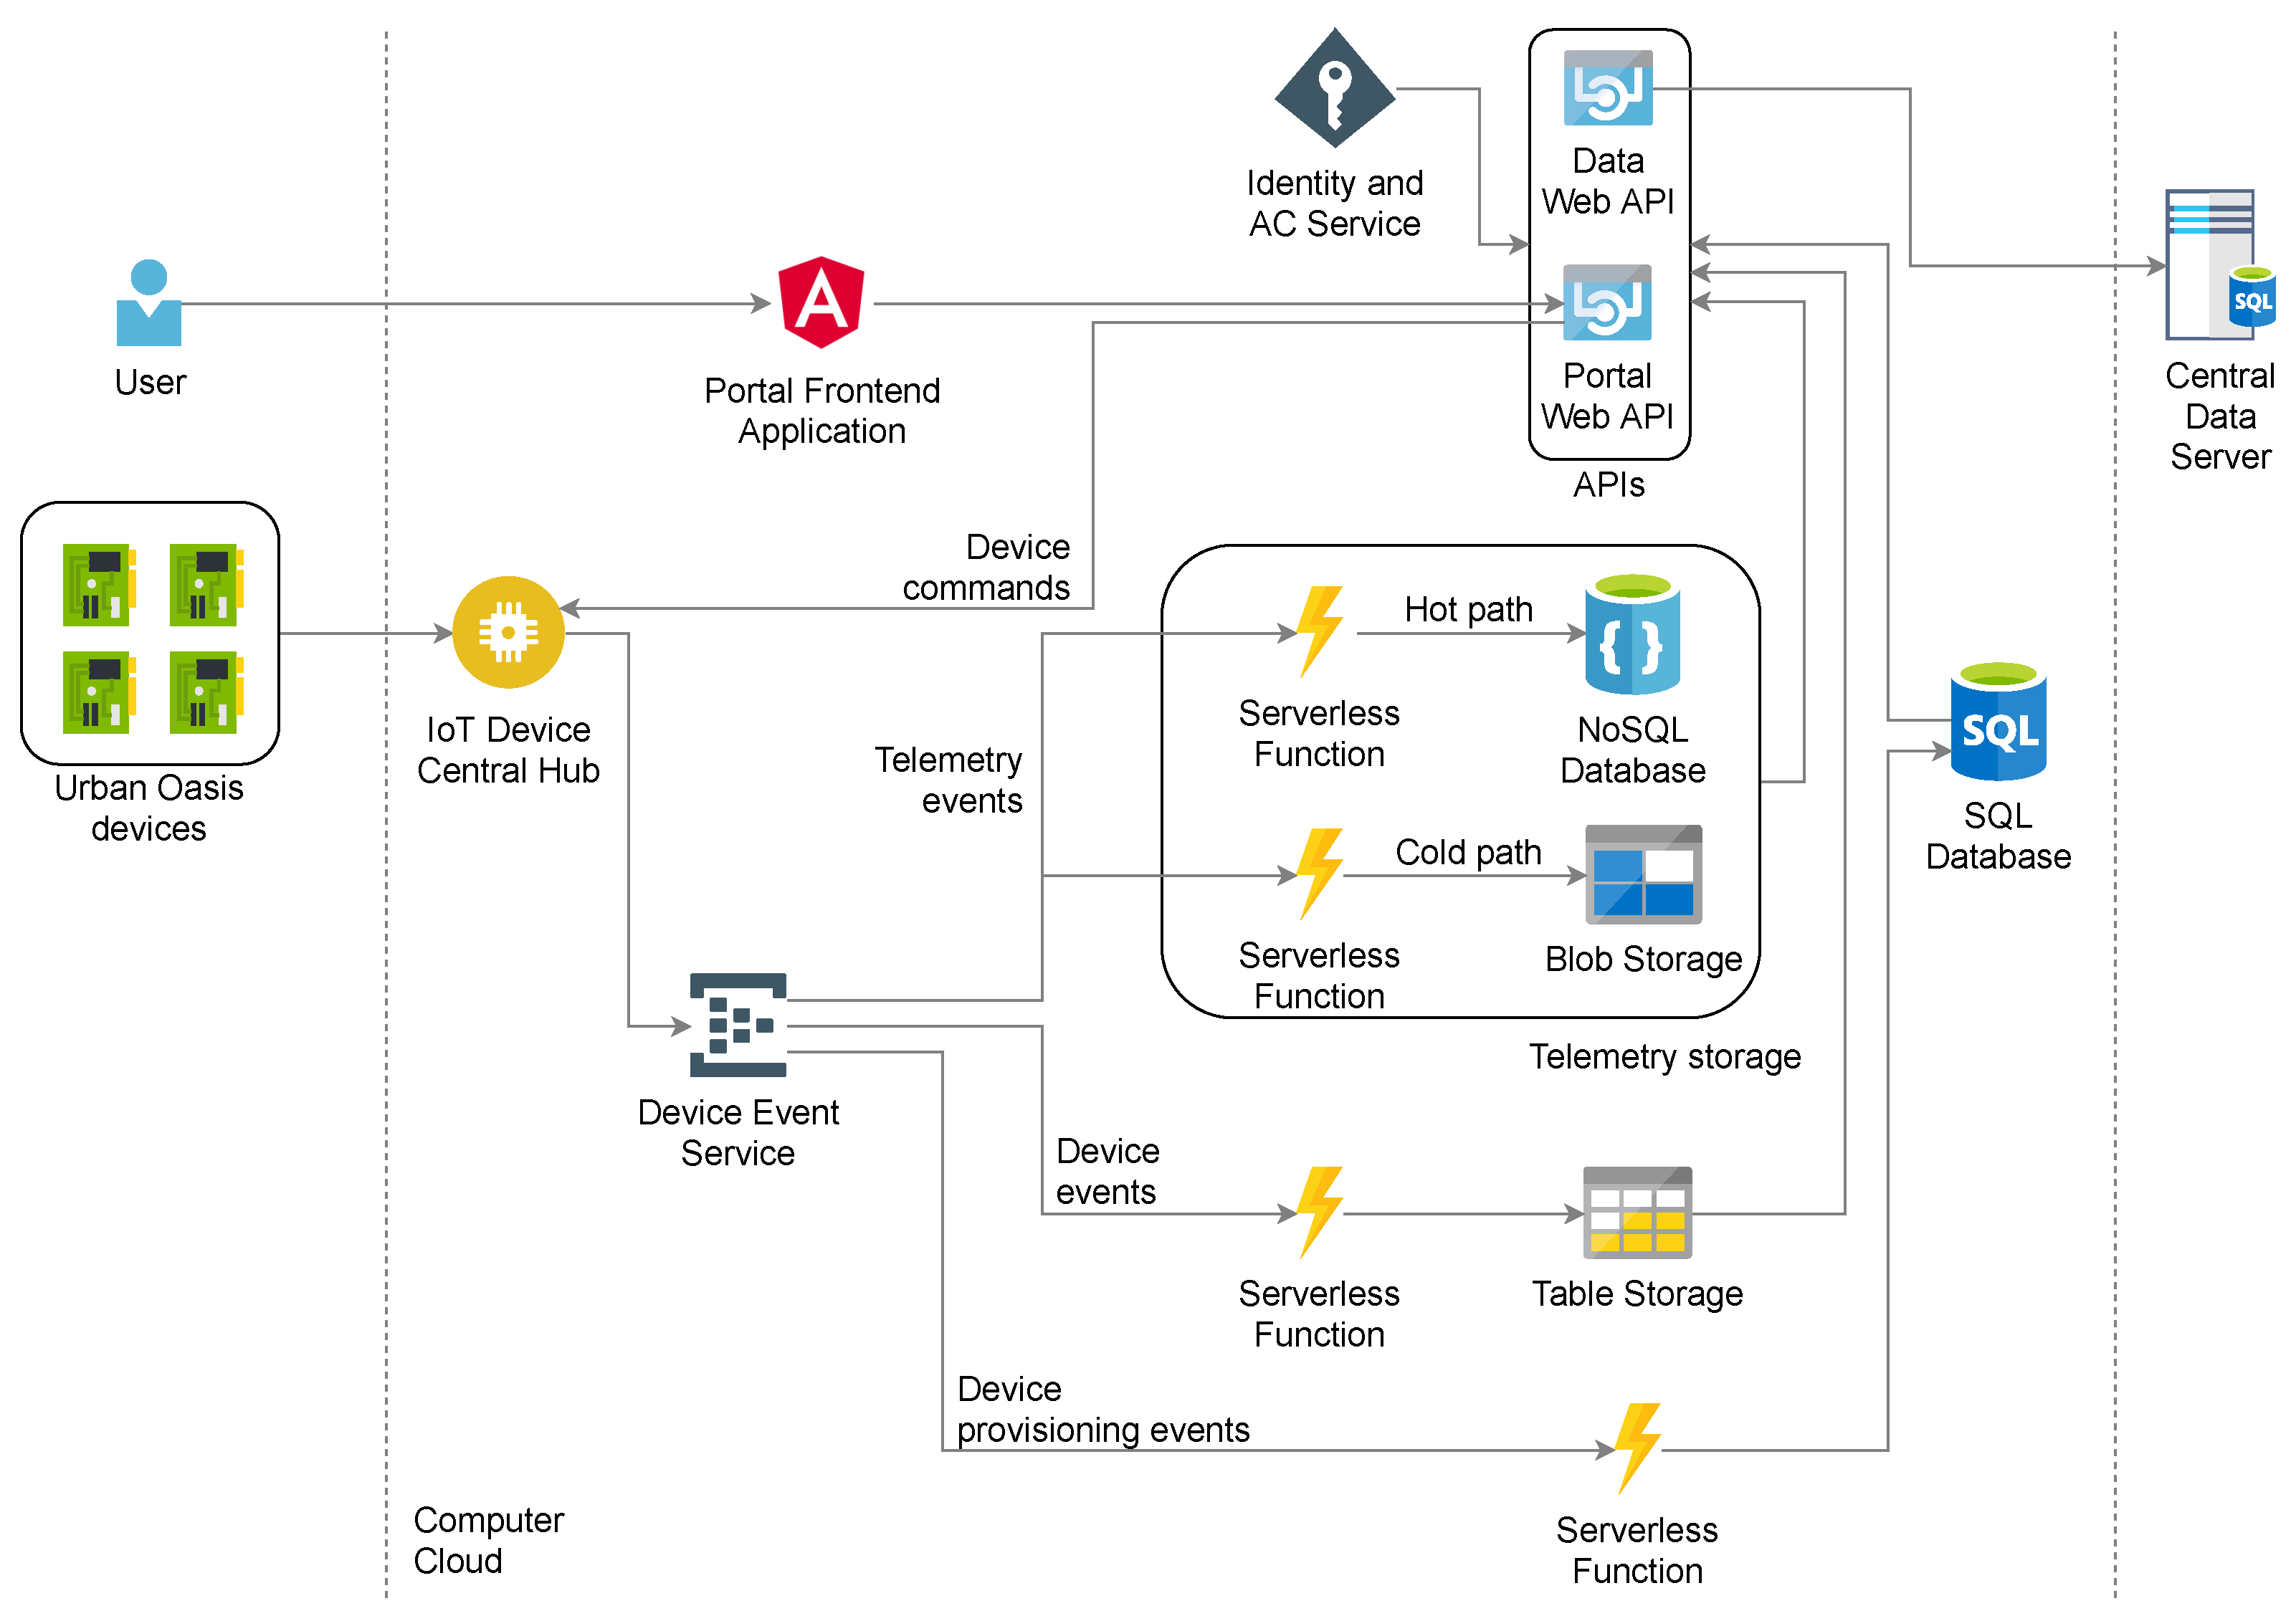
The architecture of the chamber’s software support implies that the established (i) central data server and (ii) computer cloud solution are directly connected with (iii) the sensors and actuators of the devices utilized for conducting the experiments. The sensors’ data is collected every 15 min and stored in the cloud computer, from where it is fetched once per day and then stored in the central server database and made available for advanced analysis. Figure 6 shows the complete IT system architecture with local controllers in the encapsulated design devices, computer cloud architecture, and the central data server.
4.1. Device Software Layer
The device is both physically and logically divided into multiple subsystems: a control and regulation subsystem, a network subsystem, and various sensors subsystems. Each subsystem is monitored and controlled by an individual embedded controller. The embedded controller in the control and regulation subsystem is a real-time controller with the purpose of ensuring the desired environmental conditions within the devices, i.e., wired connectivity with the sensors and actuators and real-time execution of the control loops. The sensor subsystems consist of various sensors connected by multiple controllers, which ensure proper sensor functionality and communication with the embedded controller of the control and regulation subsystem. The communication between the embedded controllers is established through an I2C communication protocol following the standard I2C master–slave communication pattern adapted for sensors in use. The design of the device’s software, along with the actuator and sensor control, implies the established communication with the computer cloud, via which telemetry data and status reports are sent. This is the main functionality of the network subsystem that ensures the bidirectional communication with the designated cloud services. The controllers involved in the network, control, and regulation subsystems communicate over a UART serial protocol, sending custom messages (requests and responses) mutually.
4.2. Computer Cloud Layer
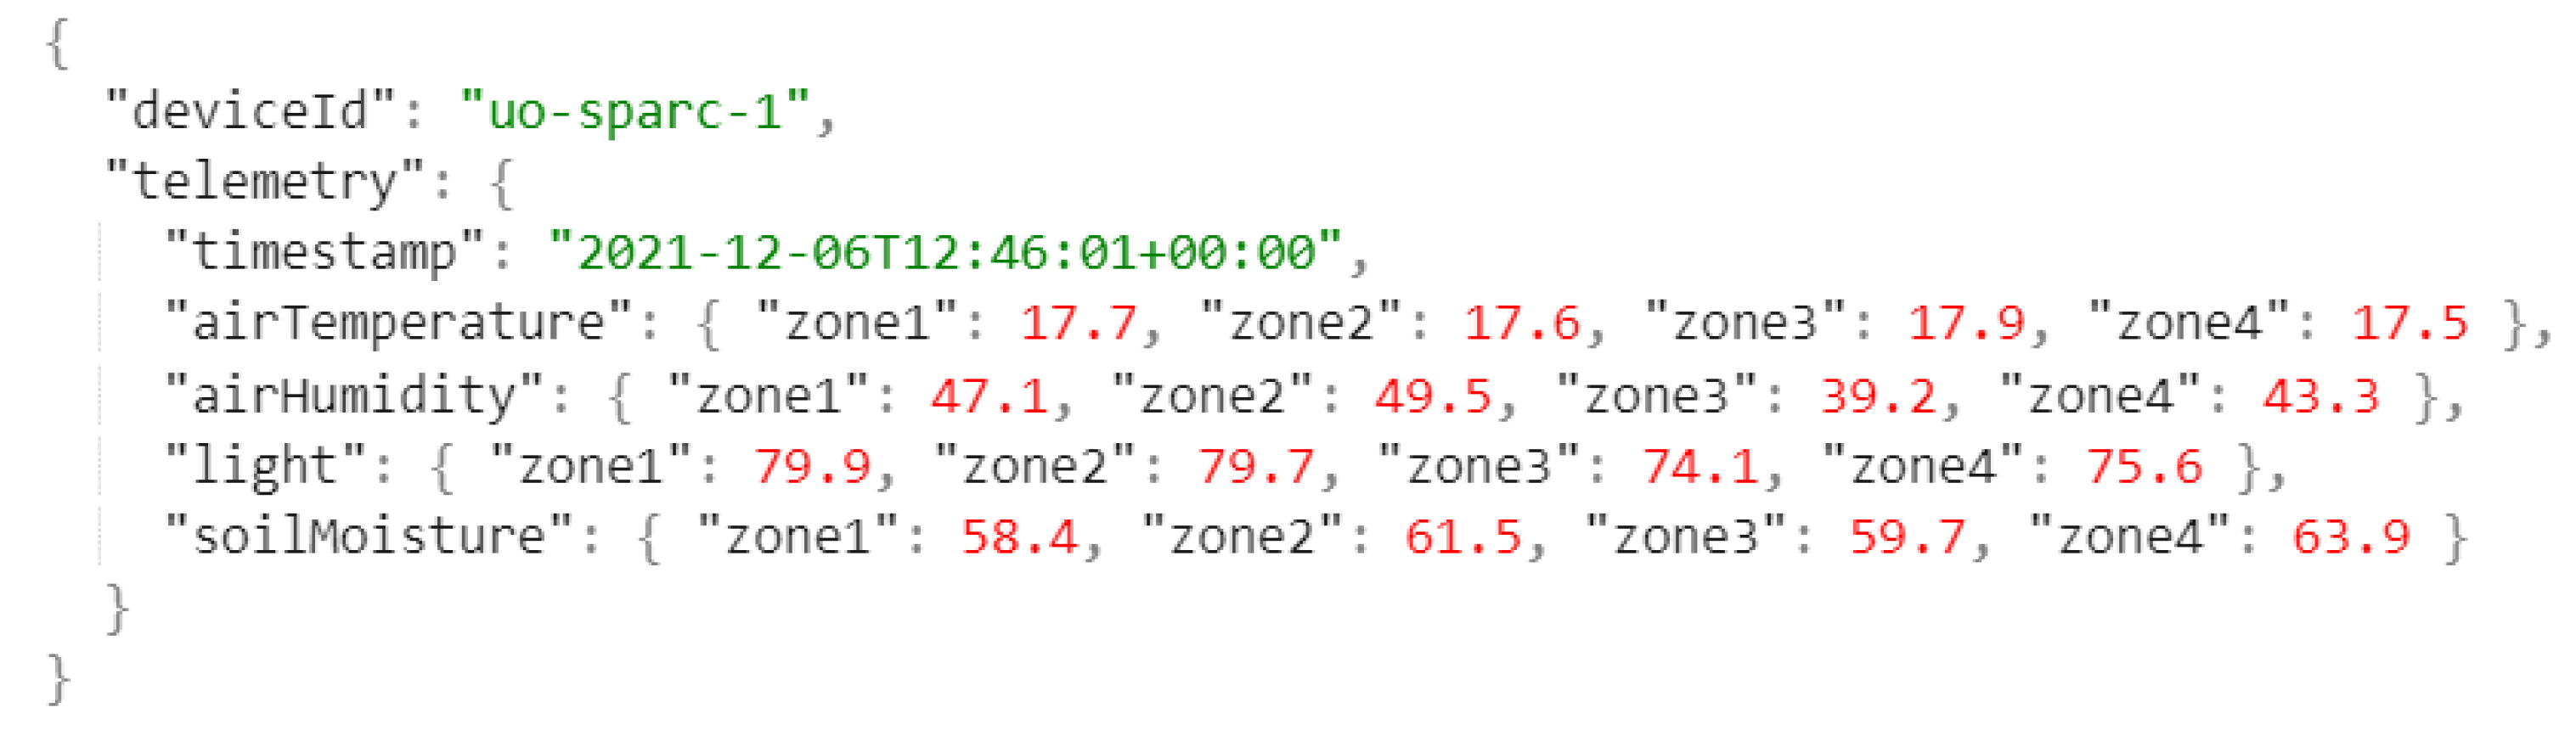
The computer cloud is designed to serve three main functions: (i) telemetry ingestion and analysis, (ii) device maintenance and control, and (iii) presentation of aggregated data and analysis results. The computer cloud was implanted using Microsoft’s Azure cloud platform. Individual devices are connected to the cloud services through a central-node IoT device central hub (from Figure 6). In order to implement the aforementioned cloud functionalities, bidirectional communication was established between the IoT device central hub and the devices, enabling both C2D (Cloud to Device) and D2C (Device to Cloud) messages. MQTT protocol was utilized for cloud–device communication, because of its lightweight design and support for bidirectional communication. The devices aggregate their sensor data into a JSON format and send them as a part of an MQTT message payload. Figure 7 shows the device telemetry of JSON data from a single device sensor readout.
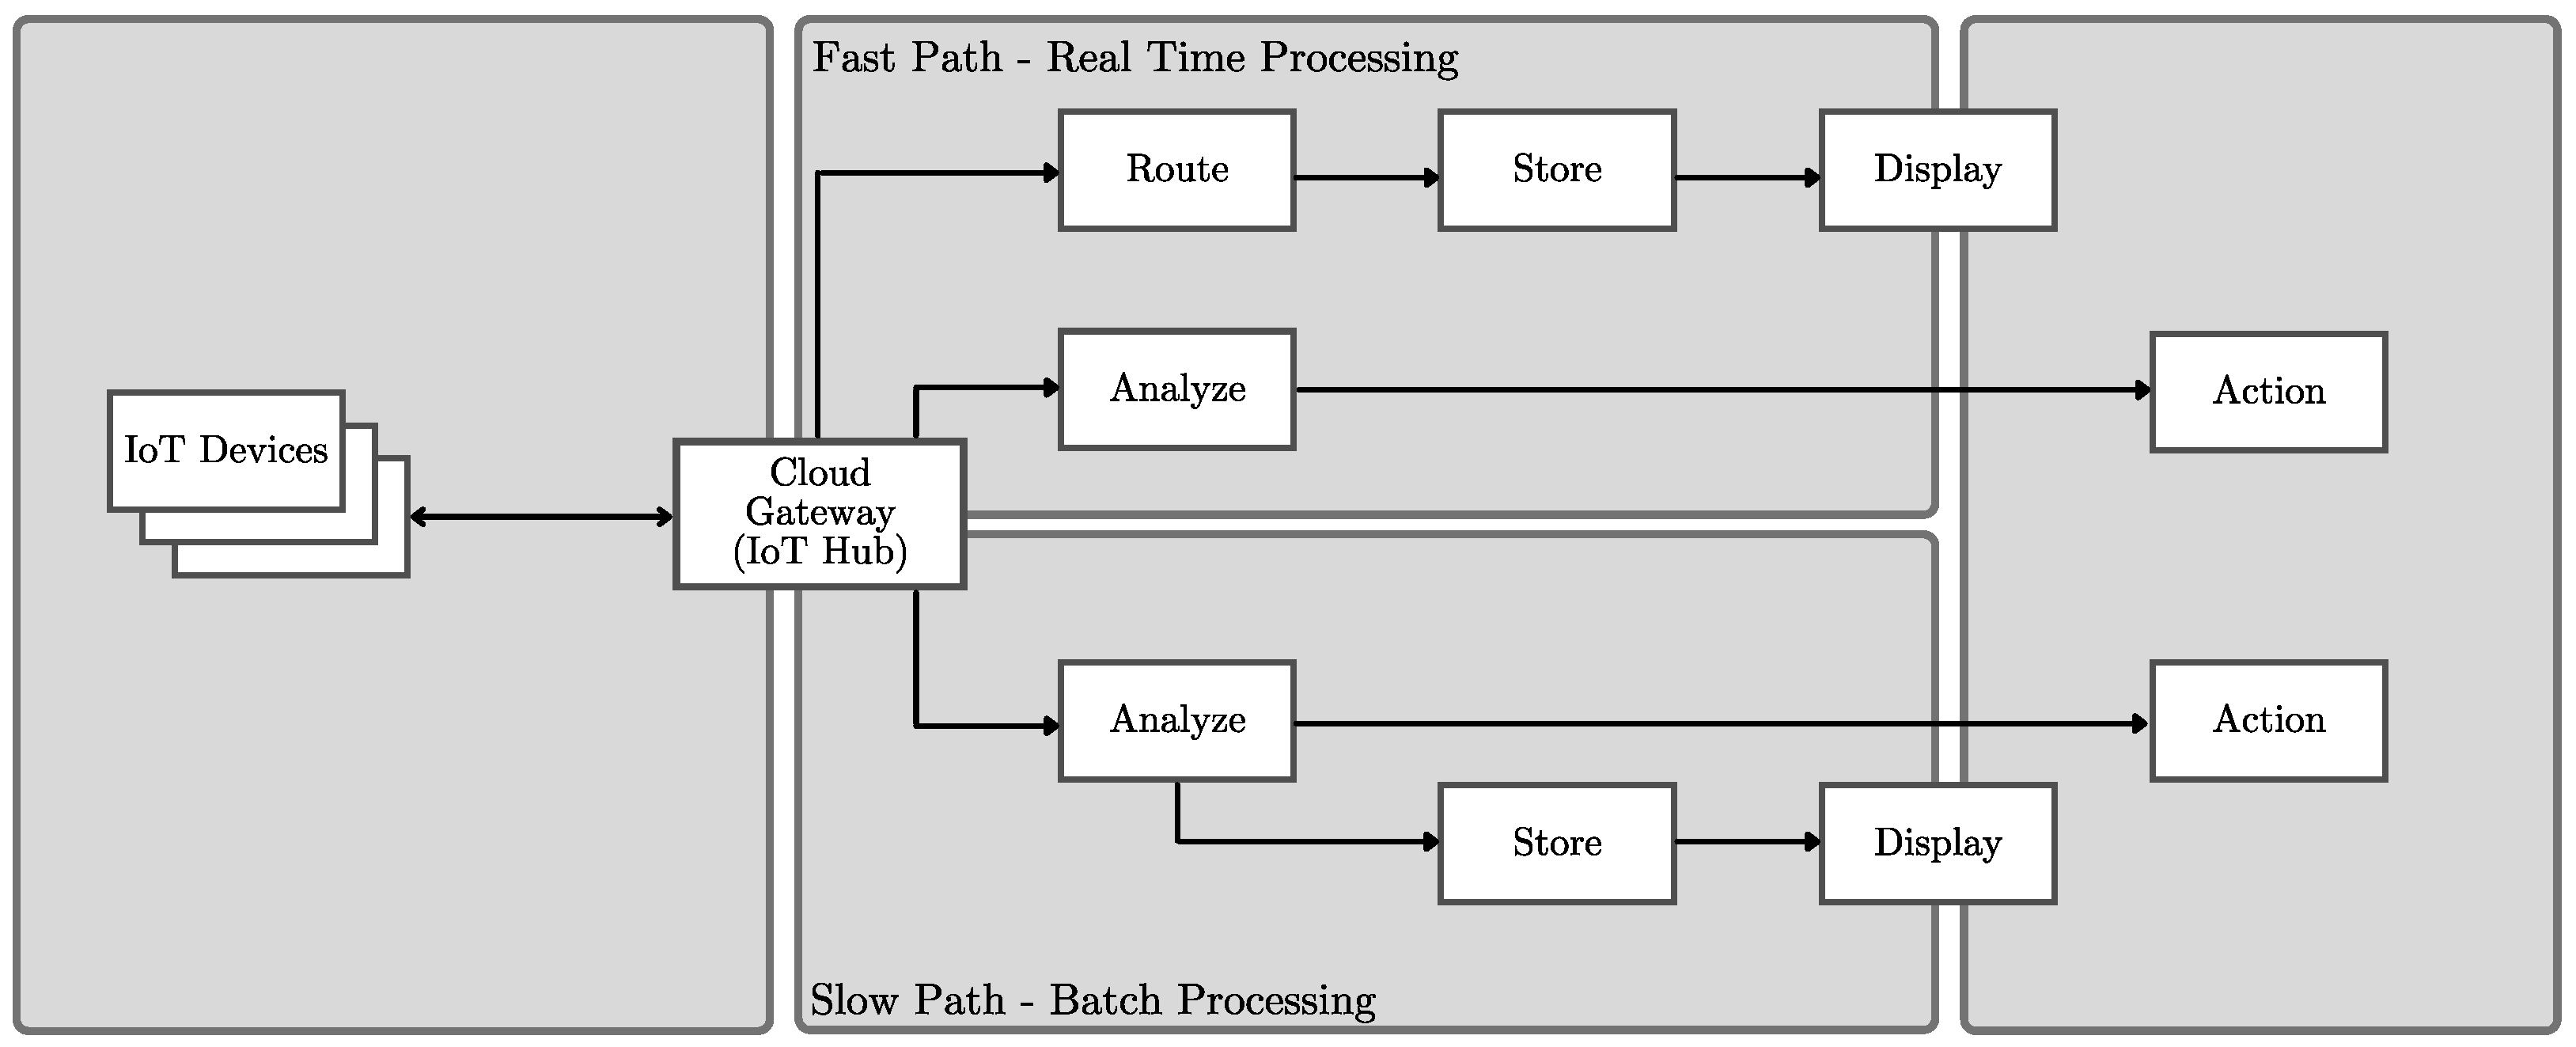
The IoT device central hub aggregates telemetry messages and, through the Device Event Service, publishes them as events. Telemetry events are then routed to subscribed storage services. The cloud data flow was designed following the principles of Lambda architecture, as shown in Figure 8.
For storing raw telemetry, hot and cold data storage paths are utilized to ensure the real-time operability of the system when large amounts of data are consumed. For hot-path storage, the NoSQL database in document form is used and configured to hold the latest device data. In such a form, telemetry data is accessed and analyzed in real-time and device regulation corrections are performed accordingly. Blob storage is used for cold-path processing, and it stores raw telemetry data, which is used later on in more complex, time-consuming analysis. The data is expected to be collected at 15-min intervals. Device maintenance and control is accomplished by combining the local logic of device-embedded controllers with computer cloud services for device event handling. Devices, along with telemetry data, periodically send status messages, which are aggregated, and device events are analyzed and logged. The computer cloud is designed to ingest and analyze the events, thus enabling real-time monitoring. With device event analysis, the system implements logic for automated device control. Moreover, to automate the registration process for new devices, device provisioning events are published and processed. Finally, the cloud supports interfaces for controlling the devices and conducted experiments over HTTPS protocol. This is accomplished through Data Web API, for daemon applications (such as the application running on the central data server), and Portal Web API, for user front-end web application. Cloud computers also offer a possibility for advanced data processing algorithms, using standard AI methods, should they be required, in addition to the developed application-tailored AI algorithms on the central data server.
4.3. Central Data Server
The central data server is a local server that collects the telemetry data and status reports from multiple encapsulated design devices, archives the data, and conducts advanced data processing, such as experiment scheduling or executing tailored AI algorithms.
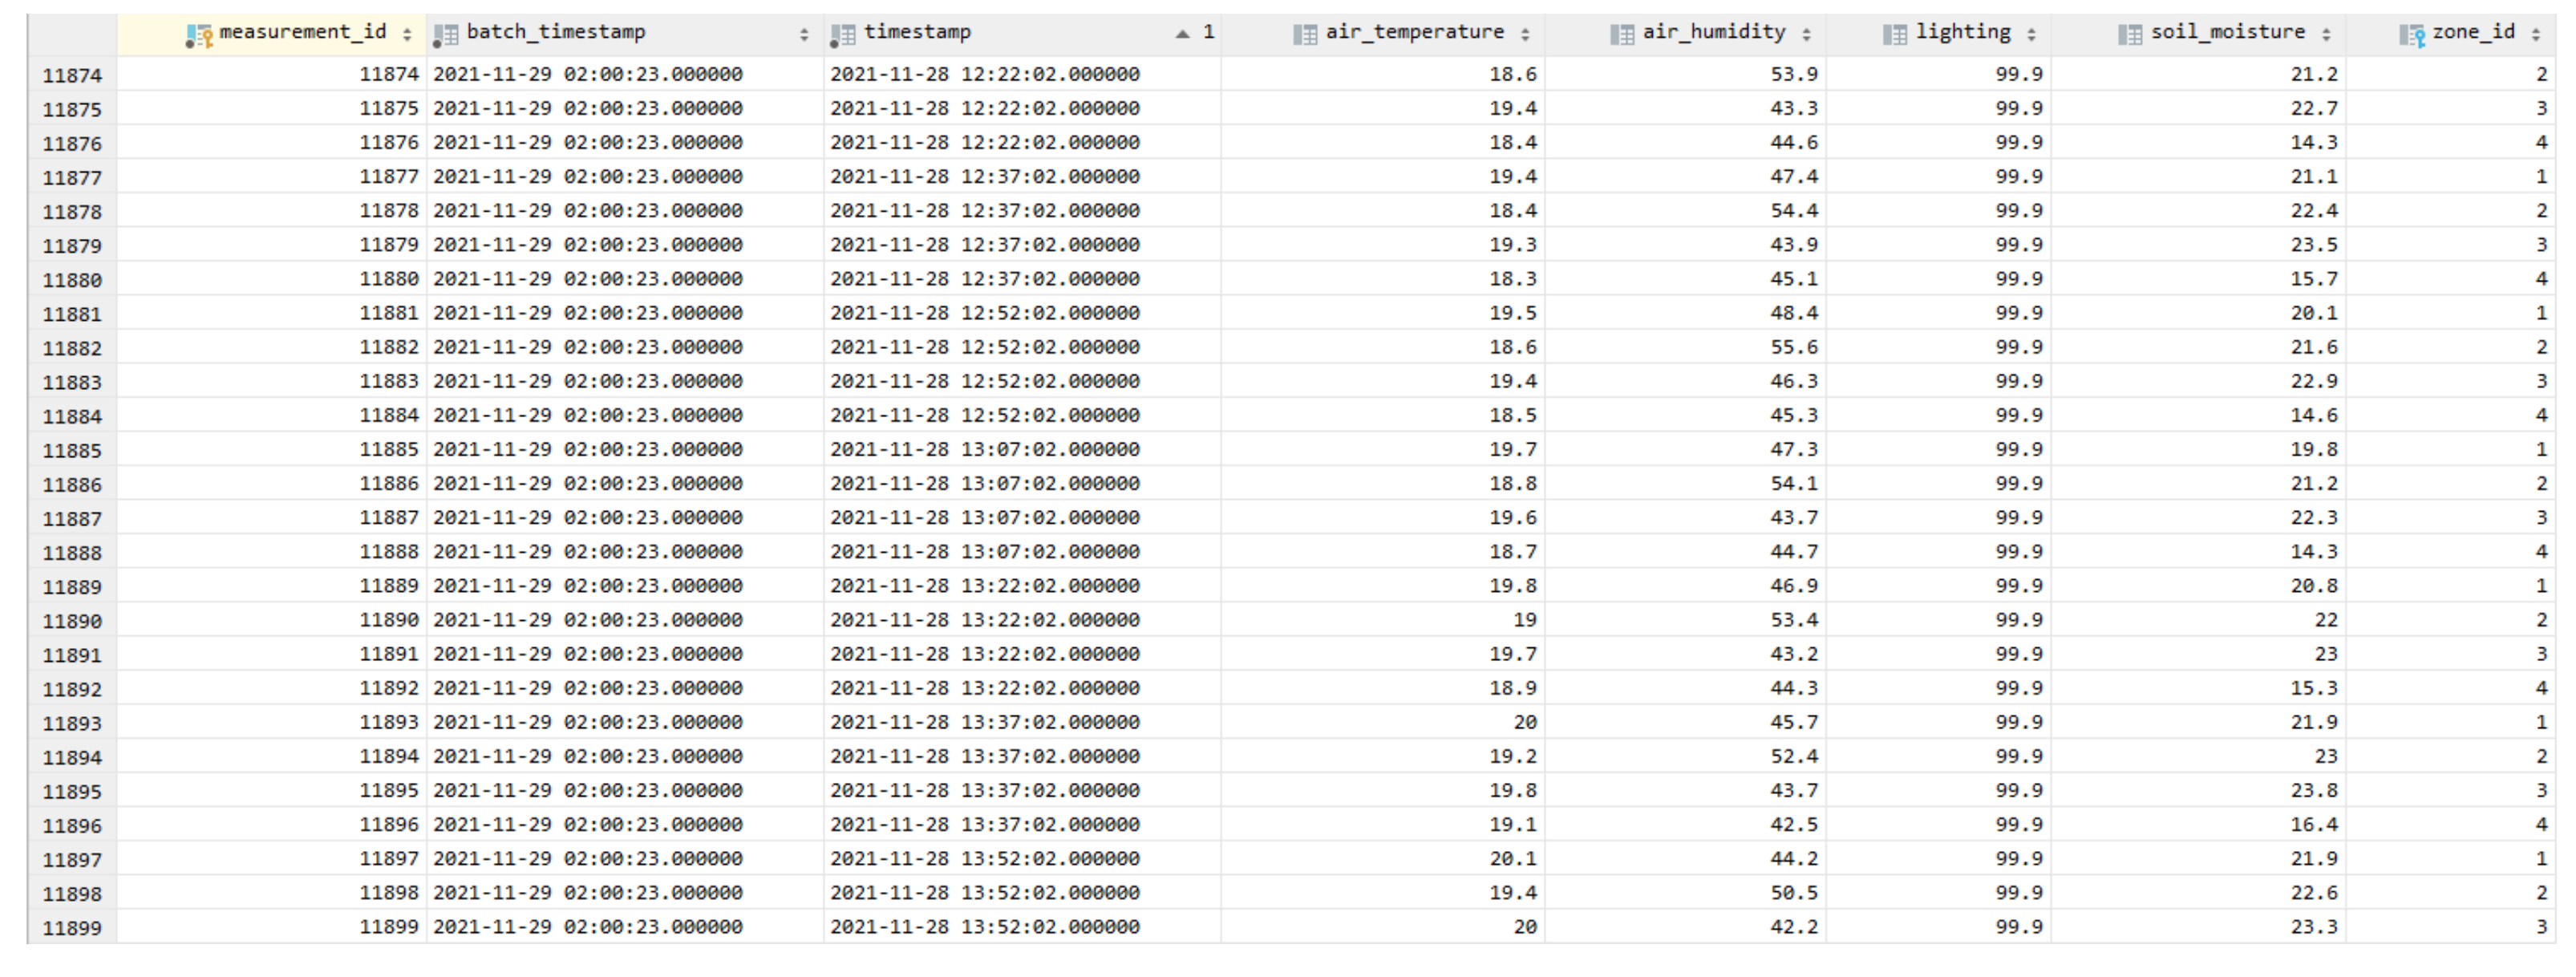
After the initial data collection and pre-processing, the processed data is stored in a cloud-based NoSQL database where it is made available to third parties through a web API. The data is retrieved through the developed web API from the cloud service with a daily frequency and stored in the PostgreSQL database on the central data server. The server integrates the data from all the growing chambers and makes it available for advanced processing, i.e., modeling through the use of ML approaches. A set of obtained and stored measurements from one device amounts to 140 kilobytes of data per day. An exemplary snippet of such data is presented in Figure 9. If this logic is further extended to the planned two years of experiments with four separate chambers, the overall amount of collected data would be 140 × 365 × 2 × 4 = 408,800 kB, or ~408 MB. The raw measurements are accompanied with meta data containing information about devices, zones, and plants; however, since this is mostly static data, their memory allocation is negligible with respect to the collected measurements.
Among the data collected from the chambers via the cloud service, multi-spectral camera images are obtained from the multi-spectral cameras once per day and are also stored on the central server computer. Through the processing of the obtained images, the vegetation indices presented in Table 2 are calculated and stored, thus rounding up the available data from the plant development side. Indices calculated from camera images amount to 1.5 kB per day, which amounts to a total of 1.5 × 365 × 2 × 4 = 4380 kB, or ~4 MB. The accompanying raw images are stored among the calculated indices, with average size of 2.3 MB. With three separate images stored (three light specters) for each of the eight plants within a single chamber, the overall amount of stored data is estimated to amount to 2.3 × 3 × 8 × 365 × 2 × 4 = 161,184 MB, or ~180 GB.
The fetching of the chamber climate measurements to the cloud is performed in a range of milliseconds, while its daily collection through the web API and storage to the central server database takes an average of 3 s.
The capturing of multi-spectral images is performed in under 2 min, while their storage is performed in a range of milliseconds. A prolonged time of 2 min is necessary in order to rotate both the camera as well as the individual chamber towers such that separate images of each individual chamber zone/plant can be obtained. This is due to the significantly higher camera price than the device price, hence fewer cameras then devices are used in the process.
The main reasoning behind the separation of device telemetry data cloud storage and central server storage is to facilitate the flexibility for the inclusion of more devices without the burden of the heavy numerical requirements generated by the data analysis algorithms, e.g., tuning of ML models. Additionally, ML algorithms as well as most other data analytic approaches, almost always require the entire historical dataset to be available, thus generating heavy database loads when they are fetched. By keeping the various data storage spaces separate, the cloud database queries are limited to one-day datasets such that the processing power of the cloud storage is preserved for serving clients and collecting the devices’ telemetry data. Additionally, the computer cloud serves as a sophisticated data archive, providing backup of experimental data that has been accumulated over the years.
Through the described IT system, the overall architecture has the ability to support a large number of encapsulated design devices and corresponding embedded controllers to ensure the scalability in an IoT concept for simple replication and scaling up of the number of experiments. In particular, we used four encapsulated design devices in our applications, which may be further extended.
To summarize, the following software and platforms were used:
- Linux-based embedded controllers in devices.
- Computer cloud exploiting the Microsoft Azure platform.
- Central server: Linux Ubuntu.
- Central database: PostgreSQL.
- APIs to communicate with the NoSQL database.
- APIs implemented in Python.
- Microclimate control implemented in C (embedded IoT devices).
4.4. System Capability for Rapid Data Collection
The described mechanical, hydrodynamic, electrical, electronic, and software aspects all contribute to enable the rapid collection of autonomous microclimate scheduling and correlated data acquisition, processing, and archiving. With multiple zones per device and multiple devices, the system is flexible and scalable with the support of software architecture.
Overall, the system supports 8–12 groups of five plants each to be grown and monitored to achieve recurrence and trustworthiness of the results. Each group is a representative sample of a field under the specific climate scenario and history. Unlike usual microbiological laboratory experimental observations, as, e.g., in [21], the approach here does not require sample collection (i.e., it is non-invasive), as the plants are kept intact. By using four devices, with a possibility of two harvests per year, the data is collected from emulations of 72–96 fields. Conservatively speaking, with a single harvest and half the number of plant groups, where two groups were used with the same conditions for higher recurrence and trustworthiness of the results, 18–24 fields are emulated per year. In practice, not all the samples were created with the aim being to survive and result in a harvest, as extreme weather conditions are also observed, which keeps the multi-harvest yearly option highly possible.
5. Conclusions
The system of encapsulated design devices for the permutation of microclimate conditions and plant development monitoring is elaborated in this paper. The system incorporates the concept of the Internet of Things with real-time controls and interfaces, as well as communication with a computer cloud that enables the autonomous performance of a large number of simultaneous experiments in the microclimate zones of the device. The system is used to rapidly gather large amounts of correlated climate measurements and plant development indices, thus enabling the artificial intelligence modeling of wheat development with respect to expected climate changes, i.e., the predictive agriculture. The data of 6 million correlated entries is scheduled to be collected by 2023 and made publicly available.
Author Contributions
Data curation, M.C. and M.R.; Investigation, M.R.; Methodology, H.N. and V.L.; Software, M.R. and M.C.; Supervision, V.L.; Writing—review & editing, H.N. and V.L. All authors have read and agreed to the published version of the manuscript.
Funding
This work has been co-financed by the European Union through the European Regional Development Fund within the Operational Programme Competitiveness and Cohesion 2014–2020 for Croatia, through the project AgroSPARC (Grant no. KK.05.1.1.02.0031).
Data Availability Statement
Not applicable.
Conflicts of Interest
The authors declare no conflict of interest. The funders had no role in the design of the study; in the collection, analyzes, or interpretation of data; in the writing of the manuscript, or in the decision to publish the results.
References
- Mulla, D.J. Twenty five years of remote sensing in precision agriculture: Key advances and remaining knowledge gaps. Biosyst. Eng. 2013, 114, 358–371. [Google Scholar] [CrossRef]
- Chettri, L.; Bera, R. A Comprehensive Survey on Internet of Things (IoT) Toward 5G Wireless Systems. IEEE Internet Things J. 2020, 7, 16–32. [Google Scholar] [CrossRef]
- Farooq, M.S.; Riaz, S.; Abid, A.; Abid, K.; Naeem, M.A. A Survey on the Role of IoT in Agriculture for the Implementation of Smart Farming. IEEE Access 2019, 7, 156237–156271. [Google Scholar] [CrossRef]
- Elijah, O.; Rahman, T.A.; Orikumhi, I.; Leow, C.Y.; Hindia, M.N. An Overview of Internet of Things (IoT) and Data Analytics in Agriculture: Benefits and Challenges. IEEE Internet Things J. 2018, 5, 3758–3773. [Google Scholar] [CrossRef]
- Jha, K.; Doshi, A.; Patel, P.; Shah, M. A comprehensive review on automation in agriculture using artificial intelligence. Artif. Intell. Agric. 2019, 2, 1–12. [Google Scholar] [CrossRef]
- Roopaei, M.; Rad, P.; Choo, K. Cloud of Things in Smart Agriculture: Intelligent Irrigation Monitoring by Thermal Imaging. IEEE Cloud Comput. 2017, 4, 10–15. [Google Scholar] [CrossRef]
- Zhao, S.; Peng, Y.; Liu, J.; Wu, S. Tomato Leaf Disease Diagnosis Based on Improved Convolution Neural Network by Attention Module. Agriculture 2021, 11, 651. [Google Scholar] [CrossRef]
- Bhatia, A.; Chug, A.; Singh, A.P. Statistical analysis of machine learning techniques for predicting powdery mildew disease in tomato plants. Int. J. Intell. Eng. Inf. 2021, 9, 24–58. [Google Scholar] [CrossRef]
- Liakos, K.G.; Busato, P.; Moshou, D.; Pearson, S.; Bochtis, D. Machine Learning in Agriculture: A Review. Sensors 2018, 18, 2674. [Google Scholar] [CrossRef] [Green Version]
- Singh, R.K.; Prajneshu. Artificial Neural Network Methodology for modeling and Forecasting Maize Crop Yield. Agric. Econ. Res. Rev. 2008, 21, 5–10. [Google Scholar] [CrossRef]
- Wolfert, S.; Ge, L.; Verdouw, C.; Bogaardt, M.J. Big Data in Smart Farming—A review. Agric. Syst. 2017, 153, 69–80. [Google Scholar] [CrossRef]
- Ahmad, U.; Alvino, A.; Marino, S. A Review of Crop Water Stress Assessment Using Remote Sensing. Remote Sens. 2021, 13, 4155. [Google Scholar] [CrossRef]
- Lazarević, B.; Šatović, Z.; Nimac, A.; Vidak, M.; Gunjača, J.; Politeo, O.; Carović-Stanko, K. Application of Phenotyping Methods in Detection of Drought and Salinity Stress in Basil (Ocimum basilicum L.). Front. Plant Sci. 2021, 12, 174. [Google Scholar] [CrossRef]
- Sishodia, R.P.; Ray, R.L.; Singh, S.K. Applications of Remote Sensing in Precision Agriculture: A Review. Remote Sens. 2020, 12, 3136. [Google Scholar] [CrossRef]
- Tran, D.; Dutoit, F.; Najdenovska, E.; Wallbridge, N.; Plummer, C.; Mazza, M.; Raileanu, L.E.; Camps, C. Electrophysiological assessment of plant status outside a Faraday cage using supervised machine learning. Sci. Rep. 2019, 9, 1–9. [Google Scholar] [CrossRef]
- Oletić, D.; Rosner, S.; Zovko, M.; Bilas, V. Time-frequency features of grapevine’s xylem acoustic emissions for detection of drought stress. Comput. Electron. Agric. 2020, 178, 105797. [Google Scholar] [CrossRef]
- Lešić, V.; Novak, H.; Ratković, M.; Zovko, M.; Lemić, D.; Skendžić, S.; Tabak, J.; Polić, M.; Orsag, M. Rapid Plant Development modeling System for Predictive Agriculture Based on Artificial Intelligence. In Proceedings of the 16th International Conference on Telecommunications (ConTEL), Zagreb, Croatia, 30 June–2 July 2021; pp. 173–180. [Google Scholar] [CrossRef]
- Zadoks, J.C.; Chang, T.T.; Konzak, C.F. A decimal code for the growth stages of cereals. Weed Res. 1974, 14, 415–421. [Google Scholar] [CrossRef]
- Doucette, W.; Dettenmaier, E.; Bugbee, B.; Mackay, D. Mass Transport from Soil to Plants. In Handbook of Chemical Mass Transport in the Environment; CRC Press: Boca Raton, FL, USA, 2010; pp. 389–411. [Google Scholar] [CrossRef]
- Snowden, M.C.; Cope, K.R.; Bugbee, B. Sensitivity of Seven Diverse Species to Blue and Green Light: Interactions with Photon Flux. PLoS ONE 2016, 11, e0163121. [Google Scholar] [CrossRef]
- Chandra, S.; Lata, H.; Khan, I.A.; Elsohly, M.A. Photosynthetic response of Cannabis sativa L. to variations in photosynthetic photon flux densities, temperature and CO2 conditions. Physiol. Mol. Biol. Plants 2008, 14, 299–306. [Google Scholar] [CrossRef] [Green Version]
- MicaSense. RedEdge-MX Professional Multispectral Sensor for Agriculture. Available online: https://micasense.com/rededge-mx/ (accessed on 12 November 2021).
- Polić, M.; Ivanović, A.; Marić, B.; Arbanas, B.; Tabak, J.; Orsag, M. Structured Ecological Cultivation with Autonomous Robots in Indoor Agriculture. In Proceedings of the 16th International Conference on Telecommunications (ConTEL), Zagreb, Croatia, 30 June–2 July 2021; pp. 189–195. [Google Scholar] [CrossRef]
- Bannari, A.; Morin, D.; Bonn, F.; Huete, A.R. A review of vegetation indices. Remote Sens. Rev. 1995, 13, 95–120. [Google Scholar] [CrossRef]
- Delegido, J.; Verrelst, J.; Meza, C.; Rivera, J.; Alonso, L.; Moreno, J. A red-edge spectral index for remote sensing estimation of green LAI over agroecosystems. Eur. J. Agron. 2013, 46, 42–52. [Google Scholar] [CrossRef]
- Panda, S.S.; Ames, D.P.; Panigrahi, S. Application of Vegetation Indices for Agricultural Crop Yield Prediction Using Neural Network Techniques. Remote Sens. 2010, 2, 673–696. [Google Scholar] [CrossRef] [Green Version]
- Microsoft Azure IoT Reference Architecture. Available online: https://azure.microsoft.com/en-us/resources/microsoft-azure-iot-reference-architecture/ (accessed on 17 November 2021).
Figure 1.
Encapsulated design plant growth device.

Figure 2.
Plant growth device construction scheme with general scheme in (a) and separate control systems with corresponding sensors and actuators highlighted for temperature and CO concentration in (b), lighting in (c), and soil irrigation and air moisture in (d).
Figure 2.
Plant growth device construction scheme with general scheme in (a) and separate control systems with corresponding sensors and actuators highlighted for temperature and CO concentration in (b), lighting in (c), and soil irrigation and air moisture in (d).

Figure 3.
Cross-coupling control system with additional PI controllers. (a) The scheme and (b) temperature response in four different zones.
Figure 3.
Cross-coupling control system with additional PI controllers. (a) The scheme and (b) temperature response in four different zones.

Figure 4.
Microclimate variables in the four zones for an exemplary case study.

Figure 5.
Spectral resolution of RedEdge-MX multi-spectral sensor datasheet [22].
Figure 5.
Spectral resolution of RedEdge-MX multi-spectral sensor datasheet [22].

Figure 6.
Schematic of the IT system for collection and storage of the encapsulated design’s measured data.
Figure 6.
Schematic of the IT system for collection and storage of the encapsulated design’s measured data.

Figure 7.
Device telemetry data.

Figure 8.
Data flow of Lambda architecture [27].
Figure 8.
Data flow of Lambda architecture [27].

Figure 9.
Exemplary snippet of zone climate measurement data stored in the central data server PostgreSQL database.
Figure 9.
Exemplary snippet of zone climate measurement data stored in the central data server PostgreSQL database.


Table 1.
List of measured microclimate conditions within the climate chambers.
| Measured Parameter | Unit |
|---|---|
| Air temperature | [C] |
| Airflow | [CFM] |
| Air humidity | [%] |
| Photosynthetic photon flux density | [mol/m/s] |
| Soil moisture | [%] |
| Spectral image light intensity (3 bands) | [%] |
Table 2.
List of calculated vegetation indices.
| Calculated Vegetation Index | Expected Range |
|---|---|
| Stem length (in m) | 0 to 0.6 |
| Plant biomass (in g/m) | 0 to 50 |
| Leaf area index | 0 to 5 |
| Normalized Difference Vegetation Index (NDVI) | −1 to 1 |
| Green Normalized Difference Vegetation Index (GNDVI) | −1 to 1 |
| Ratio Vegetation Index (RVI) | 0 to 25 |
| Simple Ratio (SR) | 0 to 20 |
| Photochemical Reflectance Index (PRI) | −0.5 to 0.5 |
| Chlorophyll Index (CI) | 0 to 15 |
Publisher’s Note: MDPI stays neutral with regard to jurisdictional claims in published maps and institutional affiliations. |
© 2022 by the authors. Licensee MDPI, Basel, Switzerland. This article is an open access article distributed under the terms and conditions of the Creative Commons Attribution (CC BY) license (https://creativecommons.org/licenses/by/4.0/).
Share and Cite
MDPI and ACS Style
Novak, H.; Ratković, M.; Cahun, M.; Lešić, V. An IoT-Based Encapsulated Design System for Rapid Model Identification of Plant Development. Telecom 2022, 3, 70-85. https://0-doi-org.brum.beds.ac.uk/10.3390/telecom3010004
AMA Style
Novak H, Ratković M, Cahun M, Lešić V. An IoT-Based Encapsulated Design System for Rapid Model Identification of Plant Development. Telecom. 2022; 3(1):70-85. https://0-doi-org.brum.beds.ac.uk/10.3390/telecom3010004
Chicago/Turabian StyleNovak, Hrvoje, Marko Ratković, Mateo Cahun, and Vinko Lešić. 2022. "An IoT-Based Encapsulated Design System for Rapid Model Identification of Plant Development" Telecom 3, no. 1: 70-85. https://0-doi-org.brum.beds.ac.uk/10.3390/telecom3010004