
Adsorption Characteristics of Cetirizine on Graphene Oxide
 , and
, and
Abstract
:1. Introduction
2. Materials and Methods
2.1. Materials
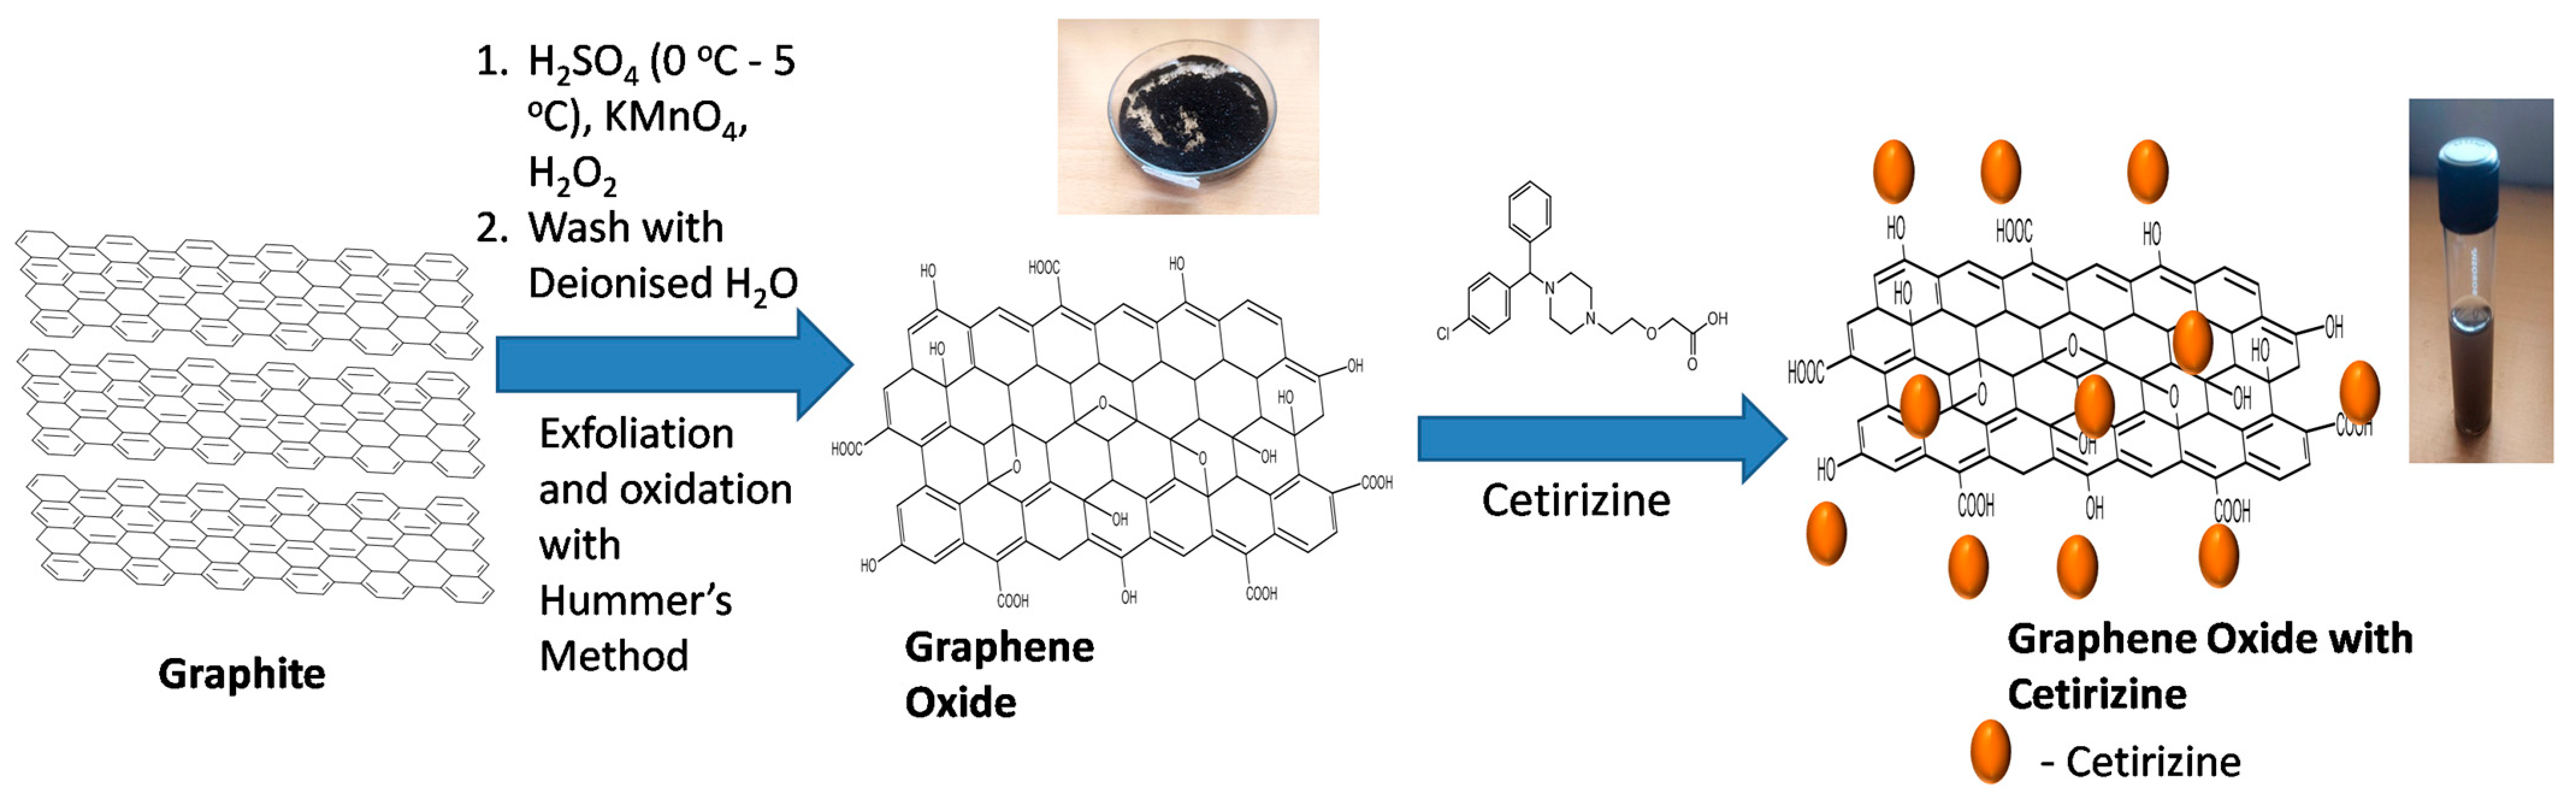
2.2. Synthesis of GO
2.3. Preparation of Cetirizine Solutions
2.4. Contact Time Experiment, Kinetics, and Diffusion Studies
2.5. Effect of pH
2.6. Thermodynamic Studies
2.7. Adsorption Isotherm Studies
2.8. Recyclability
2.9. Characterization Techniques of Adsorbent
3. Results and Discussion
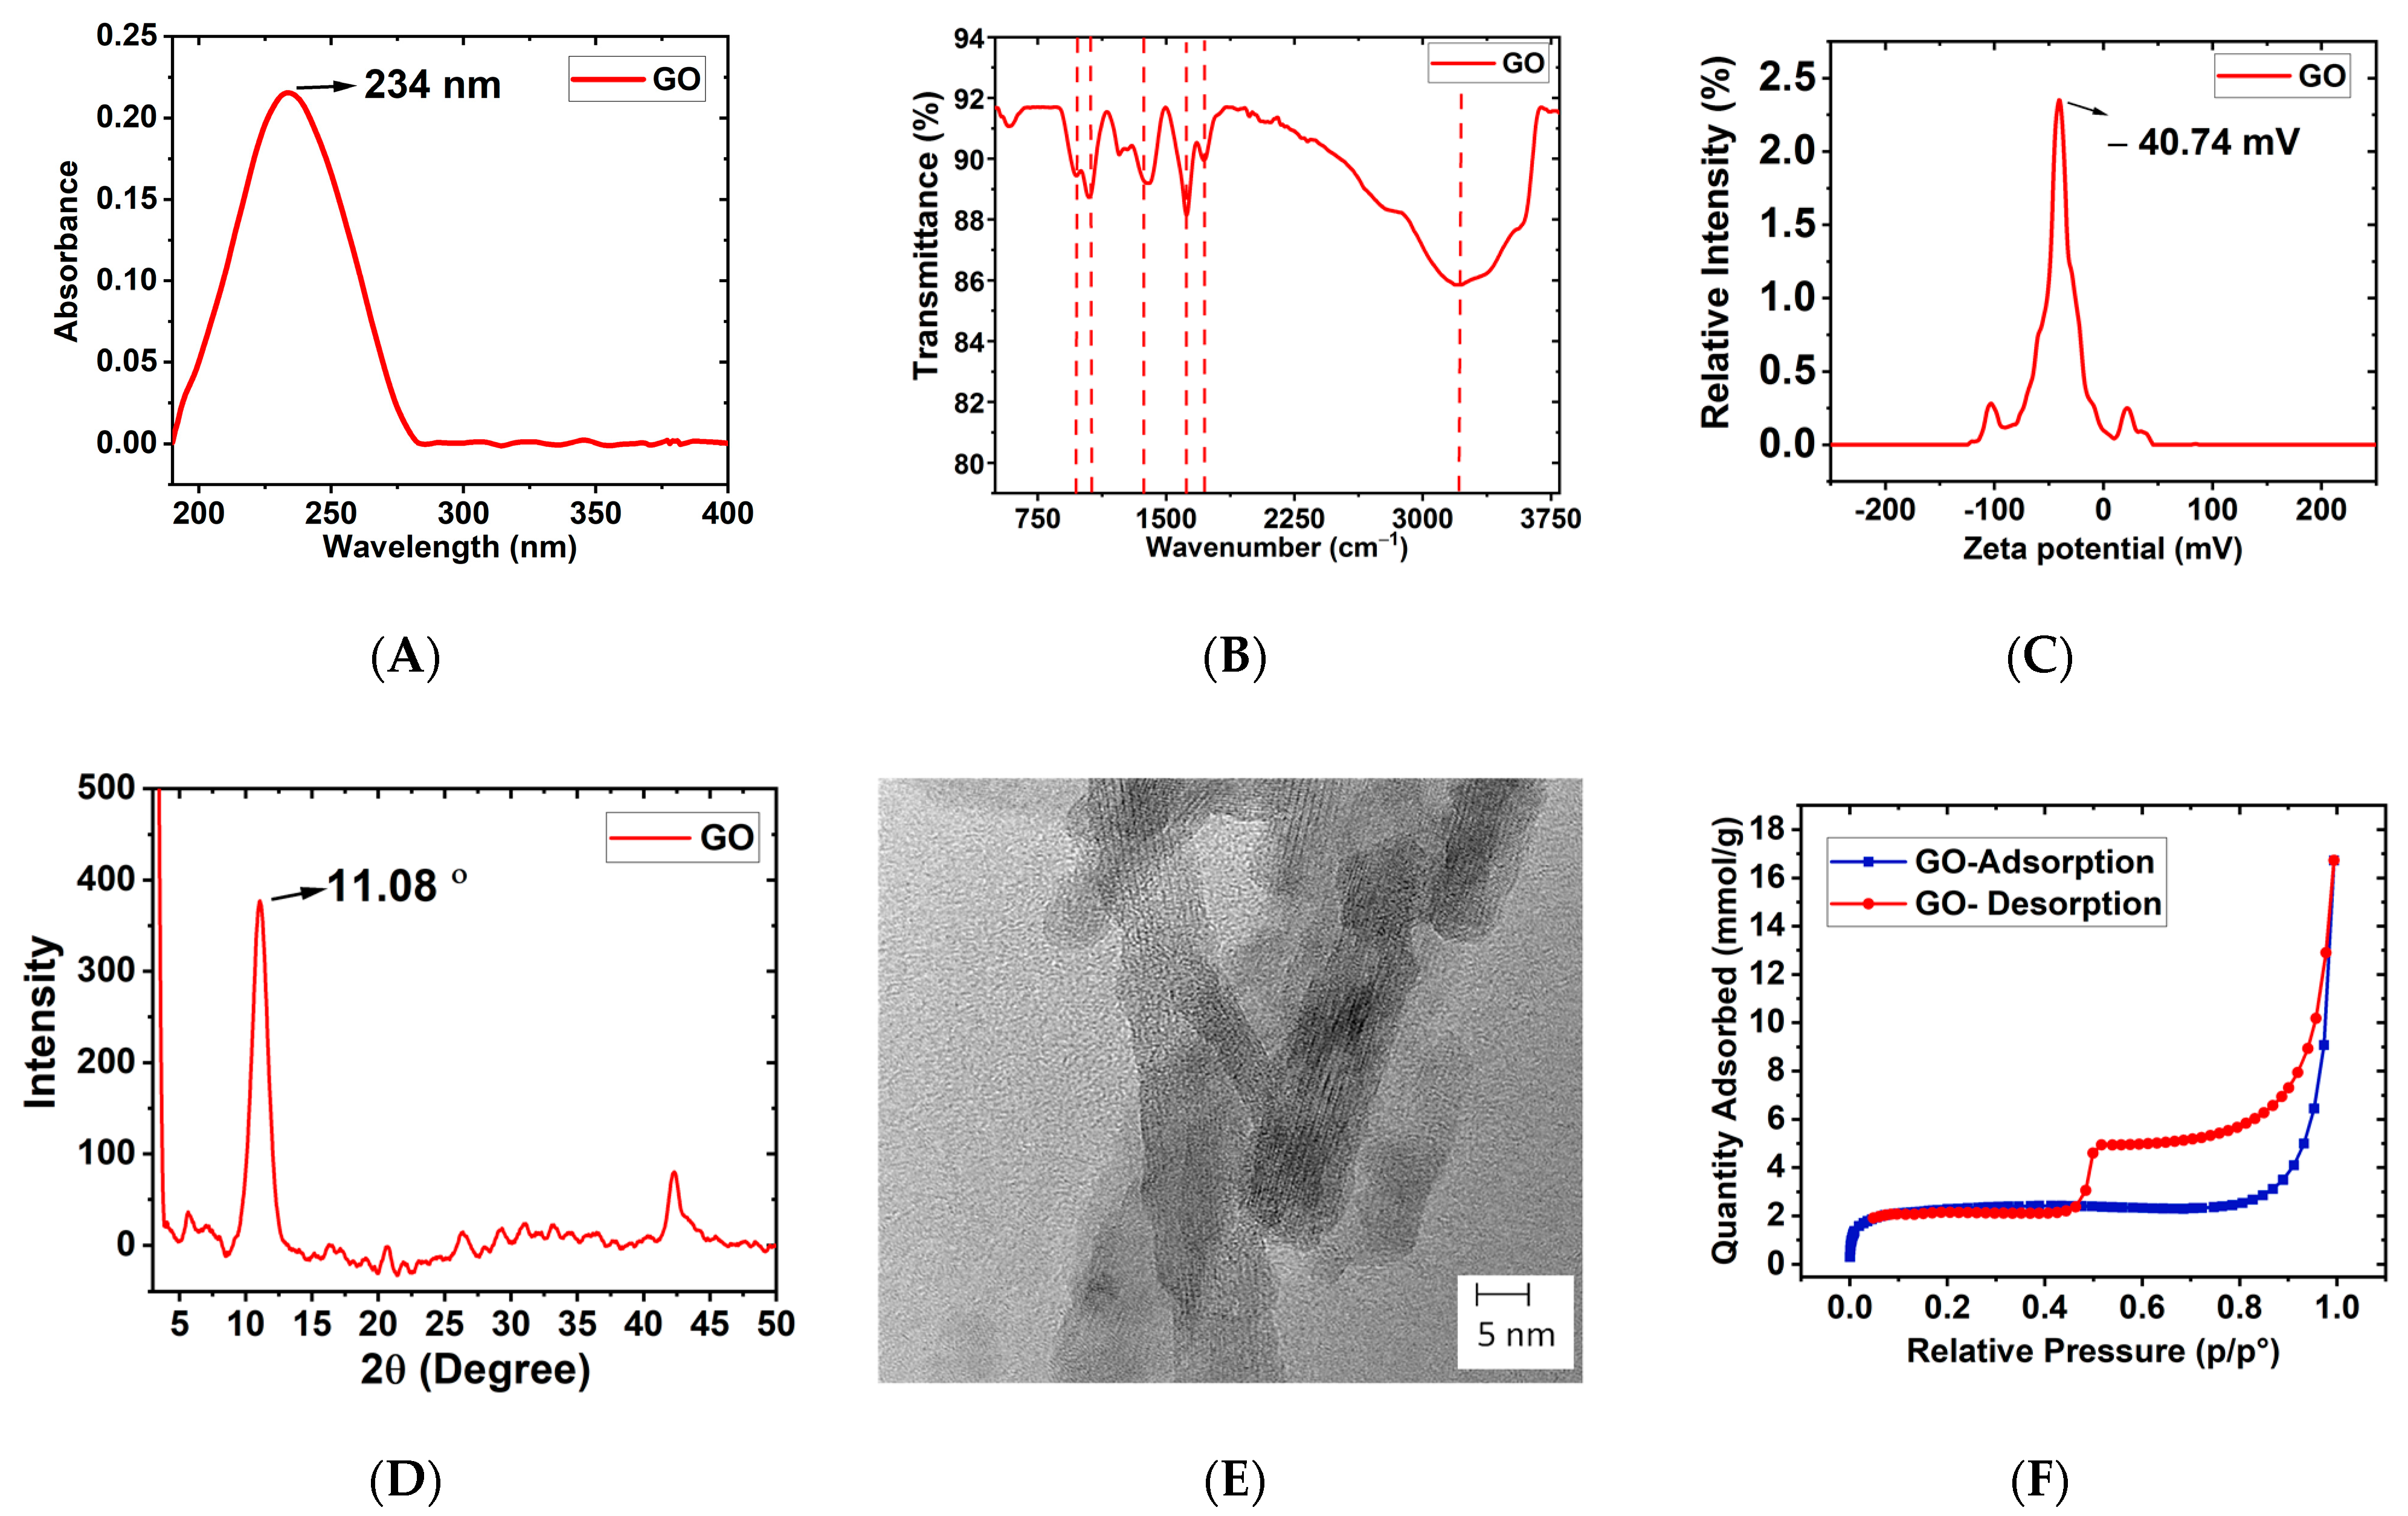
3.1. Characterization of GO
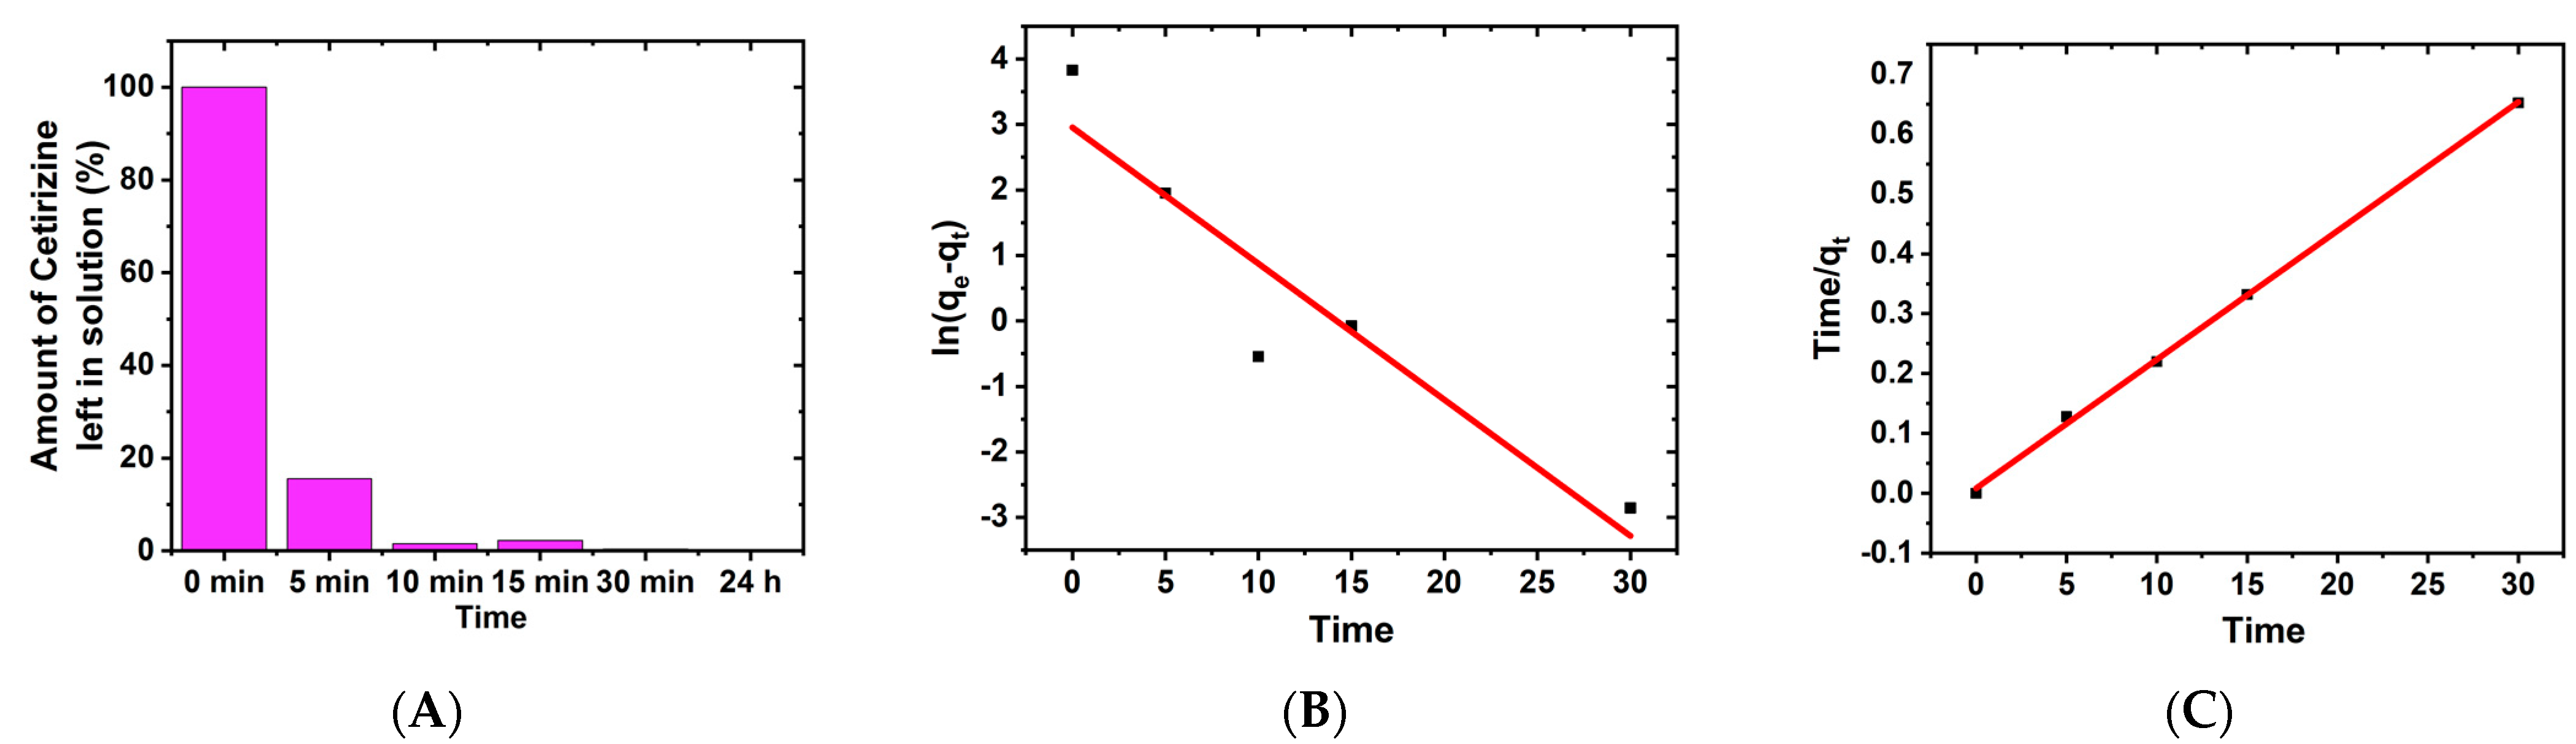
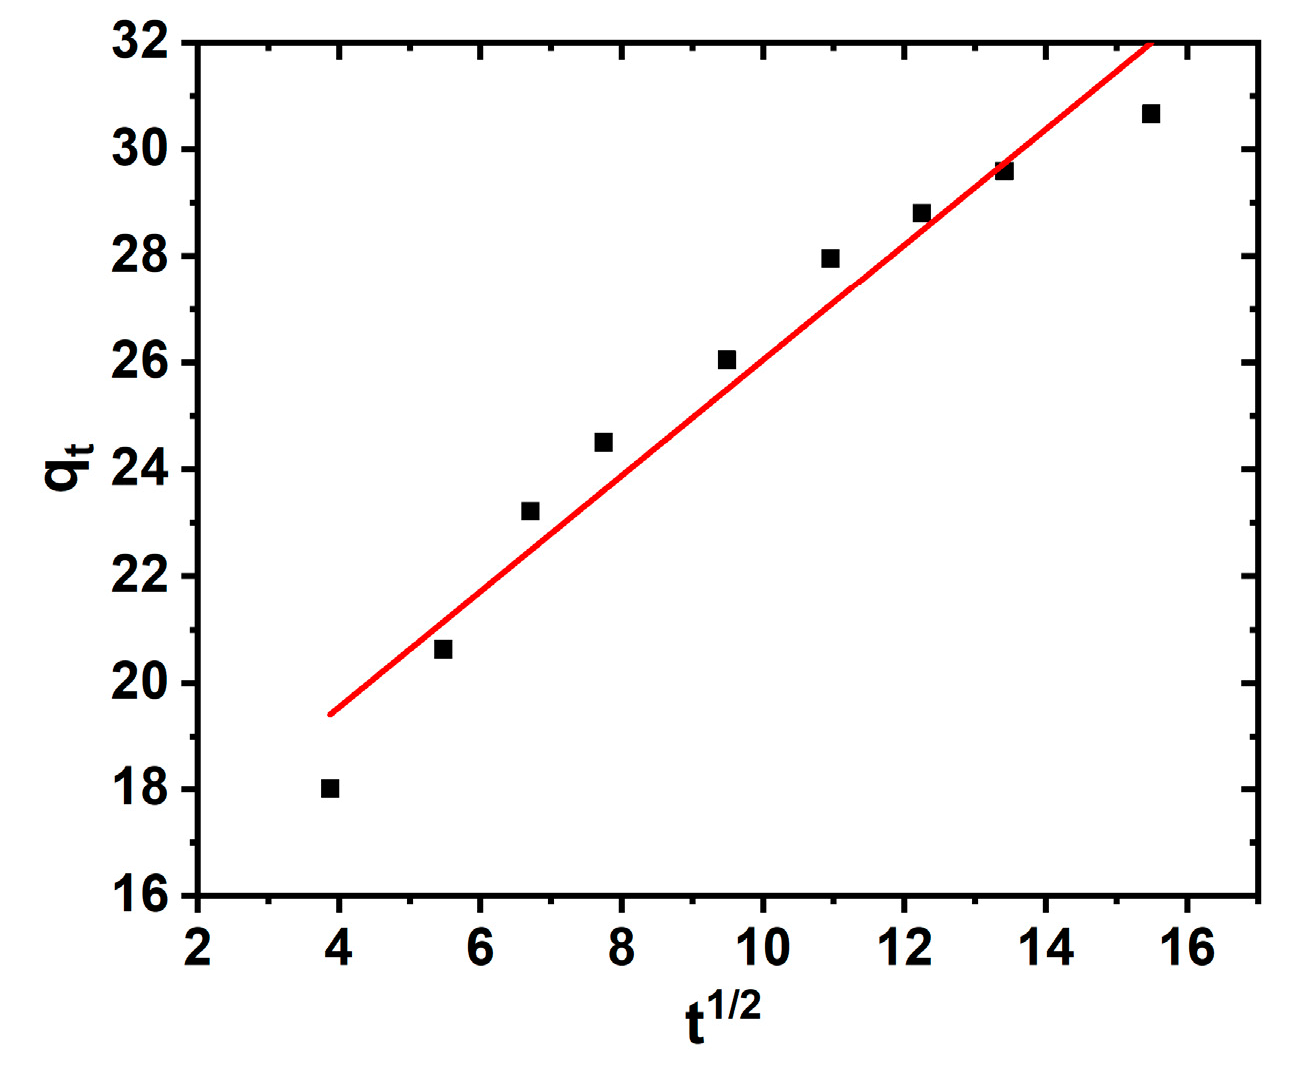
3.2. Contact Time Experiment, Kinetics, and Diffusion Studies
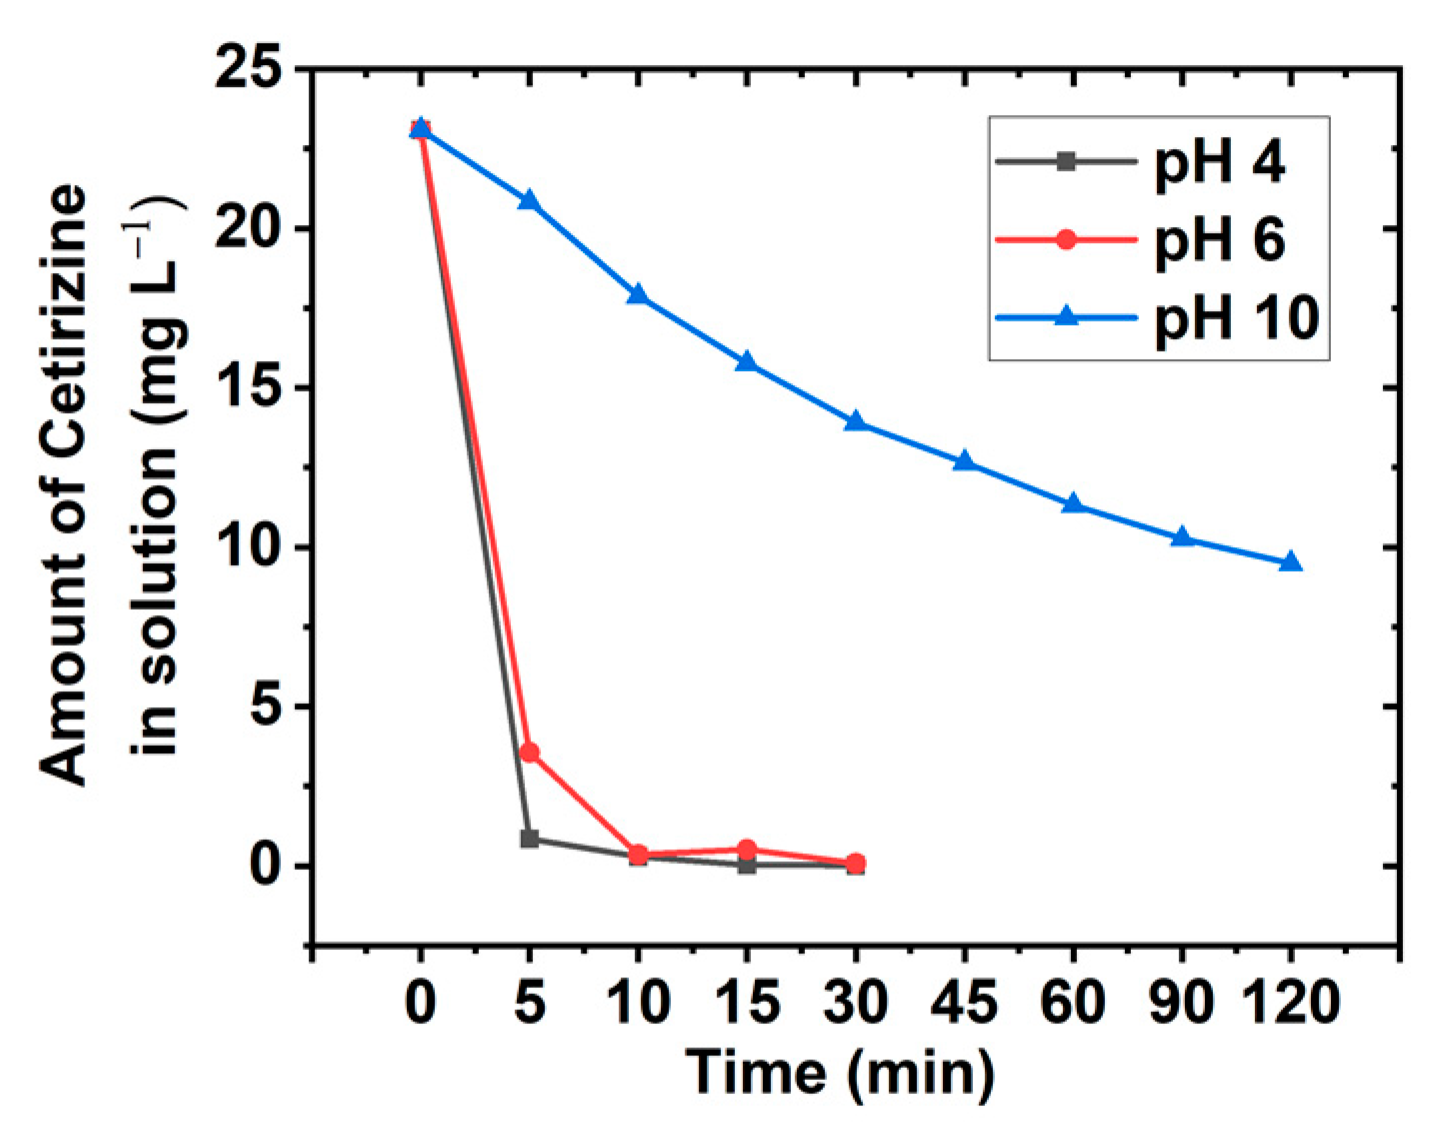
3.3. pH Variation Studies
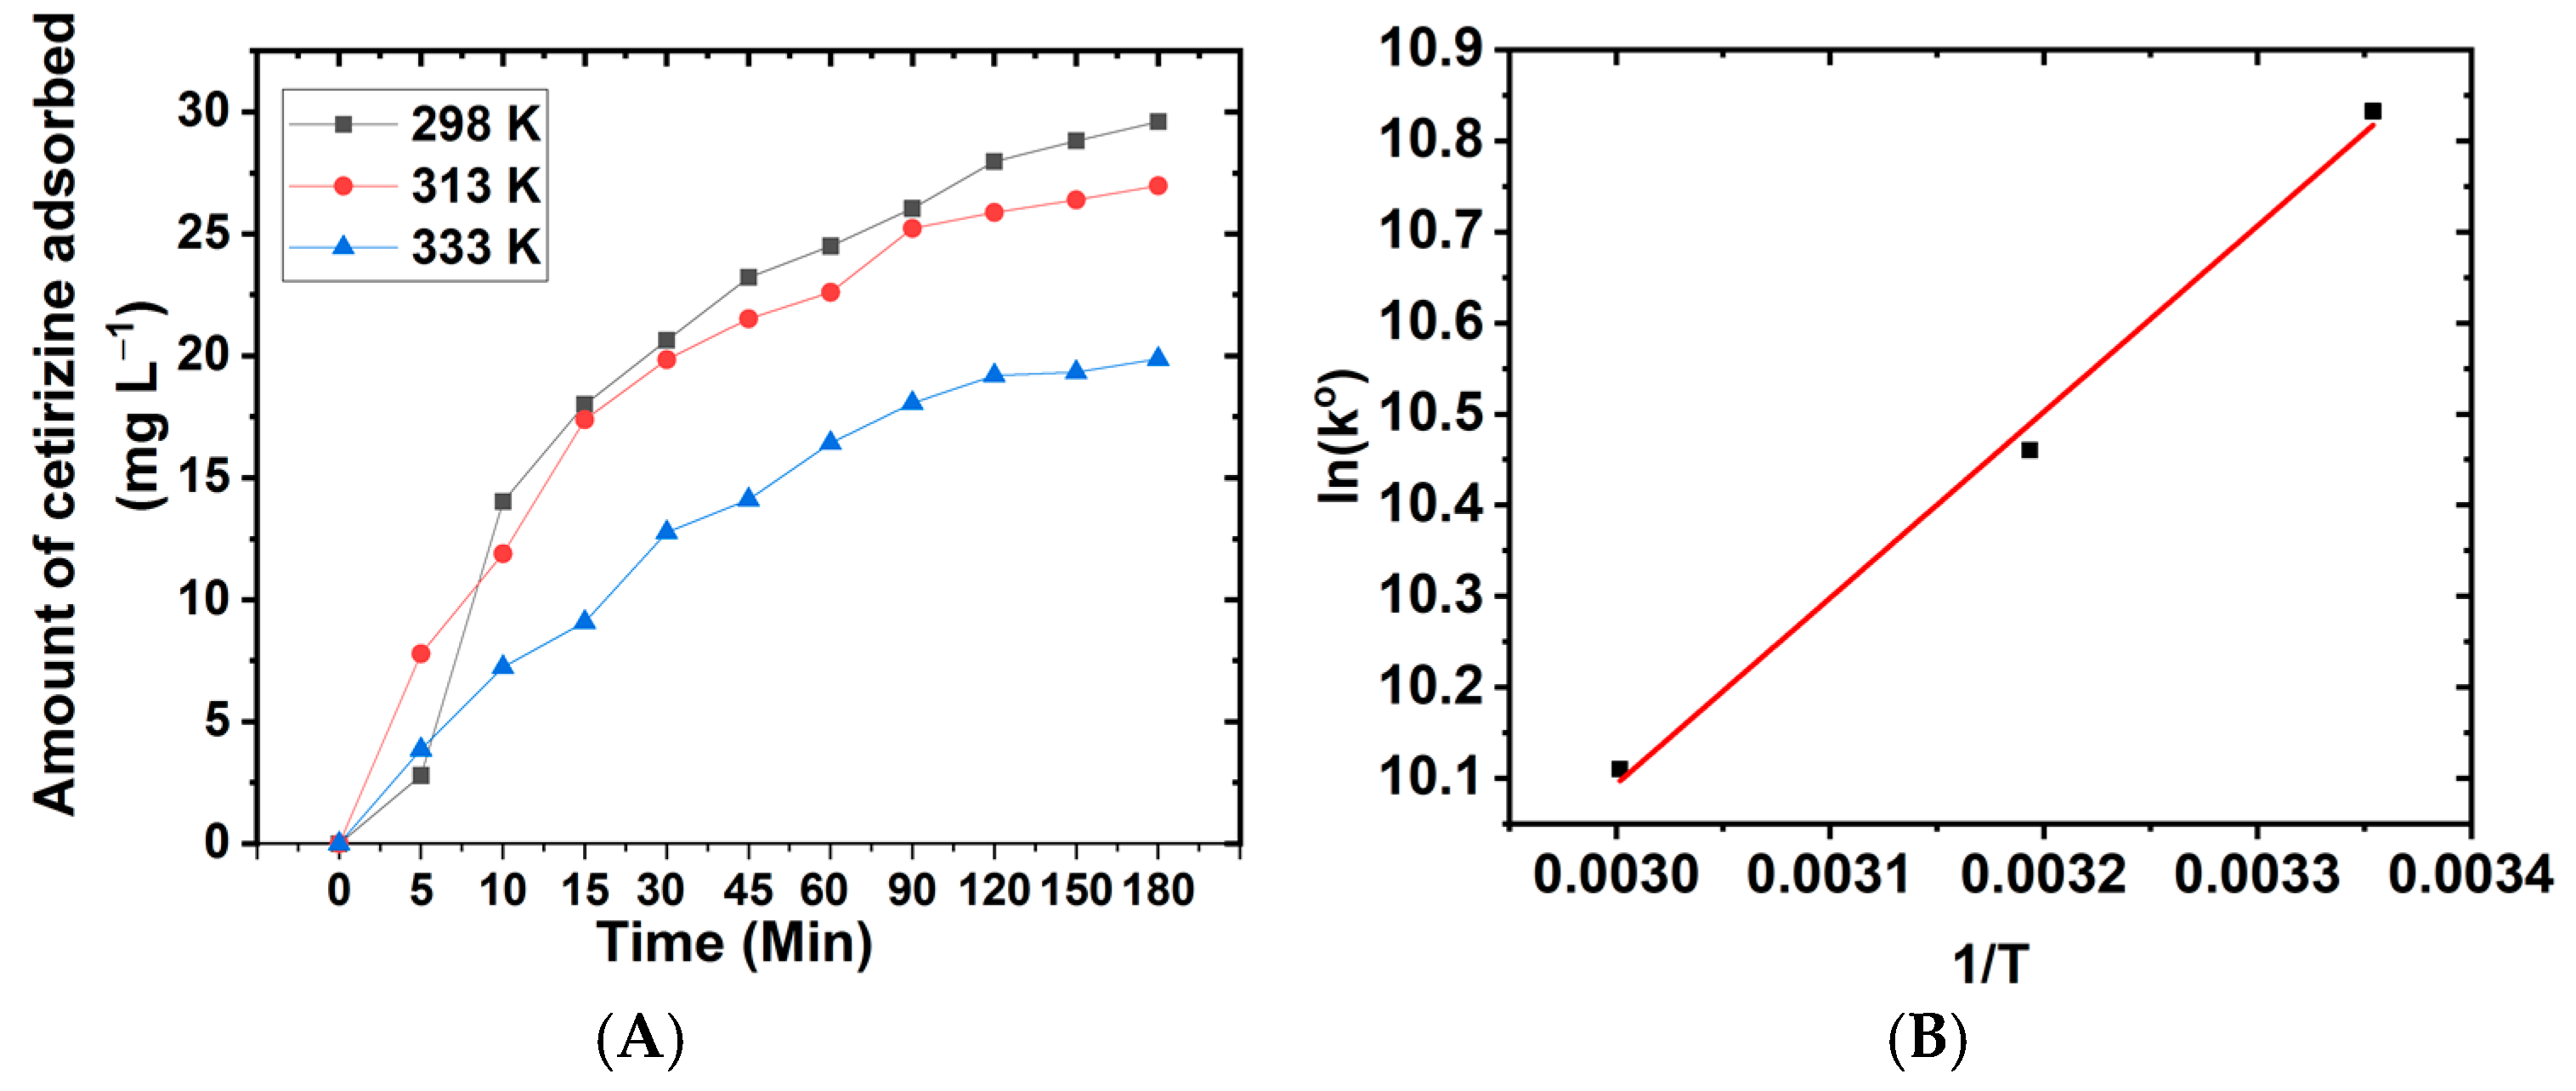
3.4. Thermodynamics Studies
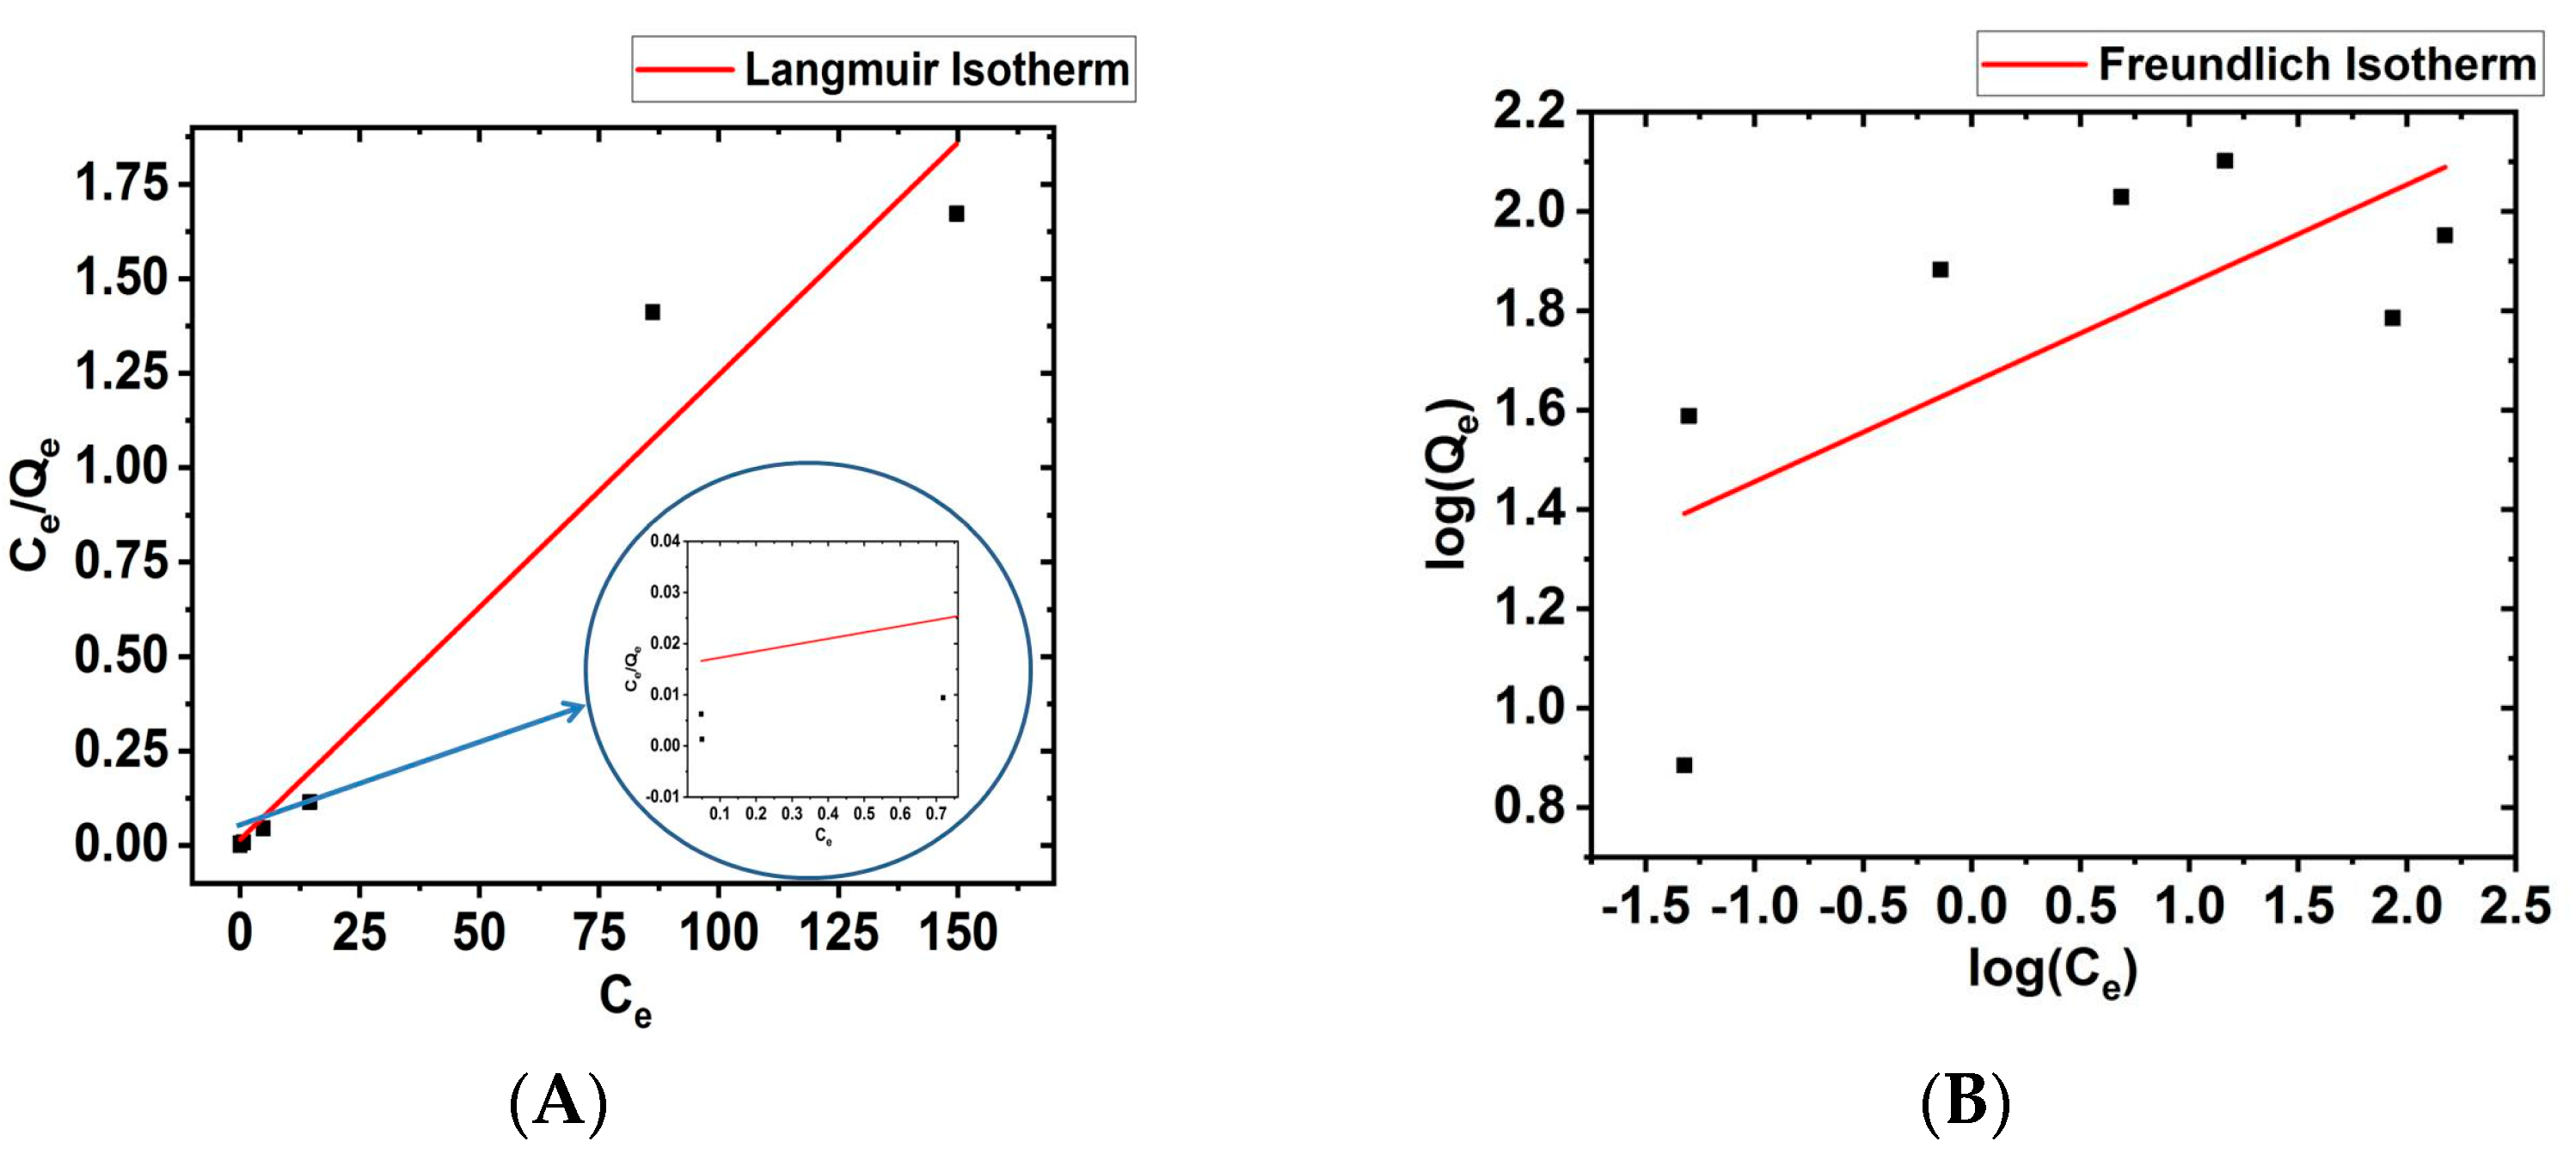
3.5. Langmuir and Freundlich Isotherm
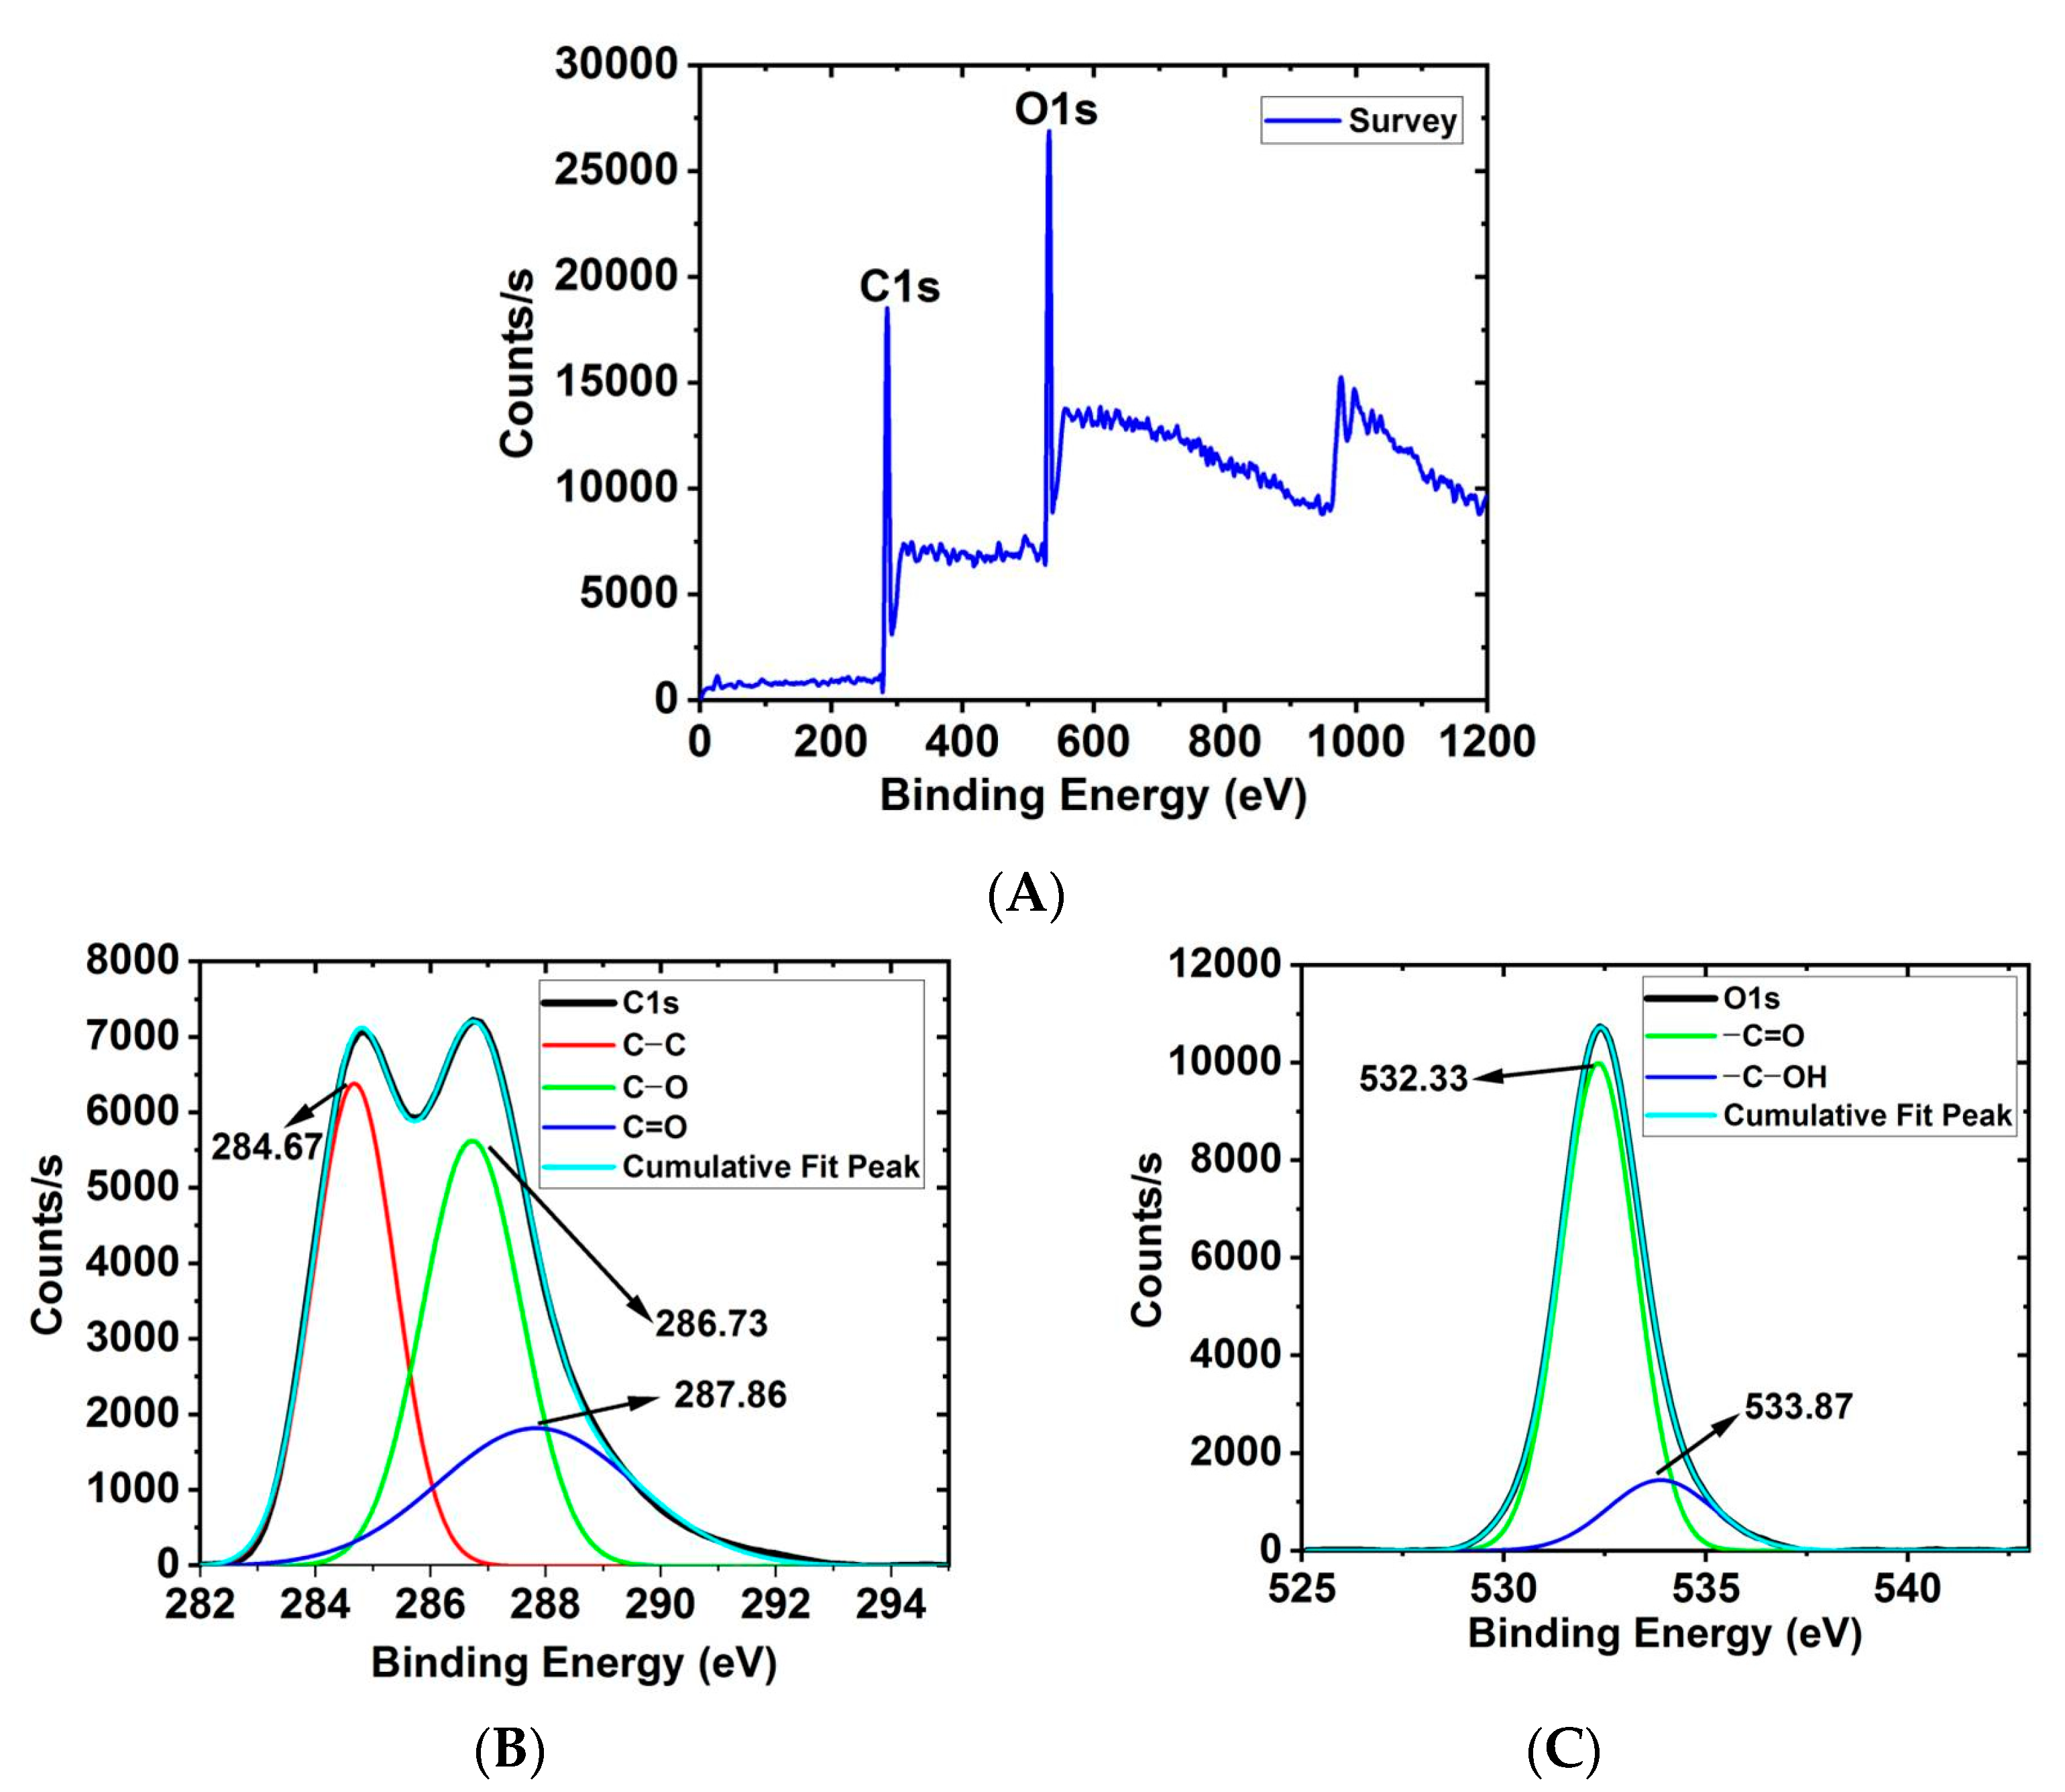
3.6. XPS Analysis
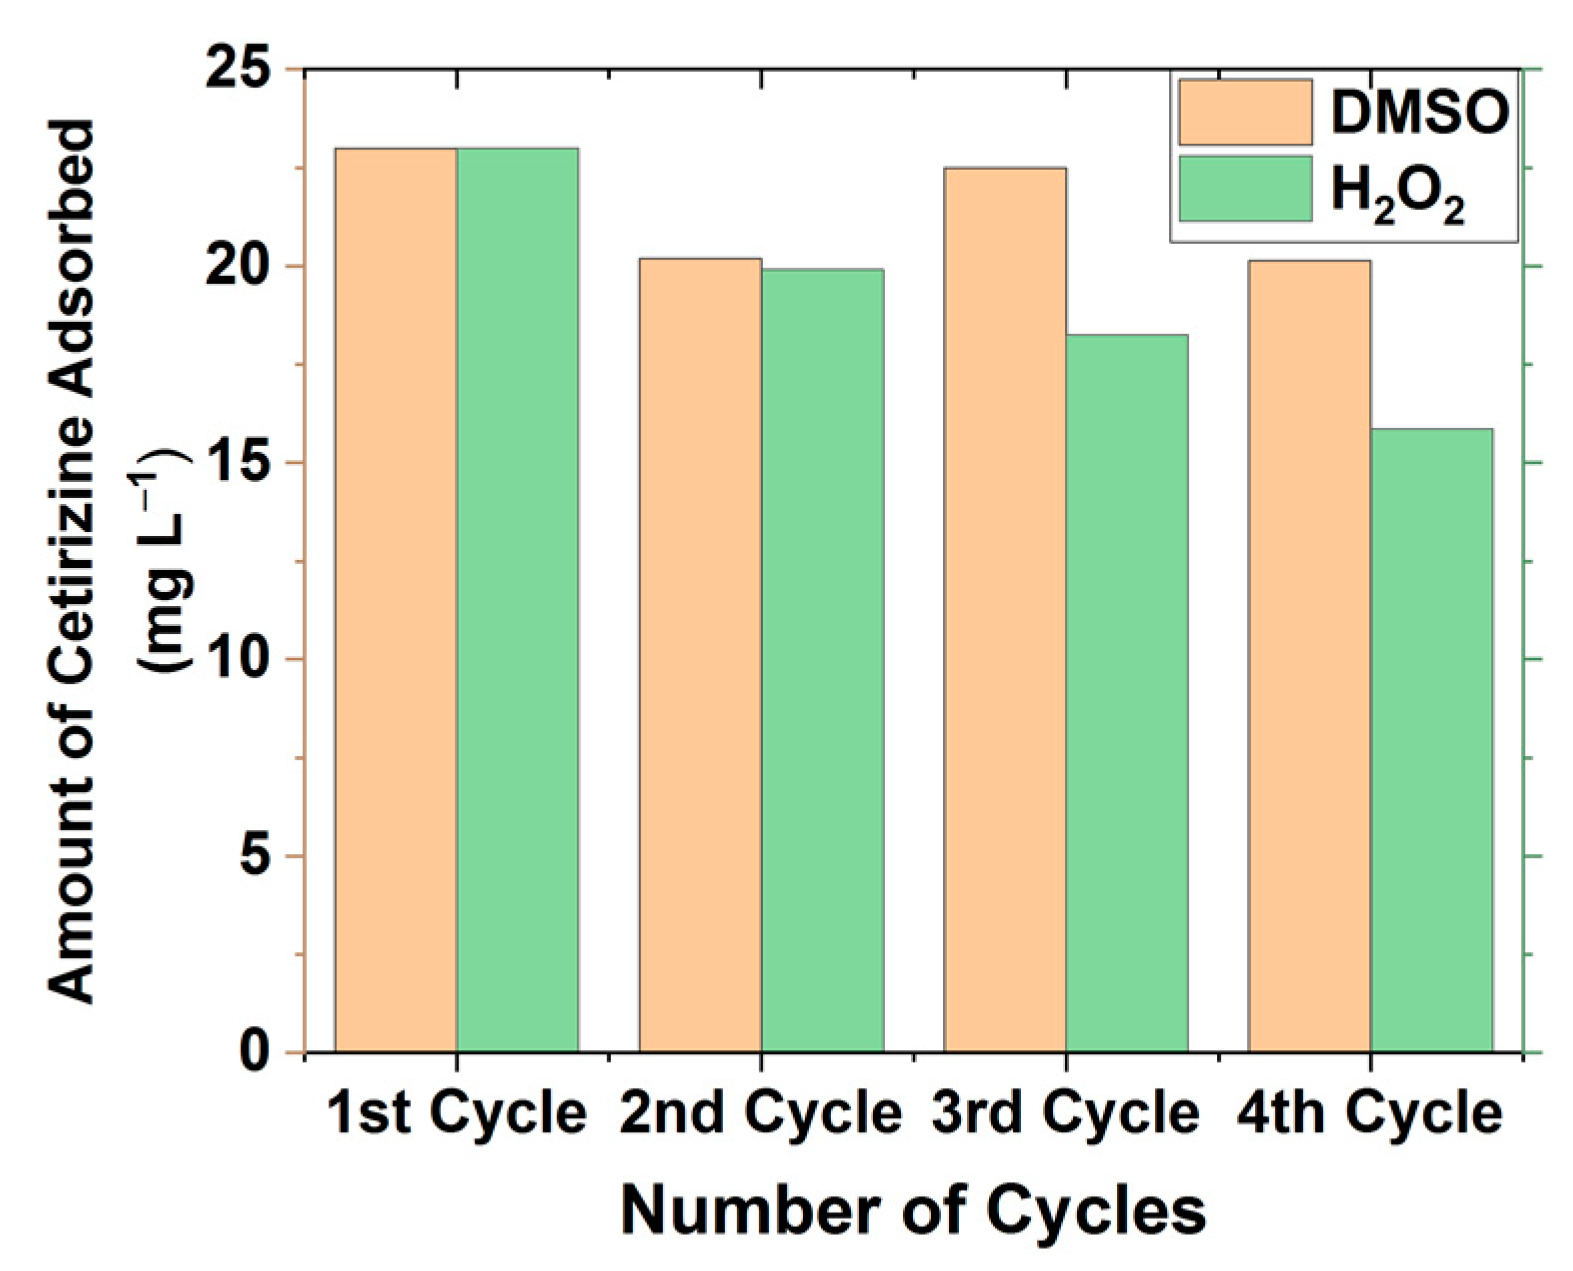
3.7. Recyclability
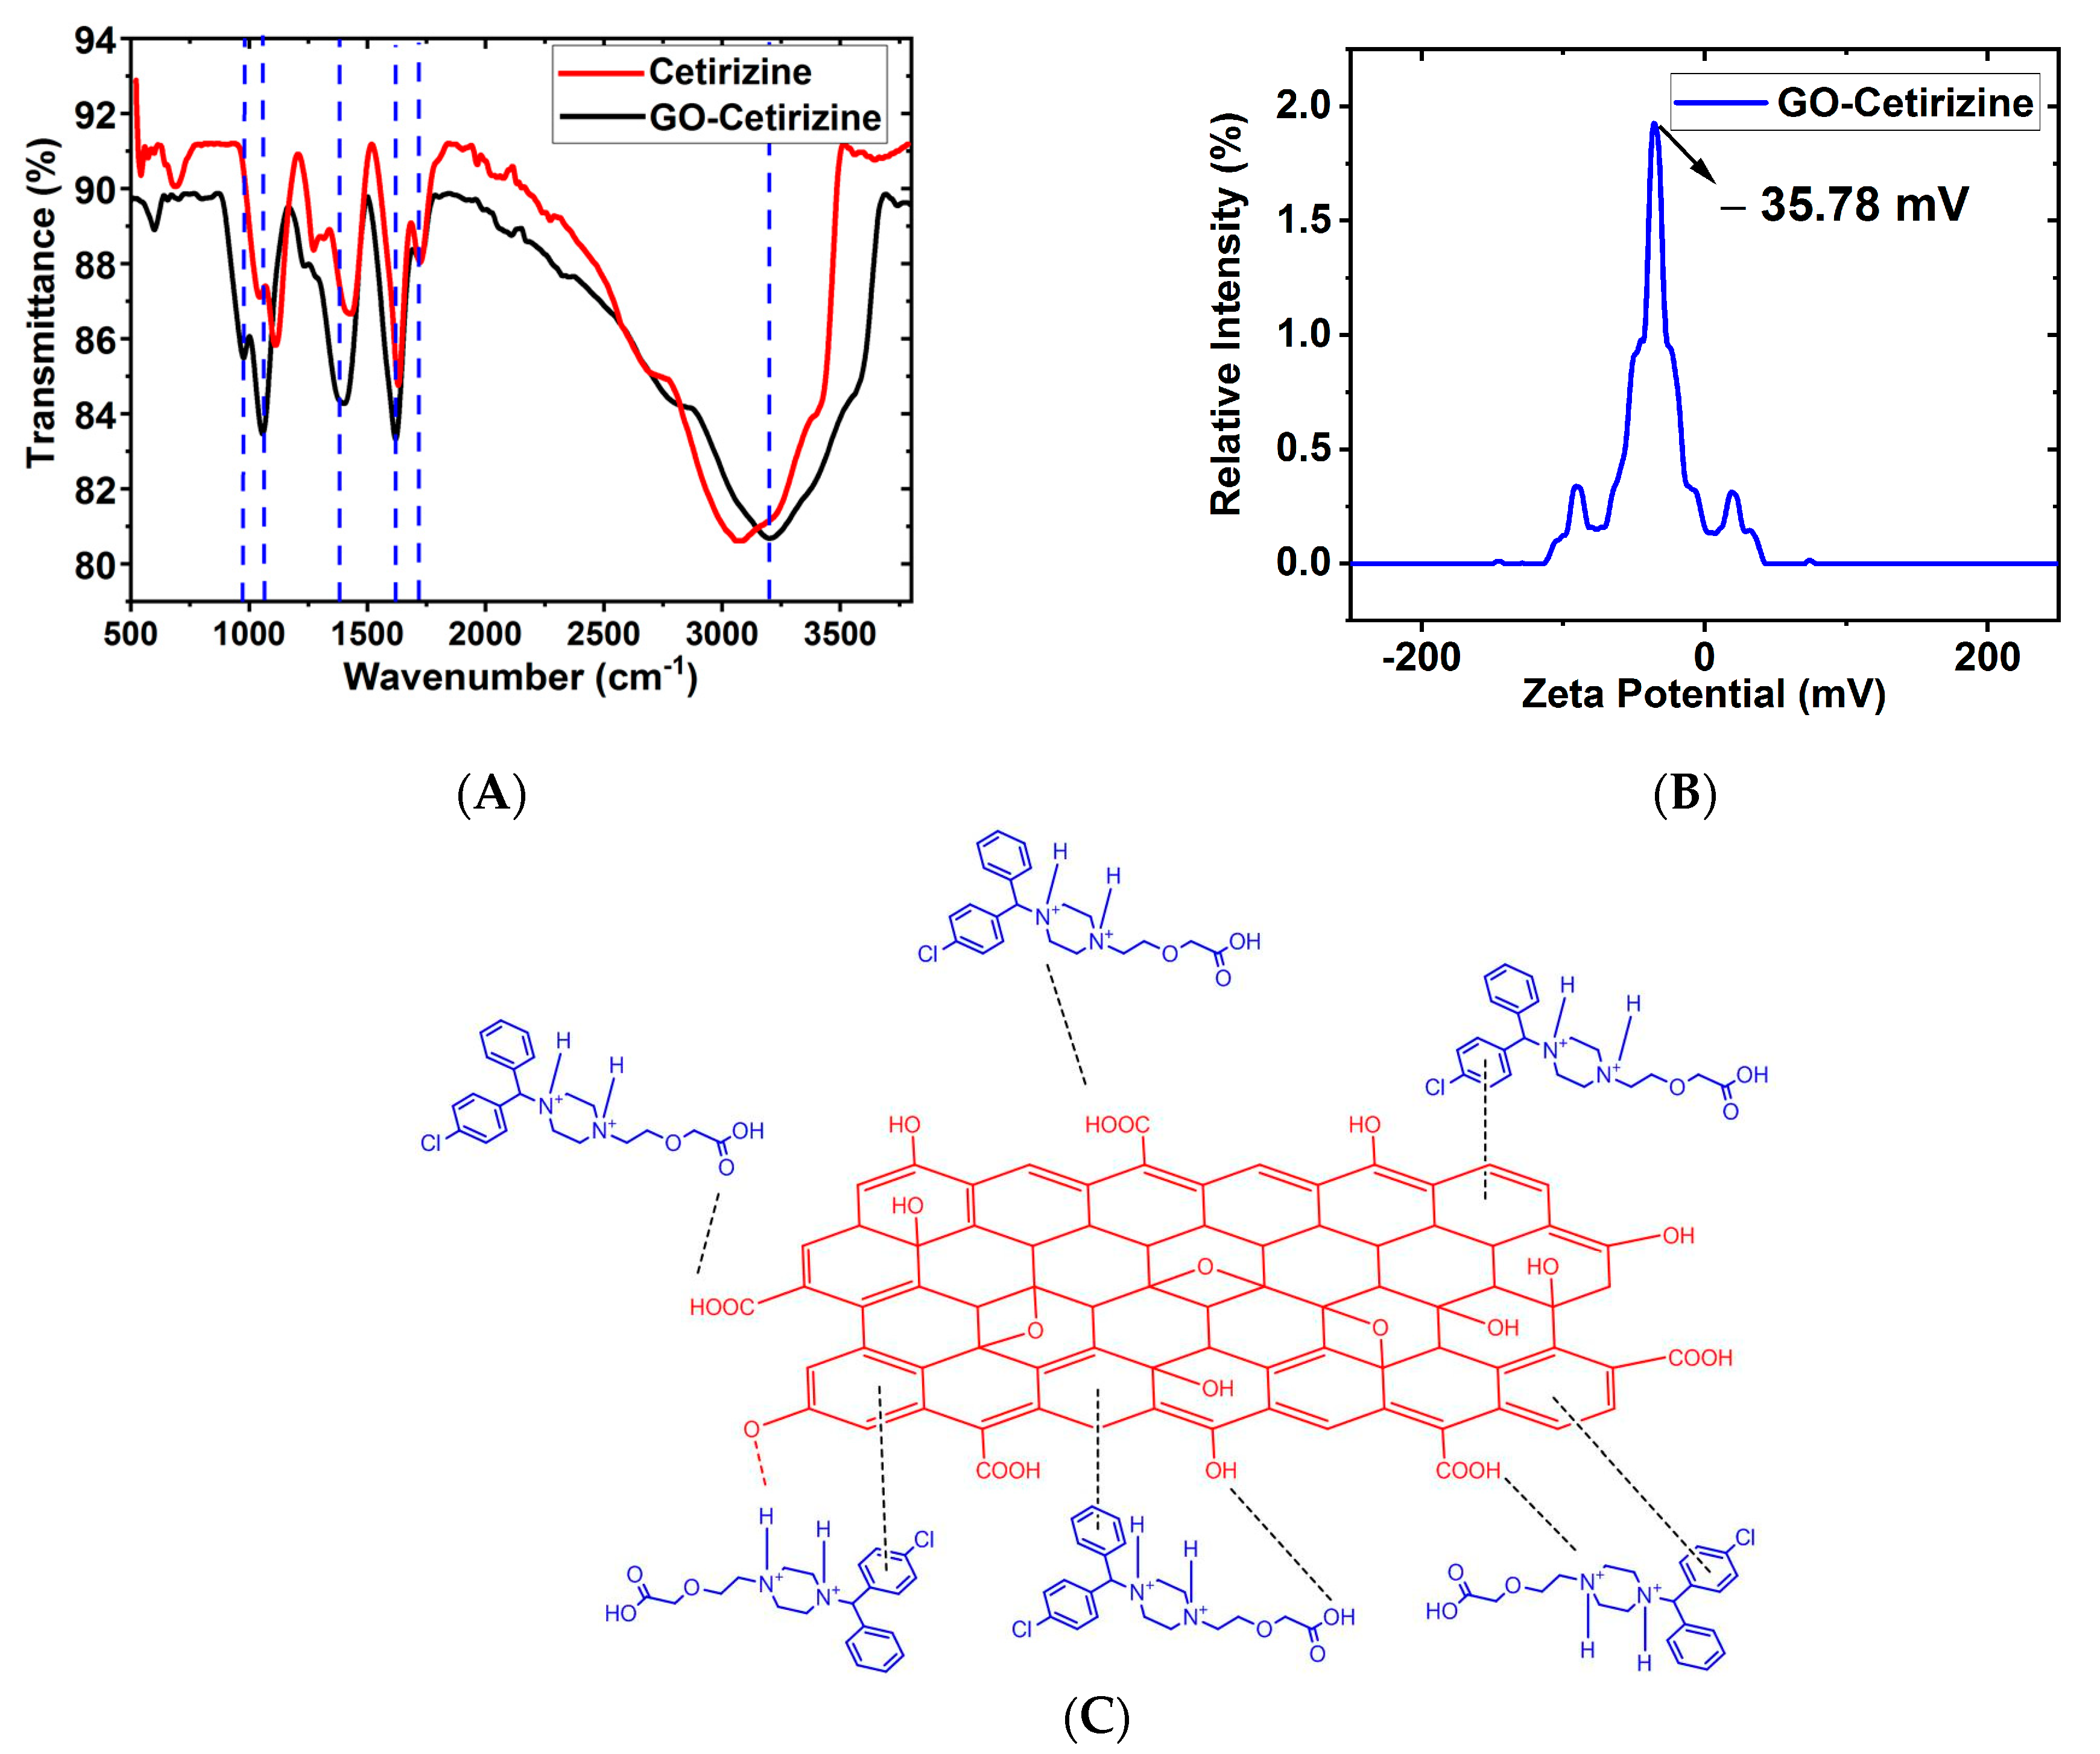
3.8. Mechanism
4. Conclusions
Supplementary Materials
Author Contributions
Funding
Institutional Review Board Statement
Informed Consent Statement
Data Availability Statement
Acknowledgments
Conflicts of Interest
References
- Patel, M.; Kumar, R.; Kishor, K.; Mlsna, T.; Pittman, C.U.; Mohan, D. Pharmaceuticals of Emerging Concern in Aquatic Systems: Chemistry, Occurrence, Effects, and Removal Methods. Chem. Rev. 2019, 119, 3510–3673. [Google Scholar] [CrossRef]
- Larsson, D.G.J.; de Pedro, C.; Paxeus, N. Effluent from Drug Manufactures Contains Extremely High Levels of Pharmaceuticals. J. Hazard. Mater. 2007, 148, 751–755. [Google Scholar] [CrossRef]
- Valdez-Carrillo, M.; Abrell, L.; Ramírez-Hernández, J.; Reyes-López, J.A.; Carreón-Diazconti, C. Pharmaceuticals as Emerging Contaminants in the Aquatic Environment of Latin America: A Review. Environ. Sci. Pollut. Res. 2020, 27, 44863–44891. [Google Scholar] [CrossRef] [PubMed]
- Majumder, J.; Deb, J.; Husain, A.; Jana, S.S.; Dastidar, P. Cetirizine Derived Supramolecular Topical Gel in Action: Rational Design, Characterization and in Vivo Self-Delivery Application in Treating Skin Allergy in Mice. J. Mater. Chem. B 2015, 3, 6634–6644. [Google Scholar] [CrossRef] [PubMed]
- Fick, J.; Söderström, H.; Lindberg, R.H.; Phan, C.; Tysklind, M.; Larsson, D.G.J. Contamination of surface, ground, and drinking water from pharmaceutical production. Environ. Toxicol. Chem. 2009, 28, 2522. [Google Scholar] [CrossRef] [PubMed]
- Schulz, M.; Schmoldt, A. Therapeutic and toxic blood concentrations of more than 800 drugs and other xenobiotics. Pharmazie 2003, 58, 447–474. [Google Scholar]
- Reyes-Jacang, A.; Wenzl, J.E. Antihistamine Toxicity in Children. Clin. Pediatr. Phila. 1969, 8, 297–299. [Google Scholar] [CrossRef]
- May, B.C.; Gallivan, K.H. Levocetirizine and Montelukast in the COVID-19 Treatment Paradigm. Int. Immunopharmacol. 2022, 103, 108412. [Google Scholar] [CrossRef]
- He, X.; O’Shea, K.E. Rapid Transformation of H1-Antihistamines Cetirizine (CET) and Diphenhydramine (DPH) by Direct Peroxymonosulfate (PMS) Oxidation. J. Hazard. Mater. 2020, 398, 123219. [Google Scholar] [CrossRef]
- Sutar, R.S.; Rathod, V.K. Ultrasound Assisted Enzyme Catalyzed Degradation of Cetirizine Dihydrochloride. Ultrason. Sonochem. 2015, 24, 80–86. [Google Scholar] [CrossRef]
- Uheida, A.; Mohamed, A.; Belaqziz, M.; Nasser, W.S. Photocatalytic Degradation of Ibuprofen, Naproxen, and Cetirizine Using PAN-MWCNT Nanofibers Crosslinked TiO2-NH2 Nanoparticles under Visible Light Irradiation. Sep. Purif. Technol. 2019, 212, 110–118. [Google Scholar] [CrossRef]
- Li, Z.; Chang, P.-H.; Jean, J.-S.; Jiang, W.-T.; Hong, H. Mechanism of Chlorpheniramine Adsorption on Ca-Montmorillonite. Colloids Surf. A Physicochem. Eng. Asp. 2011, 385, 213–218. [Google Scholar] [CrossRef]
- Khan, A.; Wang, J.; Li, J.; Wang, X.; Chen, Z.; Alsaedi, A.; Hayat, T.; Chen, Y.; Wang, X. The Role of GO and GO-Based Nanomaterials in the Removal of Pharmaceuticals from Aqueous Media: A Review. Environ. Sci. Pollut. Res. 2017, 24, 7938–7958. [Google Scholar] [CrossRef] [PubMed]
- Sharifi-Bonab, M.; Arjomandi Rad, F.; Talat Mehrabad, J. Preparation of Laccase-GO Nanosheet/Alginate Composite: Application for the Removal of Cetirizine from Aqueous Solution. J. Environ. Chem. Eng. 2016, 4, 3013–3020. [Google Scholar] [CrossRef]
- Zhu, Y.; Murali, S.; Cai, W.; Li, X.; Suk, J.W.; Potts, J.R.; Ruoff, R.S. Graphene and GO: Synthesis, Properties, and Applications. Adv. Mater. 2010, 22, 3906–3924. [Google Scholar] [CrossRef]
- Lin, K.-C.; Muthukumar, S.; Prasad, S. Flex-GO (Flexible GO) Sensor for Electrochemical Monitoring Lactate in Low-Volume Passive Perspired Human Sweat. Talanta 2020, 214, 120810. [Google Scholar] [CrossRef]
- Wang, T.; Jing, L.-C.; Zhu, Q.; SagadevanEthiraj, A.; Tian, Y.; Zhao, H.; Yuan, X.-T.; Wen, J.-G.; Li, L.-K.; Geng, H.-Z. Fabrication of Architectural Structured Polydopamine-Functionalized Reduced GO/Carbon Nanotube/PEDOT:PSS Nanocomposites as Flexible Transparent Electrodes for OLEDs. Appl. Surf. Sci. 2020, 500, 143997. [Google Scholar] [CrossRef]
- Ji, S.; Min, B.K.; Kim, S.K.; Myung, S.; Kang, M.; Shin, H.-S.; Song, W.; Heo, J.; Lim, J.; An, K.-S.; et al. Work Function Engineering of GO via Covalent Functionalization for Organic Field-Effect Transistors. Appl. Surf. Sci. 2017, 419, 252–258. [Google Scholar] [CrossRef]
- Wang, C.; Zhang, Z.; Chen, B.; Gu, L.; Li, Y.; Yu, S. Design and Evaluation of Galactosylated Chitosan/GO Nanoparticles as a Drug Delivery System. J. Colloid Interface Sci. 2018, 516, 332–341. [Google Scholar] [CrossRef]
- Berrio, M.E.; Oñate, A.; Salas, A.; Fernández, K.; Meléndrez, M.F. Synthesis and Applications of GO Aerogels in Bone Tissue Regeneration: A Review. Mater. Today Chem. 2021, 20, 100422. [Google Scholar] [CrossRef]
- Wang, Y.; Pan, C.; Chu, W.; Vipin, A.; Sun, L. Environmental Remediation Applications of Carbon Nanotubes and GO: Adsorption and Catalysis. Nanomaterials 2019, 9, 439. [Google Scholar] [CrossRef] [PubMed]
- Wu, Z.; Huang, W.; Shan, X.; Li, Z. Preparation of a Porous GO/Alkali Lignin Aerogel Composite and Its Adsorption Properties for Methylene Blue. Int. J. Biol. Macromol. 2020, 143, 325–333. [Google Scholar] [CrossRef] [PubMed]
- Ain, Q.-U.; Farooq, M.U.; Jalees, M.I. Application of Magnetic GO for Water Purification: Heavy Metals Removal and Disinfection. J. Water Process Eng. 2020, 33, 101044. [Google Scholar] [CrossRef]
- Velusamy, S.; Roy, A.; Sundaram, S.; Kumar Mallick, T. A Review on Heavy Metal Ions and Containing Dyes Removal Through GO-Based Adsorption Strategies for Textile Wastewater Treatment. Chem. Rec. 2021, 21, 1570–1610. [Google Scholar] [CrossRef] [PubMed]
- Bhattacharjee, T.; Rahman, S.; Deka, D.; Purkait, M.K.; Chowdhury, D.; Majumdar, G. Synthesis and Characterization of Exfoliated Beta-Cyclodextrin Functionalized GO for Adsorptive Removal of Atenolol. Mater. Chem. Phys. 2022, 288, 126413. [Google Scholar] [CrossRef]
- Delhiraja, K.; Vellingiri, K.; Boukhvalov, D.W.; Philip, L. Development of Highly Water Stable GO-Based Composites for the Removal of Pharmaceuticals and Personal Care Products. Ind. Eng. Chem. Res. 2019, 58, 2899–2913. [Google Scholar] [CrossRef]
- Ouyang, J.; Zhou, L.; Liu, Z.; Heng, J.Y.Y.; Chen, W. Biomass-Derived Activated Carbons for the Removal of Pharmaceutical Mircopollutants from Wastewater: A Review. Sep. Purif. Technol. 2020, 253, 117536. [Google Scholar] [CrossRef]
- Thiebault, T. Raw and Modified Clays and Clay Minerals for the Removal of Pharmaceutical Products from Aqueous Solutions: State of the Art and Future Perspectives. Crit. Rev. Environ. Sci. Technol. 2020, 50, 1451–1514. [Google Scholar] [CrossRef]
- Emam, H.E.; El-Shahat, M.; Abdelhameed, R.M. Observable Removal of Pharmaceutical Residues by Highly Porous Photoactive Cellulose Acetate@MIL-MOF Film. J. Hazard. Mater. 2021, 414, 125509. [Google Scholar] [CrossRef]
- HooriabadSaboor, F.; Nasirpour, N.; Shahsavari, S.; Kazemian, H. The Effectiveness of MOFs for the Removal of Pharmaceuticals from Aquatic Environments: A Review Focused on Antibiotics Removal. Chem.-Asian J. 2022, 17, e202101105. [Google Scholar] [CrossRef]
- Ghasemi, M.; Khedri, M.; Didandeh, M.; Taheri, M.; Ghasemy, E.; Maleki, R.; Shon, H.K.; Razmjou, A. Removal of Pharmaceutical Pollutants from Wastewater Using 2D Covalent Organic Frameworks (COFs): An In Silico Engineering Study. Ind. Eng. Chem. Res. 2022, 61, 8809–8820. [Google Scholar] [CrossRef]
- Karimi-Maleh, H.; Ayati, A.; Davoodi, R.; Tanhaei, B.; Karimi, F.; Malekmohammadi, S.; Orooji, Y.; Fu, L.; Sillanpää, M. Recent Advances in Using of Chitosan-Based Adsorbents for Removal of Pharmaceutical Contaminants: A Review. J. Clean. Prod. 2021, 291, 125880. [Google Scholar] [CrossRef]
- Kebede, T.G.; Dube, S.; Nindi, M.M. Biopolymer Electrospun Nanofibres for the Adsorption of Pharmaceuticals from Water Systems. J. Environ. Chem. Eng. 2019, 7, 103330. [Google Scholar] [CrossRef]
- Januário, E.F.D.; Fachina, Y.J.; Wernke, G.; Demiti, G.M.M.; Beltran, L.B.; Bergamasco, R.; Vieira, A.M.S. Application of Activated Carbon Functionalized with GO for Efficient Removal of COVID-19 Treatment-Related Pharmaceuticals from Water. Chemosphere 2022, 289, 133213. [Google Scholar] [CrossRef] [PubMed]
- Mahmoodi, H.; Fattahi, M.; Motevassel, M. GO–Chitosan Hydrogel for Adsorptive Removal of Diclofenac from Aqueous Solution: Preparation, Characterization, Kinetic and Thermodynamic Modelling. RSC Adv. 2021, 11, 36289–36304. [Google Scholar] [CrossRef]
- Azizian, S. Kinetic Models of Sorption: A Theoretical Analysis. J. Colloid Interface Sci. 2004, 276, 47–52. [Google Scholar] [CrossRef]
- Weber, W.J.; Morris, J.C. Kinetics of Adsorption on Carbon from Solution. J. Sanit. Eng. Div. 1963, 89, 31–59. [Google Scholar] [CrossRef]
- Murcia-Salvador, A.; Pellicer, J.A.; Rodríguez-López, M.I.; Gómez-López, V.M.; Núñez-Delicado, E.; Gabaldón, J.A. Egg By-Products as a Tool to Remove Direct Blue 78 Dye from Wastewater: Kinetic, Equilibrium Modeling, Thermodynamics and Desorption Properties. Materials 2020, 13, 1262. [Google Scholar] [CrossRef]
- Nethaji, S.; Sivasamy, A.; Mandal, A.B. Adsorption Isotherms, Kinetics and Mechanism for the Adsorption of Cationic and Anionic Dyes onto Carbonaceous Particles Prepared from Juglans Regia Shell Biomass. Int. J. Environ. Sci. Technol. 2013, 10, 231–242. [Google Scholar] [CrossRef]
- Johra, F.T.; Lee, J.-W.; Jung, W.-G. Facile and Safe Graphene Preparation on Solution Based Platform. J. Ind. Eng. Chem. 2014, 20, 2883–2887. [Google Scholar] [CrossRef]
- Abebe, B.; Murthy, H.C.A.; Amare, E. Summary on Adsorption and Photocatalysis for Pollutant Remediation: Mini Review. J. Encapsulation Adsorpt. Sci. 2018, 08, 225–255. [Google Scholar] [CrossRef]
- Farghali, A.A.; Bahgat, M.; El Rouby, W.M.A.; Khedr, M.H. Preparation, Decoration and Characterization of Graphene Sheets for Methyl Green Adsorption. J. Alloys Compd. 2013, 555, 193–200. [Google Scholar] [CrossRef]
- Pholosi, A.; Naidoo, E.B.; Ofomaja, A.E. Intraparticle Diffusion of Cr(VI) through Biomass and Magnetite Coated Biomass: A Comparative Kinetic and Diffusion Study. South Afr. J. Chem. Eng. 2020, 32, 39–55. [Google Scholar] [CrossRef]
- Falahian, Z.; Torki, F.; Faghihian, H. Synthesis and Application of Polypyrrole/Fe3O4 Nanosize Magnetic Adsorbent for Efficient Separation of Hg2+ from Aqueous Solution. Glob. Chall. 2018, 2, 1700078. [Google Scholar] [CrossRef]
- Kyzas, G.Z.; Koltsakidou, A.; Nanaki, S.G.; Bikiaris, D.N.; Lambropoulou, D.A. Removal of Beta-Blockers from Aqueous Media by Adsorption onto GO. Sci. Total Environ. 2015, 537, 411–420. [Google Scholar] [CrossRef]


| Sl. No | Pseudo 1st Order | Pseudo 2nd Order |
|---|---|---|
| 1. | K1 = 0.208 min−1 | K2 = 0.055 g mg−1 min−1 |
| 2. | qe = 19.220 mg g−1 | qe = 46.490 mg g−1 |
| 3. | R2 = 0.885 | R2 = 0.999 |
| Sl. No | Temperature (K) | ΔG° (KJ mol−1) | ΔH° (KJ mol−1) | ΔS° (J K−1 mol−1) |
|---|---|---|---|---|
| 1. | 298.150 | −26.852 | ||
| 2. | 313.150 | −27.234 | −16.984 | 33.000 |
| 3. | 333.150 | −28.002 |
| Sl. No | Langmuir Isotherm | Freundlich Isotherm |
|---|---|---|
| 1. | KL = 0.766 L mg−1 | KF = 5.014 L mg−1 |
| 2. | qM = 81.300 mg g−1 | n = 5.235 |
Disclaimer/Publisher’s Note: The statements, opinions and data contained in all publications are solely those of the individual author(s) and contributor(s) and not of MDPI and/or the editor(s). MDPI and/or the editor(s) disclaim responsibility for any injury to people or property resulting from any ideas, methods, instructions or products referred to in the content. |
© 2023 by the authors. Licensee MDPI, Basel, Switzerland. This article is an open access article distributed under the terms and conditions of the Creative Commons Attribution (CC BY) license (https://creativecommons.org/licenses/by/4.0/).
Share and Cite
Bhattacharjee, T.; Bhattacharjee, A.; Deka, D.; Purkait, M.K.; Chowdhury, D.; Majumdar, G. Adsorption Characteristics of Cetirizine on Graphene Oxide. Sustain. Chem. 2023, 4, 209-223. https://0-doi-org.brum.beds.ac.uk/10.3390/suschem4020016
Bhattacharjee T, Bhattacharjee A, Deka D, Purkait MK, Chowdhury D, Majumdar G. Adsorption Characteristics of Cetirizine on Graphene Oxide. Sustainable Chemistry. 2023; 4(2):209-223. https://0-doi-org.brum.beds.ac.uk/10.3390/suschem4020016
Chicago/Turabian StyleBhattacharjee, Tuhin, Arnab Bhattacharjee, Deepmoni Deka, Mihir Kumar Purkait, Devasish Chowdhury, and Gitanjali Majumdar. 2023. "Adsorption Characteristics of Cetirizine on Graphene Oxide" Sustainable Chemistry 4, no. 2: 209-223. https://0-doi-org.brum.beds.ac.uk/10.3390/suschem4020016