

Adding Sustainability in Analytical Chemistry Education through Monitoring Aquarium Water Quality

1
Department of Analytical Chemistry, Complutense University of Madrid, Avda. Complutense s/n, 28040 Madrid, Spain
2
Department of Science, Social Science and Mathematics Education, Complutense University of Madrid, C/Rector Royo Villanova, 1, 28040 Madrid, Spain
*
Author to whom correspondence should be addressed.
Sustain. Chem. 2023, 4(3), 282-303; https://0-doi-org.brum.beds.ac.uk/10.3390/suschem4030021
Submission received: 29 May 2023
/
Revised: 5 August 2023
/
Accepted: 7 August 2023
/
Published: 10 August 2023
(This article belongs to the Collection New and Unconventional Strategies in Sustainable Chemistry Education at All Levels)
Abstract
:This paper introduces a captivating topic for upper-level analytical chemistry capstone projects, focusing on aquarium water analysis. This provides a more comprehensive understanding of the role of analytical chemistry towards sustainability and its environmental, economic, societal and education dimensions. Regarding the crucial role of maintaining optimal aquarium water quality for the welfare of aquatic life, students are tasked with envisioning and executing the measurement of key parameters, including pH, ammonium, nitrite, and nitrate contents. This hands-on experience not only engages students in real-world applications, but also allows them to delve into essential analytical chemistry principles. They carefully select measurement methods, considering factors such as instrument availability, ease of use, precision and sensitivity requirements, sample size, and matrix effects. Besides fostering the acquisition of technical and soft skills, one notable aspect of this type of project is the exceptionally high student satisfaction. Furthermore, the project’s outcomes have proven to be significant predictors of learning achievements. Additionally, it lays the foundation for exploring potential designs of aquaponics systems and fosters interdisciplinary projects, expanding the practical applications in the field of chemistry education. Overall, these projects exemplify enriching and engaging educational experiences that empower students with valuable skills and knowledge while encouraging them to explore novel avenues in analytical chemistry.
1. Introduction
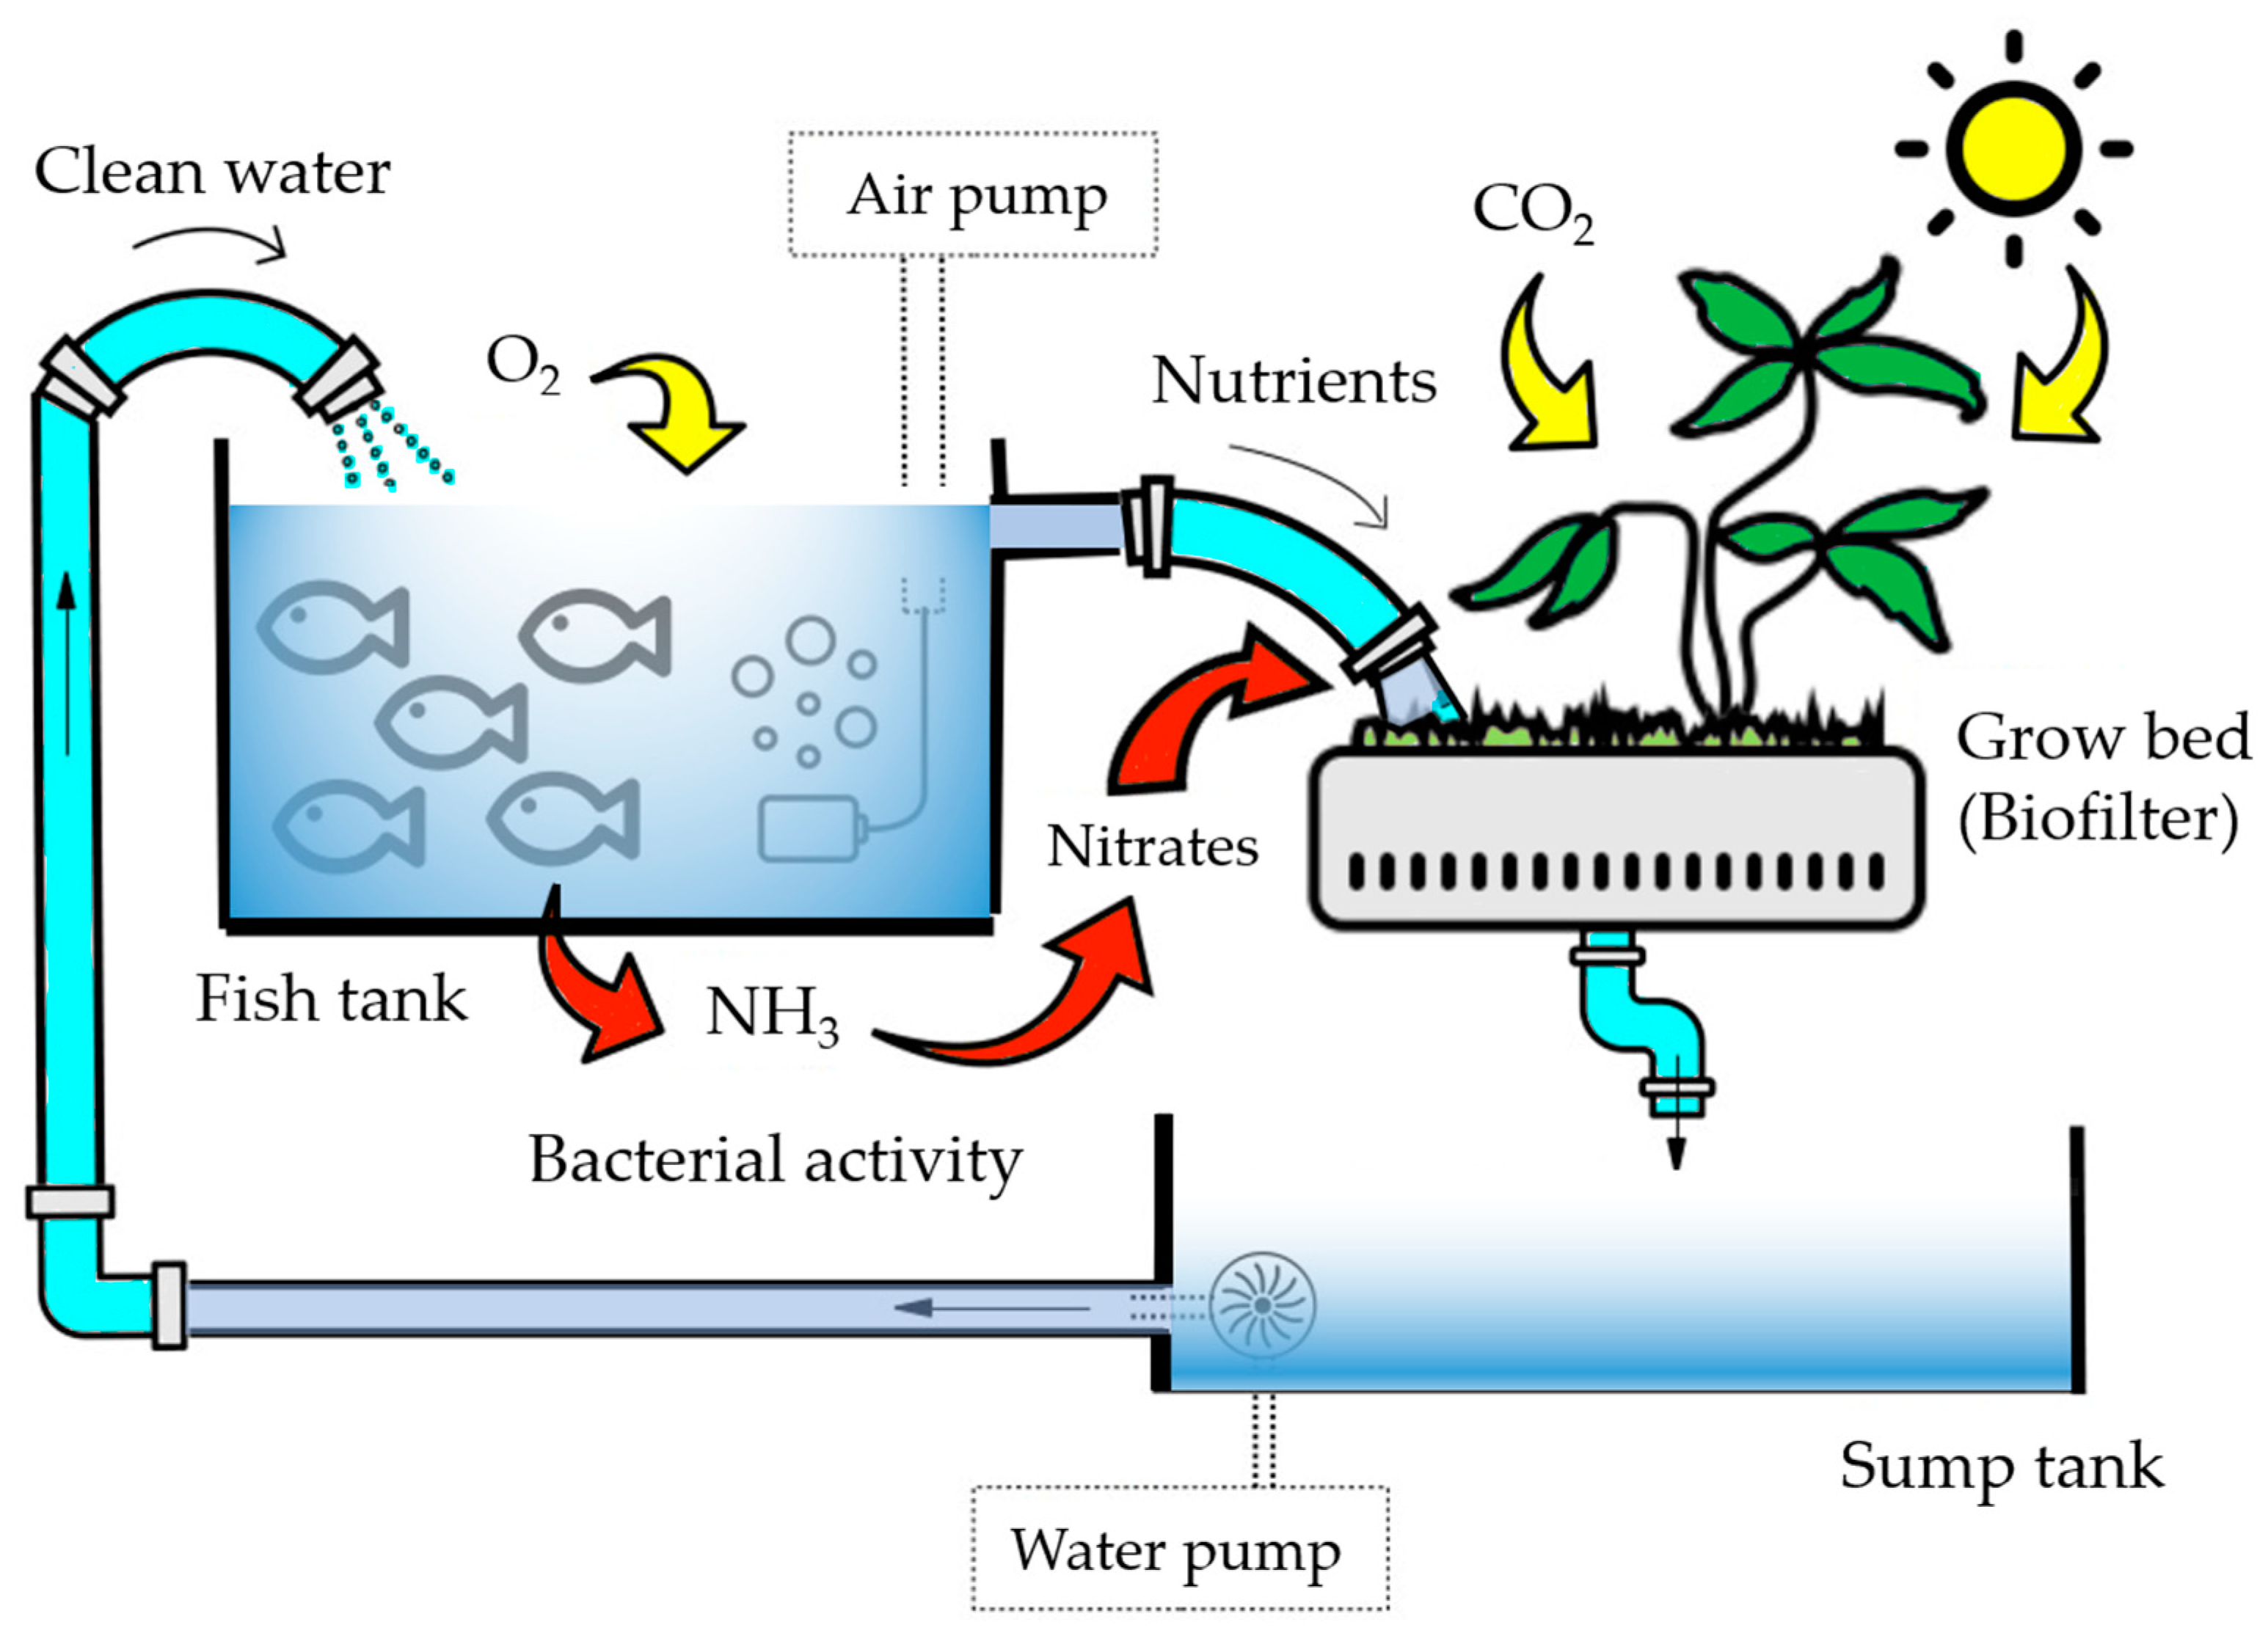
University-level chemical education to a great extent focuses on disciplinary skill training, content coverage, and preparation for final examinations [1]. However, this is not incompatible with using real-world examples to illustrate the relevance of chemistry to students’ everyday lives [2]. Actually, exposing students to real-world chemistry may illustrate chemical concepts and principles while providing connections between everyday life issues and the topics facilitated in the classroom. Students often express dissatisfaction with the absence of the aforementioned connections in their educational experiences. Thus, introducing an interdisciplinary topic as a proposal could lead to more favorable educational outcomes compared to traditional laboratory exercises [3,4]. Notably, there has been a growing interest in interdisciplinary higher education over the years, as a cross-disciplinary approach enables a more comprehensive understanding [5,6]. In line with this idea, one can find in the literature interesting undergraduate interdisciplinary projects based on water chemistry and the use of water samples from various sites along a river, lakes, surface water and groundwater in urban areas, seawater, sewage water, swimming pool water or just drinking water [7,8,9,10,11,12,13,14,15]. Clearly, the context of water presents a valuable opportunity to engage students in analytical methods and foster environmental awareness, shaping them into responsible citizens [16]. For instance, certain activities can be focused on addressing the negative impact of climate change [12]. Furthermore, implementing service-learning projects adds an enriching dimension to education, encouraging students to reflect on the broader purpose and significance of their learning process and its potential societal impact [11]. For secondary and high school students, there are also intriguing examples, such as participation in international citizen science projects dedicated to monitoring water quality [16,17,18]. These projects not only offer valuable learning experiences, but also promote the development of an environmentally literate society, by bridging connections between environmental education and other disciplines like chemistry [19]. Notwithstanding, few project-based learning works have focused on the use of aquariums as simplified ecosystem models and exceptional natural environments for laboratory practices in which chemistry skills can be developed [20,21,22,23,24]. These published works deal with seawater aquarium in the context of general chemistry or chemical engineering teaching. Specifically, the program “Chemistry in an Aquarium” proposed marine aquariums for the interdisciplinary teaching of chemistry [23], while Keaffaber et al. designed a marine aquarium as a model system for a general chemistry class [24]. Nonetheless, freshwater aquariums can serve as a viable alternative to saltwater aquariums or natural bodies of freshwater, particularly when incorporated into an aquaponics system—a dynamic combination of fish and plant production within a recirculating environment, see Figure 1. Although saline aquaponics is being considered by some authors, very little research on this topic has been explored and freshwater aquaponics is the most widely accepted aquaponics technique [25].
From an educational point of view, aquaponics based on freshwater aquariums (as an aquaculture unit) might provide an excellent tool with which to integrate several disciplines and promote the training of systemic competencies [26]. Systems thinking is a promising way to enhance chemistry education [27]. For instance, students may explore biology via observations of animal and plant life cycles, investigate chemistry while analyzing water quality and apply basic engineering to calculate water flow rates [28]. What is more, the connection with living plants and animals exposes students to the natural processes of ecosystems [28]. Therefore, freshwater aquariums, rather than marine aquariums, enable the inclusion of more complex tasks that require interdisciplinary treatment, in case of expanding the work to the design of aquaponic systems. Consequently, the employment of a freshwater aquarium as a teaching tool for analytical chemistry could be an original and gripping example of the integration of real-world elements into a chemistry lab classroom. Specifically, revolving around the aquarium water quality, given that they are essential to ensure the living conditions of the fish and the plants, analytical parameters i.e., pH and the concentration of some ionic species, should be monitored periodically to maintain a healthy ecosystem and an appropriate balance between the fish waste generation and the plants’ nutrients [29]. Moreover, water is the medium via which all needful macro and micronutrients are transported to plants, as well as the medium thorough which fish receive oxygen.
Colorimetric analyses are commonly employed for water monitoring by using analytical methods and/or commercial testing kits. Amid the selection of suitable methods for the determination of the main water parameters, the evaluation and interpretation of the results from the experimental analyses are critical for the detection of uncontrolled concentration levels, as well as the establishment of corrective actions and the reconditioning of the water quality to keep the aquarium system working properly.
Pedagogically, three key strategies are suggested to promote meaningful chemistry education: incorporating relevant contexts that demonstrate real-world applications, presenting content on a need-to-know basis to focus on essential knowledge, and fostering an environment where students feel that their input is valued [30]. Hence, the use of an aquarium is a challenging framework for teaching analytical chemistry, allowing the principles and experimental procedures related to classical and instrumental analytical methods to be introduced and general topics such as stoichiometry, solution concentrations, unit conversions, redox reactions, acid–base chemistry, and complex formation equilibria to be reviewed. In addition, aquarium-based lab activities offer the perfect blend of exploring an intriguing aquatic-life system while simultaneously applying the corresponding analytical methodologies, including both classical and instrumental methods in the laboratory curriculum. This type of instruction could provide a more realistic image of analytical chemistry according to its fundamental role in the scientific field and its applicability in today’s society; it may furthermore provide an attractive and dynamic resource that increases the interest of students, as the water quality of the aquarium is essential to ensure the living conditions of the fish and the plants that are in it [31,32,33].
2. Materials and Methods
2.1. Final Degree Project Setting
The study program of the BS Chemistry Degree at the Complutense University of Madrid (Spain) includes a final dissertation research project, a BS thesis (450 h), in the last year (usually the fourth). Every department of the Faculty of Chemistry generally offers different topics under the corresponding teacher supervision. During the 2019/2020 and 2020/2021 academic years, the Analytical Chemistry Department offered the topic “Aquarium water quality monitoring” based on the setup of a freshwater aquarium, and its water quality monitoring. Since BS thesis students must individually perform their final project, the proposed teaching–learning experience was carried out with one student for each academic year, although both students were supervised by the same tutor. These students had completed three compulsory subjects before starting their final research project: Analytical Chemistry I (225 h) in the second year dealing with classical (gravimetry and titration) analytical methods; and Analytical Chemistry II (225 h) and Analytical Chemistry III (150 h), both in the third year and related to optical and separation instrumental techniques, respectively.
The desired outcome was to enhance the students’ general, specific and transversal skills (see Table 1) and practices in analytical chemistry in their final BS dissertations [34]. Test subjects were undergraduate students who intended to finish the Chemistry Bachelor by presenting their BS thesis before a chemistry teachers’ panel. This experience was carried out at the student laboratories of the Analytical Chemistry Department at the Complutense University of Madrid (UCM).
It is worth noting that the learning objectives of this type of project assume that students will not only gain theoretical knowledge, but also develop the practical skills and critical thinking abilities essential for success in the field of Analytical Chemistry, as pointed out in Table 1. These objectives were as follows:
- Gain a comprehensive understanding of various analytical techniques in monitoring water quality.
- Identify and analyze key chemical parameters that affect freshwater aquarium water quality.
- Learn the principles of the calibration and standardization of analytical instruments, ensuring accurate and reliable measurements.
- Develop skills in proper sample collection, preservation, and preparation techniques to maintain the integrity of the water samples during analysis.
- Understand the importance of quality assurance and control in analytical chemistry to minimize errors and ensure data accuracy.
- Practice interpreting analytical data, understanding the implications of different parameter levels on aquarium health and making informed decisions based on the results.
- Develop problem-solving abilities to troubleshoot and resolve analytical challenges that may arise during the course of the project.
- Demonstrate a commitment to laboratory safety, understanding potential hazards associated with specific analytical techniques and how to mitigate them.
- Enhance research skills by conducting literature reviews on aquarium water quality, staying up-to-date with current research, and effectively communicating findings via reports and presentations.
- Collaborate effectively in a team environment, assigning roles and responsibilities, and working together to achieve project goals.
- Explore the impact of aquariums on the environment and explore ways to maintain water quality in an eco-friendly manner.
- Apply the analytical chemistry principles learned in the course to real-world applications and problem-solving in the field of aquarium keeping and water-quality management.
- Understand the ethical considerations involved in aquarium keeping, including responsible pet ownership, conservation, and promoting animal welfare.
For the students’ assessment, their tutor assessed the student’s final dissertation, taking into account different criteria (see Table 2), from 0 to 10. In addition, the students had to procced with an oral defense of their dissertation in front of a panel of Chemistry teachers of different areas of Chemistry. The overall goal was the public presentation and defense of the study. During this act, the teachers explored, with the candidate, the methodology, findings and conclusions revealed by the student’s study. In this way, the examiners could obtain a more extensive insight into the student’s work; they assessed, independently, the student’ oral defense and dissertation using the descriptors listed in Table 2, from 0 to 10 as well. The final mark was given by applying the following weighting: 30% from tutor and 70% regarding examiners (35% written dissertation and 35% oral presentation).
2.2. Theoretical Framework
Through the literature review, the students were expected to develop the ability to select the key water parameters for monitoring, and choose appropriate analytical methods for their analysis. However, it was important for the teacher(s) to provide valuable guidance regarding the physicochemical parameters, organic matter, the nitrogen cycle, and nutrient considerations.
2.2.1. Physicochemical Parameters
To begin with, temperature is an important parameter for aquarium fishes, plants, and bacteria. It influences both the dissolved oxygen (DO) and toxicity (ionization) of ammonia. Thus, high temperatures have less DO and more unionized (toxic) ammonia [35].
Regarding pH, the aquarium pH is controlled by the carbonate buffer system [24]. Many water quality parameters are affected, including ammonia and ammonium concentrations [36]. Therefore, pH levels should be monitored frequently.
Concerning the salinity—the concentration of salts in water—electrical conductivity and/or total dissolved solids are habitually used for the measurement of the total amount of nutrient salts in the water. It is influenced by temperature and pH, and it affects both freshwater fish and plants [35].
With respect to the solids in water, these can be determined as total solids, suspended solids, dissolved solids, fixed solids, volatile solids and/or settleable solids. A high TSS (total suspended solids) concentration is indicative of poor water quality. Therefore, this parameter can be considered as an indicator of the water turbidity and/or contamination [37].
Finally, one of the key water quality parameters is water hardness. Calcium and magnesium salts, which generally are present in water as bicarbonates or sulfates or chlorides, cause water hardness. Carbonate hardness, also known as alkalinity, is a measure of the buffering capacity of water. It has a unique relationship with pH, impacting the pH level. In fact, the carbonate and bicarbonate present in the water can neutralize the acids created naturally in the aquarium and keep the pH at the constant values required for fish, plants, and bacteria [35].
2.2.2. Organic Matter
The amount of organic matter in the aquarium can be measured by the estimation of the chemical oxygen demand. The biochemical oxygen demand (BOD) is the oxygen consumed by aerobic microorganisms as they break down organic material. While BOD shares similarities with COD in terms of measuring organic compounds, it primarily focuses on quantifying biologically active organic matter. Even if COD is less associated with natural processes and is completely artificial, COD tests offer rapid analysis and provide a result that could be used as a basis for calculating a reasonably accurate and reproducible estimate of the oxygen-demanding properties of water samples. The BOD test requires five days of analysis; it is difficult to reproduce and is also affected by the temperature, water pH, type of inorganic substances in water, and amount and type of organic substance.
In addition, the presence of certain kinds of microorganisms affects the growth of aerobic bacteria [38]. In this teaching–learning experience, the COD test, and the permanganate index (IMn) method in particular, was selected as an indicator of the potential of water to be polluted by organics and reduced inorganic substances, such as nitrite, ferrite and sulfide [39]. The COD test yields the total quantity of oxygen that is required for the oxidation of organic material to carbon dioxide. High COD values are not desirable for fish health and aquatic habitats. Therefore, it must be kept low by maintaining the effective filtering of solids and the regular cleaning of the water tank [40].
2.2.3. Nitrogen Cycle
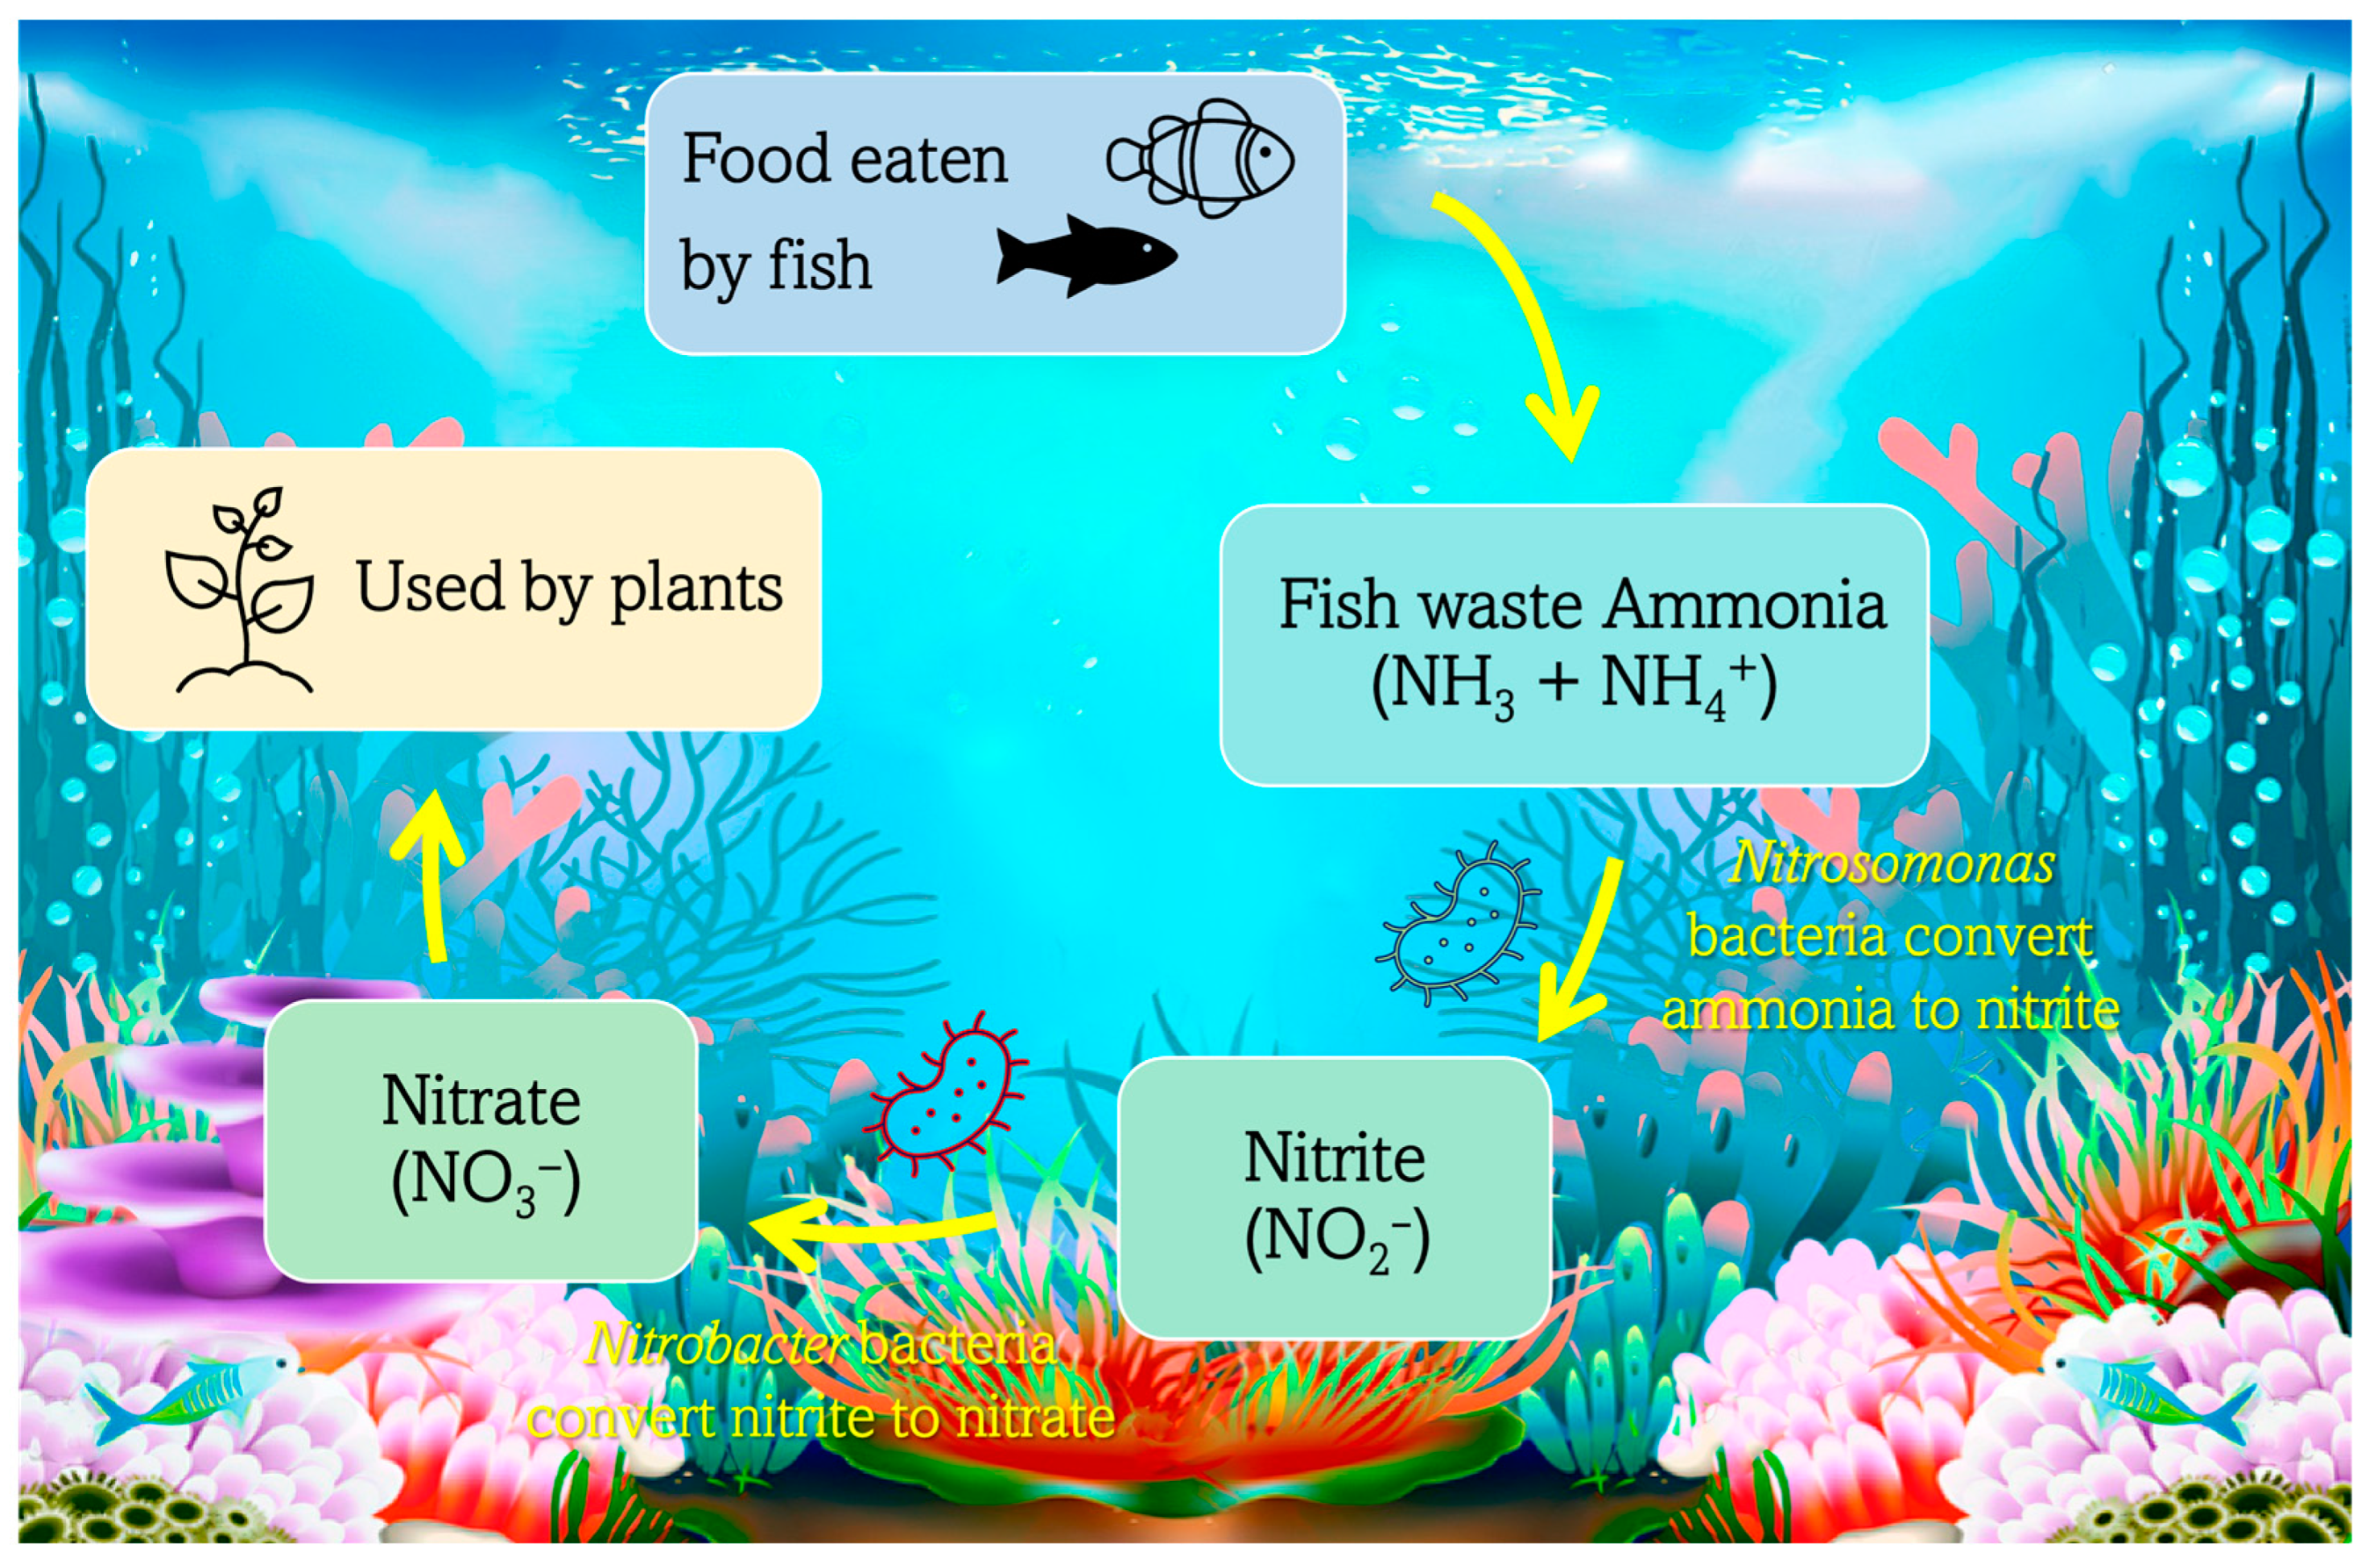
Taking into consideration the nitrogen cycle, nitrogen is one of the most critical water parameters because it is required by all life and is part of all proteins. All four forms of nitrogen involved in the aquarium cycle (NH3, NH4+, NO2−, NO3−) can be determined using colorimetric and spectrophotometric methods. Ammonia and nitrite are toxic to fish, while the nitrate content is the reason for algae growth and plant nutrients [35]. Figure 2 shows a schematic representation of the N cycle in an aquatic system.
2.2.4. Nutrients
Regarding macro and micronutrients, plants within the aquatic system need several nutrients; these are required for the enzymes that facilitate the photosynthesis needed for both growth and reproduction. Thus, phosphorous and potassium are needed by the plants in relatively large amounts, while iron is a micronutrient required in trace amounts. Over time, a perfectly balanced aquarium may become deficient in certain nutrients, most often iron or potassium. Deficiencies in these nutrients are a result of the composition of the fish feed, which does not necessarily provide everything needed for plant growth [35].
2.3. Project Development
2.3.1. Design and Setup of a Freshwater Aquarium
A freshwater aquarium with a capacity of about 55 L can be set up using a glass aquarium as a fish tank (55 × 30 × 34.8 cm) to facilitate the work of the students; see Figure 3. A filter system, a water pump with a flow regulator, a heater (50 W) with a thermostat, and a thermometer must be added. The mentioned filter could incorporate a set of filtrating cartridges, such as fiber (retaining the smaller polluting particles),activated carbon (removing dissolved organic waste, bad odors and toxins), coarse foam (promoting the biological decomposition of pollutants), and some natural product with a high porosity, like clay pebbles (providing optimum conditions for bacterial growth). In other words, the filtration system should carry out the biological, mechanical, and chemical filtration of the fresh water, both at the surface and on the bottom of the aquarium. Likewise, the tank should be constantly aerated and may include LED lights directly above the aquarium that may be continuously illuminated, e.g., 12 h per day.
The type and number of fish depends on the tank capacity, because any overload of the system would affect the water parameters and then the health of the aquarium. For instance, three guppies (Poecilia reticulata) and two peppered catfish (Corydoras paleatus) can be introduced into the tank, and flake food can be added daily in measured amounts. Since they are highly adaptable and thrive in several different environmental and ecological conditions, guppies are one of the most popular freshwater aquarium fish species. In addition, guppies are livebearers, and they reproduce very easily. In fact, after a month, several juvenile guppies could be born. On the other hand, peppered catfish are highly appreciated by aquarists for their eating habits, as they continuously search for all kinds of edible organic matter, thus removing any matter that can decompose and contaminate the water; they thus indirectly perform a cleaning task. The aquarium also may contain small ornamental plants such as Anubias barteri, which are one of the more popular and resilient of the freshwater aquarium plants.
Incorporating a freshwater aquarium as a didactic tool demands careful consideration, with strong commitment required from the educators and/or technicians involved for its successful implementation. Beyond the initial setup and routine maintenance, this commitment becomes especially crucial when navigating factors like the school’s summer break or extended holidays. During these periods, special arrangements and dedicated attention are imperative in order to safeguard the well-being of the aquatic ecosystem and its inhabitants. Close collaboration between educators and technicians is essential in order to establish effective contingency plans, delegate responsibilities, or even explore the possibility of temporary foster care for the aquarium during extended breaks. By proactively addressing these challenges, the educational potential of the aquarium can be fully realized, thus fostering a captivating learning experience.
2.3.2. Identification of Water Quality Parameters
The students guided by their supervisor must review the scientific literature to identify the most important water quality parameters and their range, which to some extent are determined by the fish species and the types of plants. Indeed, each organism in the aquarium (fish, plant, and bacteria) possesses a specific tolerance concentration range [35]. Therefore, a concentration level compromise is required to maintain a balanced ecosystem. As an example, the parameters that may be proposed by the students for the water quality measurements are temperature, pH, electrical conductivity (EC), total suspended solids (TSS), water hardness, chemical oxygen demand (COD), ammonium, nitrite, nitrate, phosphate, iron(III), and potassium contents [24,29,35,38,40].
It is convenient to understand the effect of each parameter on the organisms in the aquarium, as well as the possible interrelation between them. For instance, carbonates and bicarbonates influence the pH value, which seriously affects the conversion of non-toxic ammonium ion to toxic ammonia. Both ammonia and ammonium ion can be oxidized to nitrites, which are toxic to fish at low concentrations, and nitrites can be oxidized to nitrates, which are generally tolerated by living organisms [14]. In particular, shifts in the water’s pH have an impact on the biological activity of the nitrifying bacteria and their ability to convert ammonia and nitrite [35]. Thus, the ammonia toxicity, expressed as the total ammonia (the sum of NH3 and NH4+), increases with the water’s pH [36].
2.3.3. Water Analysis
The continuous monitoring of water parameters is essential to ensure the well-being of aquatic life [31,32,33]. Consequently, it becomes imperative to measure several key parameters using standard methods to maintain the required water quality. These methods must be selected by considering which instruments of measurement are available, their relative ease of use, the precision and sensitivity required, the number of samples and/or matrix effects. Temperature, pH, and EC can be measured using a thermometer, a portable digital pH meter, and a handheld conductivity meter, respectively. Total suspended solids (TSS) can be determined via the vacuum filtration of water aliquots (250 mL) through weighed standard glass-fiber filters (pore size 0.45 µm), the evaporation of the filtrates in an oven at 103–105 °C for one hour, and then filter-cooling in a desiccator until constant weight is reached [37].
The total water hardness, and the total calcium and magnesium content, can be measured via complexometric titration, using samples buffered at pH 10, with a standard EDTA solution (0.001 M) [41,42]; meanwhile, COD is determined via the permanganate index (IMn) method, performing a back-redox titration with sodium oxalate (0.005 M) and a previously standardized KMnO4 solution (0.002 M) [39,43].
Spectrophotometric methods can be employed for the quantitative analysis of ammonium using the Nessler method, nitrate, nitrite, phosphate using the vanadomolybdophosphoric acid colorimetric method, and iron(III) using the thiocyanate method [37,44]. For absorbance measurements in the experimental colorimetric determinations, a UV–Vis spectrophotometer could be employed. Potassium can be determined via flame emission photometry at a wavelength of 766 nm [37] using an atomic absorption spectrometer operating in the flame emission mode. Comprehensive experimental analysis procedures for a freshwater aquarium can be found in Appendix A. This section provides detailed insights into the methods employed for the study, allowing readers to gain a deeper understanding of the research process. The information presented in Appendix A is essential for replicating the experiments and verifying the results obtained in the study.
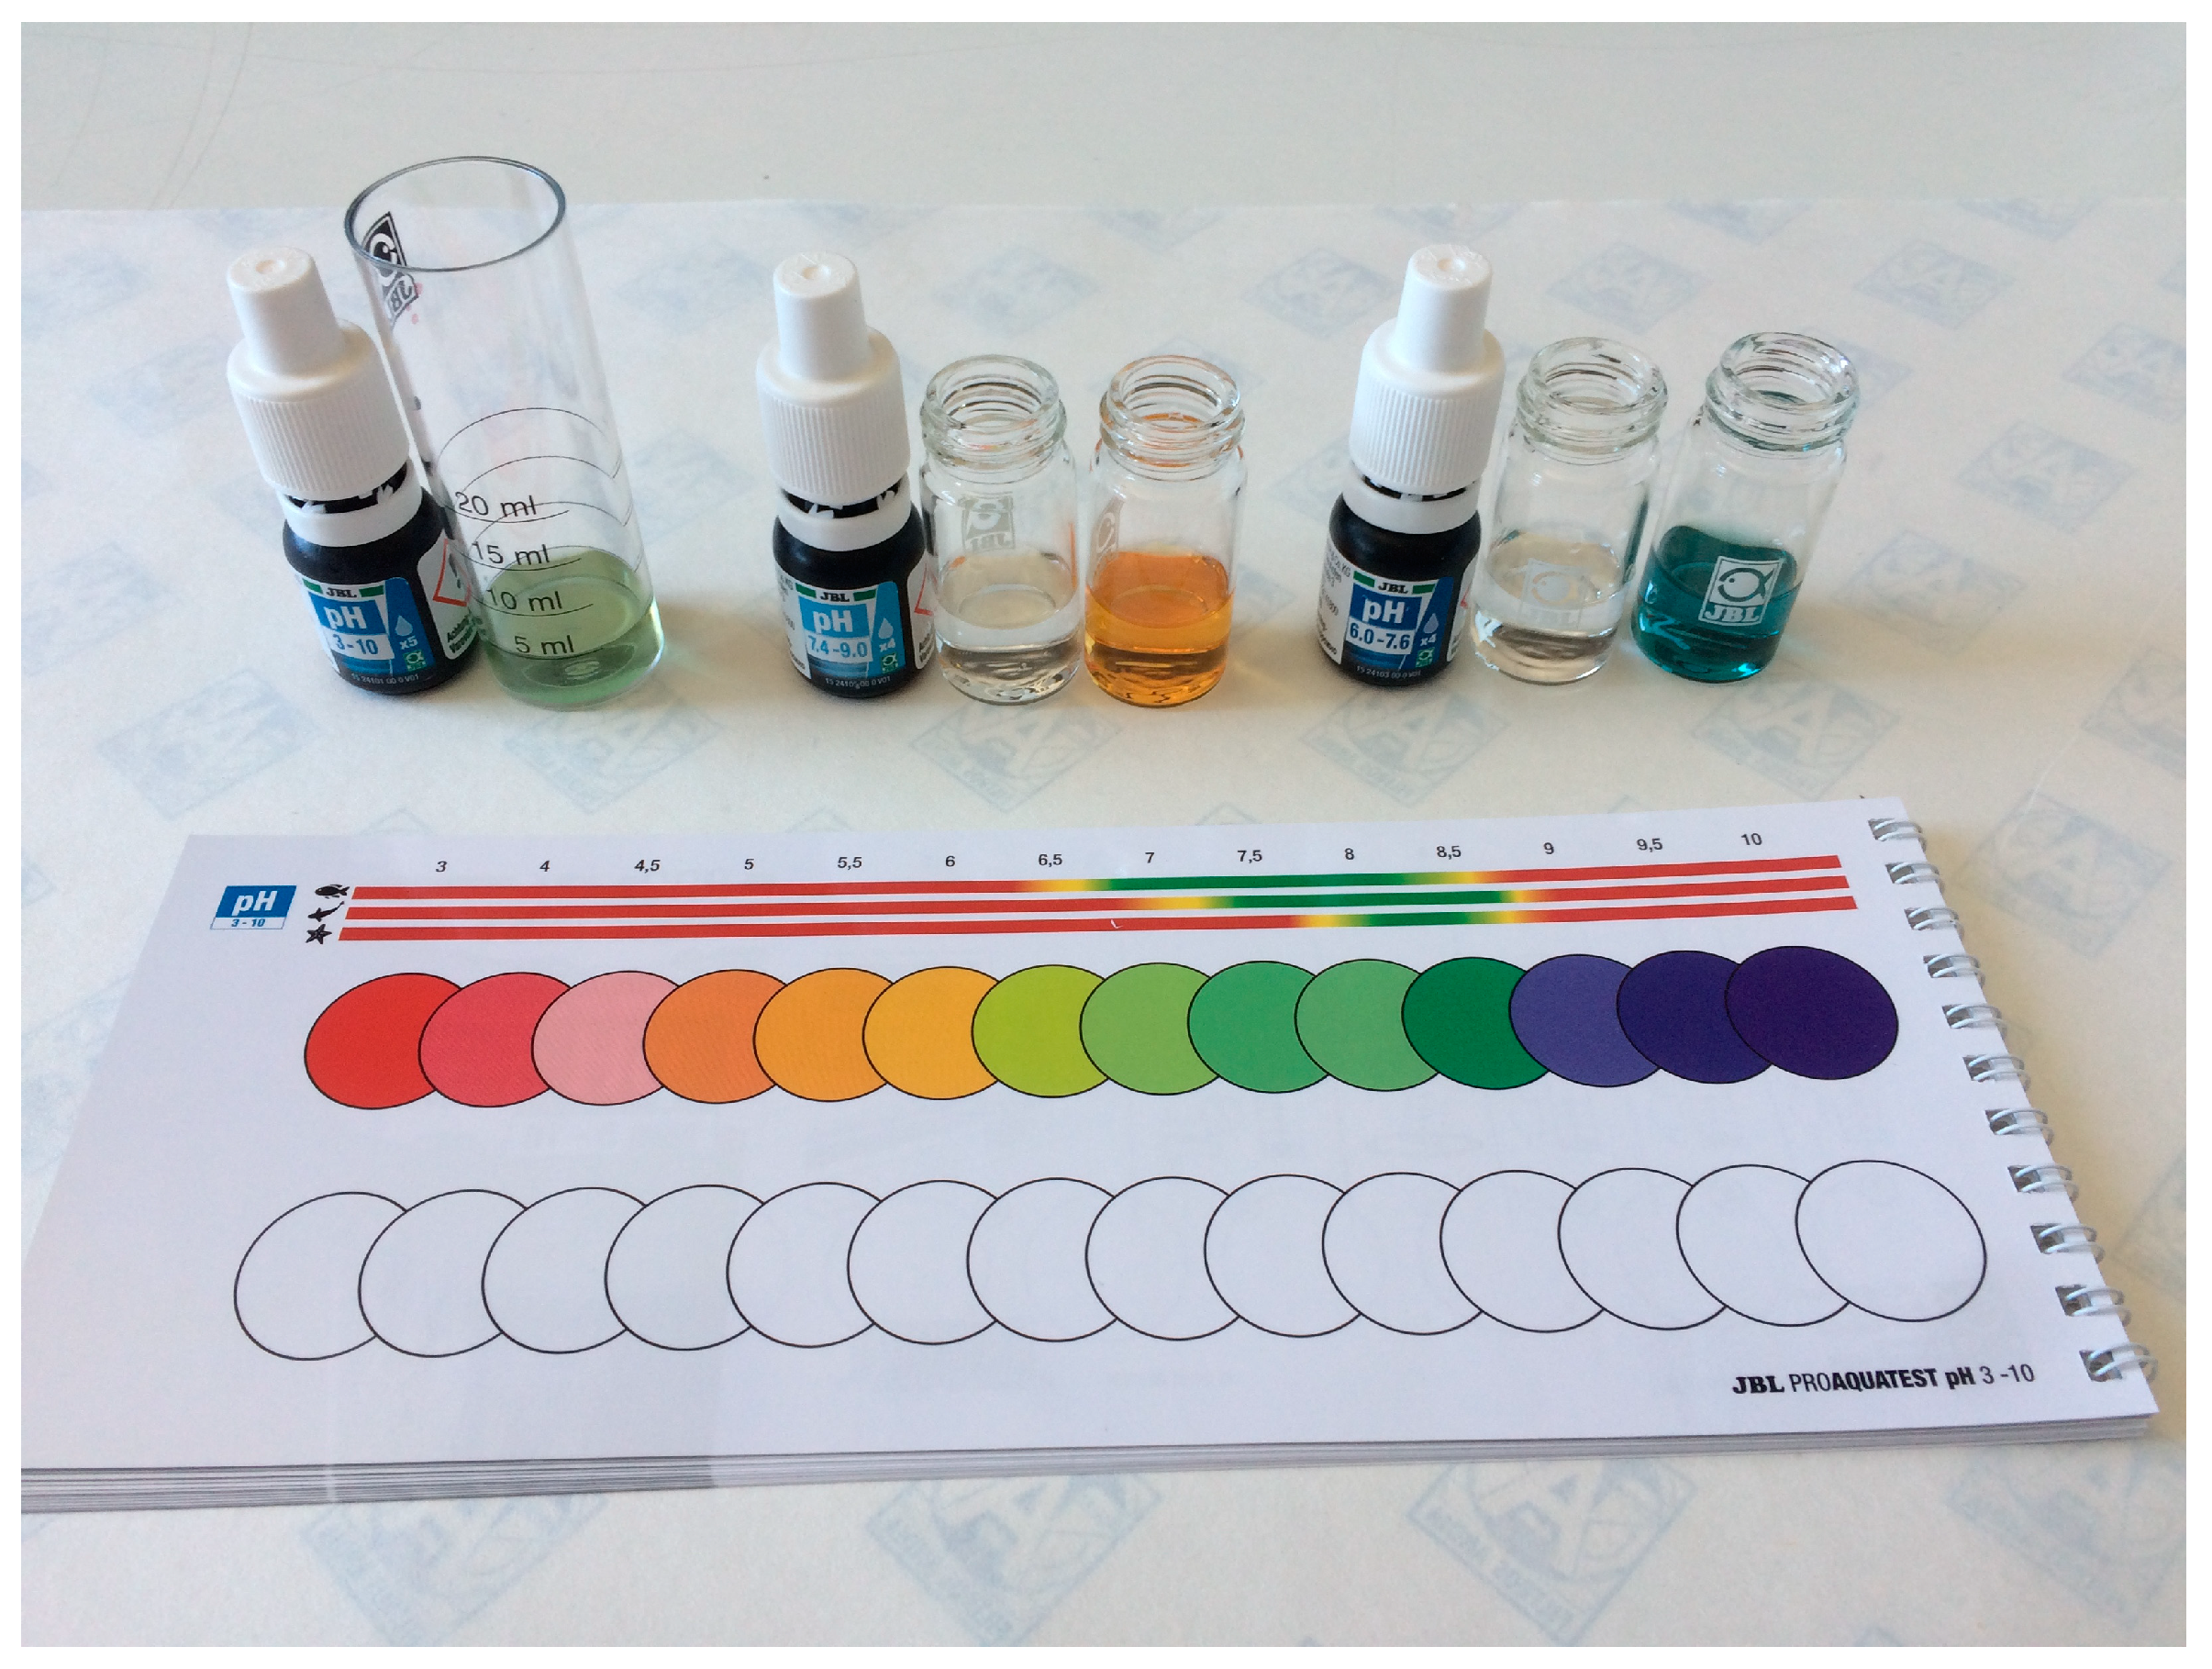
Additionally, commercial aquarium water testing kits are available to measure the pH level, total hardness and carbonate hardness (°dH), and ammonium/ammonia, nitrite, nitrate, phosphate, silicates (silicic acid), iron, copper, and oxygen concentrations (mg L−1). These aforesaid tests, see Figure 4, must be carried out according to the supplier instructions [45].
2.3.4. Data Analysis and Statistical Treatment
External calibration must be applied for quantifying purposes in the instrumental methods, and calibration curves should be prepared. Then, linearity should be evaluated in terms of the determination coefficients (R2), and calibration curve equations should be obtained via the analysis of analytical signals via least squares linear regression.
Each measurement should be performed in quintuplicate. The results obtained from the aquarium water analysis should be expressed as the mean values and the 95% confidence intervals of the test results. The precision and repeatability can be estimated using relative standard deviation (RSD, %). The identification and rejection of outliers may be performed using the Dixon’s Q-test at a 95% confidence level.
2.3.5. Experimental Implementation
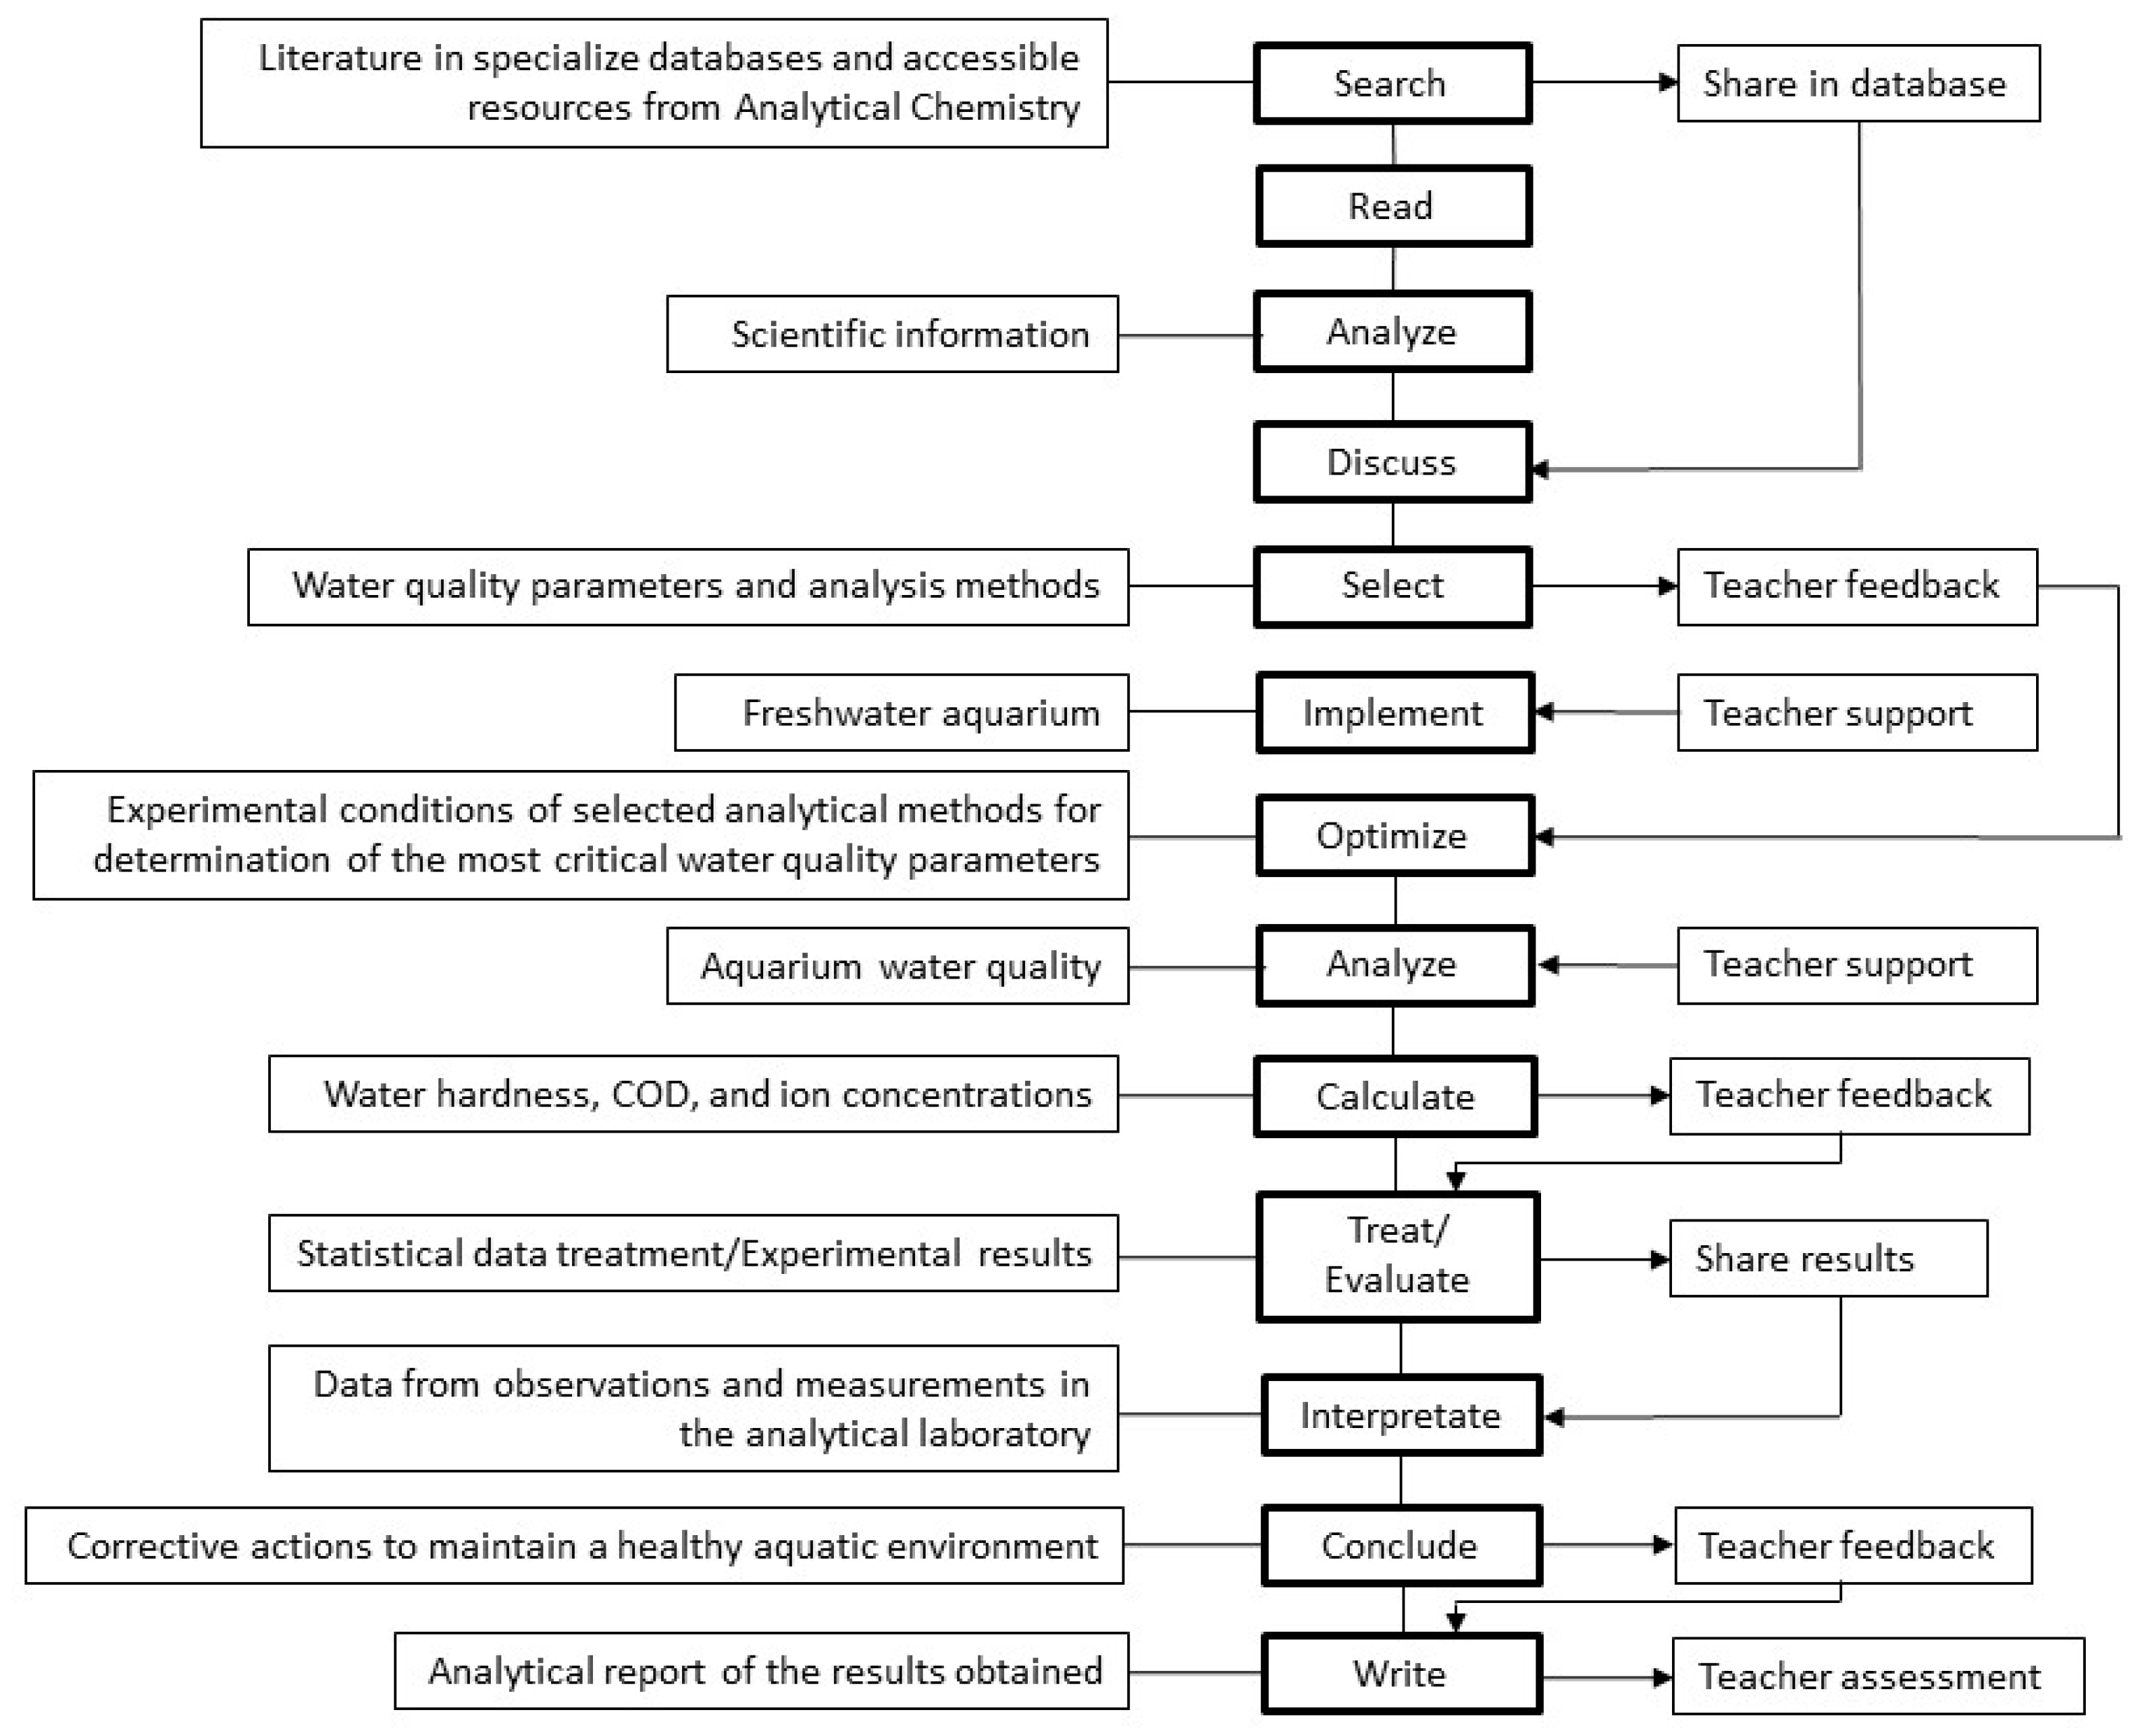
The laboratory procedure can be envisioned following the instructional scaffolding depicted in Figure 5, guided by a comprehensive analysis of the literature, meticulous selection, optimization of the analytical methods, proficiency in scientific instrumentation handling, and the valuable formative feedback provided upon the calculation and evaluation of the acquired data. By sharing results and engaging in collaborative decision making, an engaging and instructive laboratory experience is fostered, further promoting student autonomy in the learning process.
In terms of setting up the freshwater aquarium, it is advisable to test the pH and hardness of the water after filling the tank with tap water, prior to introducing any fish. the preferences of the fish must be kept in mind; for example, guppies prefer a hard-water aquarium (10–20 °dH) with a temperature between 22 and 28 °C and pH levels in the range of 6.5–8.0 [46]. Another issue to be considered is the water source, which has an impact on the water chemistry, because tap or municipal water is often treated with different chemicals, e.g., chlorine and chloramines, to remove pathogens. These chemicals are toxic to fish, plants, and bacteria, and they can seriously affect the aquatic ecosystem [35]. Hence, in the case of tap water, the students must treat it before it is used by adding a commercial dechlorinating chemical and a water conditioner to increase the carbonate hardness. In addition, commercial concentrated aquarium bacteria should be added to diminish the presence of harmful ammonia and nitrite, and to maintain water quality, making it possible to introduce fish after setting up the new aquarium. In addition, the temperature and pH must be frequently monitored by the students to ensure the optimum fish living conditions.
When the aquarium is ready, water aliquots should be taken, and the water quality parameters should be determined based on the analytical methods selected and optimized by the students. Table 3 summarizes a proposal of the analytical parameters that can be measured, and their corresponding methods. As can be observed, classical (gravimetry and titration) and instrumental (potentiometry, spectrophotometry UV–Vis and atomic emission) analytical methods can be performed.
Afterwards, the obtained results need to be analyzed, evaluated, and discussed by the students in accordance with the recommended optimum levels for a freshwater aquarium. If necessary, they should propose corrective actions to address any deviating values.
3. Results and Discussion
3.1. Experimental Activities
This section presents comprehensive details and experimental findings from the dedicated capstone project conducted during the 2020/2021 academic year, as the 2019/2020 project was severely impacted by the COVID-19 pandemic, leading to the inadequate development of activities. Despite the challenges posed by the pandemic, the 2020/2021 project was successfully executed, and this section highlights the essential research conducted, shedding light on effective aquarium water quality monitoring techniques.
Firstly, the first step was the implementation of the freshwater aquarium with the dimensions outlined in Section 2.3.1. The tank was filled with tap water (40°27′02″ N 3°43′04″ O/40.45052778, −3.7186111), which was tested for pH and hardness before introducing fish into the tank. After the measurements were taken by the students, the pH was determined to be 7.53 ± 0.04, and the total hardness was (19 ± 2) mg CaCO3 L−1 (≈ 1.1 °dH). The tap water was treated before being used by adding a commercial dechlorinating chemical, and a water conditioner was used to increase the carbonate hardness. In addition, commercial concentrated aquarium bacteria were added to diminish harmful ammonia and nitrite, and to maintain the water quality, making it possible to introduce fish immediately after setting up the new aquarium. In addition, the temperature and pH were frequently monitored by the students to ensure the optimum fish living conditions (temperature of 25 °C and pH of 8.0 maximum). Once the aquarium was set up, water aliquots were taken after a period of 15 days, and they were stored at −20 °C until analysis.
The water quality parameters, see Table 4, were determined based on the analytical methods selected and optimized by the students. In addition, several calibration curves (n ≥ 5) were prepared in the following concentration ranges: 0.20–4.0 mg L−1 (ammonium), 2.50–100 µg L−1 (nitrite), 0.30–12 mg L−1 (nitrate), 0.05–0.30 mg L−1 (phosphate), 0.05–1.5 mg L−1 (iron), and 0.20–3.0 mg L−1 (potassium).
For comparison purposes, water analysis was also carried out by using a commercial test kit, i.e., the JBL ProAquaTest Lab® kit from JBL GmbH & Co. KG (Neuhofen, Germany) [45], which was employed for measuring the following parameters: pH level in the range of 3.0–10.0 and in the range of 7.4–9.0, the total hardness and carbonate hardness (°dH), and the ammonium/ammonia, nitrite, nitrate, phosphate, silicates (silicic acid), iron, copper, and oxygen concentrations (mg L−1). These assays, see Table 4, indicated acceptable oxygen and copper concentration levels, but a high silicate content. In general, the obtained results from both analytical methods and the test kit agreed. However, lower ammonium and iron contents were determined when using the kit assays.
The obtained results (Table 4) were thoroughly analyzed, evaluated, and discussed by the students, taking into consideration the recommended optimum levels for the freshwater aquarium [35,45,47,48,49]. Please refer to Table 5 for further details.
As can be observed in Table 4, data analysis from the analytical methods revealed a low level of water hardness and low TSS values, suggesting low water turbidity, an appropriate pH and salinity and adequate COD, indicating low organic matter content and/or water contamination, proper concentrations of both phosphate and iron, and low potassium levels. Although low nitrate and nitrite contents were determined, high ammonium concentrations were measured.
Although commercial tests provide quick and convenient water values, the precision of the results obtained using analytical methods led the student to propose the following actions:
- Perform a 50% water change in the aquarium, while ensuring that the pH value of the tap water being added is checked beforehand. The pH of the tap water should not exceed the pH of the aquarium water. This corrective action will also help decrease the high silicate concentration identified using the test kit. It is important to note that ammonia and ammonium (NH4+) exist in a chemical equilibrium in the aquatic system, with their relative concentrations determined by pH. Ammonia (NH3) is the initial product of nitrogenous organic waste decomposition, and its presence often indicates the existence of such wastes [50]. Therefore, the ammonium ion content should be kept as low as possible to prevent conversion into NH3, which is highly toxic to fish.
- Increase the carbonate and total hardness reconditioning of the freshwater by adding hydrogen carbonate conditioners and/or mineral salt mixtures. Carbonate hardness directly affects the pH level. However, it is worth mentioning that the commercial conditioner used resulted in an increase in the pH up to a maximum value of 8.5. Additionally, after water conditioning, an increase in electrical conductivity may also be expected.
- Address the low potassium concentration levels by adding potassium fertilizers to the aquatic system. This action is necessary due to the observed burned spots on older leaves and poor plant vigor.
3.2. Attitude and Perception of the Students
Remarkably, via the students’ written and oral dissertations, it was found that, first, in terms of content and organization, the students highlighted that the literature consulted was relevant and comprehensive and helped them to prepare their experiments based on published results, and the laboratory resources were well-organized and managed. Secondly, another positive issue pointed out by students in their final reports was their interaction with the teacher, who helped them master the chemistry skills they need to succeed, e.g., providing support in the form of outlines, recommended documents, templates, guides, storyboards, or key questions. Among other skills, data analysis and the evaluation of the water quality parameters, including the determination of potential adjustments to keep the aquarium in steady-state conditions, enhanced the development of the students’ critical thinking. Certainly, given the impact of the regulation of the water parameters on the health of the aquatic life, the students improved their ability to select the appropriate techniques and methods in order to obtain accurate and reliable analytical results. Furthermore, regarding the impact of the experimental activities on the students’ environmental awareness, these enabled the students to realize the contribution of analytical chemistry to preserving our natural resources and to achieving sustainable development, which can be supported with some other examples collected in their literature, such as alternative food production systems based on aquaculture and aquaponics [35].
A similar experience was conducted for 29 pre-service teachers at the Faculty of Education (UCM), although only using commercial water testing kits; after completing a course devoted to the Essentials and Didactics of Chemistry, and participating in a satisfaction survey specifically designed for this purpose, the participants unanimously agreed with the assertion that, despite the required effort to implement an aquaponic system, this resource could greatly assist Elementary Education teachers in motivating their students to engage with science. In fact, the students expressed that their interest in learning new sustainable approaches and strategies had significantly increased. Among the comments regarding what intrigued them the most about working on the aquaponic cultivation project, the idea that they actively learned about alternative “sustainable methods” stood out, alongside the collaborative nature of the activity [51].
4. Conclusions
Via the aquarium water quality experience, students are presented with a unique opportunity to delve deeply into the chemical processes that underpin the maintenance of a healthy aquatic environment and their interconnectedness with broader ecological systems. This hands-on experience in a Final Degree Project context yields multiple benefits, allowing students to contextualize and apply fundamental scientific facts, concepts, and theories, while exploring classical and instrumental analytical techniques, such as gravimetry, titration, UV–Vis spectrophotometry, and emission photometry. These analytical techniques become relevant in the analysis of the physicochemical parameters crucial for water monitoring, including hardness, chemical oxygen demand, ammonium, nitrate, nitrite, phosphate, iron, and potassium concentrations. Moreover, beyond theoretical learning, actively engaging in the setup and maintenance of a freshwater aquarium empowers students to develop practical skills that find real-life applications. This interactive approach not only immerses students in the learning process, but also nurtures their ability to tackle real-world scenarios with confidence.
In essence, this paper offers adaptable content with which to promote sustainability across environmental, economic, societal, and educational dimensions by integrating aquaponics and/or freshwater aquariums into chemistry classes. These experiential learning opportunities have the potential to generate superior educational outcomes compared to traditional laboratory exercises, all while nurturing interdisciplinary learning. In the realm of Analytical Chemistry, students can acquire essential knowledge of vital analytical techniques and gain valuable insights into the unique challenges related to chemical analysis for aquatic ecosystems.
Author Contributions
Conceptualization, N.R.-C. and J.P.-M.; methodology, N.R.-C.; software, N.R.-C.; validation, N.R.-C.; formal analysis, N.R.-C.; investigation, N.R.-C. and J.P.-M.; resources, N.R.-C. and J.P.-M.; data curation, N.R.-C.; writing—original draft preparation, N.R.-C. and J.P.-M.; writing—review and editing, N.R.-C. and J.P.-M.; visualization, N.R.-C. and J.P.-M.; supervision, N.R.-C. and J.P.-M.; project administration, J.P.-M.; funding acquisition, J.P.-M. All authors have read and agreed to the published version of the manuscript.
Funding
This research was funded by the Complutense University of Madrid (Spain), Didactic Innovation Project number 181/2019 and Service-Learning Project 2021 “EDECUA”.
Institutional Review Board Statement
Not applicable.
Informed Consent Statement
Not applicable.
Data Availability Statement
The data presented in this study are available upon request from the corresponding author.
Acknowledgments
We acknowledge with gratitude the financial support of the Complutense University of Madrid (Spain).
Conflicts of Interest
The authors declare no conflict of interest.
Appendix A
This appendix contains details of the analysis methods used for freshwater aquariums.
Appendix A.1. Total Suspended Solids (TSS) Dried at 103–105 °C
- Principle: A well-mixed water sample is filtered through a weighed standard glass-fiber filter and the residue retained on the filter is dried to a constant weight at 103 to 105 °C. The increase in the weight of the filter represents the total suspended solids.
- Procedure: A volume of 250 mL of water was filtered under a vacuum through weighed standard glass-fiber filters (pore size 0.45 µm). The filtrates were evaporated in an oven at 103–105°C for one hour, and then the filter was cooled in a desiccator until constant weight was reached.
- Calculation:where
- A = weight of filter + dried residue, mg, and
- B = weight of filter, mg
Appendix A.2. Total Hardness—EDTA Titration Method
- Principle: Ethylenediaminetetraacetic acid and its sodium salts (EDTA) form a chelated soluble complex when added to a solution of specific cations. When a small amount of Eriochrome Black T dye is added to an aqueous solution containing calcium and magnesium ions at a pH of 10.0, the solution becomes wine-red. If EDTA is added as a titrant, the calcium and magnesium will be complexed. When all of the magnesium and calcium has been complexed, the solution turns to a blue color, marking the end point of the titration.
- Reagents:Buffer solution: dissolve 6.8 g of ammonium chloride (NH4Cl) in 60 mL of concentrated ammonium hydroxide and dilute to 100 mL with Milli-Q water.Standard EDTA solution 0.01 M: weigh 1.8612 g of analytical reagent-grade disodium ethylenediaminetetraacetate dihydrate, dissolve in Milli-Q water, and dilute to 500 mL.Standard EDTA titrant, 0.001 M: take 50 mL of the EDTA 0.01 M solution and dilute to 500 mL with Milli-Q water.
- Procedure: To 50 mL of water sample add 100 mL of Milli-Q water, 10 mL of buffer solution and a spatula tip of Eriochrome Black T into a 250 mL conical flask. Add standard EDTA titrant slowly, with continuous stirring, until the last reddish tinge disappears. At the end point, the solution is blue.
- Calculation:where
- V EDTA = mL titration for water sample
- C EDTA = molarity standard EDTA titrant
- MW CaCO3 = molecular weight of the compound, and
- V sample = water sample volume
Appendix A.3. Total Calcium and Magnesium Content
- Principle: The total calcium and magnesium content are determined according to calcium and magnesium hardness. The total hardness of the water sample should be established as described above. For the determination of magnesium hardness, calcium ions are removed from the water sample via precipitation as a calcium carbonate. Thus, only magnesium is titrated with AEDT at pH 10. The calcium hardness is estimated according to the difference in the AEDT volumes used in the titration of the total and magnesium hardness.
- Reagents:Buffer solution: dissolve 6.8 g of ammonium chloride (NH4Cl) in 60 mL of concentrated ammonium hydroxide and dilute to 100 mL with Milli-Q water.Standard EDTA solution 0.01 M: weigh 1.8612 g of analytical reagent-grade disodium ethylenediaminetetraacetate dihydrate, dissolve in Milli-Q water and dilute to a final volume of 500 mL in a graduated flask.Standard EDTA titrant, 0.001 M: take 50 mL of the EDTA 0.01 M solution and dilute to 500 mL with Milli-Q water.Sodium-oxalate-saturated solution: dissolve 1.5 g sodium oxalate in 50 mL milli-Q water.
- Procedure: For the determination of magnesium hardness, add a volume of 2.5 mL of buffer solution and 2.5 mL of sodium oxalate saturated solution to 50 mL of water sample. Wait 10 min for the total precipitation of calcium carbonate. Then, filter the mixture thorough a paper filter into a 250 mL conical flask and wash the filter paper carefully with 2 × 2 mL milli-Q water. Add 10 mL of buffer solution and a spatula tip of Eriochrome Black T to the same 250 mL flask and titrate with 0.001 M AEDT solution to a faint blue color.
- Calculation:where
- V EDTA Mg hardness = mL titration for water sample in the determination of magnesium hardness
- V EDTA total hardness = mL titration for water sample in the determination of total hardness
- C EDTA = molarity standard EDTA titrant
- AW Mg = magnesium atomic weight
- AW Ca = calcium atomic weight, and
- V sample = water sample volume
Appendix A.4. Chemical Oxygen Demand (COD)—Permanganate Index Method
- Principle: The basis of the method is the oxidation of the acidified water sample by heating with potassium permanganate for 10 minutes in a boiling water bath. In hot acid solution, chemical oxidation via potassium permanganate results in the reduction of the permanganate Mn(VII) ion to the manganous Mn(II) ion. The remaining unreduced permanganate is determined via the addition of excess sodium oxalate and the back-titration of the excess oxalate with potassium permanganate.COD is estimated thorough the permanganate index (IMn), defined as the mass concentration of oxygen equivalent to the amount of permanganate ion consumed when a water sample is treated with that oxidant under defined conditions.
- Reagents:Potassium permanganate solution 0.05 M: weigh out 1.98 g of potassium permanganate and dissolve in 250 mL of milli-Q water.Potassium permanganate solution 0.002 M: dilute 20 mL of the 0.05 M KMnO4 solution to 500 mL of milli-Q water. This solution must be standardized.Sodium oxalate stock solution 0.02 M (primary standard): dry enough quantity of sodium oxalate Na2C2O4 in an oven at 120 °C for 2 h. Remove and allow to cool in a desiccator. Weigh out 0.6700 ± 0.000l g and dissolve in milli-Q water to one liter in a volumetric flask.Sodium oxalate working solution 0.005 M: pipette out 25 mL of sodium oxalate stock solution (0.02 M) and dilute with water in a 100 mL volumetric flask.
- Procedure: For the standardization of the potassium permanganate solution 0.002 M, add 25 mL of the sodium oxalate stock solution (0.02 M), 5 mL of concentrated sulfuric acid and 50 mL of milli-Q water into a 250 mL conical flask. The solution is heated in a boiling water bath for 30 min and then titrated using the potassium permanganate solution to a faint pink color.Add 100 mL of water sample, 100 mL of milli-Q water and 5 mL of concentrated sulfuric acid into a 250 mL conical flask. Heat the flasks for 10 min in a water bath that has previously been raised to boiling. Add 10 mL of 0.002 M potassium permanganate standardized solution. Add 10 mL of 0.005 M sodium oxalate solution 10 min after the addition of the potassium permanganate reagent. Remove the flask from the water bath and titrate the contents, whilst still hot, with 0.002M potassium permanganate solution to a faint pink color, which persists for 30 s.
- Calculation:where
- V sample = water sample volume
- MW O2 = oxygen molecular weight
- V oxalate = mL of 0.005 M sodium oxalate solution
- C oxalate = concentration of sodium oxalate solution
- V MnO4 = mL of 0.002 M potassium permanganate standardized solution, and
- C MnO4 = concentration of potassium permanganate standardized solution
Appendix A.5. Ammonium
- Principle: Nessler’s reagent [an alkaline solution of potassium tetraiodomercurate(II)] is employed for the colorimetric determination of ammonium ion in water samples. When Nessler’s reagent is added to a dilute ammonium salt solution, the liberated ammonia reacts with the reagent rapidly to form an orange-brown product.
- Reagents:Zinc sulphate solution 0.35 M: dissolve 2.5 g of zinc sulphate in 25 mL of milli-Q water.EDTA reagent: weigh 12.5 g of disodium ethylenediaminetetraacetate dihydrate and 2.50 g of NaOH. Dissolve in 50 mL of Milli-Q water.NaOH solution 5.0 M: dissolve 10 g of NaOH in 50 mL of Milli-Q water.Nessler’s reagent: dissolve 3.5 g of potassium iodide (KI) and 5 g of mercury(II) iodide in 25 mL of NaOH solution 5.0 M and dilute to 50 mL with milli-Q water.Stock ammonium chloride solution 1000 mg L−1: dissolve 0.2965 g of anhydrous NH4Cl, dried at 100 °C, in water, and dilute to 100 mL.Standard ammonium chloride solution 10 mg L−1: take a volume of 0.5 mL from the stock NH4Cl solution and dilute to 50 mL with milli-Q water.
- Procedure: To obtain the external calibration curve, prepare a series of volumetric flasks containing the following volumes of standard ammonium chloride solution diluted to 25 mL: 0.5, 1.25, 2.5, 5.0 and 10 mL. Add 1 drop of EDTA reagent and 1 mL of Nessler’s reagent to each flask. Allow to stand for 10 minutes and measure the absorbance at 400 nm. Prepare similarly a flask containing 0 mL of standard ammonium chloride solution and use it as blank to set zero absorbance on the spectrophotometer.Add 0.5 mL of the zinc sulphate solution 0.35 M and 0.25 mL of the NaOH solution 5.0 M to 50 mL of the water sample. After 10 min, filter to remove the precipitate. Add 1 drop of EDTA reagent and 1 mL of Nessler’s reagent per 25 mL of water sample. Wait 10 min and transfer to a 1 cm spectrophotometer cell and measure the absorbance at 400 nm.
- Calculation: Construct a standard curve by plotting absorbance due to NH4+ against the NH4+ concentration of the standard. The ammonium concentration in the water sample is directly determined via linear interpolation using a calibration curve.
Appendix A.6. Nitrate
- Principle: The determination of nitrate is performed using an ultraviolet (UV) technique that measures the absorbance of NO3– at 220 nm. Since dissolved organic matter also may absorb at 220 nm and NO3– does not absorb at 275 nm, a second measurement made at 275 nm is required to correct the NO3– absorbance value. Acidification with 1N HCl aims to prevent interference from hydroxide or carbonate. Chloride has no effect on the determination.
- Reagents:Stock nitrate solution 300 mg L−1: dry potassium nitrate in an oven at 105 °C for 24 h. Dissolve 0.4887 g in milli-Q water and dilute to 1000 mL. Preserve with 1 mL of CHCl3 per liter of solution.Intermediate nitrate solution 30 mg L−1: dilute 25 mL of stock nitrate solution with 250 mL of milli-Q water. Preserve with 1 mL of CHCl3 per liter of solution.Hydrochloric acid solution, HCl, 1N: dilute 8.30 mL of acid (37.5%) with 100 mL of milli-Q water.
- Procedure: To 50 mL of clear water sample, filtered if necessary, add 1 mL of HCl solution and mix thoroughly. Read absorbance against distilled water set at zero absorbance. Use a wavelength of 220 nm to obtain the NO3– reading and a wavelength of 275 nm to determine interference due to dissolved organic matter.To obtain the external calibration curve, prepare NO3– calibration standards in the range of 0.30 to 12.0 mg L−1 by diluting the following volumes of intermediate nitrate solution to 50 mL: 0.50, 1.0, 2.0, 2.5, 5.0, 10 and 20 mL. Treat NO3– standards in the same manner as samples and measure absorbance at 200 and 275 nm.
- Calculation: For samples and standards, subtract two times the absorbance reading at 275 nm from the reading at 220 nm to obtain absorbance due to NO3–. Construct a standard curve by plotting absorbance due to NO3– against the NO3– concentration of the standard. Using the corrected sample absorbances to obtain sample concentrations directly from standard curve.
Appendix A.7. Nitrite
- Principle: Nitrite is determined via the formation of a reddish-purple azo dye produced at pH 2.0 to 2.5 by coupling diazotized sulfanilamide with N-(1-naphthyl)-ethylenediamine dihydrochloride.
- Reagents:Color reagent: to 80 mL of water add 10 mL of 85% phosphoric acid and 1 g of sulfanilamide. After dissolving sulfanilamide completely, add 0.1 g of N-(1-naphthyl)-ethylenediamine dihydrochloride. Mix to dissolve, then dilute to 100 mL with milli-Q water.Solution is stable for about a month when stored in a dark bottle in a refrigerator.Stock nitrite solution 1000 mg L−1: dry sodium nitrite in an oven at 105 °C for 24 h. Dissolve 0.1500 g in milli-Q water and dilute to 100 mL.Intermediate nitrate solution 10 mg L−1: dilute 0.25 mL stock nitrite solution to 25 mL with milli-Q water.
- Procedure: To obtain the external calibration curve, prepare NO2– calibration standards in the range of 2.5 to 100 µg L−1 by diluting the following volumes of intermediate nitrite solution to 50 mL: 12.5, 25, 50, 125, 250 and 500 µL. Add 2 mL of color reagent to the NO2– standards and measure the absorbance at 543 nm after 20 min.Add 2 mL of the color reagent to 50 mL of the water sample and mix thoroughly. Then, 20 min after adding color reagent to the samples, measure the absorbance at 543 nm.
- Calculation: Prepare a standard curve by plotting the absorbance of standards against NO2– concentration. Compute sample concentration directly from calibration curve.
Appendix A.8. Phosphate
- Principle: Orthophosphate determination is performed using the vanadomolybdophosphoric acid colorimetric method. In a dilute orthophosphate solution, ammonium molybdate reacts under acid conditions to form a heteropoly acid, molybdophosphoric acid. In the presence of vanadium, yellow vanadomolybdophosphoric acid is formed. The intensity of the yellow color is proportional to the phosphate concentration.
- Reagents:Vanadate-molybdate reagent: (1) dissolve 20 g of ammonium molybdate, (NH4)6Mo7O24⋅4H2O, in 400 mL of milli-Q water; (2) dissolve 0.5 g of ammonium metavanadate, NH4VO3, in 300 mL of milli-Q water, and add 300 mL of nitric acid (70%). Mix both solutions and dilute to 1 L.Stock phosphate solution 0.698 g L−1: dissolve in milli-Q water 0.1000 g of anhydrous KH2PO4 and dilute to 100 mL.Intermediate phosphate solution 0.0698 g L−1: dilute 10 mL of stock phosphate solution to 100 mL with milli-Q water.
- Procedure: Prepare a calibration curve in the concentration range between 0.05 and 0.30 mg L−1 by first adding 10 mL of vanadate–molybdate reagent, followed by diluting precise volumes of intermediate phosphate solution (12.5, 37.5, 50.0, 62.5 and 75 µL) to a total volume of 25 mL. Prepare a blank in which 10 mL of vanadate–molybdate reagent is diluted to 25 mL with milli-Q water.Place 5 mL of water sample in a 25 mL volumetric flask. Add 10 mL of vanadate–molybdate reagent and dilute to the mark with milli-Q water.After 10 min, measure the absorbance of the calibration standards and samples using 1 cm cells versus the blank at a wavelength of 420 nm.
- Calculation: Prepare a standard curve by plotting the absorbance of standards against the phosphate concentration. Compute the sample concentration directly from the calibration curve considering the dilution ratio.
Appendix A.9. Iron(III)
- Principle: Iron(III) selectively reacts with thiocyanate to yield a series of intensely red-colored compounds. A large excess of thiocyanate should be used in the colorimetric determination, since this increases the intensity and stability of the color. A strong acid, such as nitric acid, must be present to suppress the hydrolysis of the iron(III) cation.
- Reagents:Standard solution of iron(III) 100 mg L−1: dissolve 0.8640 g of ammonium iron(II) sulphate [(NH4)Fe(SO4)2·12H2O] and 0.864 g of ammonium chloride in 10 mL HCl (37.5%) and 40 mL of milli-Q water. Add 1 mL of nitric acid (70%). Heat to the boiling point and once cooled, dilute to 1 L.Potassium thiocyanate solution 10% (w/v): dissolve 5 g of potassium thiocyanate in 50 mL of milli-Q water.
- Procedure: To obtain the external calibration curve, prepare irone(III) calibration standards in the range of 0.25 to 1.50 mg L−1 by diluting the following volumes of the standard solution of iron(III) to 10 mL: 25, 50, 75, 100 and 150 µL. Add 0.50 mL of HCl (37.5%) and 1 mL of potassium thiocyanate solution to the iron(III) standards. Measure the absorbance at 480 nm versus a blank prepared in the same manner without iron(III).Put 5 mL of water sample into a 10 mL graduated flask. Add 0.5 mL of HCl (37.5%) and 1 mL of potassium thiocyanate solution. Dilute to 10 mL using milli-Q water. Measure the absorbance of the sample solution in a spectrophotometer at 480 nm.
- Calculation: Determine the concentration of the sample solution by comparing it with the values on the reference curve obtained in the same way using different concentrations of the standard iron solution.
Appendix A.10. Potassium
- Principle: Trace amounts of potassium can be determined via flame emission photometry at a wavelength of 766 nm. The sample is nebulized into a gas flame under controlled and reproducible excitation conditions. The emission light intensity measured at 766 nm is approximately proportional to the potassium concentration.
- Reagents:Stock potassium solution 500 mg L−1: dissolve 0.95 g of KCl dried at 110 °C and dilute to 1000 mL with milli-Q water.Standard potassium solution 50 mg L−1: dilute 10 mL of stock potassium solution with water to 100 mL
- Procedure: Prepare a blank and a series of potassium calibration standards in the concentration range of 0.20–3.0 mg L−1. Determine the emission intensity at 766 nm. Aspirate the calibration standards and water sample several times to secure a reliable average reading for each. Construct a calibration curve from the potassium standards. The water sample is analyzed via a direct-intensity measurement.
- Calculation: The potassium concentration is determined via direct reference to the calibration curve. If necessary, dilute the sample and consider the dilution ratio in calculation.
References
- Barak, M.; Carson, K.M.; Zoller, U. The “Chemistry Is in the News” Project: Can a Workshop Induce a Pedagogical Change? J. Chem. Educ. 2007, 84, 1712–1716. [Google Scholar] [CrossRef]
- Jones, M.B.; Miller, C.R. Chemistry in the Real World. J. Chem. Educ. 2001, 78, 484–487. [Google Scholar] [CrossRef]
- Loyo-Rosales, J.E.; Torrents, A.; Rosales-Rivera, G.C.; Rice, C.P. Linking Laboratory Experiences to the Real World: The Extraction of Octylphenoxyacetic Acid from Water. J. Chem. Educ. 2006, 83, 248–250. [Google Scholar] [CrossRef]
- Kozyra, A.; Skrzypczyk, K.; Stebel, K.; Rolnik, A.; Rolnik, P.; Kućma, M. Remote controlled watercraft for water measurement. Measurement 2017, 111, 105–113. [Google Scholar] [CrossRef]
- Piunno, P.A.E.; Boyd, C.; Barzda, V.; Gradinaru, C.C.; Krull, U.J.; Stefanovic, S.; Stewart, B. The Advanced Interdisciplinary Research Laboratory: A Student Team Approach to the Fourth-Year Research Thesis Project Experience. J. Chem. Educ. 2014, 91, 655–661. [Google Scholar] [CrossRef]
- Spelt, E.J.H.; Biemans, H.J.A.; Tobi, H.; Luning, P.A.; Mulder, M. Teaching and Learning in Interdisciplinary Higher Education: A Systematic Review. Educ. Psychol. Rev. 2009, 21, 365–378. [Google Scholar] [CrossRef] [Green Version]
- Georgieva, S.; Todorov, P.; Genova, Z.; Peneva, P. Interdisciplinary Project for Enhancing student’s interest in Chemistry. Bulg. J. Sci. Educ. 2016, 25, 122–136. [Google Scholar]
- Juhl, L.; Yearsley, K.; Silva, A.J. Interdisciplinary Project-Based Learning through an Environmental Water Quality Study. J. Chem. Educ. 1997, 74, 1431–1433. [Google Scholar] [CrossRef]
- Bopegedera, A.M.R.P.; Coughenour, C.L. An Interdisciplinary, Project-Based Inquiry into the Chemistry and Geology of Alkaline Surface Lake Waters in the General Chemistry Laboratory. J. Chem. Educ. 2021, 98, 1352–1360. [Google Scholar] [CrossRef]
- Jung, H.B.; Zamora, F.; Duzgoren-Aydin, N.S. Water Quality Monitoring of an Urban Estuary and a Coastal Aquifer Using Field Kits and Meters: A Community-Based Environmental Research Project. J. Chem. Educ. 2017, 94, 1512–1516. [Google Scholar] [CrossRef]
- Dameris, L.; Frerker, H.; Darrell Iler, H. The Southern Illinois Well Water Quality Project: A Service-Learning Project in Environmental Chemistry. J. Chem. Educ. 2020, 97, 668–674. [Google Scholar] [CrossRef]
- Gawankar, S.; Masten, S.J. Development of an Inexpensive, Rapid Method to Measure Nitrates in Freshwater to Enhance Student Learning. J. Chem. Educ. 2023, 100, 2141–2149. [Google Scholar] [CrossRef]
- Rana, A.; Sajid Jillani, S.M.; Alhooshani, K. Water Quality Characterization Using ASTM Methods in an Undergraduate Advanced Instrumental Analysis Laboratory Course. J. Chem. Educ. 2021, 98, 2919–2926. [Google Scholar] [CrossRef]
- O’Hara, P.B.; Sanborn, J.A.; Howard, M. Pesticides in Drinking Water: Project-Based Learning within the Introductory Chemistry Curriculum. J. Chem. Educ. 1999, 76, 1673–1677. [Google Scholar]
- Amer, M.A.; Luque-Corredera, C.; Bartolomé, E. Study and Research Path for Learning General Chemistry: Analyzing the Quality of Drinking Water. J. Chem. Educ. 2022, 99, 1255–1265. [Google Scholar] [CrossRef]
- Mandler, D.; Blonder, R.; Yayon, M.; Mamlok-Naaman, R.; Hofstein, A. Developing and Implementing Inquiry-Based, Water Quality Laboratory Experiments for High School Students To Explore Real Environmental Issues Using Analytical Chemistry. J. Chem. Educ. 2014, 91, 492–496. [Google Scholar] [CrossRef]
- Kur, A.; Alaanyi, A.T.; Awuhe, S.T. Determination of quality of water used by students of College of Education, Katsina-Ala through physical and electro-chemical parameters. Sci. World J. 2019, 14, 78–83. [Google Scholar]
- Araújo, J.L.; Morais, C.; Paiva, J.C. Developing and Implementing a Low-Cost, Portable Pedagogical Kit to Foster Students’ Water Quality Awareness and Engagement by Sampling Coastal Waters and Analyzing Physicochemical Properties. J. Chem. Educ. 2020, 97, 3697–3701. [Google Scholar] [CrossRef]
- Araújo, J.L.; Morais, C.; Paiva, J.C. Students’ attitudes towards the environment and marine litter in the context of a coastal water quality educational citizen science project. Aust. J. Environ. Educ. 2023, 1–14. [Google Scholar] [CrossRef]
- Grguric, G. Modeling chemical processes in seawater aquaria to illustrate concepts in undergraduate chemistry. J. Chem. Educ. 2000, 77, 495–498. [Google Scholar] [CrossRef]
- Sanchis, R.; Cardona, S.C.; Lo-Iacono-Ferreira, V.G.; Quijada, C. Enhancing coordination among subjects through hands-on laboratory approach. In Proceedings of the 17th International Technology, Education and Development Conference, Valencia, Spain, 6–8 March 2023. [Google Scholar]
- Caskey, R.P. 4-H Marine Aquarium Adult Partner Guide; PUBLICATION #4H434; UF/IFAS Extension: Milton, FL, USA, 2023. [Google Scholar]
- Calascibetta, F.; Campanella, L.; Favero, G. An Aquarium as a Means for the Interdisciplinary Teaching of Chemistry. J. Chem. Educ. 2000, 77, 1311–1313. [Google Scholar] [CrossRef]
- Keaffaber, J.J.; Palma, R.; Williams, K.R. The role of water chemistry in marine aquarium design: A model system for a General Chemistry class. J. Chem. Educ. 2008, 85, 225–230. [Google Scholar] [CrossRef]
- Spradlin, A.; Saha, S. Saline aquaponics: A review of challenges, opportunities, components, and system design. Aquaculture 2022, 555, 738173. [Google Scholar] [CrossRef]
- Junge, R.; Wilhelm, S.; Hofstetter, U. Aquaponic in classrooms as a tool to promote system thinking. In Transmission of Innovations, Knowledge and Practical Experience into Everyday Practice; Maček, M.A., Maček Jerala, M., Kolenc Artiček, M., Eds.; Biotehniški Center Naklo: Naklo, Slovenia, 2014; pp. 234–244. [Google Scholar]
- Paschalidou, K.; Salta, K.; Koulougliotis, D. Exploring the connections between systems thinking and green chemistry in the context of chemistry education: A scoping review. Sustain. Chem. Pharm. 2022, 29, 100788. [Google Scholar] [CrossRef]
- Hart, E.H.; Webb, J.B.; Hollingsworth, C.; Danylchuk, A.J. Managing Expectations for Aquaponics in the Classroom: Enhancing Academic Learning and Teaching an Appreciation for Aquatic Resources. Fisheries 2014, 39, 525–530. [Google Scholar] [CrossRef]
- Harris, T.M. Potentiometric measurements in a freshwater aquarium. J. Chem. Educ. 1993, 70, 340–341. [Google Scholar] [CrossRef]
- Westbroek, H.; Klaassen, K.; Bulte, A.; Pilot, A. Characteristics of Meaningful Chemistry Education. In Research and the Quality of Science Education; Boersma, K., Goedhart, M., de Jong, O., Eijkelhof, H., Eds.; Springer: Dordrecht, The Netherlands, 2005; pp. 67–76. [Google Scholar]
- Yavuzcan Yildiz, H.; Robaina, L.; Pirhonen, J.; Mente, E.; Domínguez, D.; Parisi, G. Fish Welfare in Aquaponic Systems: Its Relation to Water Quality with an Emphasis on Feed and Faeces—A Review. Water 2017, 9, 13. [Google Scholar] [CrossRef] [Green Version]
- Adriano, E.A.; de Oliveira, L.N.; Borrasca, J.C.; de Melo, C.M.R.; Junior, A.F.; de Oliveira, J.E.M. Water Quality Parameters and Their Influence on Fish Health: A Review. Rev. Aquac. 2019, 11, 1109–1126. [Google Scholar]
- Malik, S.; Hussain, S.; Waqas, M.S. Effect of water quality and different meals on growth of Catla catla and Labeo rohita. Big Data Water Resour. Eng. (BDWRE) 2020, 1, 4–8. [Google Scholar] [CrossRef]
- Final Project Guidelines for the Complutense University of Madrid, BS in Chemistry. Available online: https://quimicas.ucm.es/file/gqguia-docente-trabajo-fin-de-grado2020final (accessed on 3 May 2021).
- Somerville, C.; Cohen, M.; Pantanella, E.; Stankus, A.; Lovatelli, A. Small-scale aquaponic food production. In tegrated fish and plant farming. In FAO Fisheries and Aquaculture Technical Paper No. 589; Food and Agriculture Organization of the United Nations: Rome, Italy, 2014; pp. 1–121. [Google Scholar]
- Randall, D.J.; Tsui, T.K.N. Ammonia toxicity in fish. Mar. Pollut. Bull. 2002, 45, 17–23. [Google Scholar] [CrossRef] [PubMed]
- Clesceri, L.S.; Greenberg, A.E.; Eaton, A.D. Standard Methods for the Examination of Water and Wastewater, 20th ed.; American Public Health Association: Washington, DC, USA; American Water Works Association: Denver, CO, USA; Water Environment Federation: Alexadria, VI, USA, 1999; pp. 244–253 (total suspended solids); pp. 494–495 (potassium); pp. 1194–1198 (nitrite); pp. 1198–1200 (nitrate); pp. 1246–1249 (phosphate). [Google Scholar]
- Reeve, R. Introduction to Environmental Analysis, 1st ed.; John Wiley & Sons, Ltd.: Chichester, UK, 2002; pp. 35–75. [Google Scholar]
- Wang, J.P.; Dong, Q.H. Analysis and discussion on the calculation formula of the classical monitoring method of the permanganate index (IMn). J. Educ. Pract. 2018, 9, 1–4. [Google Scholar]
- Thorarinsdottir, R.I. Aquaponics Guidelines; European Union Lifelong Learning Program: Reykjavik, Iceland, 2015; pp. 33–41. [Google Scholar]
- Skoog, D.A.; West, D.M.; Holler, F.J.; Crouch, S.R. Fundamentos de Química Analítica, 8th ed.; McGraw-Hill: Madrid, Spain, 2005; pp. 489–490. [Google Scholar]
- Harris, D.C. Análisis Químico Cuantitativo, 3rd ed.; Reverté: Barcelona, Spain, 2007; p. 277. [Google Scholar]
- ISO 8467:1993; Water Quality—Determination of Permanganate Index. ISO: Geneva, Switzerland, 1993.
- Jeffery, G.H.; Basset, J.; Mendham, J.; Denney, R.C. Vogel´s Textbook of Quantitative Chemical Analysis, 5th ed.; Longman Scientific & Technical: Essex, UK, 1989; pp. 679–680 (ammonium); pp. 690–692 (iron); p. 702 (nitrite); pp. 702–704 (phosphate). [Google Scholar]
- JBL Pro Aquatest Lab. Available online: https://www.jbl.de/?mod=products&func=detail&id=8702&country=us&lang=en#2408400 (accessed on 1 February 2021).
- Hargrove, M.; Hargrove, M. Freshwater Aquariums for Dummies, 2nd ed.; Wiley: Hoboken, NJ, USA, 2006; p. 99. [Google Scholar]
- Person-Le Ruyet, J.; Chartois, H.; Quemener, L. Comparative acute ammonia toxicity in marine fish and plasma ammonia response. Aquaculture 1995, 136, 181–194. [Google Scholar] [CrossRef]
- Chapman, D. Water Quality Assessments: A Guide to the Use of Biota, Sediments and Water in Environmental Monitoring, 2nd ed.; CRC Press: London, UK, 1996; p. 99. [Google Scholar]
- UNECE. Protection of Water Resources and Aquatic Ecosystems; Water Series, No. 1; ECE/ENVWA/31; United Nations Economic Commission for Europe, United Nations: New York, NY, USA, 1993; p. 64. [Google Scholar]
- Manahan, S.E. Environmental Chemistry, 9th ed.; CRC Press: Boca Raton, FL, USA, 2010; p. 166. [Google Scholar]
- Peña Martínez, J.; Pérez López, R. Los cultivos acuapónicos en la formación inicial de maestros. In Proceedings of the XIV Seminario de Investigación en Educación Ambiental: El Papel del Mundo Rural y de los Conocimientos Tradicionales en la Sostenibilidad; Eugenio-Gozalbo, M., Suárez-López, R., Correa-Guimaraes, A., Longueira Matos, S., Eds.; Organismo Autónomo Parques Nacionales. Ministerio para la Transición Ecológica y el Reto Demográfico: Madrid, Spain, 2021; pp. 213–225. [Google Scholar]
Figure 1.
Simplified scheme of an aquaponic system.

Figure 2.
Nitrogen flow chart in an aquatic system.

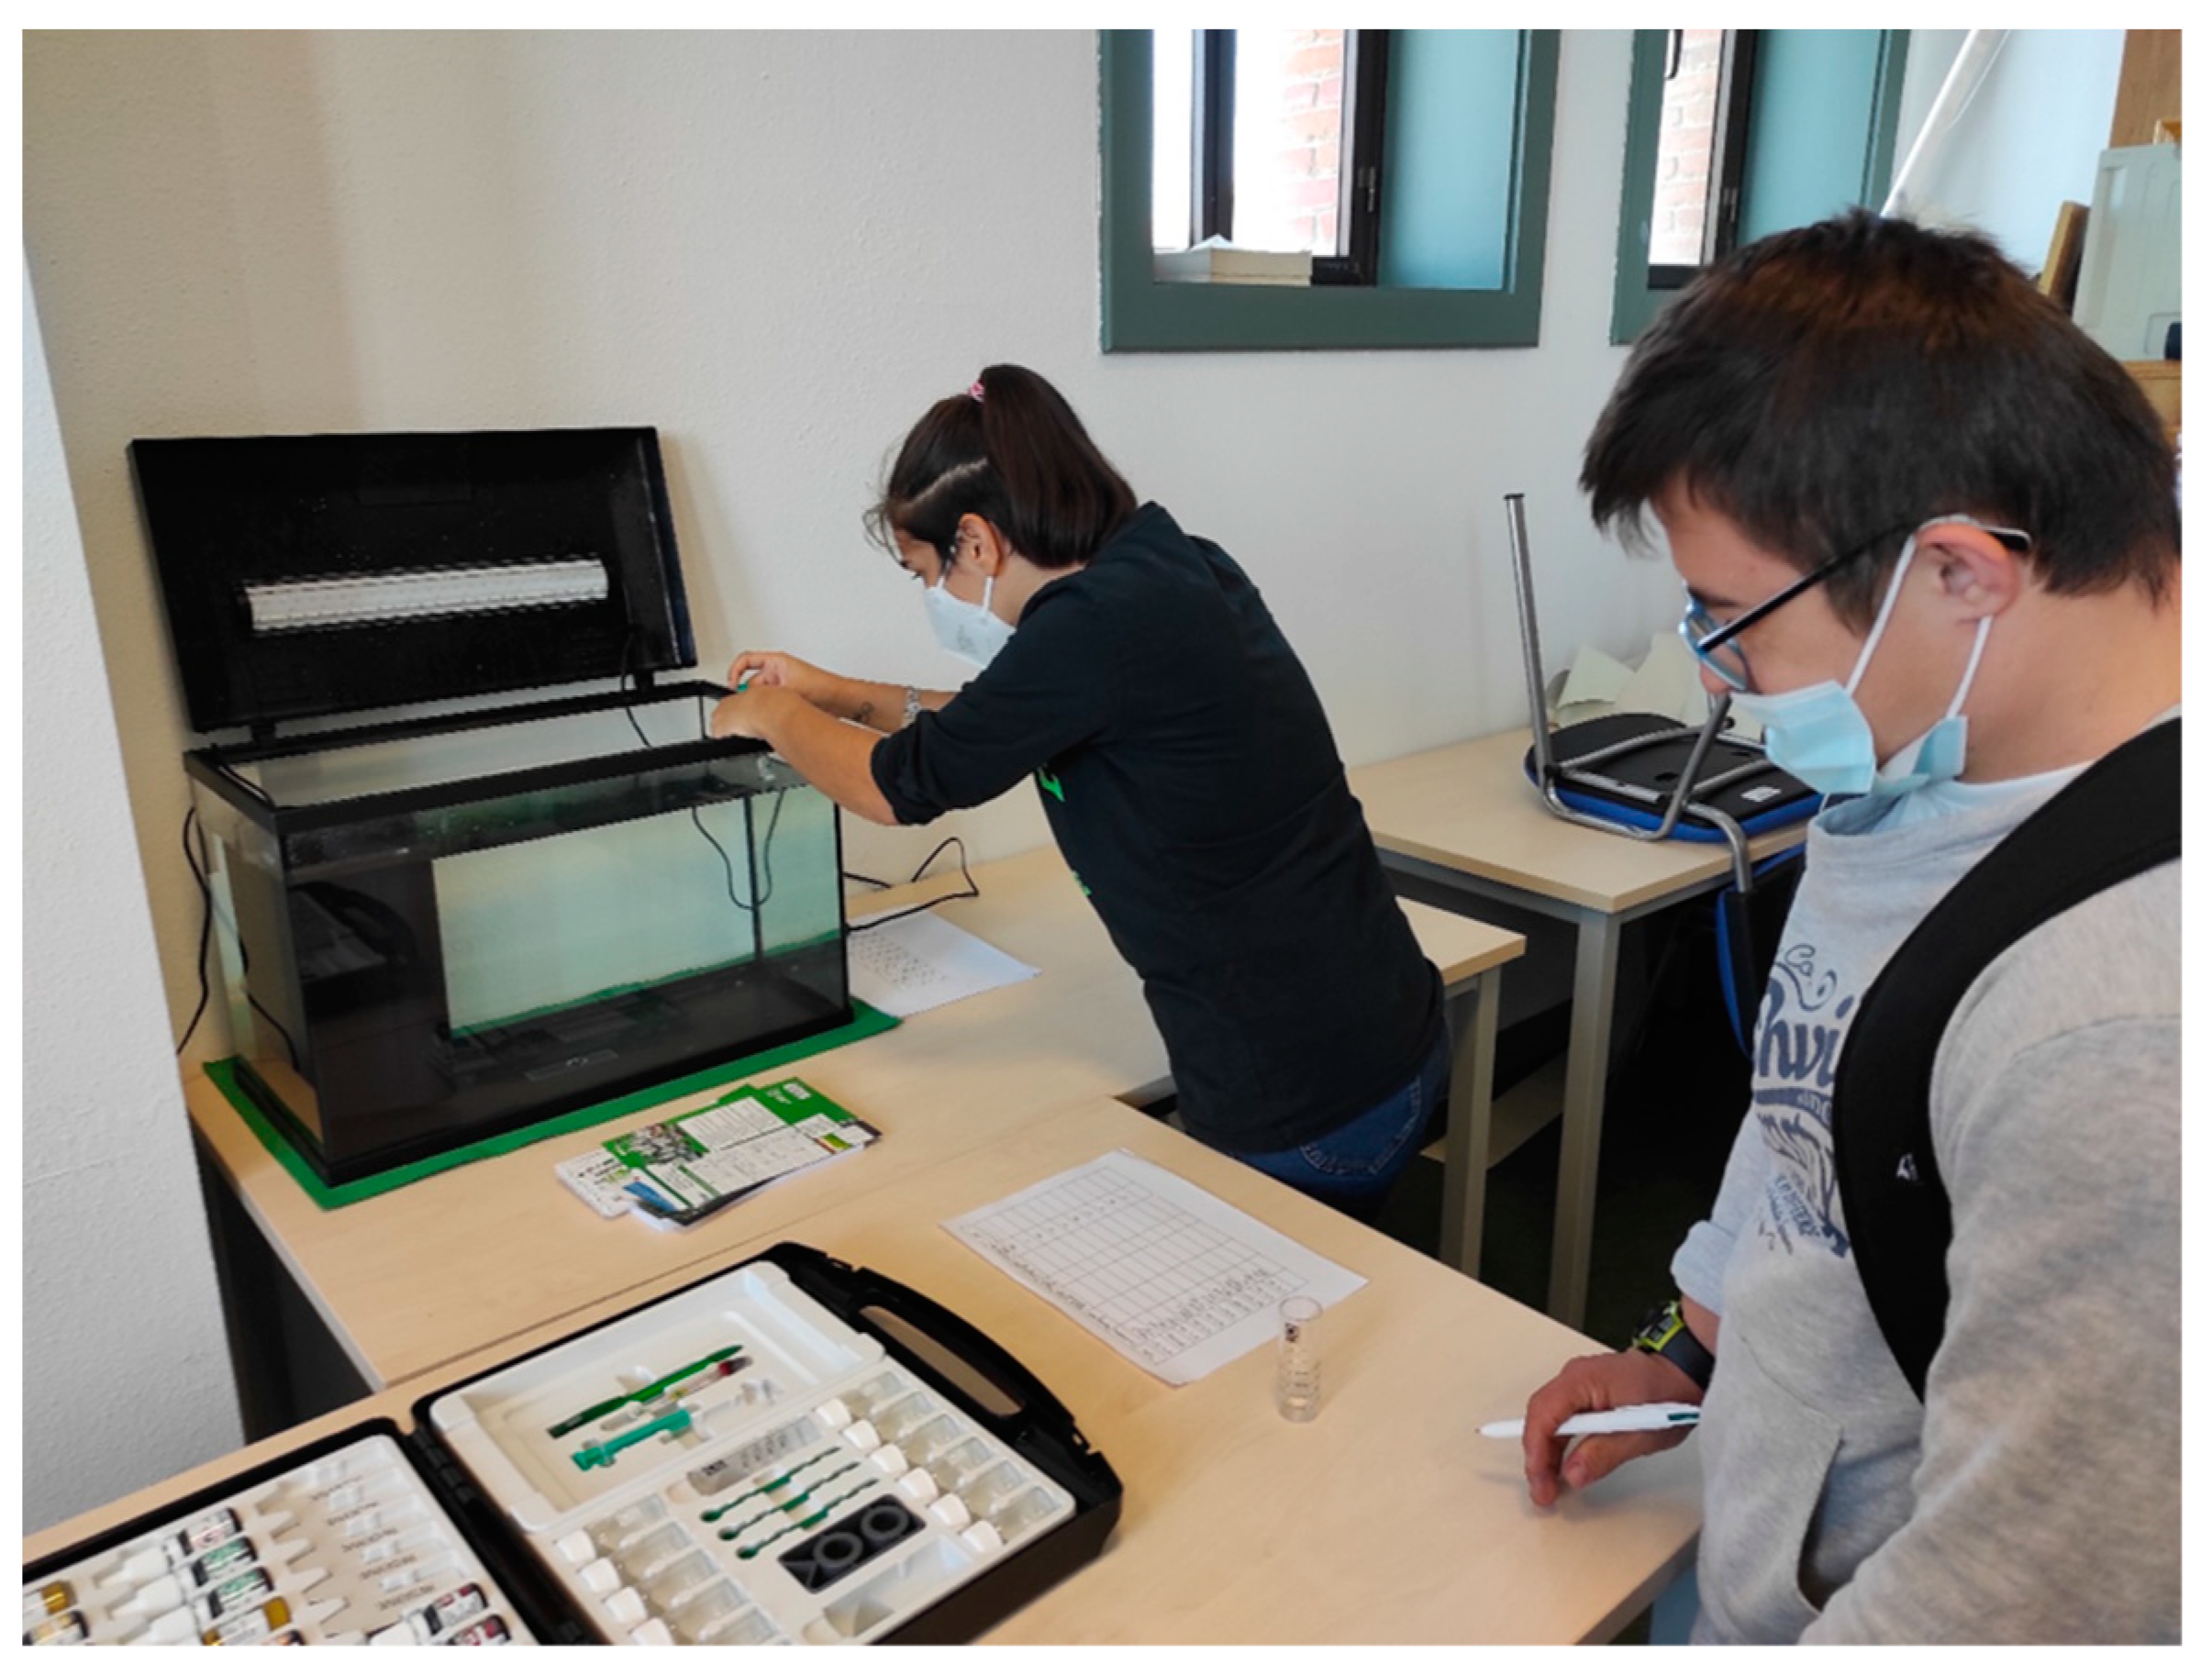
Figure 3.
Students working on the aquarium set up.

Figure 4.
Commercial aquarium water testing kit used to measure pH level.

Figure 5.
Instructional scaffolding used in the laboratory exercise.


Table 1.
General, specific, and transversal skills.
| Type | Description |
|---|---|
| General | Recognize and analyze new problems and envisage strategies to solve them. |
| Evaluate, interpret, and synthesize chemical data and information. | |
| Demonstrate a solid and balanced knowledge base on lab materials and practical skills. | |
| Safely handle chemical materials and recognize and assess the risks in the use of chemical substances and procedures of laboratory. | |
| Interpret data from observations and measurements in the laboratory in terms of their significance and the theories that support them. | |
| Develop appropriate scientific measurement and experimentation practices. | |
| Specific | Apply to chemical analysis the knowledge acquired in the study of chemical equilibrium. |
| Apply to chemical analysis the fundamentals of the main technique’s analysis and separation instruments. | |
| Recognize analytical chemistry as a metrological science that develops, optimizes, and applies measurement processes aimed at obtaining quality analytical chemist information. | |
| Transversal | Prepare and write scientific and technical reports. |
| Demonstrate critical and self-critical reasoning | |
| Adapt to new situations. | |
| Manage quality chemical information, bibliography and databases specialized, and resources accessible via the Internet. | |
| Use the tools and computer programs that facilitate the treatment of experimental results | |
| Communicate using the most common audiovisual media. | |
| Develop work autonomously |
Table 2.
Assessment criteria for students’ final dissertation and oral defense.
| Evaluated Item | Evaluator | Descriptors | Weight (%) |
|---|---|---|---|
| Final dissertation | Student’s tutor | Managing schedules and compliance deadlines | 5 |
| Use of the bibliography | 10 | ||
| Quality of the work | 40 | ||
| Skills progress | 10 | ||
| Attitude: motivation, initiative, responsibility, creativity, receptiveness to criticism, etc. | 10 | ||
| Autonomous learning capacity | 5 | ||
| Knowledge achieved in the field of study | 10 | ||
| Formal aspects of the final report | 10 | ||
| Teachers’ panel | Objectives and methodology | 20 | |
| Results of discussion | 30 | ||
| Conclusions | 10 | ||
| Bibliography | 10 | ||
| Accuracy of the written language | 15 | ||
| Quality of the material | 10 | ||
| English language use | 5 | ||
| Objectives and methodology | 20 | ||
| Oral defense | Teachers’ panel | Structure and content of the presentation | 35 |
| Quality of the presentation | 20 | ||
| Use of language and non-verbal communication | 15 | ||
| Answers to the experts’ questions | 25 | ||
| English language use | 5 |
Table 3.
Measured parameters and methods for controlling aquarium water quality.
| Parameter | Determination Method | Basis of Analytical Method/Reactions | Measurement |
|---|---|---|---|
| EC a | Electrical resistivity | Ability of water to conduct an electric current | Conductivity (µS cm−1) |
| pH | Potentiometric | Potential difference between a hydrogen ion-selective glass and a reference electrode | −log [H+] |
| TSS b | Gravimetric | Increase in the filter weight | Mass (mg) |
| Total water hardness, total calcium and magnesium ions | Complexometric titration | Ca2+ + AEDT ⇄ CaY2− + H+ Mg2+ + AEDT ⇄ MgY2− + H+ ErioT c + Ca2+ ⇄ ErioT-Ca ErioT + Mg2+ ⇄ ErioT-Mg | VAEDT (mL) |
| COD–Mn | Redox titration | 2MnO4− + 5C2O42− + 16H+ ⇄ 2Mn2+ + 10CO2 + 8H2O 4MnO4− + 12H+ ⇄ 4Mn2+ + 5O2 + 6H2O | VMnO4− (mL) |
| Ammonium ion | Spectrophotometric | 2(HgI4)2− + 4OH− + NH4+ ⇄ HgI(NH2)·HgO + 7I− + 3H2O | Absorbance (400 nm) |
| Nitrite ion | Spectrophotometric | Formation of a reddish-purple azo dye via the coupling of diazotized sulfanilamide with N-(1-naphthyl)-ethylenediamine dihydrochloride | Absorbance (543 nm) |
| Nitrate ion | Spectrophotometric | Absorbance measurements of NO3− and dissolved organic matter | Absorbance (220, 275 nm) |
| Phosphate ion | Spectrophotometric | (PO4)3− + (VO3)− + 11(MoO4)2− + 22H+ ⇄ P(VMo11O40)3− + 11H2O | Absorbance (420 nm) |
| Iron(III) ion | Spectrophotometric | Formation of red-colored complexes [Fe(SCN)n]3−n (n = 1–6) | Absorbance (480 nm) |
| Potassium ion | Atomic emission | Characteristic emission from previously excited K atoms in the flame measured using a flame photometer at a λ of emission | Iem d (766 nm) |
a Electrical conductivity; b Total suspended solids; c Eriochrome black T; d Emission intensity.
Table 4.
Water analysis results obtained from analytical methods and a commercial test kit.
| Analytical Methods Parameter | Result a | RSD b (%) | Commercial Kit Parameter | Result a |
|---|---|---|---|---|
| EC | (192.7 ± 0.7) µS cm−1 | 0.31 | ||
| pH | 8.15 ± 0.06 | 0.62 | pH | 7.4 |
| TSS | (12 ± 2) mg L−1 | 6.5 | Silicate content | 2 mg SiO2 L−1 |
| Total water hardness | (52 ± 2) mg CaCO3 L−1 | 1.6 | Total hardness | 4 °dH |
| Total calcium content | (17 ± 1) mg L−1 | 3.3 | Carbonate hardness | 3 °dH |
| Total magnesium content | (2.3 ± 0.2) mg L−1 | 4.3 | Copper content | <0.05 mg L−1 |
| COD-Mn | (2.11 ± 0.08) mg O2 L−1 | 1.6 | Oxygen content | 6 mg L−1 |
| Ammonium content | (0.89 ± 0.03) mg L−1 | 1.8 | Ammonium content | <0.05 mg L−1 |
| Nitrite content | (19 ± 2) µg L−1 | 13 | Nitrite content | 0.05 mg L−1 |
| Nitrate content | (5.7 ± 0.7) mg L−1 | 7.1 | Nitrate content | 1 mg L−1 |
| Phosphate content | (0.6 ± 0.1) mg L−1 | 12 | Phosphate content | <0.1 mg L−1 |
| Iron(III) content | (0.17 ± 0.01) mg L−1 | 2.3 | Iron(III) content | <0.02 mg L−1 |
| Potassium content | (1.18 ± 0.01) mg L−1 | 0.65 |
a Results are expressed as the mean values and 95% confidence intervals (n = 5); b Relative standard deviation.
Table 5.
Optimum levels recommended for the freshwater aquarium.
| Parameter | Optimum Values a |
|---|---|
| EC | <1500 µS cm−1 |
| pH | 7.0–8.5 |
| TSS | (25–100) mg L−1 |
| Total water hardness | (89–285) mg CaCO3 L−1 |
| COD–Mn | <10 mg O2 L−1 |
| Oxygen | (4–8) mg L−1 |
| Copper content | <0.05 mg L−1 |
| Ammonium content | <0.10 mg L−1 |
| Nitrite content | <0.50 mg L−1 |
| Nitrate content | <30 mg L−1 |
| Phosphate content | <0.40 mg L−1 |
| Iron(III) content | (0.1–0.2) mg L−1 |
| Potassium content | ≈10 mg L−1 |
a Estimated as safety for fish, promoting plant growth and avoiding the growth of unwanted algae.
Disclaimer/Publisher’s Note: The statements, opinions and data contained in all publications are solely those of the individual author(s) and contributor(s) and not of MDPI and/or the editor(s). MDPI and/or the editor(s) disclaim responsibility for any injury to people or property resulting from any ideas, methods, instructions or products referred to in the content. |
© 2023 by the authors. Licensee MDPI, Basel, Switzerland. This article is an open access article distributed under the terms and conditions of the Creative Commons Attribution (CC BY) license (https://creativecommons.org/licenses/by/4.0/).
Share and Cite
MDPI and ACS Style
Rosales-Conrado, N.; Peña-Martínez, J. Adding Sustainability in Analytical Chemistry Education through Monitoring Aquarium Water Quality. Sustain. Chem. 2023, 4, 282-303. https://0-doi-org.brum.beds.ac.uk/10.3390/suschem4030021
AMA Style
Rosales-Conrado N, Peña-Martínez J. Adding Sustainability in Analytical Chemistry Education through Monitoring Aquarium Water Quality. Sustainable Chemistry. 2023; 4(3):282-303. https://0-doi-org.brum.beds.ac.uk/10.3390/suschem4030021
Chicago/Turabian StyleRosales-Conrado, Noelia, and Juan Peña-Martínez. 2023. "Adding Sustainability in Analytical Chemistry Education through Monitoring Aquarium Water Quality" Sustainable Chemistry 4, no. 3: 282-303. https://0-doi-org.brum.beds.ac.uk/10.3390/suschem4030021