
Polyfluoroalkyl Substances (PFASs) Detection Via Carbon Dots: A Review

1
Chemistry Research Unit (CIQUP), Institute of Molecular Sciences (IMS), Department of Geosciences, Environment and Territorial Planning, Faculty of Sciences (FCUP), University of Porto, Rua do Campo Alegre s/n, 4169-007 Porto, Portugal
2
LACOMEPHI, GreenUPorto, Department of Geosciences, Environment and Territorial Planning, Faculty of Sciences (FCUP), University of Porto, Rua do Campo Alegre s/n, 4169-007 Porto, Portugal
*
Author to whom correspondence should be addressed.
Sustain. Chem. 2023, 4(4), 339-362; https://0-doi-org.brum.beds.ac.uk/10.3390/suschem4040024
Submission received: 3 November 2023
/
Revised: 30 November 2023
/
Accepted: 13 December 2023
/
Published: 15 December 2023
Abstract
:PFASs are a class of highly persistent chemicals that are slowly infiltrating soils and waterways. Thus, there is a great need for fast, sensitive, and reliable techniques to detect PFASs. Conventional methods, such as LC-MS/SPE, allow high sensitivities. However, such methods can be complex and expensive. Considering this, it is not surprising that the scientific community has turned their attention to the search for alternatives. New types of PFAS sensors have been reported over the years, being generally part of three classes: optical, electrochemical, or hybrid sensors. Carbon dots (CDs) are new alternative fluorescent sensors that can present great affinity towards PFASs, while allowing for a fast response and promising sensitivity and selectivity. Furthermore, CDs have more attractive properties than traditional fluorophores and even metal-based nanomaterials that make them better candidates for sensing applications. Thus, CDs display great potential for permitting a fast and accurate quantification of PFASs. This review aims to serve as a basis for the future development and optimization of CD-based fluorescent sensors for PFASs.
1. Introduction
Perfluoroalkyl and polyfluoroalkyl substances (PFASs) are primarily synthetic compounds with hydrophobic and lipophobic properties [1,2]. PFASs are a class of aliphatic compounds that undergo extensive fluorination, resulting in partially or fully fluorinated carbon chains with varying lengths and functional groups. The number of PFAS molecules registered on the global market has surpassed 4700 [3].
The C–F bond in PFASs is amongst the most robust in nature and is strengthened further as each bonded hydrogen is replaced with a fluorine atom. As a result of their structure, PFASs are known to be durable and resistant to heat, oil, and water, leading to a widespread use in industrial chemicals and consumer goods. Examples of PFAS applications are cosmetics, fire-fighting foams, electronics, surfactants, fast food packaging, and non-stick cookware [4,5,6,7,8]. However, despite being widely used, PFASs pose a significant health and environmental concern due to their extended biological half-lives and propensity for bioaccumulation [9,10].
The growing awareness concerning PFASs has shed light on their toxicity towards humans, linking them to health risks, such as cancer, infertility, liver disease, and delayed puberty [2,11,12,13]. Among these, dyslipidemia is of particular importance. This disorder, which affects lipid production, shows a robust metabolic connection to PFAS exposure [12].
Using a simple categorization system, PFASs can be grouped into three different main families: perfluoroalkyl acids (PFAAs), PFAAs precursors, and others, which include fluoropolymers and perfluoropolyethers (PFPEs) [3,14]. Thousands of studies have been made regarding the different PFASs used by humans (Figure 1). The three main families can be divided into several sub-groups, each with several homologs and isomers. Typically, longer-chain perfluoroalkyl carboxylic acids (CnF2n+1COOH, n ≥ 7, PFCAs) and perfluoroalkyl sulfonic acids (CnF2n+1SO3H, n ≥ 6, PFSAs), both from the PFAA family, are more bioaccumulative than their respective short-chain analogues [1]. Thus, it is not surprising that two members of these subgroups, namely perfluorooctanoic acid (PFOA) and perfluorooctanesulfonic acid (PFOS), are the most heavily studied PFAS species, with over 3500 related studies each (until Nov. 2016) [14]. Both PFOA and PFOS, among other hazardous PFAS species, used to be manufactured at a large scale until they started to be phased out due to ecological and health concerns, illustrating the danger they posed to both humans and the environment. As an example, in 2006, the U. S. Environmental Protection Agency (USEPA) worked with eight leading chemical companies to reduce PFOA consumption by up to 95% via the PFOA stewardship program [15].
Throughout their life cycle, PFASs are released into the environment and subsequently transported through various media, eventually ending up being absorbed by aquatic organisms, plants, and humans [9,10]. Once in the environment, their degradation is impeded by the strong C–F bonds (105.4 kcal mol−1) [16]. This, allied with the fact that PFASs are compact, possess a stable chemical structure, and exhibit high electronegativity, leads to them being classified as environmentally persistent substances.
As a result, in the life cycle of PFAS-containing products, landfills are often regarded as the final stage for these products [15]. This raises concerns about the potential infiltration of PFASs into solid wastes, leachates, landfill gas, biosolids, and groundwater, which are more challenging to treat when compared to direct sources of exposure [12]. In fact, a 2019 study reported the global PFAS concentration in landfill leachate to range between 0.1 ng L−1 and 250 mg L−1 [15]. PFASs are also widespread in aquatic systems, with traces of PFASs having been found in wastewater, surface water, groundwater, and drinking water, presenting concentrations ranging from several picograms to micrograms per liter. The average concentration was found to be several nanograms per liter [17,18]. Traces of PFAS contamination in food can also be linked to contaminated water sources, either via the use of water for agricultural purposes, or the presence of PFASs in animal feed and water. PFAS occurrence was also found in drinking water in the U.S., with an estimated 200 million people receiving tap water with a PFOA/PFOS combined concentration over 1 ng L−1 [19]. Even more worryingly, 18–80 million people receive water with more than 10 ng L−1 and 0.4–1 million people receive water exceeding 70 ng L−1 [19]. As a response to the high levels of PFASs detected in drinking water, both the USEPA and the European Food Safety Administration (EFSA) have established health advisory levels (70 ng L−1 and 4.4 ng per kg of body weight per week, respectively) for several PFAS groups in a step towards limiting humans’ exposure to these hazardous compounds [20,21].
Considering the extensive presence of PFASs in water systems and the potential damage to both humans and the environment, there is a significant interest in developing efficient methods that permit a reliable detection and quantification of PFASs in aqueous systems in a timely manner that prevents PFAS-derived health hazards (Figure 2). However, due to the complexity of natural aqueous systems/matrices and the relatively low absolute concentration of PFASs when compared to other species in the system [22], the development of such methods has been a challenge. While there are several articles that have reviewed the detection of PFASs using current technologies [3,23,24,25,26], be it either using the sensor category or by reviewing the generality of available methods, to the best of our knowledge, there is none that has emphasized the topic of CD-based PFAS sensors, why they work, or the current state of the art in terms of sensitivity and selectivity. Given the potential of CDs for sensing applications, which have already been demonstrated for other analytes, there is a need for an organized review of the available information that could serve as a basis for future studies concerning the use of CDs for PFAS detection. Considering this, herein, we reviewed the current detection methods for PFASs, with a particular focus on the use of carbon-based nanoparticle single- and multi-component systems as optical sensors for the fluorescence-based detection of PFASs.
2. Current Detection Methods for PFASs
Currently, the most commonly used detection methods for PFASs are LC-MS/MS or GC-MS, mostly due to their superior sensitivity, accuracy, and reliability [27,28,29]. Usually, with this method, the PFAS compounds present in the samples are extracted using solid-phase extraction (SPE) techniques [30,31]. Alternative methodologies, such as liquid–liquid extraction (LLE) [32], ion-pair extraction (IPE) [33], solid-phase microextraction (SPME) [34], and dispersive liquid–liquid microextraction (DLLME) [35], are also utilized to extract PFASs. The prevalent SPE procedure for PFAS extraction, typically involving polystyrene divinylbenzene cartridges, primarily entails elution of the extracted compounds with methanol and a subsequent concentration achieved by drying using nitrogen. After this, the pre-concentrated sample is introduced into the column for analysis via LC-MS/MS or GC-MS [27,28,29].
However, achieving an accurate and reproducible analysis of organic pollutants in aqueous matrices, particularly at ultra-low concentrations (sub ng L−1), encounters significant challenges [36]. Different samples, which may differ in their matrix constitution and PFAS levels, may cause interferences with the accuracy of the analysis when the protocols are not specifically tailored to the matrix under examination. A possible solution can be found in the work of Surma et al., who devised a dispersive solid-phase extraction (d-SPE) method to quantify PFOA and PFOS concentrations in honey samples [37]. This approach, incorporating micro-ultra-high-performance liquid chromatography (UHPLC)-MS/MS analysis, achieved a recovery rate of up to 87%. Unlike SPE cartridges, the d-SPE method employs a small quantity of dispersed sorbents within the aqueous solution. This method offers a number of advantages, such as improved compound recoveries, minimal solvent utilization, and optimal sorbent surface area usage, making it a particularly interesting choice for samples in water matrices with relatively higher pollution levels [37]. In another case, Deng et al. reported the use of bamboo charcoal as a solid-phase extraction medium to isolate PFAAs from ultrapure water, drinking water, and surface water samples. The bamboo-based SPE method for extraction allowed for low limit of detection (LOD) values, with the values for different PFAs ranging from 0.01 to 1.15 ng L−1 [38].
However, despite being the gold standard for PFAS detection, there are several limitations to consider when using GC-MS [29] and LC-MS [39,40]. These methods share a common approach, involving ion-pair extraction of the target compounds, followed by quantification through mass spectrometry. They exhibit the capability to identify concentrations as low as parts per trillion (ppt, equivalent to pg L−1). However, these techniques are not portable, often require analyses to be conducted off-site, are time consuming, are not user friendly, and lack routine incorporation of matrix-matched calibration standards to account for different matrices. Furthermore, when using a chromatographic system, distinguishing between the peaks associated with several compounds, such as PFOA and PFOS, may prove to be tricky due to interferences from other pervasive polymeric compounds [41]. Finally, due to the nature of PFASs, there is a chance that these compounds are retained inside the column, and thus affect subsequent analyses due to carry-over contamination [41].
In order to address these limitations, researchers have been exploring a wide range of alternative PFAS sensors that utilize diverse mechanisms, devices, and materials. These next-generation sensors often employ uncomplicated designs to achieve an easy, on-site, rapid, and low-cost detection of PFASs. These sensors can be categorized into three main groups based on their underlying sensing mechanisms: optical sensors (Figure 3a–f), electrochemical sensors (Figure 3g–i), and hybrid sensors that combine both optical and electrochemical mechanisms (Figure 3j,k).
Beginning with optical sensors, there are different optical phenomena that can be employed to generate meaningful signals for PFAS detection. These include fluorescence, color variation, surface plasmon resonance (SPR), and light scattering, among others [42,43,44,45,46,47,48,49,50,51,52]. Out of the them all, fluorescence is the most frequently used due to its adaptability and rapid signal change [43,44,45,46,47]. Typically, fluorescent sensors include at least one fluorescent compound (referred to as a probe) that emits radiation upon its excitation. PFASs interact with the probe, through mechanisms such as electrostatic or hydrophobic interactions, altering their emissive properties and causing a signal change proportional to the concentration of PFASs. Fluorescent sensors may fall into two categories: “turn-on” [43,44] and “turn-off” sensors [45,46,47], depending on the nature of the fluorescence change in the presence of PFASs [42]. For the “turn-on” sensors, following the probe’s conjugation with PFAS molecules, their fluorescence intensity is enhanced by a degree proportional to the PFAS concentration increase. Similarly, “turn-off” fluorescence sensors exhibit a reduction in their fluorescence when the probe interacts with the PFAS molecules [42]. An example of a fluorescent-based optical sensor for PFASs has been described in the work of Li et al., who reported the making of up-conversion nanoparticles functionalized with covalent–organic frameworks [47]. The fluorescence response to PFASs was remarkable, with trace concentrations of PFOS (ranging from 1.8 × 10⁻¹³ to 1.8 × 10⁻⁸ M) being able to quench the nanoparticles’ emission at 550 nm (Figure 4). This effect, which was deemed to be due to PFOS’ electronegativity, could be even more pronounced in the presence of a surfactant, further increasing the sensitivity. From these results, a LOD as low as 75 pg L−1 for PFOS was obtained in a dimethylformamide matrix, which is low enough to surpass the USEPA’s advisory level of 70 ng L−1 [47].
Color changes are another form of signal used in the making of optical sensors for PFASs. The determination of PFASs via color change signals may be based either on the absorption spectrum variation [48] or on a direct color assessment based on RGB coordinates [53]. Upon the interaction of the sensor with the PFASs, color changes could arise from reactions involving chromogenic species, aggregation of nanoparticles, or binding with dye molecules [48,53,54]. Xia et al. developed a PFOS sensor based on gold nanoparticles (AuNPs) that presented a LOD of 5 ng L−1 [55]. Their sensor was designed based on the fact that PFOS is an agonist for the peroxisome proliferator-activated receptor α (PPARα). The AuNPs were functionalized with peroxisome proliferator-response elements (PPREs), which could only interact with PPARα when it was activated by ligands, in this case PFOS. The concentration of PFOS was assessed by evaluating the change in the absorbance intensity of the AuNPs induced by the interaction with PFOS-activated PPARα [55]. Other optical sensors were also made based on SPR (with a LOD range from 0.13 µg L−1 to 5 mg L−1), [50,51] resonance light scattering (2.8 µg L−1) [52], and Raman scattering (50 µg L−1) [56].
Albeit less used than optical sensors, electrochemical PFAS sensors have also been studied by the scientific community. This kind of sensor is increasingly gaining interest due to their remarkable sensitivity, simplicity, cost-effectiveness, and rapid responsiveness. Currently, electrochemical PFAS sensors utilize signals measured using techniques such as voltammetry [57,58,59], impedance spectroscopy [60], or potentiometry [61].
In voltammetry-based sensors, PFASs may act as obstructive agents for electroactive species [57], transferable ions [58], or surfactants [59]. An example of the first is the work of Karimian et al., who applied a layer of molecularly imprinted polymer (MIP) onto a gold electrode using PFOS as the template molecule, thus obtaining binding sites tailored for their target analyte [57]. During the measurement, in the absence of PFOS, the electroactive probe would interact with the electrode surface via those vacancies, generating a signal. However, when PFOS was present, it occupied the vacant sites and prevented the interaction of the electroactive probe with the electrode, causing a reduction in the current intensity observed in the voltammograms. This sensor presented a LOD value of 20 ng L−1 [57]. Regarding ion-transfer voltammetry, Garada et al. used a poly(vinyl chloride) (PVC) membrane plasticized with 2-nitrophenyl octyl ether as a selective membrane for PFOS sensing. By establishing a correlation between the peak current intensity in ion-transfer voltammetry and PFOS ion concentration, they achieved a LOD value as low as 25 ng L−1 [58]. In another work, Ranaweera et al. devised a novel approach to detect PFASs by leveraging the surfactant properties of these compounds [59]. They observed that PFASs, when acting as surfactants, could stabilize gas nuclei formed during the hydrogen evolution reaction (HER) and reduce the energy barrier for bubble formation. This phenomenon was used to elicit changes in electrochemical signals, which were then correlated to the concentration of PFASs present in the medium. When integrating a pre-concentration step using SPE, this team managed to obtain a LOD value of 40 ng L−1 for PFOS [59].
In the topic of impedance-based electrochemical PFAS sensors, Cheng et al. reported the use of a synthesized mesoporous MOF probe for PFOS embedded within a microfluidic channel [60]. The binding of the PFOS molecules to the MOF probe prompted an increase in impedance of an extent correlated to the analyte concentrations found in the samples. By combining the PFOS-specific capture probe, a specialized electrode configuration, and a microfluidic platform, this team’s sensor achieved a LOD value of 0.5 ng L−1 [60]. The use of MOFs for PFAS sensing has already been widely studied and reviewed, confirming their potential for this application [23,62,63]. As for the potentiometric detection of PFASs, Chen et al. prepared a sensor for PFOA and PFOS ions using ion-selective electrodes [61]. Their detection mechanism was based on ion exchange interactions, particularly fluorophobic anion exchanges for PFOA and PFOS. The anion exchangers were incorporated into a fluorous membrane within the electrodes. These electrodes exhibited a Nernstian response, characterized by a decrease of 59.2 mV per 10-fold increase in PFOA and PFOS ion concentrations, which was translated into a LOD of 70 ng L−1 for PFOA and 430 ng L−1 for PFOS [61].
Furthermore, from the combination of the previously mentioned methods, we have made hybrid photoelectrochemical (PEC) [64] and electrochemiluminescence (ECL) sensors, [65] which integrate both optical and electrochemical mechanisms to determine the concentration of PFASs. Regarding PEC sensors, they are activated by exposure to light, generating electrochemical signals that relay information about the analyte, whereas electrochemical sensors base their response on an electrochemical reaction that leads to the emission of luminescent signals [64,65]. The majority of PEC PFAS sensors were designed in a manner similar to voltametric sensors. Namely, PFASs act as a blocking agent for electroactive species. The distinction lies in the fact that the primary source of current in these sensors is the photocurrent generated by light-excited photoactive species. The presence of PFASs impedes the flow of current generated by the electroactive species by obstructing their path to the electrode, consequently reducing the total current intensity detected [64]. An example of this type of sensor is the work of Li et al., who developed a portable and disposable sensor by employing screen-printed electrode technology [64]. As for the ECL sensors, Chen et al. presented a sensor in which PFOA is introduced as a quencher for a chemiluminescent system [65]. By acting as the quencher for one of the co-reactants responsible for the luminescence of this system, PFOA alters the signal output in correlation to its concentration. The LOD for both kinds of hybrid sensors were found to be around 10 ng L−1 [64,65].
Finally, as another intriguing development in terms of PFAS sensors, we have the integration of biologic components. Zhang et al. reported an electrochemical biosensor for the detection of PFOS via monitoring the inhibitory effect of PFOS on the enzymatic biofuel cell process [66]. A one-compartment biofuel cell, equipped with multi-walled carbon nanohorn-modified glassy carbon electrodes, was prepared. Glutamic dehydrogenase and bilirubin oxidase were employed as biocatalysts at the bioanode and biocathode, respectively. In this system, the presence of PFOS exerted a detrimental influence on the bioactivity of these biocatalysts at both the bioanode and biocathode, leading to a reduction in the open-circuit voltage of the cell. A strong correlation was found between the concentration of PFOS and the voltage decrease in its presence [66]. Moreover, the biosensor displayed considerable selectivity for PFOS, even when in the presence of similar compounds, such as PFOA, and when testing real water samples sourced from a river [66]. In another work, Cennamo et al. prepared a biosensor featuring an engineered platform coupled with a bio-receptor [50]. This biosensor design is centered on a SPR platform utilizing plastic optical fibers (POFs) coupled with a bio-receptor designed for the detection of PFOA. This platform, modified with an α-lipoic acid compound via the formation of a self-assembling monolayer, was further tailored by adding a mono-specific antibody for PFOA [50]. In this method, PFOA molecules are covalently linked to bovine serum albumin, a protein carrier known for its high affinity and selectivity. As the concentration of PFOA increases, a reduction in the refractive index value within the receptor layer was observed. The LOD for this process has been estimated to be lower than 0.21 parts per billion (ppb), even when using a seawater matrix [50].
3. Nanoparticle-Based PFAS Sensors
Nanoparticle-based sensors have gathered significant attention from the scientific community in recent years, primarily due to their advantages in terms of portability, sensitivity, and selectivity at the nanoscale, as well as their adaptability for various applications, including environmental monitoring in complex mediums [67,68,69,70]. Meanwhile, gold nanoparticles have been of particular importance when regarding PFAS sensor development; owing to their special properties and potential for high sensitivity and selectivity [70,71], they are not the only contenders in the world of nanoparticle-based PFAS sensing.
Other metal-based nanoparticles were also employed, something that was exemplified by the work of Liu et al., who used Fe3O4 nanoparticles for the colorimetric detection of PFOS [54]. In this work, the nanoparticles were covalently linked to MoS2 and presented peroxidase-like activity. This enabled them to promote the oxidation of 3,3,5,5-tetramethylbenzidine in the presence of H2O2, resulting in a blue coloration. When PFOS was present, the sulfonate head groups of PFOS formed bonds with the protonated hydroxyl groups on the surface of the Fe3O4 nanoparticles, thus inhibiting the peroxidase-like activity of the nanoparticles. The alteration in color from blue to another shade was detected and used to obtain a LOD of 4.3 ppb [54]. It is worth mentioning that, in addition to PFOS, PFOA also interacts with the Fe3O4 nanoparticles, albeit to a lesser extent. This variance in interaction can be ascribed to the distinct headgroup chemistry, with the carboxyl and sulfate headgroups being different. This being said, Fe3O4 nanoparticles present their potential for the detection of PFASs [54].
Quantum dots (QDs) are another class of nanoparticles that have been used for the sensing of PFASs. QDs are semiconductor nanomaterials that emit light and offer a tunable emission through the modulation of their size, exhibiting a remarkable capacity for high fluorescent yields and resistance against photo- and chemical deterioration [72]. Cadmium sulfide QDs have already been proven to be useful for the detection of PFOA [73]. These QDs, due to their stabilization by 3-mercaptopropionic acid, are hydrophilic and suitable for the analysis of aqueous samples. In the presence of PFOA, the QDs aggregate due to F–F interactions, prompting a decrease in the photoluminescence intensity that is proportional to the concentration of PFOA. This results in a LOD as low as 124.2 ppb and a broad sensing range from 207.03 ppb to 16.56 ppm, permitting PFOA detection in highly contaminated areas. Once again, PFASs other than PFOA also quench the QDs’ fluorescence, albeit to a lesser extent than PFOA [73]. However, despite being sensitive to PFASs, these QDs present several limitations that hinder their application in aqueous samples: they have a very poor dispersion in water, they present a small Stokes shift, and they are extremely toxic due to encompassing heavy metals on their constitution [73].
Considering this, it is of no surprise that carbon dots (CDs), a type of carbon-based nanoparticles, became a topic of research regarding the fluorometric detection of PFASs. CDs present quite attractive properties, such as being highly photoluminescent, low cost, simple to make, water soluble, (photo)stabile, and safe to use [74,75,76,77]. Furthermore, they can present a great affinity towards PFASs. In fact, a study by Lewis et al. demonstrated that positively charged polyethyleneimine-based CDs interact with PFOA via electrostatic interactions [78]. Upon interaction with PFOA, the CDs’ size increased, and the surface charge decreased, with 19F NMR spectral analysis revealing a slow–intermediate chemical exchange between the CDs and PFOA, suggesting that there is a high-affinity interaction. When tested for other PFASs, the CDs demonstrated affinity when tested with a mixture of 24 PFASs, having a slight preference towards perfluoroalkyl sulfonates [78]. Their high degree of affinity provides a good platform to build PFAS sensors.
Regarding CDs, they are carbon-based nanoparticles that were first found by Xu et al. in 2004 [79,80,81,82]. CDs are typically sized between 1 and 10 nm and present a spherical or quasi-spherical shape. While oxygenated functional groups can be found on their surface (e.g., -OH, -COOH, and CHO), [74,83], the cores of CDs are mostly composed of sp2 carbon or graphene/graphene oxide sheets connected by sp3 carbon atoms in between, organized in a diamond-like array [84,85]. The CDs’ functionalized surface contributes towards the CDs’ superior water solubility, while also allowing them to undergo additional steps of functionalization by providing a binding site for other molecules [84]. This results in nanoparticles that present a complex internal and external structure, whose constitution is extremely dependent on the precursors and synthetic conditions [86].
Depending on the chosen method, the synthesis of CDs can be divided into two categories: top-down and bottom-up. Synthesis via top-down methodologies is based on breaking macroscopic carbon-based materials (e.g., graphite) into smaller nanosized particles, the CDs. This can be achieved using methods such as arc discharge [79], laser ablation [87], chemical [88] and electrochemical oxidation [89], and ultrasonic synthesis [90]. On the other hand, we have the bottom-up approach, which is based on the fabrication of CDs from molecular components, such as citric acid. This can be carried out via microwave treatment [91], thermal decomposition [92], hydrothermal treatment [93], template-based routes [94], and plasma treatment [95]. Due to the cost-effectiveness and relative easiness of the preparation entailed for some methods, the fabrication of CDs is possible in virtually any environment without requiring expensive and time-consuming techniques.
As a result of their synthesis, CDs present several desirable properties, such as high photoluminescence [74,75], broadband optical absorption and large photo-responsive region [96], high photo- and chemical stability [76], good water solubility [74,76], biocompatibility [87,97], and low toxicity [77]. It is also possible to fabricate CDs with up-conversion PL (UCPL), which can convert lower-energy, higher-wavelength radiation into higher-energy, lower-wavelength radiation, which is useful for photocatalytic nanocomposites [98]. Due to their properties, the practical applications for CDs include bioimaging [99,100], drug delivery systems [101], sensing and biosensing [100,102,103], photodynamic therapy [104], light-emitting devices [105], nanothermometry [106], photovoltaic devices [107], and photocatalysis [107,108,109]. Given the fact that other luminescent nanoparticles, such as Fe3O4 and QDs, are already used for PFAS sensing, it is unsurprising that CDs, with their high photoluminescence and possibility of up-conversion, present their potential for the same purpose. Thus far, there have been several studies reporting different ways of quantifying PFASs with CDs, with the vast majority being dependent on alterations in the nanoparticles’ photoluminescence upon combination with PFASs or combinations of PFASs with another chemical agent [45,110,111,112,113,114].
3.1. PFAS Detection Using Solo CD-Only Systems
We start by discussing the detection of PFASs using CD-only sensing mechanisms. An example of this is the work of Walekar et al., who used selenium- and nitrogen-doped CDs as a fluorescent probe for PFOA [111]. This team observed that PFOA selectively extinguished the emission of the CDs while concurrently reducing the fluorescence lifetime. The quenching phenomenon was attributed to the formation of an excited state complex between the co-doped CDs and PFOA, with the reduction in the emission intensity being a result of internal electron transfers within the complex [111]. By quantifying the quenching extent, a LOD of 1.8 µM was achieved, with the sensor boasting detection within a linear range from 10 to 70 µM. It is worth noting that the probe exhibited a high degree of selectivity towards PFOA when tested in real samples, presenting virtually no response towards common analytes, thus negating the problems of potential interfering molecules [111]. On the other hand, a case of a “turn-on” CD-based PFAS optical sensor can be found in the work of Lin and his team [115]. N-doped CDs were prepared from vitamin B and triethylamine via hydrothermal treatment and then used for the detection of PFOS. Due to electrostatic interactions between PFOS and the CDs, the latter aggregated and yielded an enhanced fluorescent signal, which could be measured and used to determine the concentration of PFOS [115]. This selectivity was maintained even in the presence of other common ions and structural analogues. Using this sensor, this team managed to achieve a LOD of 0.3 nM and a linear range for PFOS detection from 0.3 to 160 nM [115].
Similar to other kinds of nanoparticles, when it comes to PFAS sensing, CDs are commonly used as fluorescent sensors. Thus, to better understand their properties and the detection mechanism, we have carried out an in-depth analysis of several examples. We start with the work of Hong et al., who prepared a new type of high QYFL, orange-emitting CDs for the selective sensing of PFOA and PFOS in water samples [112]. Considering that the traditional PFOS detection methods presented a number of problems, such as being complex, high cost, and having low selectivity, this team decided to base themselves on the work of other researchers who had already turned to the use of QDs to overcome this problem [73]. Furthermore, Hong and his team also tried to solve the limitations associated with QDs by turning their attention to CDs, which present the same photoluminescent properties of QDs while being low cost and nontoxic, resulting in the formation of a probe that was able to make a safe, rapid, sensitive, and specific detection of the target analyte [112].
The CDs were prepared from phosphoric acid (200 µL) and 4-(diethylamino) salicylaldehyde (20 mg) via hydrothermal treatment (200 °C for 1 h) [112]. After their synthesis, the CDs were purified via centrifugation (12,000 rpm for 5 min) and dialysis (1000 Da MWCO) for 48 h and lyophilized. The resulting CDs presented an average size of 4.0 nm, with a 64.7% C, 26.1% O, 4.7% N, and 5.0% P constitution, as observed via HR-TEM and XPS, respectively. Together, FTIR and XPS illustrated the composition of the CDs’ surface, which was covered by carboxyl, amide, and hydroxyl groups. Upon their characterization, the CDs presented two absorption peaks at 268 and 555 nm, ascribed to the π–π* transition of C=C and the n–π* transition of C=O and C=N bonds, respectively. Regarding its photoluminescence, the CDs presented an excitation-dependent emission, with their emission peak occurring at 596 nm (for an λex of 560 nm), and an estimated QYFL of 47.1%. Finally, the CDs presented much lower toxicity towards human cells than QDs, even at higher concentrations [112].
The CDs’ response to PFOS and its homologs was tested via photoluminescence assays. It was observed that when in the presence of PFOS and PFOA concentrations ranging between 0 and 1 µM, the CDs’ emission was gradually quenched (Figure 5a,c, respectively), an effect which was only observed for PFOS and PFOA. Other perfluorinated compounds had little effect on the fluorescence of the CDs [112]. After optimizing the detection conditions (CDs’ concentration of 10 µg L−1 and pH 2.21), the standard curves for PFOS and PFOA detection were measured. A good linear correlation between fluorescence and analyte concentration was observed in both cases (Figure 5b,d). The linear range for PFOS occurred between 0.05 and 1 µM, whereas for PFOA it was from 0.1 to 1.5 µM. As for the LODs, they were 5 and 10 nM, respectively, equivalent to 2.5 and 4.14 µg L−1, respectively, thus comparable to those obtained with some of the other methods mentioned above [50,51,52,56,112]. When tested in real complex samples, PFOS and PFOA were successfully detected via the addition method, confirming the method’s applicability in the real world. Afterwards, further tests were carried out to elucidate the quenching mechanism. Considering that the quenching resulting from PFOS/PFOA did not change the fluorescence lifetime of the CDs (Figure 5e), it cannot be ascribed to a Förster resonance energy transfer process [116]. Together with the fact that there was a change in the intensity of the UV–Vis absorption peak of the CDs, these observations indicate that the quenching is a static effect rather than a dynamic effect [117]. After calculating the energies for the lowest unoccupied molecular orbital (LUMO) and highest occupied molecular orbital (HOMO) for the components in the system (Figure 5f), this team found that the electron transfer of photoexcited electrons from the LUMO of the CDs (ELUMO = −3.93 eV) into the LUMO of PFOS/PFOA (ELUMO = −4.56 and −4.38 eV, respectively) was energetically favorable. This resulted in the transference of the CDs’ photoexcited electrons into the analytes, thus preventing their radiative decay back into the ground state and thus quenching the nanoparticles’ fluorescence. Thus, electron transfer is the main driving force behind the CDs’ photoluminescence quenching. Given that the electron transfer into PFOS is more favorable than the transfer into PFOA, this explains the larger extent of quenching observed in the presence of PFOS when compared to PFOA [112].
In another work, Chen et al. fabricated CDs for the sensing of PFOS via a triple-channel optical sensing mechanism that included PFOS determination via fluorescence, absorbance, and resonance light scattering (RLS) [45]. To this end, they synthesized o-phenylenediamine and phosphoric acid-based CDs via hydrothermal treatment (200 °C for 10 h). Afterwards, the CD solution was purified via centrifugation (12,000 rpm for 12 min) and dialysis (1000 Da MWCO for 24 h). In terms of properties, the CDs presented an average size of 2.2 ± 0.27 nm and a surface consisting of amino- and carboxylic acid groups [45].
The CDs’ fluorescence spectra were also recorded under excitation ranging from 320 to 600 nm. The maximum emission occurred at 620 nm, independently of the excitation wavelength. When PFOS was present (from 0 to 12 µM), the CDs’ emission was significantly quenched. The static quenching as attributed to the formation of a ground-state complex between PFOS and the CDs. This was supported by a diminution of the CDs’ zeta potential (from +32.67 mV to +18.97 mV), which indicates electrostatic interactions between the positively charged CDs and the negatively charged PFOS. At the same time, the intensity of the UV–Vis absorption at the 618 nm peak also decreased with the gradually increasing PFOS concentrations. Finally, the RLS spectra showed that the RLS intensities were enhanced by the presence of PFOS. When put together, the CDs can be used as a triple-channel optical sensor for the determination of PFOS [45]. After optimization of the sensing conditions (T = 20 °C, 30 min reaction time, and pH = 5.4), the effect of PFOS concentration on the fluorescence, absorbance, and RLS of the CDs was quantified. By measuring the CDs’ fluorescence quenching, it was possible to obtain a LOD of 18.27 nM and a linear range between 0.5 and 12 µM when considering the logarithmic variation of the fluorescence (Figure 6A). Similarly, the PFOS-induced changes in the absorption spectrum of the CDs resulted in a LOD of 75.89 nM and linearity between 0.5 and 8 µM of PFOS (Figure 6B). Finally, the RLS spectrum of the CDs was enhanced with the presence of PFOS when λ was at 310 nm. This enhancement was linearly correlated with PFOS concentrations ranging between 0.5 and 12 µM and has a LOD of 120.45 nM (Figure 6C) [45]. The fact that PFOS determination was carried out in a three-fold manner increases reliability, as one assay confirms the other, avoiding misleading measurements. When tested with real water samples from a river using the addition method, this team obtained recoveries ranging from 97.9% to 104.8% with a low standard deviation (from 1.14% to 2.09%), confirming the reliability of the method for PFOS determination [45].
Overall, in the case of PFAS sensors only made from CDs, the sensing mechanism remains mostly similar between the different reports. Namely, using the work of Hong et al. as an example (Figure 7) [112], the CDs, after their preparation, interact with the target analytes, in this case PFOA and PFOS. This interaction, which may occur due to electrostatic interactions, resulted in the transference of photoexcited electrons from the CDs into the analytes, preventing their radiative decay back into the ground state and thus quenching their fluorescence intensity. This quenching can be measured and utilized to determine the PFAS concentration that caused the corresponding decrease in the fluorescence [112]. It should be pointed out that there are cases, such as reported that reported by the authors of [115], in which an enhancement of the fluorescence is observed instead of a quenching effect. However, this positive change in the fluorescence signal can also be used to determine the concentration of PFASs.
3.2. PFAS Detection Using CDs in Multi-Component Sensing Systems
Aside from the sensors that are only based on CDs, we also have the PFAS sensing systems that consist of the CDs and other co-factors that contribute towards the determination of the analyte. One such example is the work of Cheng et al., who prepared blue-emitting CDs whose photoluminescence was quenched in the presence of berberine chloride hydrate (BH), an effect which could be reverted by the presence of PFOS, likely due to electrostatic interactions between BH and PFOS [110]. The resulting change was quantifiable and exploited to detect PFOS, achieving a LOD of 10.8 ppb. Interestingly, this sensor maintained its ability to distinguish between PFOS and PFOA. This was due to PFOS being more hydrophilic, prompting stronger interactions with BH than PFOA [110].
Chen et al. devised a novel strategy to detect PFOS using a CD-based ratiometric nanosensor that combined both fluorescence and second-order scattering (SOS) signals for its measurements [114]. The use of a ratiometric sensor rather than a traditional one-signal response permits more reliable measurements, effectively nullifying the influences of false positives and negatives resulting from interferences, such as background signals, instrumental variations, and environmental changes [118,119]. While the use of ratiometric sensors for the detection of PFASs is not a novelty, they currently demand sophisticated and expensive equipment that come with an undesired selectivity [48,55]. To avoid these shortcomings and still achieve ratiometric sensing, Chen and his team employed two fluorescent substances (CDs and ethidium bromide (EB)) in a dual-recognition strategy. The CDs were synthesized from Victoria Blue B, phosphoric acid, and ethanol via solvothermal synthesis and purified via centrifugation (10,000 rpm for 30 min) and dialysis (1000 Da for 24 h). The ratiometric sensing mechanism was prepared by simply mixing CDs and EB in a glycine buffer solution prior to the detection of PFOS [114].
After their synthesis, the CDs were characterized in terms of their structure and properties. TEM measurements revealed that the CDs presented an average size of 4.13 ± 0.17 nm. By analyzing the XPS full survey spectrum, it was found that the CDs were composed of 80.0% C, 3.5% N, 14.4% O, and 2.1% P [114]. The deconvolution of the C 1s high-resolution spectrum indicated the presence of sp2/sp3 carbon (284.5 eV, C=C/C-C), carbon phosphate (185.2 eV), nitrous carbon (C-O/C-N, 286.1 eV), and carbonyl groups (C=O, 290.0 eV). Deconvolution of the N 1s band yielded peaks at 398.4, 399.1, and 401.2 eV, corresponding to pyridinic, pyrrolic, and graphitic N, respectively. The O 1s spectrum contained peaks at 531.5 and 533.2 eV, corresponding to the C=O and C-O groups, respectively. Finally, deconvolution of the P 2p spectrum revealed the presence of P=O and P-O at 133.8 and 132.9 eV, respectively. These results, conjugated with those resulting from FTIR, confirmed that nitrogen- and phosphate-doped CDs were successfully synthesized from Victoria Blue B [114]. In terms of optical properties, the CDs presented absorption peaks at 250, 280, and 370 nm, which were ascribed to the aromatic sp2 domains and C=O/C=N groups. In terms of photoluminescence, the CDs presented a QYFL of 25.4% and a bright blue–green maximum emission centered at 472 nm when excited at 280 nm, which was consistent with the absorption profile [114].
The effect of PFOS on the fluorescence and scattering spectra of the CDs was evaluated. It was observed that, under excitation at 254 nm, the addition of PFOS prompts a decrease in the fluorescence peak and an increase in the scattering signal intensity (its mechanism is represented in Figure 8a). On the other hand, EB, when excited at its absorption peak (280 nm), exhibits an intensive emission at 600 nm that does not change with the addition of PFOS [114]. In the absence of PFOS, when both components, CDs and EB, are present in the same system, we observed a SOS peak at 568 nm (ascribed to the CDs) and two emission peaks at 472 and 600 (slight shoulder) nm, assigned to the CDs and EB, respectively. With the addition of PFOS, while the fluorescence peak of EB remained stable, the emission intensity of the CDs’ peak decreased, while the SOS intensity increased considerably [114]. This effect was more pronounced when using different concentrations of PFOS (0–30 µM), with the team observing that increasing the PFOS concentration led to a gradual decrease in the fluorescence peak at 472 nm, while the SOS peak at 568 nm increased (Figure 8b). The fluorescence intensity of EB, at 600 nm, remained almost unchanged throughout the tested concentrations. In addition, the ratio between the emission intensity at 472 and 568 nm was linearly correlated to the PFOS concentration for a range between 0 and 2 µM (Figure 8c). From the exploration of the quenching phenomenon, this team managed to achieve a LOD of 27.8 nM [114]. It is worth nothing that, by using EB in their system, this team added a control to ascertain whether factors other than PFOS concentration affected their system, increasing the level of the measurement’s reliability. Tests regarding the selectivity of the sensor and the effect of interferents revealed that there were no significant interferences by other PFCs, and that other common interfering ions (e.g., Ca2+, F−, EDTA, etc.) did not cause any interference at concentrations 1000 times higher than that of the analyte. Furthermore, tests using real samples from a local river resulted in recovery rations between 90.15% and 101.44% and relative standard deviations between 0.88% and 1.67%, suggesting that this method is reliable for the detection of PFOS in real-life samples [114]. Finally, to better understand the mechanism behind the quenching effect, the ratiometric system was characterized. Upon their interaction with PFOS, the particles increased in size and their zeta potential decreased. These results reveal that the CDs have an affinity for PFOS on their surface, possibly due to the presence of nitrogen-containing groups that easily react with the analyte, resulting in the quenching of the fluorescence [114]. Furthermore, the fluorescence lifetime of the CDs remained unchanged after the addition of PFOS, indicating that PFOS-induced fluorescence quenching should be a static process, with a non-fluorescent complex being formed between the CDs and PFOS [114,120].
Out of all publications, Jiao et al. published the work reporting the lowest PFAS concentration detected with a CD-based sensing system, presenting a LOD as low as 0.4 pg L−1, beating even the LC-MS procedures regarded as the gold standard of PFAS detection [121]. This was achieved using a chitosan-based MIP doped with CDs on its surface. The CDs were prepared from citric acid and ethylenediamine via a hydrothermal protocol (180 °C for 5 h), after which they were purified via filtration and dialysis. To prepare the doped MIP, chitosan was dissolved in acetic acid, and then PFOS was added. After mixing for 3 h, 1 mg of CDs were added together with epichlorohydrin acetone, promoting the covalent bonding of the CDs and MIP during the polymerization reaction. The resulting solution was added dropwise to NaOH (0.5 M), resulting in chitosan beads that were washed and dried until a constant weight was achieved [121]. Regarding the CDs, they presented an excitation-dependent photoluminescence, with optimal emission occurring at 460 nm for an excitation wavelength of 350 nm (QYFL = 55%). Characterization of the CD-doped MIP confirmed that, after elution of the PFOS used in the MIP preparation, the binding sites were left untouched. Furthermore, the MIP surface presented several pores, possibly resulting from the imprinting process [121].
The detection mechanism of this sensor was based on an alteration of the CDs’ fluorescence intensity caused by interaction with PFOS [121]. The elution of PFOS left imprinted sites that provided selective binding sites to the target molecule. The occupation of these sites by the template PFOS molecules led to an enhancement in the fluorescence intensity, possibly due to the amino groups of PFOS increasing the surface passivation degree of the CDs. Given that pyridinic and pyrrolic nitrogen atoms can be considered defect structures that break larger conjugated carbon structures, they can originate polyaromatic structures, resulting in a stronger emission [122]. Furthermore, the sulfonate group of PFOS may form complexes with the amino groups via hydrogen bonds or electrostatic interactions, increasing the conjugation degree of amino-passivated CDs [121]. By comparing the fluorescence enhancement extent to several tested PFOS concentrations, under optimal conditions, this team managed to achieve a LOD of 0.4 pg L−1 in an aqueous matrix, the lowest of any CD-based PFAS sensors we could find. The linear range of detection was found to be from 20 to 200 pg L−1 [121]. This system also presented selectivity towards PFOS in comparison to its structural analogues. By presenting an imprinting factor of 2.75 when compared to non-imprinted CD-doped polymers, the efficiency of the imprinting effect was confirmed. Due to the binding sites left by PFOS, the MIP presented a much higher affinity towards this molecule when compared to similar molecules such as PFOA, which, despite also enhancing the fluorescence, did so to a much smaller extent than PFOS. Substances commonly found in complex samples, such as common ions, sugars, and human serum albumin, had little interference in the measurements [121]. The method’s robustness was confirmed through tests with serum and urine samples, in which LODs of 66 pg L−1 and 85 pg L−1 were obtained, respectively, confirming its applicability in complex matrices. Overall, the work of Jiao et al. resulted in the development of a highly sensitive PFOS detection method that presented a very low LOD (in both aqueous and complex samples) and good selectivity towards the target imprinting template [121].
3.3. CD-Mediated PFAS Sensing Comparison with Other Reports
Overall, there are several cases of nanoparticles, including CDs, being used for the detection of PFASs. The use of fluorescent nanoparticles still achieves respectably low LODs and interesting linear ranges for the determination of PFASs (Table 1). The vast majority of these present a mechanism in which the interaction of the sensor (or a co-factor in the system) with PFASs ultimately leads to an alteration of the nanoparticles’ fluorescence. This change can be measured and, using techniques such as the addition method, used to quantify the amount of PFASs present in a sample.
It is worth noting that while they generally present a higher LOD than conventional LC-MS/SPE techniques, CDs are inexpensive, less time consuming, do not require a complex pre-treatment, and may be performed on-site with the right equipment. This being said, Jiao et al. still managed to report a CD/MIP sensor that presented a LOD of 0.4 pg L−1, a whole order of magnitude below those commonly found for LC-MS/SPE, which is considered the gold standard for PFAS detection [121]. When compared to a number of other sensing alternatives, including optical, electrochemical, and hybrid PEC and ECL sensors, the CDs present comparable LODs and sensing ranges (usually between the nM and µM ranges) while maintaining a simple methodology. Furthermore, relative to their most similar competitors (QDs), CDs are more soluble in water and present virtually no toxicity, therefore being safe even for use in water intended for human consumption. It is worth noting that, to the best of our knowledge, thus far, CDs have only been reported for the detection of PFOA and PFOS, which, despite being widely used in the industry and the most relevant species of PFASs, are only two members of a family containing dozens of members [14]. Nearly all the studies mentioned in Table 1, including reports concerning conventional and other alternative PFAS sensors, only concern themselves with these two species of PFAS, disregarding the rest of the family. Given the predominance of PFOA and PFOS in our world, this is understandable, as they are the most representative members of PFAS compounds. Finally, the field of CD-based sensors for PFASs is still quite limited. To the best of our knowledge, there are only seven reports concerning this kind of sensor so far, all of them being optical sensors. It is expected that in the future, considering the danger that PFASs pose to human health, these sensors will gain more attention due to their inexpensiveness and easy preparation, fueling a growth in the number of related publications.
4. Conclusions and Future Outlooks
In order to face the grand challenge of water contamination by PFASs, efficient and effective methods for the timely detection of this pollutant are now more needed than ever. PFASs, due to their durable and resistant nature, are becoming widespread as industrial chemicals in household consumer goods, starting to be known as forever chemicals due to their persistence in the environment. Given their threat to human health, it is important to detect them in waterways and soils as early as possible to avoid over-exposition and the dangers resulting thereof. In this review, we have pointed out the current sensing methods available to detect PFASs, including conventional chromatography-related technologies coupled to SPE, novel optical, electrochemical, and hybrid sensors, and, with particular emphasis, CD-based sensing systems. We discussed the advantages and disadvantages of the use of CDs when compared to other sensors, talk about their potential selectivity and sensitivity, and explain the underlying mechanism used for the detection of the analyte.
When it comes to PFAS detection, conventional LC-MS or GC-MS systems yield reliable and high-quality quantifications with a very low LOD. While this is excellent from an analytical standpoint, some important limitations should be noted. These techniques require complex and expensive equipment, meaning that they cannot be performed on-site. Additionally, they are difficult to perform, requiring training, and are time-consuming. Finally, regarding the test itself, a different matrix calibration is required for each sample (depending on the origin of the sample), and distinguishing the peaks associated with compounds such as PFOA and PFOS may prove difficult due to interferences from other pervasive polymeric compounds. Given the problems posed by conventional systems, it is no wonder that the scientific community started developing alternative PFAS sensors. These can be mostly divided into three main categories: optical sensors, including sensors based on fluorescence, color variation, SPR, and light scattering, among others; electrochemical sensors, in which their measurements are based on voltammetry, impedance, or potentiometry; and hybrid PEC and ECL sensors, which integrate both optical and electrochemical mechanisms for the determination of PFASs. One of the materials that has been used in the making of these novel sensors are CDs.
While other kinds of nanoparticles have already been employed in the making of PFAS sensors, CDs present some unique advantages, even when compared to metal-based nanomaterials. Namely, CDs can be highly fluorescent, have good water solubility, and present virtually no toxicity. Moreover, they can present a high degree of affinity towards PFASs via electrostatic interactions, facilitating the connection between the sensor and target analyte. From these results, CDs are potential candidates for the making of PFAS sensors, something confirmed by the publication of several reports regarding the use of CD-based fluorescent sensors for both PFOS and PFOA. In general, the interaction of the CDs with PFASs results in a change in the fluorescence intensity that can be measured. This change can be either a decrease (quenching) or increase (enhancement) in the fluorescence and can derive from factors such as the formation of ground-state complexes via electrostatic interactions and electron transfer or aggregation of the nanoparticles. When compared to other sensing technologies, CD-based optical PFAS sensors generally present higher LODs than conventional LC-MS/SPE techniques, albeit being less expensive, easier to use, and providing faster analysis. When compared to other optical sensing alternatives, the CDs present comparable LODs and sensing ranges, meaning that they are at least as effective as their competitors in terms of LODs, while also having some advantages in terms of their solubility, rapidness, and easiness of preparation.
In summary, CDs appear to be an attractive alternative for the sensing of PFASs, presenting both a good sensitivity and selectivity, while providing an easy to make and fast method to quantify PFASs. On the downside, few reports concerning the use of CDs for PFAS sensing are available, and the ones existing only concern PFOA and PFOS, which are only two of the tens of members of the PFAS family, albeit the most relevant. It is our expectation that, in the coming years, as these compounds become more ubiquitous in our world, new sensing technologies for PFASs will become available, including CD-based sensors, which, due to their properties and unique advantages, should be explored as potential sensors for PFAS detection.
Author Contributions
Conceptualization, R.M.S.S. and L.P.d.S.; writing—original draft preparation, R.M.S.S.; writing—review and editing, L.P.d.S. and J.C.G.E.d.S.; supervision, L.P.d.S. and J.C.G.E.d.S.; funding acquisition, L.P.d.S. and J.C.G.E.d.S. All authors have read and agreed to the published version of the manuscript.
Funding
The Portuguese “Fundação para a Ciência e Tecnologia” (FCT, Lisbon) is acknowledged for funding the project PTDC/QUI-QFI/2870/2020 (https://0-doi-org.brum.beds.ac.uk/10.54499/PTDC/QUI-QFI/2870/2020), R&D Units CIQUP (UIDB/00081/2020 and UIDP/00081/2020), GreenUPorto (UIDB/05748/2020), and the Associated Laboratory IMS (LA/P/0056/2020). Luís Pinto da Silva acknowledges funding from the FCT under the Scientific Employment Stimulus (CEECINST/00069/2021). Ricardo Sendão acknowledges the FCT for his Ph.D. grant (2021.06149.BD).
Conflicts of Interest
The authors declare no conflict of interest.
References
- Buck, R.C.; Franklin, J.; Berger, U.; Conder, J.M.; Cousins, I.T.; de Voogt, P.; Jensen, A.A.; Kannan, K.; Mabury, S.A.; van Leeuwen, S.P. Perfluoroalkyl and polyfluoroalkyl substances in the environment: Terminology, classification, and origins. Integr. Environ. Assess. Manag. 2011, 7, 513–541. [Google Scholar] [CrossRef]
- Rahman, M.F.; Peldszus, S.; Anderson, W.B. Behaviour and fate of perfluoroalkyl and polyfluoroalkyl substances (PFASs) in drinking water treatment: A review. Water Res. 2014, 50, 318–340. [Google Scholar] [CrossRef] [PubMed]
- Wang, Y.; Darling, S.B.; Chen, J. Selectivity of Per- and Polyfluoroalkyl Substance Sensors and Sorbents in Water. ACS Appl. Mater. Interfaces 2021, 13, 60789–60814. [Google Scholar] [CrossRef] [PubMed]
- Dauchy, X.; Boiteux, V.; Bach, C.; Rosin, C.; Munoz, J.F. Per- and polyfluoroalkyl substances in firefighting foam concentrates and water samples collected near sites impacted by the use of these foams. Chemosphere 2017, 183, 53–61. [Google Scholar] [CrossRef] [PubMed]
- Domingo, J.L.; Nadal, M. Human exposure to per- and polyfluoroalkyl substances (PFAS) through drinking water: A review of the recent scientific literature. Environ. Res. 2019, 177, 108648. [Google Scholar] [CrossRef] [PubMed]
- Heydebreck, F.; Tang, J.; Xie, Z.; Ebinghaus, R. Emissions of Per- and Polyfluoroalkyl Substances in a Textile Manufacturing Plant in China and Their Relevance for Workers’ Exposure. Environ. Sci. Technol. 2016, 50, 10386–10396. [Google Scholar] [CrossRef] [PubMed]
- Munoz, G.; Desrosiers, M.; Duy, S.V.; Labadie, P.; Budzinski, H.; Liu, J.; Sauve, S. Environmental Occurrence of Perfluoroalkyl Acids and Novel Fluorotelomer Surfactants in the Freshwater Fish Catostomus commersonii and Sediments Following Firefighting Foam Deployment at the Lac-Megantic Railway Accident. Environ. Sci. Technol. 2017, 51, 1231–1240. [Google Scholar] [CrossRef] [PubMed]
- Tang, C.Y.; Fu, Q.S.; Robertson, A.P.; Criddle, C.S.; Leckie, J.O. Use of reverse osmosis membranes to remove perfluorooctane sulfonate (PFOS) from semiconductor wastewater. Environ. Sci. Technol. 2006, 40, 7343–7349. [Google Scholar] [CrossRef]
- Xu, B.; Qiu, W.; Du, J.; Wan, Z.; Zhou, J.L.; Chen, H.; Liu, R.; Magnuson, J.T.; Zheng, C. Translocation, bioaccumulation, and distribution of perfluoroalkyl and polyfluoroalkyl substances (PFASs) in plants. iScience 2022, 25, 104061. [Google Scholar] [CrossRef]
- Costello, M.C.S.; Lee, L.S. Sources, Fate, and Plant Uptake in Agricultural Systems of Per- and Polyfluoroalkyl Substances. Curr. Pollut. Rep. 2020. [Google Scholar] [CrossRef]
- Bach, C.C.; Bech, B.H.; Brix, N.; Nohr, E.A.; Bonde, J.P.; Henriksen, T.B. Perfluoroalkyl and polyfluoroalkyl substances and human fetal growth: A systematic review. Crit. Rev. Toxicol. 2015, 45, 53–67. [Google Scholar] [CrossRef] [PubMed]
- Sunderland, E.M.; Hu, X.C.; Dassuncao, C.; Tokranov, A.K.; Wagner, C.C.; Allen, J.G. A review of the pathways of human exposure to poly- and perfluoroalkyl substances (PFASs) and present understanding of health effects. J. Expo. Sci. Environ. Epidemiol. 2019, 29, 131–147. [Google Scholar] [CrossRef] [PubMed]
- Bassler, J.; Ducatman, A.; Elliott, M.; Wen, S.; Wahlang, B.; Barnett, J.; Cave, M.C. Environmental perfluoroalkyl acid exposures are associated with liver disease characterized by apoptosis and altered serum adipocytokines. Environ. Pollut. 2019, 247, 1055–1063. [Google Scholar] [CrossRef] [PubMed]
- Wang, Z.; DeWitt, J.C.; Higgins, C.P.; Cousins, I.T. A Never-Ending Story of Per- and Polyfluoroalkyl Substances (PFASs)? Environ. Sci. Technol. 2017, 51, 2508–2518. [Google Scholar] [CrossRef] [PubMed]
- Wei, Z.; Xu, T.; Zhao, D. Treatment of per- and polyfluoroalkyl substances in landfill leachate: Status, chemistry and prospects. Environ. Sci. Water Res. Technol. 2019, 5, 1814–1835. [Google Scholar] [CrossRef]
- O’Hagan, D. Understanding organofluorine chemistry. An introduction to the C-F bond. Chem. Soc. Rev. 2008, 37, 308–319. [Google Scholar] [CrossRef] [PubMed]
- Kabore, H.A.; Vo Duy, S.; Munoz, G.; Meite, L.; Desrosiers, M.; Liu, J.; Sory, T.K.; Sauve, S. Worldwide drinking water occurrence and levels of newly-identified perfluoroalkyl and polyfluoroalkyl substances. Sci. Total Environ. 2018, 616–617, 1089–1100. [Google Scholar] [CrossRef] [PubMed]
- Phong Vo, H.N.; Ngo, H.H.; Guo, W.; Hong Nguyen, T.M.; Li, J.; Liang, H.; Deng, L.; Chen, Z.; Hang Nguyen, T.A. Poly-and perfluoroalkyl substances in water and wastewater: A comprehensive review from sources to remediation. J. Water Process Eng. 2020, 36, 101393. [Google Scholar] [CrossRef]
- Andrews, D.Q.; Naidenko, O.V. Population-Wide Exposure to Per- and Polyfluoroalkyl Substances from Drinking Water in the United States. Environ. Sci. Technol. Lett. 2020, 7, 931–936. [Google Scholar] [CrossRef]
- Post, G.B. Recent US State and Federal Drinking Water Guidelines for Per- and Polyfluoroalkyl Substances. Environ. Toxicol. Chem. 2021, 40, 550–563. [Google Scholar] [CrossRef]
- EFSA Panel on Contaminants in the Food Chain; Schrenk, D.; Bignami, M.; Bodin, L.; Chipman, J.K.; Del Mazo, J.; Grasl-Kraupp, B.; Hogstrand, C.; Hoogenboom, L.R.; Leblanc, J.C.; et al. Risk to human health related to the presence of perfluoroalkyl substances in food. EFSA J. 2020, 18, e06223. [Google Scholar] [CrossRef]
- Shvartsev, S.L. Geochemistry of fresh groundwater in the main landscape zones of the Earth. Geochem. Int. 2009, 46, 1285–1398. [Google Scholar] [CrossRef]
- Menger, R.F.; Funk, E.; Henry, C.S.; Borch, T. Sensors for detecting per- and polyfluoroalkyl substances (PFAS): A critical review of development challenges, current sensors, and commercialization obstacles. Chem. Eng. J. 2021, 417, 129133. [Google Scholar] [CrossRef] [PubMed]
- Garg, S.; Kumar, P.; Greene, G.W.; Mishra, V.; Avisar, D.; Sharma, R.S.; Dumee, L.F. Nano-enabled sensing of per-/poly-fluoroalkyl substances (PFAS) from aqueous systems—A review. J. Environ. Manag. 2022, 308, 114655. [Google Scholar] [CrossRef] [PubMed]
- Caroleo, F.; Magna, G.; Naitana, M.L.; Di Zazzo, L.; Martini, R.; Pizzoli, F.; Muduganti, M.; Lvova, L.; Mandoj, F.; Nardis, S.; et al. Advances in Optical Sensors for Persistent Organic Pollutant Environmental Monitoring. Sensors 2022, 22, 2649. [Google Scholar] [CrossRef] [PubMed]
- Ganesan, S.; Chawengkijwanich, C.; Gopalakrishnan, M.; Janjaroen, D. Detection methods for sub-nanogram level of emerging pollutants—Per and polyfluoroalkyl substances. Food Chem. Toxicol. 2022, 168, 113377. [Google Scholar] [CrossRef] [PubMed]
- Barreca, S.; Busetto, M.; Vitelli, M.; Colzani, L.; Clerici, L.; Dellavedova, P. Online Solid-Phase Extraction LC-MS/MS: A Rapid and Valid Method for the Determination of Perfluorinated Compounds at Sub ng·L−1 Level in Natural Water. J. Chem. 2018, 2018, 3780825. [Google Scholar] [CrossRef]
- Bielicka-Daszkiewicz, K. Extraction techniques based on solid state and connected with liquid chromatography. J. Liq. Chromatogr. Relat. 2016, 39, 477–487. [Google Scholar] [CrossRef]
- Alzaga, R.; Bayona, J.M. Determination of perfluorocarboxylic acids in aqueous matrices by ion-pair solid-phase microextraction-in-port derivatization-gas chromatography-negative ion chemical ionization mass spectrometry. J. Chromatogr. A 2004, 1042, 155–162. [Google Scholar] [CrossRef]
- Filipovic, M.; Laudon, H.; McLachlan, M.S.; Berger, U. Mass Balance of Perfluorinated Alkyl Acids in a Pristine Boreal Catchment. Environ. Sci. Technol. 2015, 49, 12127–12135. [Google Scholar] [CrossRef]
- Venkatesan, A.K.; Halden, R.U. National inventory of perfluoroalkyl substances in archived U.S. biosolids from the 2001 EPA National Sewage Sludge Survey. J. Hazard. Mater. 2013, 252–253, 413–418. [Google Scholar] [CrossRef] [PubMed]
- Gonzalez-Barreiro, C.; Martinez-Carballo, E.; Sitka, A.; Scharf, S.; Gans, O. Method optimization for determination of selected perfluorinated alkylated substances in water samples. Anal. Bioanal. Chem. 2006, 386, 2123–2132. [Google Scholar] [CrossRef] [PubMed]
- Villaverde-de-Saa, E.; Racamonde, I.; Quintana, J.B.; Rodil, R.; Cela, R. Ion-pair sorptive extraction of perfluorinated compounds from water with low-cost polymeric materials: Polyethersulfone vs. polydimethylsiloxane. Anal. Chim. Acta 2012, 740, 50–57. [Google Scholar] [CrossRef] [PubMed]
- Huang, Y.; Li, H.; Bai, M.; Huang, X. Efficient extraction of perfluorocarboxylic acids in complex samples with a monolithic adsorbent combining fluorophilic and anion-exchange interactions. Anal. Chim. Acta 2018, 1011, 50–58. [Google Scholar] [CrossRef] [PubMed]
- Wang, J.; Shi, Y.; Cai, Y. A highly selective dispersive liquid-liquid microextraction approach based on the unique fluorous affinity for the extraction and detection of per- and polyfluoroalkyl substances coupled with high performance liquid chromatography tandem-mass spectrometry. J. Chromatogr. A 2018, 1544, 1–7. [Google Scholar] [CrossRef] [PubMed]
- Wu, J.; Qian, X.; Yang, Z.; Zhang, L. Study on the matrix effect in the determination of selected pharmaceutical residues in seawater by solid-phase extraction and ultra-high-performance liquid chromatography–electrospray ionization low-energy collision-induced dissociation tandem mass spectrometry. J. Chromatogr. A 2010, 1217, 1471–1475. [Google Scholar] [CrossRef] [PubMed]
- Surma, M.; Wiczkowski, W.; Cieślik, E.; Zieliński, H. Method development for the determination of PFOA and PFOS in honey based on the dispersive Solid Phase Extraction (d-SPE) with micro-UHPLC–MS/MS system. Microchem. J. 2015, 121, 150–156. [Google Scholar] [CrossRef]
- Deng, Z.H.; Cheng, C.G.; Wang, X.L.; Shi, S.H.; Wang, M.L.; Zhao, R.S. Preconcentration and Determination of Perfluoroalkyl Substances (PFASs) in Water Samples by Bamboo Charcoal-Based Solid-Phase Extraction Prior to Liquid Chromatography-Tandem Mass Spectrometry. Molecules 2018, 23, 902. [Google Scholar] [CrossRef]
- Szostek, B.; Prickett, K.B.; Buck, R.C. Determination of fluorotelomer alcohols by liquid chromatography/tandem mass spectrometry in water. Rapid Commun. Mass Spectrom. 2006, 20, 2837–2844. [Google Scholar] [CrossRef]
- Boulanger, B.; Vargo, J.; Schnoor, J.L.; Hornbuckle, K.C. Detection of perfluorooctane surfactants in Great Lakes water. Environ. Sci. Technol. 2004, 38, 4064–4070. [Google Scholar] [CrossRef]
- Flaherty, J.M.; Connolly, P.D.; Decker, E.R.; Kennedy, S.M.; Ellefson, M.E.; Reagen, W.K.; Szostek, B. Quantitative determination of perfluorooctanoic acid in serum and plasma by liquid chromatography tandem mass spectrometry. J. Chromatogr. B Analyt. Technol. Biomed. Life Sci. 2005, 819, 329–338. [Google Scholar] [CrossRef] [PubMed]
- Ryu, H.; Li, B.; De Guise, S.; McCutcheon, J.; Lei, Y. Recent progress in the detection of emerging contaminants PFASs. J. Hazard. Mater. 2021, 408, 124437. [Google Scholar] [CrossRef] [PubMed]
- Zheng, Z.; Yu, H.; Geng, W.C.; Hu, X.Y.; Wang, Y.Y.; Li, Z.; Wang, Y.; Guo, D.S. Guanidinocalix [5] arene for sensitive fluorescence detection and magnetic removal of perfluorinated pollutants. Nat. Commun. 2019, 10, 5762. [Google Scholar] [CrossRef] [PubMed]
- Fang, C.; Wu, J.; Sobhani, Z.; Amin, M.A.; Tang, Y. Aggregated-fluorescent detection of PFAS with a simple chip. Anal. Methods 2019, 11, 163–170. [Google Scholar] [CrossRef]
- Chen, Q.; Zhu, P.; Xiong, J.; Gao, L.; Tan, K. A sensitive and selective triple-channel optical assay based on red-emissive carbon dots for the determination of PFOS. Microchem. J. 2019, 145, 388–396. [Google Scholar] [CrossRef]
- Wang, Y.; Zhu, H. Detection of PFOS and copper(ii) ions based on complexation induced fluorescence quenching of porphyrin molecules. Anal. Methods 2014, 6, 2379–2383. [Google Scholar] [CrossRef]
- Li, J.; Zhang, C.; Yin, M.; Zhang, Z.; Chen, Y.; Deng, Q.; Wang, S. Surfactant-Sensitized Covalent Organic Frameworks-Functionalized Lanthanide-Doped Nanocrystals: An Ultrasensitive Sensing Platform for Perfluorooctane Sulfonate. ACS Omega 2019, 4, 15947–15955. [Google Scholar] [CrossRef]
- Niu, H.; Wang, S.; Zhou, Z.; Ma, Y.; Ma, X.; Cai, Y. Sensitive colorimetric visualization of perfluorinated compounds using poly(ethylene glycol) and perfluorinated thiols modified gold nanoparticles. Anal. Chem. 2014, 86, 4170–4177. [Google Scholar] [CrossRef]
- Cennamo, N.; D’Agostino, G.; Sequeira, F.; Mattiello, F.; Porto, G.; Biasiolo, A.; Nogueira, R.; Bilro, L.; Zeni, L. A Simple and Low-Cost Optical Fiber Intensity-Based Configuration for Perfluorinated Compounds in Water Solution. Sensors 2018, 18, 3009. [Google Scholar] [CrossRef]
- Cennamo, N.; Zeni, L.; Tortora, P.; Regonesi, M.E.; Giusti, A.; Staiano, M.; D’Auria, S.; Varriale, A. A High Sensitivity Biosensor to detect the presence of perfluorinated compounds in environment. Talanta 2018, 178, 955–961. [Google Scholar] [CrossRef]
- Cennamo, N.; D’Agostino, G.; Porto, G.; Biasiolo, A.; Perri, C.; Arcadio, F.; Zeni, L. A Molecularly Imprinted Polymer on a Plasmonic Plastic Optical Fiber to Detect Perfluorinated Compounds in Water. Sensors 2018, 18, 1836. [Google Scholar] [CrossRef]
- Cheng, Z.; Zhang, F.; Chen, X.; Du, L.; Gao, C.; Tan, K. Highly sensitive and selective detection of perfluorooctane sulfonate based on the Janus Green B resonance light scattering method. Anal. Methods 2016, 8, 8042–8048. [Google Scholar] [CrossRef]
- Fang, C.; Zhang, X.; Dong, Z.; Wang, L.; Megharaj, M.; Naidu, R. Smartphone app-based/portable sensor for the detection of fluoro-surfactant PFOA. Chemosphere 2018, 191, 381–388. [Google Scholar] [CrossRef]
- Liu, J.; Du, J.; Su, Y.; Zhao, H. A facile solvothermal synthesis of 3D magnetic MoS2/Fe3O4 nanocomposites with enhanced peroxidase-mimicking activity and colorimetric detection of perfluorooctane sulfonate. Microchem. J. 2019, 149, 104019. [Google Scholar] [CrossRef]
- Xia, W.; Wan, Y.J.; Wang, X.; Li, Y.Y.; Yang, W.J.; Wang, C.X.; Xu, S.Q. Sensitive bioassay for detection of PPARalpha potentially hazardous ligands with gold nanoparticle probe. J. Hazard. Mater. 2011, 192, 1148–1154. [Google Scholar] [CrossRef]
- Fang, C.; Megharaj, M.; Naidu, R. Surface-enhanced Raman scattering (SERS) detection of fluorosurfactants in firefighting foams. RSC Adv. 2016, 6, 11140–11145. [Google Scholar] [CrossRef]
- Karimian, N.; Stortini, A.M.; Moretto, L.M.; Costantino, C.; Bogialli, S.; Ugo, P. Electrochemosensor for Trace Analysis of Perfluorooctanesulfonate in Water Based on a Molecularly Imprinted Poly(o-phenylenediamine) Polymer. ACS Sens. 2018, 3, 1291–1298. [Google Scholar] [CrossRef] [PubMed]
- Garada, M.B.; Kabagambe, B.; Kim, Y.; Amemiya, S. Ion-transfer voltammetry of perfluoroalkanesulfonates and perfluoroalkanecarboxylates: Picomolar detection limit and high lipophilicity. Anal. Chem. 2014, 86, 11230–11237. [Google Scholar] [CrossRef] [PubMed]
- Ranaweera, R.; Ghafari, C.; Luo, L. Bubble-Nucleation-Based Method for the Selective and Sensitive Electrochemical Detection of Surfactants. Anal. Chem. 2019, 91, 7744–7748. [Google Scholar] [CrossRef] [PubMed]
- Cheng, Y.H.; Barpaga, D.; Soltis, J.A.; Shutthanandan, V.; Kargupta, R.; Han, K.S.; McGrail, B.P.; Motkuri, R.K.; Basuray, S.; Chatterjee, S. Metal-Organic Framework-Based Microfluidic Impedance Sensor Platform for Ultrasensitive Detection of Perfluorooctanesulfonate. ACS Appl. Mater. Interfaces 2020, 12, 10503–10514. [Google Scholar] [CrossRef] [PubMed]
- Chen, L.D.; Lai, C.Z.; Granda, L.P.; Fierke, M.A.; Mandal, D.; Stein, A.; Gladysz, J.A.; Buhlmann, P. Fluorous membrane ion-selective electrodes for perfluorinated surfactants: Trace-level detection and in situ monitoring of adsorption. Anal. Chem. 2013, 85, 7471–7477. [Google Scholar] [CrossRef] [PubMed]
- Li, R.; Adarsh, N.N.; Lu, H.; Wriedt, M. Metal-organic frameworks as platforms for the removal of per- and polyfluoroalkyl substances from contaminated waters. Matter 2022, 5, 3161–3193. [Google Scholar] [CrossRef]
- Rodriguez, K.L.; Hwang, J.H.; Esfahani, A.R.; Sadmani, A.; Lee, W.H. Recent Developments of PFAS-Detecting Sensors and Future Direction: A Review. Micromachines 2020, 11, 667. [Google Scholar] [CrossRef]
- Li, X.; Wang, X.; Fang, T.; Zhang, L.; Gong, J. Disposable photoelectrochemical sensing strip for highly sensitive determination of perfluorooctane sulfonyl fluoride on functionalized screen-printed carbon electrode. Talanta 2018, 181, 147–153. [Google Scholar] [CrossRef] [PubMed]
- Chen, S.; Li, A.; Zhang, L.; Gong, J. Molecularly imprinted ultrathin graphitic carbon nitride nanosheets-Based electrochemiluminescence sensing probe for sensitive detection of perfluorooctanoic acid. Anal. Chim. Acta 2015, 896, 68–77. [Google Scholar] [CrossRef] [PubMed]
- Zhang, T.; Zhao, H.; Lei, A.; Quan, X. Electrochemical Biosensor for Detection of Perfluorooctane Sulfonate Based on Inhibition Biocatalysis of Enzymatic Fuel Cell. Electrochemistry 2014, 82, 94–99. [Google Scholar] [CrossRef]
- Poma, A.; Turner, A.P.; Piletsky, S.A. Advances in the manufacture of MIP nanoparticles. Trends Biotechnol. 2010, 28, 629–637. [Google Scholar] [CrossRef]
- Aragay, G.; Pino, F.; Merkoci, A. Nanomaterials for sensing and destroying pesticides. Chem. Rev. 2012, 112, 5317–5338. [Google Scholar] [CrossRef]
- Thatai, S.; Khurana, P.; Boken, J.; Prasad, S.; Kumar, D. Nanoparticles and core–shell nanocomposite based new generation water remediation materials and analytical techniques: A review. Microchem. J. 2014, 116, 62–76. [Google Scholar] [CrossRef]
- Fang, C.; Dharmarajan, R.; Megharaj, M.; Naidu, R. Gold nanoparticle-based optical sensors for selected anionic contaminants. TrAC Trends Anal. Chem. 2017, 86, 143–154. [Google Scholar] [CrossRef]
- Qin, L.; Zeng, G.; Lai, C.; Huang, D.; Xu, P.; Zhang, C.; Cheng, M.; Liu, X.; Liu, S.; Li, B.; et al. “Gold rush” in modern science: Fabrication strategies and typical advanced applications of gold nanoparticles in sensing. Coord. Chem. Rev. 2018, 359, 1–31. [Google Scholar] [CrossRef]
- Kairdolf, B.A.; Smith, A.M.; Stokes, T.H.; Wang, M.D.; Young, A.N.; Nie, S. Semiconductor quantum dots for bioimaging and biodiagnostic applications. Annu. Rev. Anal. Chem. 2013, 6, 143–162. [Google Scholar] [CrossRef]
- Liu, Q.; Huang, A.; Wang, N.; Zheng, G.; Zhu, L. Rapid fluorometric determination of perfluorooctanoic acid by its quenching effect on the fluorescence of quantum dots. J. Lumin. 2015, 161, 374–381. [Google Scholar] [CrossRef]
- Esteves da Silva, J.C.G.; Gonçalves, H.M.R. Analytical and bioanalytical applications of carbon dots. TrAC Trends Anal. Chem. 2011, 30, 1327–1336. [Google Scholar] [CrossRef]
- Wang, R.; Lu, K.-Q.; Tang, Z.-R.; Xu, Y.-J. Recent progress in carbon quantum dots: Synthesis, properties and applications in photocatalysis. J. Mater. Chem. A 2017, 5, 3717–3734. [Google Scholar] [CrossRef]
- Lim, S.Y.; Shen, W.; Gao, Z. Carbon quantum dots and their applications. Chem. Soc. Rev. 2015, 44, 362–381. [Google Scholar] [CrossRef] [PubMed]
- Wang, K.; Gao, Z.; Gao, G.; Wo, Y.; Wang, Y.; Shen, G.; Cui, D. Systematic safety evaluation on photoluminescent carbon dots. Nanoscale Res. Lett. 2013, 8, 122. [Google Scholar] [CrossRef] [PubMed]
- Lewis, R.E.; Huang, C.-H.; White, J.C.; Haynes, C.L. Using 19F NMR to Investigate Cationic Carbon Dot Association with Per- and Polyfluoroalkyl Substances (PFAS). ACS Nanosci. Au 2023, 3, 408–417. [Google Scholar] [CrossRef] [PubMed]
- Xu, X.; Ray, R.; Gu, Y.; Ploehn, H.J.; Gearheart, L.; Raker, K.; Scrivens, W.A. Electrophoretic analysis and purification of fluorescent single-walled carbon nanotube fragments. J. Am. Chem. Soc. 2004, 126, 12736–12737. [Google Scholar] [CrossRef] [PubMed]
- Choi, D.; Ham, S.; Jang, D.-J. Visible-light photocatalytic reduction of Cr(VI) via carbon quantum dots-decorated TiO2 nanocomposites. J. Environ. Chem. Eng. 2018, 6, 1–8. [Google Scholar] [CrossRef]
- Chen, J.; Shu, J.; Anqi, Z.; Juyuan, H.; Yan, Z.; Chen, J. Synthesis of carbon quantum dots/TiO2 nanocomposite for photo-degradation of Rhodamine B and cefradine. Diamond Relat. Mater. 2016, 70, 137–144. [Google Scholar] [CrossRef]
- Li, Y.; Liu, Z.M.; Wu, Y.C.; Chen, J.T.; Zhao, J.Y.; Jin, F.M.; Na, P. Carbon dots-TiO2 nanosheets composites for photoreduction of Cr(VI) under sunlight illumination: Favorable role of carbon dots. Appl. Catal. B 2018, 224, 508–517. [Google Scholar] [CrossRef]
- Hola, K.; Zhang, Y.; Wang, Y.; Giannelis, E.P.; Zboril, R.; Rogach, A.L. Carbon dots—Emerging light emitters for bioimaging, cancer therapy and optoelectronics. Nano Today 2014, 9, 590–603. [Google Scholar] [CrossRef]
- Baker, S.N.; Baker, G.A. Luminescent carbon nanodots: Emergent nanolights. Angew. Chem. Int. Ed. Engl. 2010, 49, 6726–6744. [Google Scholar] [CrossRef]
- Demchenko, A.P.; Dekaliuk, M.O. Novel fluorescent carbonic nanomaterials for sensing and imaging. Methods Appl. Fluoresc. 2013, 1, 042001. [Google Scholar] [CrossRef] [PubMed]
- Crista, D.M.A.; Esteves da Silva, J.C.G.; Pinto da Silva, L. Evaluation of Different Bottom-up Routes for the Fabrication of Carbon Dots. Nanomaterials 2020, 10, 1316. [Google Scholar] [CrossRef]
- Sun, Y.P.; Zhou, B.; Lin, Y.; Wang, W.; Fernando, K.A.; Pathak, P.; Meziani, M.J.; Harruff, B.A.; Wang, X.; Wang, H.; et al. Quantum-sized carbon dots for bright and colorful photoluminescence. J. Am. Chem. Soc. 2006, 128, 7756–7757. [Google Scholar] [CrossRef]
- Wang, J.; Sahu, S.; Sonkar, S.K.; Tackett Ii, K.N.; Sun, K.W.; Liu, Y.; Maimaiti, H.; Anilkumar, P.; Sun, Y.-P. Versatility with carbon dots—From overcooked BBQ to brightly fluorescent agents and photocatalysts. RSC Adv. 2013, 3, 15604–15607. [Google Scholar] [CrossRef]
- Lu, J.; Yang, J.X.; Wang, J.; Lim, A.; Wang, S.; Loh, K.P. One-pot synthesis of fluorescent carbon nanoribbons, nanoparticles, and graphene by the exfoliation of graphite in ionic liquids. ACS Nano 2009, 3, 2367–2375. [Google Scholar] [CrossRef]
- Park, S.Y.; Lee, H.U.; Park, E.S.; Lee, S.C.; Lee, J.W.; Jeong, S.W.; Kim, C.H.; Lee, Y.C.; Huh, Y.S.; Lee, J. Photoluminescent green carbon nanodots from food-waste-derived sources: Large-scale synthesis, properties, and biomedical applications. ACS Appl. Mater. Interfaces 2014, 6, 3365–3370. [Google Scholar] [CrossRef]
- Sendão, R.M.S.; Crista, D.M.A.; Afonso, A.C.P.; Martinez de Yuso, M.D.V.; Algarra, M.; Esteves da Silva, J.C.G.; Pinto da Silva, L. Insight into the hybrid luminescence showed by carbon dots and molecular fluorophores in solution. Phys. Chem. Chem. Phys. 2019, 21, 20919–20926. [Google Scholar] [CrossRef]
- Ma, C.B.; Zhu, Z.T.; Wang, H.X.; Huang, X.; Zhang, X.; Qi, X.; Zhang, H.L.; Zhu, Y.; Deng, X.; Peng, Y.; et al. A general solid-state synthesis of chemically-doped fluorescent graphene quantum dots for bioimaging and optoelectronic applications. Nanoscale 2015, 7, 10162–10169. [Google Scholar] [CrossRef] [PubMed]
- Sendão, R.; Yuso, M.d.V.M.d.; Algarra, M.; Esteves da Silva, J.C.G.; Pinto da Silva, L. Comparative life cycle assessment of bottom-up synthesis routes for carbon dots derived from citric acid and urea. J. Clean. Prod. 2020, 254, 120080. [Google Scholar] [CrossRef]
- Liu, R.; Wu, D.; Liu, S.; Koynov, K.; Knoll, W.; Li, Q. An aqueous route to multicolor photoluminescent carbon dots using silica spheres as carriers. Angew. Chem. Int. Ed. Engl. 2009, 48, 4598–4601. [Google Scholar] [CrossRef] [PubMed]
- Jiang, H.; Chen, F.; Lagally, M.G.; Denes, F.S. New strategy for synthesis and functionalization of carbon nanoparticles. Langmuir 2010, 26, 1991–1995. [Google Scholar] [CrossRef]
- Peng, Z.; Han, X.; Li, S.; Al-Youbi, A.O.; Bashammakh, A.S.; El-Shahawi, M.S.; Leblanc, R.M. Carbon dots: Biomacromolecule interaction, bioimaging and nanomedicine. Coord. Chem. Rev. 2017, 343, 256–277. [Google Scholar] [CrossRef]
- Vale, N.; Silva, S.; Duarte, D.; Crista, D.M.A.; Pinto da Silva, L.; Esteves da Silva, J.C.G. Normal breast epithelial MCF-10A cells to evaluate the safety of carbon dots. RSC Med. Chem. 2021, 12, 245–253. [Google Scholar] [CrossRef]
- Deng, Y.; Chen, M.; Chen, G.; Zou, W.; Zhao, Y.; Zhang, H.; Zhao, Q. Visible-Ultraviolet Upconversion Carbon Quantum Dots for Enhancement of the Photocatalytic Activity of Titanium Dioxide. ACS Omega 2021, 6, 4247–4254. [Google Scholar] [CrossRef]
- Belkahla, H.; Boudjemaa, R.; Caorsi, V.; Pineau, D.; Curcio, A.; Lomas, J.S.; Decorse, P.; Chevillot-Biraud, A.; Azaïs, T.; Wilhelm, C.; et al. Carbon dots, a powerful non-toxic support for bioimaging by fluorescence nanoscopy and eradication of bacteria by photothermia. Nanoscale Adv. 2019, 1, 2571–2579. [Google Scholar] [CrossRef]
- Li, J.; Tang, K.; Yu, J.; Wang, H.; Tu, M.; Wang, X. Nitrogen and chlorine co-doped carbon dots as probe for sensing and imaging in biological samples. R. Soc. Open Sci. 2019, 6, 181557. [Google Scholar] [CrossRef]
- Hettiarachchi, S.D.; Graham, R.M.; Mintz, K.J.; Zhou, Y.; Vanni, S.; Peng, Z.; Leblanc, R.M. Triple conjugated carbon dots as a nano-drug delivery model for glioblastoma brain tumors. Nanoscale 2019, 11, 6192–6205. [Google Scholar] [CrossRef]
- Simoes, E.F.C.; da Silva, L.P.; da Silva, J.; Leitao, J.M.M. Hypochlorite fluorescence sensing by phenylboronic acid-alizarin adduct based carbon dots. Talanta 2020, 208, 120447. [Google Scholar] [CrossRef]
- Afonso, A.C.P.; Correia, A.S.; Duarte, D.; Brandão, A.T.S.C.; de Yuso, M.d.V.M.; Jiménez-Jiménez, J.; Vale, N.; Pereira, C.M.; Algarra, M.; Pinto da Silva, L. An Active Surface Preservation Strategy for the Rational Development of Carbon Dots as pH-Responsive Fluorescent Nanosensors. Chemosensors 2021, 9, 191. [Google Scholar] [CrossRef]
- He, H.; Zheng, X.; Liu, S.; Zheng, M.; Xie, Z.; Wang, Y.; Yu, M.; Shuai, X. Diketopyrrolopyrrole-based carbon dots for photodynamic therapy. Nanoscale 2018, 10, 10991–10998. [Google Scholar] [CrossRef]
- Joseph, J.; Anappara, A.A. White-Light-Emitting Carbon Dots Prepared by the Electrochemical Exfoliation of Graphite. ChemPhysChem 2017, 18, 292–298. [Google Scholar] [CrossRef] [PubMed]
- Kalytchuk, S.; Polakova, K.; Wang, Y.; Froning, J.P.; Cepe, K.; Rogach, A.L.; Zboril, R. Carbon Dot Nanothermometry: Intracellular Photoluminescence Lifetime Thermal Sensing. ACS Nano 2017, 11, 1432–1442. [Google Scholar] [CrossRef] [PubMed]
- Zhang, Y.-Q.; Ma, D.-K.; Zhang, Y.-G.; Chen, W.; Huang, S.-M. N-doped carbon quantum dots for TiO2-based photocatalysts and dye-sensitized solar cells. Nano Energy 2013, 2, 545–552. [Google Scholar] [CrossRef]
- Zhou, H.; Zhang, B.; Jiang, Z.; Zhao, H.; Zhang, Y. Room-Temperature Synthesis of Carbon Dot/TiO2 Composites with High Photocatalytic Activity. Langmuir 2023, 39, 7184–7191. [Google Scholar] [CrossRef] [PubMed]
- Saini, D.; Garg, A.K.; Dalal, C.; Anand, S.R.; Sonkar, S.K.; Sonker, A.K.; Westman, G. Visible-Light-Promoted Photocatalytic Applications of Carbon Dots: A Review. ACS Appl. Nano Mater. 2022, 5, 3087–3109. [Google Scholar] [CrossRef]
- Cheng, Z.; Dong, H.; Liang, J.; Zhang, F.; Chen, X.; Du, L.; Tan, K. Highly selective fluorescent visual detection of perfluorooctane sulfonate via blue fluorescent carbon dots and berberine chloride hydrate. Spectrochim. Acta A Mol. Biomol. Spectrosc. 2019, 207, 262–269. [Google Scholar] [CrossRef]
- Walekar, L.S.; Zheng, M.; Zheng, L.; Long, M. Selenium and nitrogen co-doped carbon quantum dots as a fluorescent probe for perfluorooctanoic acid. Mikrochim. Acta 2019, 186, 278. [Google Scholar] [CrossRef]
- Hong, Y.; Chen, X.; Zhang, Y.; Zhu, Y.; Sun, J.; Swihart, M.T.; Tan, K.; Dong, L. One-pot hydrothermal synthesis of high quantum yield orange-emitting carbon quantum dots for sensitive detection of perfluorinated compounds. New J. Chem. 2022, 46, 19658–19666. [Google Scholar] [CrossRef]
- Zheng, L.; Zheng, Y.; Liu, Y.; Long, S.; Du, L.; Liang, J.; Huang, C.; Swihart, M.T.; Tan, K. Core-shell quantum dots coated with molecularly imprinted polymer for selective photoluminescence sensing of perfluorooctanoic acid. Talanta 2019, 194, 1–6. [Google Scholar] [CrossRef] [PubMed]
- Chen, Q.; Zhu, P.; Xiong, J.; Gao, L.; Tan, K. A new dual-recognition strategy for hybrid ratiometric and ratiometric sensing perfluorooctane sulfonic acid based on high fluorescent carbon dots with ethidium bromide. Spectrochim. Acta A Mol. Biomol. Spectrosc. 2020, 224, 117362. [Google Scholar] [CrossRef] [PubMed]
- Lin, L.; Zhou, S.; Guo, H.; Chen, Y.; Lin, S.; Yan, L.; Li, K.; Li, J. Nitrogen-doped carbon dots as an effective fluorescence enhancing system for the determination of perfluorooctyl sulfonate. Mikrochim. Acta 2019, 186, 380. [Google Scholar] [CrossRef] [PubMed]
- Liu, L.; Mi, Z.; Hu, Q.; Li, C.; Li, X.; Feng, F. Green synthesis of fluorescent carbon dots as an effective fluorescence probe for morin detection. Anal. Methods 2019, 11, 353–358. [Google Scholar] [CrossRef]
- Rahal, M.; Atassi, Y.; Alghoraibi, I. Quenching photoluminescence of Carbon Quantum Dots for detecting and tracking the release of Minocycline. J. Photochem. Photobiol. A 2021, 412, 113257. [Google Scholar] [CrossRef]
- Fu, Y.; Jin, H.; Bu, X.; Gui, R. Melamine-Induced Decomposition and Anti-FRET Effect from a Self-Assembled Complex of Rhodamine 6G and DNA-Stabilized Silver Nanoclusters Used for Dual-Emitting Ratiometric and Naked-Eye-Visible Fluorescence Detection. J. Agric. Food. Chem. 2018, 66, 9819–9827. [Google Scholar] [CrossRef]
- Gui, R.; Bu, X.; He, W.; Jin, H. Ratiometric fluorescence, solution-phase and filter-paper visualization detection of ciprofloxacin based on dual-emitting carbon dot/silicon dot hybrids. New J. Chem. 2018, 42, 16217–16225. [Google Scholar] [CrossRef]
- Li, N.; Liu, S.G.; Fan, Y.Z.; Ju, Y.J.; Xiao, N.; Luo, H.Q.; Li, N.B. Adenosine-derived doped carbon dots: From an insight into effect of N/P co-doping on emission to highly sensitive picric acid sensing. Anal. Chim. Acta 2018, 1013, 63–70. [Google Scholar] [CrossRef]
- Jiao, Z.; Li, J.; Mo, L.; Liang, J.; Fan, H. A molecularly imprinted chitosan doped with carbon quantum dots for fluorometric determination of perfluorooctane sulfonate. Mikrochim. Acta 2018, 185, 473. [Google Scholar] [CrossRef] [PubMed]
- Zuo, P.; Lu, X.; Sun, Z.; Guo, Y.; He, H. A review on syntheses, properties, characterization and bioanalytical applications of fluorescent carbon dots. Microchim. Acta 2015, 183, 519–542. [Google Scholar] [CrossRef]
Figure 1.
Categorization of PFASs, including sub-groups and representative individual species. This figure includes the number of related peer-reviewed articles from 2002 to 2016. Reprinted with permission from Ref. [14]. Copyright 2017 American Chemical Society.
Figure 1.
Categorization of PFASs, including sub-groups and representative individual species. This figure includes the number of related peer-reviewed articles from 2002 to 2016. Reprinted with permission from Ref. [14]. Copyright 2017 American Chemical Society.

Figure 2.
Schematic representation of this review’s topic of research: PFAS detection in contaminated water sources.
Figure 2.
Schematic representation of this review’s topic of research: PFAS detection in contaminated water sources.

Figure 3.
Representations of (a–f) optical, (g–i) electrochemical, and (j,k) mixed sensors, according to their sensing mechanisms. (a) “turn-on” fluorescent sensor using fluorescein, a quencher, and the PFAS-capturing probe; (b) “turn-off” fluorescent sensor using nanoparticles in a metal–organic framework (MOF) as the sensing probe for PFOS; (c) smartphone app-based portable sensor based on the color change of dyes upon conjugation with PFOA; (d) colorimetric sensor for PFASs based on the interaction between modified gold nanoparticle probes and PPARα activated by PFASs; (e) SPR optical fiber biosensor using monospecific antibodies as the PFAS-capturing probe; (f) light scattering-based PFAS sensor using cationic dyes as the probe; (g) microelectrode for voltametric detection of PFASs; (h) MOF-based microfluidic impedance sensor for PFOS; (i) Potentiometric PFAS sensor with fluorous anion-exchange membranes; (j) disposable photoelectrochemical sensing strip for PFASs; (k) ECL sensor for PFOA using molecularly imprinted ultrathin graphitic carbon nitride nanosheets as a probe. Reprinted with permission from Ref. [3]. Copyright 2021 American Chemical Society.

Figure 4.
(a) Fluorescence intensity response of the up-conversion nanoparticles (dispersed in DMF) to different amounts of PFOS; (b) plot of F0−F vs. log [PFOS] (F0 and F are the fluorescence intensities at 550 nm in the absence and presence of PFOS, respectively). Reprinted with permission from Ref. [47]. Copyright 2019 American Chemical Society.

Figure 5.
CDs’ emission (λex of 560 nm) in the presence of gradually increasing concentrations of (a) PFOS and (c) PFOA; representation of the linear correlation between the fluorescence of the CDs and the concentration of (b) PFOS and (d) PFOA; (e) time-resolved fluorescence lifetime decay of the CDs in the absence and the presence of PFOS and PFOA; and (f) representation of the calculated LUMO and HOMO energies for the CDs, PFOS, and PFOA. Reprinted with permission from the authors of [112].

Figure 6.
Calibration curves for the determination of PFOS via fluorescence (A), spectrophotometry (B), and RLS (C). Reproduced here with authorization from the authors of [45].
Figure 6.
Calibration curves for the determination of PFOS via fluorescence (A), spectrophotometry (B), and RLS (C). Reproduced here with authorization from the authors of [45].

Figure 7.
Schematic representation of the interaction between CDs and PFASs and the resulting fluorescence quenching. Reproduced here with authorization from the authors of [112].
Figure 7.
Schematic representation of the interaction between CDs and PFASs and the resulting fluorescence quenching. Reproduced here with authorization from the authors of [112].

Figure 8.
(a) Schematic representation of the sensing process of PFOS using CDs and EB; (b) fluorescence and second-order scattering spectra of the CD/EB system in the presence of PFOS (0–30 µM). In the inset are the samples upon excitation with a 254 nm UV lamp; (c) representation of the correlation between fluorescence intensity and PFOS concentration and respective linear range (inset). Reproduced here with authorization from Ref. [114], Copyright 2023 Elsevier B.V., its licensors, and contributors.


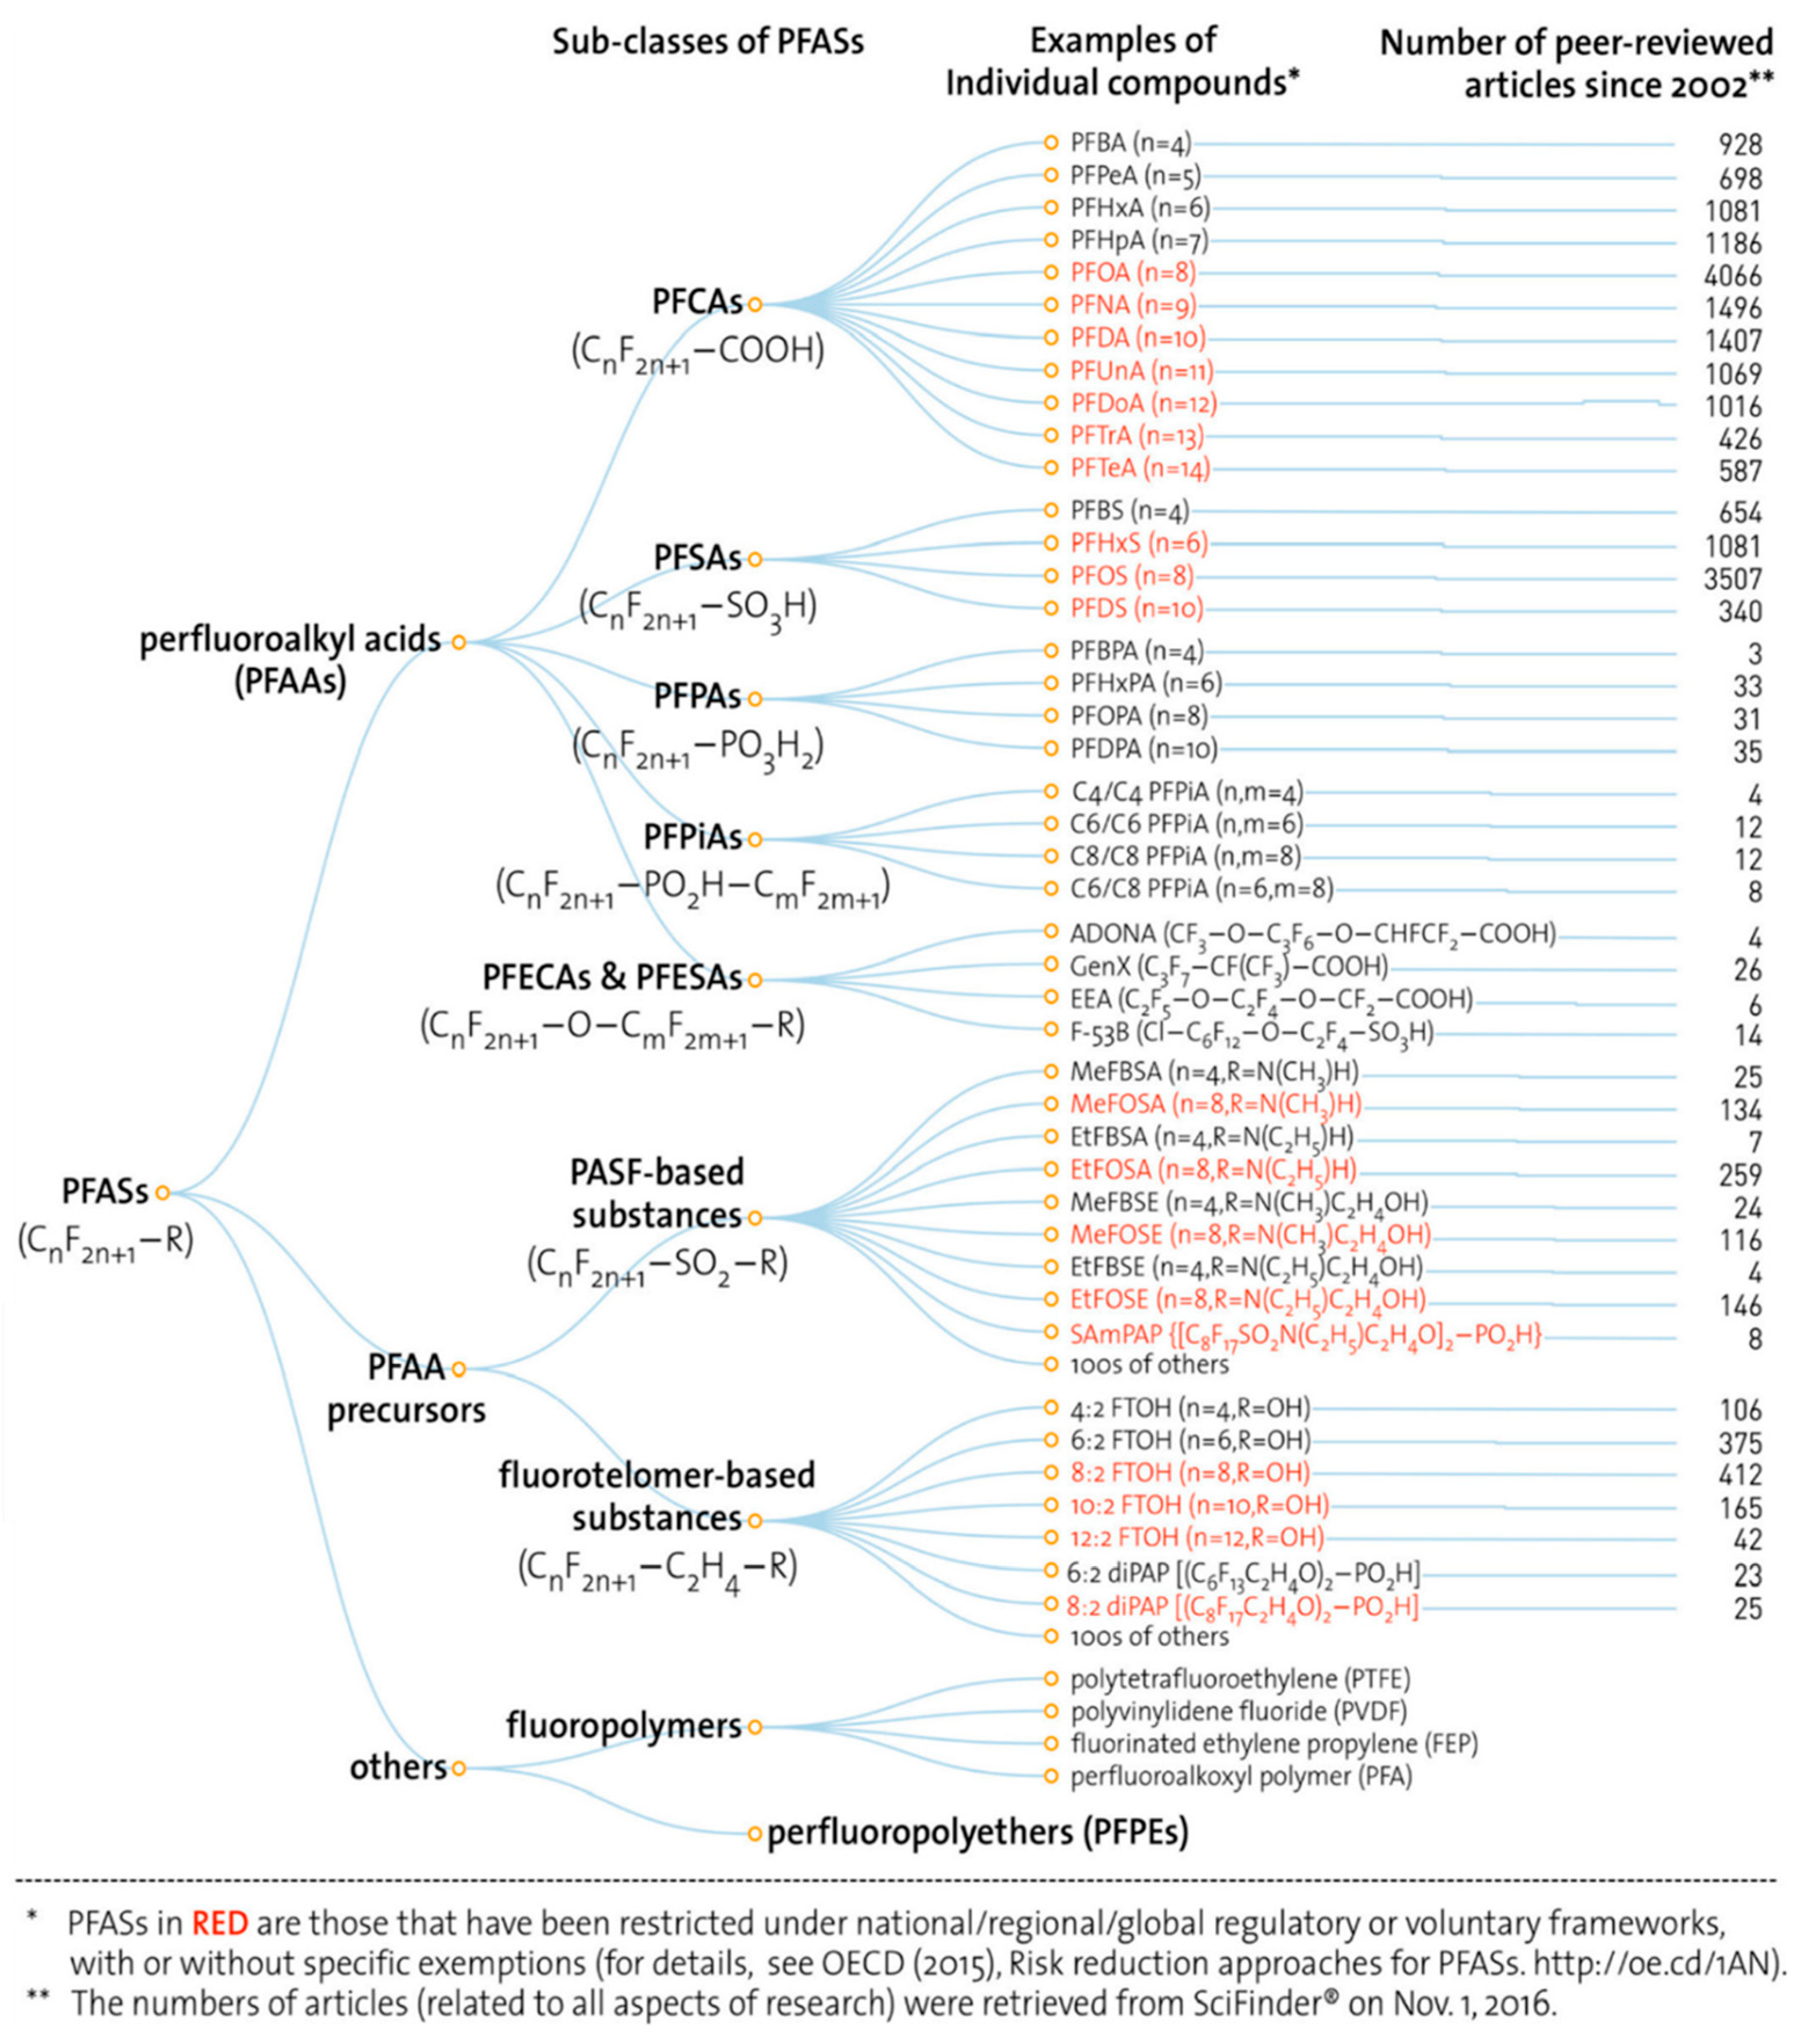
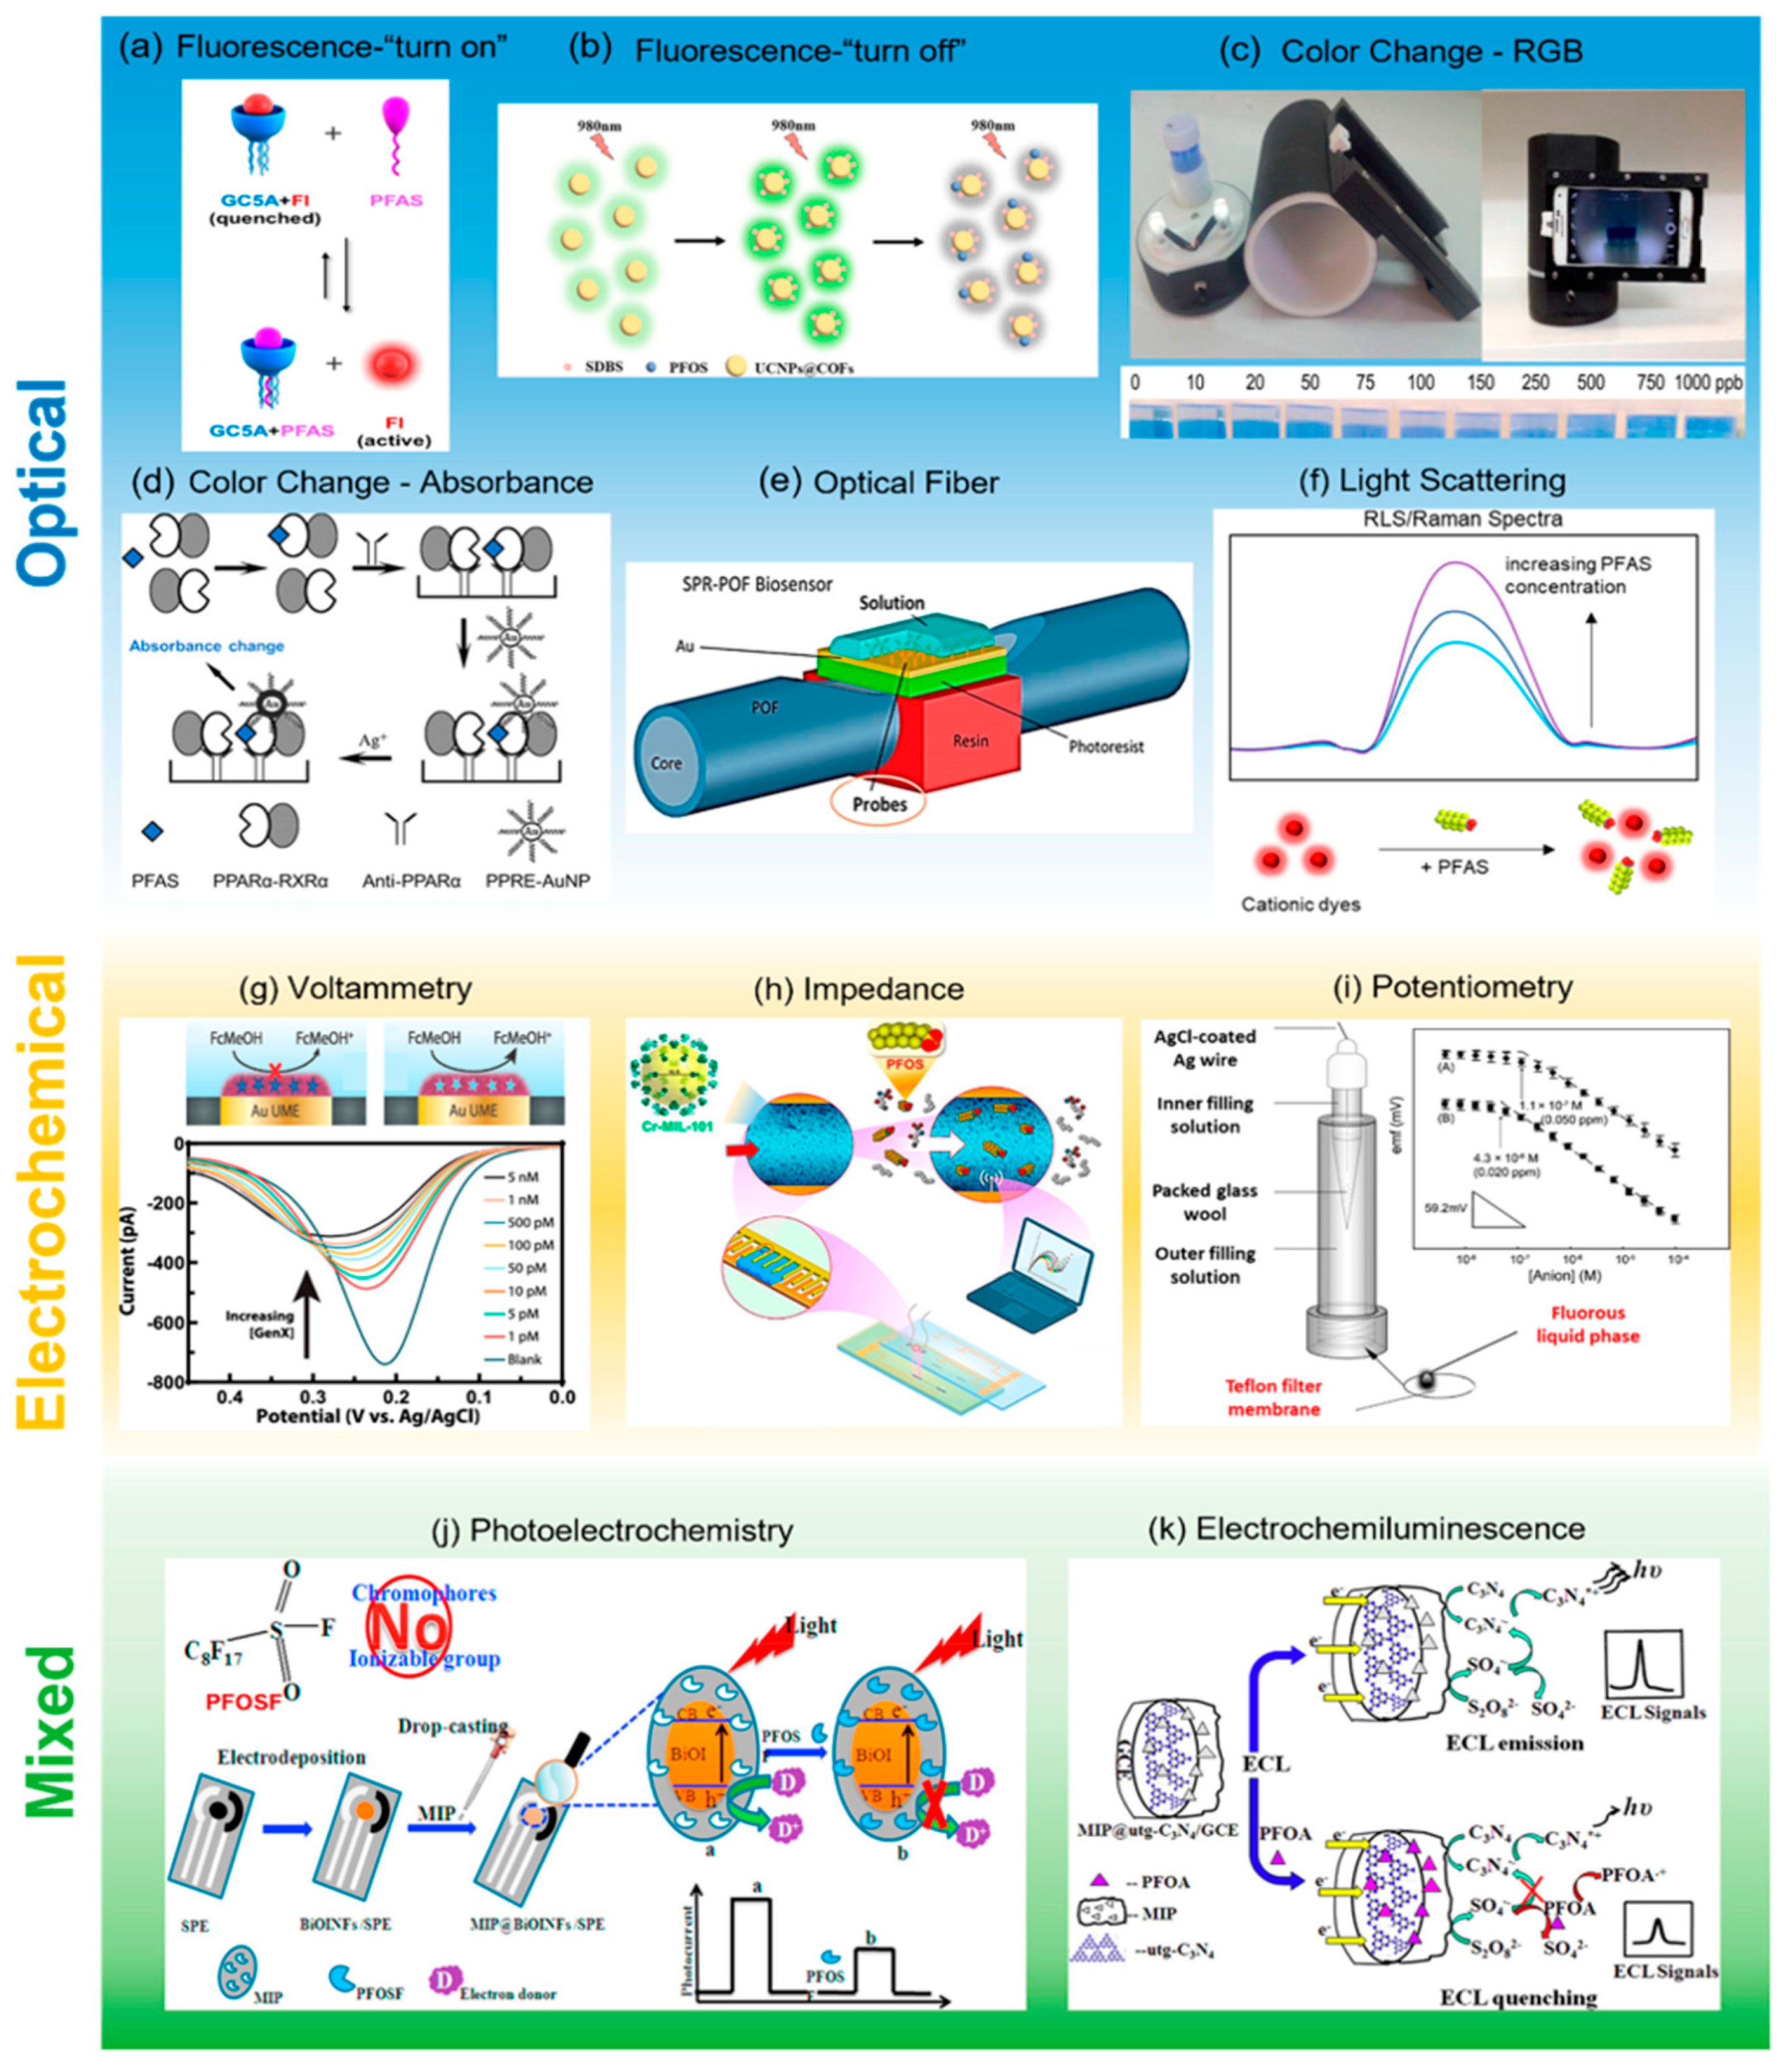
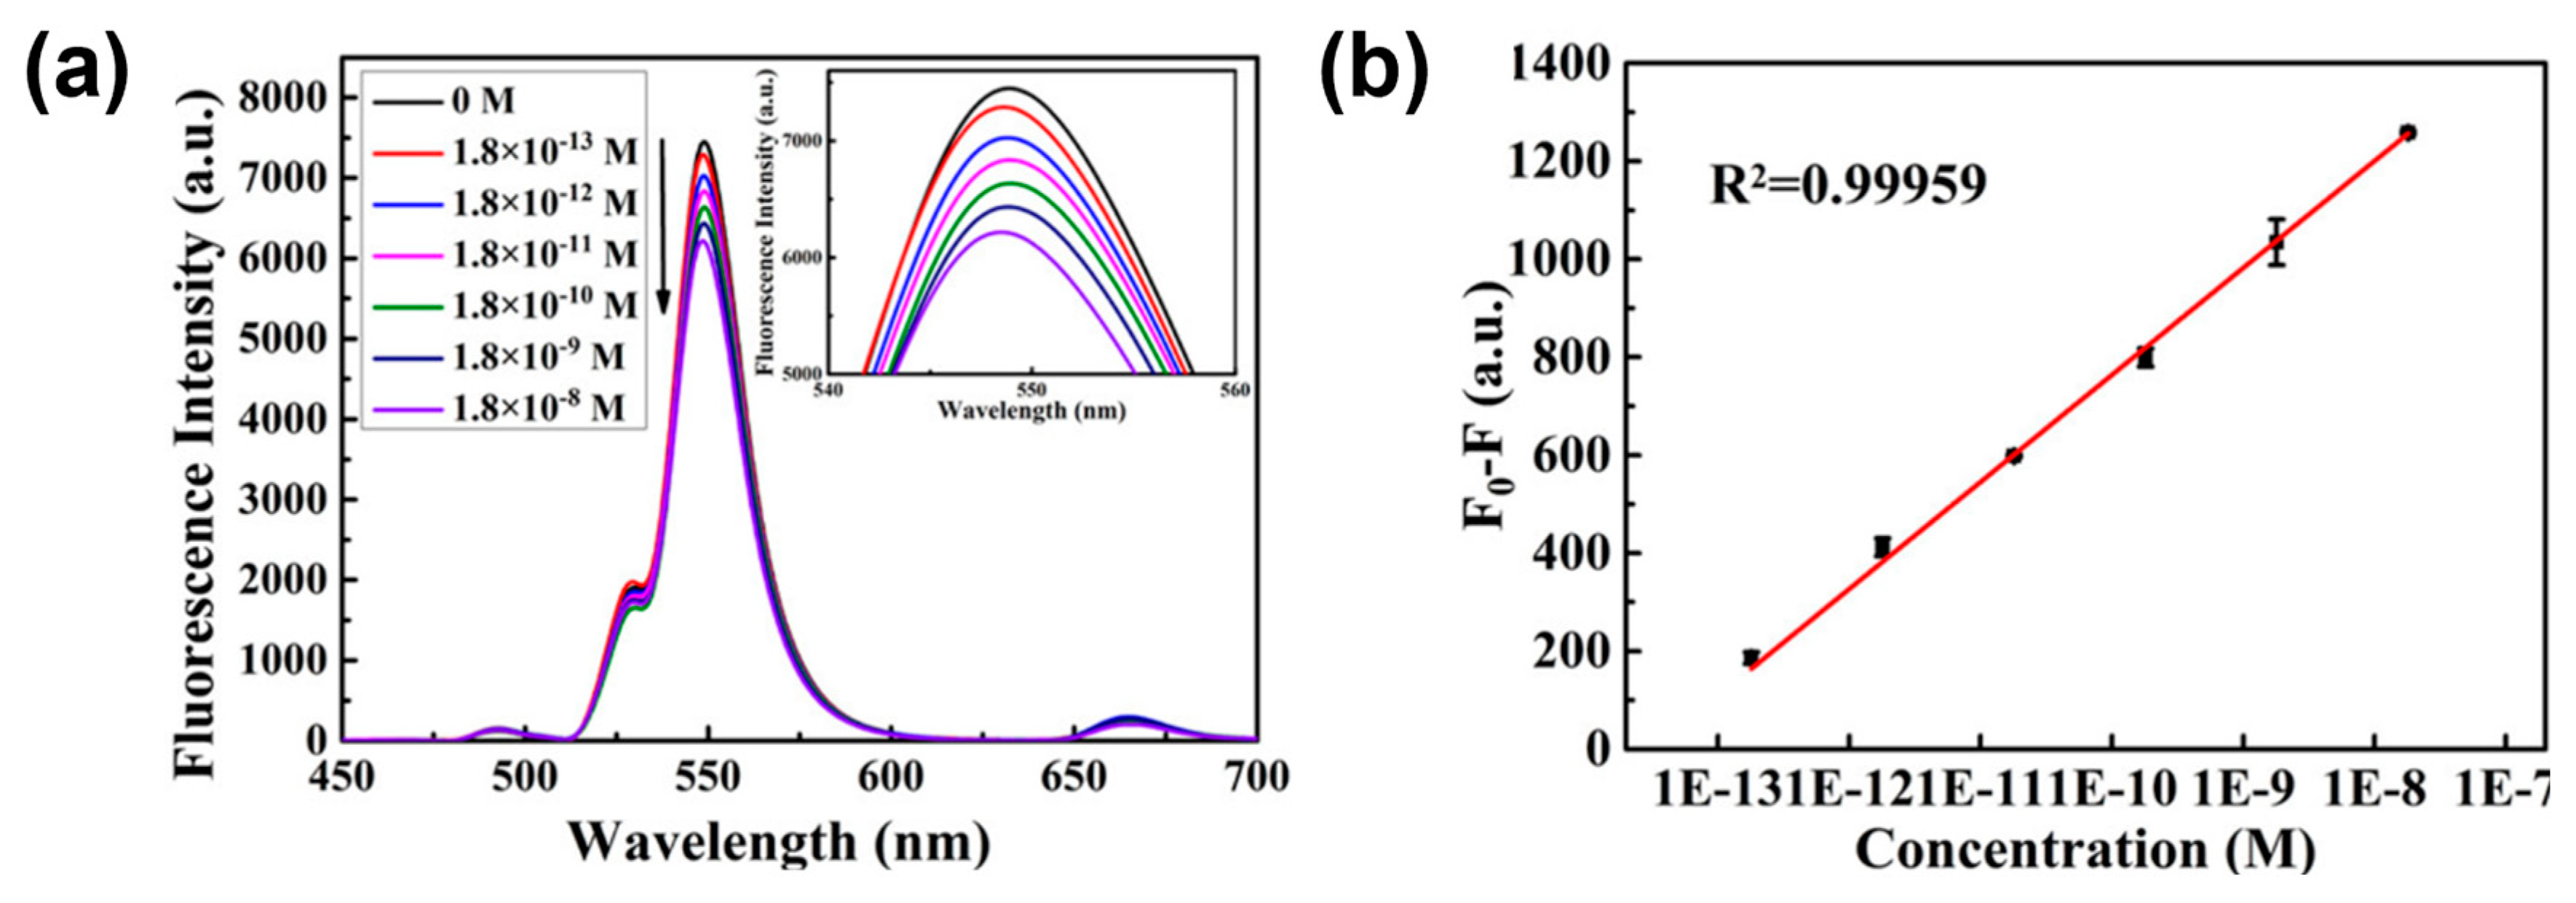
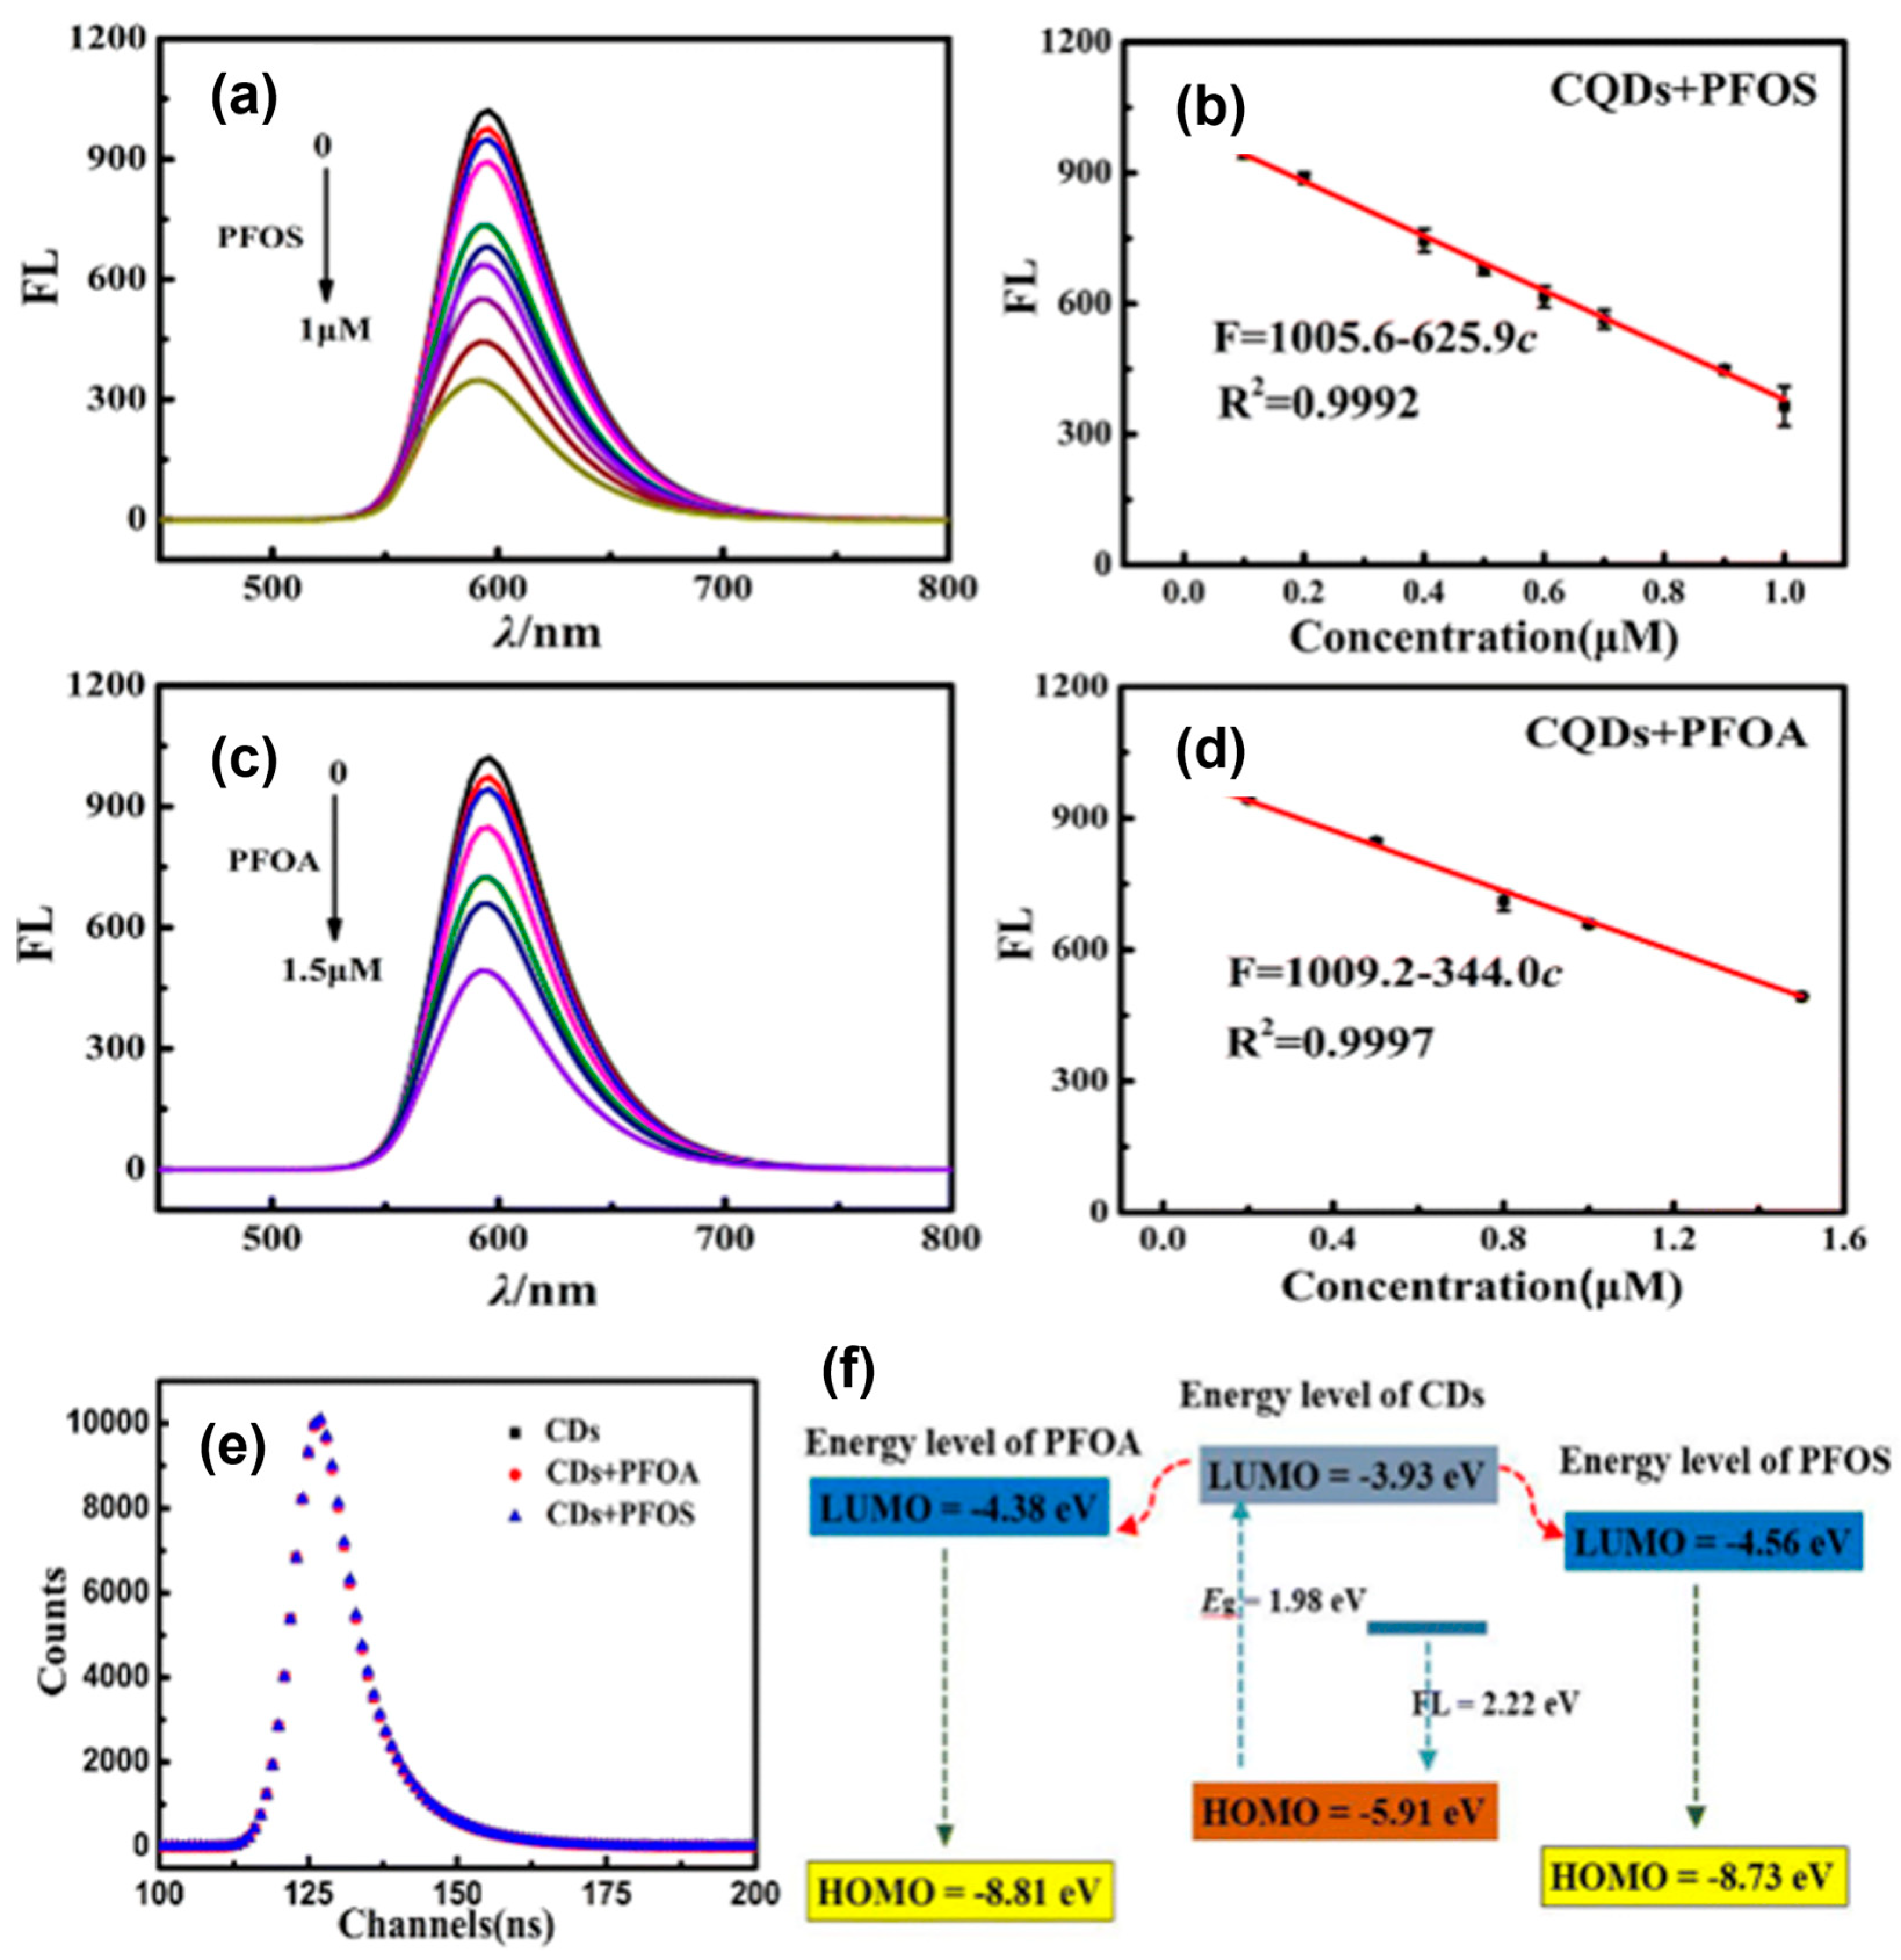
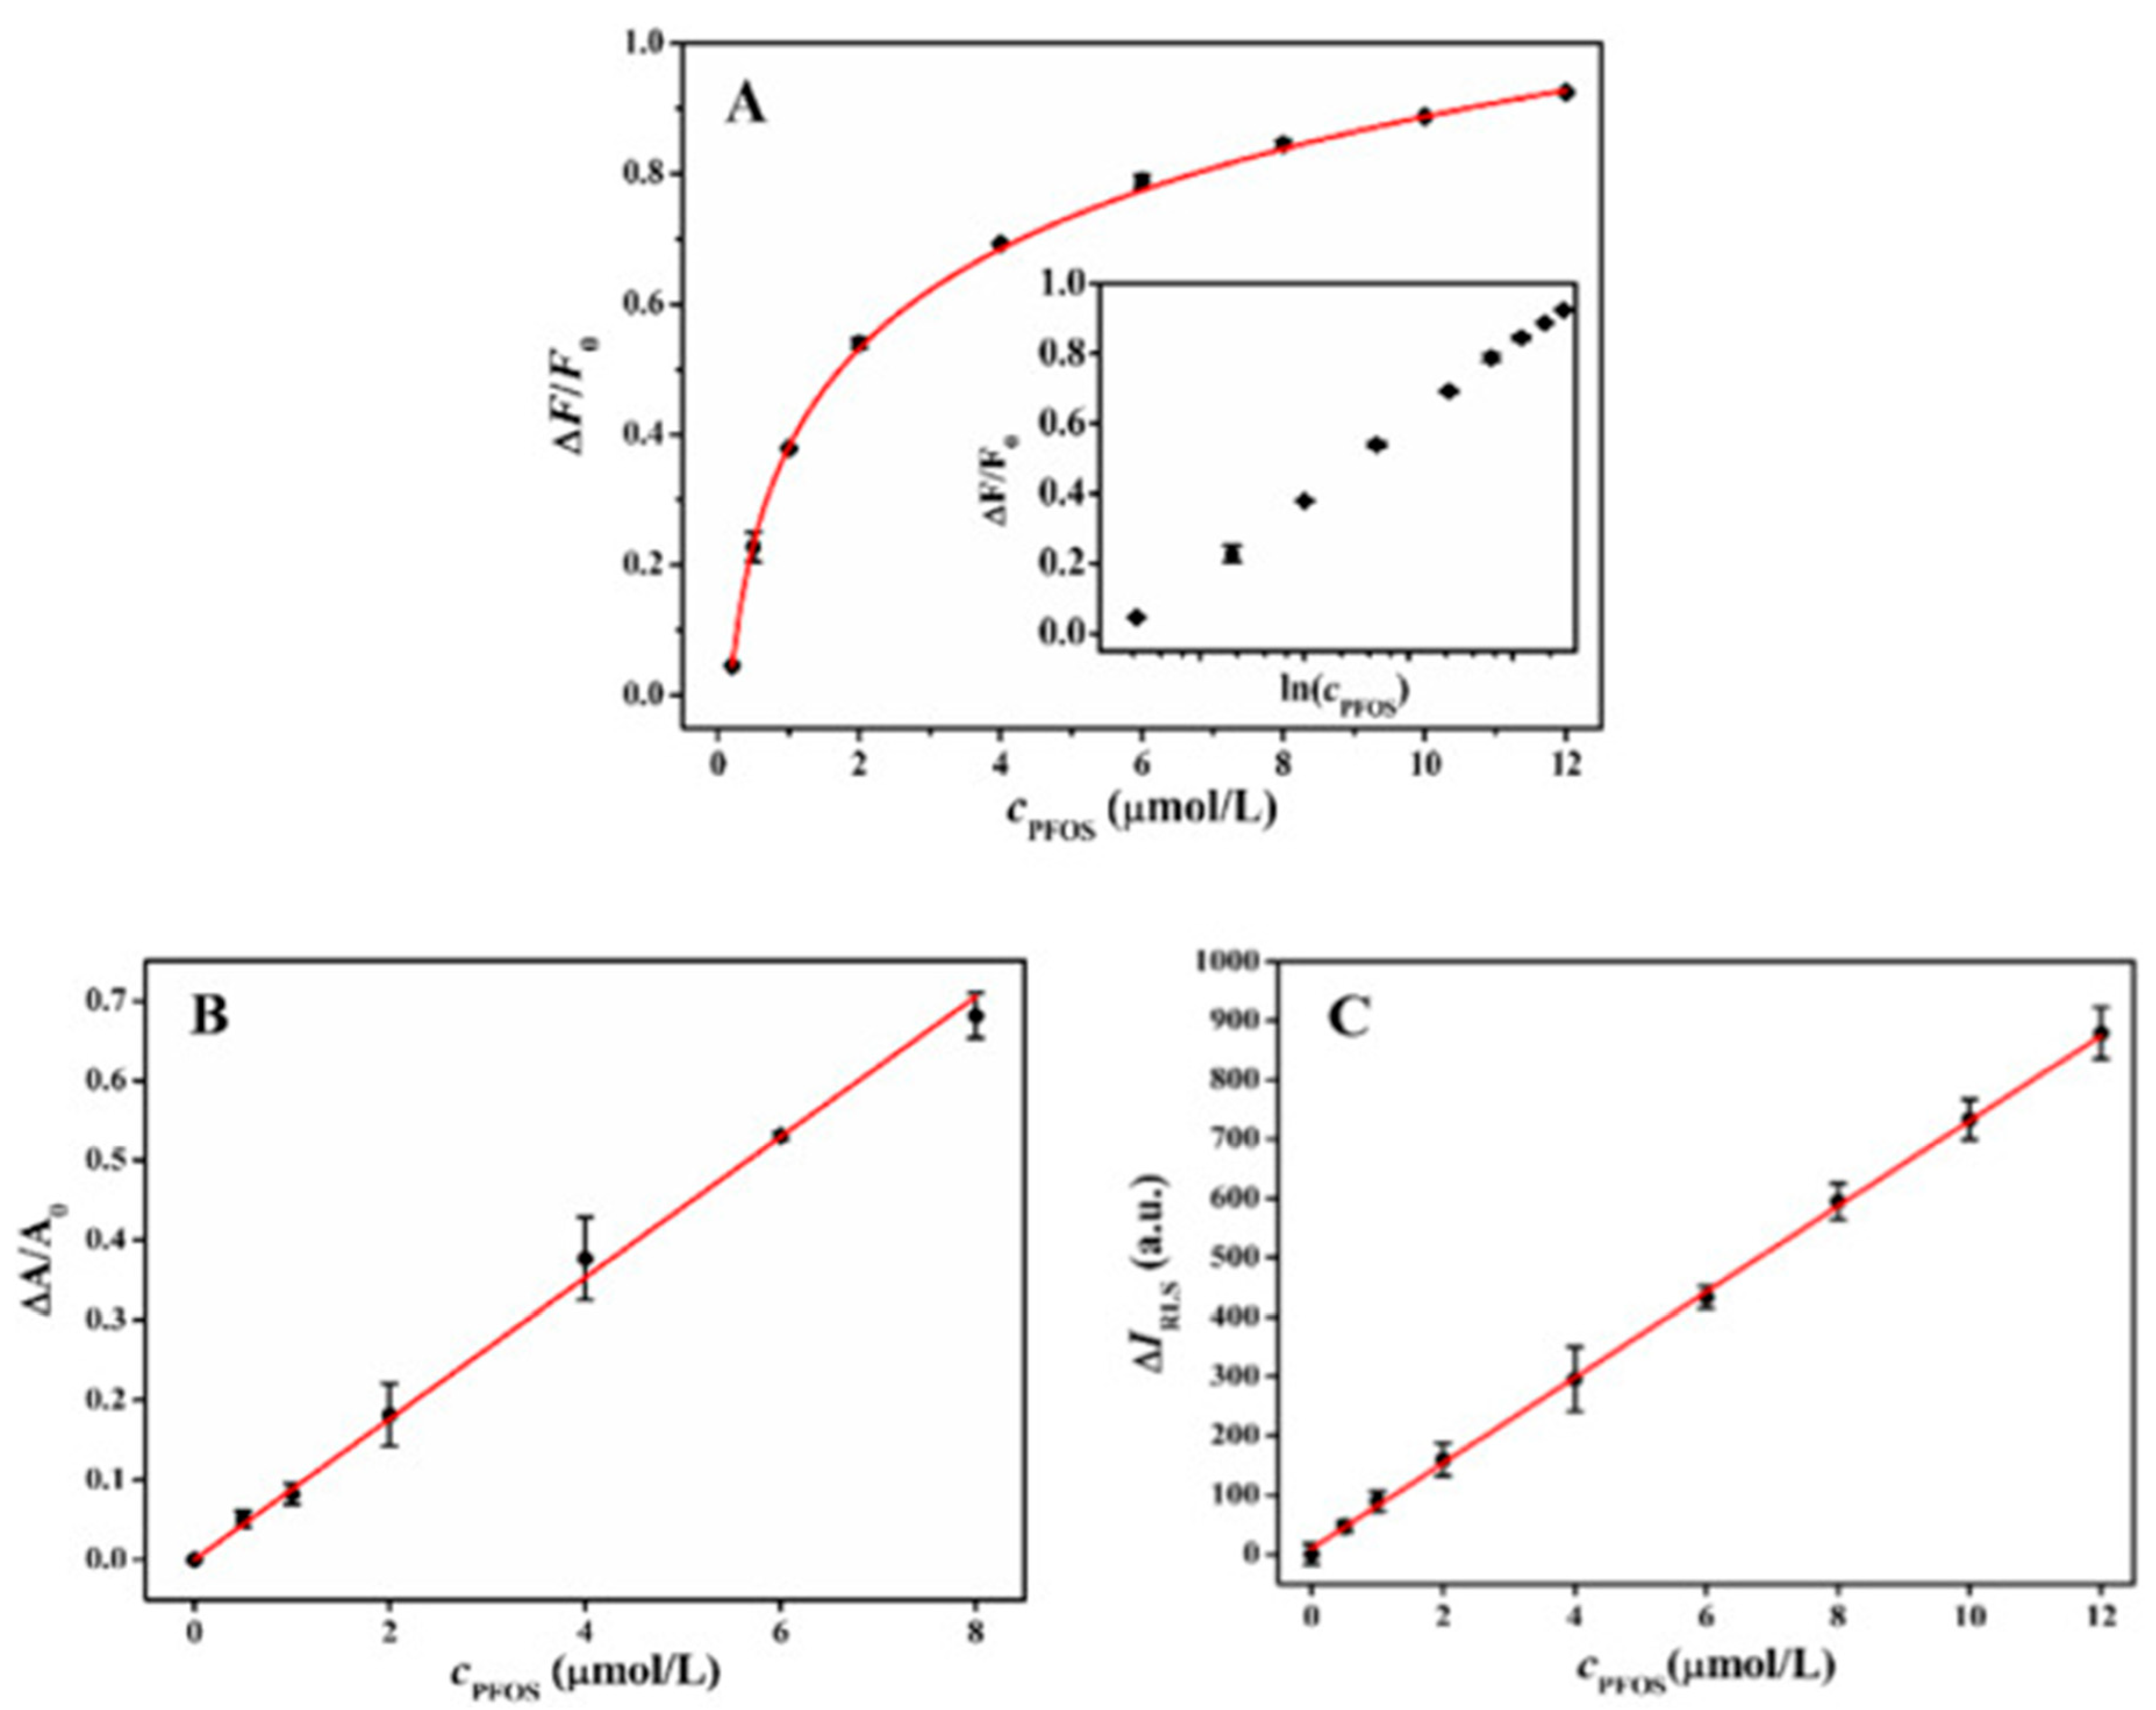
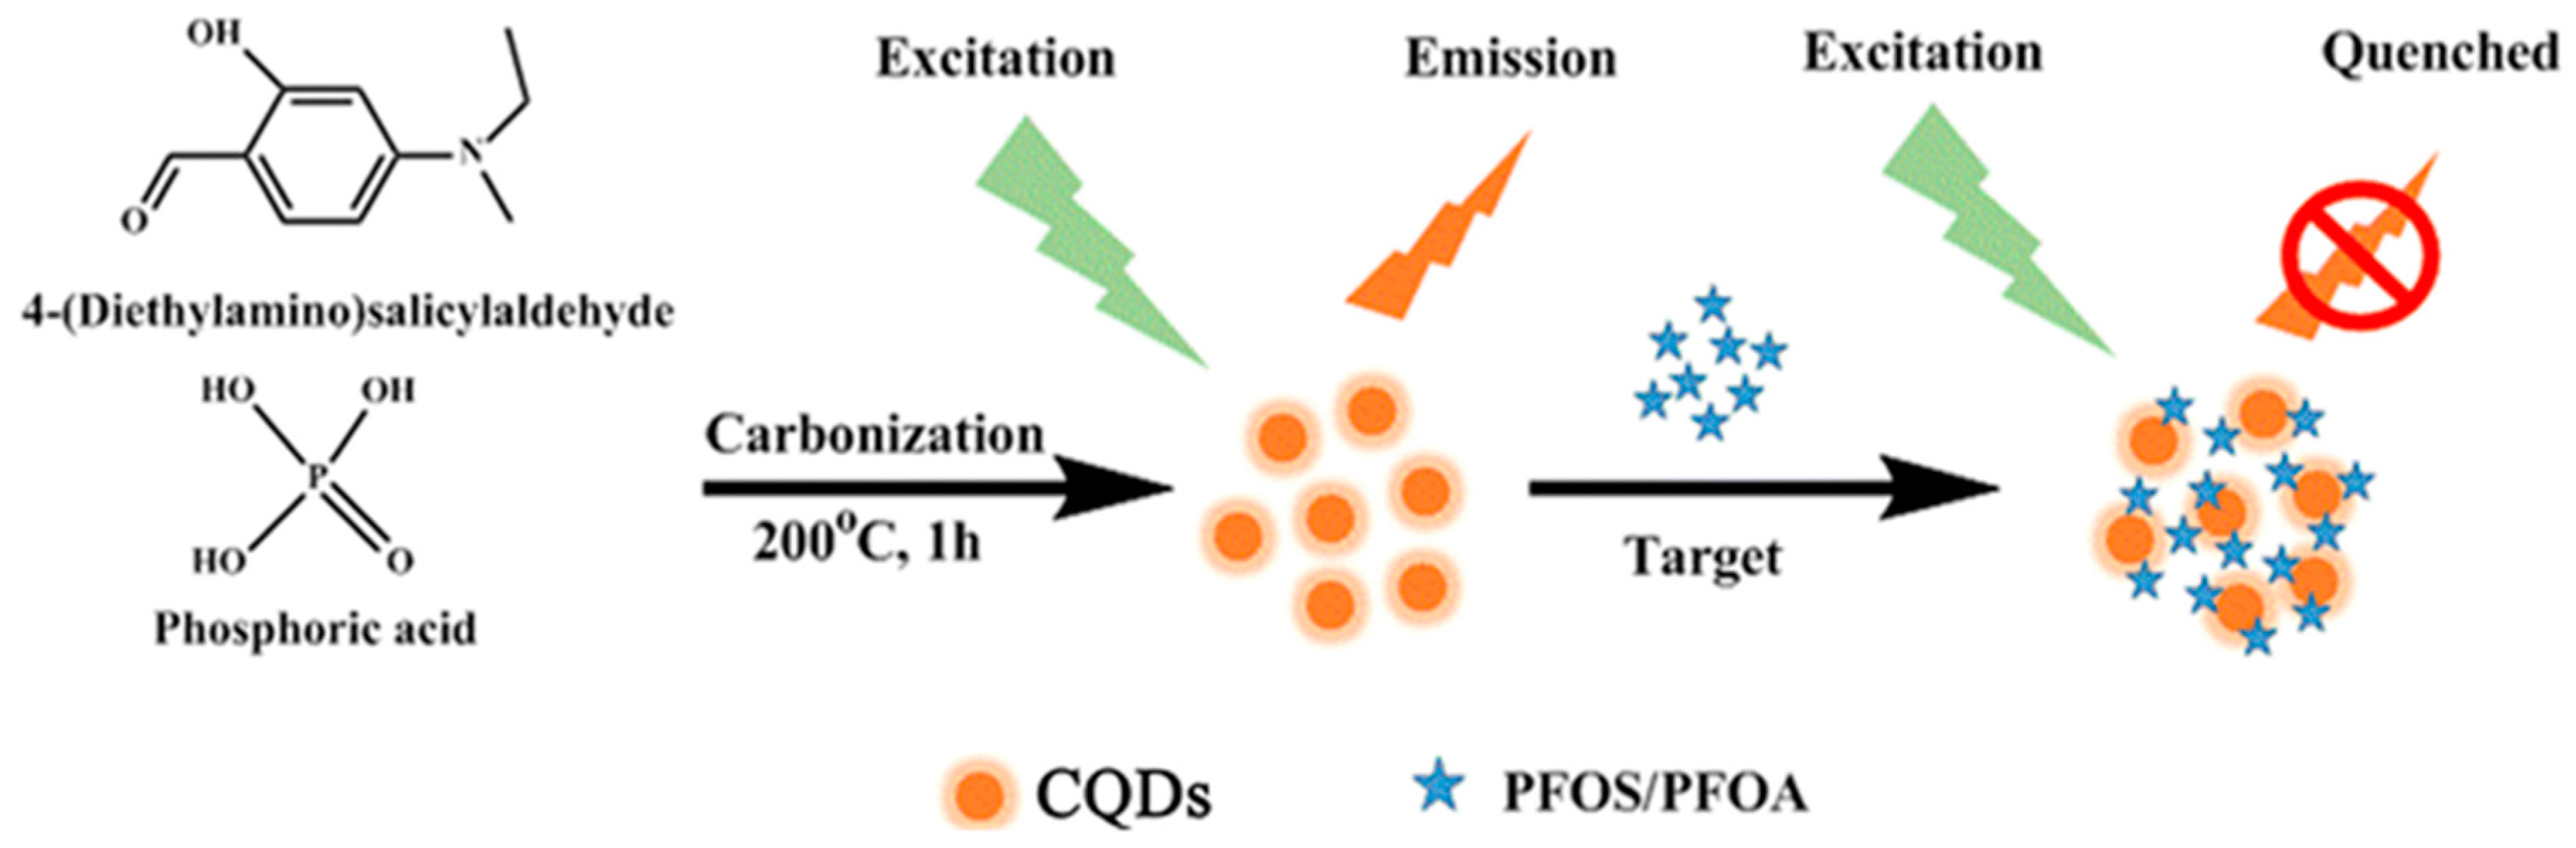
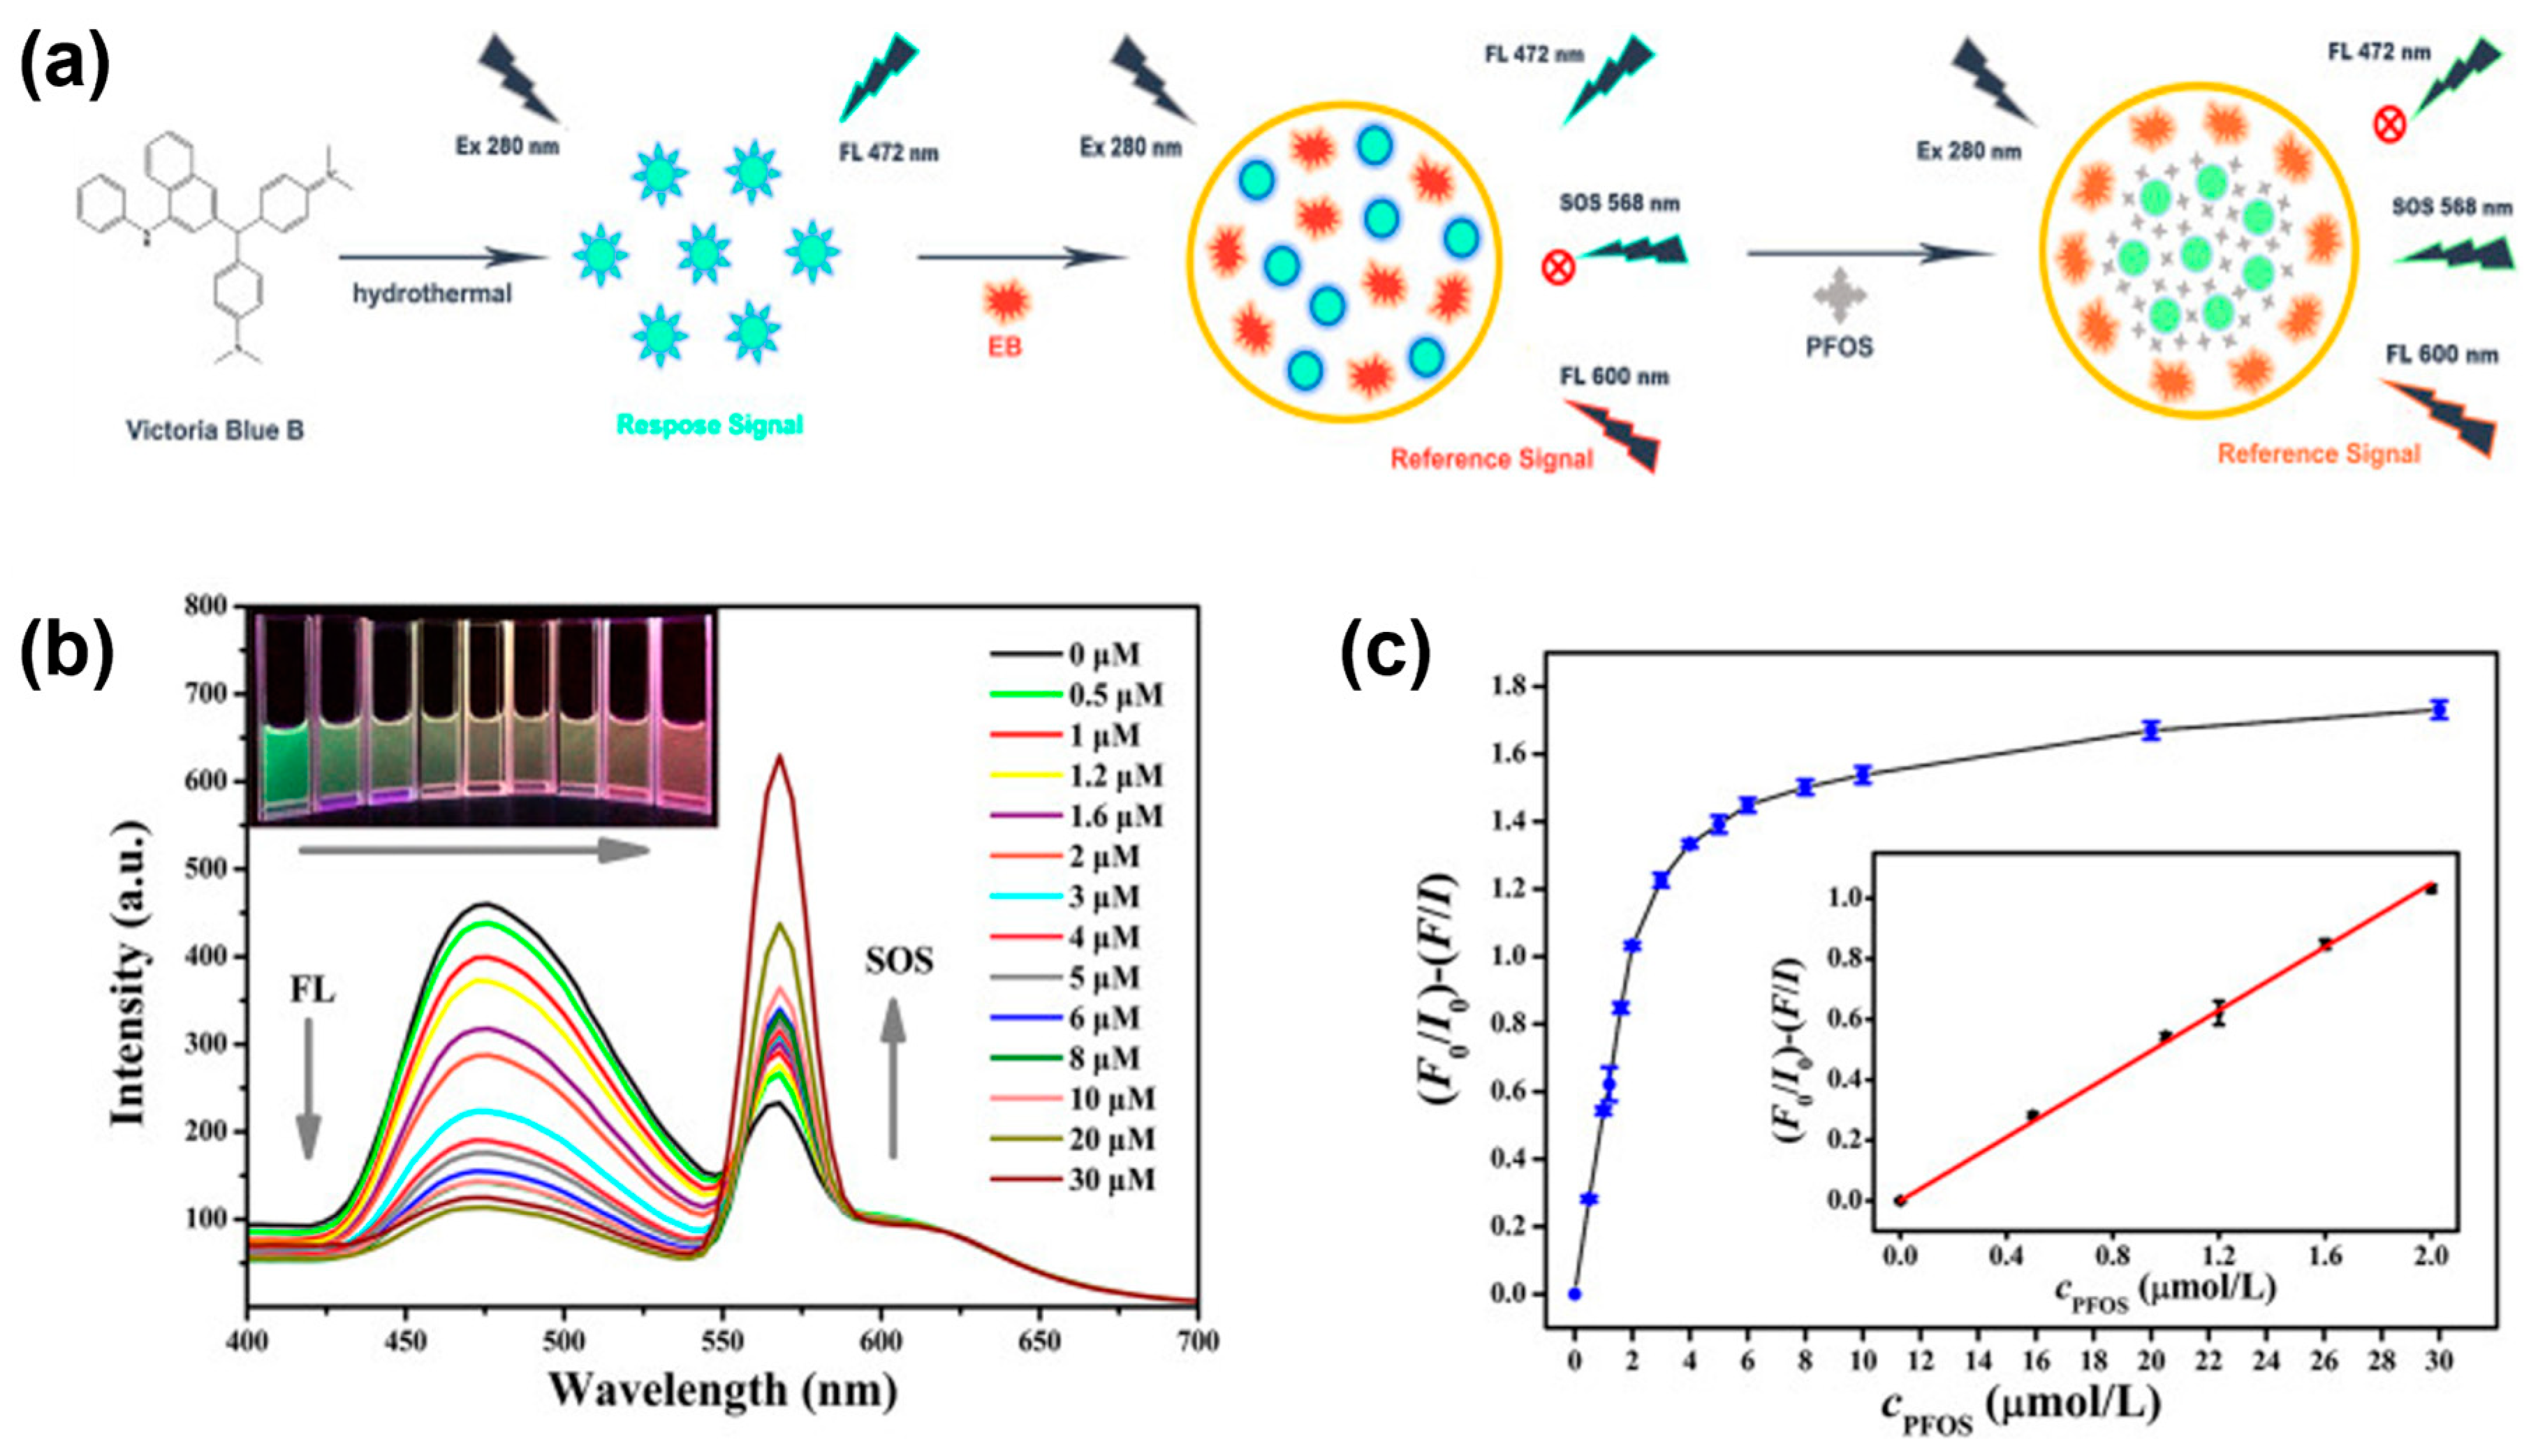
Table 1.
Parameters reported for several PFAS sensors with different mechanisms and components. NA—not available.
Table 1.
Parameters reported for several PFAS sensors with different mechanisms and components. NA—not available.
| Sensor | Sensing Mechanism | Analyte | LOD | Linear Range (ng L−1) | Ref. |
|---|---|---|---|---|---|
| LC-MS/SPE | Chromatography | PFOA | 0.07 ng L−1 | 1–200 ng L−1 | [38] |
| PFOS | 0.01 ng L−1 | 0.1–100 ng L−1 | |||
| PFNA | 1.15 ng L−1 | 4–1000 ng L−1 | |||
| PFDA | 0.88 ng L−1 | 10–1000 ng L−1 | |||
| AuNPs | Colorimetric | PFOS | 10 pM | 100–1000 pM | [55] |
| MIP | SPR | PFOA | 0.13 ppb | NA | [51] |
| PFOS | 0.15 ppb | ||||
| AgNPs/graphene oxide | Raman | PFOA | 50 ppb | NA | [56] |
| MIP on a Au electrode | Voltammetry | PFOS | 0.04 nM | 0.1–4.9 nM | [57] |
| MOF | Impedance | PFOS | 0.5 ng L−1 | NA | [60] |
| Ion-selective electrodes | Potentiometric | PFOA | 0.07 ppb | 10−1–10−1 M | [61] |
| PFOS | 0.43 ppb | 10−1–10−1 M | |||
| Screen-printed carbon electrode | PEC | PFOSF | 0.01 ppb | 0.05–500 ppb | [64] |
| C3N4 nanosheets/S2O82− | ECL | PFOA | 0.01 ppb | 0.02–40 ppb | [65] |
| MoS2/Fe3O4 nanoparticles | Colorimetric | PFOS | 8.6 nM | 0.1–12.5 µM | [54] |
| CdS QDs | Fluorescence | PFOA | 0.3 µM | 0.5–40 µM | [73] |
| CDs | Fluorescence | PFOA | 1.8 µM | 10–70 µM | [111] |
| CDs/BH | Fluorescence | PFOS | 21.7 nM | 0.22–50 µM | [110] |
| CDs/MIP | Fluorescence | PFOS | 0.4 pg L−1 | 20–200 pg L−1 | [121] |
| CDs | Fluorescence | PFOS | 0.3 nM | 0.3–160 nM | [115] |
| CDs | Fluorescence | PFOS | 5 nM | 0.05–1 µM | [112] |
| PFOA | 10 nM | 0.1–1.5 µM | |||
| CDs/EB | Fluorescence | PFOS | 27.8 nM | 0–2 µM | [114] |
| CDs | Fluorescence | PFOS | 18.27 nM | 0.2–12 µM | [45] |
| Colorimetric | PFOS | 75.89 nM | 0.5–8 µM | ||
| Light scattering | PFOS | 120.45 nM | 0.5–12 µM |
Disclaimer/Publisher’s Note: The statements, opinions and data contained in all publications are solely those of the individual author(s) and contributor(s) and not of MDPI and/or the editor(s). MDPI and/or the editor(s) disclaim responsibility for any injury to people or property resulting from any ideas, methods, instructions or products referred to in the content. |
© 2023 by the authors. Licensee MDPI, Basel, Switzerland. This article is an open access article distributed under the terms and conditions of the Creative Commons Attribution (CC BY) license (https://creativecommons.org/licenses/by/4.0/).
Share and Cite
MDPI and ACS Style
Sendão, R.M.S.; Esteves da Silva, J.C.G.; Pinto da Silva, L. Polyfluoroalkyl Substances (PFASs) Detection Via Carbon Dots: A Review. Sustain. Chem. 2023, 4, 339-362. https://0-doi-org.brum.beds.ac.uk/10.3390/suschem4040024
AMA Style
Sendão RMS, Esteves da Silva JCG, Pinto da Silva L. Polyfluoroalkyl Substances (PFASs) Detection Via Carbon Dots: A Review. Sustainable Chemistry. 2023; 4(4):339-362. https://0-doi-org.brum.beds.ac.uk/10.3390/suschem4040024
Chicago/Turabian StyleSendão, Ricardo M. S., Joaquim C. G. Esteves da Silva, and Luís Pinto da Silva. 2023. "Polyfluoroalkyl Substances (PFASs) Detection Via Carbon Dots: A Review" Sustainable Chemistry 4, no. 4: 339-362. https://0-doi-org.brum.beds.ac.uk/10.3390/suschem4040024