

Waste Lignocellulosic Biomass as a Source for Bioethanol Production
Faculty of Chemistry and Chemical Engineering, University of Maribor, Smetanova 17, 2000 Maribor, Slovenia
*
Author to whom correspondence should be addressed.
Sustain. Chem. 2024, 5(1), 1-12; https://0-doi-org.brum.beds.ac.uk/10.3390/suschem5010001
Submission received: 24 January 2024
/
Revised: 23 February 2024
/
Accepted: 24 February 2024
/
Published: 28 February 2024
(This article belongs to the Topic Biomass Transformation: Sustainable Development)
Abstract
:Synthetically produced biofuels play a critical role in the energy transition away from fossil fuels. Biofuels could effectively lower greenhouse gas (GHG) emissions and contribute to better air quality. One of these biofuels is bioethanol, which could act as a gasoline replacement. For this purpose, a simulation of bioethanol production through lignocellulosic biomass fermentation, focused on distillation, was carried out in simulation software Aspen Plus. Since the possibility of absolute ethanol production through distillation is limited by the ethanol–water azeotrope, pressure swing distillation (PSD) was used to obtain fuel-grade ethanol (EtOH) with a fraction of 99.60 wt.%. The flowsheet was optimised with NQ analysis, which is a simple optimisation method for distillation columns. We found that the PSD has the potential to concentrate the EtOH to a desired value, while simultaneously removing other unwanted impurities whose presence is a consequence of pretreatment and fermentation processes.
1. Introduction
Lignocellulosic biomass is the most widespread form of renewable raw material on Earth. It accounts for half of the plant resources obtained through photosynthesis [1]. Due to its abundance, availability, and global renewability, it represents the most important alternative to fossil fuels, especially for the production of second-generation biofuels, chemicals, and materials from biological sources, without influencing global food security. Lignocellulosic biomass includes agricultural residues and energy crops as well as woody biomass. On the other hand, transportation is responsible for 15% of global greenhouse gas emissions and 23% of total energy-related CO2 emissions [2]. To reduce the dependence on petroleum-based fuels and mitigate climate change, biofuels are widely seen as promising alternative transportation fuels. Biofuels such as bioethanol have been proven to emit significantly less GHG than petroleum-based fuels.
Second generation bioethanol is produced from lignocellulosic biomass [3]. The production consists of four major steps. First, pretreatment is conducted to break down the lignocellulosic structure, consisting of lignin, cellulose, and hemicellulose. This ensures the accessibility of cellulose and hemicellulose for hydrolysis, which hydrolyses the two components in fermentable sugars. Both pentoses and hexoses are then ideally fermented into EtOH in the third step. Lastly, the purification of the fermentation product is required to provide fuel-grade EtOH [4].
Even though the EtOH can be purified by distillation, purity higher than 95.6 wt.% EtOH cannot be achieved with conventional distillation, due to the EtOH-H2O azeotrope [5]. Among the challenges in second-generation bioethanol production, the main ones are financially achievable pretreatment for the deconstruction of lignocellulosic structure and the optimisation of enzymes to maximise fermentable sugar yields [3]; the dehydration step also represents a major challenge in bioethanol production plants [6], due to its high energy demand [4]. To achieve fuel-grade purity of 99.60 wt.%, numerous technologies are available, like pressure swing adsorption (PSA) [7,8], membrane separation [6], and extractive, azeotropic, and pressure swing distillation [4,5]. The latter has an advantage among the distillation techniques, since it does not depend on an entrainer to separate the EtOH-H2O azeotrope [5]. Membrane separation has the same advantage, besides its low energy consumption, but requires a high capital investment [6].
Second-generation bioethanol production has been studied extensively, and even though it has seen rapid advancements, its production is still inefficient [3]. Due to the high energy requirements of the purification step, the present work focuses on the PSD, since according to our knowledge, not many studies have been conducted on that topic. The presented research therefore deals with the development of the process for bioethanol purification.
Few processes have been developed. Mulia-Soto and Flores-Tlacuahuac developed a model of internal heat-integrated pressure swing distillation. The process was used for the separation of an azeotropic mixture of EtOH and water (H2O) and the production of high-purity EtOH suitable for the transportation sector. The system consisted of 30 trays; the feed was fed into the 23rd tray of the first column, while the reflux was fed to the 13th tray. The vapour from the first column was fed into the 14th tray. The feed and distillate of the first column contained 20 mol% (38.99 wt.%) and 85.9 mol% EtOH, respectively [9]. Iqbal and Ahmad used the same conditions [10]. In the flowsheet of Kiran and Jana, a 20 mol% EtOH solution was used as feed for the 21st tray of the first column. The column was used to produce EtOH at 85.65 mol%; the recycle tray was fed into the eleventh tray, and the distillate from the first column was fed into the twelfth tray of the second column. The PSD was used to produce EtOH with a purity of 99.62 mol% [11].
In our work, the stream from the fermentation unit contained other components, whereas in the literature only water and EtOH were present in the stream. The stream in our work was first concentrated to a higher, 50 wt.% of EtOH. Then, the PSD was applied for a possibility of fuel grade bioethanol production. To reduce GHG emissions and achieve sustainability of the processes, the reduction in energy consumption and optimisation play influential roles. To promote bioethanol production and its alternative to fossil fuels, the work explores many trade-offs that are present in designing the distillation columns and attempts to optimise the columns with a simple yet effective method.
2. Materials and Methods
2.1. Process Feed and Thermodynamic Properties
The simulation of bioethanol distillation was carried out using the Aspen Plus V8 computer program. In accordance with [9,10], we used the Redlich–Kwong equation of state (Wilson RK) to describe the interaction between the components. According to the source, it agrees well with the experimental data.
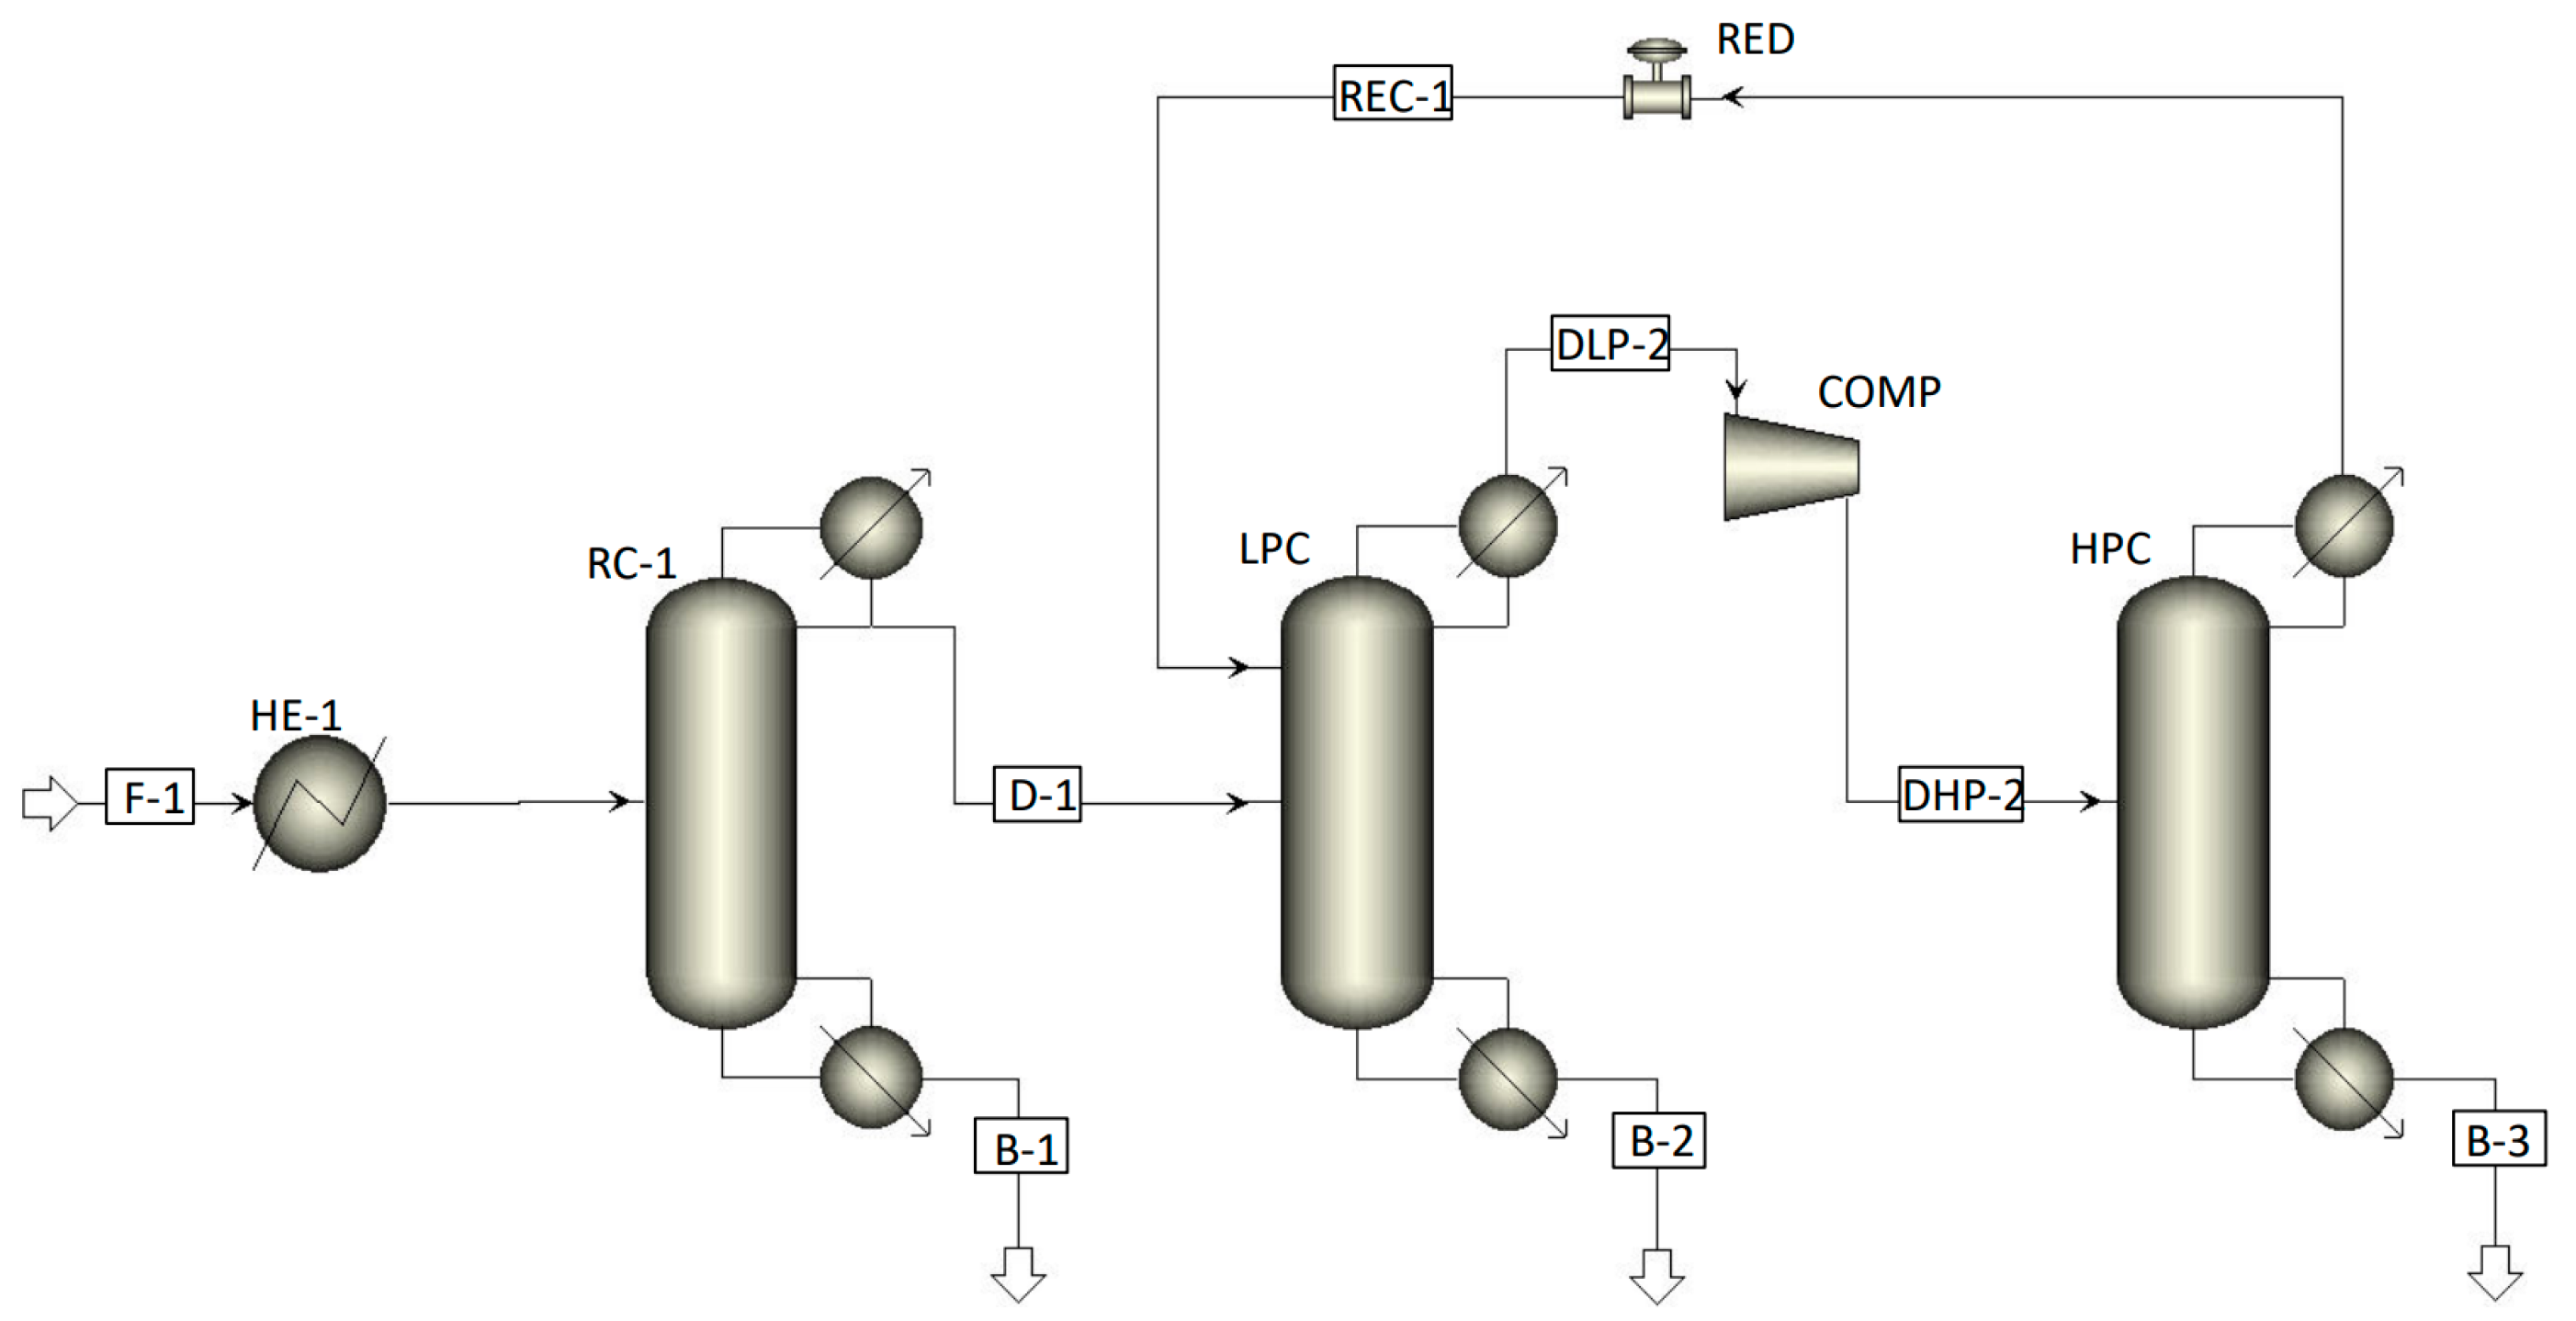
The data used for the simulations were obtained from Cardona and Quintero, from the outlet of the fermentation unit [12]. Apart from H2O and EtOH, the stream included sulfuric acid (H2SO4), Hydroxymethylfurfural (HMF), furfural, and calcium hydroxide (Ca(OH)2). The bacterial culture Z-Mobilis was also present in the stream, which Aspen Plus does not have in its component database, so we had to self-report it along with its properties. To avoid this, we added its proportion to the water content and excluded it from the simulations. The input data are listed in Table 1 and correspond to the feed to the first distillation column RC-1 (process stream F-1 in Figure 1). We used the obtained mass flow rate, temperature, and pressure of 50,188.90 kg/h, 33 °C, and 1 bar, respectively.
2.2. Process Scheme
The entire process shown in Figure 1 consists of three distillation columns and is taken from Karimi et al. [7]. The first column RC-1 is intended for the concentration of EtOH up to 50% by weight. The second and third columns are used to concentrate EtOH to 99.60% by weight.
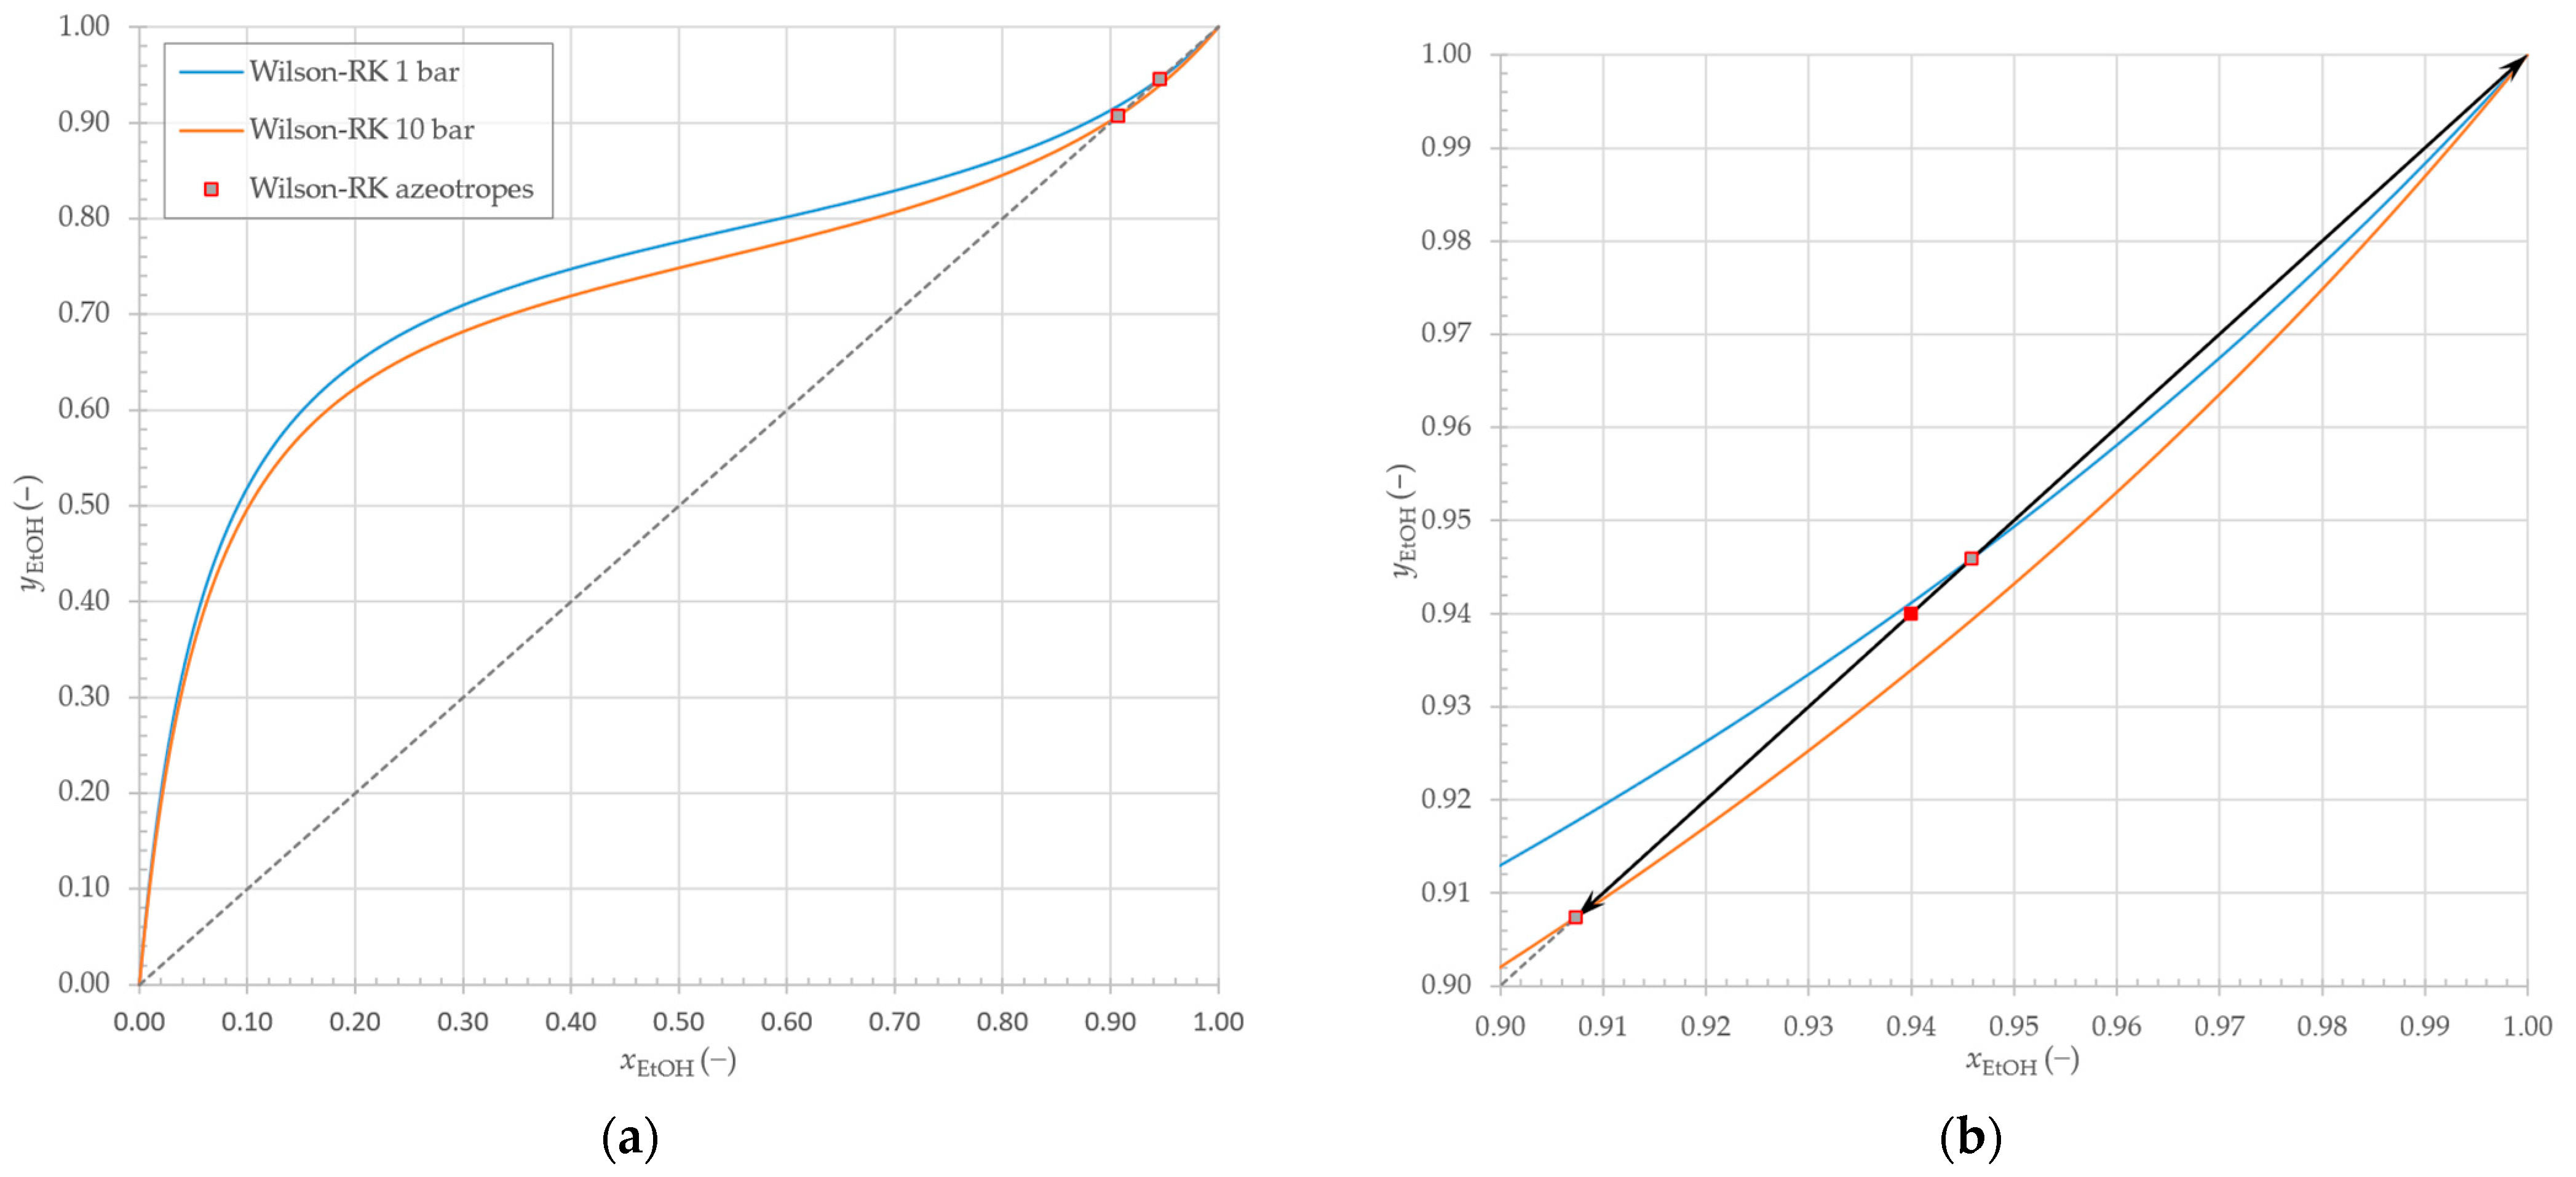
It is known that the azeotropic composition of mixtures changes as a function of pressure, but in the case of a mixture of EtOH and water this change is not so significant [7]. This effect on the azeotrope is shown in Figure 2, in the xy diagrams for EtOH-H2O, where xEtOH and yEtOH represent the fractions of EtOH in equilibrium for liquid and vapour phases, respectively. By properly utilising this property, it is possible to obtain absolute EtOH by distillation without organic solvents.
The basis of PSD is that the two columns operate at different pressures. In our example, the low-pressure column (LPC) operates at 1 bar, while the high-pressure column (HPC) operates at 10 bar. The LPC is used to concentrate EtOH to a composition that is close to the azeotrope, in our case up to 94% by weight. The pressure of the distillate vapour was increased to 10 bar with the compressor COMP, which allows the distillate to reach another, previously inaccessible distillation area that does not have an upper limit regarding azeotropic composition [13]. In the HPC, therefore, EtOH at 99.60 wt.% in the bottom of the column was obtained, while the distillate was close to the azeotropic composition corresponding to the operating pressure of the HPC. In our case, the vapour with a composition of 91.50 wt.% EtOH was fed back into the LPC through the RED reduction valve. The reduction valve lowers the pressure of the vapours to 1 bar. The Radfrac model available in Aspen Plus V8 was used to simulate the distillation columns.
The HE-1 heat exchanger was used to preheat the feed mixture to boiling point. The Heater model, which is available in Aspen Plus V8, was used for the heat exchanger.
2.3. Simulation Procedure
2.3.1. Distillation Column RC-1
First, a simulation of column RC-1 with feed stream F-1 was carried out. The composition of the feed is shown in Section 2.1. The column was simulated with the specifications that the distillate D-1 and bottom B-1 contain 50 wt.% and 0.01 wt.% EtOH, respectively. These values were achieved automatically by varying the reflux ration (RR) and the distillate flow rate.
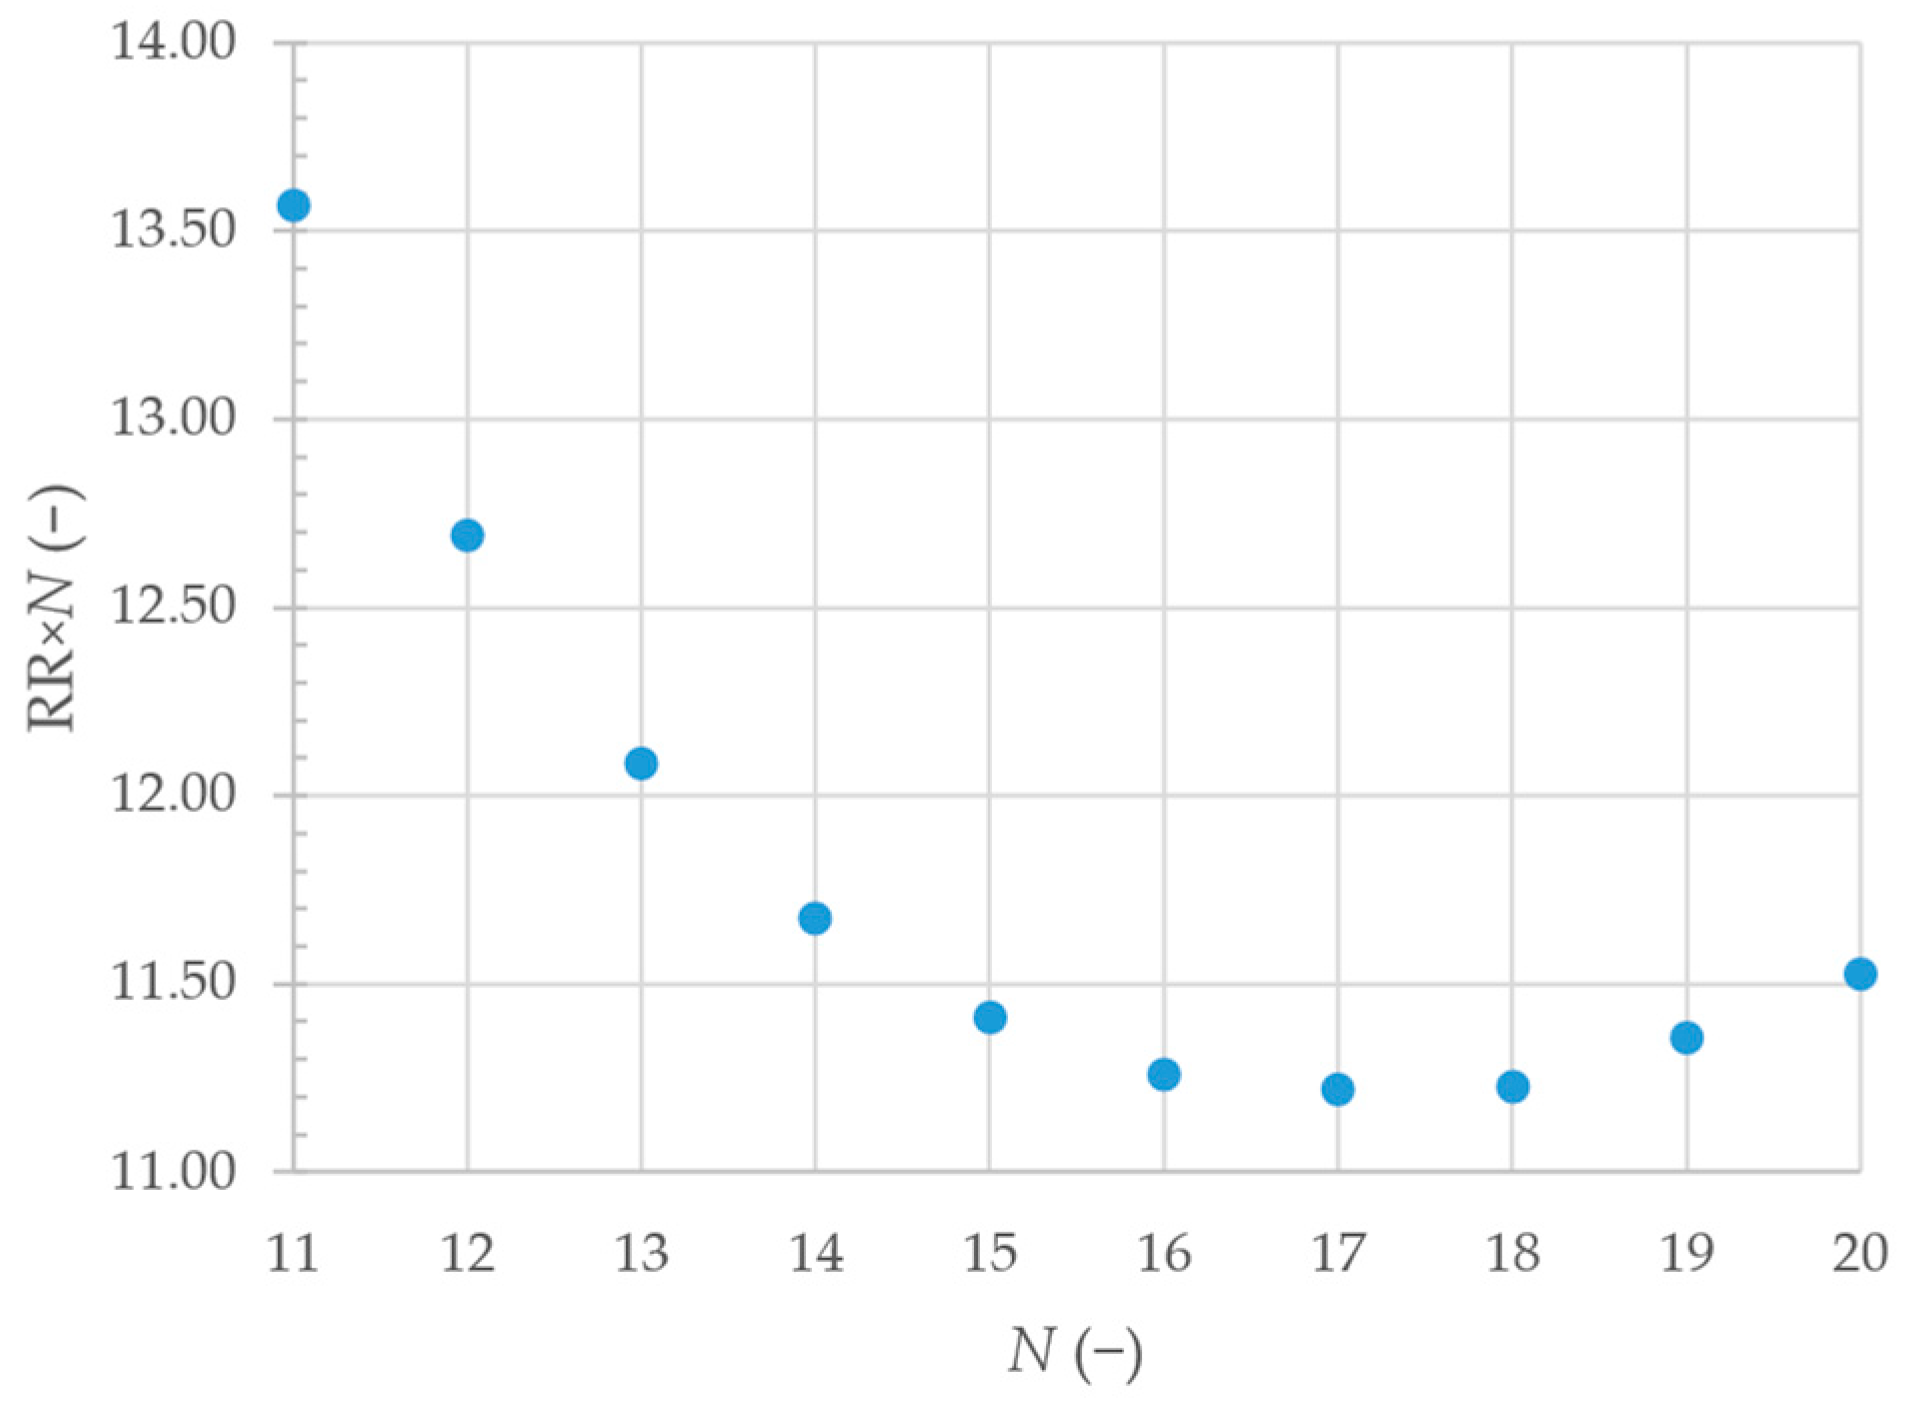
The RC-1 column was optimised by NQ analysis, which determines the optimum RR and tray numbers N, assuming for simplicity that they represent the operating and investment costs of a distillation column. Assuming that both costs are equally weighted, the optimal column design is the minimum of the diagram RR × N = f(N) [14]. For this purpose, Aspen Plus has the built-in function »NQ curves«, which provides the results of the heat flows, RR, and the optimum feed tray for a selected range of the total distillation column trays.
2.3.2. Pressure Swing Distillation
Based on the results obtained for column RC-1, the PSD was simulated separately. First, the columns were simulated with 50 trays, where the 40th tray was the feed tray (counted from the top of the column to the bottom). In both columns, the proportion of EtOH that the distillate must contain was determined. Values were determined near the azeotropic points with an EtOH content of 94.00 wt.% and 91.50 wt.% in the DLP-2 (distillate from LPC) and DLP-3 (distillate from HPC) streams, respectively. In addition, a specification for EtOH recovery of 99.90 wt.% was added in the LPC column. For the HPC column, the proportion of 99.60 wt.% EtOH in the B-3 was determined. The specifications were set so that they depend on the flow rate in the sump and the RR of the respective columns.
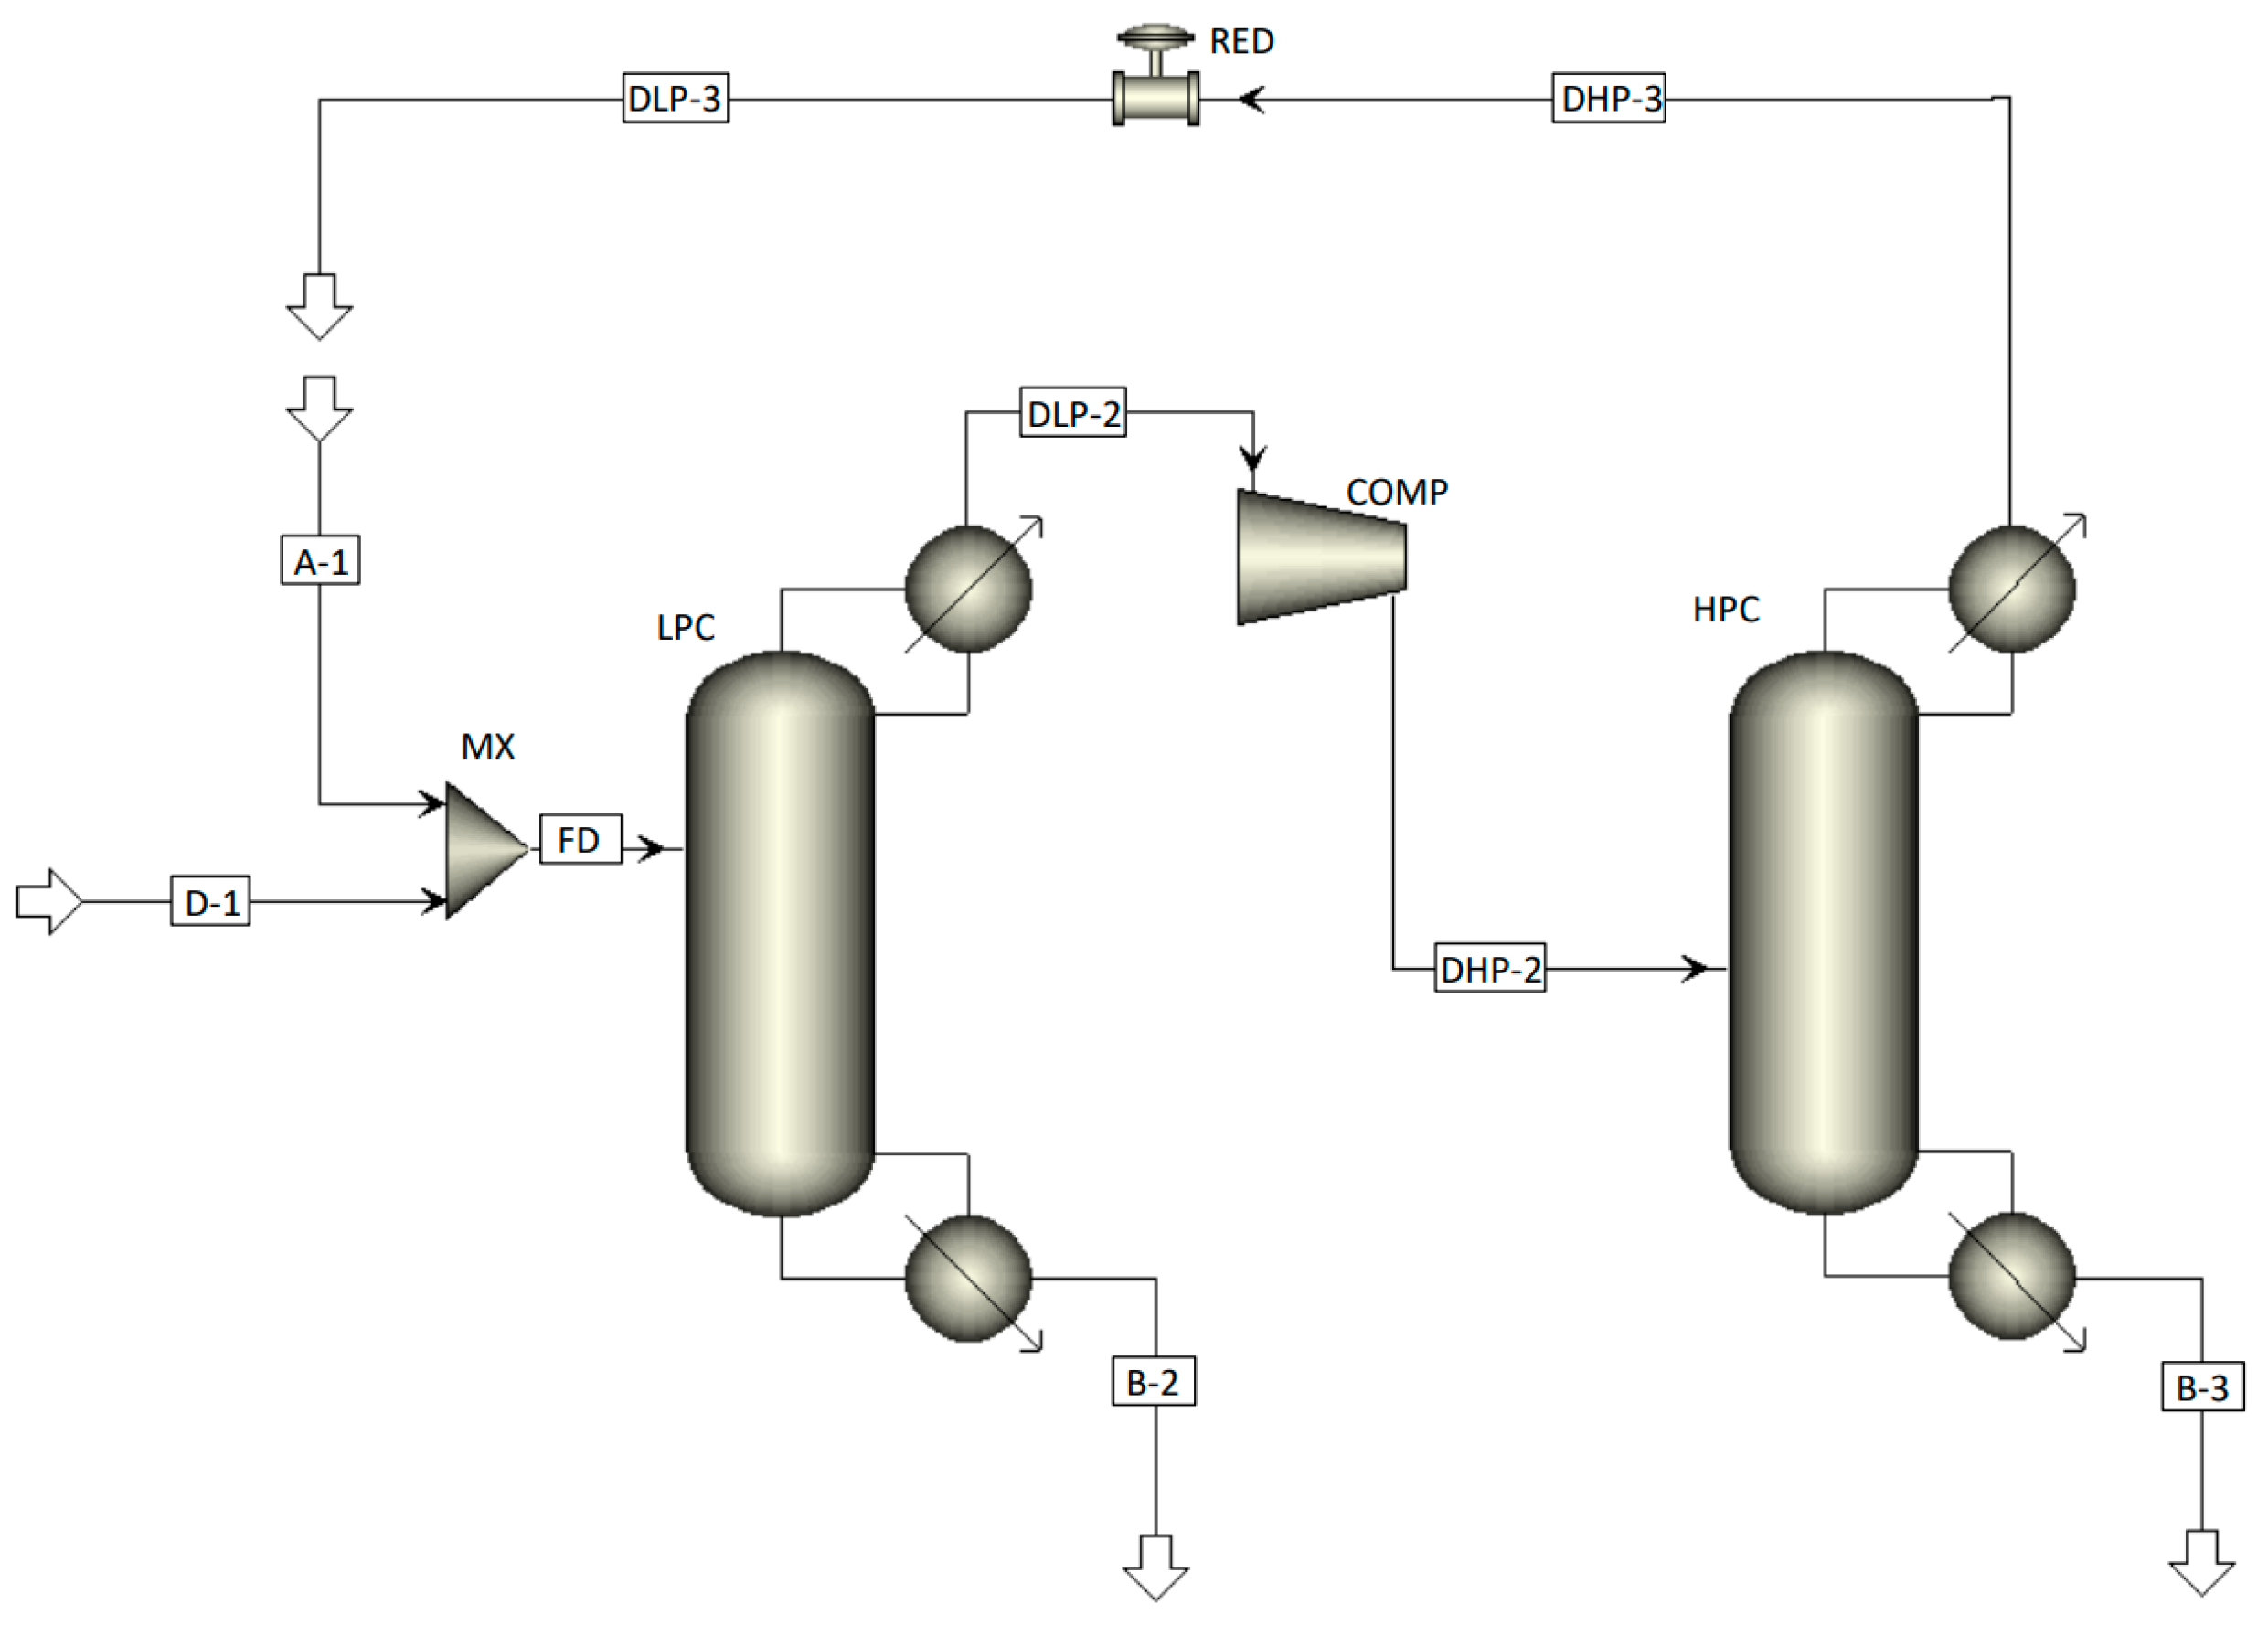
To ensure convergence, the simulation of the PSD was initially carried out as shown in Figure 3, where the streams DLP-3 and A-1 were disconnected. Later, the streams were connected as shown in Figure 1. For simplicity, both streams A-1 and D-1 were combined with the mixer MX, resulting in stream FD, as in the document of AspenTech [15]. In this way, the NQ analysis on the LPC was enabled. After the first simulation, the composition and flow rate of stream A-1 in further simulations were adjusted manually until they corresponded to stream DLP-3.
Using the process scheme in Figure 3, the NQ analysis was carried out and the optimum feed trays for the FD and DHP-2 streams were determined. After the analysis, the mixer MX and the stream FD were removed and the optimal feed trays for the streams A-1 and DLP-3 were determined manually. Since all simulations were performed with the above specifications, the compositions and flow rates of the process streams remained unchanged. During the manual search for the feed trays, the RR and heat flows of the distillation columns were automatically adjusted to meet the desired specifications. After determining the optimal feed trays, the A-1 and DLP-3 streams were combined with Wegstein convergence to form the REC-1 stream, resulting in the final process scheme shown in Figure 1.
2.4. Sensitivity Analysis
Sensitivity analyses on the LPC and HPC were performed. For the LPC, the effect of the recovery and the EtOH fraction in the distillate was analysed, while the effect of EtOH fraction in the distillate of HPC was examined. The specification to achieve 99.60 wt.% of EtOH in B-3 was constant since it was set as a desired value. The effect of the variables on the compressor work, heat demand in the evaporators, EtOH losses, RR, and the mass flow of stream REC-1 were analysed.
2.5. Restrictions and Assumptions
- The distillation columns are modelled with the Radfrac mode.
- Pressure drops are neglected.
- The compressor is isentropic with isentropic efficiency of 0.72, based on commercially available compressors from certified manufacturers.
- The simulation was carried out in a steady state.
- For optimisation with the NQ analysis, the same weight of operating and investment costs was assumed.
3. Results and Discussion
3.1. Distillation in Column RC-1
The results of the NQ analysis are shown graphically in Figure 4, for the range of column trays from 11 to 20. The optimum column from the analysis point of view is the column with 17 trays, where the third tray is the optimal feed tray.
Column design corresponds to that of Morales et al. [16], where the column with 18 trays was used for the production of 45 wt.% EtOH. Feed was also introduced to the column on the third tray. Columns with a lower or higher number of trays have also been reported, as in [12], where 10 trays with an RR of 3 were used. Lassmann et al. used 32 trays with an RR of 3 [17]. Of course, all of the columns were capable of concentrating EtOH up to 50 wt.%. In the case of using a column with a lower number of trays, the required RR will be higher, whereas when the column has a higher number of trays, the RR needed will be lower. This is ultimately reflected in the investment and operating costs.
3.2. Pressure Swing Distillation
The results of the NQ analysis performed with the process scheme in Figure 3 are shown graphically in Figure 5. For the LPC, it turned out that the optimal inlet tray is the 24th tray. With this design, 9171 kW of heat needs to be supplied to the LPC evaporator, and 8 470 kW needs to be removed at the condenser. A further reduction in heating and cooling demand was possible with a manual adjustment of inlet trays for flows REC-1 and D-1. For this purpose, the process scheme was altered slightly, and the MX mixer and the FD flow were removed, which resulted in the process scheme shown in Figure 1. The number of column trays was not changed. The final designs of the LPC and HPC are shown in Table 2, where ϕb represents boiler heat flow, ϕc cooling need in the condenser, N is number of trays, and Nf is the feed tray. The negative sign for the values of ϕc emphasises the heat released from the condenser. The table also shows the column heat flows. The preheating demand in HE-1 and compressor work needed were excluded from the table. The values for process units amount to 3569 kW and 593 kW, respectively.
The results of all process streams are shown in Table 3, where qm represents mass flow, T temperature, p pressure, and w mass fraction of the process flow component.
The desired content of 99.60 wt.% of EtOH in the final product was achieved, while the remaining 0.40 wt.% was mainly water, with a low proportion of other components.
3.3. Sensitivity Analysis
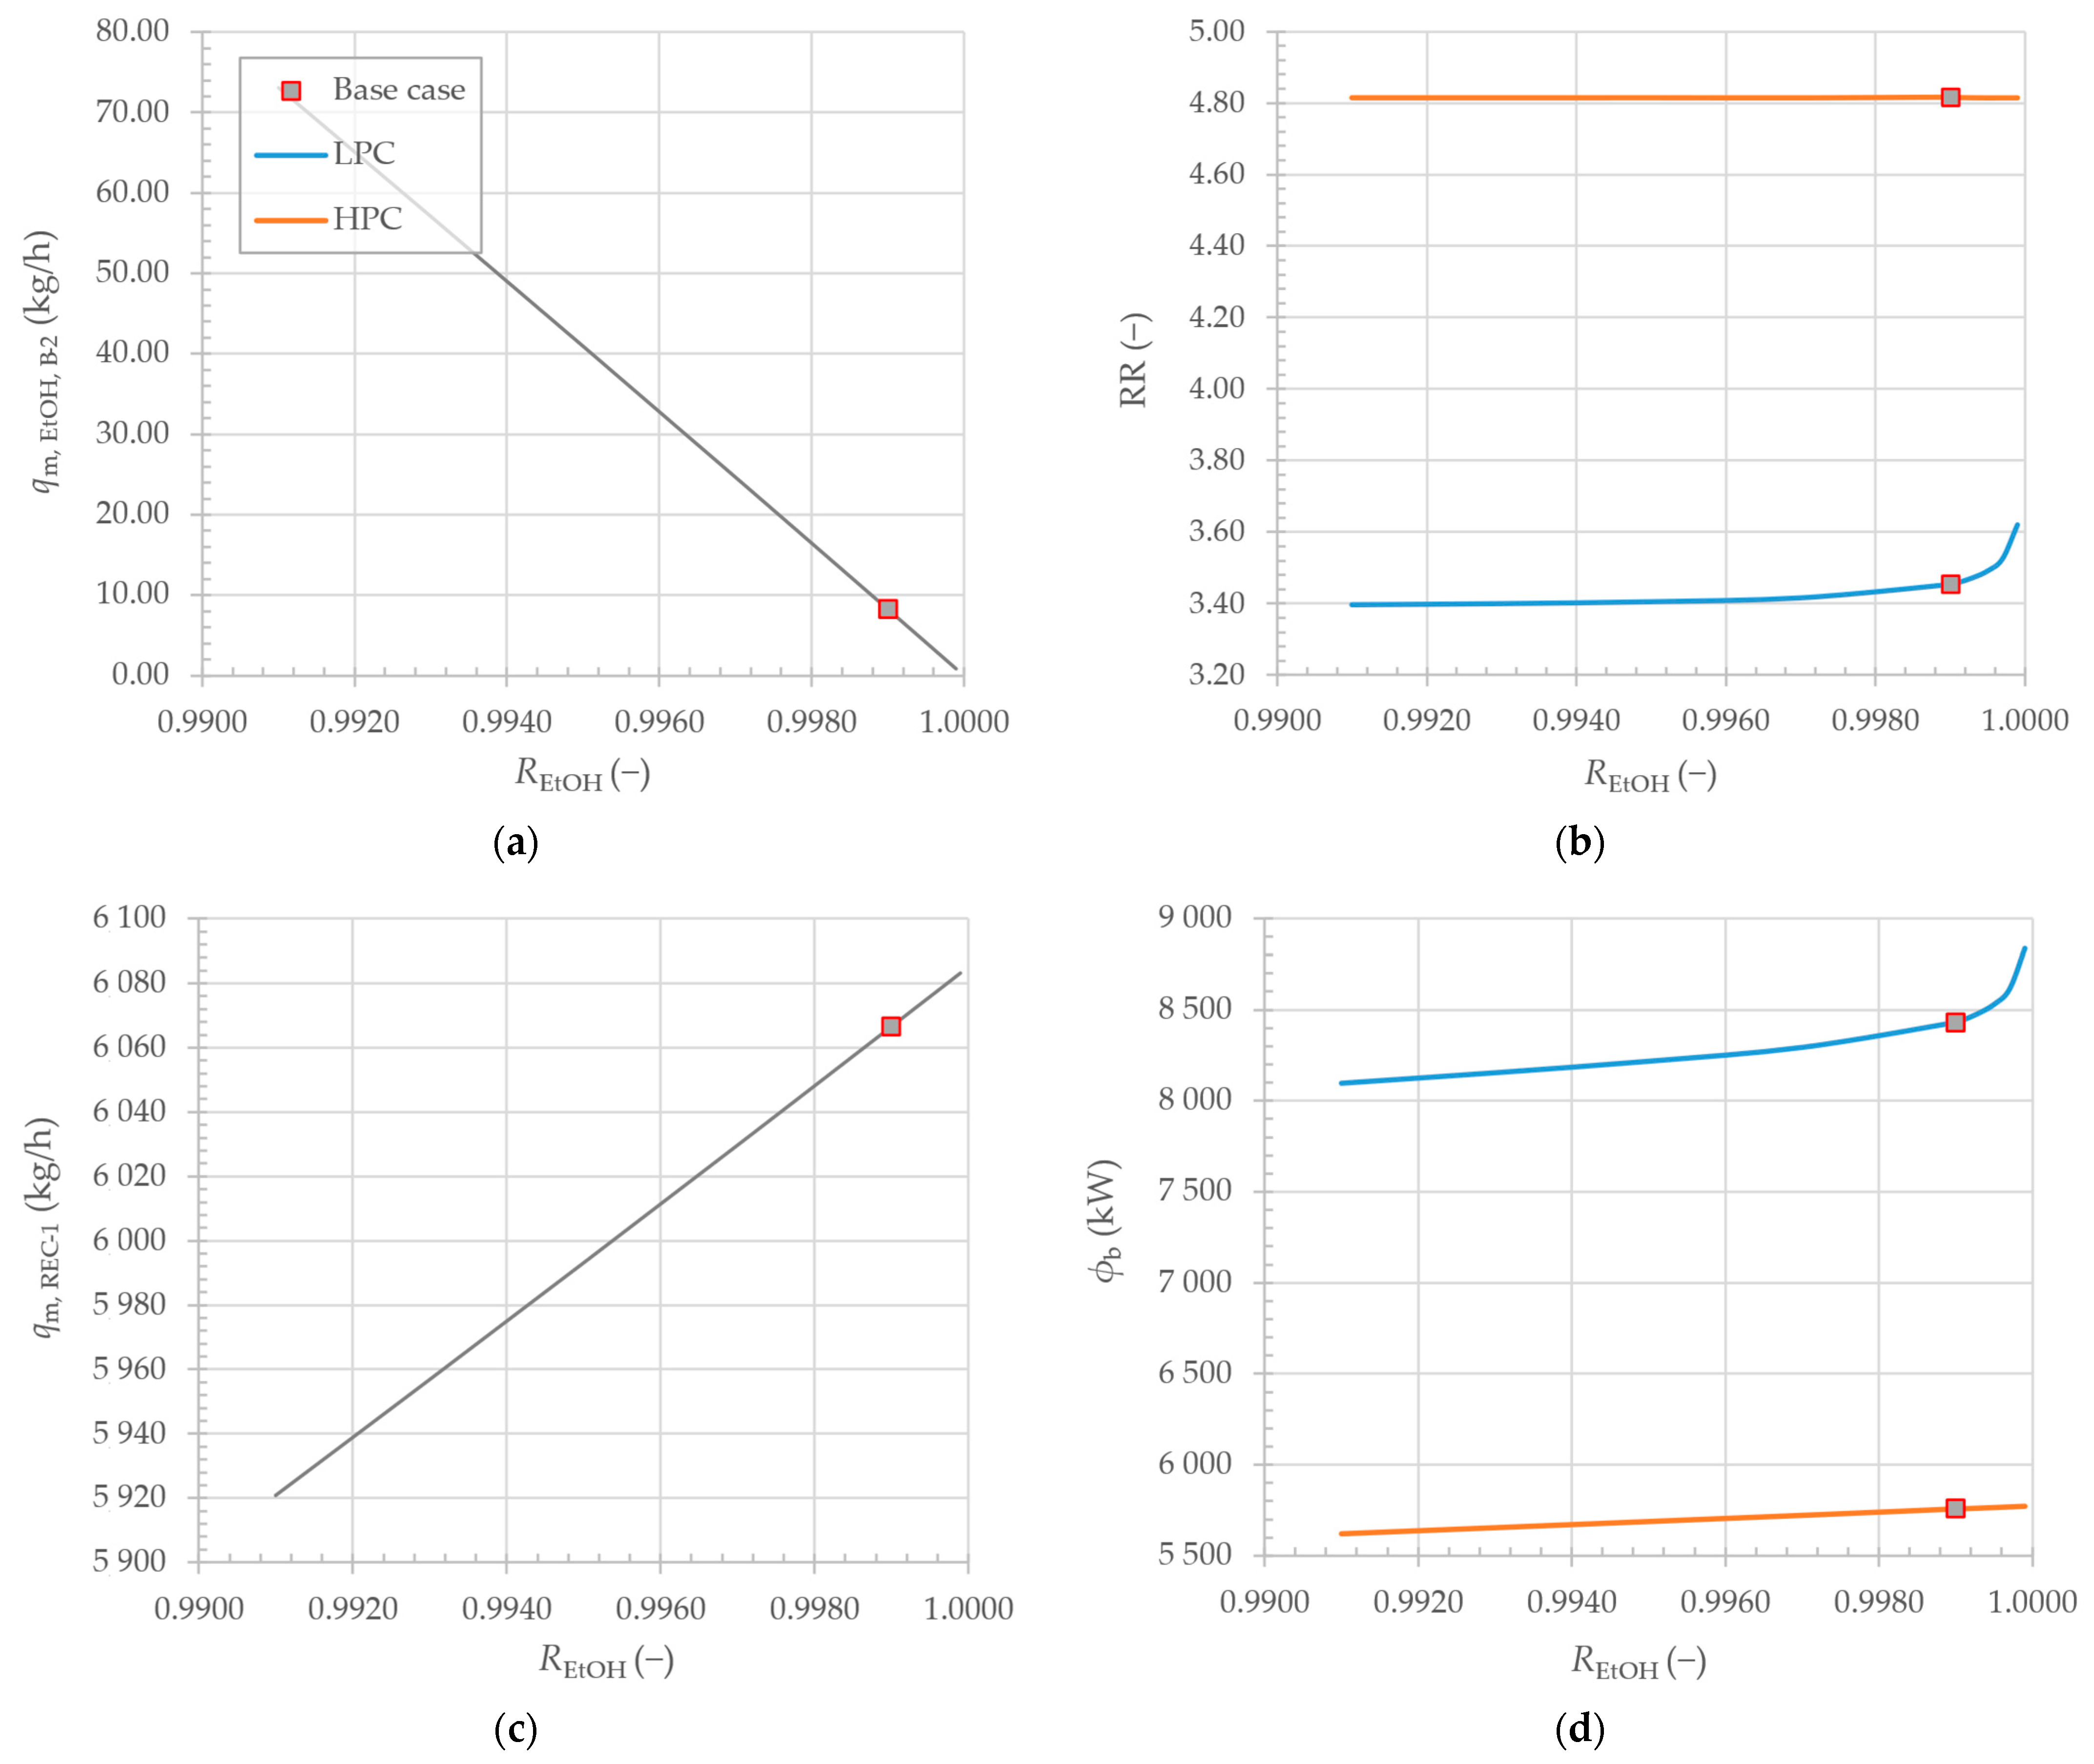
3.3.1. The Effect of EtOH Recovery
The results of the first sensitivity analysis are shown graphically in Figure 6. Upon varying the recovery of EtOH (REtOH) from D-1, it was observed that the increase in recovery resulted in linear decrease in EtOH losses in B-2 (qm, EtOH, B-2). Simultaneously, the REC-1 mass flow (qm, REC-1) increased. This was due to the specification for the EtOH fraction of 94 wt.% in the DLP-2 stream, which also resulted in the increase in the stream’s flow rate.
As more vapour flows into the HPC, the boiler heat demand increases linearly, while the RR remains constant due to the constant composition of the DHP-2 process flow. Because the condenser of the column has the same relationship, it is not additionally illustrated. The same applies for the following sensitivity analyses.
Larger effects of recovery were observed in the LPC. As the recovery of EtOH increases, heat flows and RR increase exponentially. Increasing the recovery of EtOH increases the difficulty of recovery, which is reflected in higher RR. This results in the circulation of a larger mass of the mixture in the column, which increases the heat demand for the vaporisation of the mixture. It is worth noting that 100% recovery is not achievable.
3.3.2. The Effect of the EtOH Content in the Distillate of the LPC
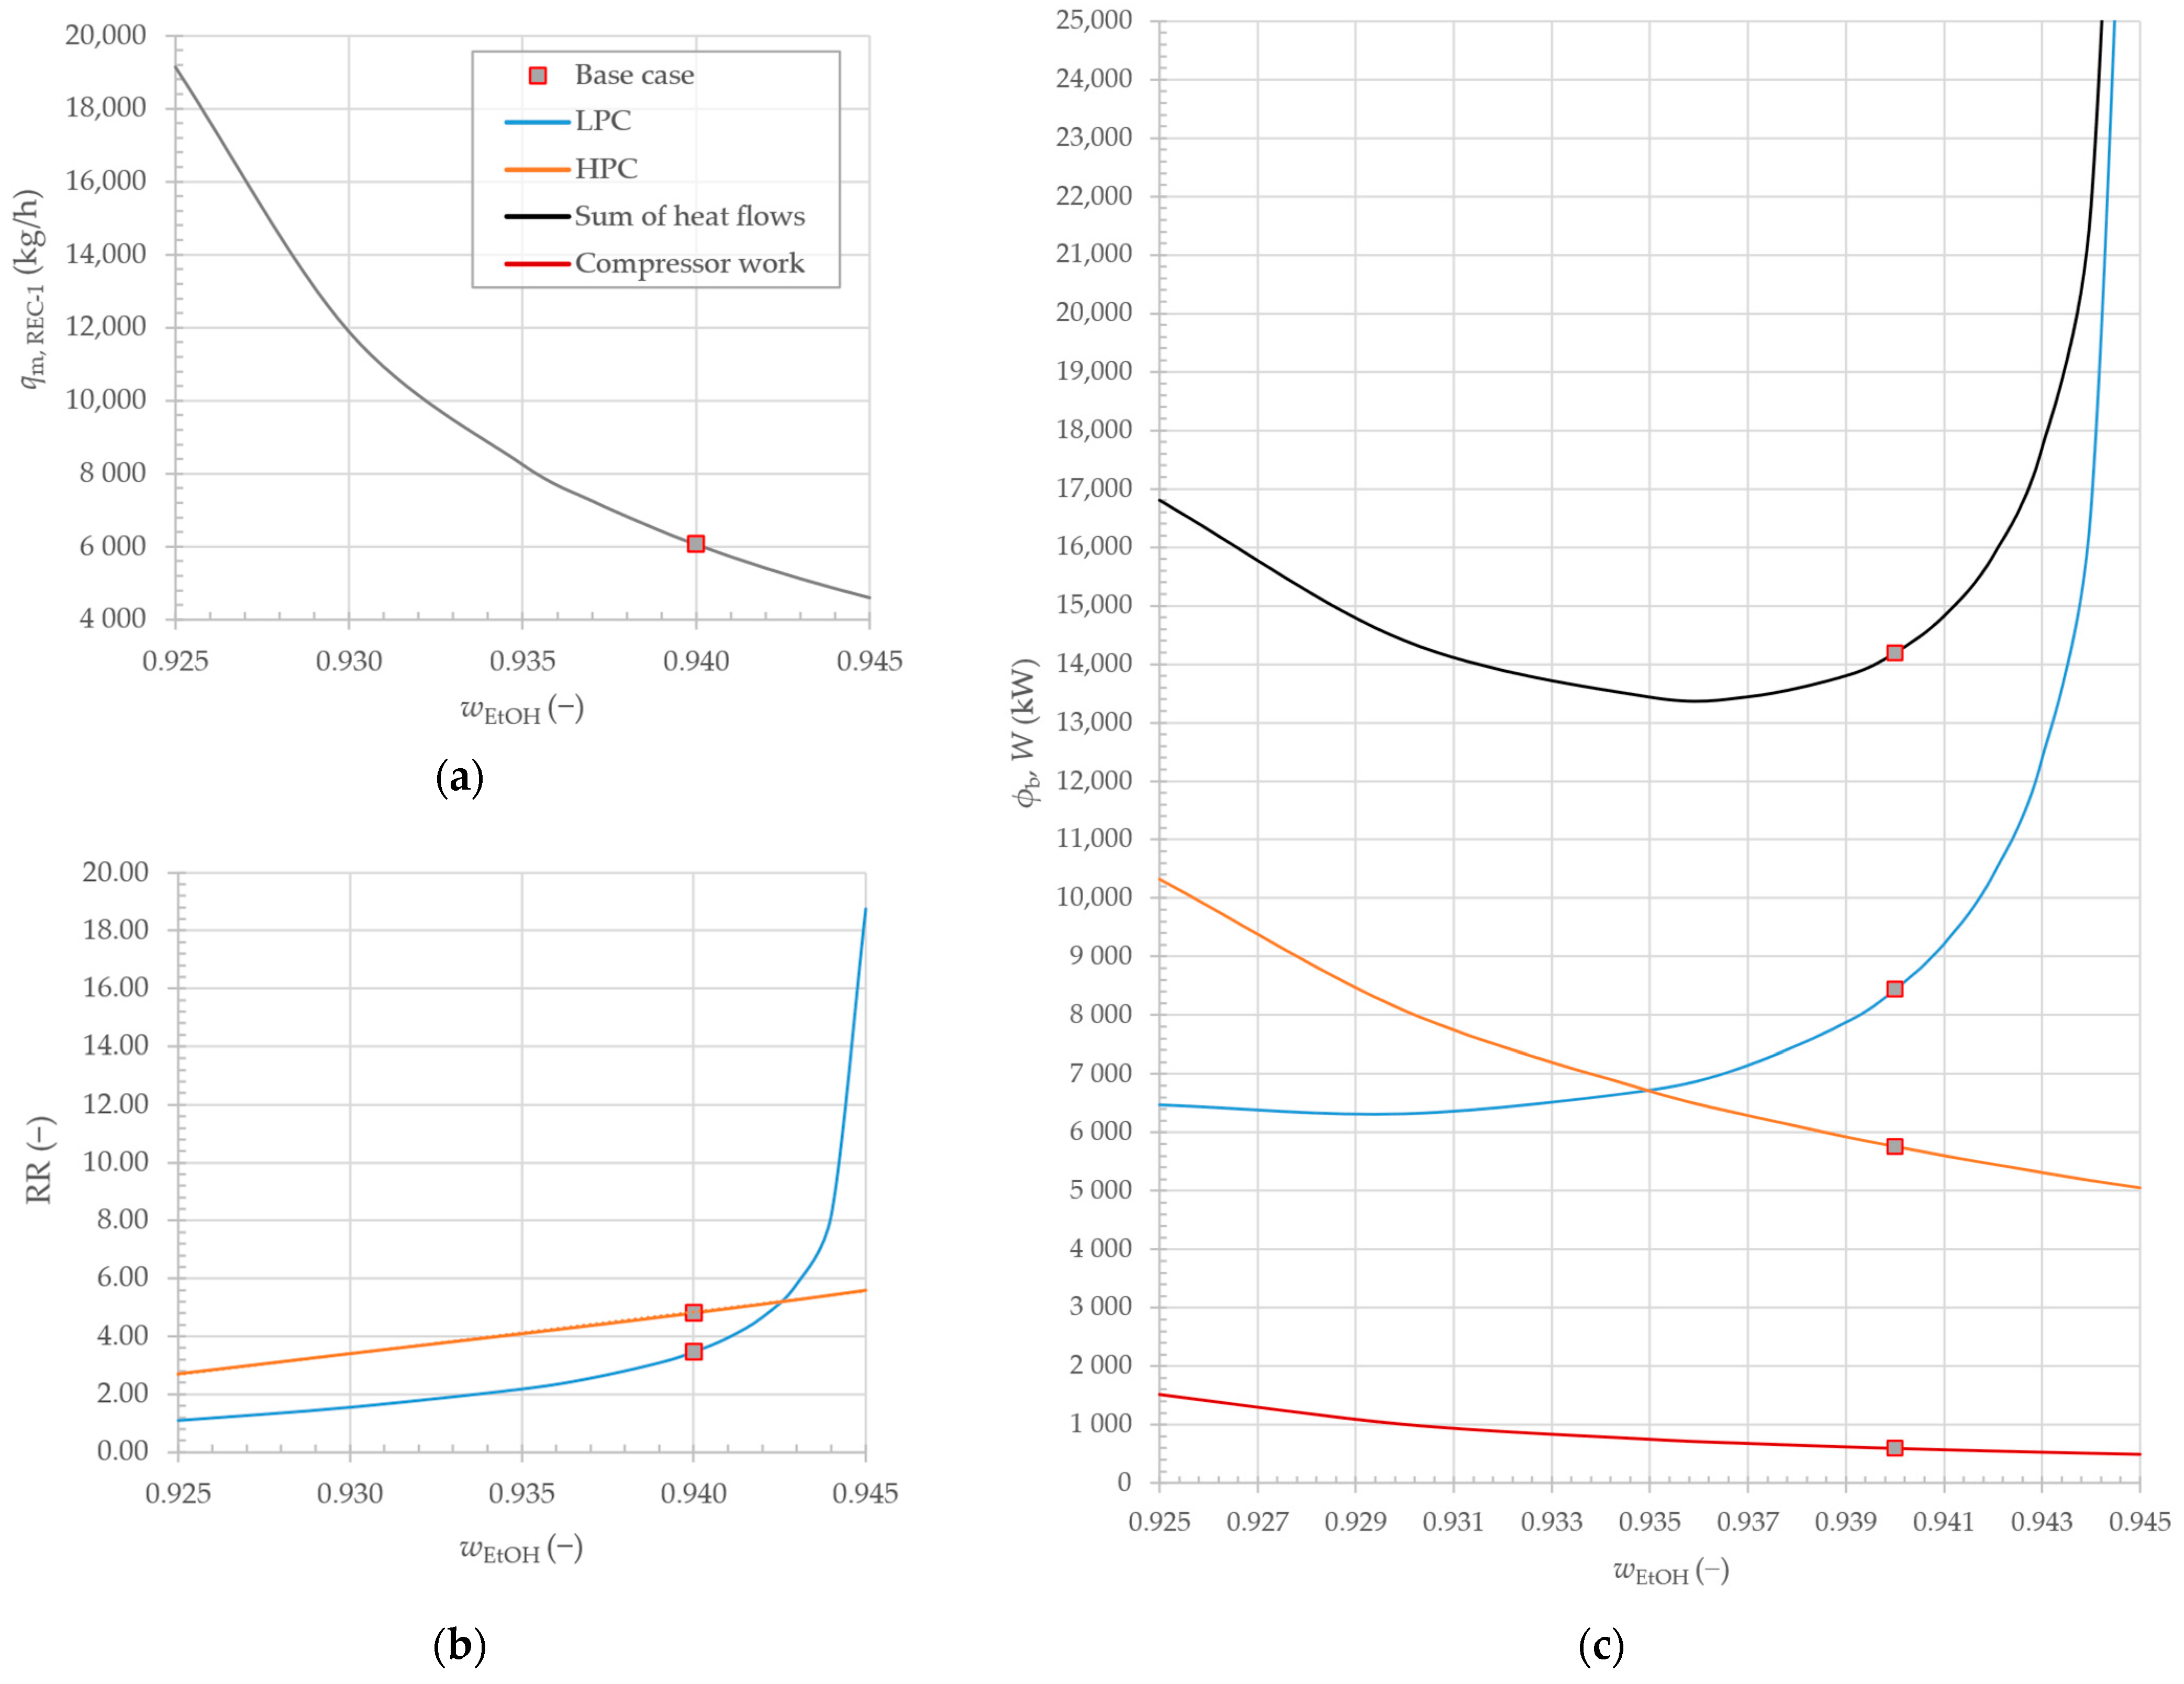
Changing the EtOH content of the distillate has a much more complex effect on the overall system. Increasing the mass fraction results in a decrease in the flow rate of DLP-2 due to the lower flow rate of water in the distillate. Consequently, the flow rate of REC-1 recycle is reduced, as shown in Figure 7.
Because the recovery of EtOH remains constant, the mass flow rate of EtOH losses in the bottoms decreases. The non-linearity of the relationship is mainly influenced by the second column. It is observed that as the EtOH fraction decreases, the mass flow rate of REC-1 starts to increase exponentially. This is due to the specification of the second column, which requires 91.50 wt.% of EtOH in the distillate. Although the RR decreases linearly, the closer the fraction of EtOH in the distillate is to this value, more distillate DHP-3 is sent to recycle. We conclude that the linear decrease in RR in the HPC is a result of approaching the value of 91.50 wt.%, since it is easier to reach the required value by adjusting the RR, and since the composition of the feed to the HPC column is already close to the specified value of the HPC. On the other hand, as the specification for EtOH fraction in DLP-2 increases, the RR in the LPC increases exponentially, which is caused by the approach to the azeotropic point.
The complex relationship between heat flows in the LPC column is caused by the simultaneous variation in RR and recycle flow rate. At one extreme, as we approach the azeotrope at 1 bar, the heat flow increases exponentially due to the RR in the LPC. At the other extreme, as we approach the specification 91.50 wt.% of EtOH in the HPC distillate, the increase in heat flow increases the flow rate of the recycling. The EtOH fraction of the DLP-2 distillate is therefore confined between the azeotrope at 1 bar and the specification for the EtOH fraction of the HPC distillate.
Compressor work (W), shown by the red line, is dependent on the mass flow rate of the LPC vapour distillate.
3.3.3. The Effect of the EtOH Content in the Distillate of the HPC
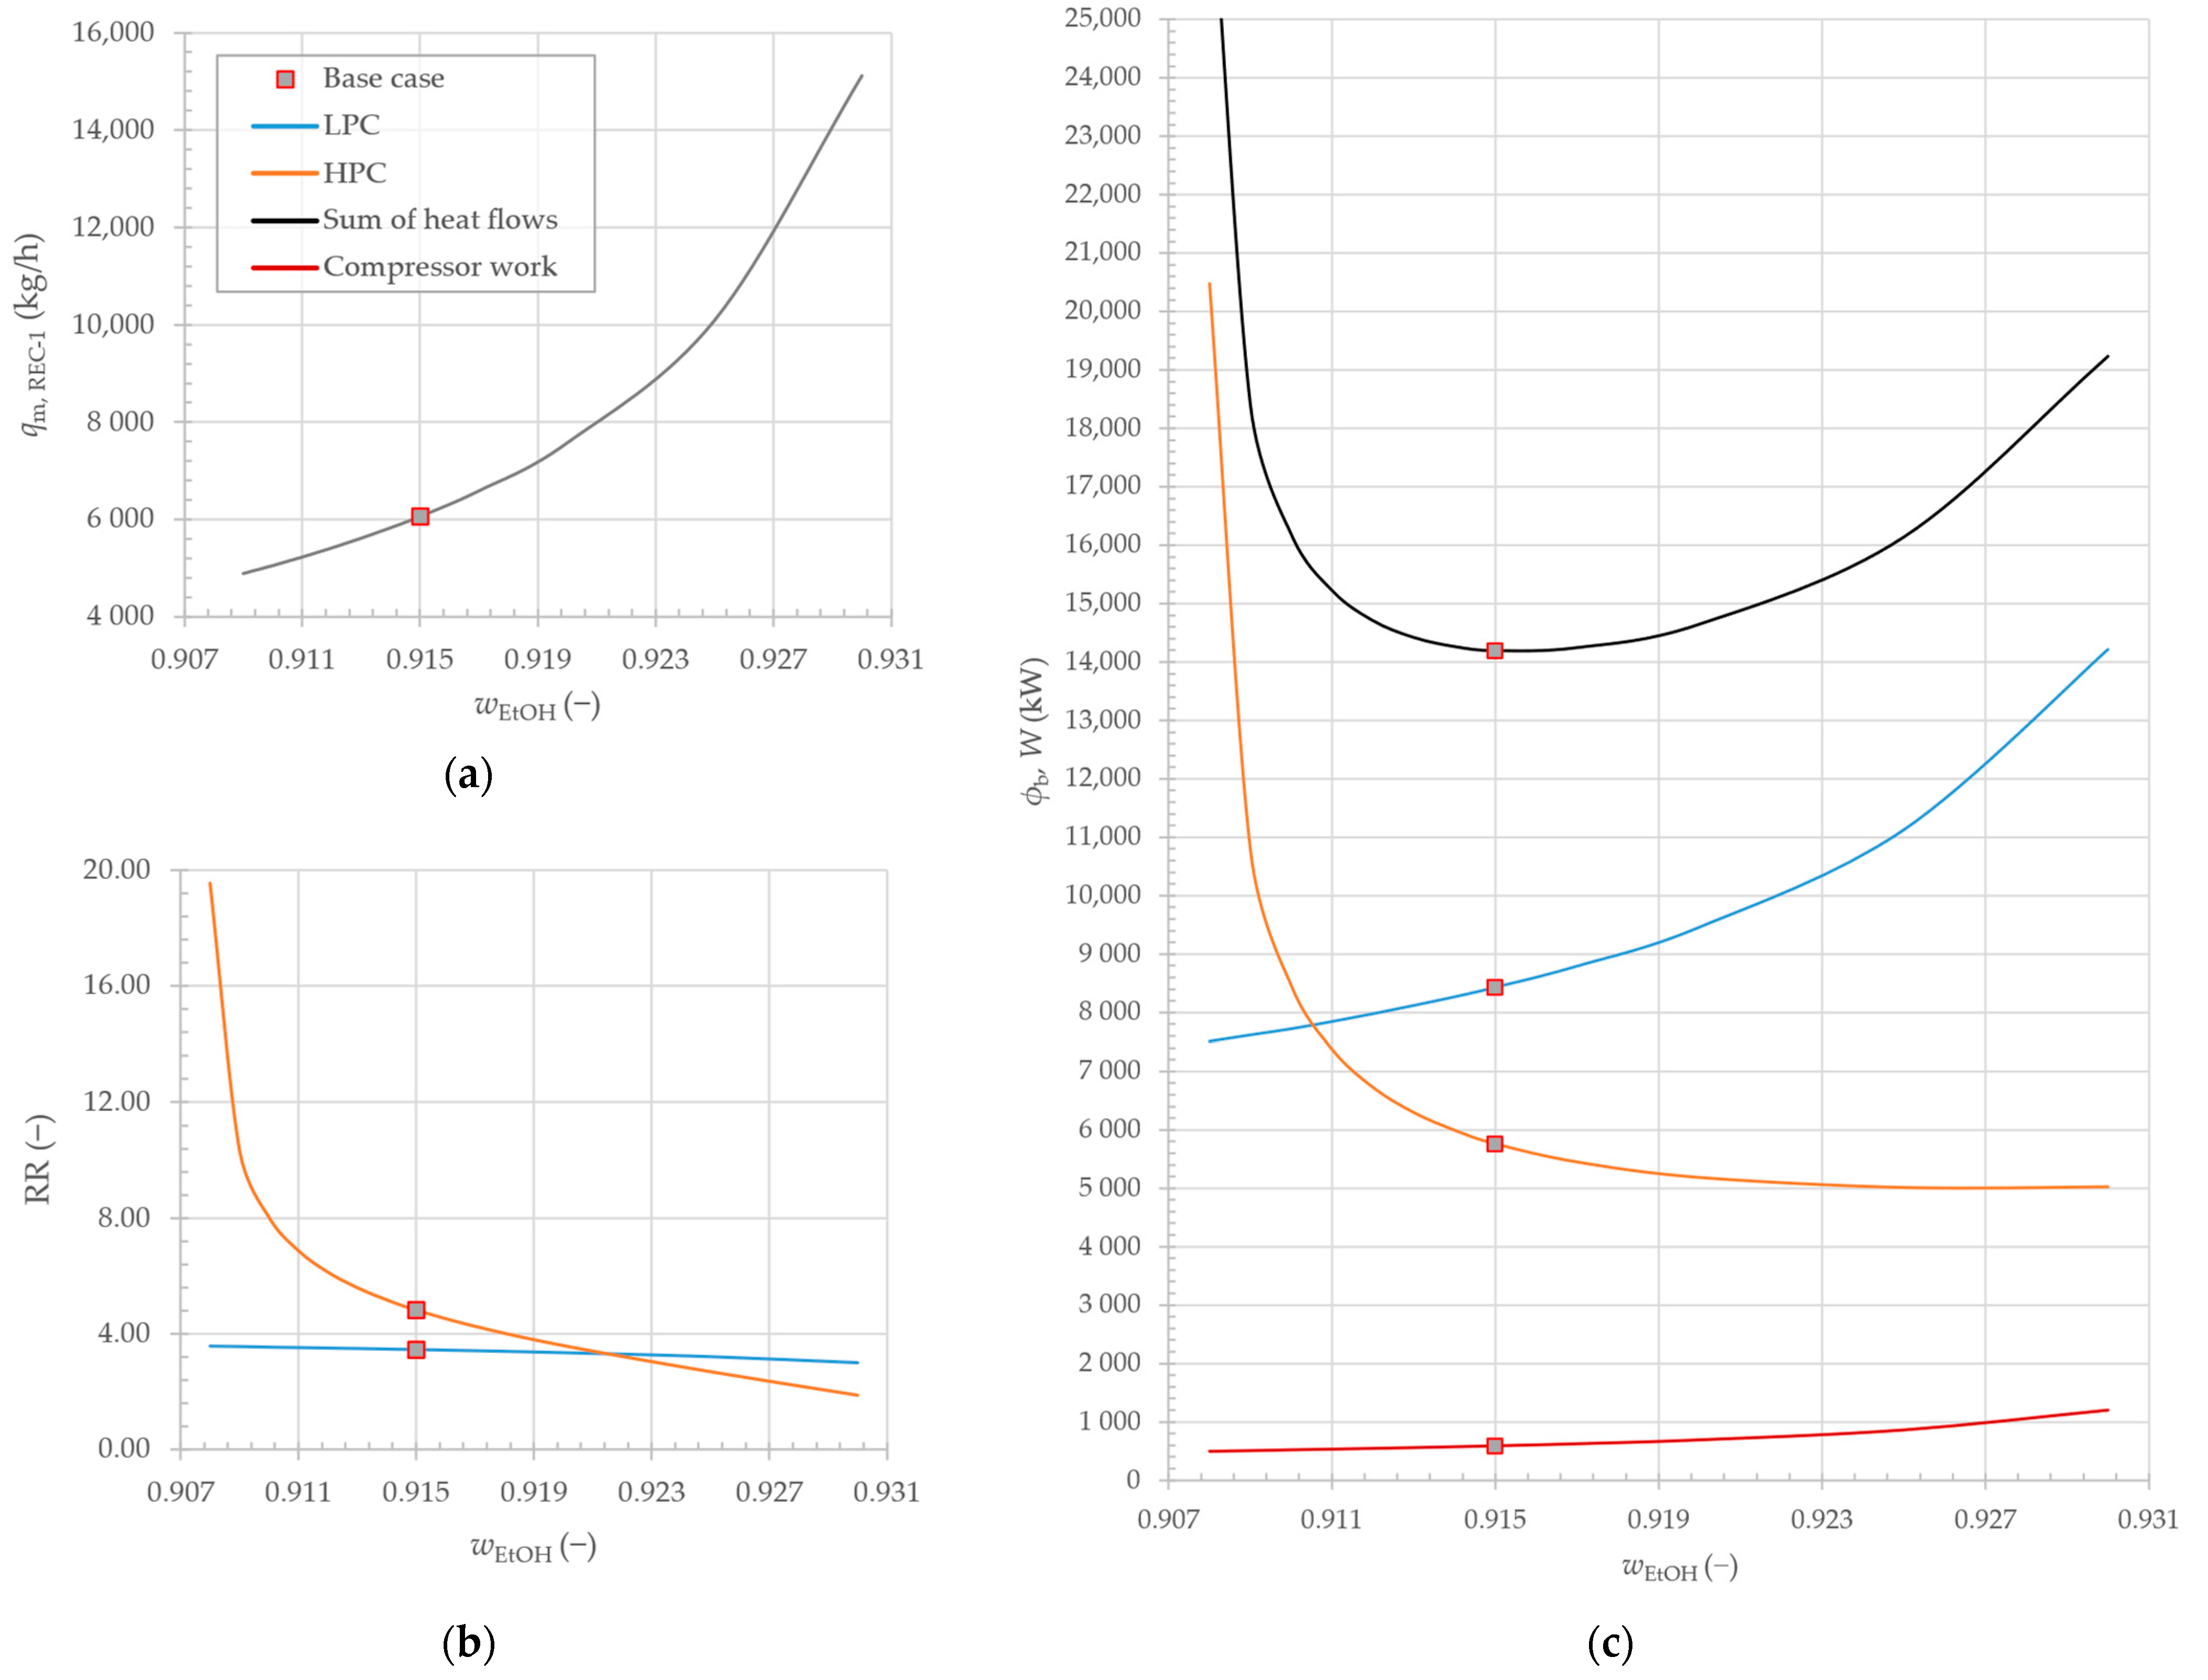
Changing the EtOH fraction in the distillate of HPC has a similar effect as the fraction of EtOH in the distillate of LPC. This can be seen in Figure 8. When the purity of the distillate is increased, an increase in recycle flow rate is observed. This is a result of approaching the specification of 94 wt.% of EtOH in LPC distillate DLP-2. As we increase the EtOH content in the distillate DHP-3, the difference between EtOH fractions becomes smaller, resulting in a larger volume of distillate being sent to the DLP-2 stream. At the same time, the RR decreases, because from the RR point of view it becomes easier to obtain the target value of 94 wt.% EtOH. The EtOH losses increase due to the increase in recycle flow rate. Because of higher DLP-2 flow rates, the compressor also requires more energy.
In the HPC, the RR increases as the EtOH fraction in the distillate decreases. This is due to the approach of the azeotropic point at 10 bars. Consequently, at the two extremes, we can again observe an increase in heat flows. As the investigated specification approaches 94 wt.%, the heat flows increase due to the high recycle flows. As we decrease the specification, the heat flows increase due to the increase in RR in the HPC.
Comparing the heat flow plots in Figure 7 and Figure 8, we see that the minima of the sum lie at different values. From an operational point of view, the 93.70 wt.% of EtOH in the distillate of LPC might be better, but the recycle flow rate would increase, leading to higher EtOH losses. This would also lead to higher flow rates of DLP-2, leading to an increase in compressor work. The change in the specification of LPC would require further optimisation of the HPC feed tray, while it is also not necessary that the optimum specification of the HPC distillate would be 91.50 wt.%. Due to the complexity of the interactions between the columns, the problem requires a more detailed optimisation and economic analysis, which is very difficult with a sensitivity analysis, and is beyond the scope of the present work.
The design of the columns is comparable with the literature. In Mulia-Soto and Flores-Tlacuahuac [9], Iqbal and Ahmad [10], and Kiran and Jana [11], 30 trays were used for both columns, which was very close to our results. The inlet trays differed due to minor differences between the compositions of all streams. According to Karimi et al., PSD is often used to separate azeotropic mixtures of EtOH and water [7], but we have not found any other reliable data on its use to produce anhydrous EtOH in industry. In any case, the separation of azeotropic mixtures by such distillation is possible but is more difficult when the azeotropic composition with pressure varies only slightly [7].
4. Conclusions
The present work presents the possibility of using PSD for the production of high-purity bioethanol obtained through the fermentation of biomass. The produced renewable ethanol could be used as a fuel instead of conventional gasoline.
NQ analysis, a simple method for determining the optimal design of distillation columns, was used for the process design. The results of the analysis showed a process design with good agreement with the data reported in the literature. The components present in the feed stream were successfully removed by distillation, producing high-purity EtOH with 99.60 wt.% and a water content of 0.40 wt.%. However, the process consumes a lot of heat and could be further improved by heat integration.
Author Contributions
Conceptualisation, methodology, software, validation, investigation, formal analysis, writing—original draft: K.R.; investigation, formal analysis, writing—original draft: S.G.; formal analysis, writing—review and editing, supervision: D.G.; writing—review and editing, supervision: D.U. All authors have read and agreed to the published version of the manuscript.
Funding
This research received no external funding.
Institutional Review Board Statement
Not applicable.
Informed Consent Statement
Not applicable.
Data Availability Statement
All the data generated during work is provided through tables, diagrams and figures.
Conflicts of Interest
The authors declare no conflicts of interest.
References
- Chen, W.-H.; Lin, B.-J.; Lin, Y.-Y.; Chu, Y.-S.; Ubando, A.T.; Show, P.L.; Ong, H.C.; Chang, J.-S.; Ho, S.-H.; Culaba, A.B.; et al. Progress in Biomass Torrefaction: Principles, Applications and Challenges. Prog. Energy Combust. Sci. 2021, 82, 100887. [Google Scholar] [CrossRef]
- Environmental Protection Agency. Inventory of U.S. Greenhouse Gas Emissions and Sinks: 1990–2019; U.S. Environmental Protection Agency: Washington, DC, USA, 2021. [Google Scholar]
- Lamichhane, G.; Acharya, A.; Poudel, D.K.; Aryal, B.; Gyawali, N.; Niraula, P.; Phuyal, S.R.; Budhathoki, P.; Bk, G.; Parajuli, N. Recent Advances in Bioethanol Production from Lignocellulosic Biomass. Int. J. Green Energy 2021, 18, 731–744. [Google Scholar] [CrossRef]
- Amornraksa, S.; Subsaipin, I.; Simasatitkul, L.; Assabumrungrat, S. Systematic Design of Separation Process for Bioethanol Production from Corn Stover. BMC Chem. Eng. 2020, 2, 10. [Google Scholar] [CrossRef]
- Beluhan, S.; Mihajlovski, K.; Šantek, B.; Ivančić Šantek, M. The Production of Bioethanol from Lignocellulosic Biomass: Pretreatment Methods, Fermentation, and Downstream Processing. Energies 2023, 16, 7003. [Google Scholar] [CrossRef]
- Conde-Mejía, C.; Jiménez-Gutiérrez, A. Analysis of Ethanol Dehydration Using Membrane Separation Processes. Open Life Sci. 2020, 15, 122–132. [Google Scholar] [CrossRef] [PubMed]
- Karimi, S.; Karri, R.R.; Tavakkoli Yaraki, M.; Koduru, J.R. Processes and Separation Technologies for the Production of Fuel-Grade Bioethanol: A Review. Environ. Chem. Lett. 2021, 19, 2873–2890. [Google Scholar] [CrossRef]
- Rumbo Morales, J.Y.; Ortiz-Torres, G.; García, R.O.D.; Cantero, C.A.T.; Rodriguez, M.C.; Sarmiento-Bustos, E.; Oceguera-Contreras, E.; Hernández, A.A.F.; Cerda, J.C.R.; Molina, Y.A.; et al. Review of the Pressure Swing Adsorption Process for the Production of Biofuels and Medical Oxygen: Separation and Purification Technology. Adsorpt. Sci. Technol. 2022, 2022, 3030519. [Google Scholar] [CrossRef]
- Mulia-Soto, J.F.; Flores-Tlacuahuac, A. Modeling, Simulation and Control of an Internally Heat Integrated Pressure-Swing Distillation Process for Bioethanol Separation. Comput. Chem. Eng. 2011, 35, 1532–1546. [Google Scholar] [CrossRef]
- Iqbal, A.; Ahmad, S.A. Pressure Swing Distillation of Azeotropic Mixture—A Simulation Study. Perspect. Sci. 2016, 8, 4–6. [Google Scholar] [CrossRef]
- Kiran, B.; Jana, A.K. A Hybrid Heat Integration Scheme for Bioethanol Separation through Pressure-Swing Distillation Route. Sep. Purif. Technol. 2015, 142, 307–315. [Google Scholar] [CrossRef]
- Quintero, J.A.; Cardona, C.A. Process Simulation of Fuel Ethanol Production from Lignocellulosics Using Aspen Plus. Ind. Eng. Chem. Res. 2011, 50, 6205–6212. [Google Scholar] [CrossRef]
- Thomas Rodgers Plotting Approximate Residue Curves and Pressure Swing. Available online: https://www.youtube.com/watch?v=o6zOi_Pp_80 (accessed on 25 December 2023).
- Roman, C.; García-Morales, M. Achieving a Better Understanding of Binary Azeotropic Mixtures Distillation through Aspen Plus Process Simulations. Comp. Applic. Eng. 2019, 27, 1453–1464. [Google Scholar] [CrossRef]
- Aspen Technology Inc. Pressure Swing Distillation with Aspen Plus® V8.0; Aspen Technology Inc.: Bedford, MA, USA, 2012. [Google Scholar]
- Morales, M.; Arvesen, A.; Cherubini, F. Integrated Process Simulation for Bioethanol Production: Effects of Varying Lignocellulosic Feedstocks on Technical Performance. Bioresour. Technol. 2021, 328, 124833. [Google Scholar] [CrossRef] [PubMed]
- Lassmann, T.; Kravanja, P.; Friedl, A. Simulation of the Downstream Processing in the Ethanol Production from Lignocellulosic Biomass with ASPEN Plus® and IPSEpro. Energy Sustain. Soc. 2014, 4, 27. [Google Scholar] [CrossRef]
Figure 1.
Process scheme used for the simulations of EtOH distillation, adapted from Karimi et al. [7].
Figure 1.
Process scheme used for the simulations of EtOH distillation, adapted from Karimi et al. [7].

Figure 2.
(a) EtOH-H2O xy diagram; (b) EtOH-H2O xy diagram magnified at the location of azeotrope shift (full red square shows EtOH fraction of distillate, achieved in LPC, while the black line shows the possible operation of HPC).
Figure 2.
(a) EtOH-H2O xy diagram; (b) EtOH-H2O xy diagram magnified at the location of azeotrope shift (full red square shows EtOH fraction of distillate, achieved in LPC, while the black line shows the possible operation of HPC).

Figure 3.
Initial process scheme for the simulation of PSD.

Figure 4.
NQ analysis results for distillation column RC-1.

Figure 5.
NQ analysis results for (a) LPC and (b) HPC.

Figure 6.
The effect of EtOH recovery on: (a) losses of EtOH in distillation bottom B-2; (b) RR of distillation columns; (c) mass flow of REC-1; and (d) heat demand in distillation column boilers.
Figure 6.
The effect of EtOH recovery on: (a) losses of EtOH in distillation bottom B-2; (b) RR of distillation columns; (c) mass flow of REC-1; and (d) heat demand in distillation column boilers.

Figure 7.
The effect of EtOH fraction in the distillate of LPC on (a) mass flow rate of recycle REC-1; (b) RR of distillation columns; (c) boiler heat demand and necessary compressor work.
Figure 7.
The effect of EtOH fraction in the distillate of LPC on (a) mass flow rate of recycle REC-1; (b) RR of distillation columns; (c) boiler heat demand and necessary compressor work.

Figure 8.
The effect of EtOH fraction in distillate of HPC on (a) mass flow rate of recycle REC-1; (b) RR of distillation columns; and (c) boiler heat demand and necessary compressor work.
Figure 8.
The effect of EtOH fraction in distillate of HPC on (a) mass flow rate of recycle REC-1; (b) RR of distillation columns; and (c) boiler heat demand and necessary compressor work.


Table 1.
Feed composition, adapted from Cardona and Quintero [12].
Table 1.
Feed composition, adapted from Cardona and Quintero [12].
| Component | w (wt.%) |
|---|---|
| H2O | 0.9320 |
| EtOH | 0.0540 |
| H2SO4 | 0.0007 |
| HMF | 0.0119 |
| Furfural | 0.0010 |
| Ca(OH)2 | 0.0004 |
Table 2.
Final design of distillation columns.
| LPC | HPC | |||
|---|---|---|---|---|
| RC-1 | After NQ Analysis 1 | After Additional Feed Tray Optimisation 2 | ||
| ϕb (kW) | 4109 | 9171 | 8377 | 5910 |
| ϕc (kW) | −3850 | −8470 | −7852 | −6436 |
| RR (−) | 0.61 | 3.70 | 3.43 | 4.68 |
| N (−) | 17 | 28 | 28 | 32 |
| Nf (−) | 3 | 24 | REC-1: 18 | 14 |
| D-1: 25 | ||||
Table 3.
Process flow results for the optimal process scheme.
| qm (kg/h) | T (°C) | p (bar) | wH2O (−) | wEtOH (−) | wH2SO4 (−) | wHMF (−) | wFurfural (−) | wCa(OH)2 (−) | |
|---|---|---|---|---|---|---|---|---|---|
| F-1 | 50,188.90 | 33.00 | 1 | 0.9320 | 0.0540 | 0.0007 | 0.0119 | 0.0010 | 0.0004 |
| F-2 | 50,188.90 | 94.47 | 1 | 0.9320 | 0.0540 | 0.0007 | 0.0119 | 0.0010 | 0.0004 |
| D-1 | 5411.45 | 81.83 | 1 | 0.4928 | 0.5000 | 3.47 × 10⁻¹² | 2.24 × 10−09 | 0.0072 | 5.47 × 10−54 |
| B-1 | 44,777.45 | 100.05 | 1 | 0.9851 | 0.0001 | 0.0008 | 0.0133 | 0.0002 | 0.0004 |
| DLP-2 | 8774.91 | 77.99 | 1 | 0.0600 | 0.9400 | 3.64 × 10−132 | 3.82 × 10−108 | 6.42 × 10⁻¹⁹ | 0 |
| DHP-2 | 8774.91 | 217.72 | 10 | 0.0600 | 0.9400 | 3.64 × 10−132 | 3.82 × 10−108 | 6.42 × 10⁻¹⁹ | 0 |
| B-2 | 2703.14 | 99.12 | 1 | 0.9824 | 0.0031 | 6.95 × 10⁻¹² | 4.48 × 10−09 | 0.0145 | 0 |
| DHP-3 | 6066.60 | 149.43 | 10 | 0.0850 | 0.9150 | 0 | 0 | 0 | 0 |
| REC-1 | 6066.60 | 138.46 | 1 | 0.0850 | 0.9150 | 0 | 0 | 0 | 0 |
| B-3 | 2708.30 | 150.70 | 10 | 0.0040 | 0.9960 | 0 | 0 | 0 | 0 |
Disclaimer/Publisher’s Note: The statements, opinions and data contained in all publications are solely those of the individual author(s) and contributor(s) and not of MDPI and/or the editor(s). MDPI and/or the editor(s) disclaim responsibility for any injury to people or property resulting from any ideas, methods, instructions or products referred to in the content. |
© 2024 by the authors. Licensee MDPI, Basel, Switzerland. This article is an open access article distributed under the terms and conditions of the Creative Commons Attribution (CC BY) license (https://creativecommons.org/licenses/by/4.0/).
Share and Cite
MDPI and ACS Style
Rola, K.; Gruber, S.; Goričanec, D.; Urbancl, D. Waste Lignocellulosic Biomass as a Source for Bioethanol Production. Sustain. Chem. 2024, 5, 1-12. https://0-doi-org.brum.beds.ac.uk/10.3390/suschem5010001
AMA Style
Rola K, Gruber S, Goričanec D, Urbancl D. Waste Lignocellulosic Biomass as a Source for Bioethanol Production. Sustainable Chemistry. 2024; 5(1):1-12. https://0-doi-org.brum.beds.ac.uk/10.3390/suschem5010001
Chicago/Turabian StyleRola, Klemen, Sven Gruber, Darko Goričanec, and Danijela Urbancl. 2024. "Waste Lignocellulosic Biomass as a Source for Bioethanol Production" Sustainable Chemistry 5, no. 1: 1-12. https://0-doi-org.brum.beds.ac.uk/10.3390/suschem5010001