Article

Power Spectrum and Connectivity Analysis in EEG Recording during Attention and Creativity Performance in Children

by
Diego M. Mateos
1,2,3,*,
Gabriela Krumm
1,4,5,
Vanessa Arán Filippetti
1,4,5 and
Marisel Gutierrez
1,4,5
1
Consejo Nacional de Investigaciones Científicas y Técnicas (CONICET), Buenos Aires C1425FQB, Argentina
2
Facultad de Ciencia y Tecnología, Universidad Autónoma de Entre Ríos (UADER), Oro Verde E3100, Argentina
3
Instituto de Matemática Aplicada del Litoral-UNL-CONICET (IMAL), CCT CONICET, Santa Fe S3000, Argentina
4
Centro Interdisciplinario de Investigaciones en Ciencias de la Salud y del Comportamiento (CIICSAC), Universidad Adventista del Plata, Libertador San Martin E3103XAF, Argentina
5
Facultad de Humanidades, Educación y Ciencias Sociales, Universidad Adventista del Plata, Libertador San Martin E3103XAF, Argentina
*
Author to whom correspondence should be addressed.
Submission received: 26 April 2022 / Revised: 17 May 2022 / Accepted: 21 May 2022 / Published: 2 June 2022
(This article belongs to the Special Issue EEG in Cognitive and Affective Neuroscience)

Abstract

:
The present research aims at examining the power spectrum and exploring functional brain connectivity/disconnectivity during concentration performance, as measured by the d2 test of attention and creativity as measured by the CREA test in typically developing children. To this end, we examined brain connectivity by using phase synchrony (i.e., phase locking index (PLI) over the EEG signals acquired by the Emotiv EPOC neuroheadset in 15 children aged 9- to 12-years. Besides, as a complement, a power spectrum analysis of the acquired signals was performed. Our results indicated that, during d2 Test performance there was an increase in global gamma phase synchronization and there was a global alpha and theta band desynchronization. Conversely, during CREA task, power spectrum analysis showed a significant increase in the delta, beta, theta, and gamma bands. Connectivity analysis revealed marked synchronization in theta, alpha, and gamma. These findings are consistent with other neuroscience research indicating that multiple brain mechanisms are indeed involved in creativity. In addition, these results have important implications for the assessment of attention functions and creativity in clinical and research settings, as well as for neurofeedback interventions in children with typical and atypical development.

1. Introduction

Attention is a multifaceted construct that encompasses distinct sub-processes (i.e., selective attention, sustained attention, and executive control [1,2]), enabling effective information processing and successful responses to changing demands. Furthermore, creativity has been defined as the highest expression of new ideas, flexibility of perspectives, and the ability to combine unrelated concepts in different ways, avoiding common paths [3,4]. Much has been written about creativity from different social, psychological, developmental, cognitive, and historical perspectives, and several theories have been proposed from these perspectives [5,6,7,8,9,10]. However, little is still known about the brain mechanisms underlying creative thinking, especially in children. Creativity is based on ordinary mental processes [11], making creative cognition a part of cognitive science and, therefore, of neuroscience. Indeed any theory of creativity must be consistent and integrated with the contemporary understanding of brain function [12]. Measuring attention and creativity at school age is of great significance, as both are skills related to academic performance [13,14]. Among those attentional and creativity tasks that have received considerable interest in the neuropsychology field are the d2 test of attention [15,16] and the CREA test [17,18,19,20,21], respectively.
To study attention and creativity, various methods have been used, including neurophysiological techniques, both in children with typical development [22] and those with neurodevelopmental disorders (see e.g., [23]). Electroencephalography (EEG) approaches, in particular, provide important evidence on both the substrate of cognitive functions in children and the way the brain-behavior relationship develops [24], through the recording of the bio-signals generated by the groups of neurons involved in those cognitive processes. Therefore, EEG can be used to assess cognitive functions and thus help to expand and deepen the understanding of the relationship between brain maturation and behavioral development [24]. In addition, its non-invasive nature makes it a suitable technique for the assessment of cognitive processes in children [24,25].
EEG studies are usually analyzed in terms of electrophysiological frequency band oscillations, which are categorized into delta (1–3 Hz), theta (4–8 Hz), alpha (8–13 Hz), beta (12–25 Hz), and gamma (35–100 Hz) bands. There is evidence that delta waves are related to resting sleep [26] and may play a role in cognitive processes such as decision making and attention [27]. Theta waves are associated with behavioral states, and synchronize under conditions of attentional and emotional burden in children [28] and meditation states in adults [29]. Alpha waves are associated with relaxation and states of inattention [30]. Finally, beta [31] and gamma [32] waves are involved in attentional processes (i.e., selective or focused attention). Gamma-band activity, in particular, has received increasing consideration in recent years due to its role in different cognitive processes [33,34]. Indeed, phase synchronization of gamma activity seems to be involved in attentional processes [34], and its measurement provides an important indicator of the relationship between executive functions and the prefrontal cortex [35]. It has also been hypothesized that an optimal level of gamma synchrony is necessary for cognitive performance [35]. This would be consistent with previous EEG studies in children with ADHD, which have observed reduced resting gamma activity [36], but greater activation during active task situations [37] compared to healthy controls. This would suggest that children with ADHD require greater gamma activation in order to achieve and sustain accurate task performance [36]. Increased gamma synchrony has also been observed in elderly healthy subjects, as a compensatory mechanism due to their lower ability to integrate information [35]. In addition, alpha desynchronization is also expected during concentration task performance, considering that its synchronization is actually observed during inattention and relaxation [30] (e.g., when practicing transcendental meditation [38]). Attenuated alpha activity has also been noticed in children during sustained attention [39], and in adults during spatial attention allocation [40] and word fluency [41]. According to Klimesch et al., (1996) [42], during alpha desynchronization, distinct neural populations start oscillating with different frequencies, leading to the disappearance of the dominant alpha activity.
Furthermore, EEG studies on creativity have shown changes in neural activity during creative activity in divergent thinking tasks, creative ideation, remote associations, creative stories, metaphors, paintings, and melodies [43,44,45,46,47,48,49,50,51,52,53,54,55,56,57,58]. Research in young people and adults on the power spectrum has shown increased power in certain brain areas during creativity tasks [46,47,51,54,58], specifically in the alpha band, in the frontal, parietal-occipital, and right hemispheric regions [47,51,54,59]. The changes in alpha seem to be due to attention, which is more inwardly focused [60], further allowing it to successfully inhibit information that is not relevant. In fact, it has been found that when people focus outward, alpha decreases [61,62]. EEG studies in older adults also revealed connectivity in the alpha band associated with individual creativity, but the power spectrum did not actually show any relationship with creative ability [63], so it seems that age is an important factor to be considered. Events related to alpha band desynchronization and synchronization are especially sensitive to the performance of cognitive tasks and higher cognitive abilities [64,65]. In general, studies show that a lower alpha power is observed during the performance of simple association creativity tasks than during the performance of more demanding creative idea generation tasks, with alpha being more synchronized with divergent thinking than with other creative ideation tasks [59]. However, alpha is not the only band in which changes are found in creativity tasks. Studies report changes in the delta, theta, beta, and gamma bands [53]. These studies have shown increases in the power of beta and gamma bands in the temporal region [46] and a decrease in the power of theta in the central and parieto-occipital areas [66]. In addition, in the latter work, an increase in connectivity in the alpha, beta, and gamma bands was observed with coherence analysis during the creative task. Connectivity changes in delta and theta have also been reported [67,68]. Specifically, theta has shown increased fronto-occipital functional connectivity in more creative individuals [68], becoming a band that has been found to be associated with cognitive control [69]. Another interesting work carried out by Razumnikova et al., (2009) [57], who found that theta power decreases during figural tasks and increases in verbal ones, compared to baseline. In contrast, a coherence study showed an increase in the theta band in figural tasks and a decrease in verbal ones. The beta band also increased in figural tasks relative to baseline. Along these lines Volf and Tarasova (2010), [58] studied the theta and beta bands during creativity task performance, observing that a high level of creativity in men and women is associated with these bands’ activity in the occipital and lateral frontal region. In general, there is a great heterogeneity of findings in EEG studies in relation to creative cognition in adults. These issue makes it difficult to draw solid conclusions regarding the impact or direction of alpha activity and the other bands, as well as its timing and its localization in the frontal, posterior, or even lateral hemispheric cortexes. This is because creativity can be viewed from many conceptual levels, including transient creative states, creative potential, and creative achievement, among others. Furthermore, creativity can refer to different definitions, (i.e., divergent thinking, imagination, and cognitive flexibility) and can be related to different domains, such as storytelling, story writing, poetry creation, drawing, or musical improvisation [70]. In this regard, Dietrich and Kanso (2010) [44] mention that correlations between neural activity and all these creative processes cannot be expected to be consistent. Moreover, when relationships are found, they seem to be mediated by talent [52,71], personality [49], gender [56,58], and age [72,73]. Considering the aforementioned reasons, it is necessary for the research conducted to be very clear about the definition of the construct, as well as the differentiation between creativity and other classical mental constructs or abilities, such as intelligence [50]. It is also important that the creativity construct can be decomposed into definable neurocognitive processes (e.g., [44]), while maintaining the valid and reliable psychometric properties of the tasks used, as in the case of divergent thinking tests such as the Creative Thinking Test [74] and the CREA [75]. In this sense, the EEG technique provides an environment with better conditions for studying creativity [50].
To our knowledge, no research has examined brain connectivity/disconnectivity during these two performances in typically developing children. The study of brain connectivity/disconnectivity is of great relevance, as it allows quantification of those brain areas that have more/less information exchange during a cognitive task in relation to the basal state, thus improving knowledge of the brain-behavior relationship. Therefore, this work aims at analyzing power spectrum characteristics and functional inter- and intrahemispheric brain connectivity/disconnectivity during d2 and CREA test performance in children. Examining brain activity in two tasks that place demands on different cognitive processes will not only provide insight into the processes underlying each task, but also validate the scanning method employed, as it is hypothesized that different brain regions should be activated during the execution of each task (i.e., d2 vs. CREA).

2. Materials and Methods

2.1. Participants

The sample consisted of 15 children, aged between 9 to 12 years, from Argentina (M = 10.33 , SD = 1.11 ), of middle-socioeconomic-status families. Children’s parents or legal guardians received a note on the research characteristics and the assessment implementation. It was clarified that participation was voluntary and anonymous. Finally, parents’ or legal tutors’ written consent was obtained prior to assessment. The acquisition data for the children was approved by “Research Ethics Committee of the Facultad de Ciencias de la Salud, Universidad Adventista del Plata (UAP)” (approval code: 5.7/2019). The evaluation was conducted individually, at two different times, in a suitable location. The EEG-recording Emotiv Epoc+ and its functioning was made available to parents upon request. Upon consultation, all parents and children expressed that they felt comfortable working with the Emotiv device. The inclusion criteria were: (a) children with no known history of neurological or psychiatric treatment; (b) normal hearing and normal or corrected-to-normal vision; (c) regular school attendance; and (d) no school repetition. In addition, IQ and levels of inattention and hyperactivity–impulsivity were assessed. Parents’ educational level was categorized by means of a 5-point scale, as follows: 1. primary level; 2. secondary level; 3. more education than secondary school, but less than a university degree; 4. university degree; 5. master’s degree or higher education. Table 1 shows the sociodemographic characteristics of the sample.

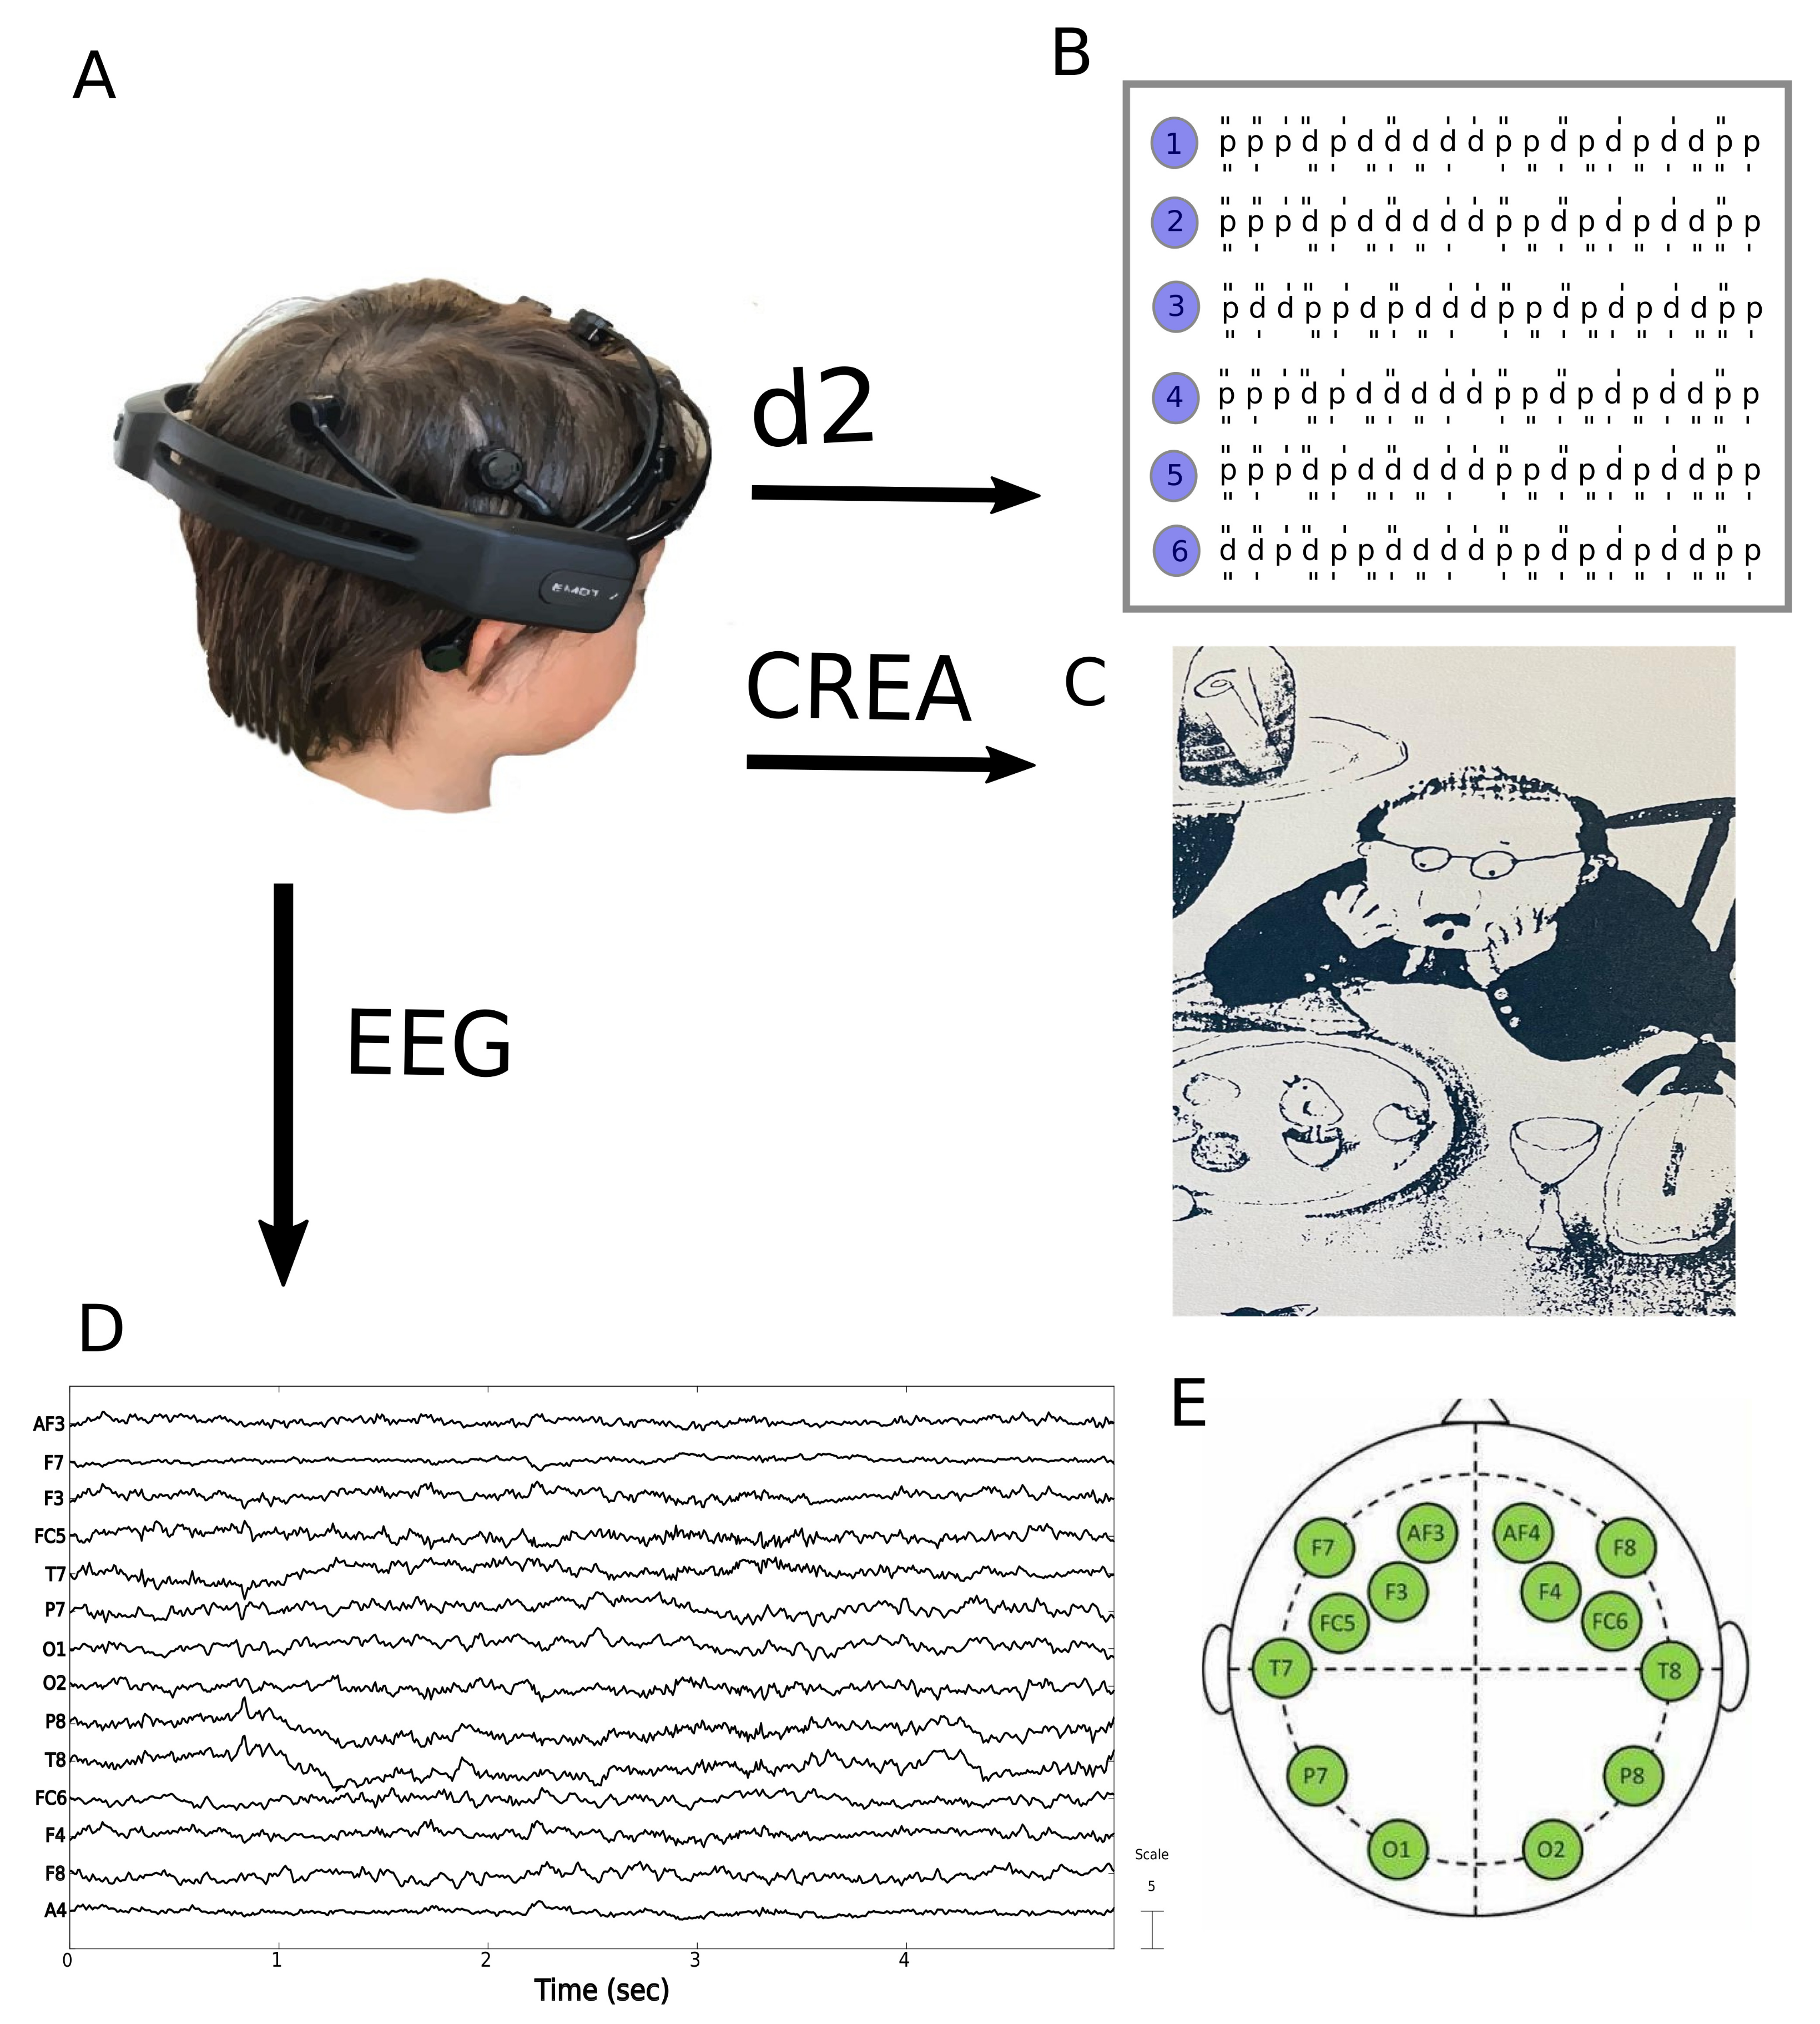
2.2. Data Acquisition

The Emotiv Epoc + [76] device was used to collect EEG data. It includes 14 electrodes (AF3, F3, F7, FC5, T7, P7, O1, O2, P8, T8, FC6, F8, F4, AF4) and 2 additional references placed according to the international 10–20 system (see Figure 1). The device filters the signals in a frequency range of 0.2–45 Hz, which enables up to 128 samples per second on each channel (sf = 128 Hz). Earlier research has indicated that the Emotiv Epoc EEG headset generates patterns of brain activity of good resolution [77] and has good test-retest reliability [78] properties.

2.3. Raven Test of Progressive Matrices

The Raven test of progressive matrices [79] provides a measure of general intellectual ability (fluid intelligence). According to the age of the children’s sample, it used either the colored scale (RCPM), made up of three series for children aged between 5 and 11 years, or the general scale (RPM), composed of five series for children aged 12 years old.

2.4. Swanson, Nolan, and Pelham Rating Scale, Fourth Version (SNAP-IV)

This scale assesses children’s hyperactivity, impulsivity, and attention deficit. It includes two versions, one for parents and one for teachers. Symptoms are evaluated on a scale of 0 to 3 points, with nine items related to attention and nine for hyperactivity–impulsivity. The range of severity goes from 0 to 27. The scale that has been used in Argentina is the teachers’ version, and it has been used as an instrument for detecting ADHD in Argentinian children between 4 and 14 years of age [80].

2.5. d2 Attention Test

The d2 test of Attention [81] offers a measure of selective attention, inhibitory control and mental concentration ability, by means of a selective search for relevant stimuli. The test includes a total of 658 items, organized in 14 lines, each containing 47 letters. The stimulus comprises the letters “d” and “p” with one or two dashes, placed either individually or in pairs above or below each letter (see Figure 1). Subjects have to search across the lines, so as to recognise and cross all instances of the letter “d” with two dashes (they may appear either above or below the letter) during 20 s per line. The test presents a high degree of internal consistency ( r > 0.90 ), regardless of the statistic (two-half method and odd-even) and the sample used [81].

2.6. CREA (Creative Intelligence) Test

From the divergent thinking approach, the purpose of this instrument is to assess creative intelligence according to the indicator of question generation in the theoretical context of problem search and solution [82]. The CREA offers a unique and indirect measure of creativity, in that it forces the activation of the mechanisms involved in the creative act, but does not strictly imply a productive creative performance. The test consists of three stimulus sheets (A, B and C) that are used according to age; each has a drawing from which the interviewee must formulate as many questions as possible within a set time (see Figure 1). It can be applied individually or collectively and can be used from the age of six. The ability to ask questions is a procedure for measuring creativity, which derives from the work of Torrance [83] with the Creative Thinking Test, but unlike the latter, each question posed in the CREA needs to be supported by a new cognitive schema; the generation of cognitive schemas is what becomes of interest in this instrument, but not the question itself as a creative product [75]. From the practical evidence, the test has proven to be predictive with respect to other creativity tests and differential regarding the measurement of IQ. From the statistical point of view, the test has shown convergent and divergent validity, as well as reliability. The test has norms for the Spanish and Argentinean samples of both sexes from 6 years of age onwards [82].

2.7. Data Analysis

The pre-processing was conducted using MATLAB © software and the free access package EEGLAB (https://sccn.ucsd.edu/eeglab/index.php). The raw data were filtered using a finite impulse response (FIR) bandpass filter (0.5–45 Hz). Electrode impedance was visually monitored using the Emotiv software and decreased until the required level was reached, ensuring good contact quality. Bad channels were manually removed and estimated using an interpolation algorithm. The signal was divided into epochs of 5 s length. A visual estimation of the signals was performed, eliminating the epoch that contained artefacts from movement or other acquisition problems. The mean number of epochs per subject was 52 ± 7 . Finally, an independent component analysis (ICA) was used to eliminate the components associated with myographic, cardiac, and ocular artifacts. Once the pre-processing was concluded, the epochs were grouped according to the two states, baseline (BL) and d2/CREA task.
In each study, we analyzed the relative difference power spectrum density (PS) between the BL state and d2/CREA. The PS was calculated considering the power of the full band of delta (1–3 Hz), theta (4–8 Hz), alpha (8–13 Hz), beta (13–25 Hz), and gamma bands (30–40 Hz). The calculation was like the above, that is, it was calculated by epoch, and then a mean value was computed for all subjects’ epoch. Finally, the relative difference of power was calculated as ( P S d 2 / C R E A P S B L ) / P S B L for each band. In this case, the results were plotted using the function of the eegLab topoplot package, which allows observing the results of PS distributed topographically in the cerebral cortex. To find out whether the differences between BL and d2 are significant, a statistical study was carried out. To test for data normality, a one-sample Kolmogorov–Smirnov Test was conducted. Since the data were not normally distributed ( p < 0.01 ), we employed the non-parametric Mann–Whitney U test.
To study the functional connectivity, we implemented the phase lag index [84] in order to measure the extent to which a distribution of phase angle differences is allocated toward positive or negative sides of the imaginary axis on the complex plane. The fundamental idea here is to disregard phase locking that is centered around 0 phase difference as a means of excluding the volume conduction effect. This also applies to phase locking at π , 2 π , and so on (i.e., repeating at every π , also given as 0 m o d π ). Mathematically, this can be expressed as follows:
P L I i j = n 1 t = 1 n s g n ( i m a g ( Δ ϕ i j ) )
where Δ ϕ i j = ϕ i ϕ j is the phase difference between two signals and the signum function that discards the phase difference of 0 m o d π . The P L I ranges between 0 and 1, with 0 indicating no coupling or instantaneous coupling due to volume conduction and 1 indicating true, lagged interaction.PLI is a useful tool for the functional analysis of specific brain functions, as it enables to reflect brain anatomical boundaries due to its high intrinsic synchronization [85]. Unlike other EGG connectivity brain measures, such as coherence (i.e., [86]), PLI does not rely on stationarity, and it is enough to conclude that two brain regions interact [87] either directly or through other groups of neural networks. Therefore, PLI would be a more suitable analysis than coherence when working with nonlinear and nonstationary signals, such as those of EEG [88]. Furthermore, as it has the additional benefit of enabling the detection of zero-phase lag events, it would be more useful in the study of how information is transferred and integrated in the brain [38].
Where Δ ϕ i j = ϕ i ϕ j is the phase difference between two signals and the signum function that discards phase difference of 0 m o d π . The P L I ranges between 0 and 1, with 0 indicating no coupling or instantaneous coupling due to volume conduction and 1 indicating true, lagged interaction. The calculation of the P L I index was applied to the same EEG bands that were used in the power analysis. In each band, all possible signal pairs were calculated. The mean value of the P L I obtained was then estimated for the epoch time length. This procedure was performed in both states and for each epoch; then, the average was calculated in each subject. Finally, for all subjects, the mean value μ s i j and the standard deviation σ s i j were calculated, being the s state s = b l , d 2 / C R E A and the i j of the two channels compared with i j ( i , j = 1 , , 14 ). We argue that two channels i j are more connected or disconnected during d2 task performance when the < μ d 2 / C R E A i j > is greater (i.e., connected) or lower (i.e., disconnected) than a threshold T h = μ b l i j ± σ b l i j (see full description in [89,90]). Although our synchrony analysis reveals only correlations between phases of oscillations, we used the term “connectivity”, as this analysis allows us to infer that these correlations could underlie some degree of connectivity [90].

3. Results

3.1. d2 Test

All children performed the d2 task accurately, with a performance that fell in the average range ( C P m e a n = 280.00 , S D = 57.96 ; T N E m e a n = 112.53 , S D = 26.33 ) but was higher than the 50th percentile according to the developmental norms provided in the d2 manual and a recent normative study with Spanish-speaking children. The average IQ was estimated at the 55.53 percentile ( S D = 30.5 ). Finally, no child had a profile consistent with ADHD (i.e., children had neither high levels of inattention and hyperactivity or impulsivity), according to the SNAP IV scale. Table 1 provides descriptive statistics for d2 task, intelligence, and behavioral measures.
The relative power spectrum was applied explained in Section 2.7, for the different physiological bands delta, theta, alpha, beta, and gamma. In Figure 2, the delta band shows no significant changes except for the F7 channel. The theta band shows a significant increase in the prefrontal cortex electrodes, but no changes are shown for the other areas. The alpha band shows a significant power decrease in overall channels during the d2 task. The beta band doesn’t present significant changes between states. Finally, the gamma band shows an increase in power in the left fronto-parietal and right parieto-occipital areas.
For the connectivity analysis, the P L I index was calculated from all possible pairwise signal combinations employing the procedure detailed in the Section 2.7. As explained in the methods section, the connectivity/disconnectivity during the d2 task performance was calculated with respect to the baseline state. The frequencies band analyzed were the same as the PSD. Figure 3 (left panel, blue line) shows the relative connected channels during the d2 test for the different frequency bands. The delta band shows a connectivity between the frontal and left temporal channels with the right temporal areas. In the theta and alpha bands, there is no higher connectivity than in the baseline state. The beta band presents greater intra-hemispheric connectivity in the frontal channels. The gamma band shows a marked global connectivity, both inter- and intra-hemispheric, in the frontal, temporal, and occipital areas. On the other hand, Figure 3 (right panel, red dotted line) shows the relative disconnectivity between channels on the frequency bands mentioned before. The delta band presents an inter-hemispheric disconnectivity in the prefrontal channels. The theta band shows a high disconnectivity between the frontal and occipital areas with the left temporal lobe. The alpha band has a global disconnection between the frontal, temporal, and parietal areas. In the beta band, the disconnectivity occurs between the left occipital area and the frontal areas. In the gamma band, no significant disconnections between the channels are observed.

3.2. CREA Test

For the power spectrum analyses in the CREA test, the same bands as those analysed for the d2 test were used. Figure 4 shows that during the CREA task, there is a significant power increase in the frontal area in Delta band. Similarly, for the theta band, an increase in the frontal area is observed, especially in the electrodes F8, F4, and F7. In the alpha band, no significant changes are observed at most electrodes, except for a small decrease in power at the frontal levels. The beta band shows an increase in power at the electrodes located in the right parieto-occipital area, and a slight increase in the right frontotemporal area. Finally, for the gamma band, we have an increase in the electrodes in the right occipital area.
The connectivity/disconnectivity analysis was implemented in the same bands used for the d2 study. Figure 5 (left panel, blue line) shows the connected channels during the CREA test for the different frequency bands. We can observe that there is a high fronto-occipital connectivity for the theta band. For the alpha band, connectivity is observed between electrode F7 and the frontal and temporal electrodes. Gamma has a higher connectivity between electrode P8 and the fronto-temporal electrodes. For the delta and beta bands, no major changes in connectivity are seen.
For the case of disconnectivity, except for the alpha band in some particular channels, there are no significant changes in any band.

4. Discussion

The aim of the present study was to explore the power spectrum density and the functional brain connectivity and disconnectivity during CP, as measured by the d2 and CREA tests. On the one hand, power spectral density reflects the “frequency content” of the signal, or the distribution of signal power over frequency [91]. On the other hand, the phase locking index (PLI) [84] measures the phase difference between two neuroelectric signals, and it could be interpreted in the context of neural integration [87]. The fundamental idea about PLI is to disregard phase locking that is centered around 0 phase difference as a means of excluding volume conduction effects (at the risk of ignoring true instantaneous interactions) [85]. Unlike other EEG connectivity brain measures, such as coherence (i.e., MSC; Clifford Carter, 1987), PLI does not rely on stationarity, and it is enough to conclude that two brain regions interact [87] either directly or through other groups of neural networks. Therefore, PLI is a more suitable analysis than coherence when working with nonlinear and nonstationary signals, such as those of EEG [88]. Furthermore, as it has the additional benefit of enabling the detection of zero-phase lag events, it would be more useful in the study of how information is transferred and integrated in the brain [38].

4.1. d2 Study

Our results showed global gamma-phase synchrony and a regional increase in beta- and delta-band phase synchrony. In addition, we observed a general desynchronization of alpha activity and a regional one of the beta, delta, and theta bands. Gamma phase synchronization has been reported in previous studies during attentional conditions [31,34], as a mechanism for large-scale cognitive integration across brain areas [92,93]. Several hypotheses have been proposed to explain synchronous gamma-band activity, including increased attention, increased alertness, and the binding hypothesis [34,94]. Beta-frequency phase synchronization during attention paradigms is also supported by earlier studies (see [31]). For example, beta band oscillations are observed when subjects are engaged in problem-solving activities or tasks that demand critical thinking [95] (e.g., during math performance [96] or visual spatial attention [97]). Finally, delta-band synchronization during CP is also consistent with studies that have found increased delta coherence during word fluency tasks [41] and attentional processes (for a review, see [27]). Furthermore, frontal coherence in both delta and beta frequencies has been positively associated with executive function performance [98]. Thus, our results are in line with previous studies showing that gamma- [34], beta- [31], and delta-band [27] synchronization play a role in attentional processes. Alpha desynchronization during d2 task performance is also consistent with studies that have examined the role of alpha-band activity during attention and cognitive functions.
For instance, earlier research reported a decrease in the alpha band during visual spatial attention [97] and word fluency [41]. It has been argued that while alpha desynchronization indicates external attention and cognitive processing, alpha synchrony reflects internal attention [99]. We also observed regional theta desynchronization during CP. A decrease in frontal theta coherence has also been observed during VF tasks [41]. These results support the hypothesis that increased arousal reduces the activity in the theta band, further shifting it towards the beta band [100]. Indeed, there is evidence that ADHD children show increased theta activity [100], suggesting cortical hypoarousal [101]. Consistently, a decrease in alpha [30] and theta activity [100] has been noticed after methylphenidate (MPH) administration, probably due to an increase in cortical arousal [102]. The theta band also increases during nondirective meditation [29], when subjects’ attention is focused on their breathing without external instructions [103], and during states of internalized attention and positive emotional experiences [28,104]. In this sense, as with alpha activity [99], theta activity has a differential role in internal vs. external attention. Thus, our results regarding alpha and theta desynchronization could be interpreted as a greater cortical activation during external attention. Interestingly, when comparing the two EEG analyses performed in the current study, that is, power spectrum and PLI synchrony, the most significant differences with respect to the BS were found in the alpha and gamma bands, supporting earlier reports that alpha and gamma rhythms are frequently inversely coupled [105,106]. Specifically, for the alpha band, a decrease in power was observed during d2 task performance in the right frontal, temporal, and parietal channels. Interestingly, our results of PLI synchrony analysis regarding the alpha band show a significant disconnection between the frontal, temporal, and parietal channels during d2 task. Concerning the gamma band, the power increases during the d2 task across all channels. Earlier studies have also consistently observed an association between gamma power and EF [107,108,109]. For the gamma band, our synchrony study shows high connectivity between all channels during d2 task performance.
These data have important clinical and educational implications for the neuroscience field. First, to our knowledge, while the role of gamma activity in children’s cognitive and behavioral outcomes has been mainly assessed under resting conditions [36,110] and after auditory task stimuli [37], there are no studies on brain connectivity in children during a “state of concentration” that study all frequency bands through phase synchrony analysis. This is important, considering that only synchrony measures (unlike power spectral) “bear directly on the possible role of gamma activity in cognition”, as they provide direct evidence about electrode pairs and their local location ([93], p. 433). Therefore, only synchrony measures can be considered as indicators of long-range synchrony [88]. Thus, our data help to enhance knowledge of the role of gamma activity during CP in children under different conditions and analysis methods. Our results also have important implications for neurofeedback interventions in children with attentional and executive problems. The d2 test is widely used as part of the neurofeedback protocol treatment in ADHD children [111] and for the study of the relationship between CP and MPH-induced power changes [30]. However, although it is considered an indicator of attentional ability in children, both for diagnostic purposes and rehabilitation, to our knowledge, no study has previously examined the brain activity elicited during its execution in children. Thus, the current study is of great relevance, as it provides not only evidence on the validity of the d2 as an attentional measure, but also enables one to make inferences about the brain changes that underlie cognitive performance following interventions targeting cognitive development. Indeed, it has been hypothesized that changes in attentional functions, as measured by d2 and following meditation and coordinative exercise interventions, could be due to structural and functional brain changes [112] and the facilitation of neuronal networks that would lead to a pre-activation of the cortical activities underlying attention [113]. In addition, although neurofeedback may not affect the power spectrum of EEG signals, an improvement in d2 performance has been noticed after beta/theta training in children with ADHD [114]. This is consistent with our results regarding a greater connectivity in the frontal area for the beta band and theta-band desynchronization during d2 performance. Thus, our data could be useful in selecting cognitive measures to examine training effectiveness and understanding the nature of brain changes, after applying neurofeedback protocols, mindfulness practices, and other interventions aimed at improving attention and EF in children.

4.2. CREA Study

Power spectrum analysis showed that during the CREA task, there was a significant increase in the bands: delta in the left frontal area, theta in the fronto-temporal areas of both hemispheres, beta in the right hemisphere, and gamma in the left parieto-occipital and right frontal-parietal region. In general, power spectrum studies show improvements in neural activity in the alpha band in creativity tasks [47,51,72,73]. However, in this power study, no activity was found in alpha, but in delta, theta, beta, and gamma.
Delta and subdelta frequencies are the quietest frequencies in the human brain. When globally distributed, the brain usually goes into sleep [115]. These waves are also involved in decision making after a new or unexpected signal [116], and in cognitive flexibility in sudden task switching [115]. In turn, cognitive flexibility is important for divergent thinking [117], with the CREA task being a divergent thinking one, which requires asking questions in the face of a stimulus.
Theta activity is related to novelty detection [118] and to the imagination of fictitious scenes [119]. In the CREA task, questions are asked about a scene, which often leads to imagining fictitious elements of what is happening in the image. In terms of evidence, an increase in power has been found in verbal creative tasks compared to visual ones [57].
Beta has been suggested to be involved in the encoding of acquired experiences, and changes in rhythms have been associated with the perception of simple and complex stimuli, as well as attention and wakefulness levels [58,120,121]. This band is related to externally focused attention [122], sensory processing, and sensorimotor control [123], as well as processing tasks [124], and it also reflects psychomotor speed in intelligence tests [125]. Evidence has shown an increase in the power of this band in creative verbal tasks compared to baseline [57,58]. While Beta does not commonly appear in creativity studies, and in many cases has shown ambiguous results [66], in this work the CREA task requires processing an image and writing questions about that image as fast as possible, thus requiring external focused attention and psychomotor speed, as subjects must write the questions in a given time.
Finally, gamma activity may be due to the fact that this band is involved in many cognitive, sensory, and memory processes, and it is related to a state of arousal, alertness, and attention [115]. The occurrence of this band should not be considered in relation to specific mental states, but to the organization and maintenance of brain system activity [126,127]. Studies of creativity that have included this band have found, as with beta, ambiguous results, which could be due to task specificity or factors not controlled for in the experiment [66]. Similarly, in this study, the occurrence of gamma is consistent with the internal processes involved in CREA.
On the other hand, connectivity analysis showed that during the creativity task, there was marked connectivity between frontal and fronto-occipital channels in theta, high fronto-temporal connectivity in alpha, and higher connectivity in the right fronto-temporal and right parietal areas in gamma. Connectivity was also present in the delta and beta bands. There were no major changes in brain disconnectivity. Regarding theta, an increase in frontal-occipital functional connectivity has been found to be associated with an increase in creativity [68]. Furthermore, this band is found to be associated with increased cognitive control, which plays an important role in creative divergent thinking tasks [69,128]. Coherence studies have shown an increase of this band in a creativity task, relative to baseline in women [129], as well as an increase of delta and theta in creative figure tasks in adults [130].
In relation to alpha, increased connectivity in this band has been shown in a variety of creativity tasks [48,59,60,131], and it has even been reported to appear in both divergent and convergent thinking tasks, due to the internal processing demands that the latter require [61]. In this work, alpha connectivity may indicate that children are able to exclude interfering external stimuli in order to generate creative responses. Indeed, Benedek et al. (2011) mention that attention seems to play a key role in alpha fluctuations related to creativity. Outward-facing attention largely involves visual processing, and has been found to reduce alpha activity during divergent thinking; conversely, when attention is inward-facing, alpha potency increases. Simply closing the eyes has also been shown to improve divergent task performance [132].
As for gamma, as mentioned above, it is a band that encompasses many cognitive processes, and the results found so far are somewhat ambiguous. A coherence study reported an increase in the interaction of the gamma, beta, and alpha bands during the performance of a creativity test, compared to the control [66].
In relation to beta, coherence studies have shown an increase of this band in creativity tasks compared to baseline [57,129]. Finally, although studies with the delta band are scarce, an increase of this band has been found in visual divergent thinking tasks [133]. On the other hand, Bechtereva and Nagornova [130], through a coherence study in adults, found an increase in delta and theta, but a decrease in alpha, beta, and gamma bands in a creative task vs. baseline. In addition, Bhattacharya and Petsche [88] found that art students exhibited better delta synchronization in frontal regions when performing a mental composition drawing, while non-artists exhibited beta and gamma synchronization. Creative work is a complex activity that involves different mental processes depending on the type of task to be performed. In our work, the task of creativity requires the processing of an image and its interpretation in a given time, which requires attention, speed, flexibility of thought to change the questions asked about the image, capacity for association, originality, and other processes that the child must carry out in order to write the answer. All of these activities could be activating a variety of processes associated with almost all EEG bands. Although this work is preliminary, it is necessary to continue performing studies of creativity in children with other types of divergent thinking tasks.
This work has some important limitations that need to be addressed. Firstly, and mainly because we are working with children, eye and head movements introduce large artefacts to EEG recordings. This resulted in the need to discard many epochs during the pre-processing stage. Secondly, our EEG results should be observed as preliminary because of the small sample size. Finally, as only TD children with ages ranging from 8 to 13 years were included, the generalization of findings to other age ranges and clinical samples is limited. Future research would benefit from examining the electrophysiological correlates during concentration performance and creativity in older children and in children with atypical development.

5. Conclusions

In summary, our electrophysiological data revealed that d2 task performance increased brain gamma and beta-band synchronization. Besides, there was a global desynchronization in alpha-band and, to a lesser extent, in theta activity. These results contribute to the neuroscience and developmental neuropsychology fields, by providing not only evidence in favor of the validity of the d2 as a measure of attention and concentration in school-age children, but also further understanding of the neural processes involved in selective attention during childhood. Furthermore, the electrophysiological study of CREA showed changes in the spectral power of beta, delta, theta, and gamma, which could be due to the multiple cognitive and emotional factors at stake when performing a creative task. In addition, unlike d2, theta, alpha, and gamma waves showed high connectivity in frontal areas, which are regions associated with cognitive control that play an important role in creative processes. In general, findings in terms of connectivity are consistent with the demands of the task in terms of the requirements of attention, concentration, insight, and creativity for the generation of ideas, also providing validity for the CREA test, as a measure of creativity from divergent thinking. Taken together, this research provides useful data to outline tests to be included in neurofeedback training protocols for children with typical development and children with neurodevelopmental disorders.

Author Contributions

Conceptualization, D.M.M., G.K. and V.A.F.; methodology, D.M.M.; software, D.M.M.; formal analysis, D.M.M.; investigation, G.K. and V.A.F.; resources, V.A.F., G.K. and D.M.M.; data acquisition, G.K. and M.G.; writing—original draft preparation, D.M.M., G.K. and V.A.F.; writing—review and editing, V.A.F., G.K. and D.M.M.; visualization, D.M.M. All authors have read and agreed to the published version of the manuscript.

Funding

This research was funded by Universidad Adventista del Plata (UAP) and Fondo para la Investigación Científica y Tecnológica (FONCYT) PICT-2019.

Institutional Review Board Statement

The study was conducted according to the guidelines of the Declaration of Helsinki, and approved by the Ethics Committee Facultad de Ciencias de la Salud, Universidad Adventista del Plata (UAP) protocol code 5.7/2019.

Informed Consent Statement

Informed consent was obtained from all subjects involved in the study.

Data Availability Statement

All the data used are available upon request.

Conflicts of Interest

The authors declare no conflict of interest. The funders had no role in the design of the study; in the collection, analyses, or interpretation of data; in the writing of the manuscript, or in the decision to publish the results.

References

  1. Brauch Lehman, E.; Naglieri, J.A.; Aquilino, S. A national study on the development of visual attention using the cognitive assessment system. J. Atten. Disord. 2010, 14, 15–24. [Google Scholar] [CrossRef] [PubMed]
  2. Manly, T.; Anderson, V.; Nimmo-Smith, I.; Turner, A.; Watson, P.; Robertson, I. The differential assessment of children’s attention: The Test of Everyday Attention for Children (TEA-Ch), normative sample and ADHD performance. J. Child Psychol. Psychiatry Allied Discip. 2001, 42, 1065–1081. [Google Scholar] [CrossRef] [PubMed]
  3. Benedek, M.; Franz, F.; Heene, M.; Neubauer, A. Differential effects of cognitive inhibition and intelligence on creativity. Personal. Individ. Differ. 2012, 53, 480–485. [Google Scholar] [CrossRef] [PubMed] [Green Version]
  4. Benedek, M.; Konen, T.; Neubauer, A. Associative abilities underlying creativity. Psychol. Aesthet. Creat. Arts 2012, 6, 273. [Google Scholar] [CrossRef]
  5. Amabile, T. The social psychology of creativity: A componential conceptualization. J. Personal. Soc. Psychol. 1983, 45, 357. [Google Scholar] [CrossRef]
  6. Csikszentmihalyi, M. The Flow Experience and Its Significance for Human Psychology; Optimal Experience: Psychological Studies of Flow in Consciousness; Csikszentmihalyi, I.S., Ed.; Cambridge University Press: Cambridge, UK, 1988. [Google Scholar]
  7. Guilford, J. The structure of intellect. Psychol. Bull. 1956, 53, 267. [Google Scholar] [CrossRef]
  8. Mednick, S. The associative basis of the creative process. Psychol. Rev. 1962, 69, 220–232. [Google Scholar] [CrossRef] [Green Version]
  9. Simonton, D. Scientific Genius: A Psychology of Science; Cambridge University Press: Cambridge, UK, 1988. [Google Scholar]
  10. Sternberg, R.; Lubart, T. Investing in creativity. Am. Psychol. 1996, 51, 677. [Google Scholar] [CrossRef]
  11. Boden, M. Creativity and artificial intelligence. Artif. Intell. 1998, 103, 347–356. [Google Scholar] [CrossRef] [Green Version]
  12. Pfenninger, K.; Shubik, V. Insights into the foundation of creativity: A synthesis. Orig. Creat. 2001, 103, 213–236. [Google Scholar]
  13. Arán Filippetti, V.; Gutierrez, M.; Krumm, G.; Mateos, D. Convergent validity, academic correlates and age-and SES-based normative data for the d2 Test of attention in children. Appl. Neuropsychol. Child 2021, 1–11. [Google Scholar] [CrossRef] [PubMed]
  14. Garaigordobil, M.; Torres, E. Evaluación de la creatividad en sus correlatos con inteligencia y rendimiento académico. Univ. Tarracon. 1996, 18, 87–101. [Google Scholar]
  15. Brickenkamp, R.; Zillmer, E. The d2 Test of Attention; Hogrefe & Huber: Cambridge, MA, USA, 1998. [Google Scholar]
  16. Lord, W.; Clarke, P. Use of the d2 Test of Attention as a Predictor of Driving Proficiency. In Driver Behaviour and Training; Routledge: Oxfordshire, UK, 2017; pp. 437–441. [Google Scholar]
  17. Arán Filippetti, V.; Krumm, G. A hierarchical model of cognitive flexibility in children: Extending the relationship between flexibility, creativity and academic achievement. Child Neuropsychol. 2020, 26, 770–800. [Google Scholar] [CrossRef] [PubMed]
  18. Krumm, G.; Filippetti, A. The contribution of executive functions to creativity in children: What is the role of crystallized and fluid intelligence? Think. Skills Creat. 2018, 29, 185–195. [Google Scholar] [CrossRef] [Green Version]
  19. Gras, R.; Corbalán, B. Creatividad y estilos de personalidad: Aproximación a un perfil creativo en estudiantes universitarios. Psicol. Ann. Psychol. 2010, 26, 273–278. [Google Scholar]
  20. Elisondo, R.; Donolo, D. ¿Creatividad o inteligencia? That is not the question. An. Psicol. Ann. Psychol. 2010, 26, 220–225. [Google Scholar]
  21. Berná Corbalán, J.; Gras, R. El genio en una botella. El test CREA, las preguntas y la creatividad. Introducción al monográfico “El test CREA, inteligencia creativa”. An. Psicol. Ann. Psychol. 2010, 26, 197–205. [Google Scholar]
  22. Perry, N.; Swingler, M.; Calkins, S.; Bell, M. Neurophysiological correlates of attention behavior in early infancy: Implications for emotion regulation during early childhood. J. Exp. Child Psychol. 2016, 142, 245–261. [Google Scholar] [CrossRef] [Green Version]
  23. Cheung, C.; McLoughlin, G.; Brandeis, D.; Banaschewski, T.; Asherson, P.; Kuntsi, J. Neurophysiological correlates of attentional fluctuation in attention-deficit/hyperactivity disorder. Brain Topogr. 2017, 30, 320–332. [Google Scholar] [CrossRef] [Green Version]
  24. Taylor, M.; Baldeweg, T. Application of EEG, ERP and intracranial recordings to the investigation of cognitive functions in children. Dev. Sci. 2002, 5, 318–334. [Google Scholar] [CrossRef]
  25. Mueller, V.; Brehmer, Y.; Von Oertzen, T.; Li, S.C.; Lindenberger, U. Electrophysiological correlates of selective attention: A lifespan comparison. BMC Neurosci. 2008, 9, 1–21. [Google Scholar] [CrossRef] [PubMed] [Green Version]
  26. Bernardi, G.; Betta, M.; Ricciardi, E.; Pietrini, P.; Tononi, G.; Siclari, F. Regional delta waves in human rapid eye movement sleep. J. Neurosci. 2019, 39, 2686–2697. [Google Scholar] [CrossRef] [PubMed] [Green Version]
  27. Güntekin, B.; Başar, E. Review of evoked and event-related delta responses in the human brain. Int. J. Psychophysiol. 2016, 103, 43–52. [Google Scholar] [CrossRef] [PubMed] [Green Version]
  28. Orekhova, E.; Stroganova, T.; Posikera, I.; Elam, M. EEG theta rhythm in infants and preschool children. Clin. Neurophysiol. 2006, 117, 1047–1062. [Google Scholar] [CrossRef]
  29. Lagopoulos, J.; Xu, J.; Rasmussen, I.; Vik, A.; Malhi, G.S.; Eliassen, C.; Arntsen, I.; Sæther, J.; Hollup, S.; Holen, A.; et al. Increased theta and alpha EEG activity during nondirective meditation. J. Altern. Complement. Med. 2009, 15, 1187–1192. [Google Scholar] [CrossRef]
  30. Wienbruch, C.; Paul, I.; Bauer, S.; Kivelitz, H. The influence of methylphenidate on the power spectrum of ADHD children—An MEG study. BMC Psychiatry 2005, 5, 1–16. [Google Scholar] [CrossRef] [Green Version]
  31. Womelsdorf, T.; Fries, P. The role of neuronal synchronization in selective attention. Curr. Opin. Neurobiol. 2007, 17, 154–160. [Google Scholar] [CrossRef]
  32. Benasich, A.; Gou, Z.; Choudhury, N.; Harris, K. Early cognitive and language skills are linked to resting frontal gamma power across the first 3 years. Behav. Brain Res. 2008, 195, 215–222. [Google Scholar] [CrossRef] [Green Version]
  33. Engel, A.; Fries, P.; Singer, W. Dynamic predictions: Oscillations and synchrony in top-down processing. Nat. Rev. Neurosci. 2001, 2, 704–716. [Google Scholar] [CrossRef]
  34. Fell, J.; Fernandez, G.; Klaver, P.; Elger, C.E.; Fries, P. Is synchronized neuronal gamma activity relevant for selective attention? Brain Res. Rev. 2003, 42, 265–272. [Google Scholar] [CrossRef]
  35. Paul, R.; Richard Clark, C.; Lawrence, J.; Goldberg, E.; Williams, L.; Cooper, N.; Cohen, R.A.; Brickman, A.; Gordon, E. Age-dependent change in executive function and gamma 40 Hz phase synchrony. J. Integr. Neurosci. 2005, 4, 63–76. [Google Scholar] [CrossRef] [PubMed]
  36. Barry, R.; Clarke, A.; Hajos, M.; McCarthy, R.; Selikowitz, M.; Dupuy, F. Resting-state EEG gamma activity in children with attention-deficit/hyperactivity disorder. Clin. Neurophysiol. 2010, 121, 1871–1877. [Google Scholar] [CrossRef] [PubMed]
  37. Yordanova, J.; Banaschewski, T.; Kolev, V.; Woerner, W.; Rothenberger, A. Abnormal early stages of task stimulus processing in children with attention-deficit hyperactivity disorder-evidence from event-related gamma oscillations. Clin. Neurophysiol. 2001, 112, 1096–1108. [Google Scholar] [CrossRef]
  38. Hebert, R.; Lehmann, D.; Tan, G.; Travis, F.; Arenander, A. Enhanced EEG alpha time-domain phase synchrony during Transcendental Meditation: Implications for cortical integration theory. Signal Process. 2005, 85, 213–2232. [Google Scholar] [CrossRef]
  39. Xie, W.; Mallin, B.M.; Richards, J. Development of infant sustained attention and its relation to EEG oscillations: An EEG and cortical source analysis study. Dev. Sci. 2018, 21, e12562. [Google Scholar] [CrossRef]
  40. Thut, G.; Nietzel, A.; Brandt, S.A.; Pascual-Leone, A. α-Band electroencephalographic activity over occipital cortex indexes visuospatial attention bias and predicts visual target detection. J. Neurosci. 2006, 26, 9494–9502. [Google Scholar] [CrossRef] [Green Version]
  41. Tucker, D.; Dawson, S.; Roth, D.L.; Penland, J. Regional changes in EEG power and coherence during cognition: Intensive study of two individuals. Behav. Neurosci. 1985, 99, 564. [Google Scholar] [CrossRef]
  42. Klimesch, W.; Doppelmayr, M.; Schimke, H.P.T. Alpha frequency, reaction time, and the speed of processing information. J. Clin. Neurophysiol. 1996, 13, 511–518. [Google Scholar] [CrossRef]
  43. Arden, R.; Chavez, R.S.; Grazioplene, R.; Jung, R. Neuroimaging creativity: A psychometric view. Behav. Brain Res. 2010, 214, 143–156. [Google Scholar] [CrossRef]
  44. Dietrich, A.; Kanso, R. A review of EEG, ERP, and neuroimaging studies of creativity and insight. Psychol. Bull. 2010, 136, 822. [Google Scholar] [CrossRef]
  45. Bazanova, O.; Aftanas, L. Individual measures of electroencephalogram alpha activity and non-verbal creativity. Neurosci. Behav. Physiol. 2008, 38, 227–235. [Google Scholar] [CrossRef] [PubMed]
  46. Danko, S.; Shemyakina, N.; Nagornova, Z.; Starchenko, M. Comparison of the effects of the subjective complexity and verbal creativity on EEG spectral power parameters. Hum. Physiol. 2009, 35, 381–383. [Google Scholar] [CrossRef]
  47. Fink, A.; Grabner, R.; Benedek, M.; Reishofer, G.; Hauswirth, V.; Fally, M.; Neuper, C.; Ebner, F.; Neubauer, A. The creative brain: Investigation of brain activity during creative problem solving by means of EEG and fMRI. Hum. Brain Mapp. 2009, 30, 734–748. [Google Scholar] [CrossRef]
  48. Fink, A.; Neubauer, A. EEG alpha oscillations during the performance of verbal creativity tasks: Differential effects of sex and verbal intelligence. Int. J. Psychophysiol. 2006, 62, 46–53. [Google Scholar] [CrossRef] [PubMed]
  49. Fink, A.; Neubauer, A. Eysenck meets Martindale: The relationship between extraversion and originality from the neuroscientific perspective. Personal. Individ. Differ. 2008, 44, 299–310. [Google Scholar] [CrossRef]
  50. Fink, A.; Benedek, M. EEG alpha power and creative ideation. Neurosci. Biobehav. Rev. 2014, 44, 111–123. [Google Scholar] [CrossRef] [Green Version]
  51. Grabner, R.; Fink, A.; Neubauer, A.C. Brain correlates of self-rated originality of ideas: Evidence from event-related power and phase-locking changes in the EEG. Behav. Neurosci. 2007, 121, 224. [Google Scholar] [CrossRef] [Green Version]
  52. Jaušovec, N. Differences in cognitive processes between gifted, intelligent, creative, and average individuals while solving complex problems: An EEG study. Intelligence 2000, 28, 213–237. [Google Scholar] [CrossRef]
  53. Pidgeon, L.M.; Grealy, M.; Duffy, A.H.; Hay, L.; McTeague, C.; Vuletic, T.; Coyle, D.; Gilbert, S. Functional neuroimaging of visual creativity: A systematic review and meta-analysis. Brain Behav. 2016, 6, e00540. [Google Scholar] [CrossRef] [Green Version]
  54. Rominger, C.; Papousek, I.; Perchtold, C.; Benedek, M.; Weiss, E.; Schwerdtfeger, A.; Fink, A. Creativity is associated with a characteristic U-shaped function of alpha power changes accompanied by an early increase in functional coupling. Cogn. Affect. Behav. Neurosci. 2019, 19, 1012–1021. [Google Scholar] [CrossRef] [Green Version]
  55. Stevens, C., Jr.; Zabelina, D. Creativity comes in waves: An EEG-focused exploration of the creative brain. Curr. Opin. Behav. Sci. 2019, 27, 154–162. [Google Scholar] [CrossRef] [Green Version]
  56. Razumnikova, O. Gender differences in hemispheric organization during divergent thinking: An EEG investigation in human subjects. Neurosci. Lett. 2004, 362, 193–195. [Google Scholar] [CrossRef] [PubMed]
  57. Razumnikova, O.; Volf, N.; Tarasova, I. Strategy and results: Sex differences in electrographic correlates of verbal and figural creativity. Hum. Physiol. 2009, 35, 285–294. [Google Scholar] [CrossRef]
  58. Volf, N.; Tarasova, I. The relationships between EEG θ and β oscillations and the level of creativity. Hum. Physiol. 2010, 36, 132–138. [Google Scholar] [CrossRef]
  59. Jauk, E.; Benedek, M.; Neubauer, A. Tackling creativity at its roots: Evidence for different patterns of EEG alpha activity related to convergent and divergent modes of task processing. Int. J. Psychophysiol. 2012, 84, 219–225. [Google Scholar] [CrossRef] [Green Version]
  60. Benedek, M. The Neuroscience of Creative Idea Generation. In Exploring Transdisciplinarity in Art and Sciences; Springer: Berlin, Germany, 2018; pp. 31–48. [Google Scholar]
  61. Benedek, M.; Bergner, S.; Könen, T.; Fink, A.; Neubauer, A. EEG alpha synchronization is related to top-down processing in convergent and divergent thinking. Neuropsychologia 2011, 49, 3505–3511. [Google Scholar] [CrossRef] [Green Version]
  62. Stevens, C., Jr.; Zabelina, D. Classifying creativity: Applying machine learning techniques to divergent thinking EEG data. NeuroImage 2020, 219, 116990. [Google Scholar] [CrossRef]
  63. Nobukawa, S.; Yamanishi, T.; Ueno, K.; Mizukami, K.; Nishimura, H.; Takahashi, T. High phase synchronization in alpha band activity in older subjects with high creativity. Front. Hum. Neurosci. 2020, 14, 420. [Google Scholar] [CrossRef]
  64. Neubauer, A.; Fink, A.; Grabner, R. Sensitivity of alpha band ERD to individual differences in cognition. Prog. Brain Res. 2006, 159, 167–178. [Google Scholar]
  65. Neubauer, A.C.; Fink, A. Intelligence and neural efficiency. Neurosci. Biobehav. Rev. 2009, 33, 1004–1023. [Google Scholar] [CrossRef]
  66. Shemyakina, N.; Danko, S.; Nagornova, Z.; Starchenko, M.; Bechtereva, N. Changes in the power and coherence spectra of the EEG rhythmic components during solution of a verbal creative task of overcoming a stereotype. Hum. Physiol. 2007, 33, 524–530. [Google Scholar] [CrossRef]
  67. Boot, N.; Baas, M.; Mühlfeld, E.; de Dreu, C.; van Gaal, S. Widespread neural oscillations in the delta band dissociate rule convergence from rule divergence during creative idea generation. Neuropsychologia 2017, 104, 8–17. [Google Scholar] [CrossRef]
  68. Wokke, M.; Padding, L.; Ridderinkhof, K. Creative Brains Show Reduced Mid Frontal Theta. bioRxiv 2019, 370494. [Google Scholar]
  69. Cavanagh, J.F.; Frank, M. Frontal theta as a mechanism for cognitive control. Trends Cogn. Sci. 2014, 18, 414–421. [Google Scholar] [CrossRef] [PubMed] [Green Version]
  70. Fink, A.; Benedek, M. The Creative brain: Brain correlates underlying the generation of original ideas. Neurosci. Creat. 2013, 1, 207–232. [Google Scholar]
  71. Jin, S.H.; Kwon, Y.J.; Jeong, J.S.; Kwon, S.W.; Shin, D.H. Differences in brain information transmission between gifted and normal children during scientific hypothesis generation. Brain Cogn. 2006, 62, 191–197. [Google Scholar] [CrossRef]
  72. Privodnova, E.; Volf, N. Features of temporal dynamics of oscillatory brain activity during creative problem solving in young and elderly adults. Hum. Physiol. 2016, 42, 469–475. [Google Scholar] [CrossRef]
  73. Privodnova, E.; Volf, N.; Knyazev, G. Specific features of the oscillatory brain activity during the final stage of creative problem solving in young and elderly subjects. Hum. Physiol. 2017, 43, 241–247. [Google Scholar] [CrossRef]
  74. Torrance, E.; Ball, O.; Safter, H. Torrance Tests of Creative Thinking: Streamlined Scoring Guide. Figural A and B; Scholastic Testing Service: Bensenville, IL, USA, 1992. [Google Scholar]
  75. Corbalán Berná, J.; Martínez Zaragoza, F.; Donolo, D.; Alonso Monreal, C.; Tejerina Arreal, M.; Limiñana Gras, R. CREA. In Inteligencia Creativa. Una Medida Cognitiva de la Creatividad; TEA Ediciones: Madrid, Spain, 2003. [Google Scholar]
  76. Emotiv Epoc+ Emotiv. Available online: https://www.emotiv.com/epoc/ (accessed on 8 September 2021).
  77. Bobrov, P.; Frolov, A.; Cantor, C.; Fedulova, I.; Bakhnyan, M.; Zhavoronkov, A. Brain-computer interface based on generation of visual images. PLoS ONE 2011, 6, e20674. [Google Scholar] [CrossRef]
  78. Amjad, I.; Toor, H.; Niazi, I.K.; Afzal, H.; Jochumsen, M.; Shafique, M.; Allen, K.; Haavik, H.; Ahmed, T. Therapeutic effects of aerobic exercise on EEG parameters and higher cognitive functions in mild cognitive impairment patients. Int. J. Neurosci. 2019, 129, 551–562. [Google Scholar] [CrossRef]
  79. Raven, J.; Court, J.; Raven, J. Test de Matrices Progresivas. Escalas Coloreada, General y Avanzada. Manual; Paidós: Buenos Aires, Argentina, 2008. [Google Scholar]
  80. Grañana, N.; Richaudeau, A.; Gorriti, C.; O’Flaherty, M.; Scotti, M.E.; Sixto, L.; Allegri, R.; Fejerman, N. Evaluación de déficit de atención con hiperactividad: La escala SNAP IV adaptada a la Argentina. Rev. Panam. Salud PÚBlica 2011, 29, 344–349. [Google Scholar] [CrossRef] [PubMed] [Green Version]
  81. Brickenkamp, R. d2, Test de Atención (Revisada y Ampliada), 2nd ed.; TEA Ediciones: Madrid, Spain, 2004. [Google Scholar]
  82. Elisondo, R.; Donolo, D. Los estímulos en un test de creatividad. Incidencias según género, edad y escolaridad. Bol. Psicol. 2011, 101, 51–65. [Google Scholar]
  83. Torrance, E. Torrance Tests of Creative Thinking: Manual for Scoring and Interpreting Results; Scholastic Testing Service: Bensenville, IL, USA, 1990. [Google Scholar]
  84. Stam, C.; Nolte, G.; Daffertshofer, A. Phase lag index: Assessment of functional connectivity from multi channel EEG and MEG with diminished bias from common sources. Hum. Brain Mapp. 2007, 28, 1178–1193. [Google Scholar] [CrossRef] [PubMed]
  85. Cohen, M. Analyzing Neural Time Series Data: Theory and Practice; MIT Press: Cambridge, MA, USA, 2014. [Google Scholar]
  86. Carter, G.C. Coherence and time delay estimation. Proc. IEEE 1987, 75, 236–255. [Google Scholar] [CrossRef]
  87. Lachaux, J.P.; Rodriguez, E.; Martinerie, J.; Varela, F. Measuring phase synchrony in brain signals. Hum. Brain Mapp. 1999, 8, 194–208. [Google Scholar] [CrossRef] [Green Version]
  88. Bhattacharya, J.; Petsche, H. Phase synchrony analysis of EEG during music perception reveals changes in functional connectivity due to musical expertise. Signal Process. 2005, 85, 2161–2177. [Google Scholar] [CrossRef]
  89. Guevara Erra, R.; Mateos, D.; Wennberg, R.; Perez Velazquez, J. Statistical mechanics of consciousness: Maximization of information content of network is associated with conscious awareness. Phys. Rev. E 2016, 94, 052402. [Google Scholar] [CrossRef] [Green Version]
  90. Mateos, D.; Wennberg, R.; Guevara, R.; Perez Velazquez, J. Consciousness as a global property of brain dynamic activity. Phys. Rev. E 2017, 96, 062410. [Google Scholar] [CrossRef] [Green Version]
  91. Dressler, O.; Schneider, G.; Stockmanns, G.; Kochs, E. Awareness and the EEG power spectrum: Analysis of frequencies. Br. J. Anaesth. 2004, 93, 806–809. [Google Scholar] [CrossRef] [Green Version]
  92. Doesburg, S.; Roggeveen, A.; Kitajo, K.; Ward, L. Large-scale gamma-band phase synchronization and selective attention. Cereb. Cortex 2008, 18, 386–396. [Google Scholar] [CrossRef] [Green Version]
  93. Rodriguez, E.; George, N.; Lachaux, J.P.; Martinerie, J.; Renault, B.; Varela, F.J. Perception’s shadow: Long-distance synchronization of human brain activity. Nature 1999, 397, 430–433. [Google Scholar] [CrossRef] [PubMed]
  94. Aoki, F.; Fetz, E.; Shupe, L.; Lettich, E.; Ojemann, G. Increased gamma-range activity in human sensorimotor cortex during performance of visuomotor tasks. Clin. Neurophysiol. 1999, 110, 524–537. [Google Scholar] [CrossRef]
  95. Ferraracci, J.; Anzalone, C.; Bridges, R.; Moore, R.; Decker, S. QEEG correlates of cognitive processing speed in children and adolescents with traumatic brain injuries. Appl. Neuropsychol. Child 2019, 10, 1–11. [Google Scholar] [CrossRef]
  96. González-Garrido, A.; Gómez-Velázquez, F.; Salido-Ruiz, R.; Espinoza-Valdez, A.; Vélez-Pérez, H.; Romo-Vazquez, R.; Gallardo-Moreno, G.; Ruiz-Stovel, V.; Martínez-Ramos, A.; Berumen, G. The analysis of EEG coherence reflects middle childhood differences in mathematical achievement. Brain Cogn. 2018, 124, 57–63. [Google Scholar] [CrossRef] [PubMed]
  97. Marrufo, M.; Vaquero, E.; Cardoso, M.; Gomez, C.M. Temporal evolution of α and β bands during visual spatial attention. Cogn. Brain Res. 2001, 12, 315–320. [Google Scholar] [CrossRef]
  98. Fleck, J.; Kuti, J.; Brown, J.; Mahon, J.; Gayda-Chelder, C. Frontal-posterior coherence and cognitive function in older adults. Int. J. Psychophysiol. 2016, 110, 217–230. [Google Scholar] [CrossRef]
  99. Shaw, J. Intention as a component of the alpha-rhythm response to mental activity. Int. J. Psychophysiol. 1996, 24, 7–23. [Google Scholar] [CrossRef]
  100. Clarke, A.; Barry, R.; Bond, D.; McCarthy, R.; Selikowitz, M. Effects of stimulant medications on the EEG of children with attention-deficit/hyperactivity disorder. Psychopharmacology 2002, 164, 277–284. [Google Scholar] [CrossRef]
  101. Satterfield, J.; Cantwell, D. CNS function and response to methylphenidate in hyperactive children. Psychopharmacol. Bull. 1974, 10, 36–37. [Google Scholar]
  102. Loo, S.; Teale, P.; Reite, M. EEG correlates of methylphenidate response among children with ADHD: A preliminary report. Biol. Psychiatry 1999, 45, 1657–1660. [Google Scholar] [CrossRef]
  103. Ahani, A.; Wahbeh, H.; Nezamfar, H.; Miller, M.; Erdogmus, D.; Oken, B. Quantitative change of EEG and respiration signals during mindfulness meditation. J. Neuroeng. Rehabil. 2014, 11, 1–11. [Google Scholar] [CrossRef] [PubMed] [Green Version]
  104. Aftanas, L.; Golocheikine, S. Human anterior and frontal midline theta and lower alpha reflect emotionally positive state and internalized attention: High-resolution EEG investigation of meditation. Neurosci. Lett. 2001, 310, 57–60. [Google Scholar] [CrossRef]
  105. Bagherzadeh, Y.; Baldauf, D.; Pantazis, D.; Desimone, R. Alpha synchrony and the neurofeedback control of spatial attention. Neuron 2020, 105, 577–587. [Google Scholar] [CrossRef] [PubMed]
  106. Roux, F.; Uhlhaas, P. Working memory and neural oscillations: Alpha–gamma versus theta–gamma codes for distinct WM information? Trends Cogn. Sci. 2014, 18, 16–25. [Google Scholar] [CrossRef] [PubMed]
  107. Brito, N.; Fifer, W.; Myers, M.; Elliott, A.; Noble, K. Associations among family socioeconomic status, EEG power at birth, and cognitive skills during infancy. Dev. Cogn. Neurosci. 2016, 19, 144–151. [Google Scholar] [CrossRef] [PubMed] [Green Version]
  108. Gou, Z.; Choudhury, N.; Benasich, A. Resting frontal gamma power at 16, 24 and 36 months predicts individual differences in language and cognition at 4 and 5 years. Behav. Brain Res. 2011, 220, 263–270. [Google Scholar] [CrossRef] [PubMed] [Green Version]
  109. Tarullo, A.; Obradović, J.; Keehn, B.; Rasheed, M.; Siyal, S.; Nelson, C.; Yousafzai, A. Gamma power in rural Pakistani children: Links to executive function and verbal ability. Dev. Cogn. Neurosci. 2017, 26, 1–8. [Google Scholar] [CrossRef]
  110. Njiokiktjien, C.; De Rijke, W.; Jonkman, E. Children with nonverbal learning disabilities (NLD): Coherence values in the resting state may reflect hypofunctional long distance connections in the right hemisphere. Hum. Physiol. 2001, 27, 523–528. [Google Scholar] [CrossRef]
  111. Drechsler, R.; Straub, M.; Doehnert, M.; Heinrich, H.; Steinhausen, H.C.; Brandeis, D. Controlled evaluation of a neurofeedback training of slow cortical potentials in children with attention deficit/hyperactivity disorder (ADHD). Behav. Brain Funct. 2007, 3, 1–13. [Google Scholar] [CrossRef] [Green Version]
  112. Moore, A.; Malinowski, P. Meditation, mindfulness and cognitive flexibility. Conscious. Cogn. 2009, 18, 176–186. [Google Scholar] [CrossRef]
  113. Budde, H.; Voelcker-Rehage, C.; Pietraßyk-Kendziorra, S.; Ribeiro, P.; Tidow, G. Acute coordinative exercise improves attentional performance in adolescents. Neurosci. Lett. 2008, 441, 219–223. [Google Scholar] [CrossRef] [PubMed]
  114. Mohammadi, M.; Malmir, N.; Khaleghi, A.; Aminiorani, M. Comparison of sensorimotor rhythm (SMR) and beta training on selective attention and symptoms in children with attention deficit/hyperactivity disorder (ADHD): A trend report. Iran. J. Psychiatry 2015, 10, 165. [Google Scholar]
  115. Horan, R. The neuropsychological connection between creativity and meditation. Creat. Res. J. 2009, 21, 199–222. [Google Scholar] [CrossRef]
  116. Aftanas, L.; Reva, N.; Varlamov, A.; Pavlov, S.; Makhnev, V. Analysis of evoked EEG synchronization and desynchronization in conditions of emotional activation in humans: Temporal and topographic characteristics. Neurosci. Behav. Physiol. 2004, 34, 859–867. [Google Scholar] [CrossRef] [PubMed]
  117. Dietrich, A. The cognitive neuroscience of creativity. Psychon. Bull. Rev. 2004, 11, 1011–1026. [Google Scholar] [CrossRef] [PubMed] [Green Version]
  118. Knight, R. Contribution of human hippocampal region to novelty detection. Nature 1996, 383, 256–259. [Google Scholar] [CrossRef] [PubMed]
  119. Hassabis, D.; Kumaran, D.; Maguire, E. Using imagination to understand the neural basis of episodic memory. J. Neurosci. 2007, 27, 14365–14374. [Google Scholar] [CrossRef]
  120. Hanslmayr, S.; Aslan, A.; Staudigl, T.; Klimesch, W.; Herrmann, C.; Bäuml, K.H. Prestimulus oscillations predict visual perception performance between and within subjects. Neuroimage 2007, 37, 1465–1473. [Google Scholar] [CrossRef]
  121. Pulvermüller, F.; Birbaumer, N.; Lutzenberger, W.; Mohr, B. High-frequency brain activity: Its possible role in attention, perception and language processing. Prog. Neurobiol. 1997, 52, 427–445. [Google Scholar] [CrossRef]
  122. Wróbel, A. Beta activity: A carrier for visual attention. Acta Neurobiol. Exp. 2000, 60, 247–260. [Google Scholar]
  123. Lalo, E.; Gilbertson, T.; Doyle, L.; Di Lazzaro, V.; Cioni, B.; Brown, P. Phasic increases in cortical beta activity are associated with alterations in sensory processing in the human. Exp. Brain Res. 2007, 177, 137–145. [Google Scholar] [CrossRef] [PubMed]
  124. Pfurtscheller, G.; Andrew, C. Event-related changes of band power and coherence: Methodology and interpretation. J. Clin. Neurophysiol. 1999, 16, 512. [Google Scholar] [CrossRef] [PubMed]
  125. Polunina, A.; Davydov, D. EEG correlates of Wechsler adult intelligence scale. Int. J. Neurosci. 2006, 116, 1231–1248. [Google Scholar] [CrossRef]
  126. Kaiser, J.; Lutzenberger, W. Induced gamma-band activity and human brain function. Neuroscientist 2003, 9, 475–484. [Google Scholar] [CrossRef]
  127. Pulvermüller, F.; Keil, A.; Elbert, T. High-frequency brain activity: Perception or active memory? Trends Cogn. Sci. 1999, 3, 250–252. [Google Scholar] [CrossRef] [Green Version]
  128. Zabelina, D.; Ganis, G. Creativity and cognitive control: Behavioral and ERP evidence that divergent thinking, but not real-life creative achievement, relates to better cognitive control. Neuropsychologia 2018, 118, 20–28. [Google Scholar] [CrossRef] [PubMed] [Green Version]
  129. Petsche, H. Approaches to verbal, visual and musical creativity by EEG coherence analysis. Int. J. Psychophysiol. 1996, 24, 145–159. [Google Scholar] [CrossRef]
  130. Bechtereva, N.; Nagornova, Z. Changes in EEG coherence during tests for nonverbal (figurative) creativity. Hum. Physiol. 2007, 33, 515–523. [Google Scholar] [CrossRef]
  131. Jung-Beeman, M.; Bowden, E.; Haberman, J.; Frymiare, J.; Arambel-Liu, S.; Greenblatt, R.; Reber, P.; Kounios, J.; Dehaene, S. Neural activity when people solve verbal problems with insight. PLoS Biol. 2004, 2, e97. [Google Scholar] [CrossRef] [Green Version]
  132. Ritter, S.; Abbing, J.; Van Schie, H. Eye-closure enhances creative performance on divergent and convergent creativity tasks. Front. Psychol. 2018, 9, 1315. [Google Scholar] [CrossRef]
  133. Sviderskaya, N. The EEG spatial pattern and psychophysiological characteristics of divergent and convergent thinking in humans. Hum. Physiol. 2011, 37, 31–38. [Google Scholar] [CrossRef]
Figure 1. Scheme of the experiment and data recording during d2 and CREA test. (A) Illustration of the Emotiv Epoc device placed on a child. (B) Example of the worksheet useded in the D2 attention test. (C) Example of an illustration used in the creativity CREA test. (D) Extract of EEG signal acquired by the device. (E) Distribution of EEG acquisition channels of the Emotiv Epoc.
Neurosci 03 00025 g001
Figure 2. Relative difference of PS between BL and d2 state for the different frequency bands. The values are expressed in log ( u V 2 / H z ) .
Neurosci 03 00025 g002
Figure 3. Connectivity/disconnectivity analysis for d2 task. Left panel: the blue lines represent the existence of a greater connectivity between brain areas during d2 performance with respect to the baseline state. Right panel: the red dotted lines represent the disconnection between brain areas during d2 performance with respect to the baseline state.
Neurosci 03 00025 g003
Figure 4. Relative difference of PS between BL and during CREA test for the different frequency bands. The values are expressed in log ( u V 2 / H z ) .
Neurosci 03 00025 g004
Figure 5. Connectivity/disconnectivity analysis for CREA task. Left panel: blue lines represent the existence of a greater connectivity between brain areas during CREA performance with respect to the baseline state. Right panel: red dotted lines represent the disconnection between brain areas during CREA performance with respect to the baseline state.
Neurosci 03 00025 g005
Table 1. Demographic characteristics of the sample and descriptive statistics of measures.
M ± SD or %
Age (M ± SD) 10.33 ± 1.11
Gender (% girls) 46.7
Father educational level 3.2 ± 1.22
Mother educational level 3.46 ± 0.92
Gestational age (<37 weeks) 100 % full-term
Weight at birth 3.37 (0.41)
Breastfeeding
 Exclusive 73.3
 Mixed 26.7
Dominant hand 100 % right-handed
Foreign language study 66.7
 Years studying a foreign language 2.26 ± 2.52
Extracurricular activities
 Soccer or volleyball 46.7
 Skate or dance school 33.3
 Choir combined with some sport20
 Years practicing extracurricular activities 4 ± 1.06
Raven (percentile) 55.53 ± 30.55
SNAP-IV
 Inattention 0.60 ± 0.67
 Hyperactivity–impulsivity 0.60 ± 0.65
 Combined ADHD 1.20 ± 0.86
d2 test
 Total efficiency of the task 112.53 ± 26.33
 Concentration performance 280.00 ± 57.96
 Fluctuation rate 11.13 ± 2.72
CREA (percentile) 83.20 ± 26.33
Publisher’s Note: MDPI stays neutral with regard to jurisdictional claims in published maps and institutional affiliations.

