Evaluation of Concrete Material Properties at Early Age


1
Department of Civil and Construction Engineering, Swinburne University of Technology, Melbourne, VIC 3122, Australia
2
Civil Engineering Department, University of Baghdad, Baghdad 10070, Iraq
3
Australian Engineered Fasteners and Anchors Council (AEFAC), Melbourne, VIC 3122, Australia
*
Author to whom correspondence should be addressed.
CivilEng 2020, 1(3), 326-350; https://0-doi-org.brum.beds.ac.uk/10.3390/civileng1030021
Submission received: 26 October 2020
/
Revised: 30 November 2020
/
Accepted: 1 December 2020
/
Published: 3 December 2020
(This article belongs to the Special Issue Connections in Concrete)
Abstract
:This article investigates the development of the following material properties of concrete with time: compressive strength, tensile strength, modulus of elasticity, and fracture energy. These properties were determined at seven different hydration ages (18 h, 30 h, 48 h, 72 h, 7 days, 14 days, 28 days) for four pure cement concrete mixes totaling 336 specimens tested throughout the study. Experimental data obtained were used to assess the relationship of the above properties with the concrete compressive strength and how these relationships are affected with age. Further, this study investigates prediction models available in literature and recommendations are made for models that are found suitable for application to early age concrete. Results obtained indicate that the relationship between the splitting tensile strength and concrete compressive strength can be approximated with a power function between 0.7 and 0.8, and this correlation is not affected by age. Fracture energy of the concrete and modulus of elasticity values obtained in this study correlate well with the square root of the compressive strength and it was found that this relationship holds true for all hydration ages investigated in this paper. Inverse analysis on the wedge-splitting test was conducted to determine the direct tensile strength. Values of tensile strength obtained from the inverse analysis have been validated numerically by carrying out finite element analysis on the wedge split, and anchor pull-out tests. The ratio of the tensile strength obtained from the inverse analysis to the splitting tensile strength was found to be in the range of 0.5–0.9 and 0.7 on average.
1. Introduction
The application of anchorage in the construction industry is increasing every year with the demand of increased flexibility in the design of new structures and strengthening of existing ones. In addition, there is an increasing use of precast concrete elements in construction that require both lifting means, as well as means of connection to other elements on site. Although there are available models for predicting capacity of fasteners and failure modes, the understanding of the fastening technology remains poor [1]. One of the highly accepted models for predicting the capacity of fasteners is the concrete capacity design (CCD) method which was originally proposed by [2]. This method is based on the original κ-method introduced by Eligehausen, Fuchs, and Mayer in (1987/1988) and inherits the same mechanical model [3]. This method is based on experimental data where fasteners have been installed and tested in mature concrete. However, in current applications especially for precast lifting purposes, fasteners are loaded before reaching a concrete age of 28 days.
The original form of the equation that estimates the concrete cone capacity is shown in Equation (1) [4]. The term (k1 fcc,2000.5) represents the tensile capacity of the concrete, and (k2 hef2) refers to the area of the concrete cone formed, while the term (k3/hef0.5) is to account for the size effect. This translates to, the fastener tensile capacity is determined by the concrete tensile strength, and the concrete tensile strength is determined indirectly from the square root of the concrete compressive strength (k1 fcc,2000.5). The assumption of the concrete tensile strength being proportioned to the compressive strength to the power 0.5 is widely adopted for mature concrete, as it can be seen in most design codes available including the Australian standard for concrete structures [5]. However, this may not yield accurate representation of the early age tensile strength of the concrete.
where, Nu,c0 is the concrete cone capacity.
Nu,c0 = k1 fcc,2000.5 × k2 hef2 × k3/hef0.5
k1, k2, k3 are the fitting factors.
fcc,200 is the cube compressive strength.
hef is the effective embedment depth.
Although the CCD-method prediction formula includes the term (fcc,2000.5), but theoretically the behavior of fasteners can only be explained using linear fracture mechanics. Therefore, research conducted by Sawade (1994) introduced the following formula for the prediction of ultimate load [4].
where, Nu is the concrete cone capacity.
Nu = 2.1× (Ec × Gf)0.5 × hef1.5
Ec is the concrete modulus of elasticity.
Gf is the concrete fracture energy.
Furthermore, it has been validated numerically and experimentally that the capacity of anchors is not influenced by the compressive strength or the tensile strength of the concrete, but the modulus of elasticity and fracture energy (Ec × Gf)0.5 [4]. Therefore, the term (fcc,2000.5) is present in the CCD method prediction formula because it can accurately replace the term (Ec × Gf)0.5 i.e., fracture energy and modulus of elasticity correlate well with the square root of the compressive strength. In addition, concrete compressive strength is a more suitable parameter for a design formula as it can be readily determined from cylinder compressive tests. Therefore, it is essential to understand the correlation between compressive strength, modulus of elasticity, and fracture energy for early age concrete in order to understand the behavior of fasteners in early age concrete.
This study investigates the correlation between compressive strength and modulus of elasticity, splitting tensile strength, direct tensile strength, and fracture energy of concrete at early age from 18 h. Furthermore, an assessment of models available in literature that predict these properties is also made and recommendations are provided for models that are suitable for early age concrete. Finally, a finite element analysis is conducted to verify the suitability of the material properties tested for modelling cast-in headed fasteners behavior in early age concrete.
2. Materials and Methods
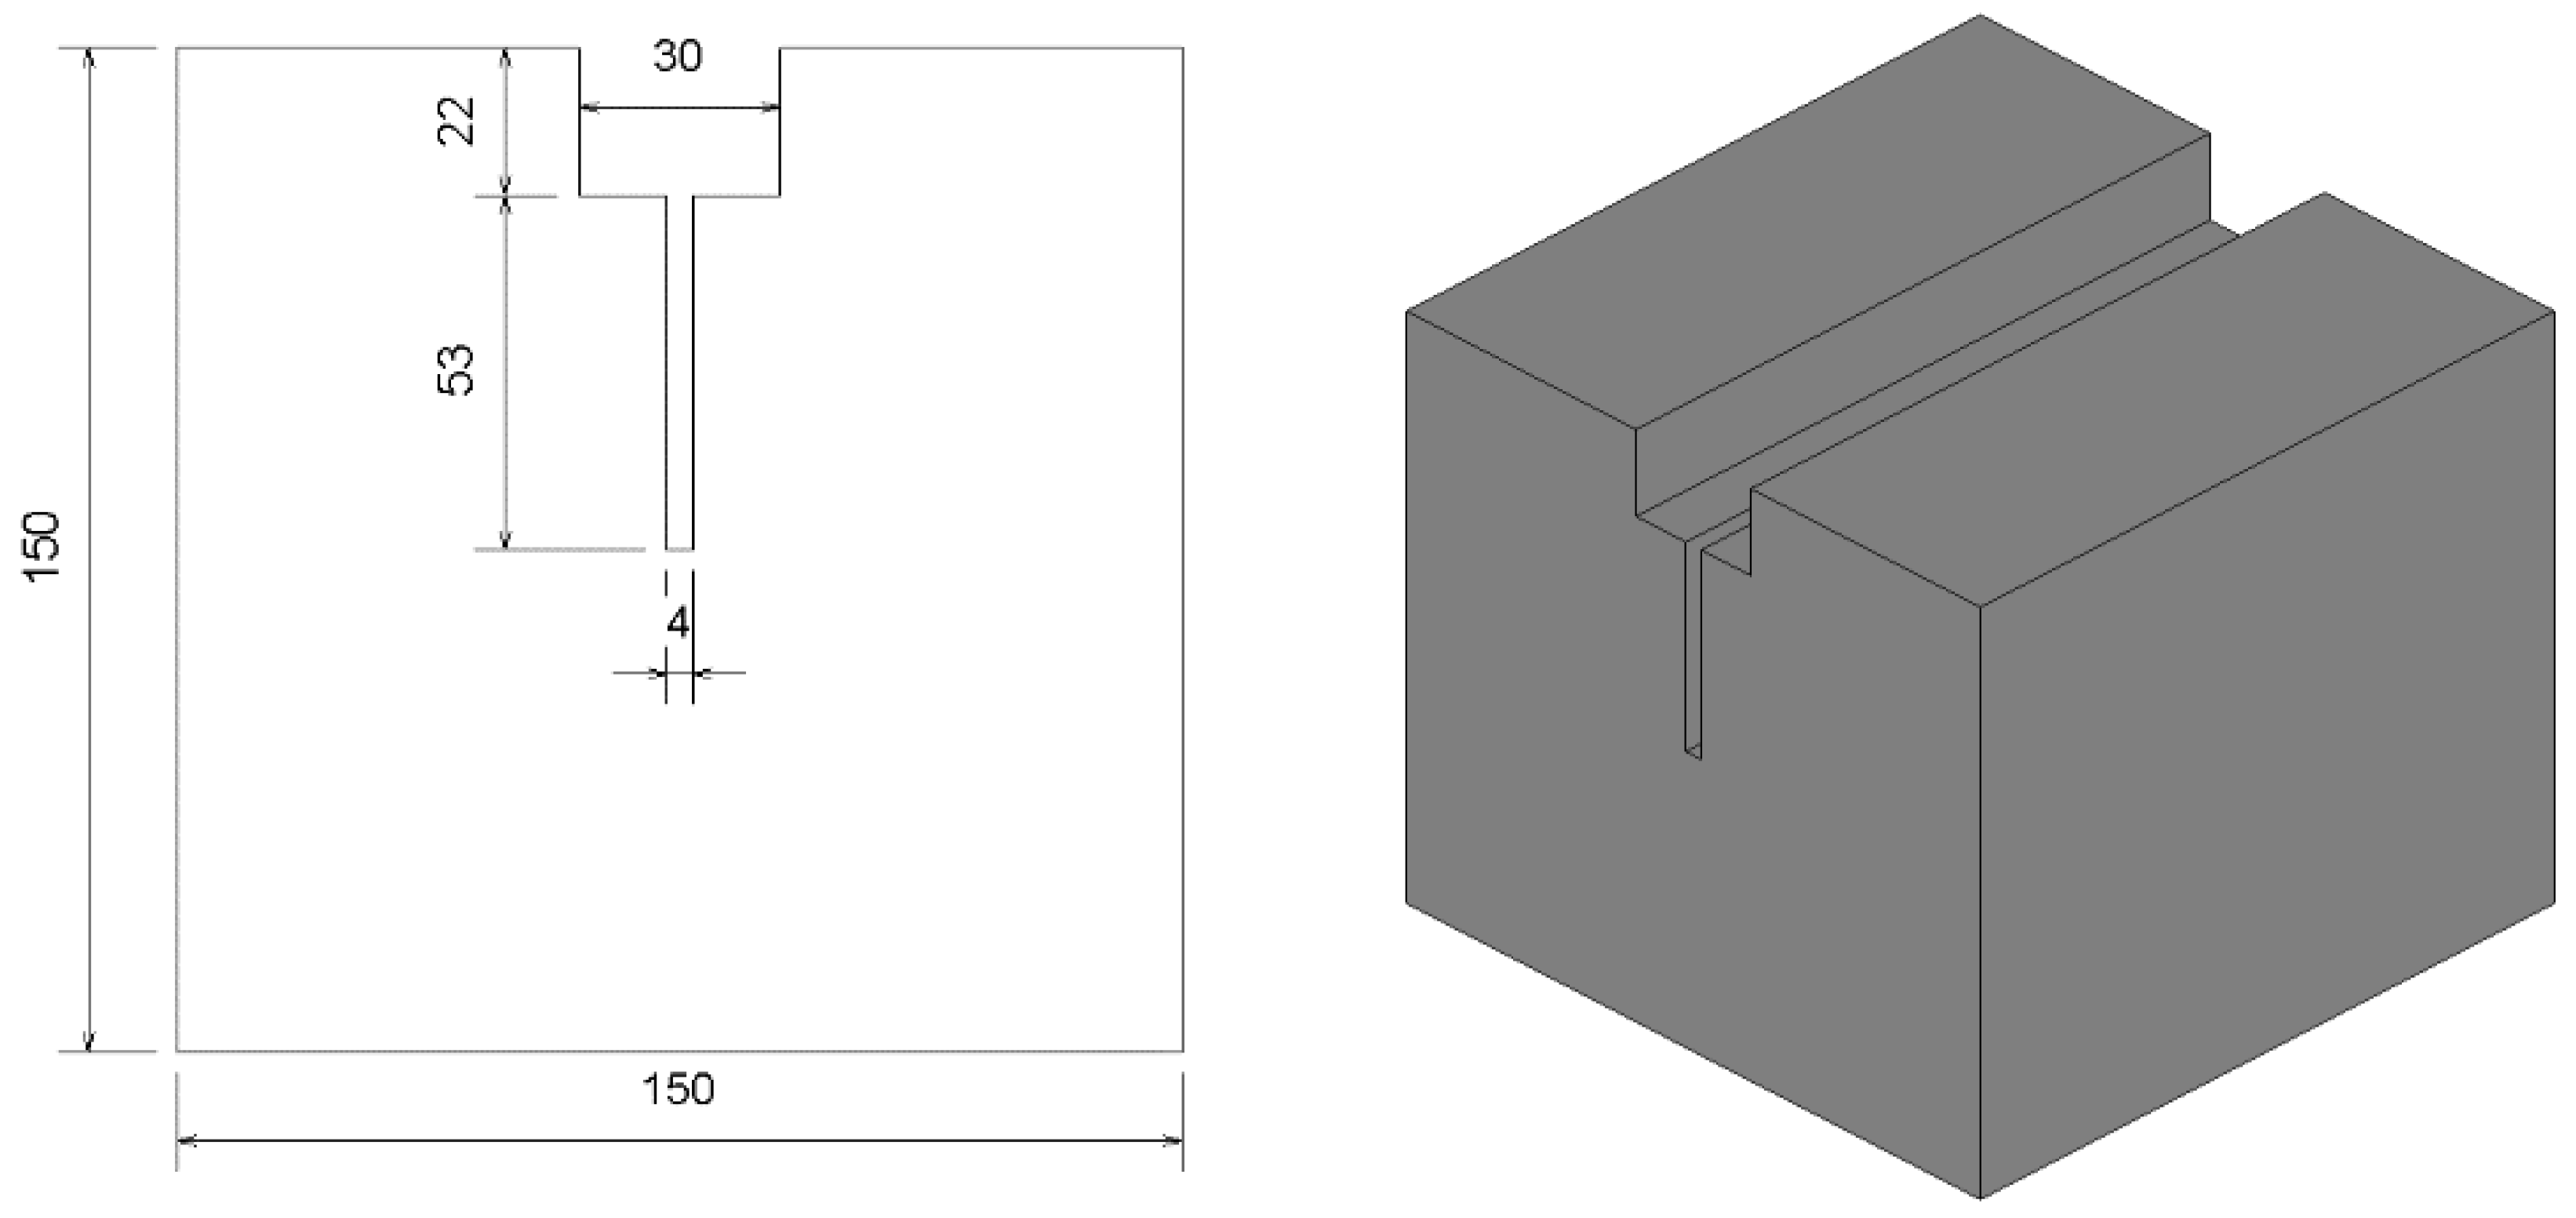
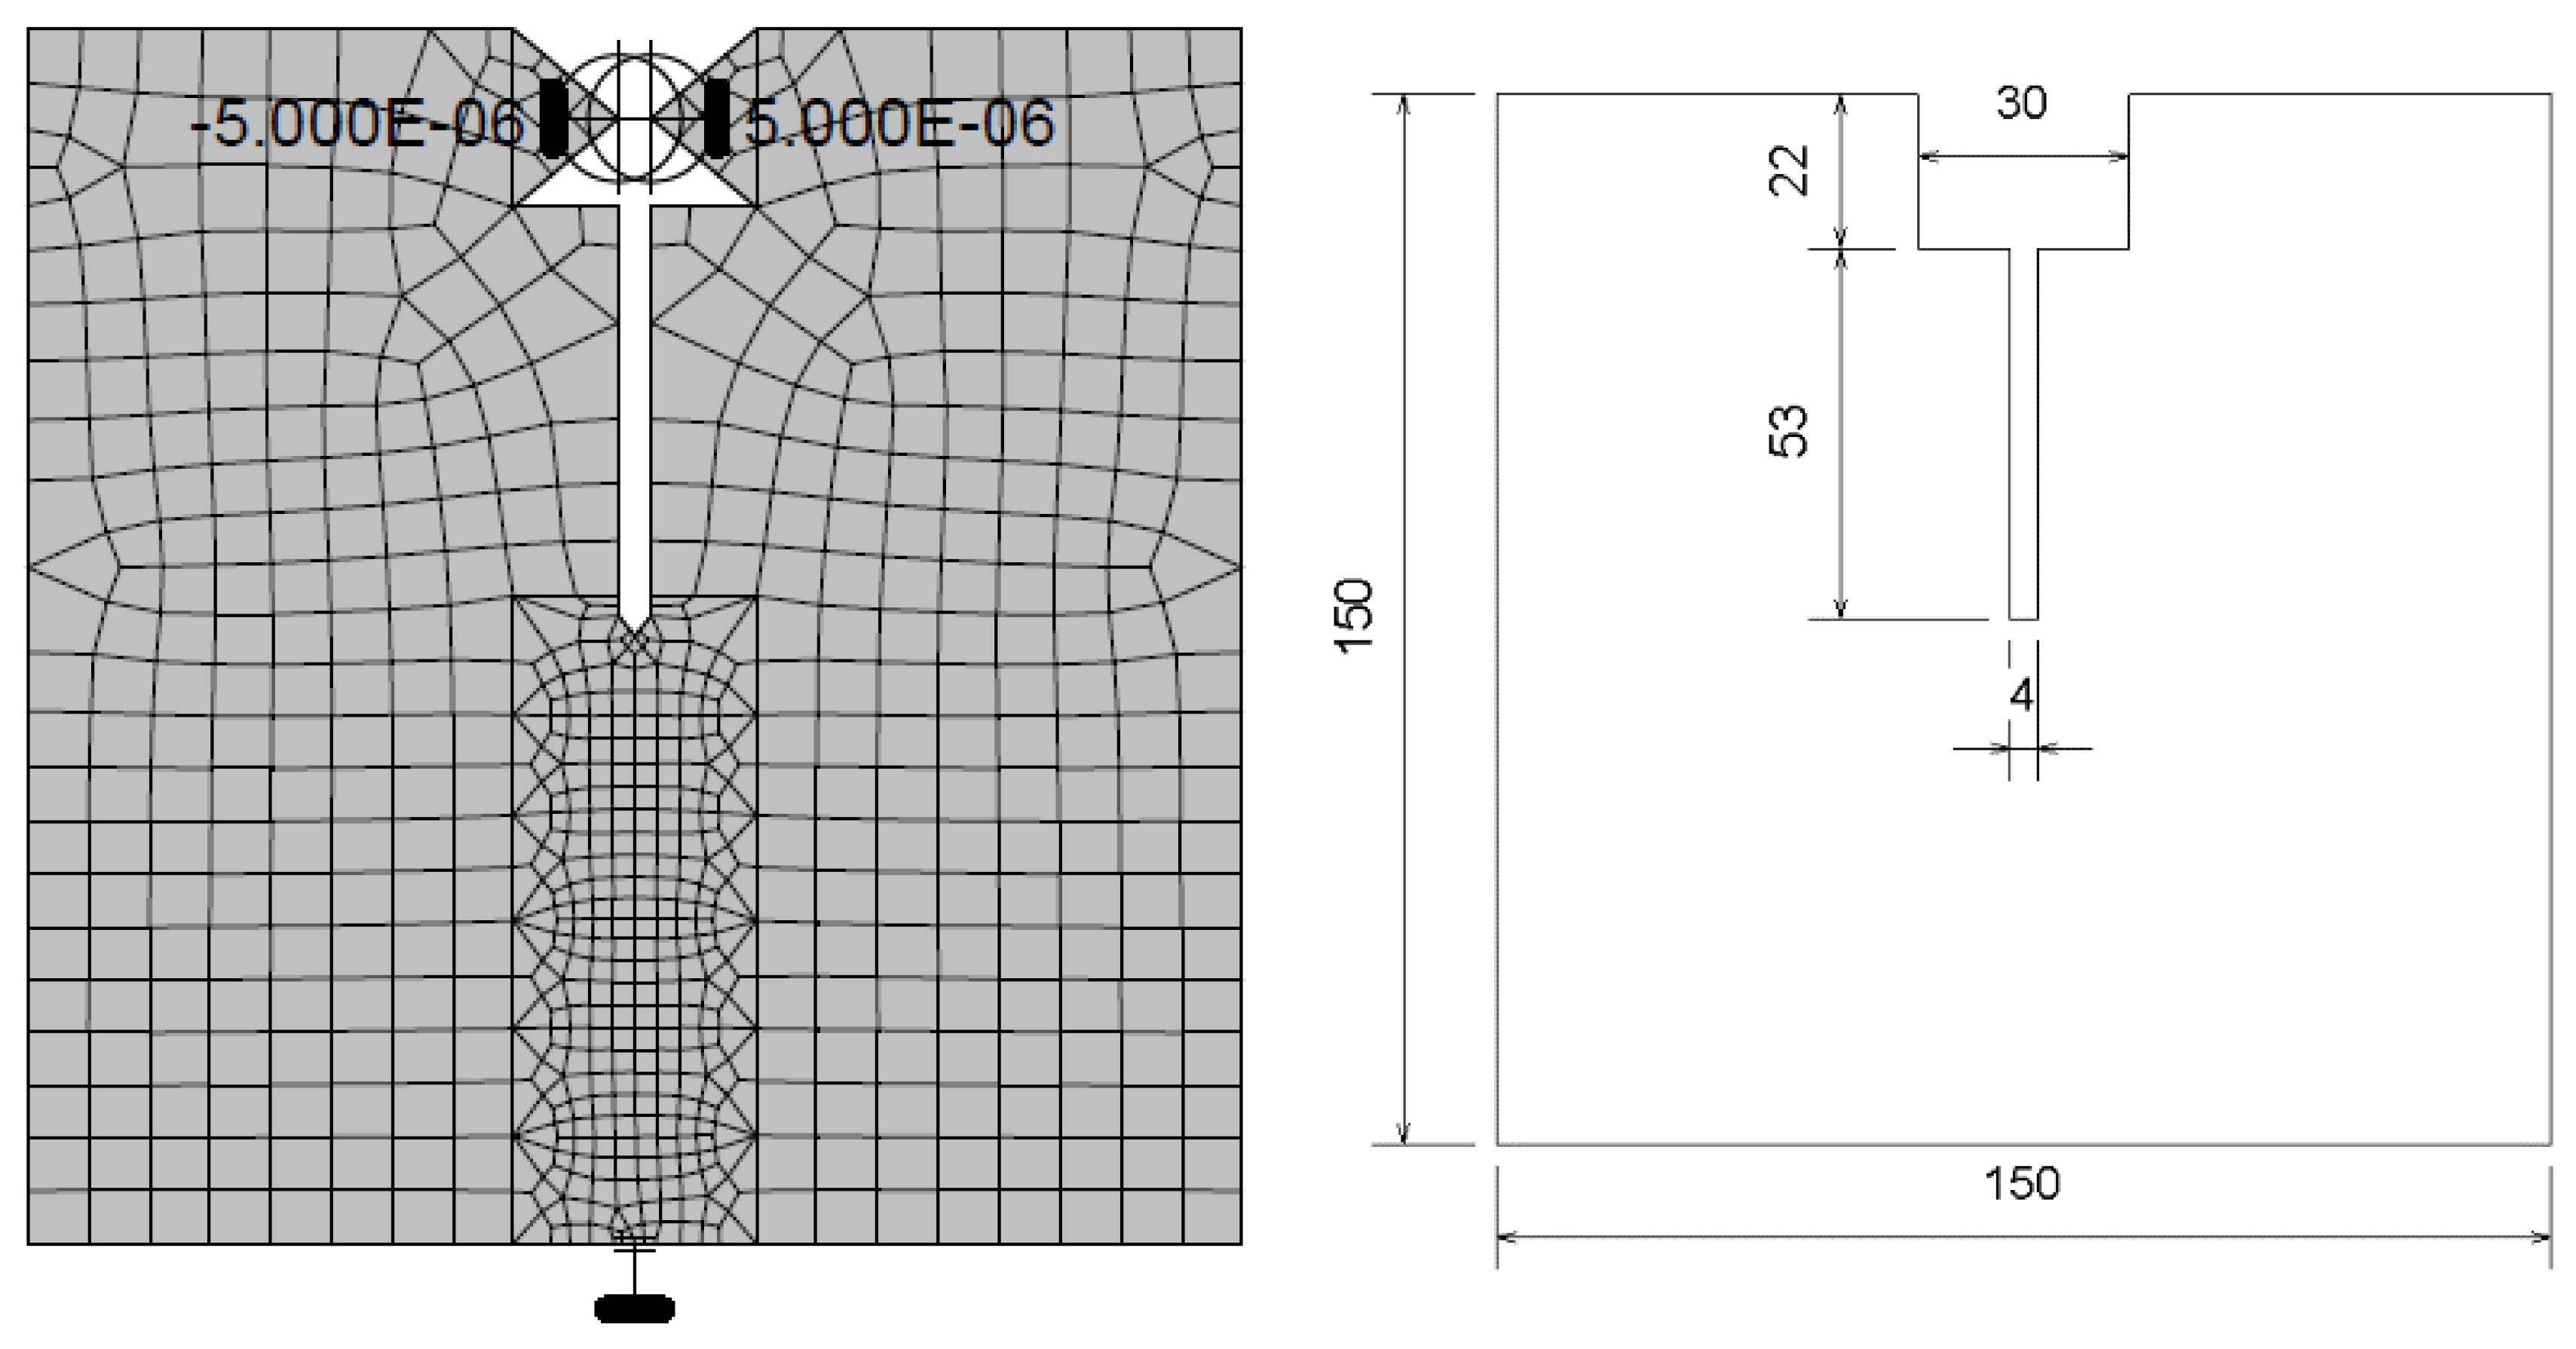
Four different concrete mixes with a slump of 80 mm have been used in this study. Table 1 summarizes the mix design for each mix and the target characteristic compressive strength at 28 days. The maximum size of coarse aggregate used was 14 mm and no supplementary cementitious materials were used. The concrete was poured into the molds with the application of vibration to ensure uniform compactness. Specimens were cured by covering with a damp cloth and a plastic sheet to replicate curing condition of slabs used for fastener testing. Further, specimens were cast and cured in an indoor environment around 20 °C. Demolding of the specimens started at 18 h after the pour and were covered immediately after. Surfaces of cylinders used to determine the compressive strength and modulus of elasticity were ground to provide a flat surface for uniform loading. Concrete cylinders used throughout the study were ϕ100 × 200 mm while the cubes used to determine fracture energy were 150 × 150 × 150 mm as shown in Figure 1. The 30-mm groove in the upper part of the specimen and the 4-mm crack starter notch were created by casting a steel plate with that profile inside the concrete cube and were removed during the demolding process.
For each concrete mix tested, a total of 21 concrete cubes and 63 cylinders were cast. These specimens were used to measure the compressive strength, tensile splitting strength, modulus of elasticity, Poisson’s ratio, and fracture energy at seven hydration ages (18 h, 30 h, 48 h, 72 h, 7 d, 14 d, and 28 d). Standard compression tests in accordance with AS1012.9 [6] were conducted to measure the development of the compressive strength with time. The splitting tensile strength was measured in accordance with AS1012.10 [7], while the modulus of elasticity was determined in accordance with AS1012.17 [8]. The test results presented in this paper are the average of three identical specimens tested.
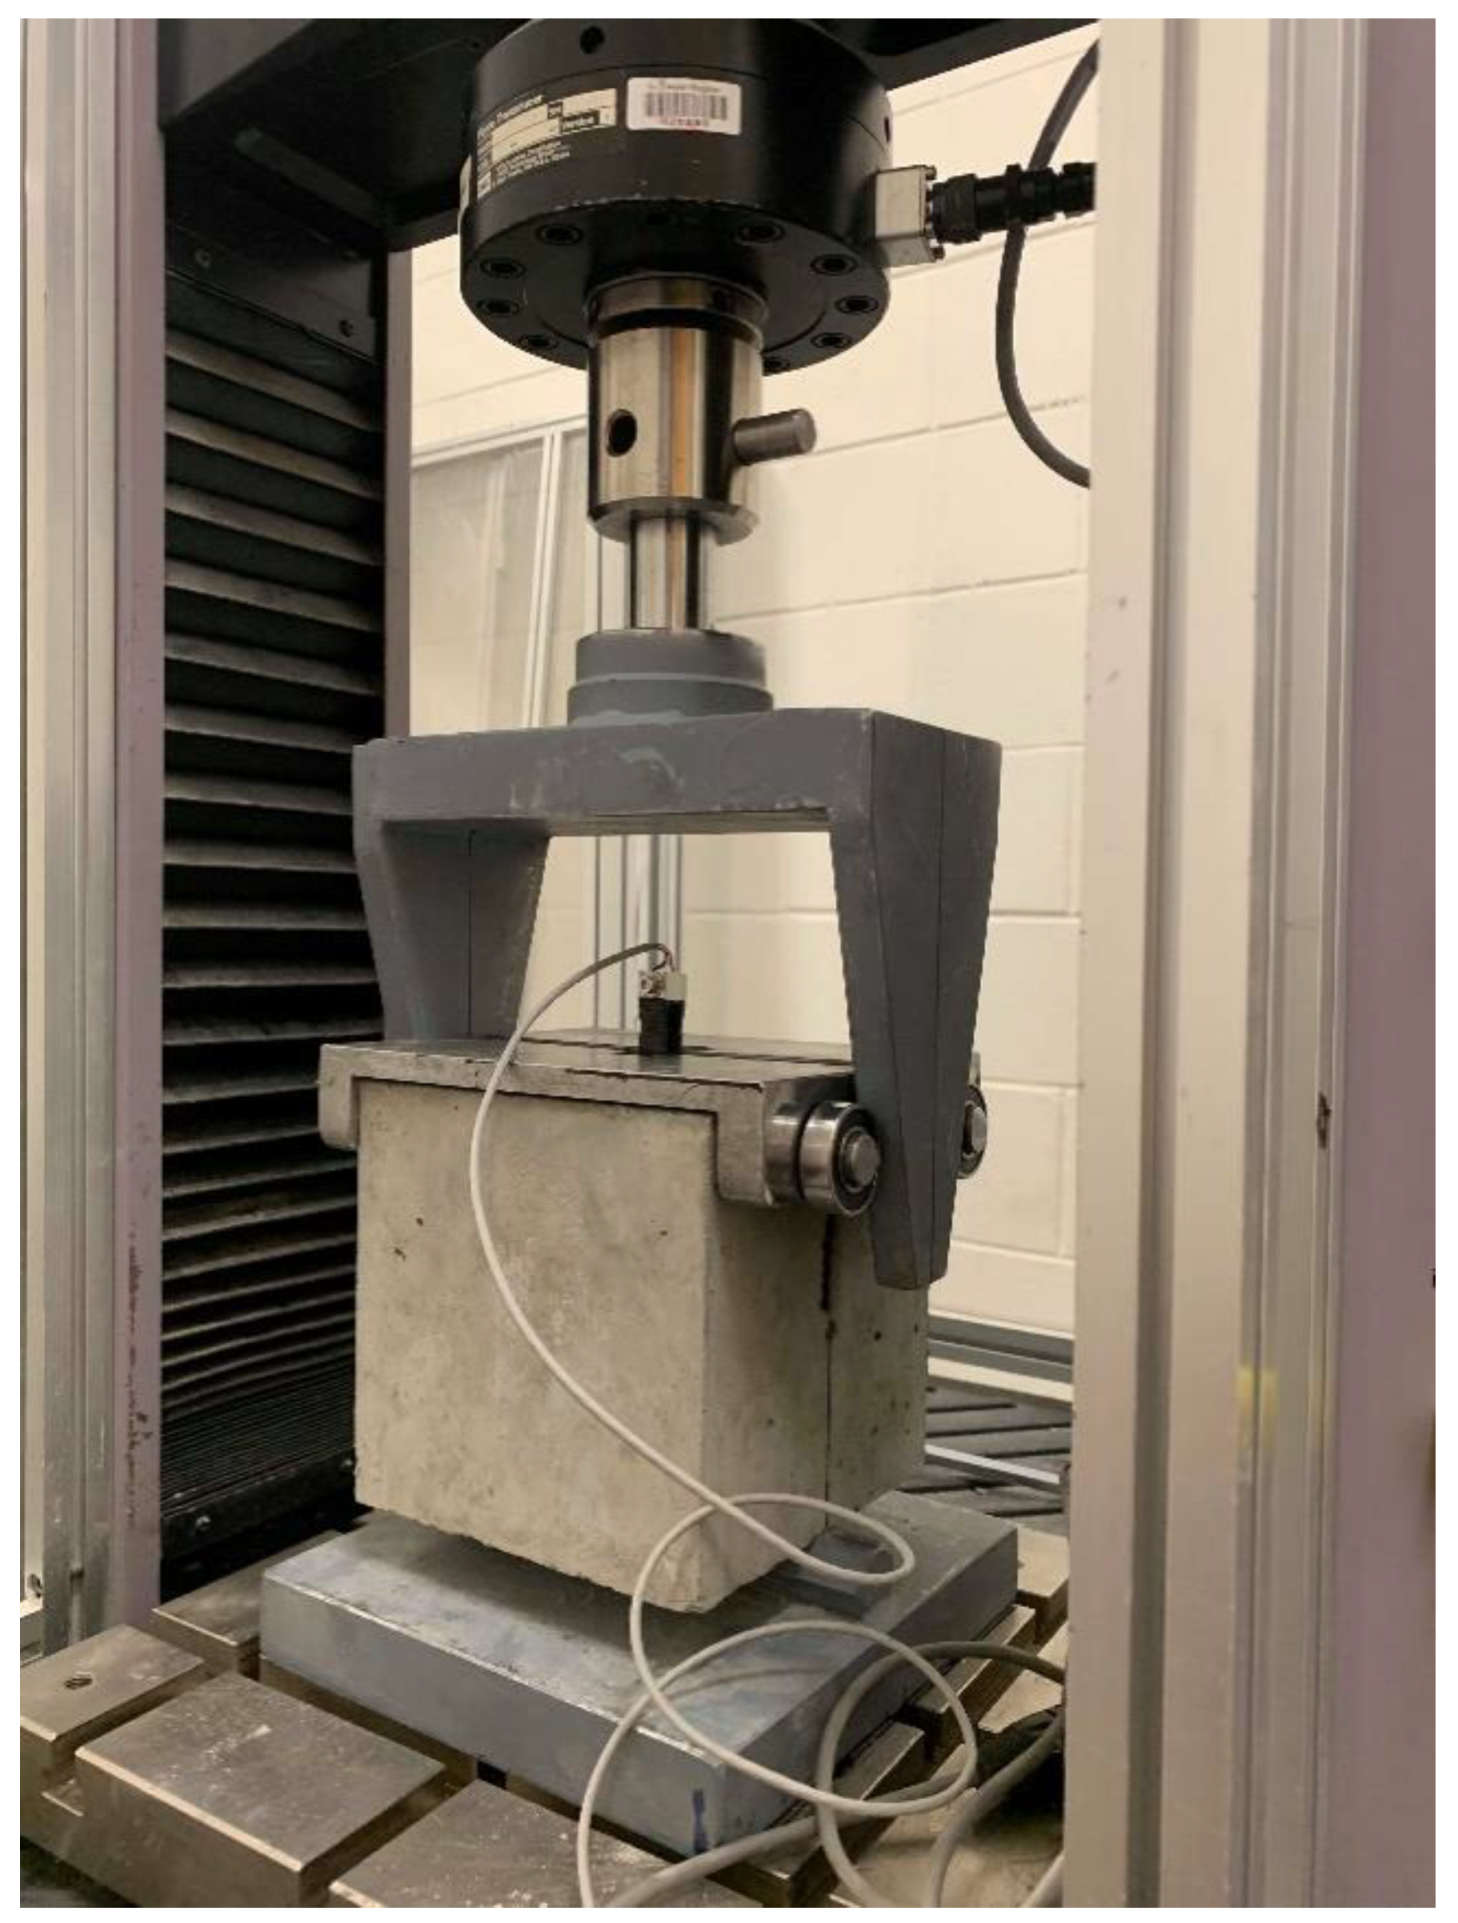
The wedge-splitting test was used to determine fracture energy of the concrete. This test requires splitting a cube with a groove and a notch in two halves while monitoring the crack mouth opening displacement (CMOD) and the splitting load. The setup of this test requires the specimen to be rested on a line support which is connected to the base of the testing machine. While two loading plates with roller bearings are placed on top of the specimen. The load is applied by pushing a wedge profile in between the roller bearings.
This test method was originally introduced by [9] followed by [10], it is designed to measure fracture energy of the concrete by calculating the area under the splitting load vs. CMOD curve. Further, this test is very suitable for early age concrete since the effect of self-weight is negligible. Moreover, the specimen stores minimal elastic energy during the test [11]. The vertical load and the crack opening displacement are monitored and recorded during the test. Crack opening is usually measured using a clip-on gage that is mounted at the center of the specimen as shown in Figure 2. Loading with constant rate of displacement is considered satisfactory, since the test is stable.
The force recorded in this test is a vertical force, this can be converted to the horizontal splitting force using Equation (3)
where, Fsp, Fv are the splitting load and the vertical load respectively.
Fsp = Fv/(2·tanα)(1 − μ·tanα)/(1 + μ.cotα) ≈ 1.866 Fv
α is the wedge angle (15 degrees).
μ is the coefficient of friction of the roller bearing.
The friction coefficient varies between 0.1 and 0.5, and its effect on the splitting force can be in the range of (0.4–1.9)%. Therefore, it is usually neglected and Equation (3) can be reduced to 1.866 Fv [12]. The area under the Fsp vs. CMOD curve represents the work of fracture, and fracture energy can be calculated by dividing this area by the ligament length x specimen depth.
3. Results
Results of the tests conducted are summarized in Table 2, Table 3, Table 4 and Table 5. Values in the tables are averages of the three identical specimens tested. However, for the wedge-splitting test, some of the samples suffered premature cracking and were not suitable for testing, hence the COV in such instances is not reported in the table.
4. Discussion
4.1. Compressive Strength Development with Time
Compressive strength is the main parameter that has been used historically to characterize concrete strength for design purposes. This is mainly due to ease of testing of this property. Therefore, this parameter has been widely investigated, especially for pure cement concretes. Several strength development models were found in literature that can be used to estimate the compressive strength at any age from the 28-days strength. In this section the accuracy of these models in predicting the compressive strength at early ages is assessed. The main two models that were identified in literature are the ACI [13] (Equation (4)) and fib [14] (Equations (5) and (6)) models.
where, (fc)t is the compressive strength at time t in days.
(fc)t = t/(4 + 0.85t) (f’c)28
(fc)t = βcc (t) (f’c)28
βcc (t) = exp{0.25[1 − (28/t)(1/2)]}
(f’c)28 is the compressive strength at 28 days.
βcc (t) is the strength development factor.
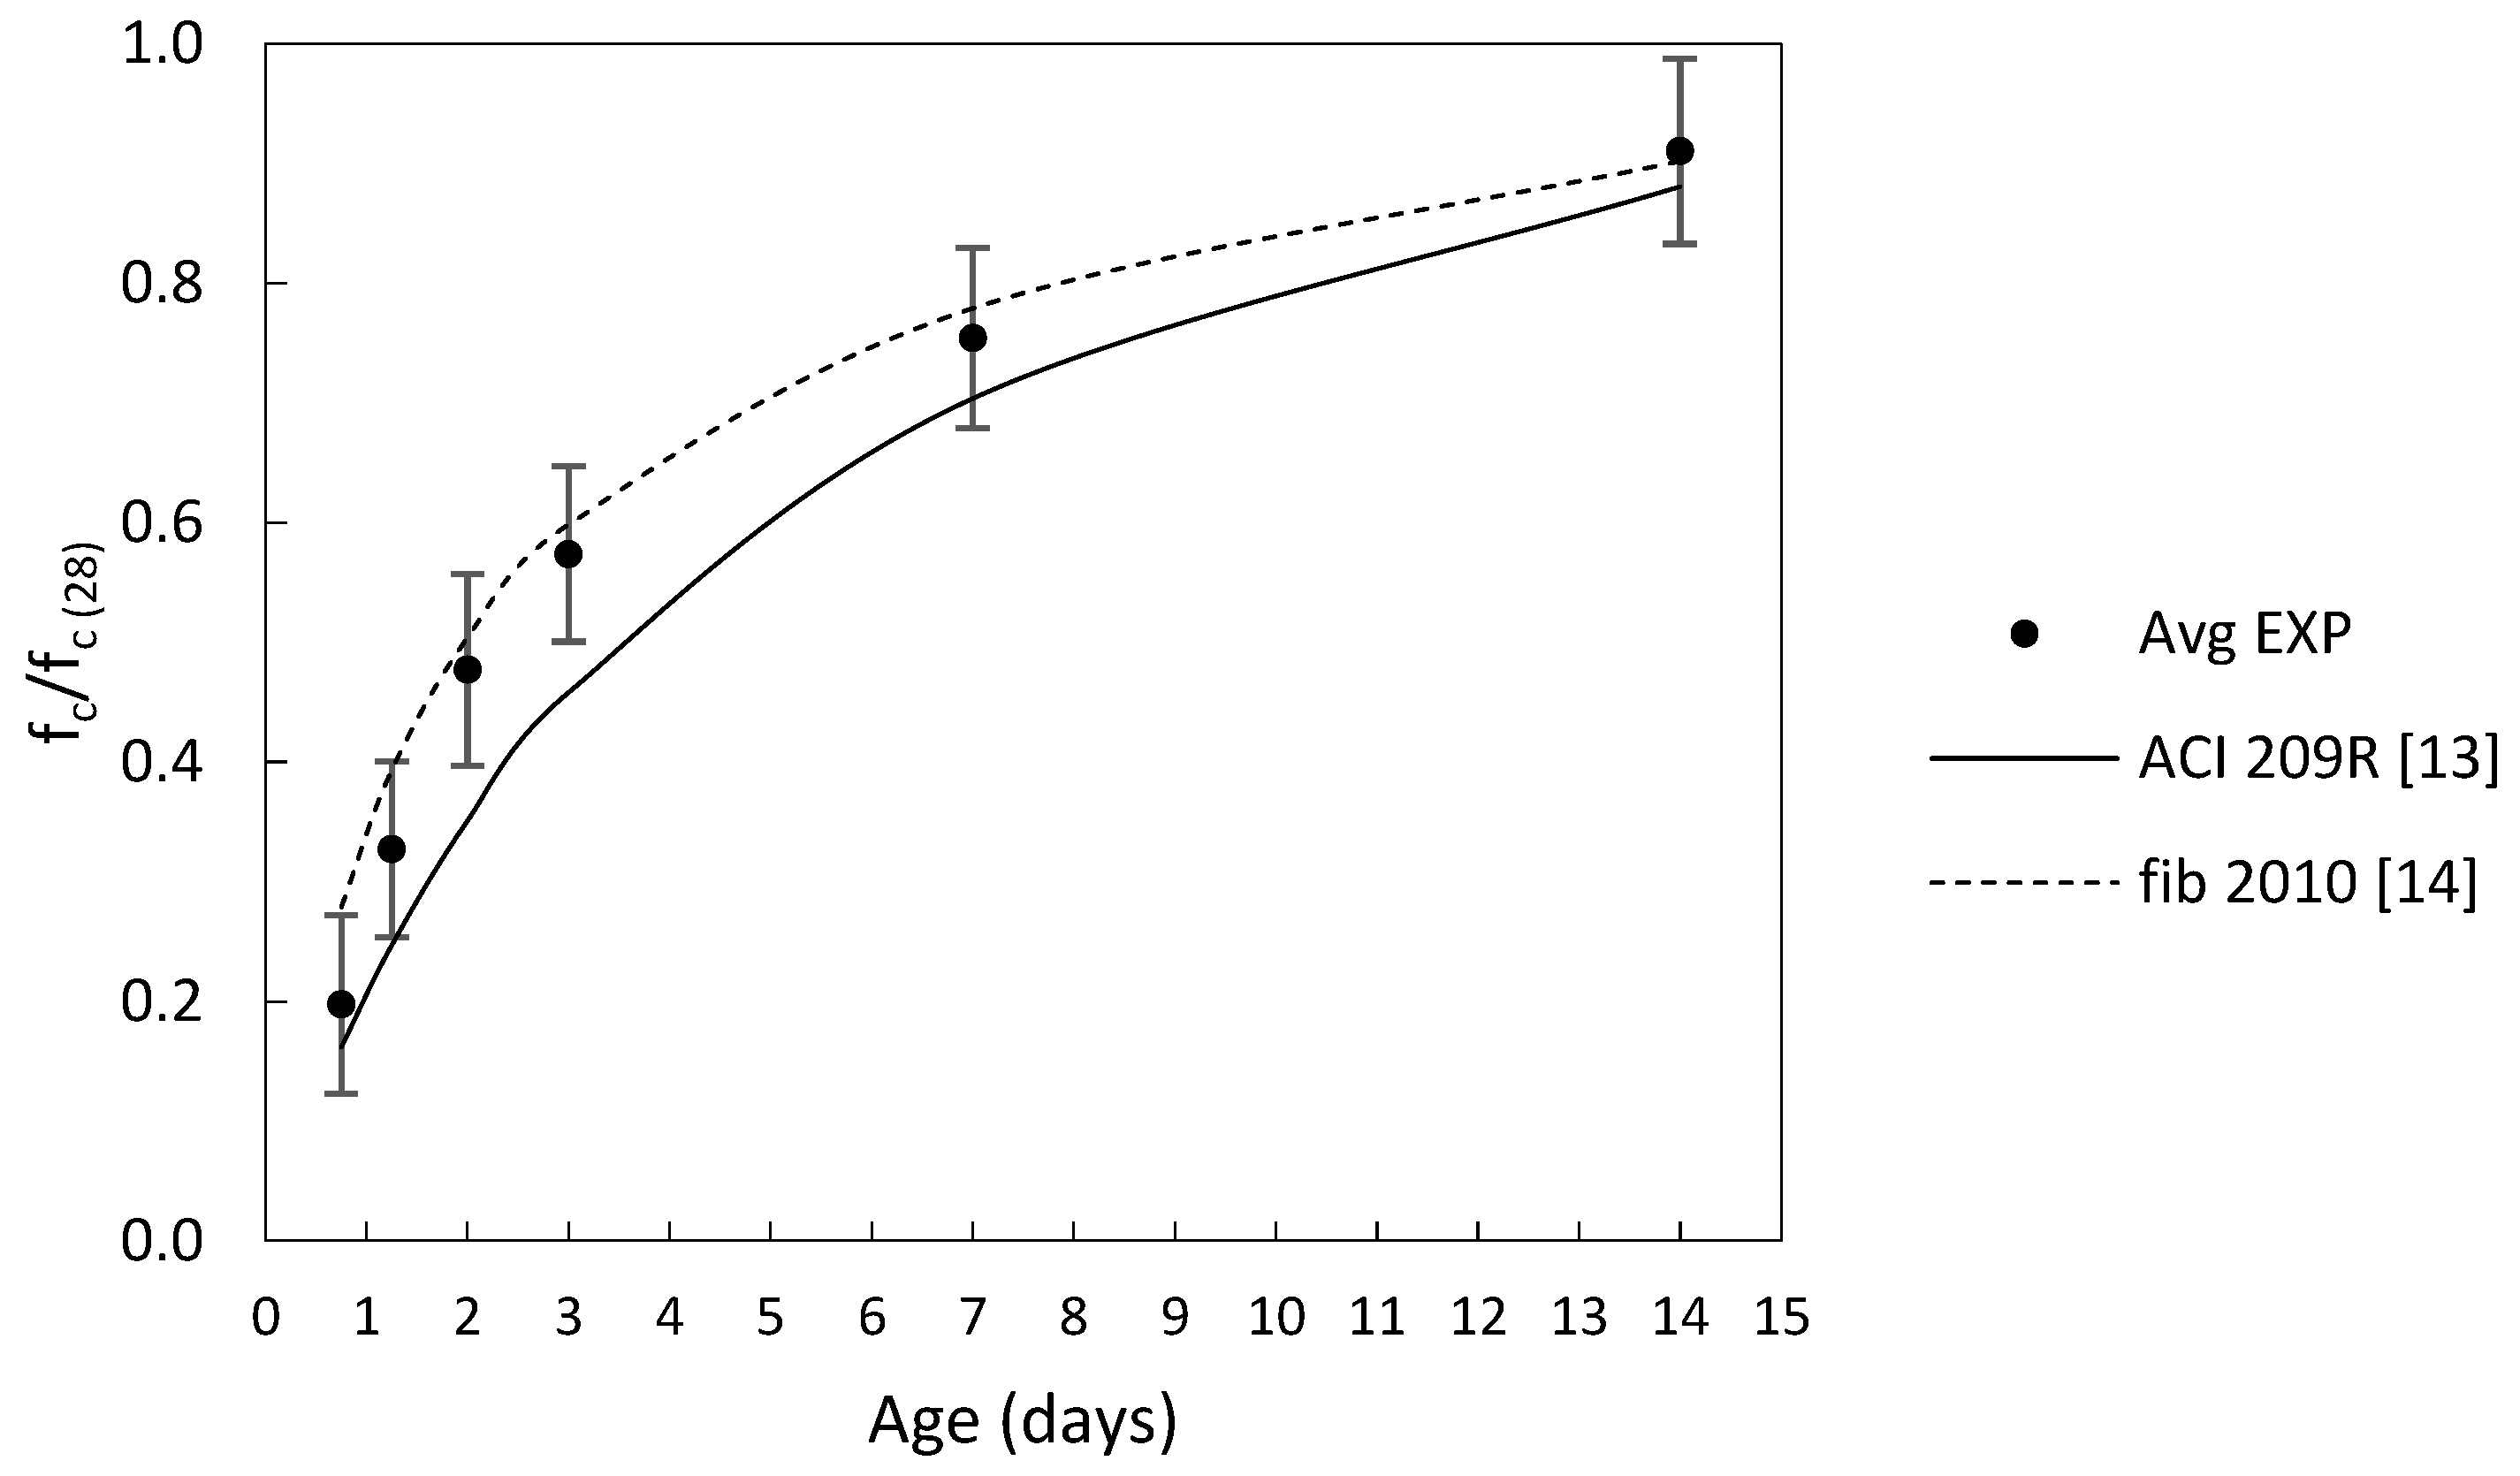
Figure 3 shows the ratio of concrete strength at age (t) relative to the 28-days compressive strength. In this figure the estimation curves for the ACI and fib models are drawn for comparison with experimental data. Both models appear to be able to capture the compressive strength development with reasonable accuracy. However, the fib model provides a more accurate estimation at almost all ages, while the ACI model slightly underestimates the strength. Nevertheless, the development of compressive strength at early ages is highly dependent on curing conditions and the above models should only be used for estimating the strength at early stages for logistic purposes, but loading of fasteners should only take place after testing the compressive strength.
4.2. Modulus of Elasticity
Modulus of elasticity in this study was determined on concrete cylinders 100 mm × 200 mm and was taken as the average of three specimens. Three accompanying cylinders were tested in compression to determine the average ultimate load, and then the test for modulus of elasticity was conducted by loading to 40% of the average ultimate load. The load was applied in three cycles and the modulus of elasticity was taken as the average of the second and third cycles for each specimen. Modulus of elasticity was taken as the chord modulus, which is the slope of a line drawn between the two points on the stress–strain curve. The first point is the vertical projection of 50 µm/m strain, and the second point corresponds to 40% of the compressive strength of the concrete as described in AS1012.17 [8].
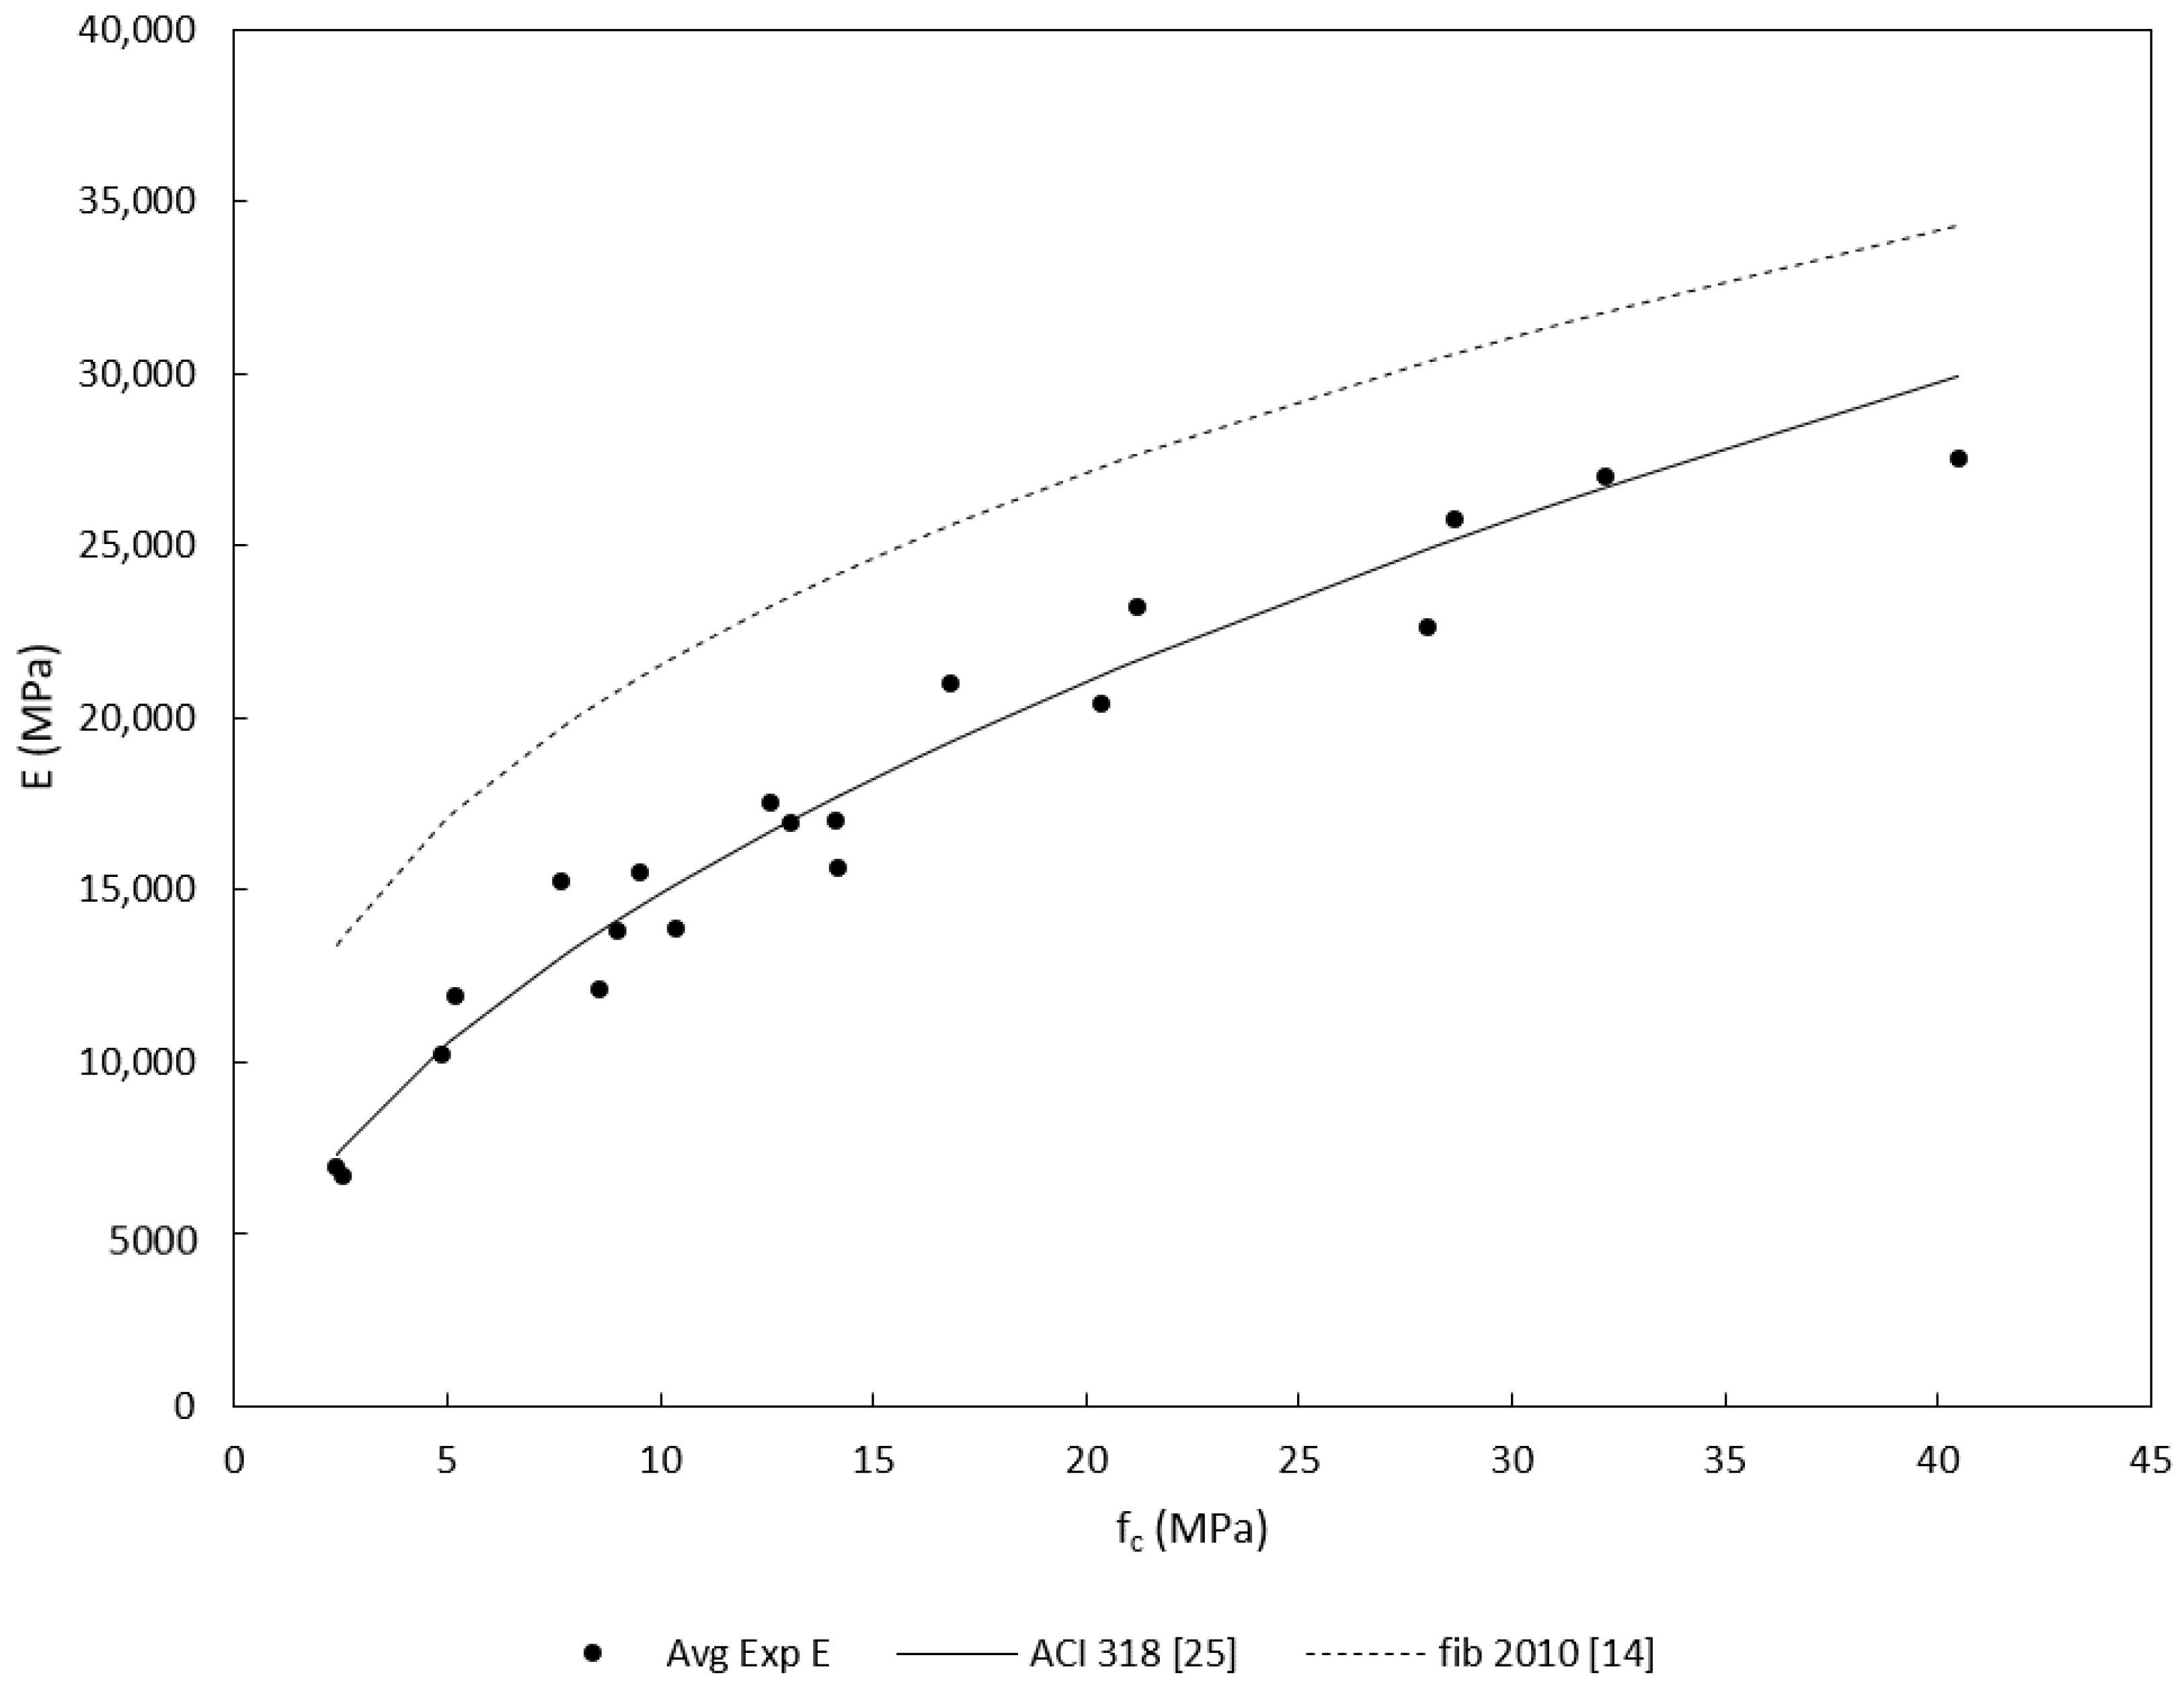
Modulus of elasticity used in concrete design is usually calculated from models that take into account the effect of concrete strength and density [15]. ACI building code 318-14 and the Australian concrete code [5] give Equation (7) to calculate the modulus of elasticity. Further, fib [14] allows using Equation (8) to estimate the modulus of elasticity for known compressive strengths. However, fib model is designed to estimate the modulus of elasticity of mature concrete (>28 days), while the ACI/AS model can be used to find the modulus of elasticity by knowing the average compressive strength. Further, AS3600/ACI318 allows a tolerance of ±20% from the predicted mean using Equation (7). Fib model states that a correction factor in the range of (0.7–1.2) applies to Equation (8), to take into account the effect of aggregates type. Figure 4 shows prediction using Equations (7) and (8) against the experimentally obtained modulus of elasticity values for specimens tested within 7 days. From the figure, the ACI/AS model appears to be able to capture the development of the modulus of elasticity with strength very accurately. This shows that the correlation between the two properties is irrelevant of age and the power of 0.5 is more suitable for the correlation between the compressive strength and the modulus of elasticity. This is in line with the conclusions drawn in [16] that the ACI code formula for the modulus of elasticity is valid from a hydration age of 12 h.
where, wc is the concrete density in kg/m3, and fc is the compressive strength.
Ec = wc1.5 × 0.043√(fc)
Ec = 2.15 × 10⁴ (fc/10)(1/3)
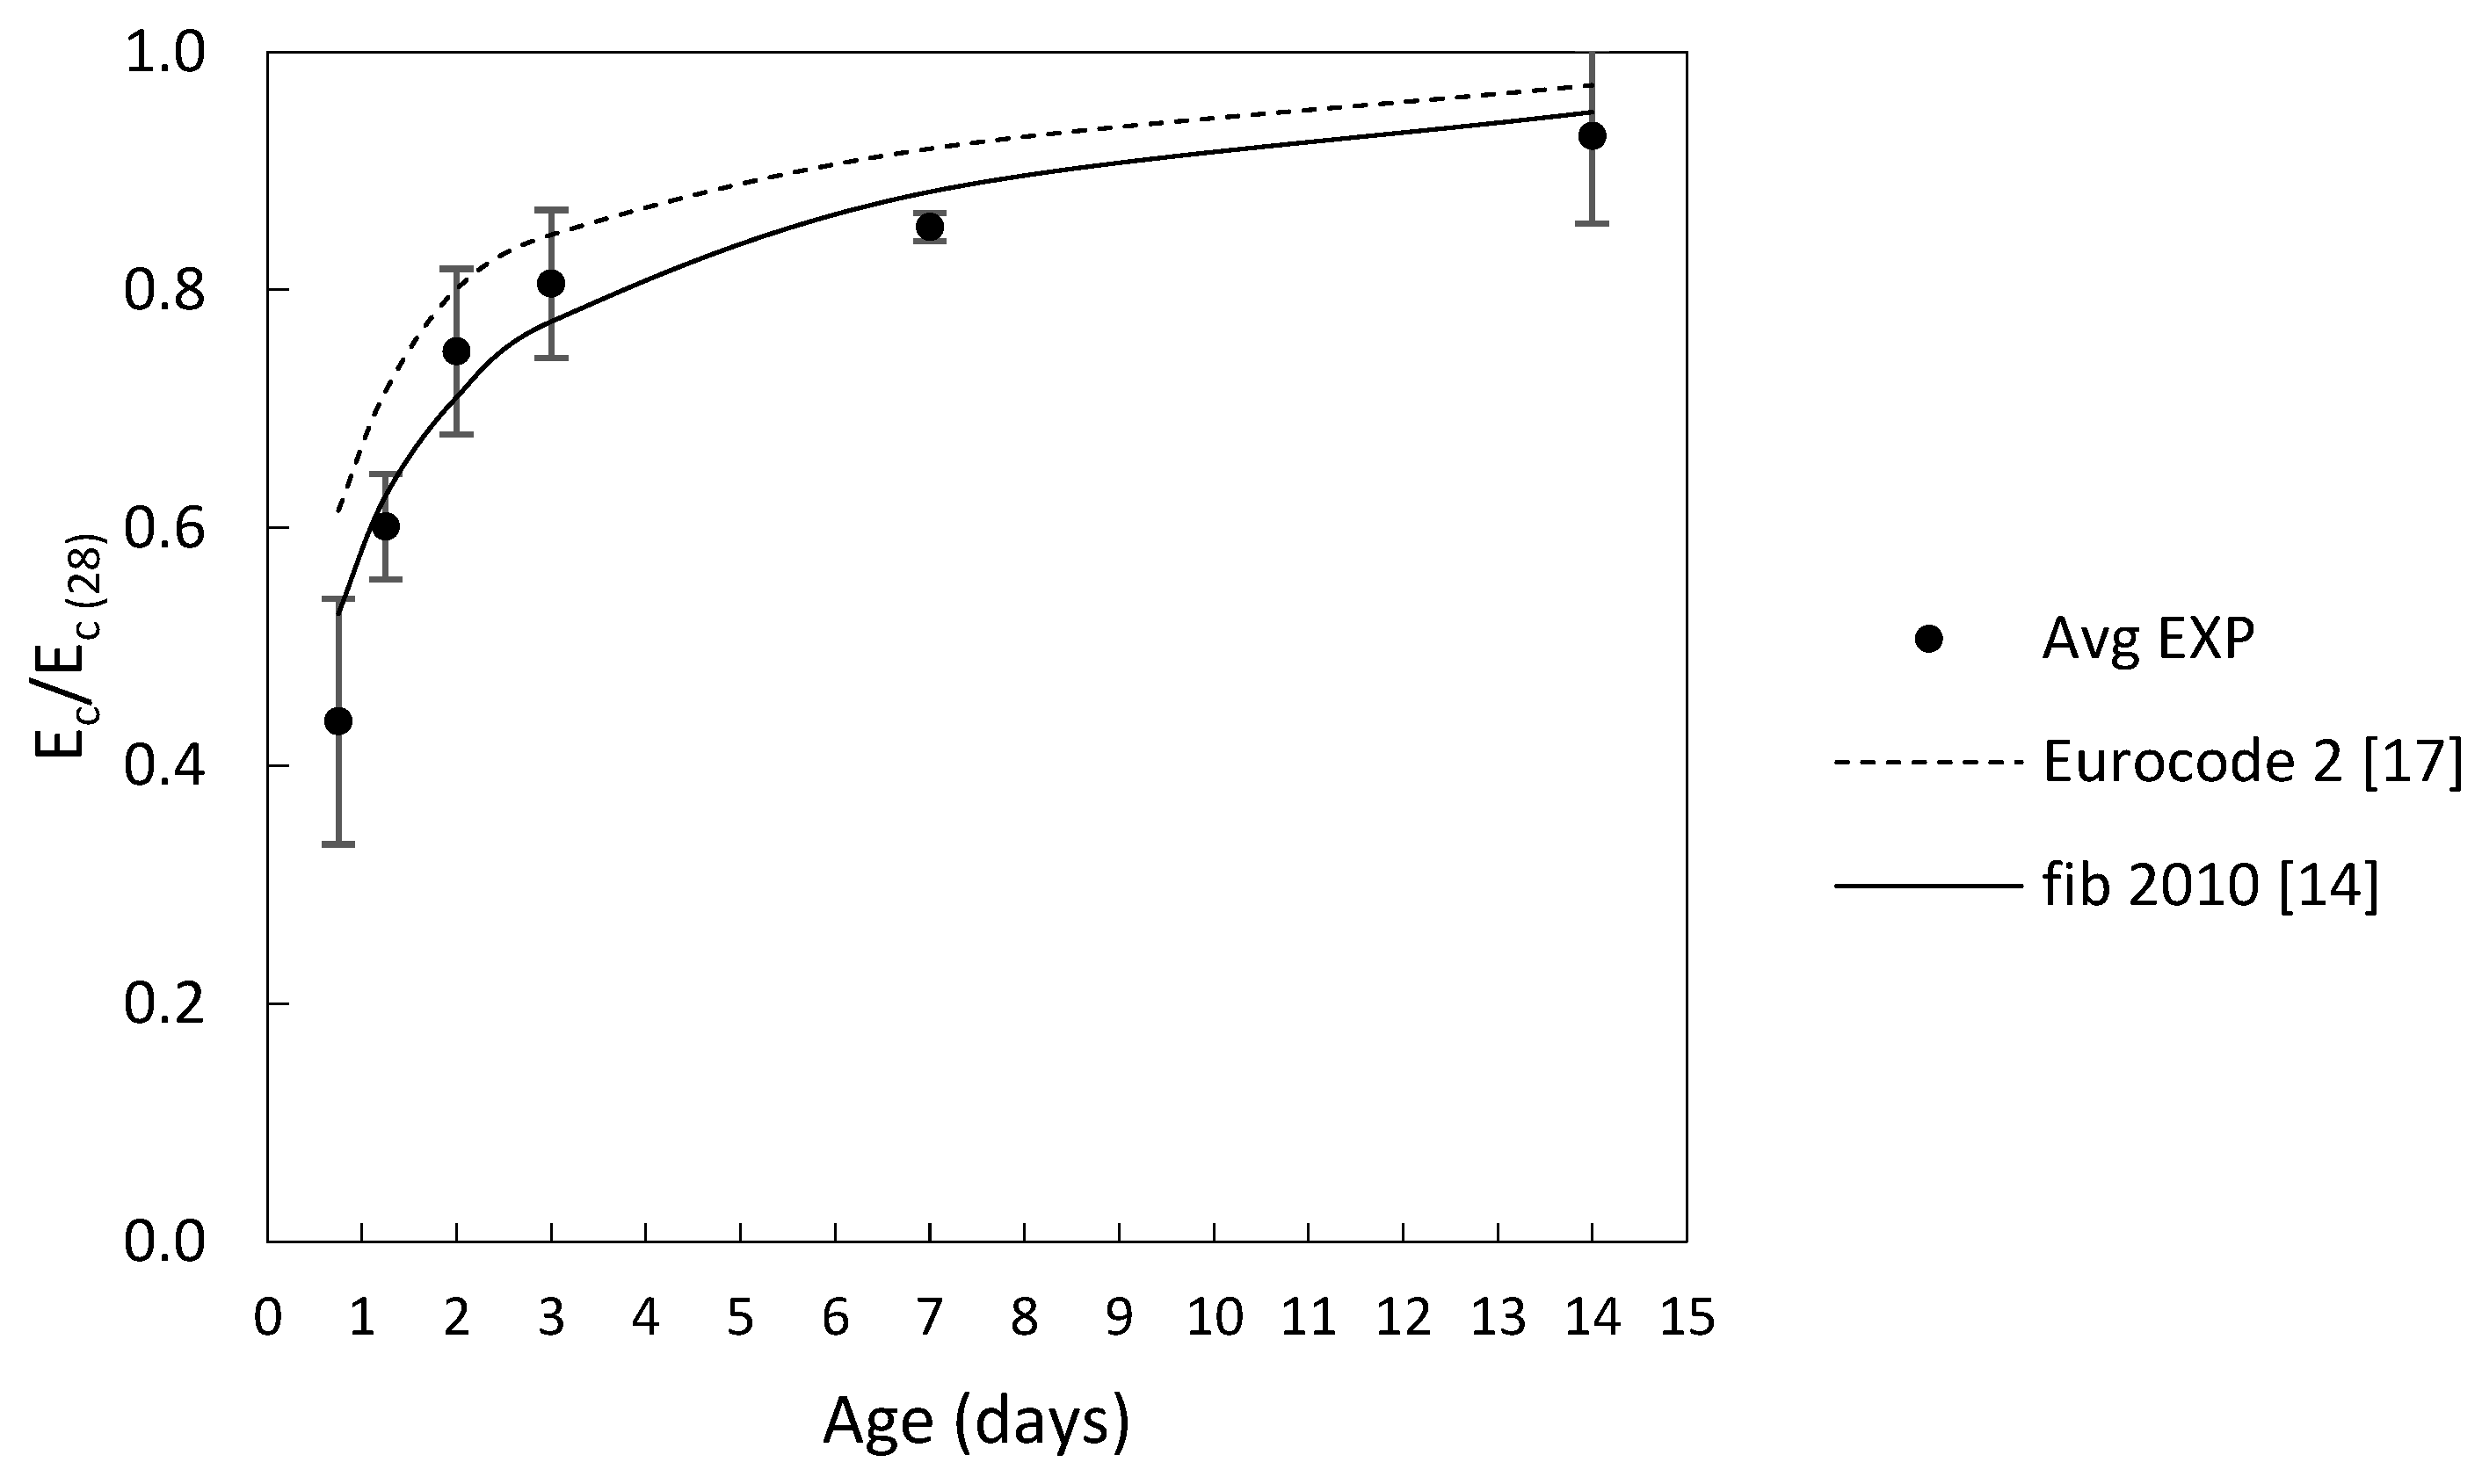
The development of concrete modulus of elasticity with time has been investigated in literature and two main models shown in Table 6 were assessed in this study. Figure 5 shows how the prediction of these two models compare with the average of the four mixes tested in this study. From Figure 5, both models appear to overestimate the development especially at ages below 48 h. After 3 days the fib model starts to match the experimental results with reasonable accuracy.
4.3. Tensile Strength
Two methods were adopted in this study to evaluate the tensile strength of the concrete. The first method was by carrying out the Brazilian split cylinder test on 100 × 200 mm cylinders, while the second was by doing an inverse analysis on the wedge split test results in accordance with the method developed by [11]. In the second method, a cracked hinge model was used as a solution for the wedge-splitting test, and this solution was used for the purpose of inverse analysis to obtain fracture mechanics properties of concrete. Because of its feasibility and simplicity, this approach has been widely used to analyze the wedge split test as can be seen in the work of [18,19,20,21,22]. Detailed formulation of the method and the program used to run the analysis can be found in [11].
4.3.1. Splitting Tensile Strength
The Brazilian test is carried out by subjecting the concrete cylinder to two diametrically opposite axial lines of compression load. This compression load will generate tensile stress along the central part of the diameter, and compressive stress along the edge. The value of this tensile stress can be evaluated using Equation (13) [23]. Similar procedure is described in AS1012.10-2000 (R2014) for carrying out this test. Equation (13) calculates the tensile stress in the cylinder assuming that the load is applied as a perfect line load not taking into consideration the width of the loading strips. [24] developed an elastic solution that considers the load distribution by the loading strips. The solution is reproduced here as Equation (14) and has been used in this study to analyze the test results. Furthermore, the recommended specimen size for this test is the 150 × 300 mm cylinder. When using a smaller size specimen i.e., 100 × 200 mm it is expected that the splitting strength increase by a factor of about (5%) [22].
where, σten is the tensile stress.
σten = (2P)/(πLD)
σten = (2P)/(πLD) [1 − (b/D)2](3/2)
P is the vertical load applied.
L is the length of the specimen.
D is the diameter of the specimen.
b is the width of the bearing strip.
Splitting tensile strength can be predicted from the compressive strength of the concrete. There have been numerous studies that investigated this parameter in mature concrete, and consequently numerous prediction models have been derived. One common relation is a 0.5 power function [25]. Figure 6 compares the results obtained from this study, for specimens tested within 7 days, and other models identified in literature in Table 7. Results from this study are in agreement with [26] findings with regards to unsuitability of the square root function of fc as suggested in the ACI code. The square root function appears to overestimate the splitting tensile strength at early ages when the compressive strength is low and underestimate it for higher strengths. However, models with a power function between 0.7 and 0.8 provide an accurate estimate of the splitting tensile at early age. Furthermore, Figure 7 shows that the relationship between the compressive strength and the splitting tensile strength is not dependent on age, as the models proposed by [26,27] are capturing the development of the splitting tensile strength at all ages for the four concrete mixes tested.
4.3.2. Inverse Analysis of the Wedge-Splitting Test
Inverse analysis of the wedge-split test was conducted in accordance with the method of cracked hinge model developed by [11]. The aim of this analysis is to assess the ratio of the splitting tensile strength to the direct tensile strength. Values of the direct tensile strength are assumed to be the average values obtained from the inverse analysis of the wedge-splitting test. Because of the sensitivity of the wedge-splitting test at early ages, not all specimens were valid as some experienced premature cracking. However, based on results of ages where three specimens were available, the coefficient of variation of the tensile strength from the inverse analysis can be as high as 25%. This high variation coefficient is also a result of the variation in the load vs. crack mouth opening displacement obtained from the wedge-splitting test due to the non-homogeneous nature of the concrete. Summary of the inverse analysis is shown in Table 8 for the four mixes tested in this study.
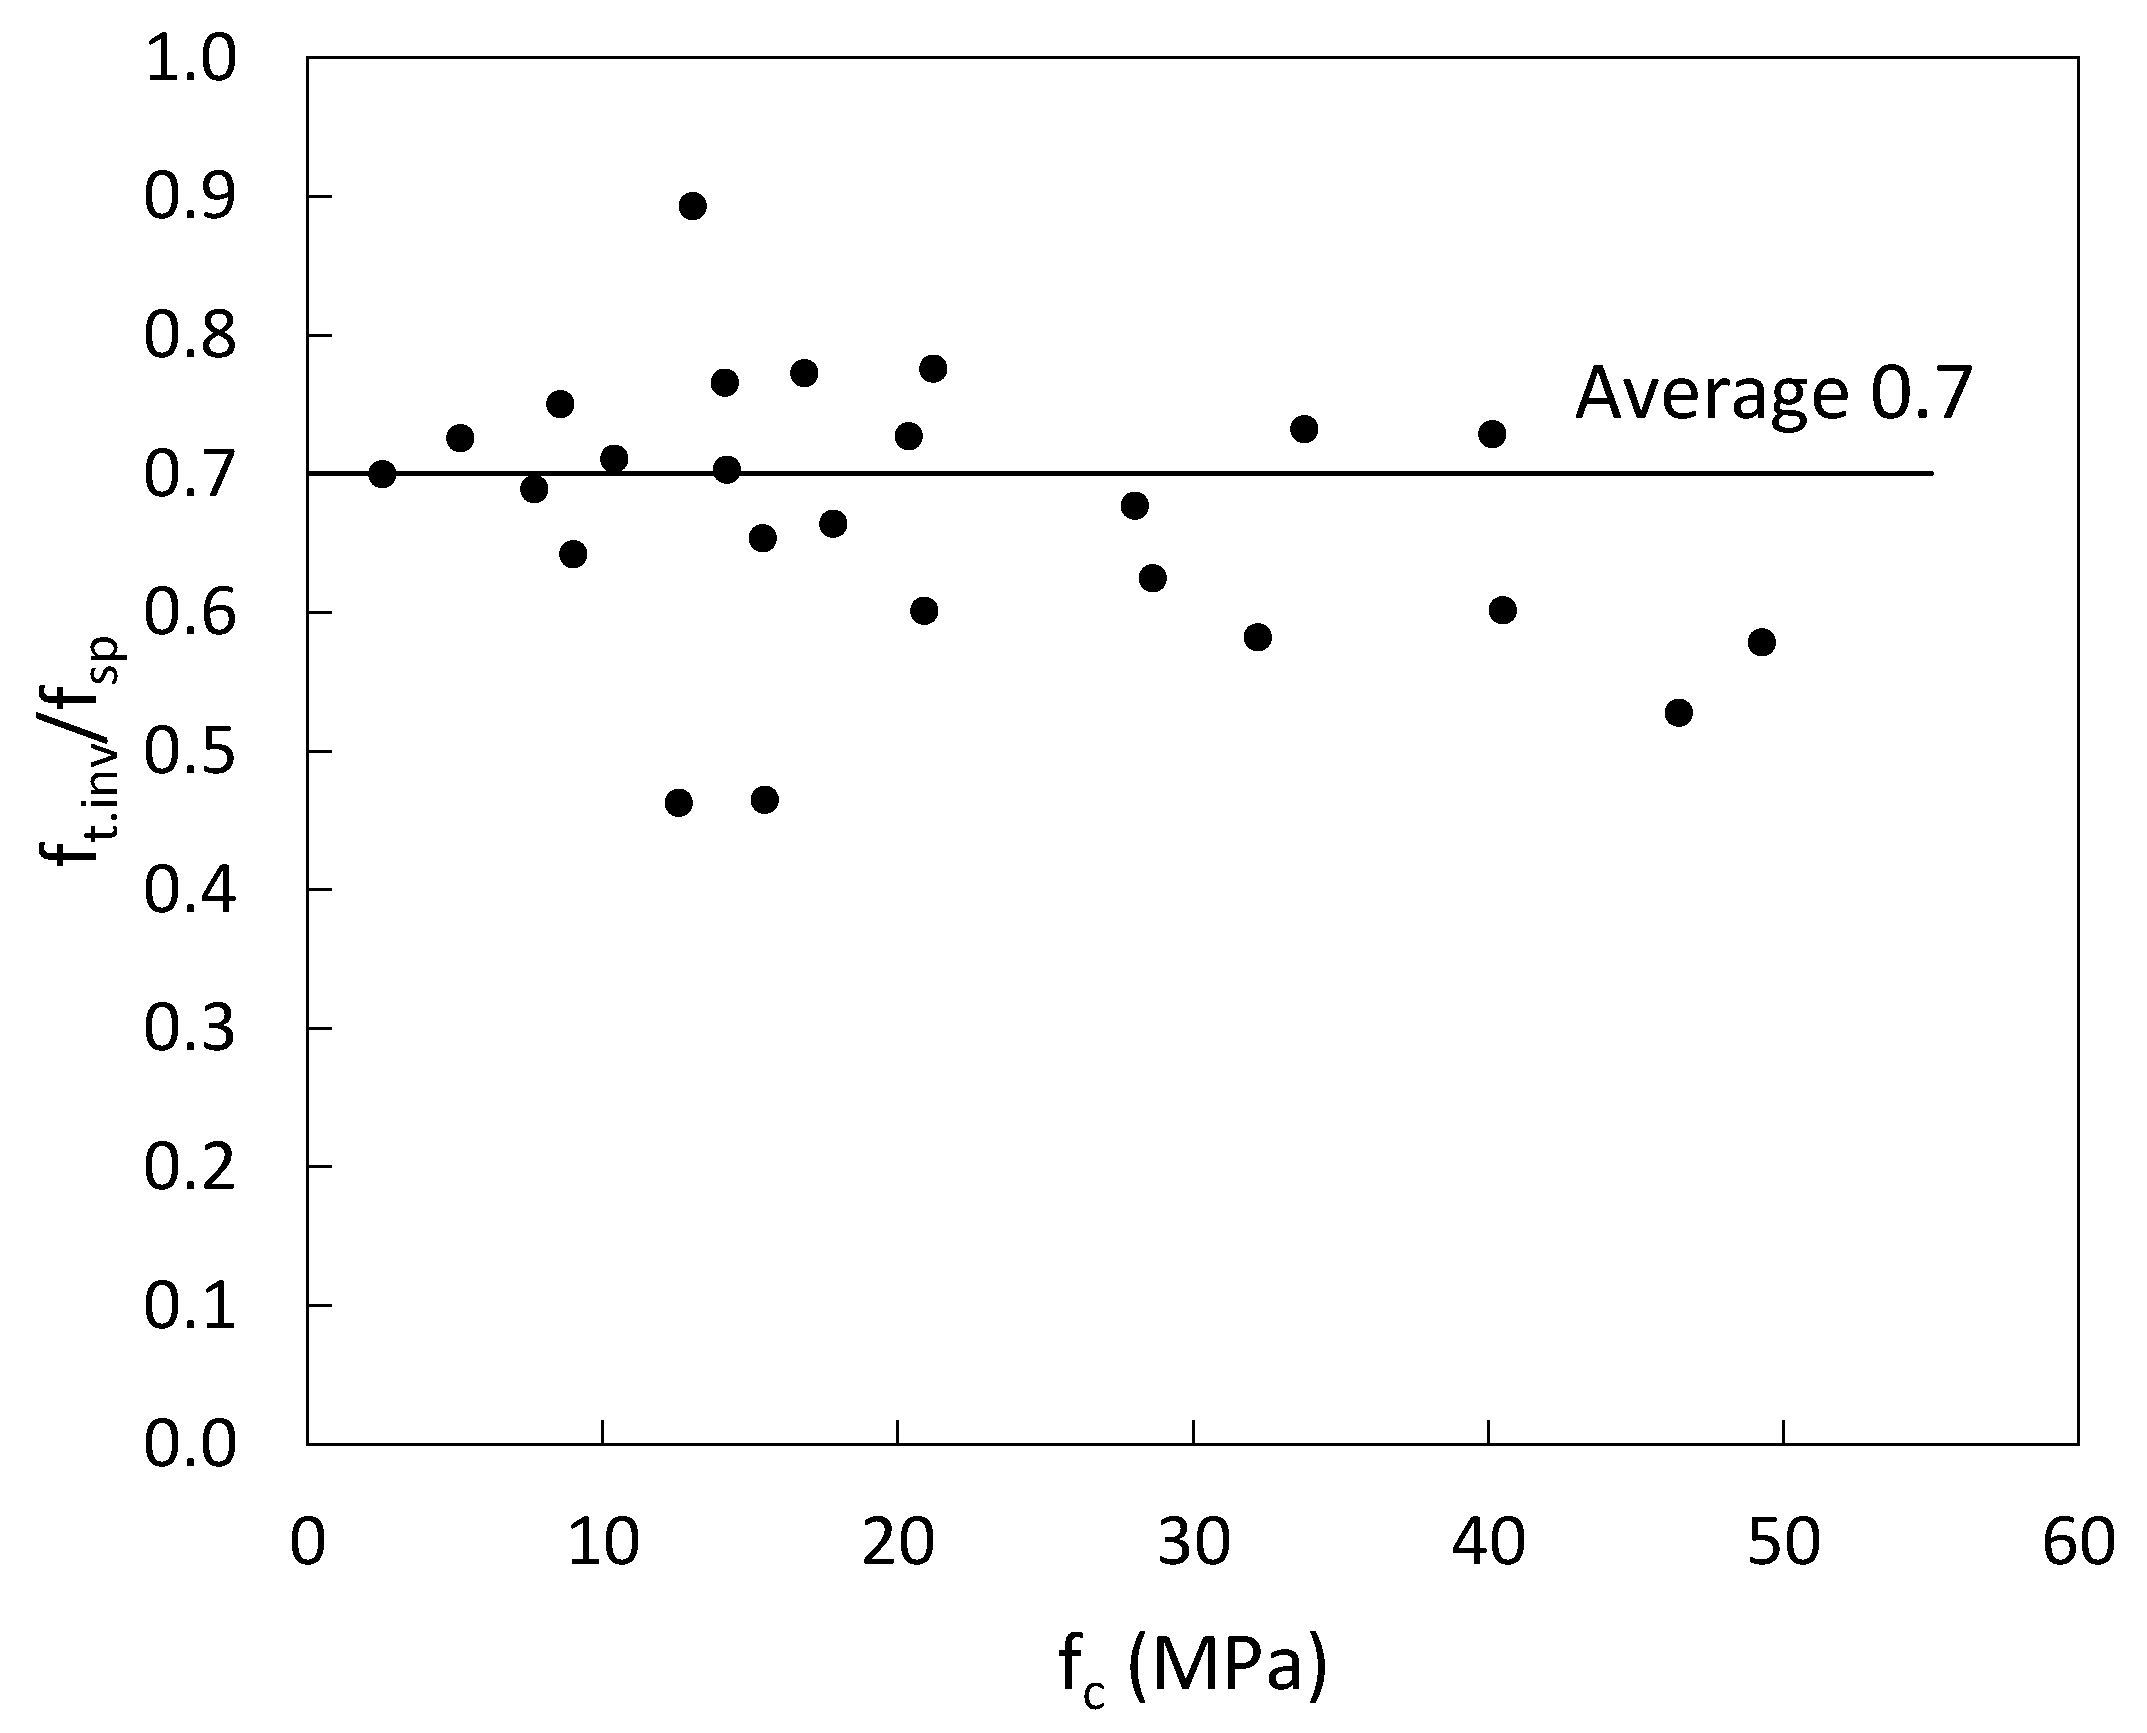
For brittle materials, the value of splitting tensile strength theoretically matches the value of direct tensile strength. However, concrete is a quasi-brittle material and the presence of loading strips affect the stress field leading to an overestimation of the tensile strength. The tensile strength is overestimated because of the crushing failure under the loading strips associated with the diametrical crack initiation. The overestimation of the tensile strength for normal strength concrete ranges from 0.6–0.9 [11,32]. Most design codes propose the correction factor of 0.9, which is toward the high end of the range reported in literature. A comparison is made between values of the splitting tensile strength and the tensile strength obtained from the inverse analysis as shown in Table 8. From this table, the ratio between the tensile strength obtained from the inverse analysis and the splitting tensile strength obtained from the Brazilian test, can be between 0.4 and 1.2. However, the ratio of 1.2 occurred for a specimen with extremely low compressive strength, 2.4 MPa and the 0.4 is for a single specimen wedge split test result where the other two were invalid. If these values are removed the range reduces to 0.5–0.9. This range is in agreement with the range reported in [11,32]. The average ratio obtained in this study was 0.7 as shown in Figure 8. Furthermore, results indicate that the ratio is independent of concrete compressive strength and age. The average ratio of 0.7 fits the data for the range of compressive strengths tested in the study.
4.4. Fracture Energy
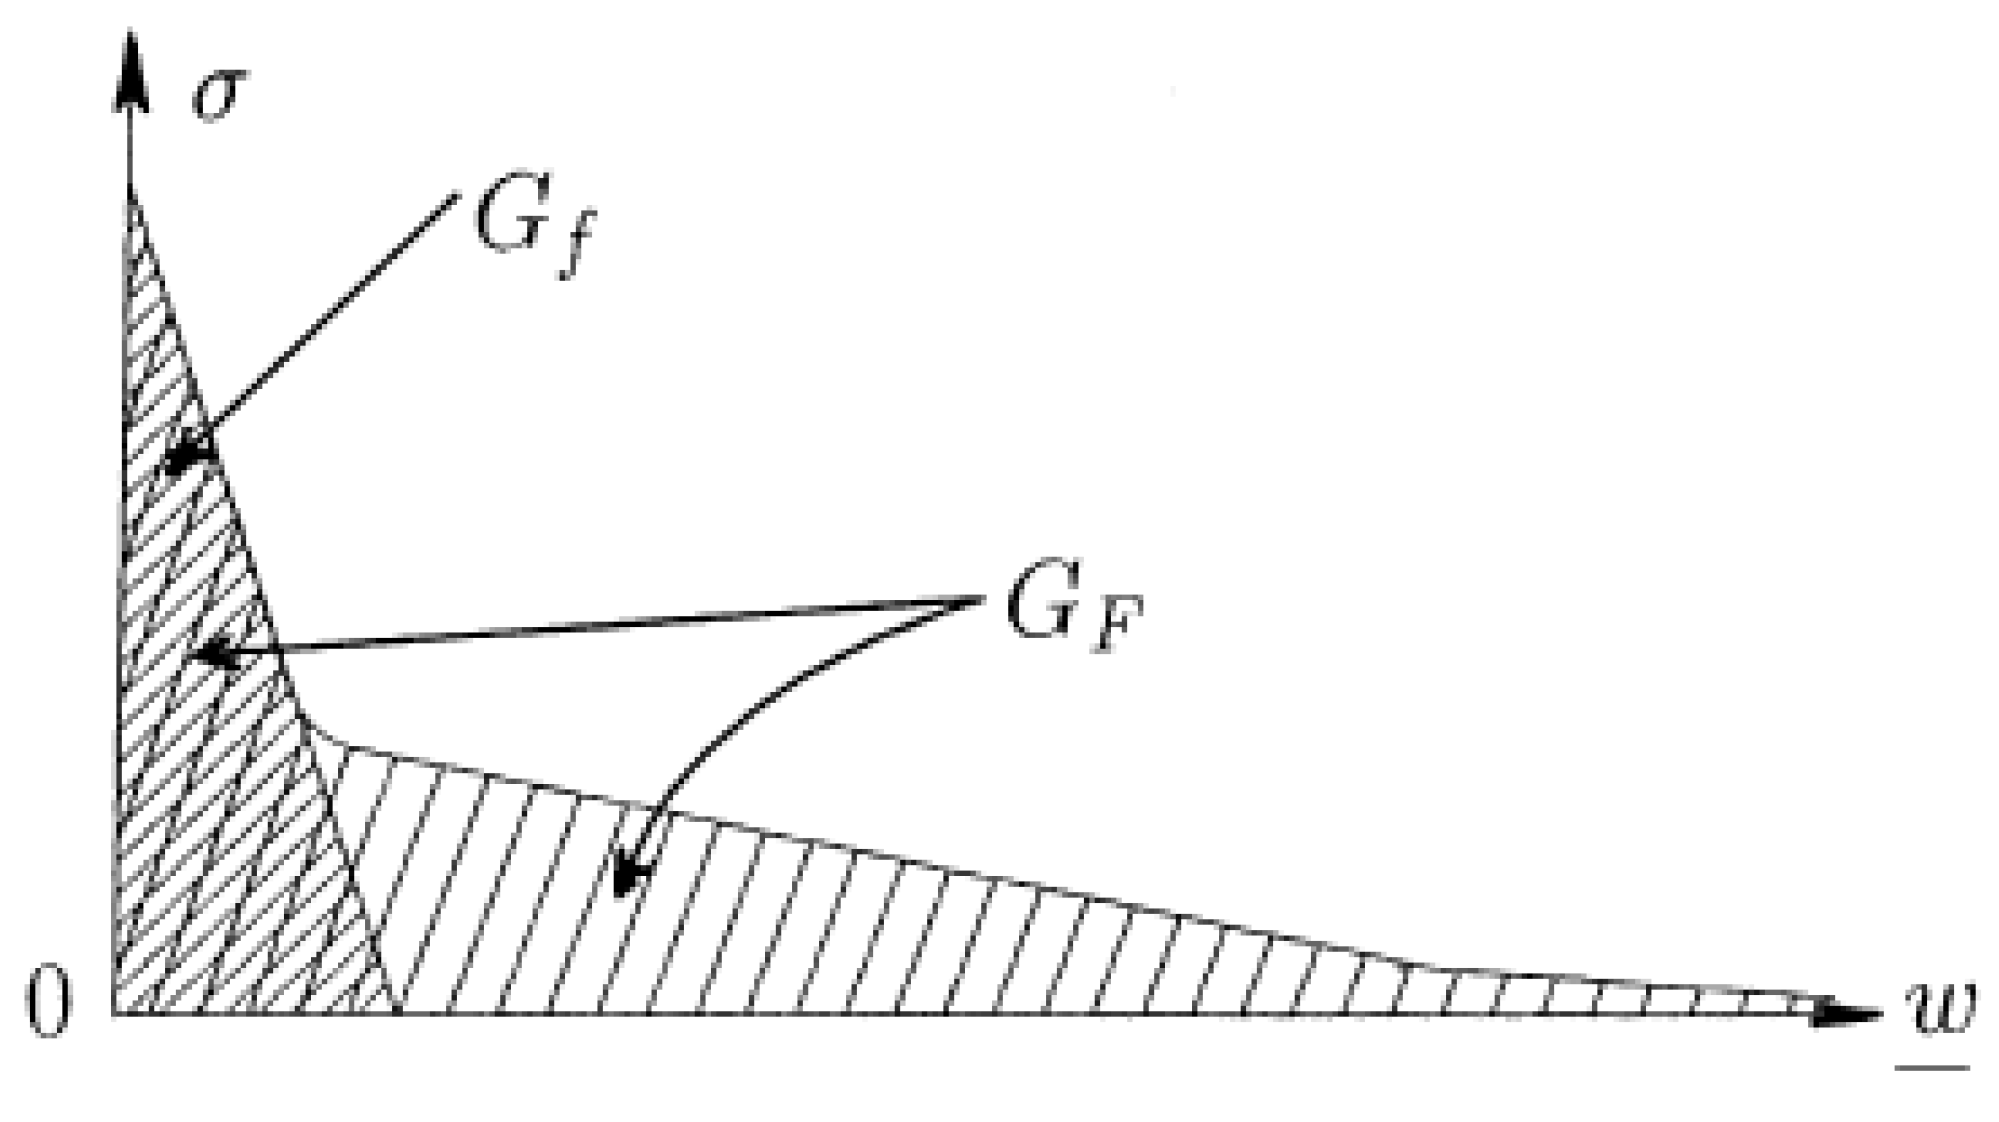
Bazant, Z. and Giraudon, E. [33] define two values for fracture energy, GF, and Gf. The first corresponds to the full area under the stress-separation curve, whereas the latter corresponds to the area under the initial tangent of the stress-separation curve as shown in Figure 9. Wedge-splitting test has been conducted at different hydration ages to investigate the development of these fracture energies with age. GF was determined to be the area under the splitting force vs. CMOD curve obtained from the wedge-splitting test, whereas Gf was measured to be the area under the initial tangent after peak of the splitting load vs. CMOD curve. Summary of the experimentally obtained fracture energies is presented in Table 9.
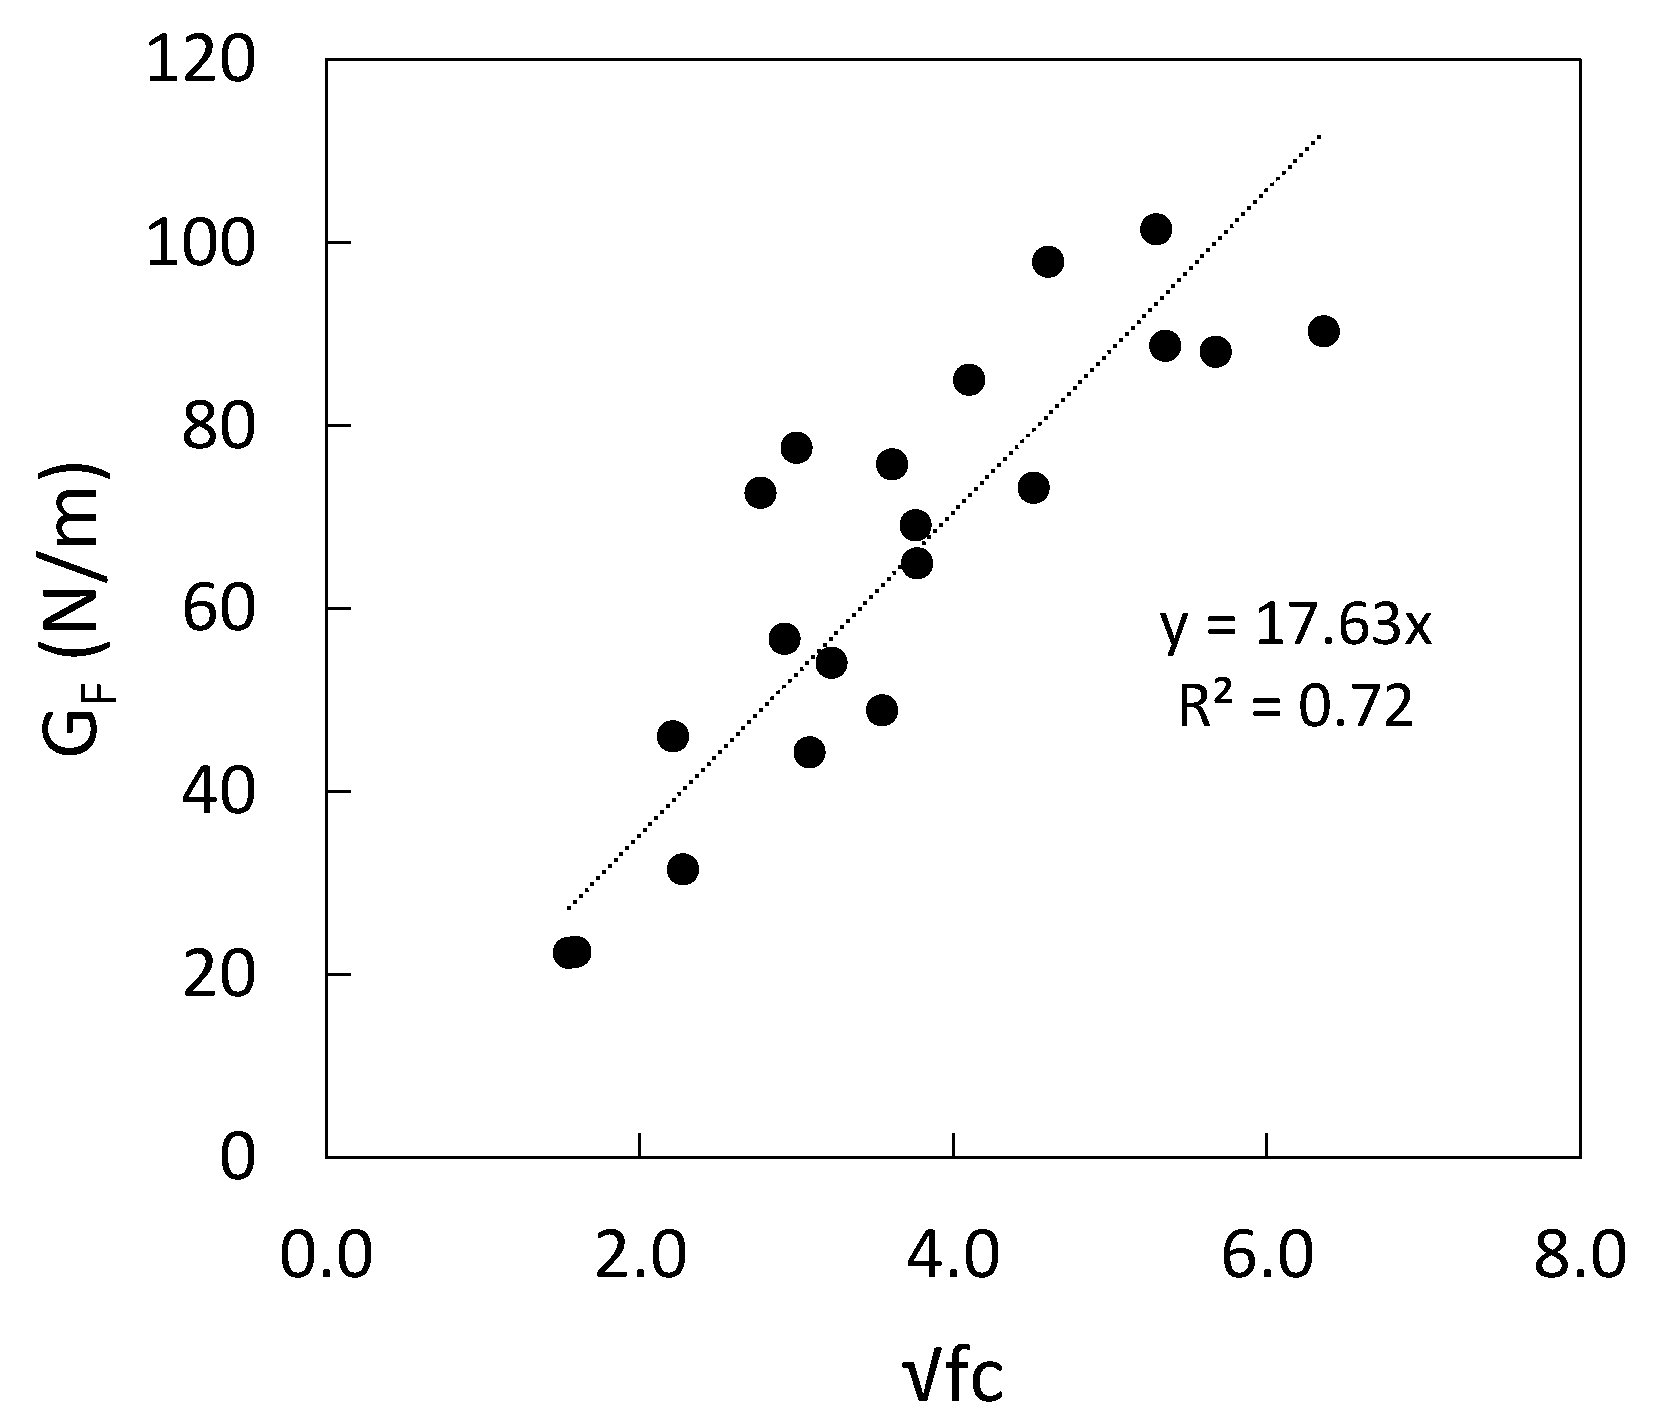
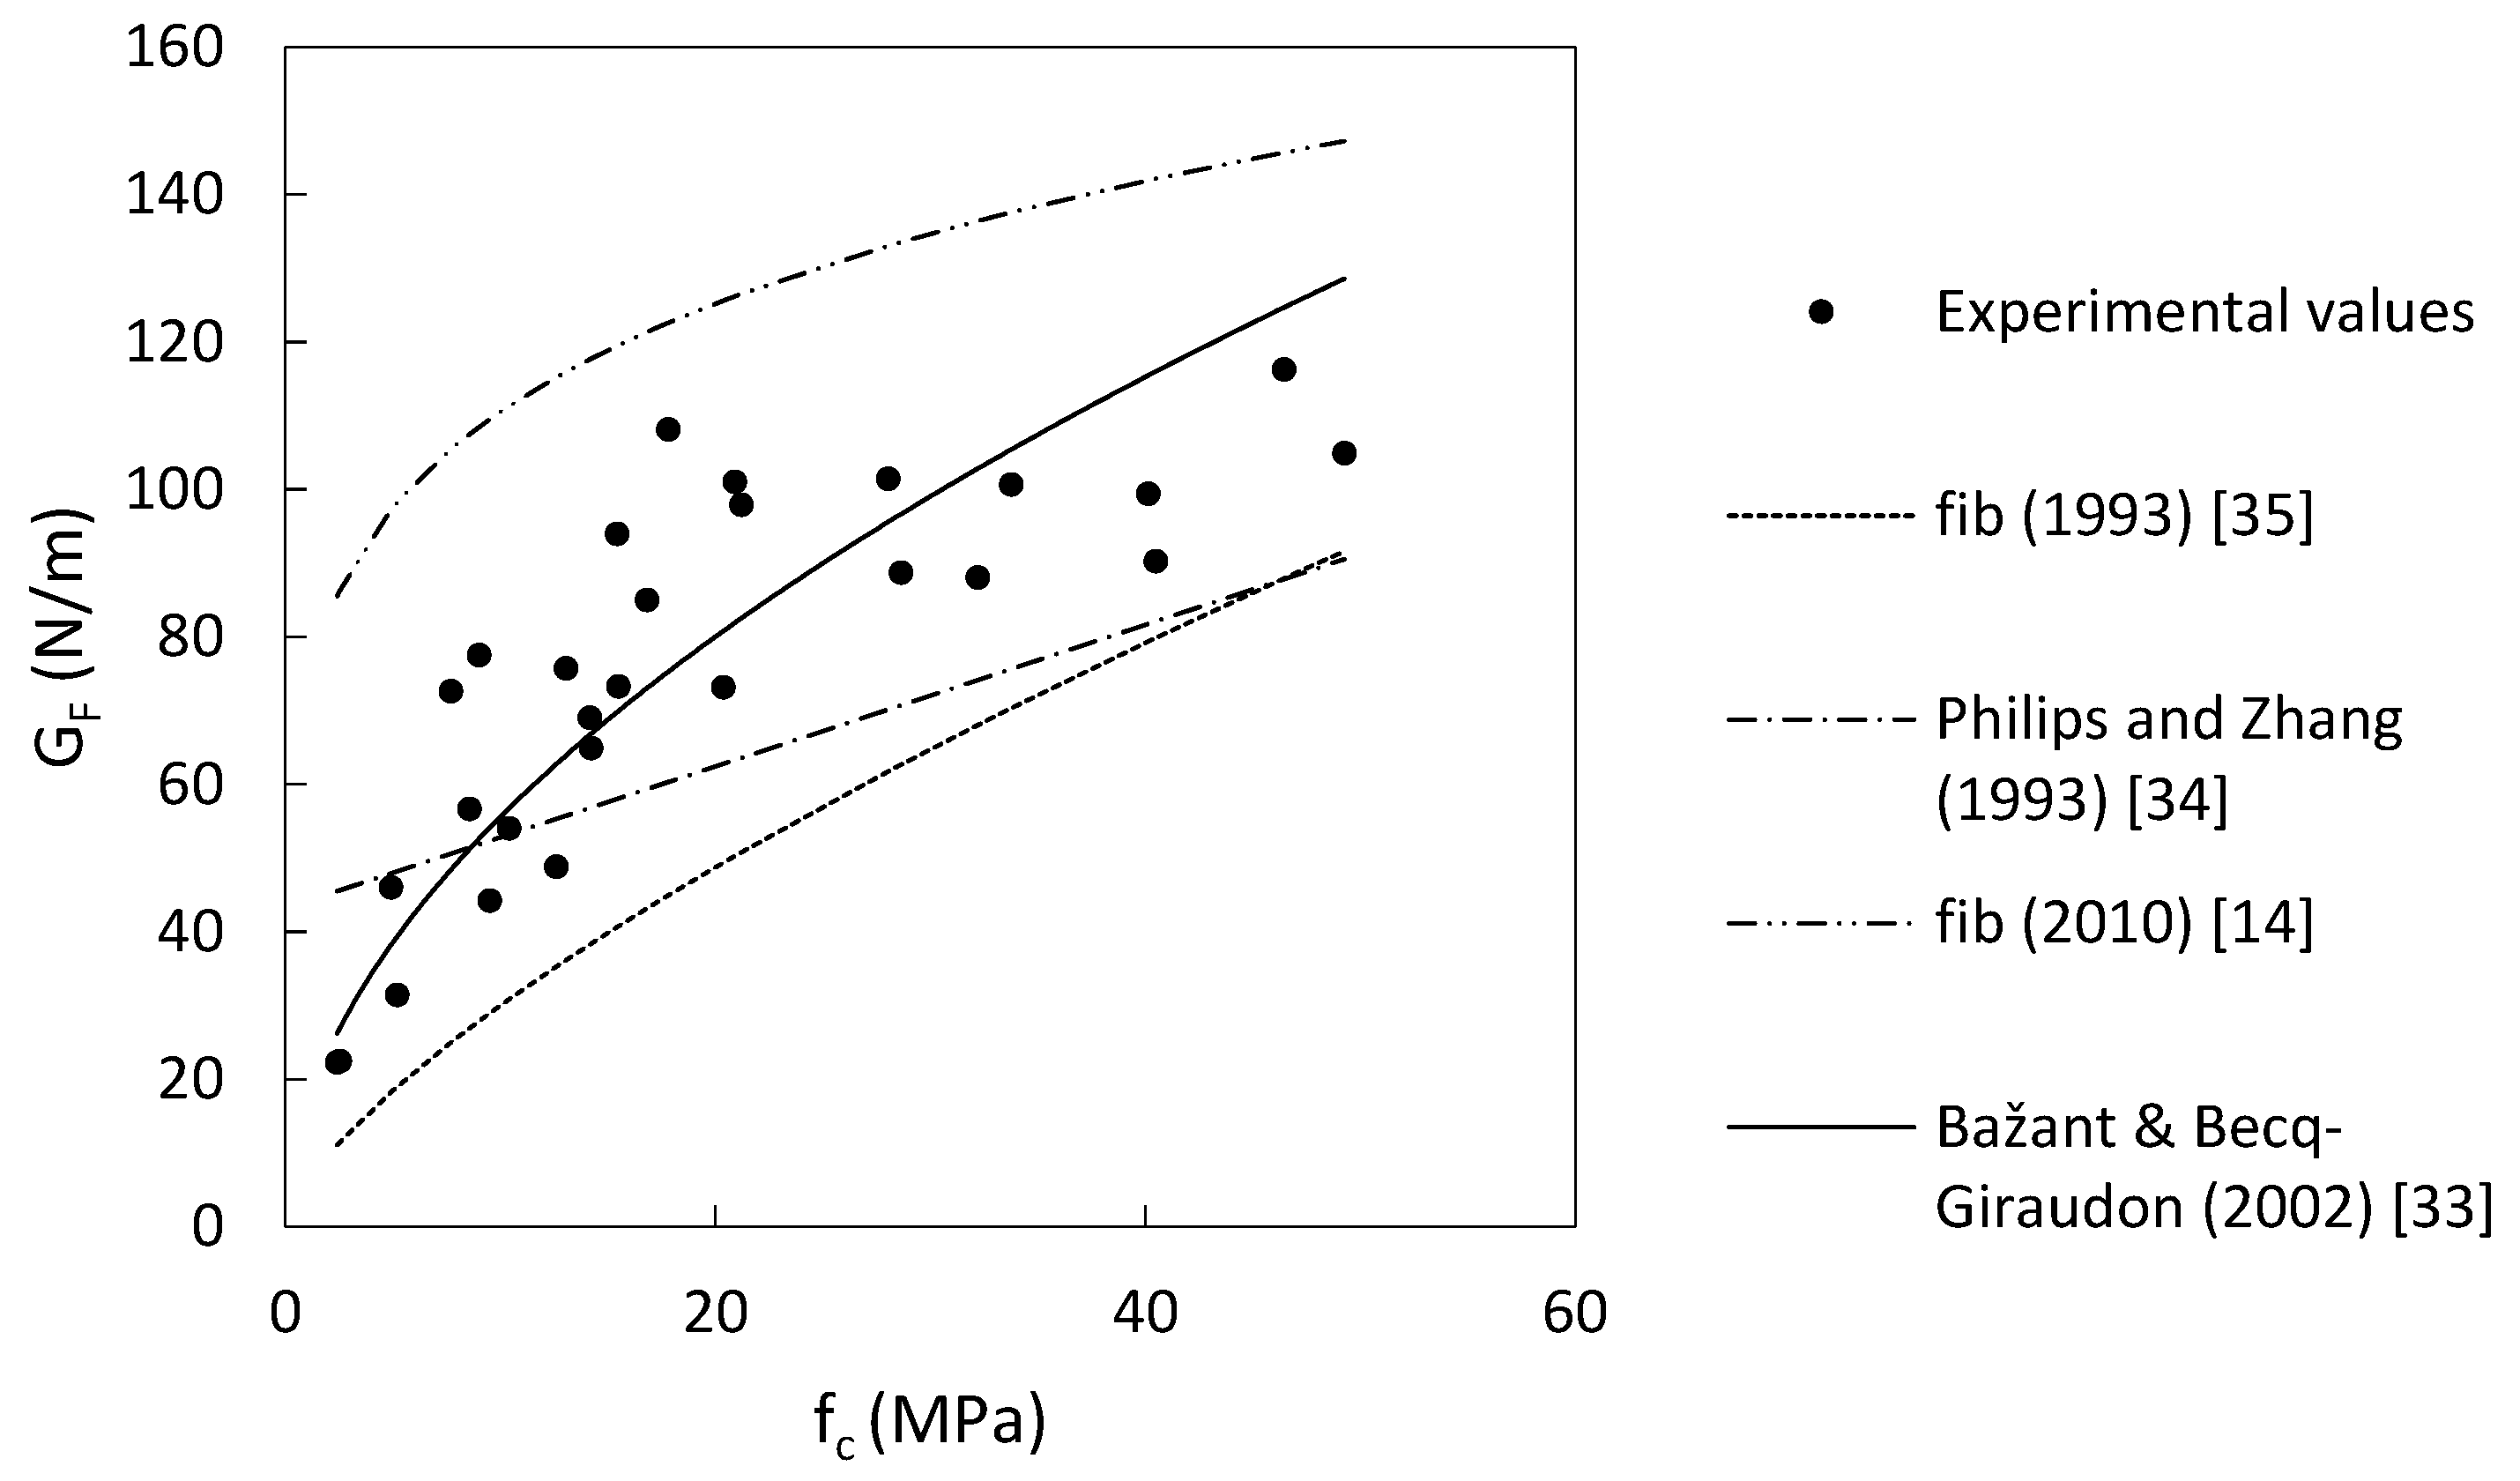
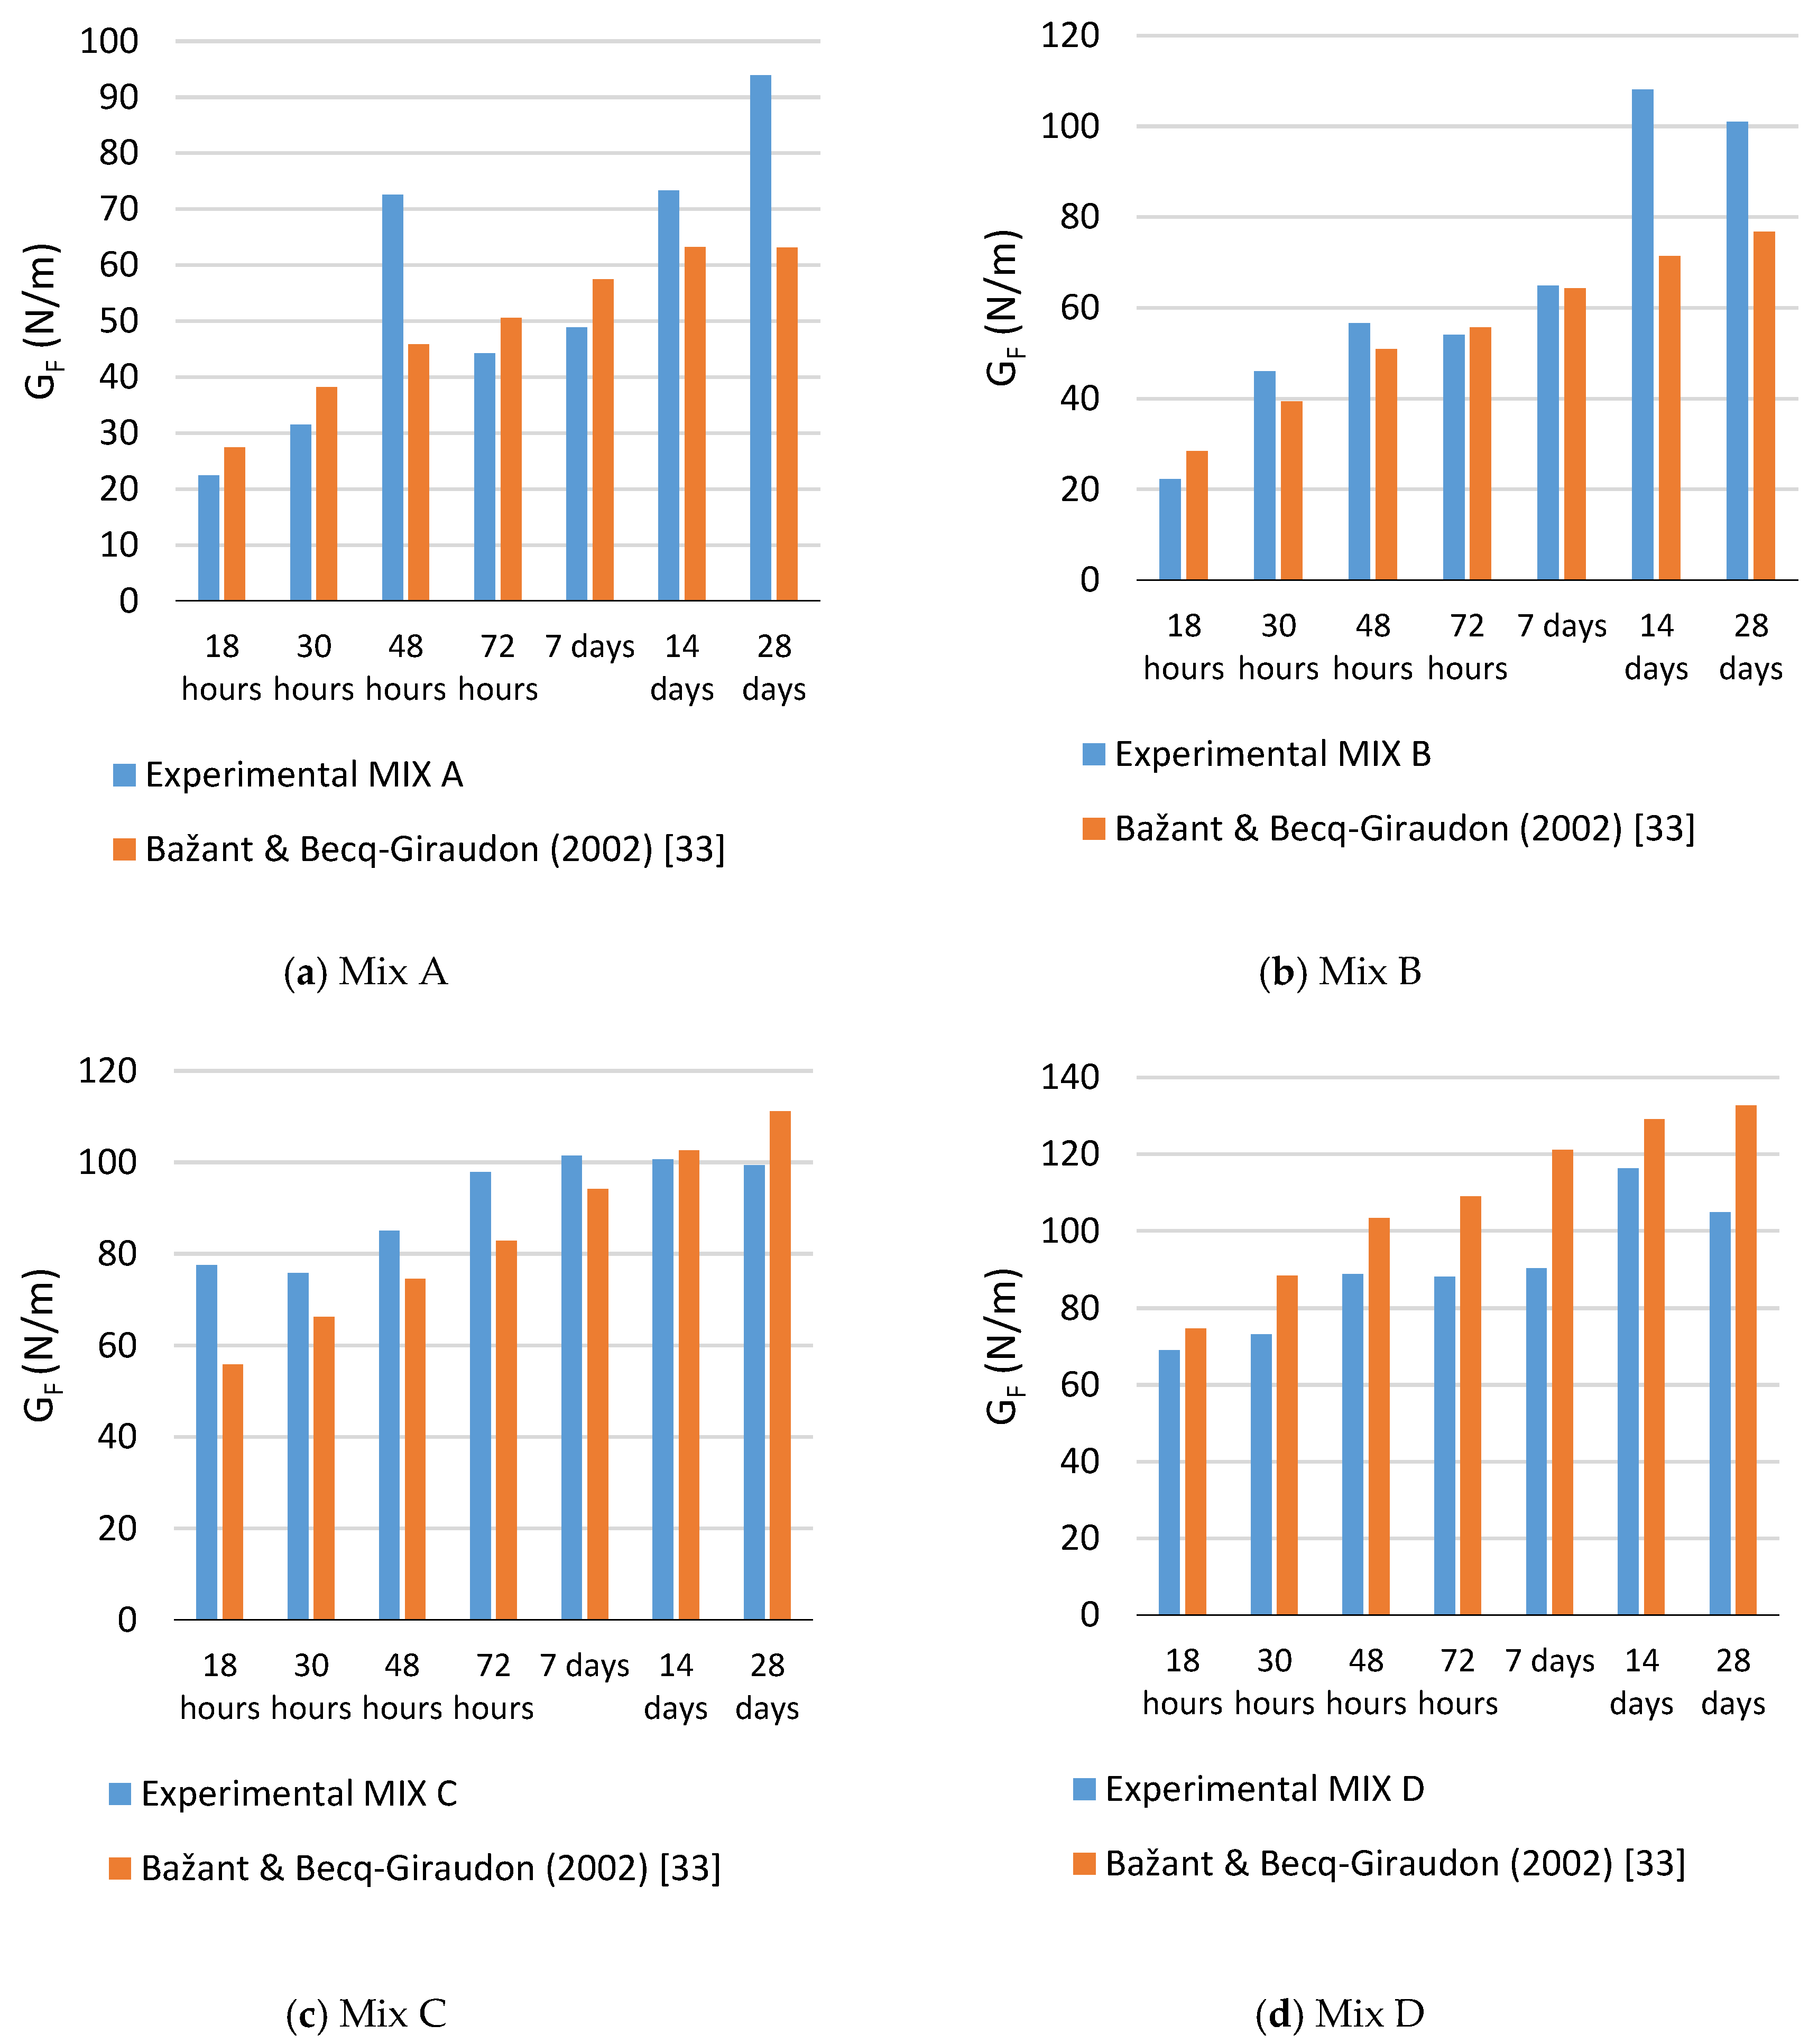
There are several fracture energy models identified in literature as shown in Table 10, these models predict fracture energy of concrete from the compressive strength. The identified models are derived from test data on mature concrete (>28 days). Experimental data for fracture energy values obtained in this study for specimens that are <7 days old are plotted against the square root of the compressive strength in Figure 10. Fracture energy of concrete at early age is linearly correlated with the square root of the compressive strength as shown in Figure 10 where an R2 of 0.72 is obtained. The full data set obtained experimentally in this study is plotted against prediction models in Table 10 as shown in Figure 11. Despite the scatter of the results due to the high coefficient of variation, the model proposed by [33] provides a better estimate compared to other models indicating that the correlation between the compressive strength of the concrete and fracture energy is not dependent on age since the majority of the experimental data in this study is for concrete less than 7 days of age. However, it slightly overestimates the value of fracture energy at higher compressive strengths as shown in Figure 12.
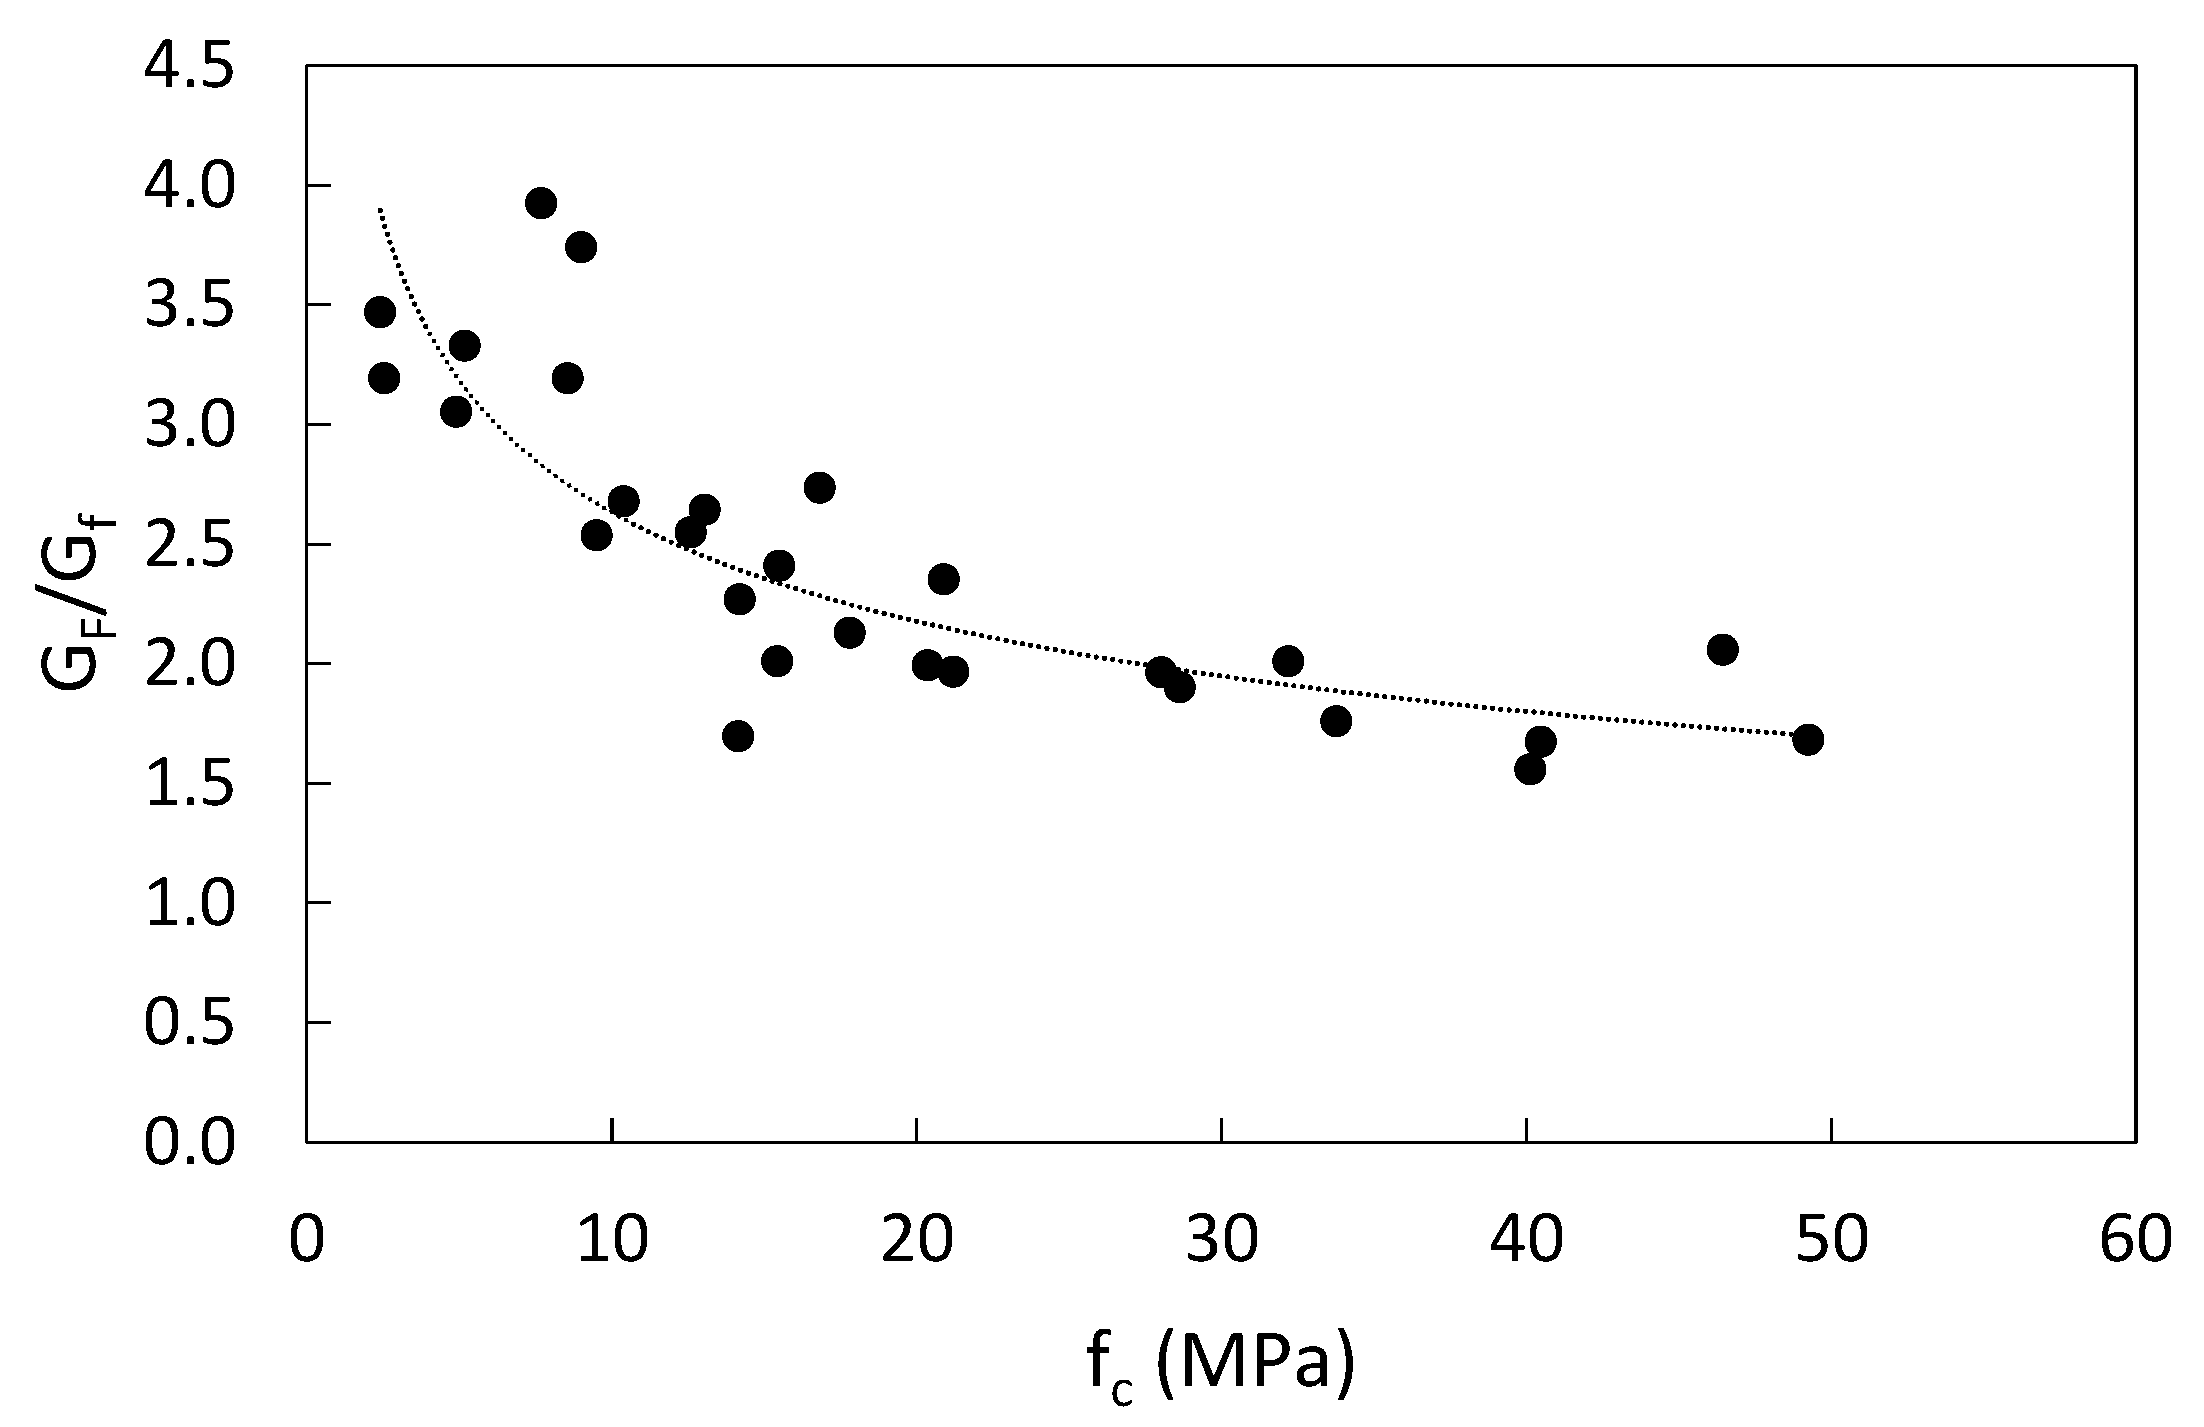
The correlation between fracture energy that corresponds to the full area under the load CMOD diagram (GF) and the area of under the initial post peak tangent (Gf) is assessed in this study. As shown in Figure 13, the slope of the best fit line between the two values of fracture energy is (~2) which is in agreement with [33]. However, the ratio between the two values is found to be higher at lower compressive strength as shown in Figure 14 and then flatten out at about a value of (2) for compressive strengths higher than 20 MPa.
4.5. Finite Element Analysis of the Wedge-Splitting Test
Wedge-splitting tests have been conducted to determine fracture energy of the concrete in this study. Fracture energy of concrete plays a significant role in the tensile behavior of fasteners. The description of the testing procedure and the geometry of the specimen of the wedge-splitting tests have been provided earlier in this paper. The finite element analysis of the fracture energy test is presented in this section. The main purpose of modelling this test is to validate the direct tensile strength obtained from the inverse analysis.
4.5.1. Finite Element Model and Boundary Conditions
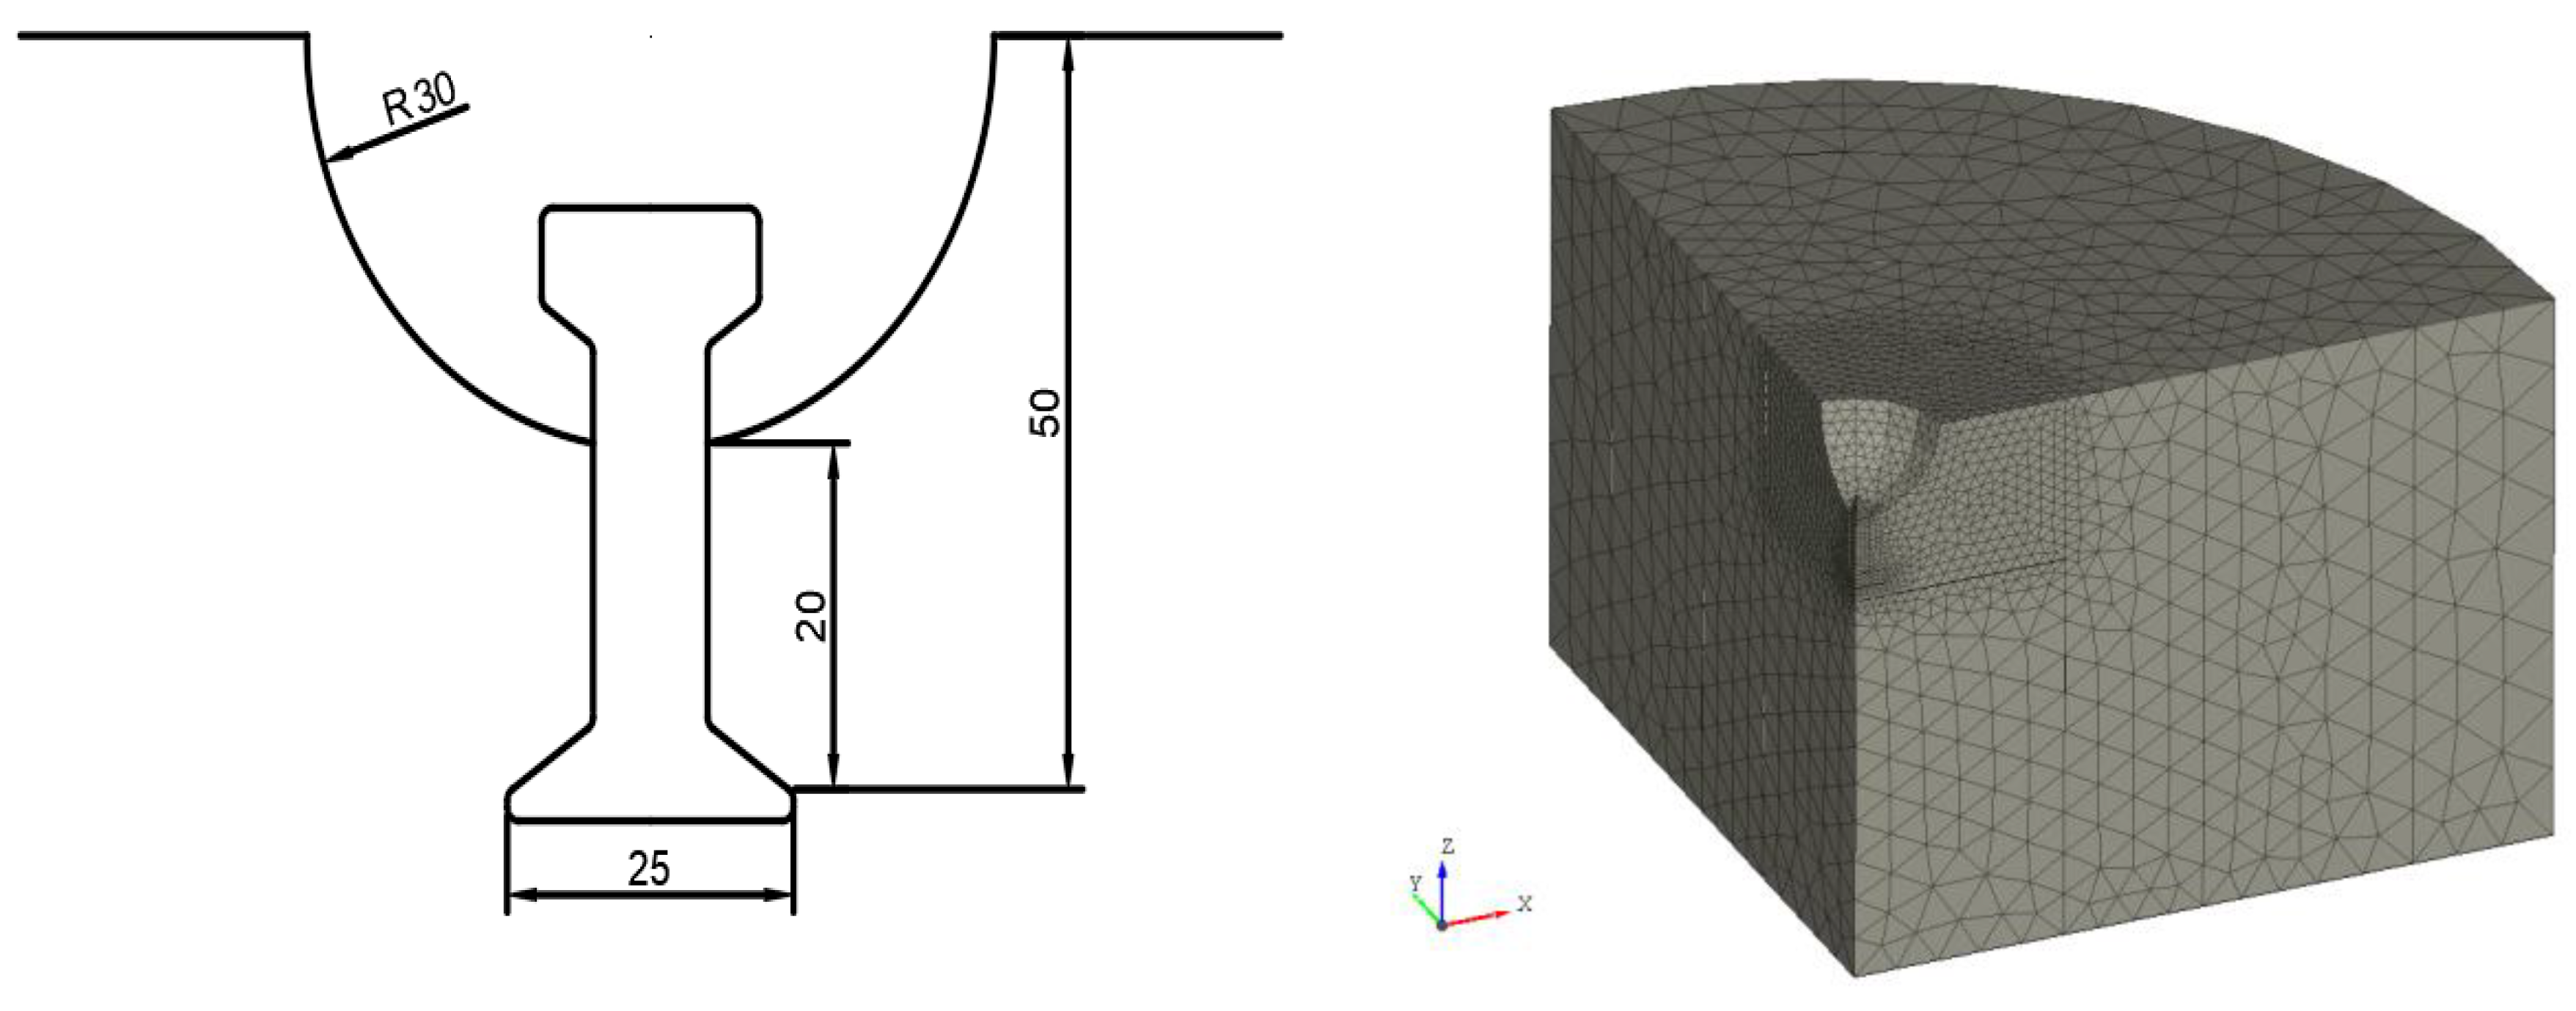
The wedge-splitting test was modelled as a 2D plane stress model because of its simplicity. ATENA 2D by Červenka Consulting was used for the modelling and analysis. The full geometry of the specimen was modelled in the FE analysis due to the relatively small size of the specimen, and the damage being limited to a small region. The mesh size outside the critical region was increased to reduce the processing time. The load was applied as a uniform horizontal displacement of 0.005 mm/step at the location of the roller bearing on the actual loading plate through rigid elastic elements. This extremely small value for the loading rate is to ensure capturing of the post peak behavior without numerical difficulties. The specimen was supported vertically by restraining the central bottom node from moving in the y-direction. Quadrilateral elements were used to model the specimen with the size of elements being 3 mm in the critical region and 7 mm outside that region. Mesh sensitivity analysis was conducted for the mesh size at the critical region and it was established that the model is consistent and the results are not mesh dependent. Figure 15 shows the specimen modelled with relevant dimensions, in addition to mesh profile and boundary conditions of the finite element model.
4.5.2. Aims and Significance
To determine fracture energy of the concrete, three wedge-splitting tests were conducted for each hydration age. The value of fracture energy was taken as the average of the three specimens. In addition to the determination of fracture energy, inverse analysis was conducted on the results of this test to obtain the direct tensile strength. Inverse analysis was conducted by utilizing a cracked hinge model with a bilinear stress softening curve. However, the constitutive relation for concrete in tension adopted in the numerical analyses of this study is based on [36] model that is built in with the concrete model provided by ATENA (NonlinearCementitious2). Therefore, finite element analysis of the test with tensile strength obtained from the inverse analysis is conducted to check the possibility of replacing the bilinear stress-softening relationship with a more advanced one.
4.5.3. Material Properties
For the validation of the inverse analysis results, the material properties of Mix B were used as inputs for the FE models. ATENA 2D has several built in concrete models, for this study the model labelled “3DNonlinearCementitious2” was used. Cracking of the concrete was modelled following the rotated crack approach. Concrete properties used in the FE analysis are shown in Table 3. All other parameters required by the concrete material model were kept to their default values suggested in [37].
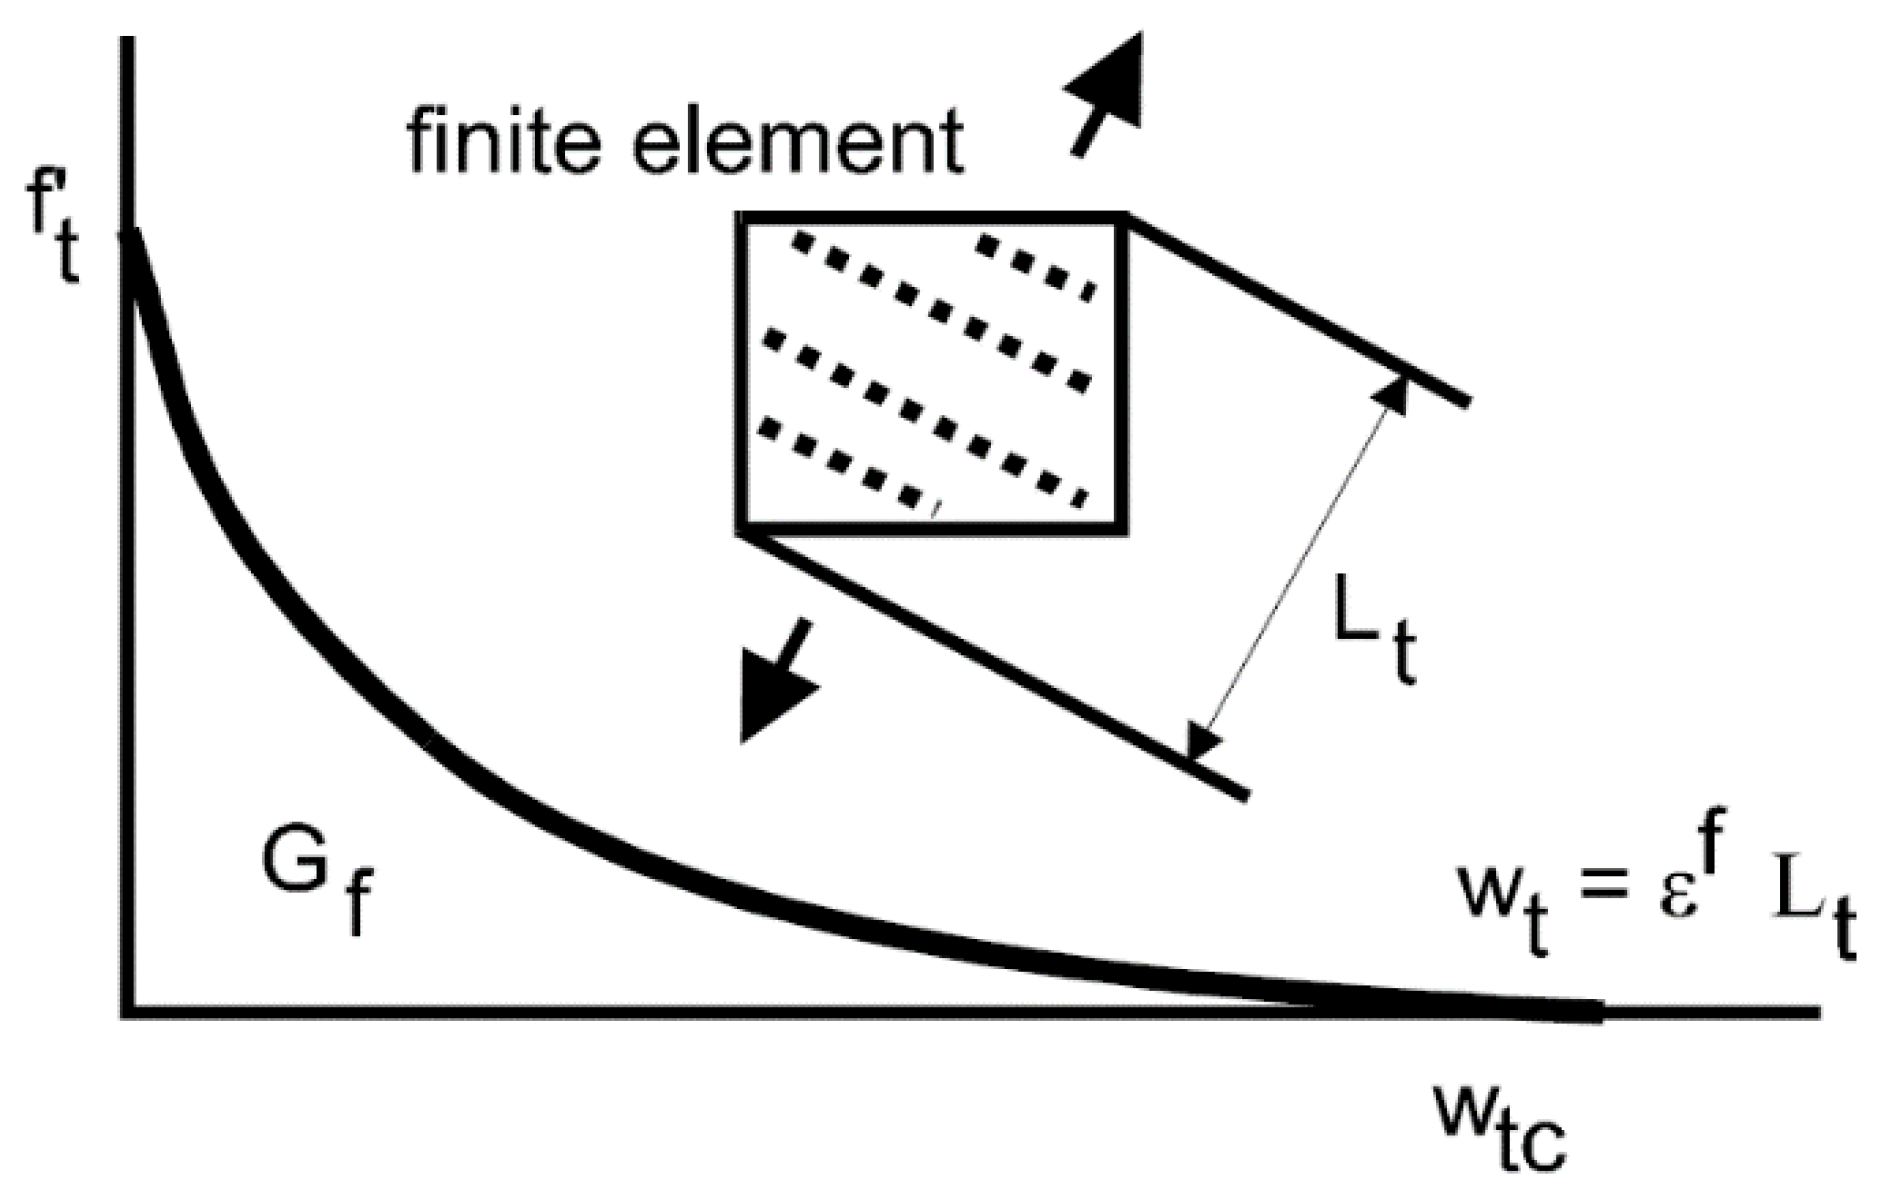
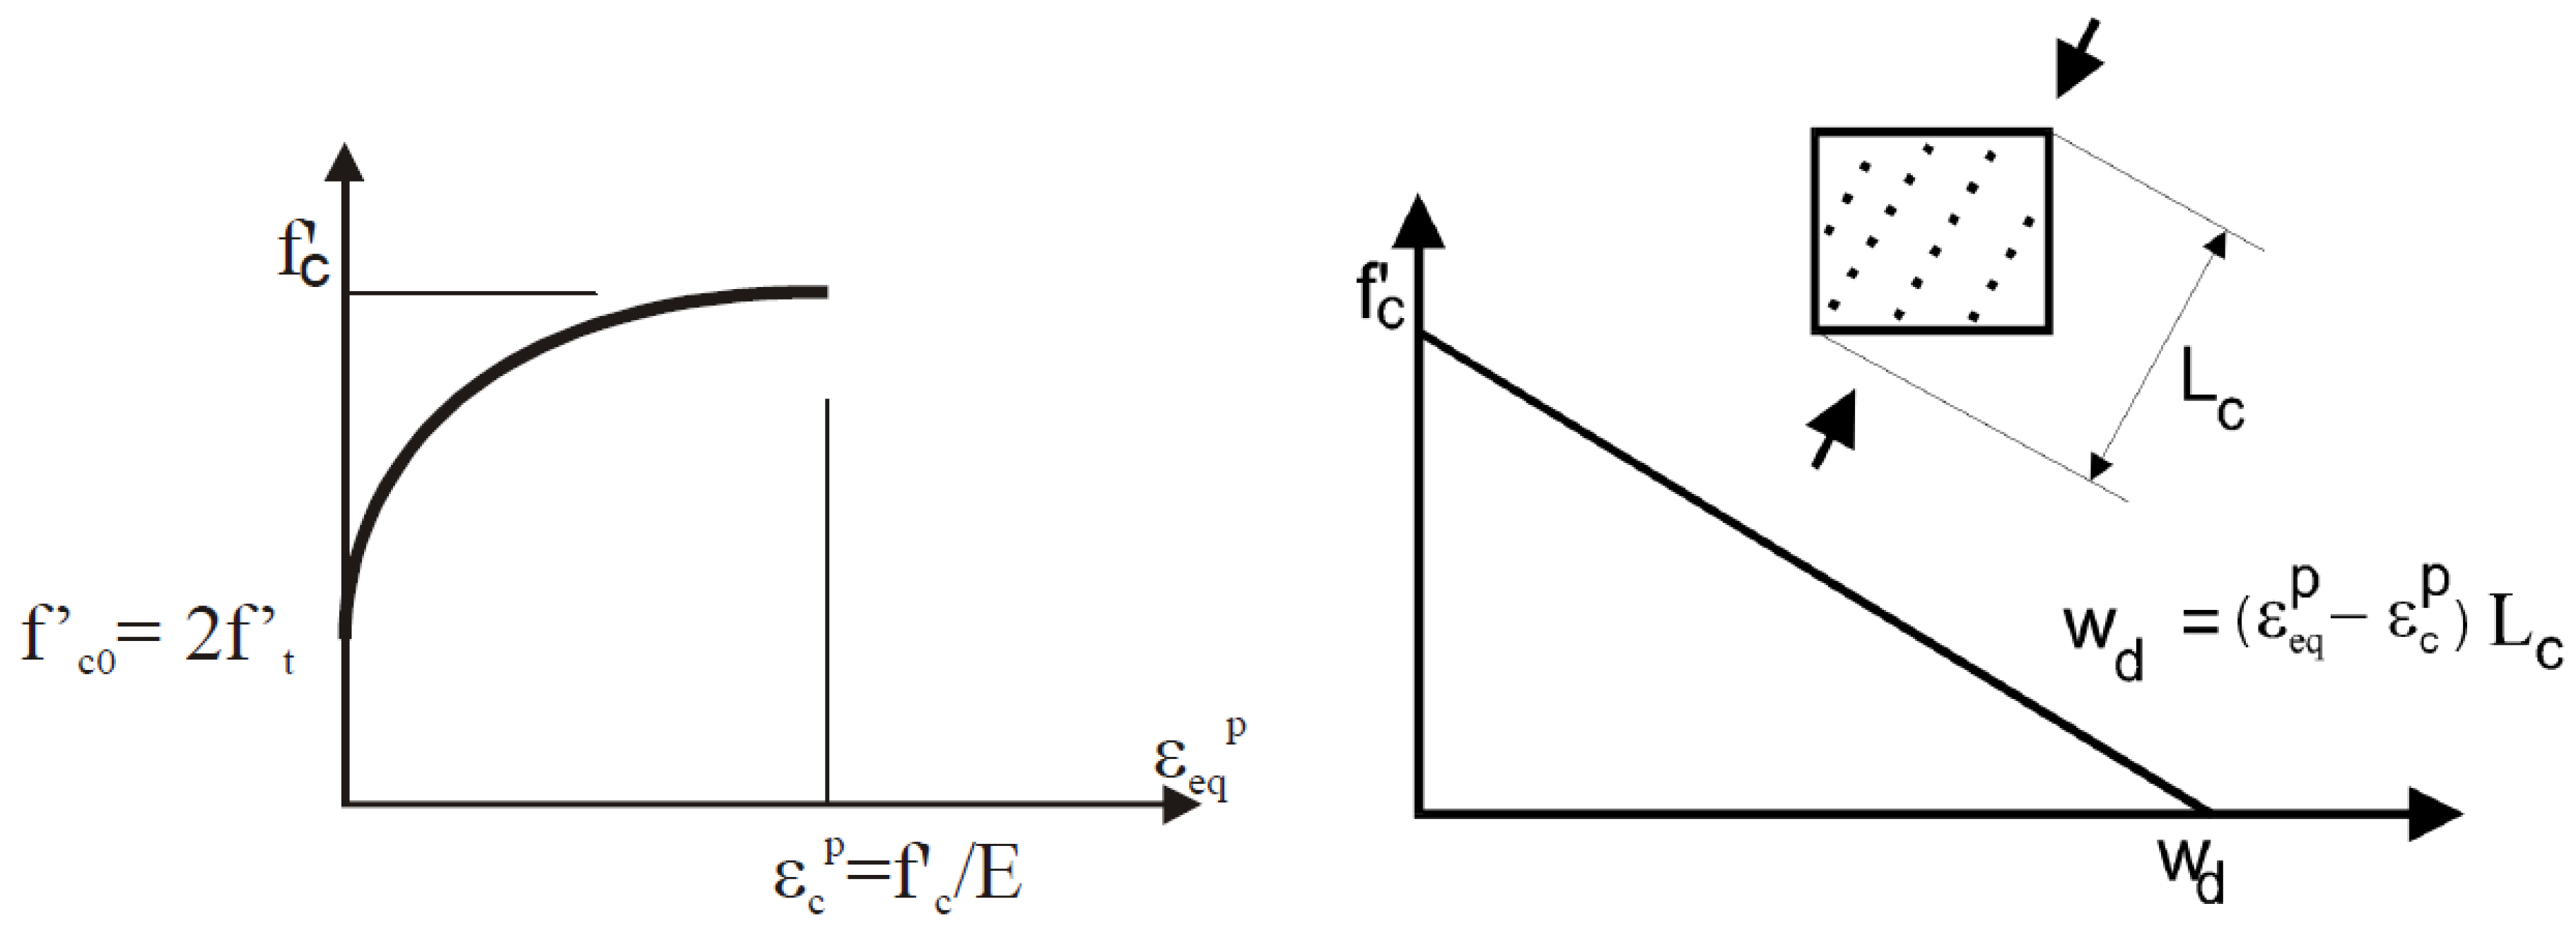
The concrete behaviour in tension is assumed to be linear until reaching the tensile strength, then tension softening takes place following Hordijk’s formula [36]. The crack width in tension is calculated based on a characteristic length following the crack band size introduced by [38], and taken as the size of the element projected into the crack direction as shown in Figure 16. The compressive behaviour follows an eliptical assending branch and linear decending brach that takes into consideration the compressive characterstic length as shown in Figure 17. Detailed formulation of the model can be found in [37].
4.5.4. Results and Discussion
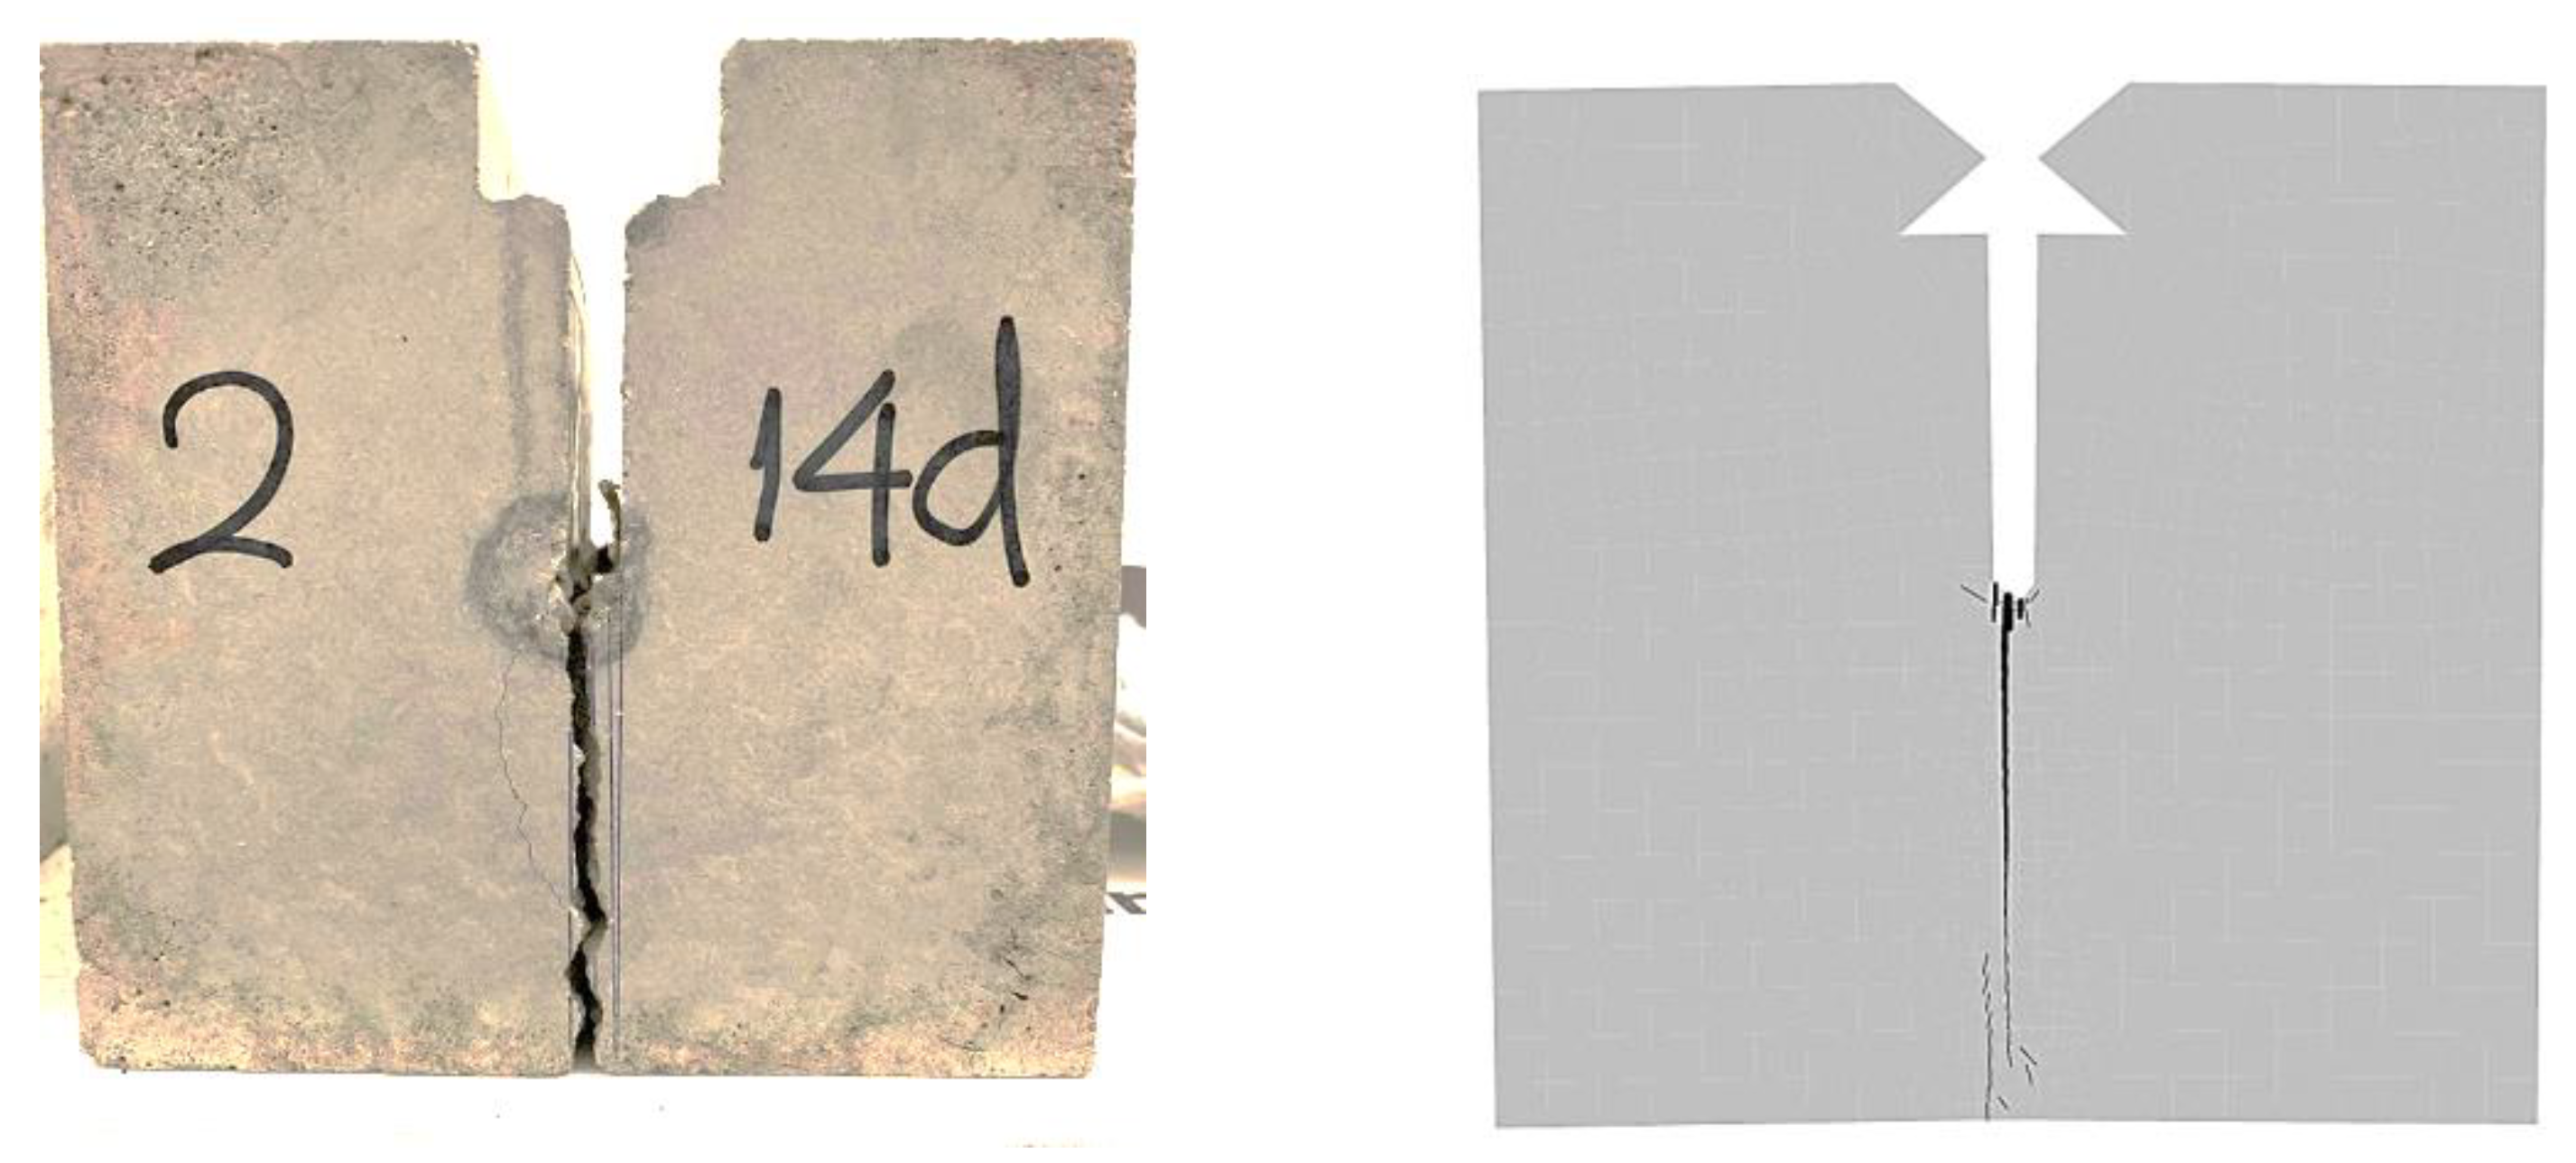
As the wedge is pushed between the roller bearing, because of the wedge profile, a horizontal force will be exerted on the specimen. This force will initiate a crack along the center line of the specimen. The crack initiation point is forced by the geometry of the specimen where a starter notch is created to ensure that the crack propagates through a known cross section. This crack pattern is shown in Figure 18 where this is the typical failure mode observed experimentally. Figure 18 also shows the finite element model in its’ cracked state, and it can be seen that the crack propagation from the FE analysis matches well with the experimental results.
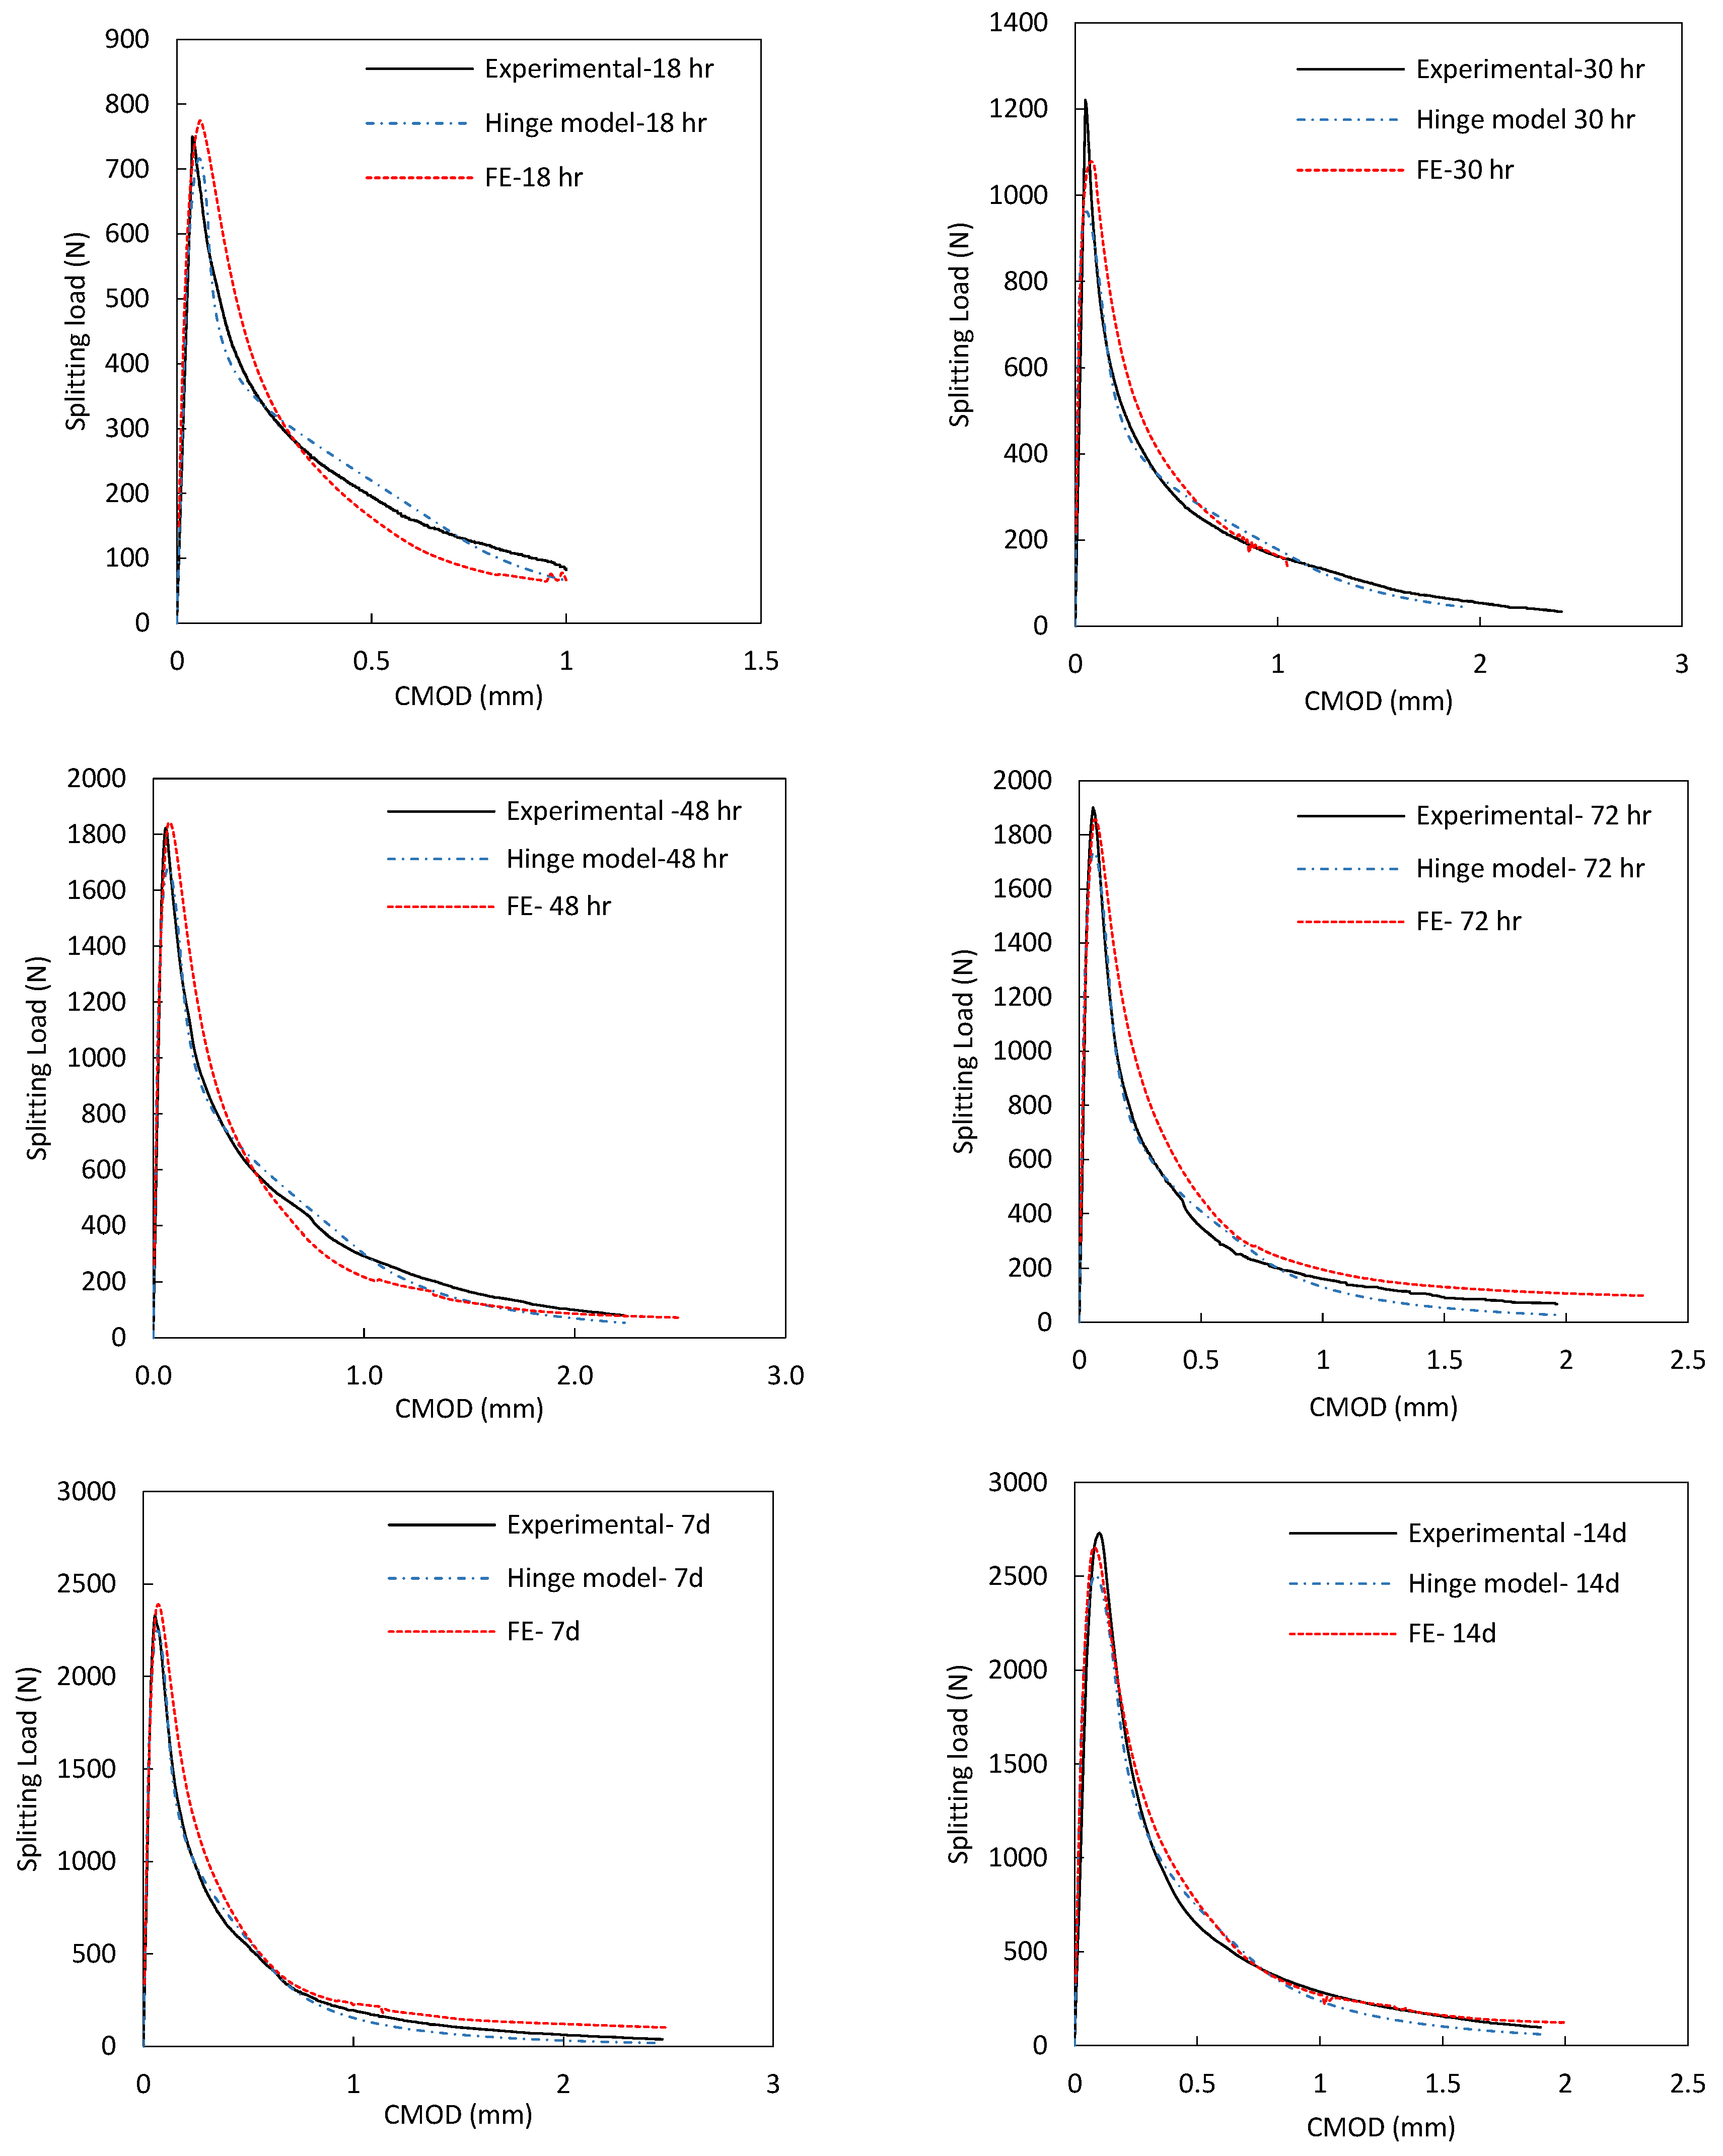
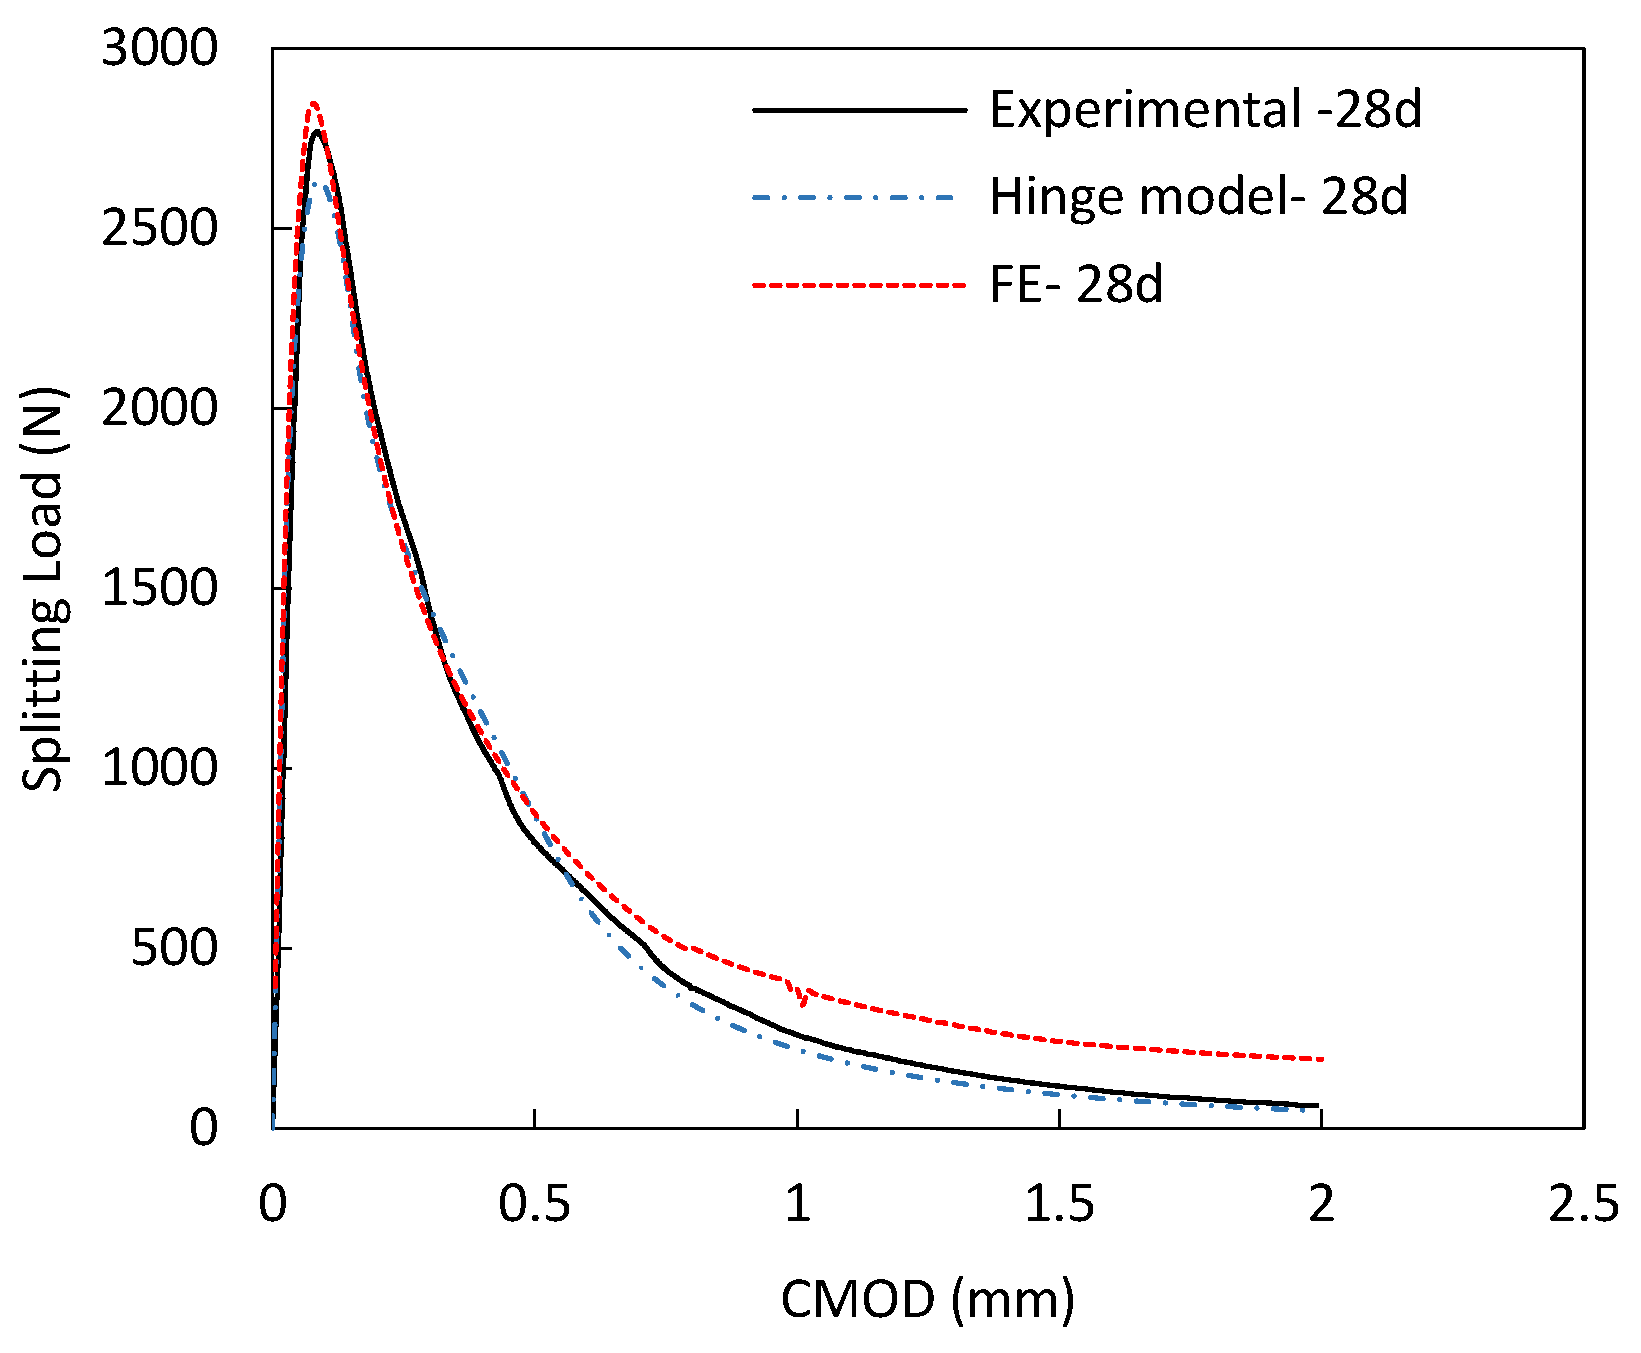
Figure 19 shows the splitting force vs. CMOD displacement curves from concrete age 18 h to 28 days. Black solid curves represent experimentally obtained behavior, red dashed curves represent results of the finite element analysis, and the dashed light blue curves are the curves generated by the inverse analysis (hinge model). From this figure, using tensile strength from the inverse analysis in the FE model provide a good match to the experimental behavior over all ages tested.
When the splitting tensile test was used to determine the tensile strength based on a correction factor of 0.9, the FE model for the wedge-splitting test overestimated the experimentally obtained peak load. However, when using values obtained from the inverse analysis, a better match was achieved. This indicates that the correction factor of 0.9 may be questionable and appears to be overestimating the true tensile strength. Fracture energy used in the simulation was taken as the average experimentally determined value. Matching of the Psp-CMOD curves indicated that the value of fracture energy (GF) determined experimentally from the wedge-splitting test can be used as an input in FE analysis where post-peak behavior is of interest.
4.6. Finite Element Analysis of Anchor Pull-Out Test
The finite element program ATENA-3D by Červenka Consulting is used to model pull-out experiments on fasteners in early age concrete. This program has been used previously in studies to investigate the behavior of fasteners and found to be accurate [39,40,41]. The concrete is modelled using the concrete model “3DNonlinearCementitious2,” whereas steel elements are modelled as an elastic isotropic material. Experimental fastener pull-out test performed as part of a study on the behavior of fasteners in early age concrete has been chosen as the validation benchmark for the FE model. The purpose of this analysis is to verify the suitability of material properties determined from the experiment for modelling pull-out tests of anchors.
4.6.1. Geometry and Setup
Standard headed fasteners were installed in plain concrete with void formers to replicate the installation of lifting fasteners in commercial construction. Fasteners tested had an effective embedment depth of 50 mm and installed in a 30-mm radius void former. The concrete slab was 200-mm thick and detailed dimensions of the anchor are shown in Figure 20. The load was applied as a uniform displacement through a support ring with a 400 mm inner diameter. The symmetry of the setup was employed in the anchor model where only quarter of the problem is modelled to reduce the computational resources. Further, because of the damage being limited to the region close to the head of the fastener, a fine mesh of 5 mm size was adopted in this region, and the mesh size was gradually increased to 25 mm at the far end of the slab as shown in Figure 20.
The support ring was modelled by restraining the top surface of the concrete in the loading direction at the location where the frame was in contact with the slab in the actual test setup. The load was applied in the FE model as a uniform displacement of 0.005 mm/step to the anchor shank. The contact between the concrete and the anchor was modelled as a hard contact with zero tensile strength. Further, friction is neglected in the modelling as the load is mainly transferred by bearing between the anchor foot and the concrete.
4.6.2. Material Properties
A total of 24 anchors were installed and tested in Mix B, concrete properties at different ages are as shown in Table 3. Anchor pull-out test were conducted at four ages at which the concrete compressive strength was 7, 11.2, 14.2, and 17.8 MPa. Five anchors were tested per age except for anchors D where nine anchors were tested. The compressive strength at the time of test was used to estimate E, Gf, and ft of the concrete by fitting to strength development curves obtained from the material testing conducted on Mix B. Summary of the properties used in the FE model is given in Table 11. Where fcm is the average compressive strength from the experiment, ft is the tensile strength obtained from the inverse analysis, and Gf is the fracture energy that corresponds to the area under the initial tangent after peak and taken as (GF/2).
4.6.3. Discussion of Results
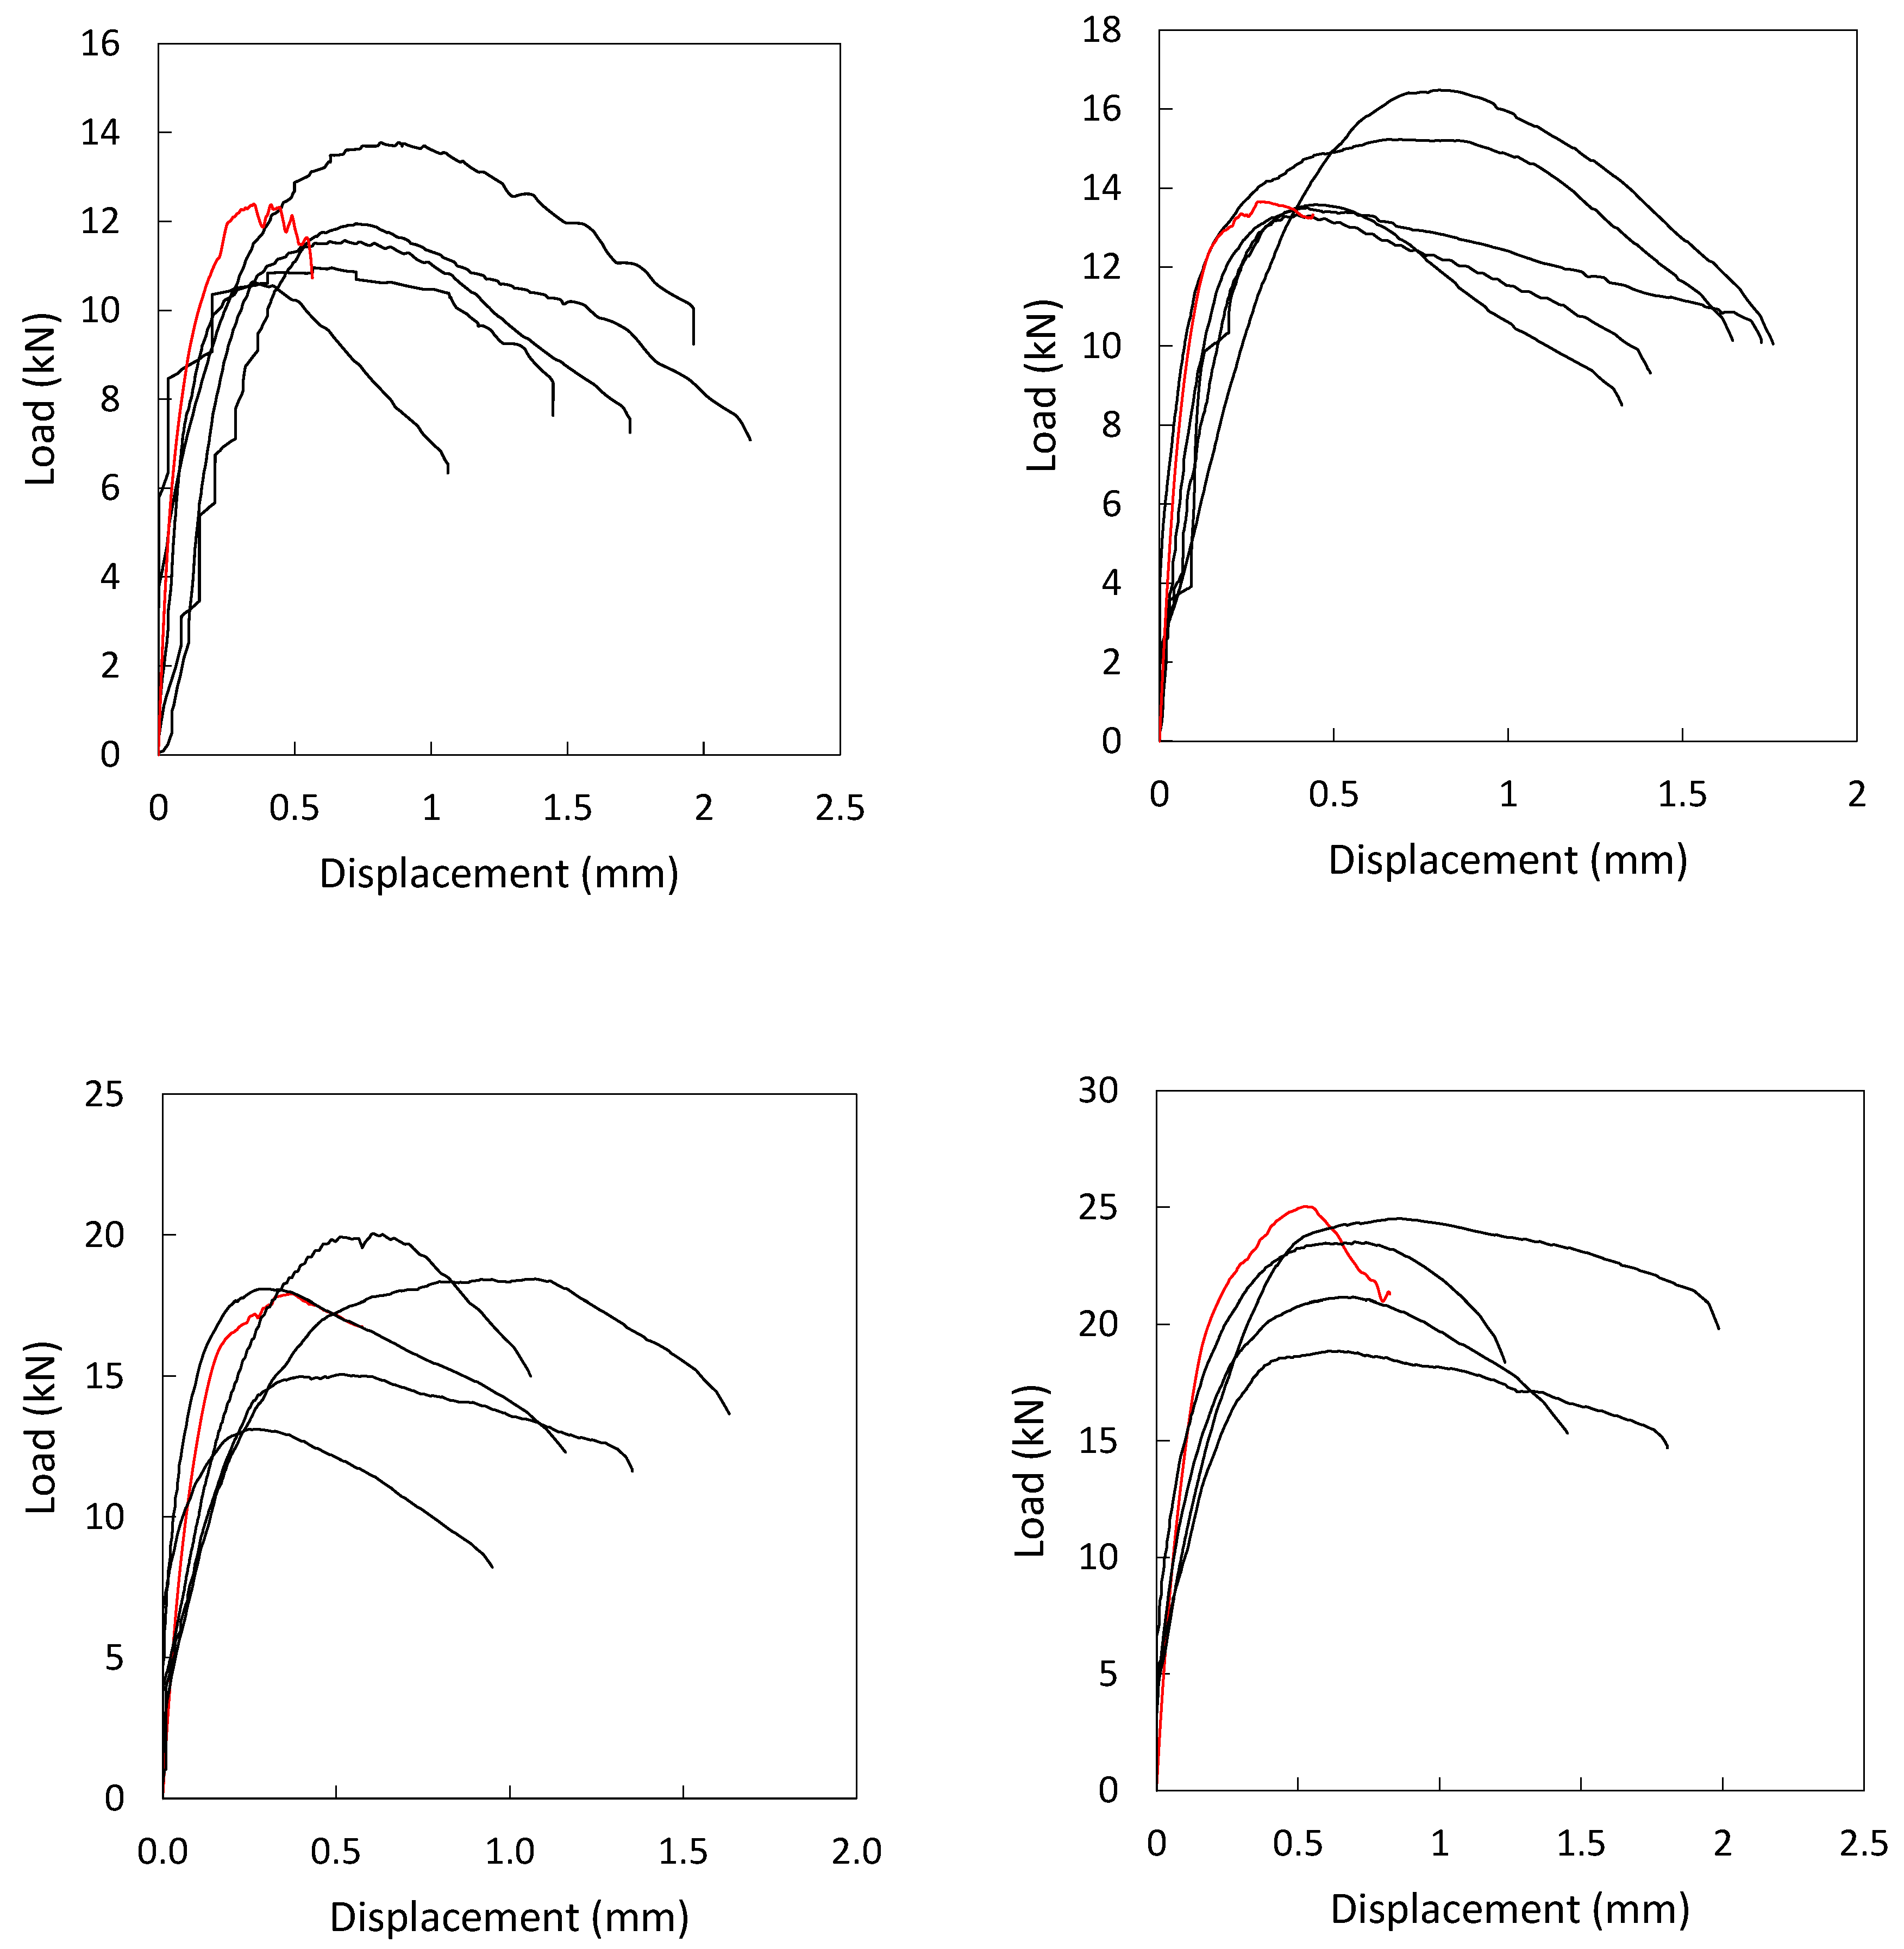
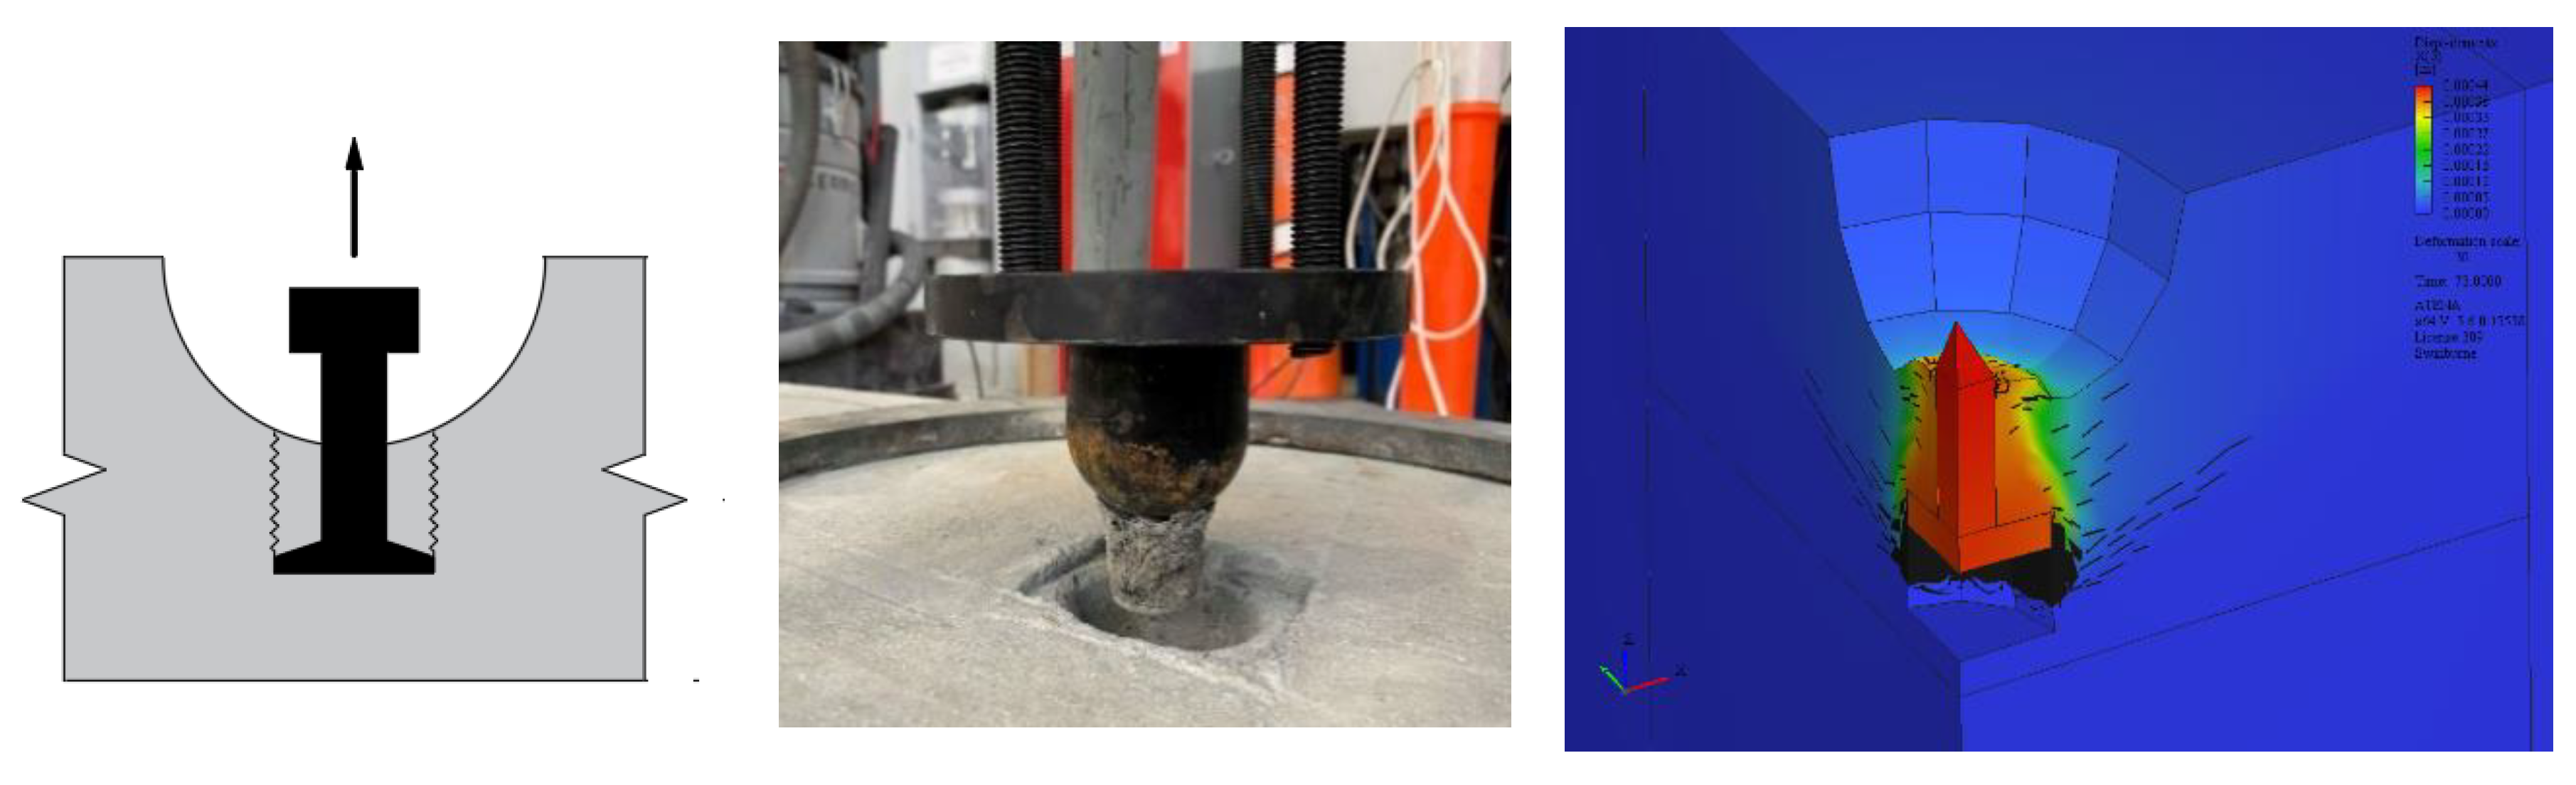
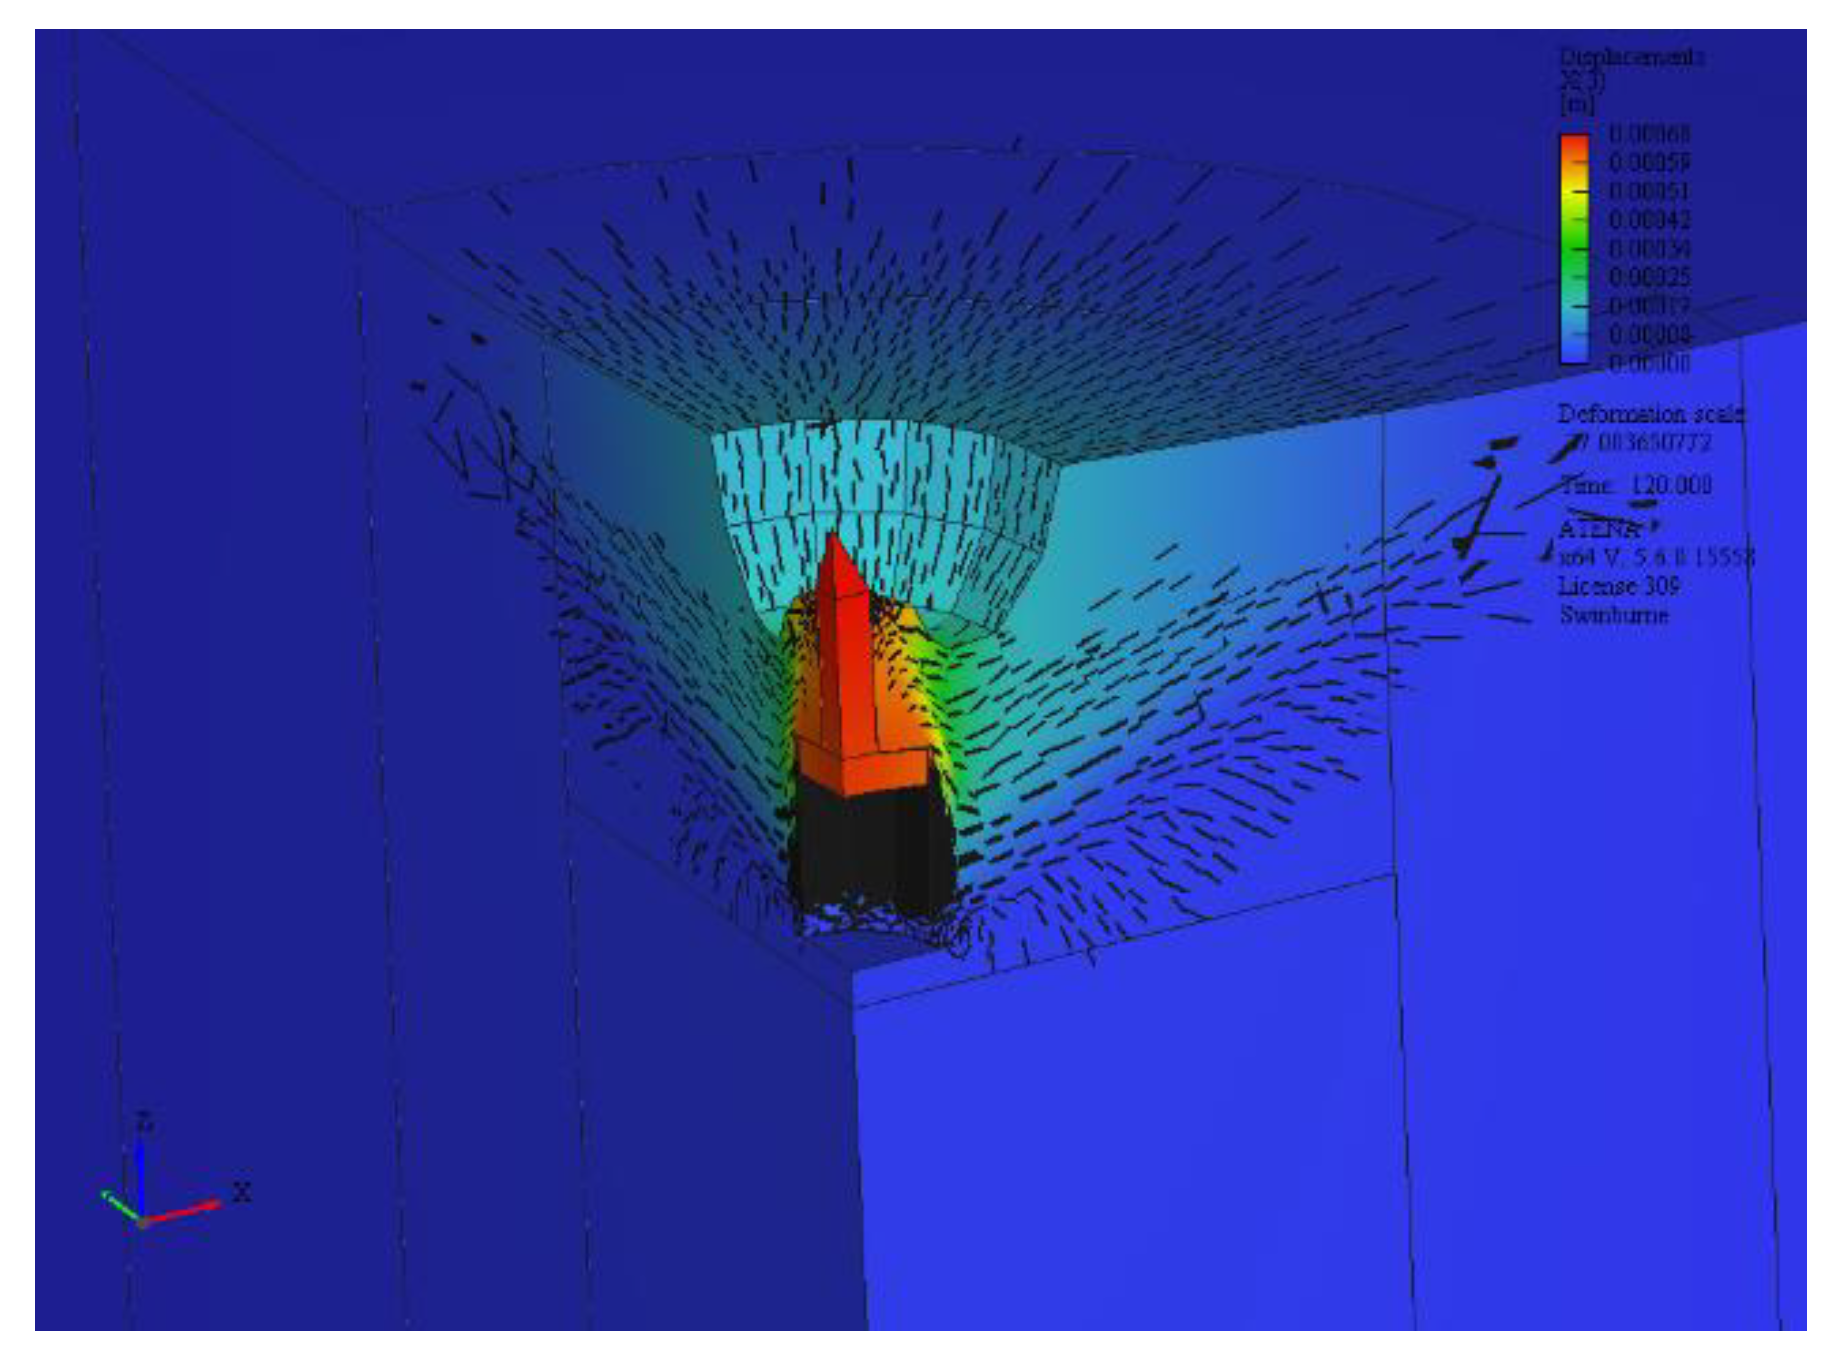
The results of the finite element analysis are presented in Table 12 and Figure 21. The results are in good agreement with the experimental results in terms of the load displacement behavior, peak load, and failure mechanism. Anchors labelled A to C failed experimentally by pulling out a cylindrical plug as shown schematically in Figure 22, however anchors labelled D 4 out of 9 anchors failed by pull-out failure and the remaining five anchors failed by pulling out a concrete cone. The failure modes of anchors A-C in FE analysis was same as that observed in the experiment, while anchor D numerically failed by combined failure reflecting the fact that the anchors are on the edge of the two failure modes as shown in Figure 23. Figure 22 shows typical observed failure modes for the anchors modelled with a comparison with the experimentally observed failure modes.
5. Conclusions
This study investigates the development of concrete properties with time for the compressive strength, tensile strength, modulus of elasticity, and fracture energy. These properties are governing factors of the behavior of fasteners in early age concrete. In order to obtain an understanding of the behavior of fasteners in early age concrete, it is important to identify the correlation of the properties above with concrete compressive strength and understanding of how this correlation is changing with time as the concrete matures. The focus on the correlation with the compressive strength is due to the fact that it is the most common concrete strength parameter for design purposes. Furthermore, this study investigated prediction models in literature to assess the usability for early age concrete and particularly for modelling of anchors.
Splitting tensile strength of concrete was found to be correlated to the concrete compressive strength by a power function of 0.7 to 0.8 and this correlation was found to hold true for all ages tested. Two models from literature were found to provide reasonable prediction of the splitting tensile strength from the compressive strength namely [26,27] found in Table 7. Moreover, tensile strength values obtained from the inverse analysis proposed by [11] provided a reasonable estimate of the true tensile strength for modelling purposes, as demonstrated in the wedge-splitting and anchor pull-out finite element analysis. The ratio of the tensile strength obtained from the inverse analysis to the splitting tensile strength was found to be in the range of 0.5–0.9, with an average of 0.7.
Modulus of elasticity is related to the square root of compressive strength and this relationship is independent of age. This conclusion is in line with findings from [16]. Further, the prediction model proposed in the American and Australian codes (Equation (7)) provide a very accurate estimate of the modulus of elasticity even at a concrete age of 18 h. In addition, the model proposed in [14] (Equation (10)) can be used to predict the development of the modulus of elasticity with time from the 28 days modulus of elasticity.
Fracture energy of concrete was determined by carrying out wedge-splitting tests on concrete cubes with the dimension given in Figure 1. Two values of fracture energy were determined, GF and Gf which correspond to the full area under the splitting vs. CMOD curve and the area under the initial post-peak tangent respectively. Data obtained in this study show that GF is approximately equal to (2 Gf). However, this factor appears to be higher for specimens with compressive strength lower than 20 MPa. According to [33], GF is used when the post-peak behavior is of interest in the analysis, while Gf is sufficient for analysis up to peak loads. This has been confirmed in the finite element analysis conducted in this study, where it was found that for wedge-splitting models GF is required to match the post peak tail. On the other hand, for the anchor pull-out modelling, using Gf provides a better match to the experimentally obtained capacity.
Fracture energy values obtained from the wedge-splitting test appear to have a high coefficient of variation, typically as high as 20%. Therefore, when using this method it is recommended to test at least three specimens. The results obtained in this study show a good correlation between fracture energy and the square root of the compressive strength at early age. Furthermore, after analyzing different prediction models identified in literature, the model proposed by [33] can be used to predict fracture energy of concrete at all ages with reasonable accuracy.
Author Contributions
Conceptualization, O.O., E.G., T.P., J.L., and K.A.; methodology, O.O., E.G., T.P., J.L., and K.A.; software, O.O.; validation O.O., E.G., T.P., J.L., and K.A.; formal analysis, O.O.; investigation, O.O., E.G., T.P., J.L., and K.A.; resources, E.G.; data curation, O.O., E.G., T.P., J.L., and K.A.; writing—original draft preparation, O.O.; writing—review and editing, T.P., J.L., and K.A.; visualization, O.O., E.G., T.P., J.L., and K.A.; supervision, E.G., T.P., J.L., and K.A.; project administration, E.G.; funding acquisition, E.G. All authors have read and agreed to the published version of the manuscript.
Funding
This research was funded by Australian Engineered Fasteners and Anchors Council AEFAC.
Acknowledgments
The joint scholarship support provided to the first author by the Iraqi Ministry of Higher Education and Scientific Research and Swinburne University of Technology is greatly appreciated. Authors also acknowledge the valuable assistance provided by the technical staff members of the smart structures laboratory and the engineering workshop at Swinburne University of Technology.
Conflicts of Interest
The authors declare no conflict of interest.
References
- Nilforoush, R. Anchorage in Concrete Structures; Department of Civil, Environmental and Natural Resources Engineering, Lulea University of Technology: Lulea, Sweden, 2017. [Google Scholar]
- Fuchs, W.; Eligehausen, R.; Breen, E.J. Concrete Capacity Design (CCD) Approach for Fastening to Concrete. ACI Struct. J. 1995, 92, 73–94. [Google Scholar]
- Comité Euro-International du Béton. Fastenings to Concrete and Masonry Structures State of the Art Report; Thomas Telford: London, UK, 1994. [Google Scholar]
- Eligehausen, R.; Mallee, R.; Silva, J.F. Anchorage in Concrete Construction, 1st ed.; Wilhelm Ernst & Sohn Verlag fur Architektur und Technische: Berlin, Germany, 2006. [Google Scholar]
- Standards Australia. AS 3600-2009 Concrete Structures; Standards Australia: Sydney, Australia, 2009. [Google Scholar]
- Standards Australia. AS 1012.9 Method of Testing Concrete: Compressive Strength Tests—Concrete, Mortar and Grout Specimens; Standards Australia: Sydney, Australia, 2014. [Google Scholar]
- Standards Australia. AS 1012.10 Methods for Testing Concrete: Determination of Indirect Tensile Strength of Concrete Cylinders (Brazil or Splitting Test); Standards Australia: Sydney, Australia, 2014. [Google Scholar]
- Standards Australia. AS 1012.17 Methods of Testing Concrete: Determination of the Static Chord Modulus of Elasticity and Poisson’s Ratio of Concrete Specimens; Standards Australia: Sydney, Australia, 2014. [Google Scholar]
- Linsbauer, H.N.; Tschegg, E.K. Fracture energy determination of concrete with cube-shaped specimens. Zem. Beton 1986, 31, 38–40. [Google Scholar]
- Brühwiler, E.; Wittmann, F.H. The wedge splitting test, a new method of performing stable fracture mechanics tests. Eng. Fract. Mech. 1990, 35, 117–125. [Google Scholar] [CrossRef]
- Ostergaard, L. Early Age Fracture Mechanics and Cracking of Concrete: Experiments and Modelling; Technical University of Denmark: Lyngby, Denmark, 2003. [Google Scholar]
- Lofgren, I.; Olsen, J.F.; Flansbjer, M. Application of WST—Method for Fracture Testing of Fibre-Reinforced Concrete; Nordic Innovation Centre: Oslo, Norway, 2005. [Google Scholar]
- American Concrete Institute. Prediction of Creep, Shrinkage and Temperature Effects in Concrete Structures; ACI 209R-92; American Concrete Institute: Farmington Hills, MI, USA, 1997. [Google Scholar]
- International Federation for Structural Concrete (fib). Model Code 2010; International Federation for Structural Concrete: Lausanne, Switzerland, 2010. [Google Scholar]
- Mehta, P.K. Concrete: Microstructure, Properties, and Materials, 3rd ed.; McGraw-Hill: New York, NY, USA, 2006. [Google Scholar]
- Oluokun, F.; Burdette, E.; Deatherage, H. Elastic Modulus, Poisson’s Ratio, and Compressive Strength Relationships at Early Ages. ACI Mater. J. 1991, 88, 3–10. [Google Scholar]
- European Committee for Standardization CEN. Eurocode 2: Design of Concrete Structures; CEN: Brussels, Belgium, 2004. [Google Scholar]
- Hanjari, K. Evaluation of WST Method as a Fatigue Test for Plain and Fiber-Reinforced Concrete; Chalmers University of Technology: Goteborg, Sweden, 2006. [Google Scholar]
- Skocek, J. Fracture Propagation in Cementitious Materials; Technical University of Denmark: Lyngby, Denmark, 2010. [Google Scholar]
- Hodicky, K.; Hulin, T.; Schmidt, J.; Stang, H. Wedge Splitting Test on Fracture Behaviour of Fiber Reinforced and Regular High Performance Concretes. In Proceedings of the 13th International Conference on Fracture, Beijing, China, 16–21 June 2013. [Google Scholar]
- Abdalla, H.; Karihaloo, B. A method for constructing the bilinear tension softening diagram of concrete corresponding to its true fracture energy. Mag. Concr. Res. 2004, 56, 597–604. [Google Scholar] [CrossRef]
- Polies, W. Identification of Concrete Fracture Parameters Using Digital Image Correlation and Inverse Analysis; University of Wndsor: Windsor, ON, Canada, 2013. [Google Scholar]
- Li, Z. Advanced Concrete Technology; John Wiley & Sons: Hoboken, NJ, USA, 2011. [Google Scholar]
- Tang, T. Effects of load distributed width on split tension of unnotched and notched cylindrical specimens. J. Test. Eval. 1994, 22, 401–409. [Google Scholar]
- American Concrete Institute. Building code requirements for structural concrete (ACI 318-14 metric) and commentary. In ACI 318-11 (Metric); American Concrete Institute: Farmington Hills, MI, USA, 2014. [Google Scholar]
- Oluokun, F.A.; Burdette, E.G.; Deatherage, J.H. Splitting Tensile Strength and Compressive Strength Relationships at Early Ages. Mater. J. 1991, 88, 115–121. [Google Scholar]
- Ros, S.; Shima, H. Relationship between splitting tensile strength and compressive strength of concrete at early age with different types of cements and curing temperature histories. Concrete Inst. Proc. 2013, 35, 427–432. [Google Scholar]
- Chhorn, C.; Hong, S.J.; Lee, S.W. Relationship between compressive and tensile strengths of roller-compacted concrete. J. Traffic Transp. Eng. 2018, 5, 215–223. [Google Scholar] [CrossRef]
- Carino, N.J.; Lew, H.S. Re-examination of the Relation Between Splitting Tensile andCompressive Strength of Normal Weight Concrete. ACI J. 1982, 79, 214–219. [Google Scholar]
- Raphael, J.M. Tensile Strength of Concrete. ACI J. 1984, 81, 158–165. [Google Scholar]
- Gardner, N.J.; Sau, P.L.; Cheung, M.S. Strength Development and Durability of Concretes Cast and Cured at 0 C. Mater. J. 1988, 85, 529–536. [Google Scholar]
- Herdholdt, A.; Justesen, C.; Nepper-Chrostensen, P.; Nielsen, A. Beton-Bogen, 2nd ed.; Aalborg Portland: Aalborg, Denmark, 1985. [Google Scholar]
- Bažant, Z.P.; Becq-Giraudon, E. Statistical prediction of fracture parameters of concrete and implications for choice of testing standard. Cem. Concr. Res. 2002, 32, 529–556. [Google Scholar] [CrossRef]
- Phillips, D.V.; Zhang, B. Direct tension tests on notched and un-notched plain concrete specimens. Mag. Concr. Res. 1993, 45, 25–35. [Google Scholar] [CrossRef]
- Comité Euro-International du Béton; Fédération Internationale de la Précontrainte. CEB-FIP Model Code 1990 Design Code; Thomas Telford: London, UK, 1993. [Google Scholar]
- Hordijk, A. Local Approach to Fatigue of Concrete; Delft University of Technology: Delft, The Netherlands, 1991. [Google Scholar]
- Červenka, V.; Jendele, L.; Červenka, J. ATENA Program Documentation: Theory; Červenka Consulting: Prague, Czech Republic, 2017. [Google Scholar]
- Bazant, Z.P.; Oh, B. Crack Band Theory for Fracture of Concrete. Mater. Struct. 1983, 16, 155–177. [Google Scholar]
- Bui, T.T.; Limam, A.; Nana, W.S.A.; Arrieta, B.; Roure, T. Cast-in-place Headed Anchor Groups Under Shear: Experimental and Numerical Modelling. Structures 2018, 14, 178–196. [Google Scholar] [CrossRef]
- Poveda, E.; Ortega, J.J.; Ruiz, G.; Porras, R.; Carmona, J.R. Normal and tangential extraction of embedded anchor plates from precast façade concrete panels. Eng. Struct. 2016, 110, 21–35. [Google Scholar] [CrossRef]
- Barnat, J. Analysis of Bonded Anchor in Combined Concrete-Bond Failure Mode. In Recent Researches in Geography Geology Energy Environment and Biomedicine; WSEAS: Stevens Point, WI, USA, 2011. [Google Scholar]
Figure 1.
Geometry of the wedge-splitting test specimen.

Figure 2.
Wedge-splitting test setup.

Figure 3.
Compressive strength development with time, experimental vs. prediction models.

Figure 4.
Modulus of elasticity as a function of the compressive strength, experimental data of specimens <7 days vs. prediction models.
Figure 4.
Modulus of elasticity as a function of the compressive strength, experimental data of specimens <7 days vs. prediction models.

Figure 5.
Modulus of elasticity development with time, experimental vs. prediction models.

Figure 6.
Splitting tensile strength as a function of the compressive strength, experimental data <7 days vs. prediction models from literature.
Figure 6.
Splitting tensile strength as a function of the compressive strength, experimental data <7 days vs. prediction models from literature.

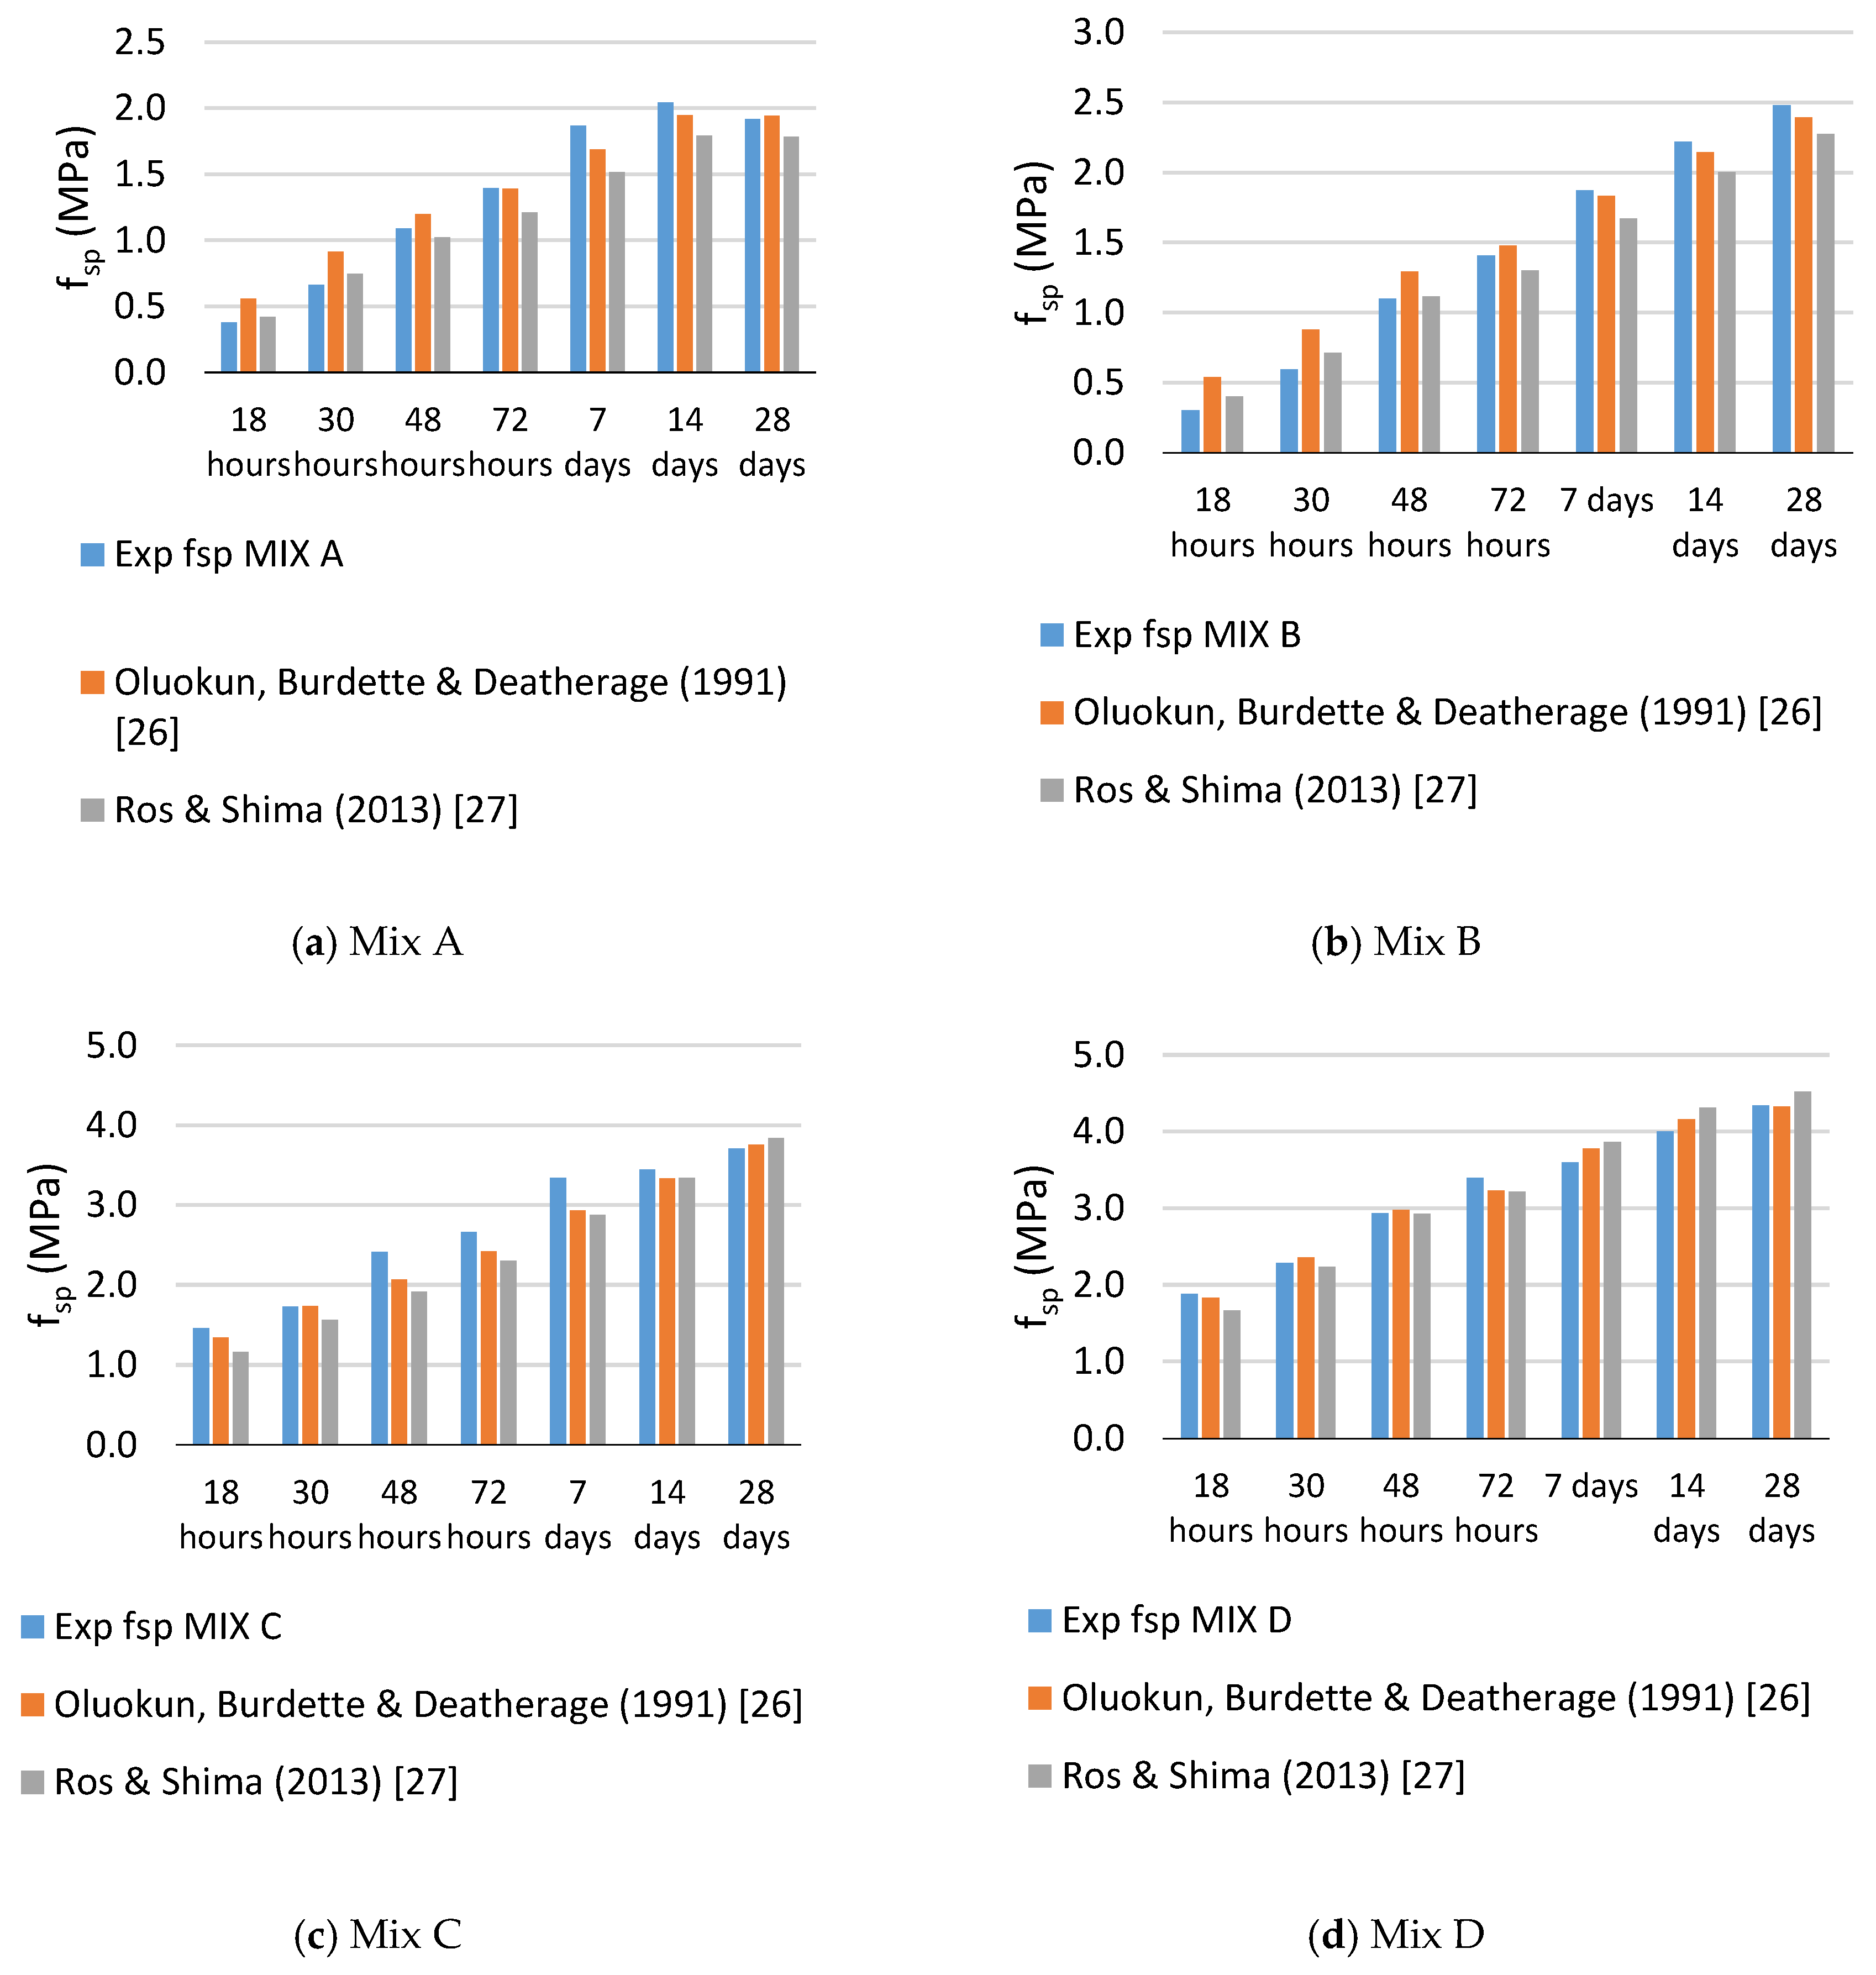
Figure 7.
Splitting tensile strength development with time, experimental vs. prediction models, for mixes A, B, C, and D respectively.
Figure 7.
Splitting tensile strength development with time, experimental vs. prediction models, for mixes A, B, C, and D respectively.

Figure 8.
Ratio of the tensile strength obtained from the inverse analysis to the splitting tensile strength.
Figure 8.
Ratio of the tensile strength obtained from the inverse analysis to the splitting tensile strength.

Figure 9.
Graphical presentation of the values of fracture energy reproduced from [33].
Figure 9.
Graphical presentation of the values of fracture energy reproduced from [33].

Figure 10.
GF vs. square root of the compressive strength for specimens tested within 7 days after casting.
Figure 10.
GF vs. square root of the compressive strength for specimens tested within 7 days after casting.

Figure 11.
Experimentally obtained values of fracture energy GF vs. prediction models identified in literature.
Figure 11.
Experimentally obtained values of fracture energy GF vs. prediction models identified in literature.

Figure 12.
Experimentally obtained values of fracture energy GF for the four mixes tested vs. prediction by [33] at different ages. For mixes A, B, C, and D respectively.
Figure 12.
Experimentally obtained values of fracture energy GF for the four mixes tested vs. prediction by [33] at different ages. For mixes A, B, C, and D respectively.

Figure 13.
GF vs. Gf Experimental data.

Figure 14.
Ratio of GF and Gf vs. concrete compressive strength.

Figure 15.
Wedge split test finite element geometry and boundary conditions.

Figure 16.
Characteristic length and tension softening behavior of the concrete model reproduced from [37].
Figure 16.
Characteristic length and tension softening behavior of the concrete model reproduced from [37].

Figure 17.
Compressive behavior of the concrete model reproduced from [37].
Figure 17.
Compressive behavior of the concrete model reproduced from [37].

Figure 18.
Wedge split test crack profile (experimental vs. FE model).

Figure 19.
Load vs. displacement curves for the wedge split test (experimental, FE, and inverse analysis).
Figure 19.
Load vs. displacement curves for the wedge split test (experimental, FE, and inverse analysis).


Figure 20.
Anchor geometry and FE model discretization.

Figure 21.
Load vs. displacement curves A to D left to right, FE (red) vs. experimental behavior (black).
Figure 21.
Load vs. displacement curves A to D left to right, FE (red) vs. experimental behavior (black).

Figure 22.
Typical pull-out failure mode observed schematically, experimentally, and numerically. Color contour shows displacement in the z direction.
Figure 22.
Typical pull-out failure mode observed schematically, experimentally, and numerically. Color contour shows displacement in the z direction.

Figure 23.
Anchor D, combined failure mode observed numerically. Color contour shows displacement in the z direction.
Figure 23.
Anchor D, combined failure mode observed numerically. Color contour shows displacement in the z direction.


Table 1.
Concrete mix design summary.
| Mix ID | Grade | GP Cement (kg) | Aggregates (kg) | Manufactured Sand (kg) | Sand (kg) | Nominal Water (lt) | Water Reducing Agent (ml) | w/c |
|---|---|---|---|---|---|---|---|---|
| A | N20 | 217 | 925 | 195 | 787 | 179 | 760 | 0.82 |
| B | N25 | 255 | 938 | 188 | 756 | 174 | 893 | 0.68 |
| C | N32 | 325 | 967 | 129 | 738 | 175 | 1138 | 0.54 |
| D | N40 | 443 | 956 | 36 | 697 | 183 | 1551 | 0.41 |
Table 2.
Mix A results summary.
| Age | fcm (MPa) | COV | fsp (MPa) | COV | GF (N/m) | COV | Ec (MPa) | COV | ν |
|---|---|---|---|---|---|---|---|---|---|
| 18 h | 2.5 | 1.9% | 0.40 | 3.6% | 24 | / | 6669 | 7.0% | 0.15 |
| 30 h | 5.2 | 3.3% | 0.70 | 5.6% | 34 | / | 11,924 | 7.9% | 0.17 |
| 48 h | 7.7 | 2.6% | 1.15 | 2.5% | 41 | / | 15,277 | 6.1% | 0.18 |
| 72 h | 9.5 | 1.2% | 1.47 | 14.6% | 49 | / | 15,510 | 11.1% | 0.16 |
| 7 d | 12.6 | 11.6% | 1.97 | 3.7% | 54 | / | 17,567 | / | 0.17 |
| 14 d | 15.5 | 1.5% | 2.15 | 6.5% | 80 | / | 18,797 | 1.2% | 0.19 |
| 28 d | 15.4 | 3.9% | 2.02 | 4.2% | 108 | 7.5% | 20,420 | 3.7% | 0.19 |
Table 3.
Mix B results summary.
| Age | fcm (MPa) | COV | fsp (MPa) | COV | GF (N/m) | COV | Ec (MPa) | COV | ν |
|---|---|---|---|---|---|---|---|---|---|
| 18 h | 2.40 | 5.0% | 0.32 | 3.2% | 26 | 13.3% | 6947 | 14.2% | 0.16 |
| 30 h | 4.89 | 3.1% | 0.63 | 9.6% | 49 | 18.5% | 10,188 | 6.1% | 0.21 |
| 48 h | 8.56 | 0.5% | 1.16 | 2.3% | 60 | / | 12,132 | 4.6% | 0.17 |
| 72 h | 10.39 | 1.8% | 1.48 | 4.9% | 61 | / | 13,878 | 9.3% | 0.18 |
| 7 d | 14.20 | 3.2% | 1.97 | 3.3% | 74 | 4.2% | 15,650 | 6.7% | 0.18 |
| 14 d | 17.81 | 5.6% | 2.34 | 9.4% | 100 | / | 15,664 | 2.6% | 0.18 |
| 28 d | 20.89 | 1.9% | 2.61 | 8.3% | 118 | 13.6% | 18,639 | 2.0% | 0.21 |
Table 4.
Mix C results summary.
| Age | fcm (MPa) | COV | fsp (MPa) | COV | GF (N/m) | COV | Ec (MPa) | COV | ν |
|---|---|---|---|---|---|---|---|---|---|
| 18 h | 9.00 | 7.3% | 1.53 | 6.2% | 83 | 20.8% | 13,811 | 7.2% | 0.22 |
| 30 h | 13.04 | 5.2% | 1.82 | 6.5% | 83 | 12.4% | 16,953 | 2.2% | 0.20 |
| 48 h | 16.82 | 7.3% | 2.54 | 1.7% | 94 | 27.1% | 20,985 | 3.4% | 0.22 |
| 72 h | 21.20 | 3.4% | 2.80 | 7.2% | 109 | / | 23,249 | 10.6% | 0.23 |
| 7 d | 28.02 | 9.1% | 3.52 | 0.4% | 117 | 16.0% | 22,650 | 5.9% | 0.20 |
| 14 d | 33.76 | 4.8% | 3.62 | 7.0% | 119 | 4.3% | 27,301 | 5.6% | 0.24 |
| 28 d | 40.14 | 1.0% | 3.90 | 8.5% | 121 | / | 26,768 | 1.8% | 0.23 |
Table 5.
Mix D results summary.
| Age | fcm (MPa) | COV | fsp (MPa) | COV | GF (N/m) | COV | Ec (MPa) | COV | ν |
|---|---|---|---|---|---|---|---|---|---|
| 18 h | 14.14 | 7.3% | 1.97 | 6.0% | 78 | / | 16,987 | 11.3% | 0.18 |
| 30 h | 20.37 | 5.9% | 2.40 | 9.7% | 77 | 15.7% | 20,393 | 3.0% | 0.18 |
| 48 h | 28.64 | 1.2% | 3.09 | 9.7% | 90 | / | 25,786 | 6.4% | 0.19 |
| 72 h | 32.19 | 7.8% | 3.57 | 7.7% | 89 | 18.5% | 26,998 | 4.6% | 0.19 |
| 7 d | 40.48 | 3.9% | 3.79 | 2.3% | 103 | 8.0% | 27,561 | 3.2% | 0.20 |
| 14 d | 46.46 | 2.0% | 4.21 | 3.3% | 119 | / | 29,834 | 1.5% | 0.21 |
| 28 d | 49.26 | 4.8% | 4.57 | 3.6% | 114 | 11.2% | 31,853 | 21.0% | 0.22 |
Table 6.
Modulus of elasticity development with time prediction models.
| Reference | Model | |
|---|---|---|
| [17] | Ec(t) = (fc(t) ⁄ fc(28))0.3·Ec(28) | (9) |
| [14] | Ec(t) = βE(t)·Ec(28) | (10) |
| βE(t) = [βcc (t)]0.5 | (11) | |
| βcc (t) = exp{0.25[1 − (28/t)(1/2)]} | (12) |
Table 7.
Relationship between splitting tensile strength and compressive strength [28].
Table 7.
Relationship between splitting tensile strength and compressive strength [28].
| Reference | Model |
|---|---|
| [25] | fsp = 0.56(fc)0.5 |
| [26] | fsp = 0.294(fc)0.69 |
| [27] | fsp = 0.2(fc)0.8 |
| [29] | fsp = 0.272(fc)0.71 |
| [14] | fsp = 0.3(fc)2/3 |
| [30] | fsp = 0.313(fc)2/3 |
| [31] | fsp = 0.47(fc)0.59 |
Table 8.
Summary of inverse analysis results.
| Age | MIX A | MIX B | MIX C | MIX D | ||||
|---|---|---|---|---|---|---|---|---|
| ft inv (MPa) | ft inv/fsp | ft inv (MPa) | ft inv/fsp | ft inv (MPa) | ft inv/fsp | ft inv (MPa) | ft inv/fsp | |
| 18 h | 0.27 | 0.7 | 0.35 | 1.2 | 0.93 | 0.6 | 1.44 | 0.8 |
| 30 h | 0.48 | 0.7 | 0.57 | 1.0 | 1.54 | 0.9 | 1.66 | 0.7 |
| 48 h | 0.75 | 0.7 | 0.83 | 0.8 | 1.86 | 0.8 | 1.83 | 0.6 |
| 72 h | 0.60 | 0.4 | 1.00 | 0.7 | 2.07 | 0.8 | 1.98 | 0.6 |
| 7 d | 0.87 | 0.5 | 1.32 | 0.7 | 2.26 | 0.7 | 2.16 | 0.6 |
| 14 d | 0.95 | 0.5 | 1.47 | 0.7 | 2.52 | 0.7 | 2.11 | 0.5 |
| 28 d | 1.25 | 0.7 | 1.49 | 0.6 | 2.70 | 0.7 | 2.51 | 0.6 |
Table 9.
Summary of fracture energy values from the wedge split test.
| Age | Mix A | Mix B | Mix C | Mix D | ||||||||
|---|---|---|---|---|---|---|---|---|---|---|---|---|
| GF N/m | Gf N/m | GF/Gf | GF N/m | Gf N/m | GF/Gf | GF N/m | Gf N/m | GF/Gf | GF N/m | Gf N/m | GF/Gf | |
| 18 h | 24 | 7 | 3.36 | 26 | 6 | 4.04 | 83 | 21 | 4.02 | 78 | 41 | 1.91 |
| 30 h | 34 | 9 | 3.59 | 49 | 15 | 3.22 | 83 | 29 | 2.90 | 77 | 37 | 2.09 |
| 48 h | 41 | 13 | 3.08 | 60 | 18 | 3.38 | 94 | 31 | 3.03 | 90 | 47 | 1.93 |
| 72 h | 49 | 17 | 2.80 | 61 | 20 | 3.00 | 109 | 50 | 2.18 | 89 | 44 | 2.04 |
| 7 d | 54 | 54 | 1.00 | 74 | 29 | 2.58 | 117 | 52 | 2.27 | 103 | 54 | 1.91 |
| 14 d | 80 | 30 | 2.64 | 100 | 35 | 2.84 | 119 | 57 | 2.08 | 119 | 57 | 2.10 |
| 28 d | 108 | 47 | 2.32 | 118 | 43 | 2.74 | 121 | 64 | 1.90 | 114 | 62 | 1.82 |
Table 10.
Fracture energy prediction models identified in literature.
| Model | Reference |
|---|---|
| GF = 43.2 + 1.13 fcu | [34] |
| GF = Gfo (fcm/10)0.7 | * [35] |
| GF = 73fc0.18 | [14] |
| GF = 2.5 ∝0 (f’c/0.051)0.46 (1 + da/11.27) 0.22 (w/c)−0.30 | ** [33] |
* Gfo = 25, 30, 58 for aggregate size of 8, 16, 32 respectively. ** ∝0 = 1, 1.44 for rounded and crushed aggregates respectively.
Table 11.
Summary of concrete material properties for each anchor set tested.
| Specimen | Age (Hours) | fcm (MPa) | ft (MPa) | E (MPa) | Gf (N/m) |
|---|---|---|---|---|---|
| A | 43 | 7 | 0.72 | 11,941 | 25.85 |
| B | 91.5 | 11.2 | 1.0 | 14,292 | 35.8 |
| C | 166 | 14.2 | 1.17 | 15,400 | 42.15 |
| D | 334 | 17.8 | 1.37 | 16,610 | 49.25 |
Table 12.
Summary of the finite element analysis results.
| Label | Nu.test (kN) | δtest (mm) | Nu.FE (kN) | δFE (mm) | Nu.FE/Nu.test | δFE/δtest | Failure Mode |
|---|---|---|---|---|---|---|---|
| A | 11.78 | 0.64 | 12.6 | 0.41 | 1.07 | 0.64 | Plug (P-O) |
| B | 14.42 | 0.55 | 13.7 | 0.28 | 0.95 | 0.51 | Plug (P-O) |
| C | 16.14 | 0.54 | 17.9 | 0.39 | 1.11 | 0.72 | Plug (P-O) |
| D | 22.01 | 0.73 | 25.1 | 0.53 | 1.14 | 0.73 | Plug (P-O) |
Publisher’s Note: MDPI stays neutral with regard to jurisdictional claims in published maps and institutional affiliations. |
© 2020 by the authors. Licensee MDPI, Basel, Switzerland. This article is an open access article distributed under the terms and conditions of the Creative Commons Attribution (CC BY) license (http://creativecommons.org/licenses/by/4.0/).
Share and Cite
MDPI and ACS Style
Obayes, O.; Gad, E.; Pokharel, T.; Lee, J.; Abdouka, K. Evaluation of Concrete Material Properties at Early Age. CivilEng 2020, 1, 326-350. https://0-doi-org.brum.beds.ac.uk/10.3390/civileng1030021
AMA Style
Obayes O, Gad E, Pokharel T, Lee J, Abdouka K. Evaluation of Concrete Material Properties at Early Age. CivilEng. 2020; 1(3):326-350. https://0-doi-org.brum.beds.ac.uk/10.3390/civileng1030021
Chicago/Turabian StyleObayes, Osamah, Emad Gad, Tilak Pokharel, Jessey Lee, and Kamiran Abdouka. 2020. "Evaluation of Concrete Material Properties at Early Age" CivilEng 1, no. 3: 326-350. https://0-doi-org.brum.beds.ac.uk/10.3390/civileng1030021