
Experimental Study on the Reliability of Scaling Down Techniques Used in Direct Shear Tests to Determine the Shear Strength of Rockfill and Waste Rocks


Abstract
:1. Introduction
2. Laboratory Tests
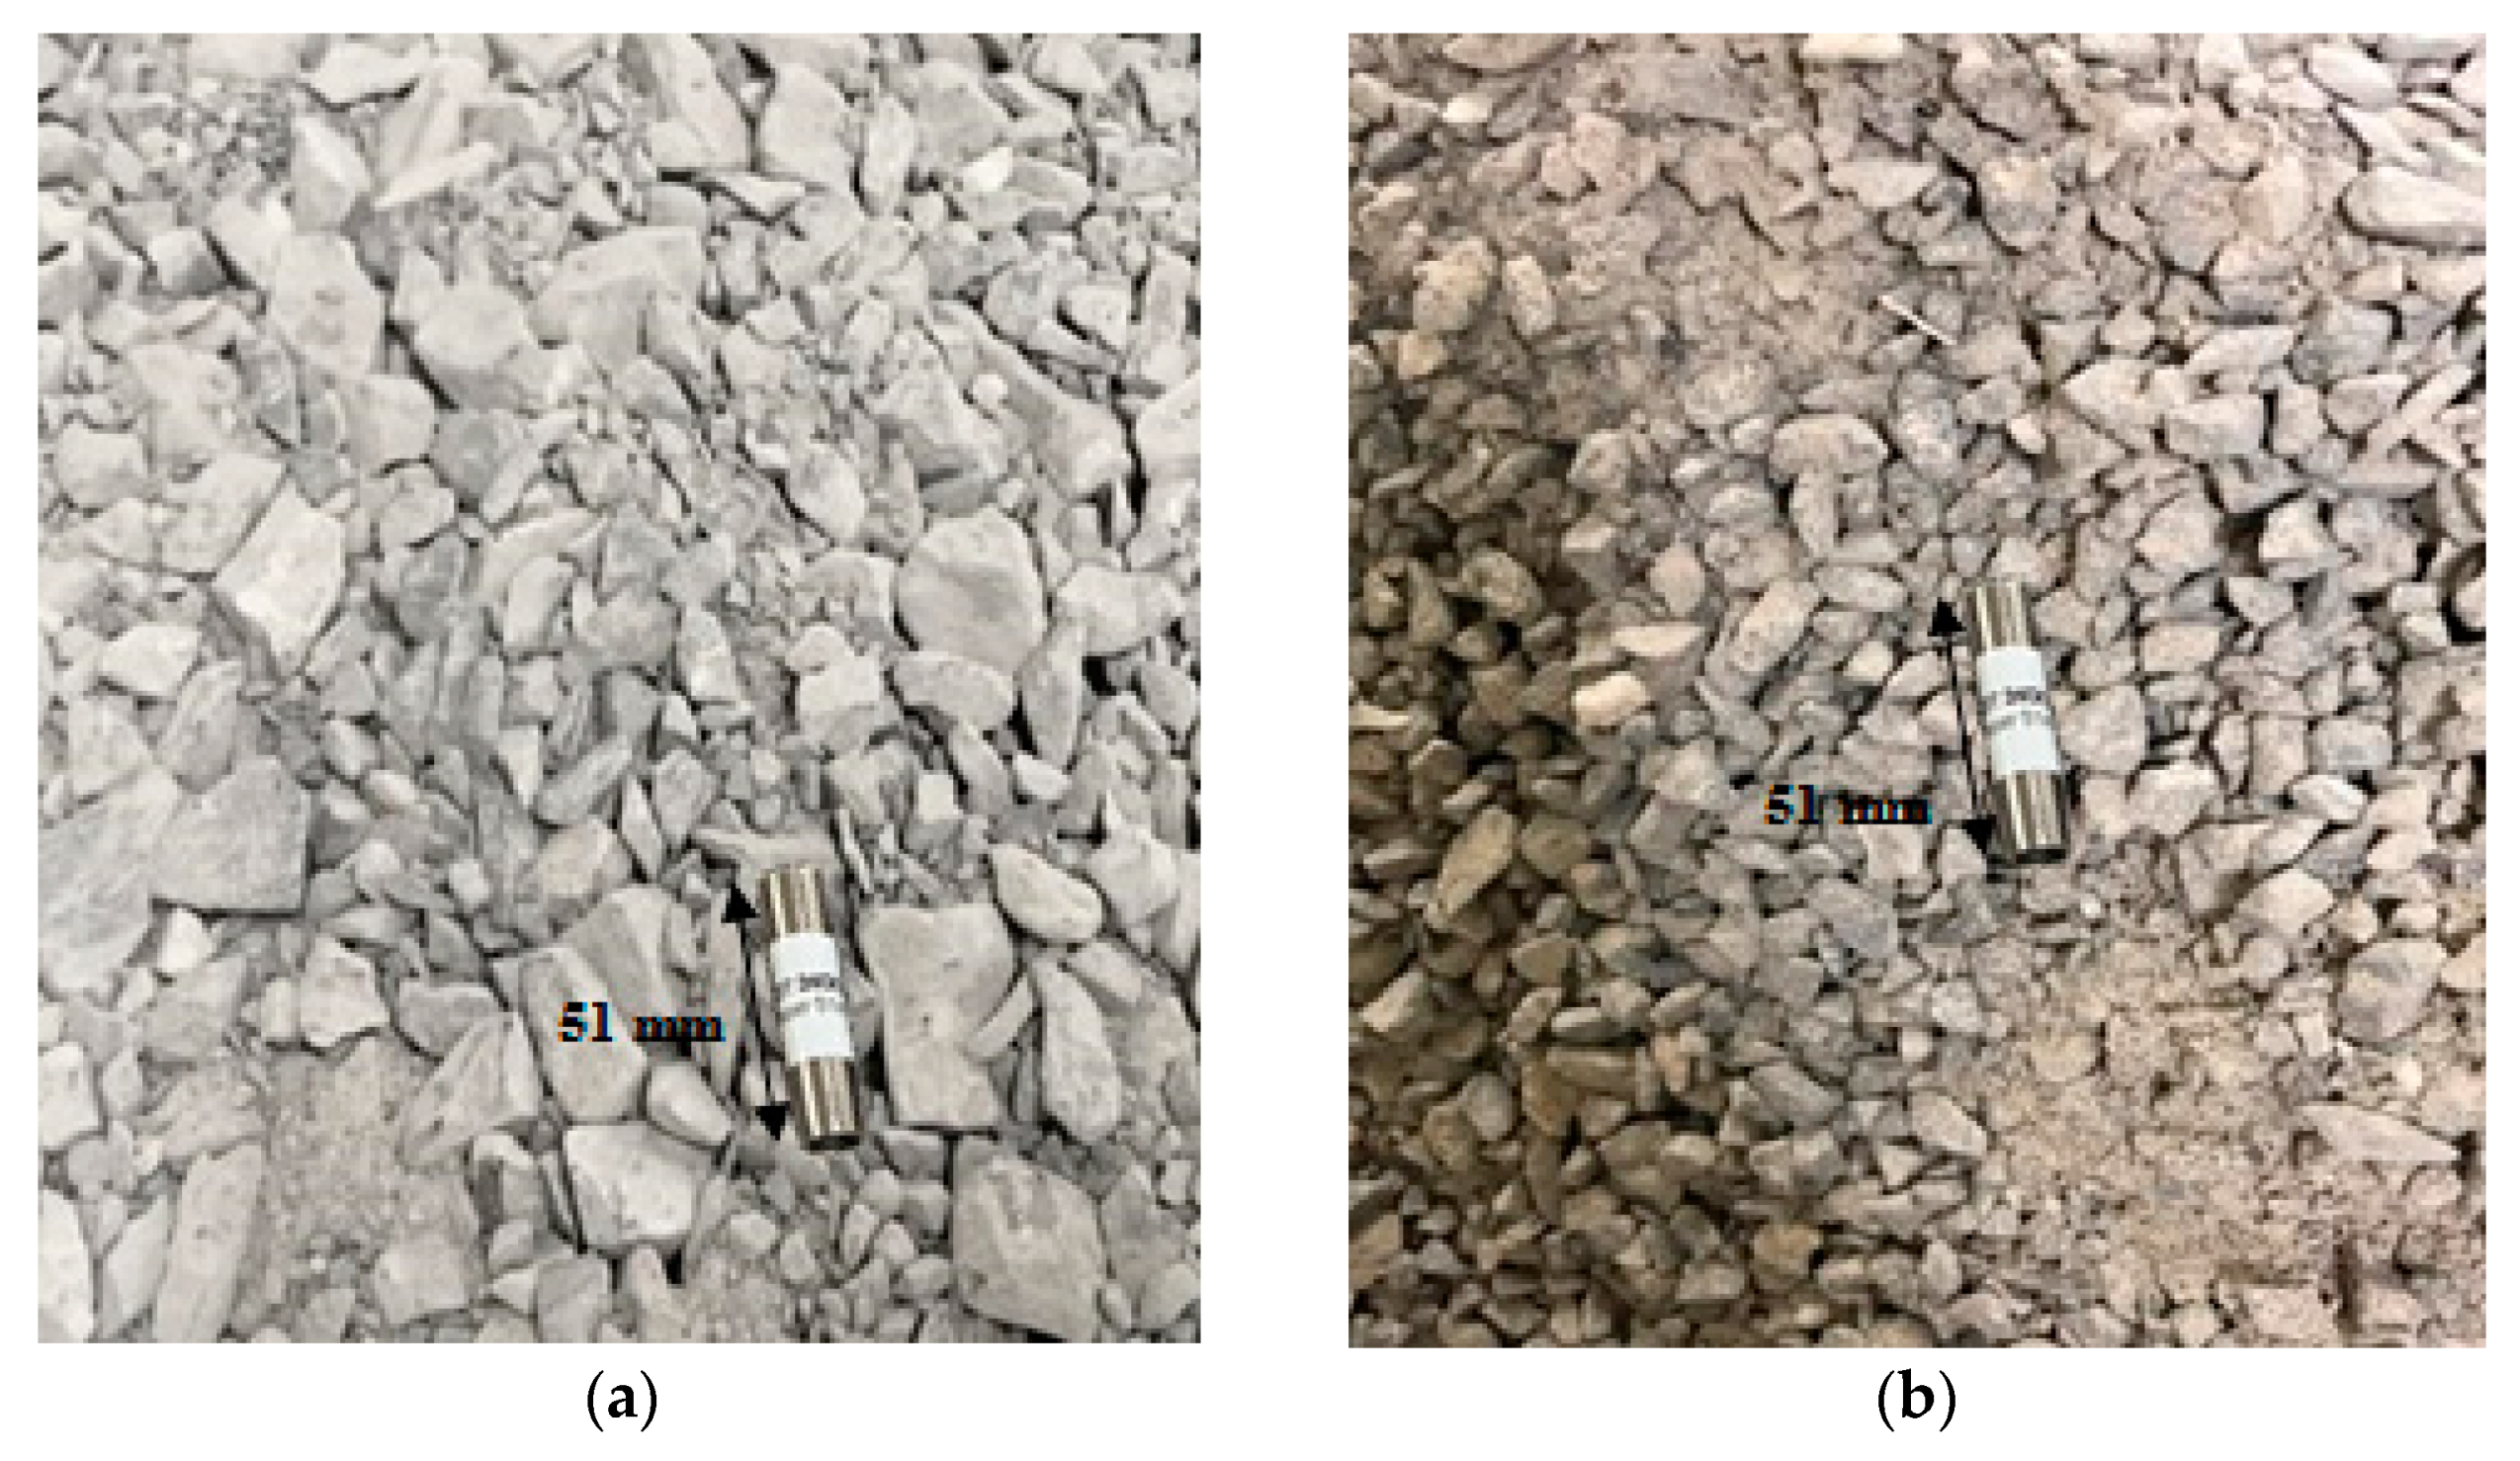
2.1. Testing Materials
2.2. Direct Shear Tests
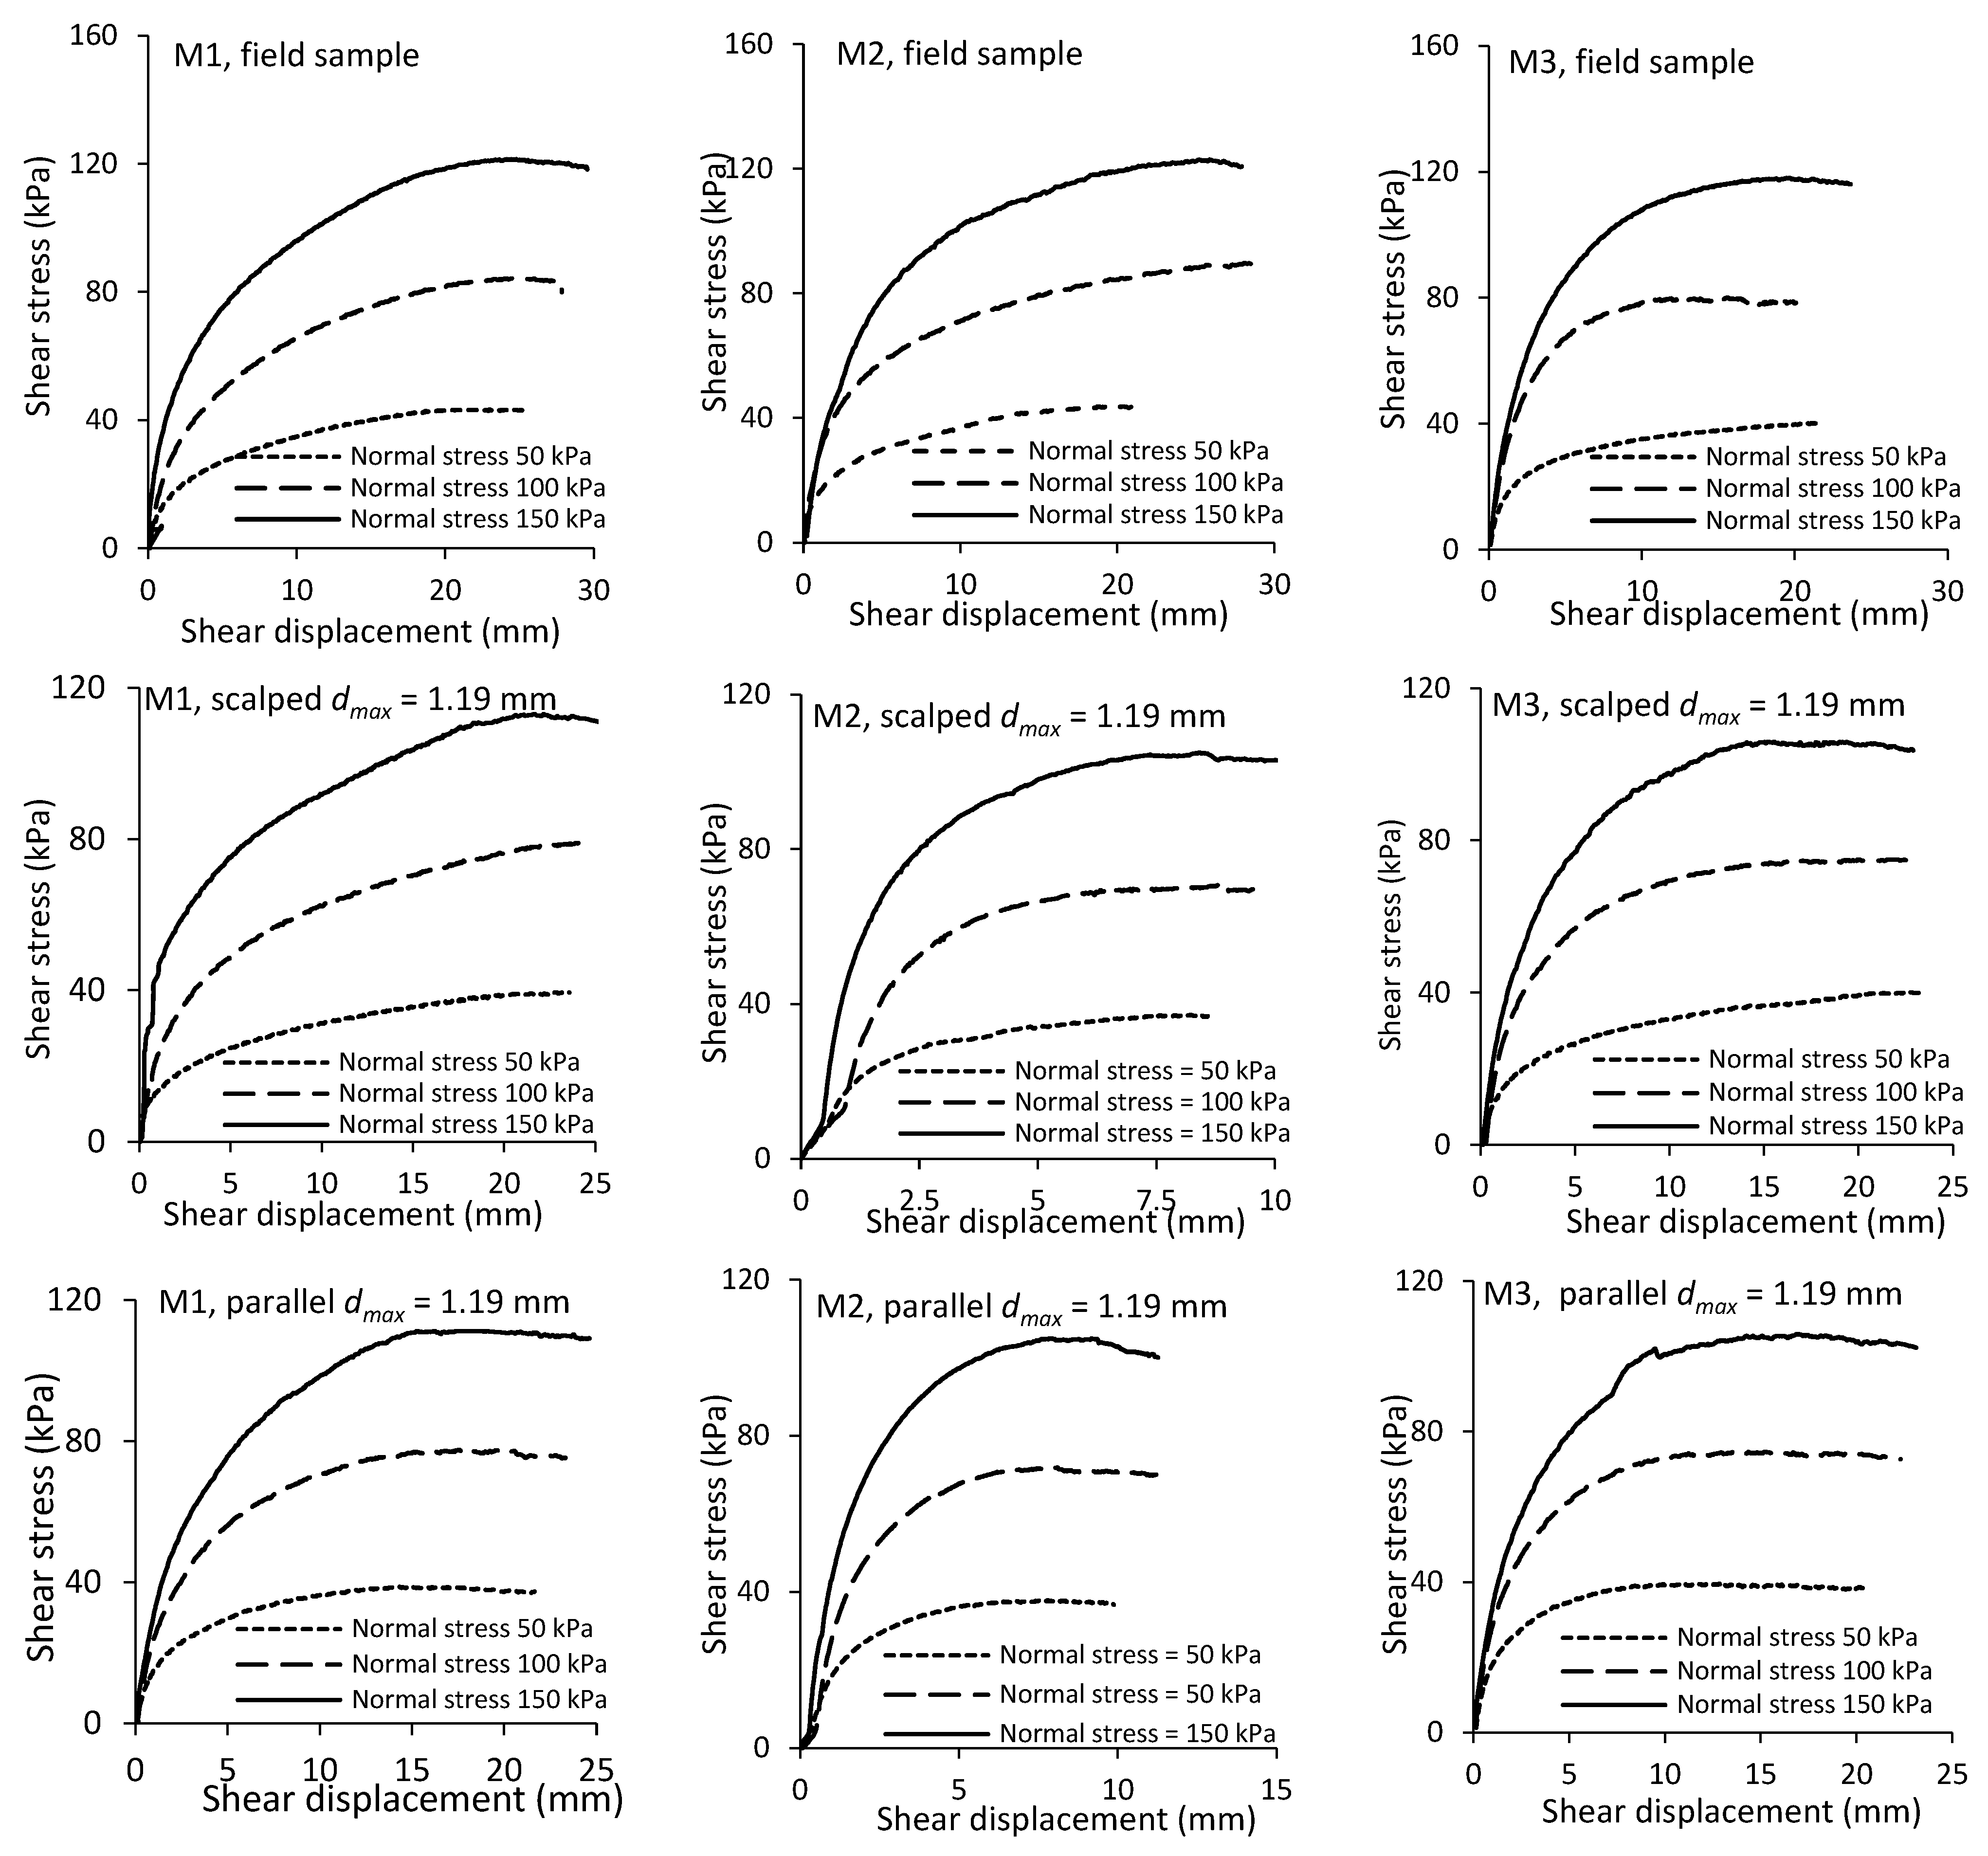
2.3. Experimental Results
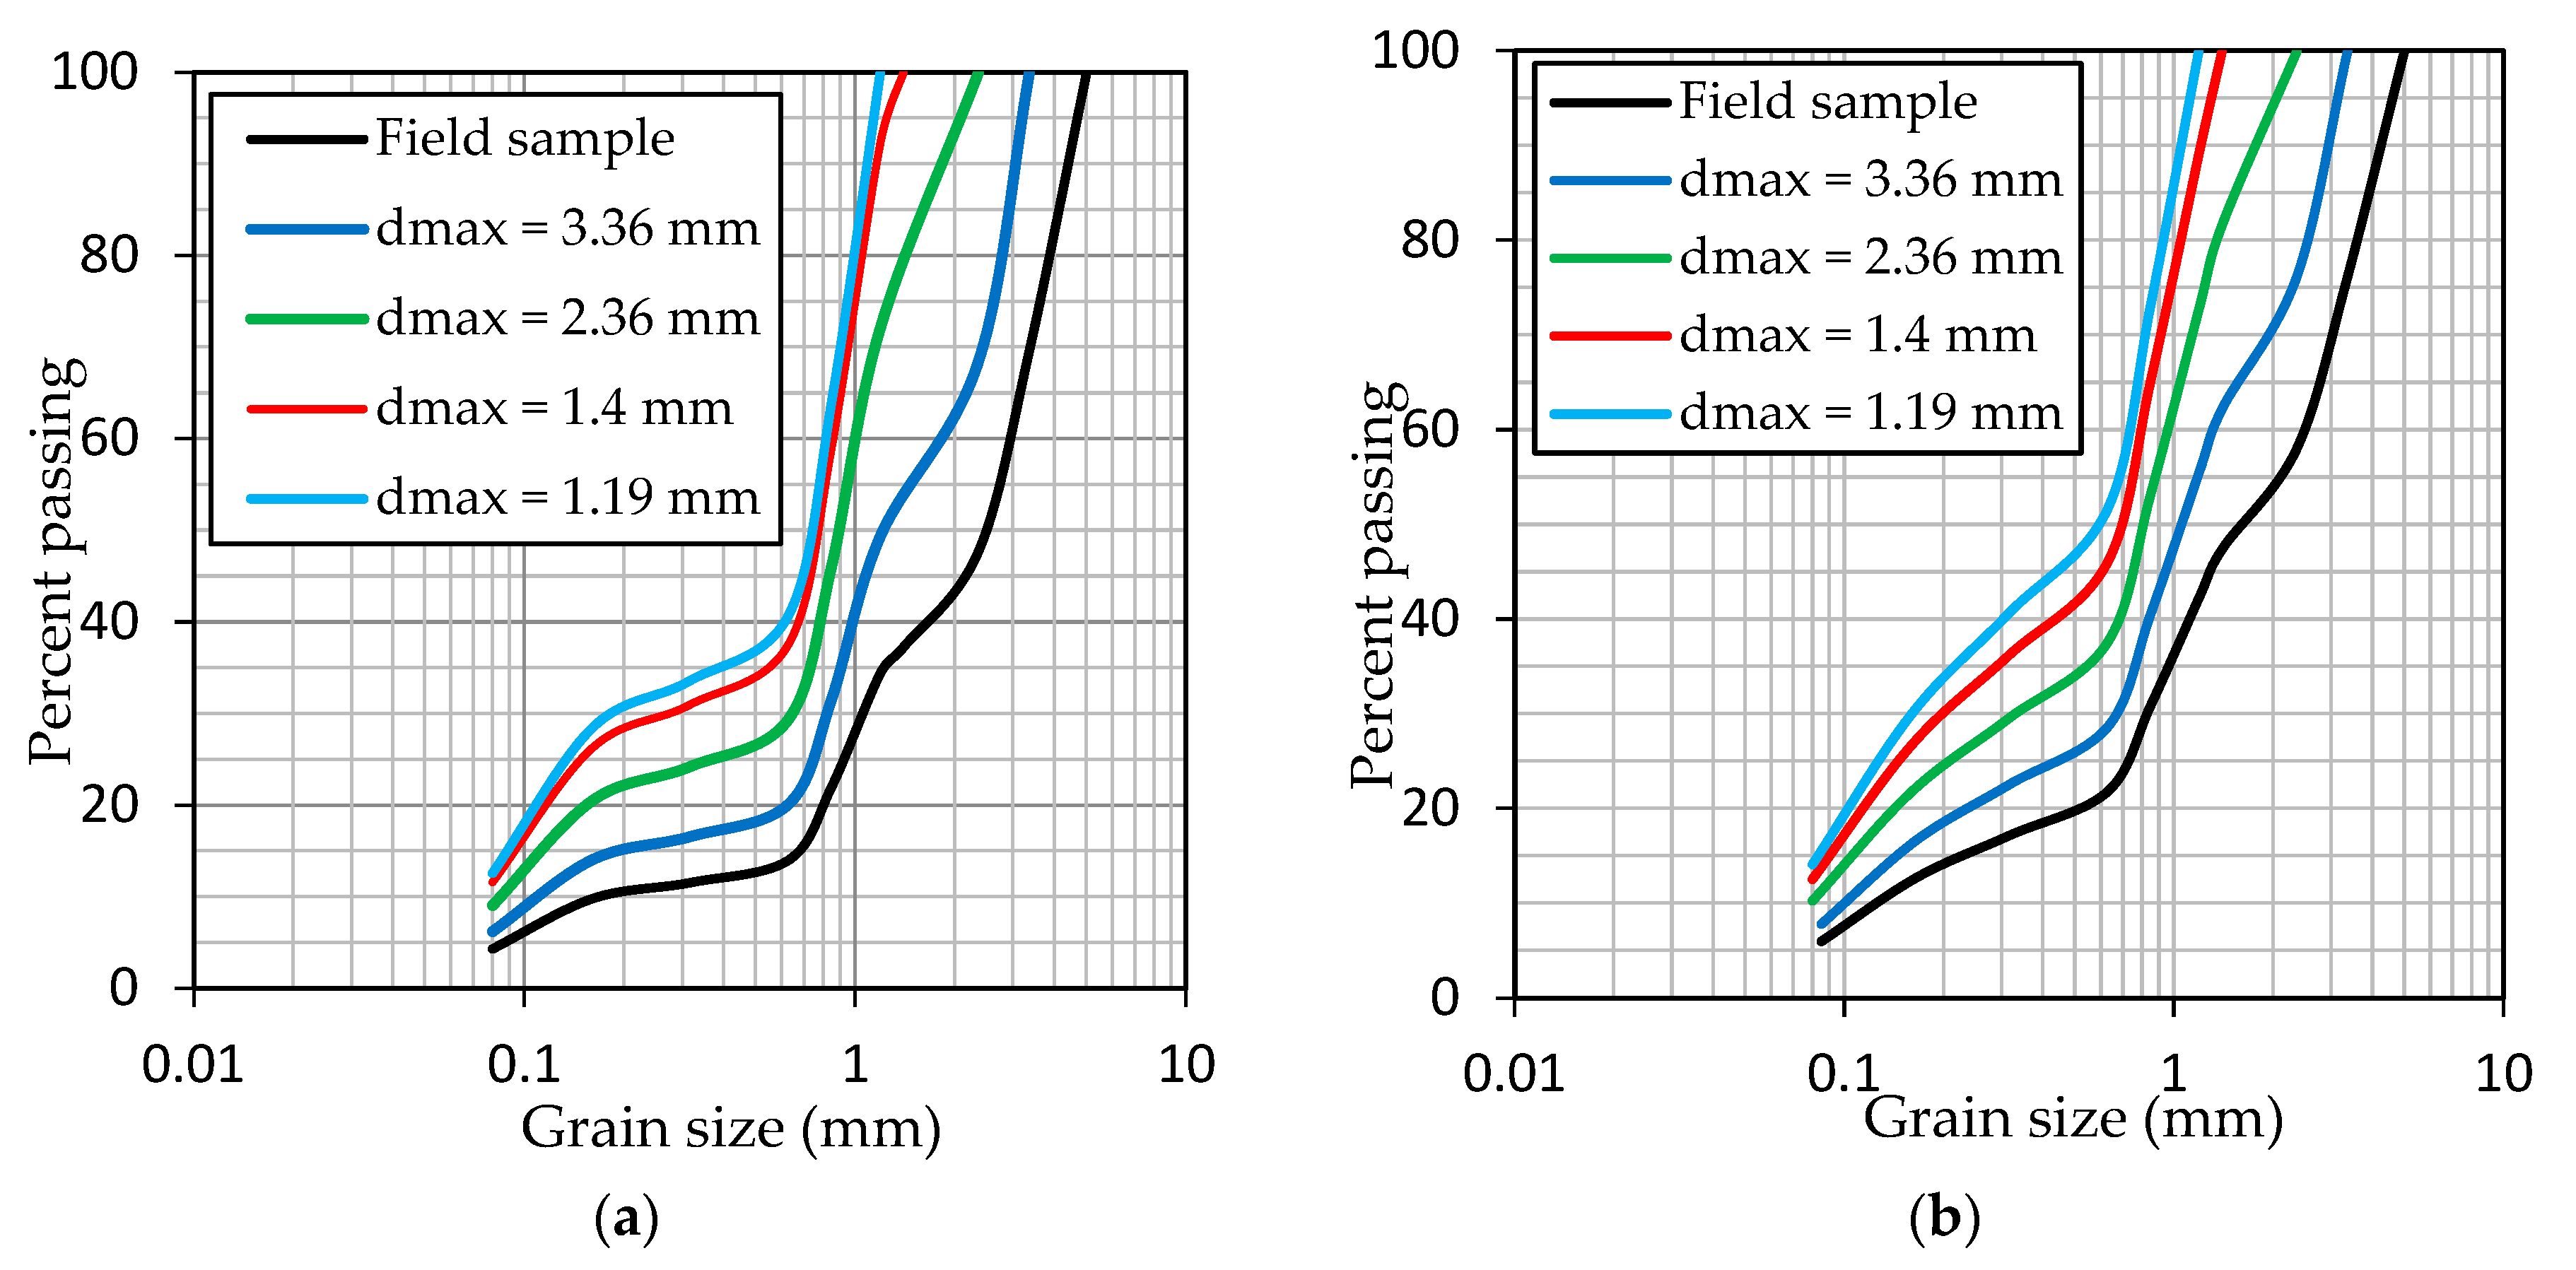
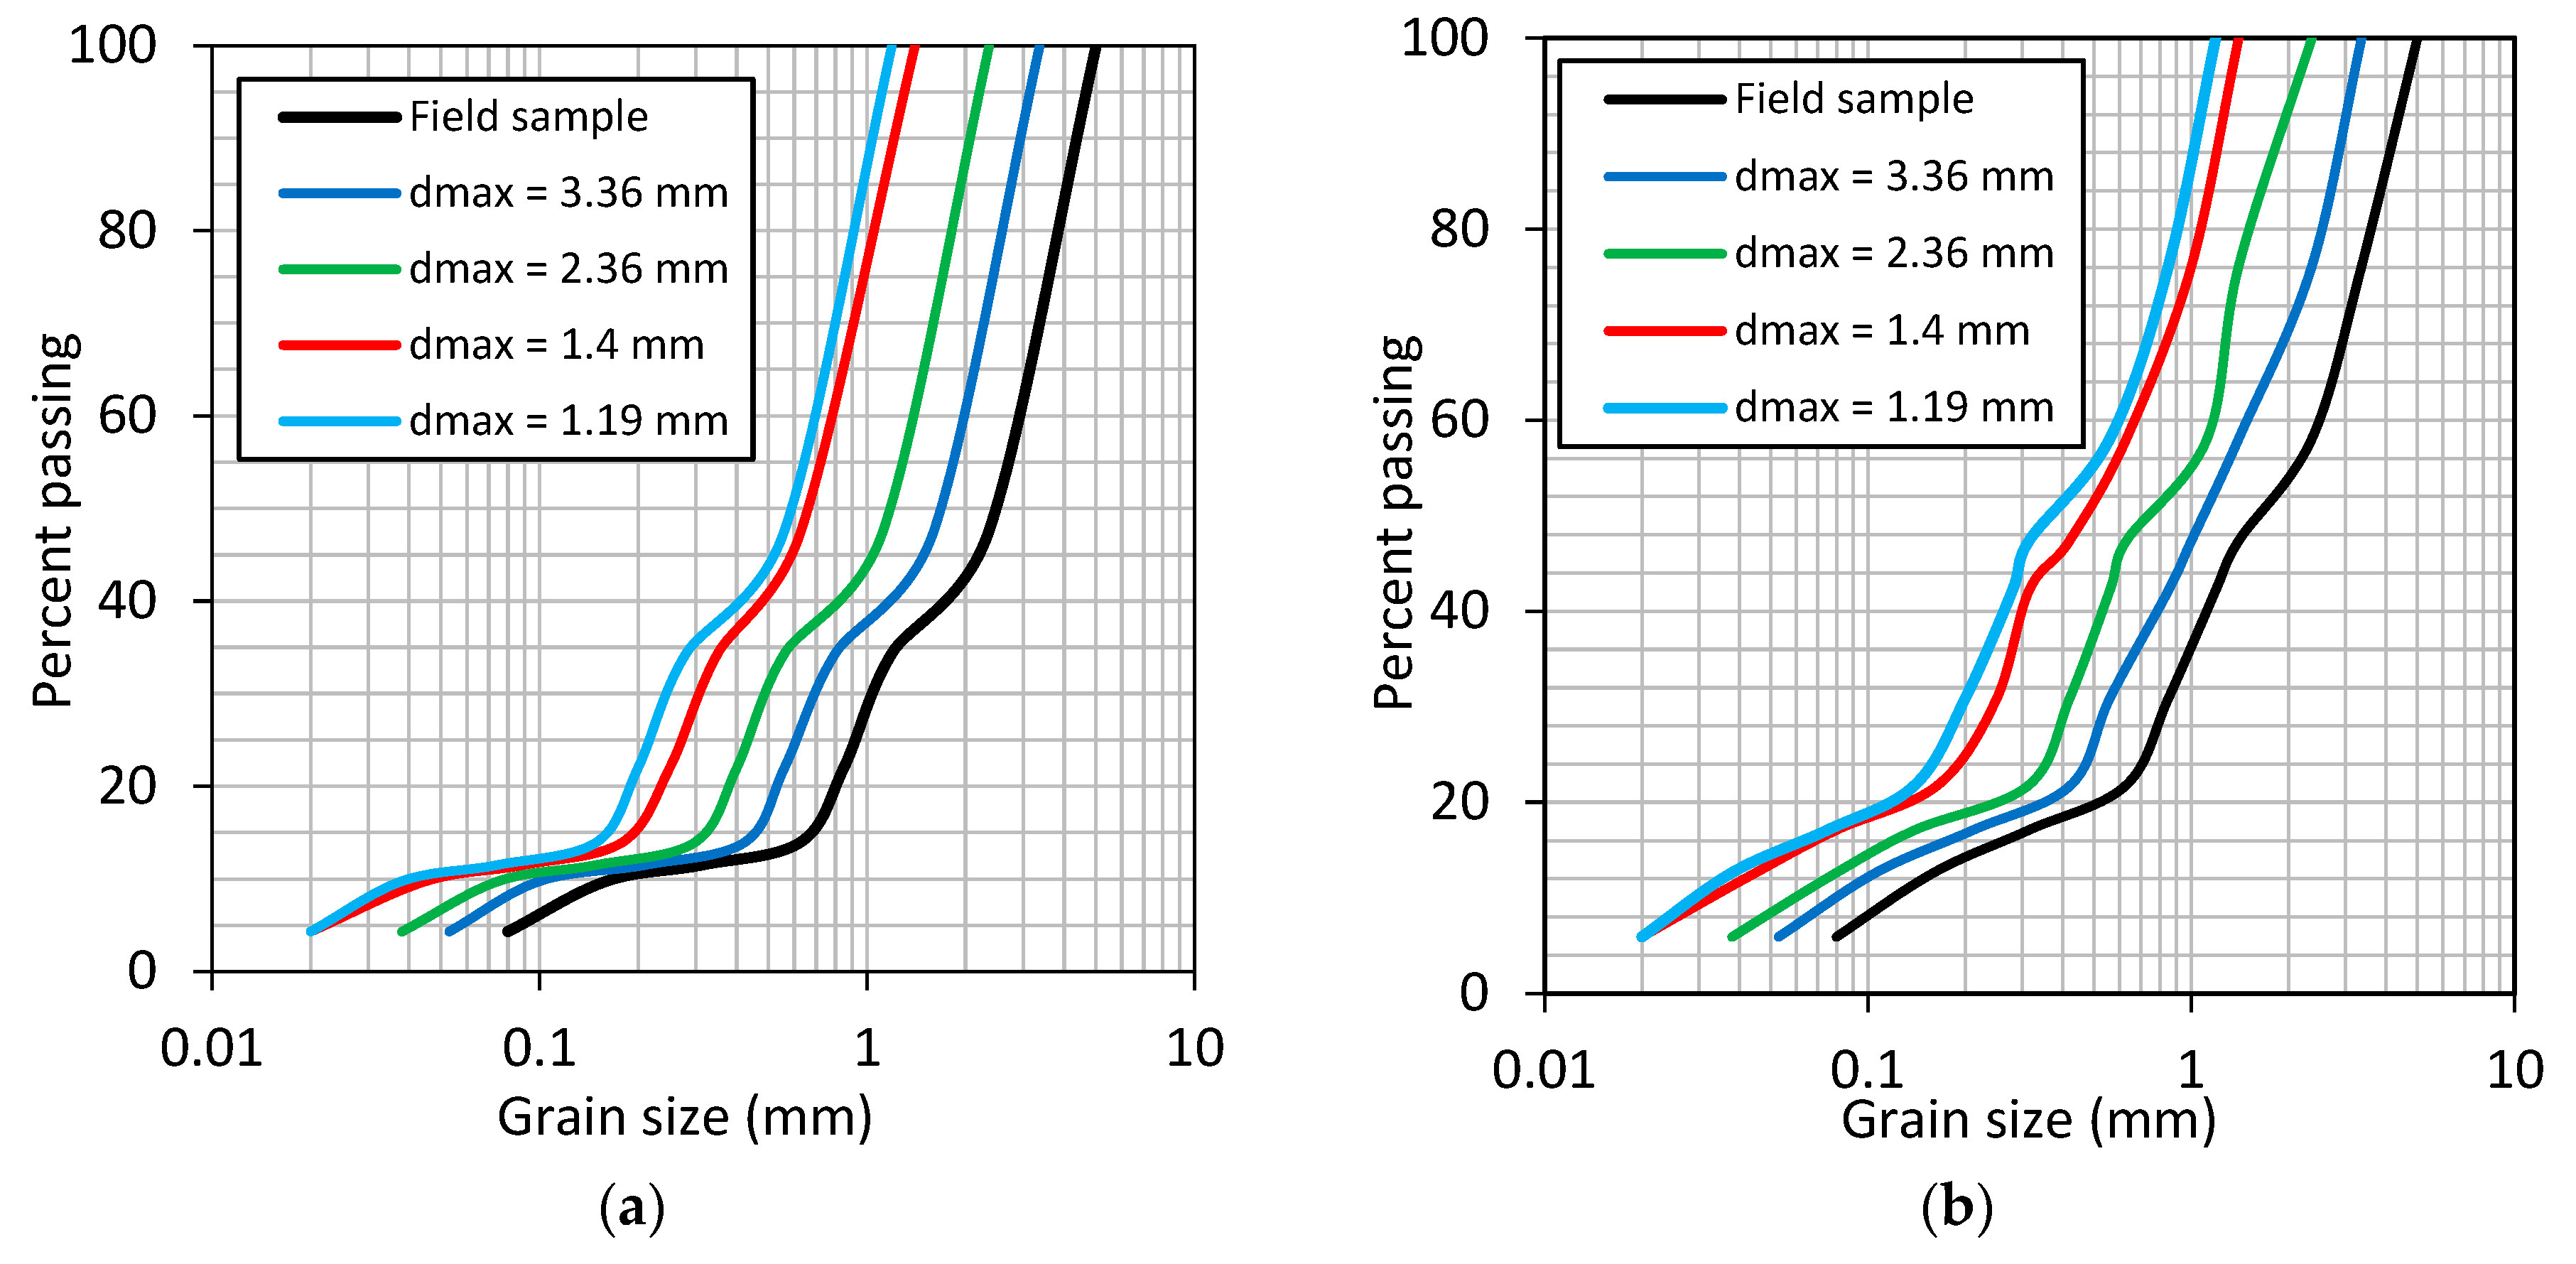
3. Validation of Scaling Down Techniques
4. Discussion
- Calculate the scaled down ratio N;
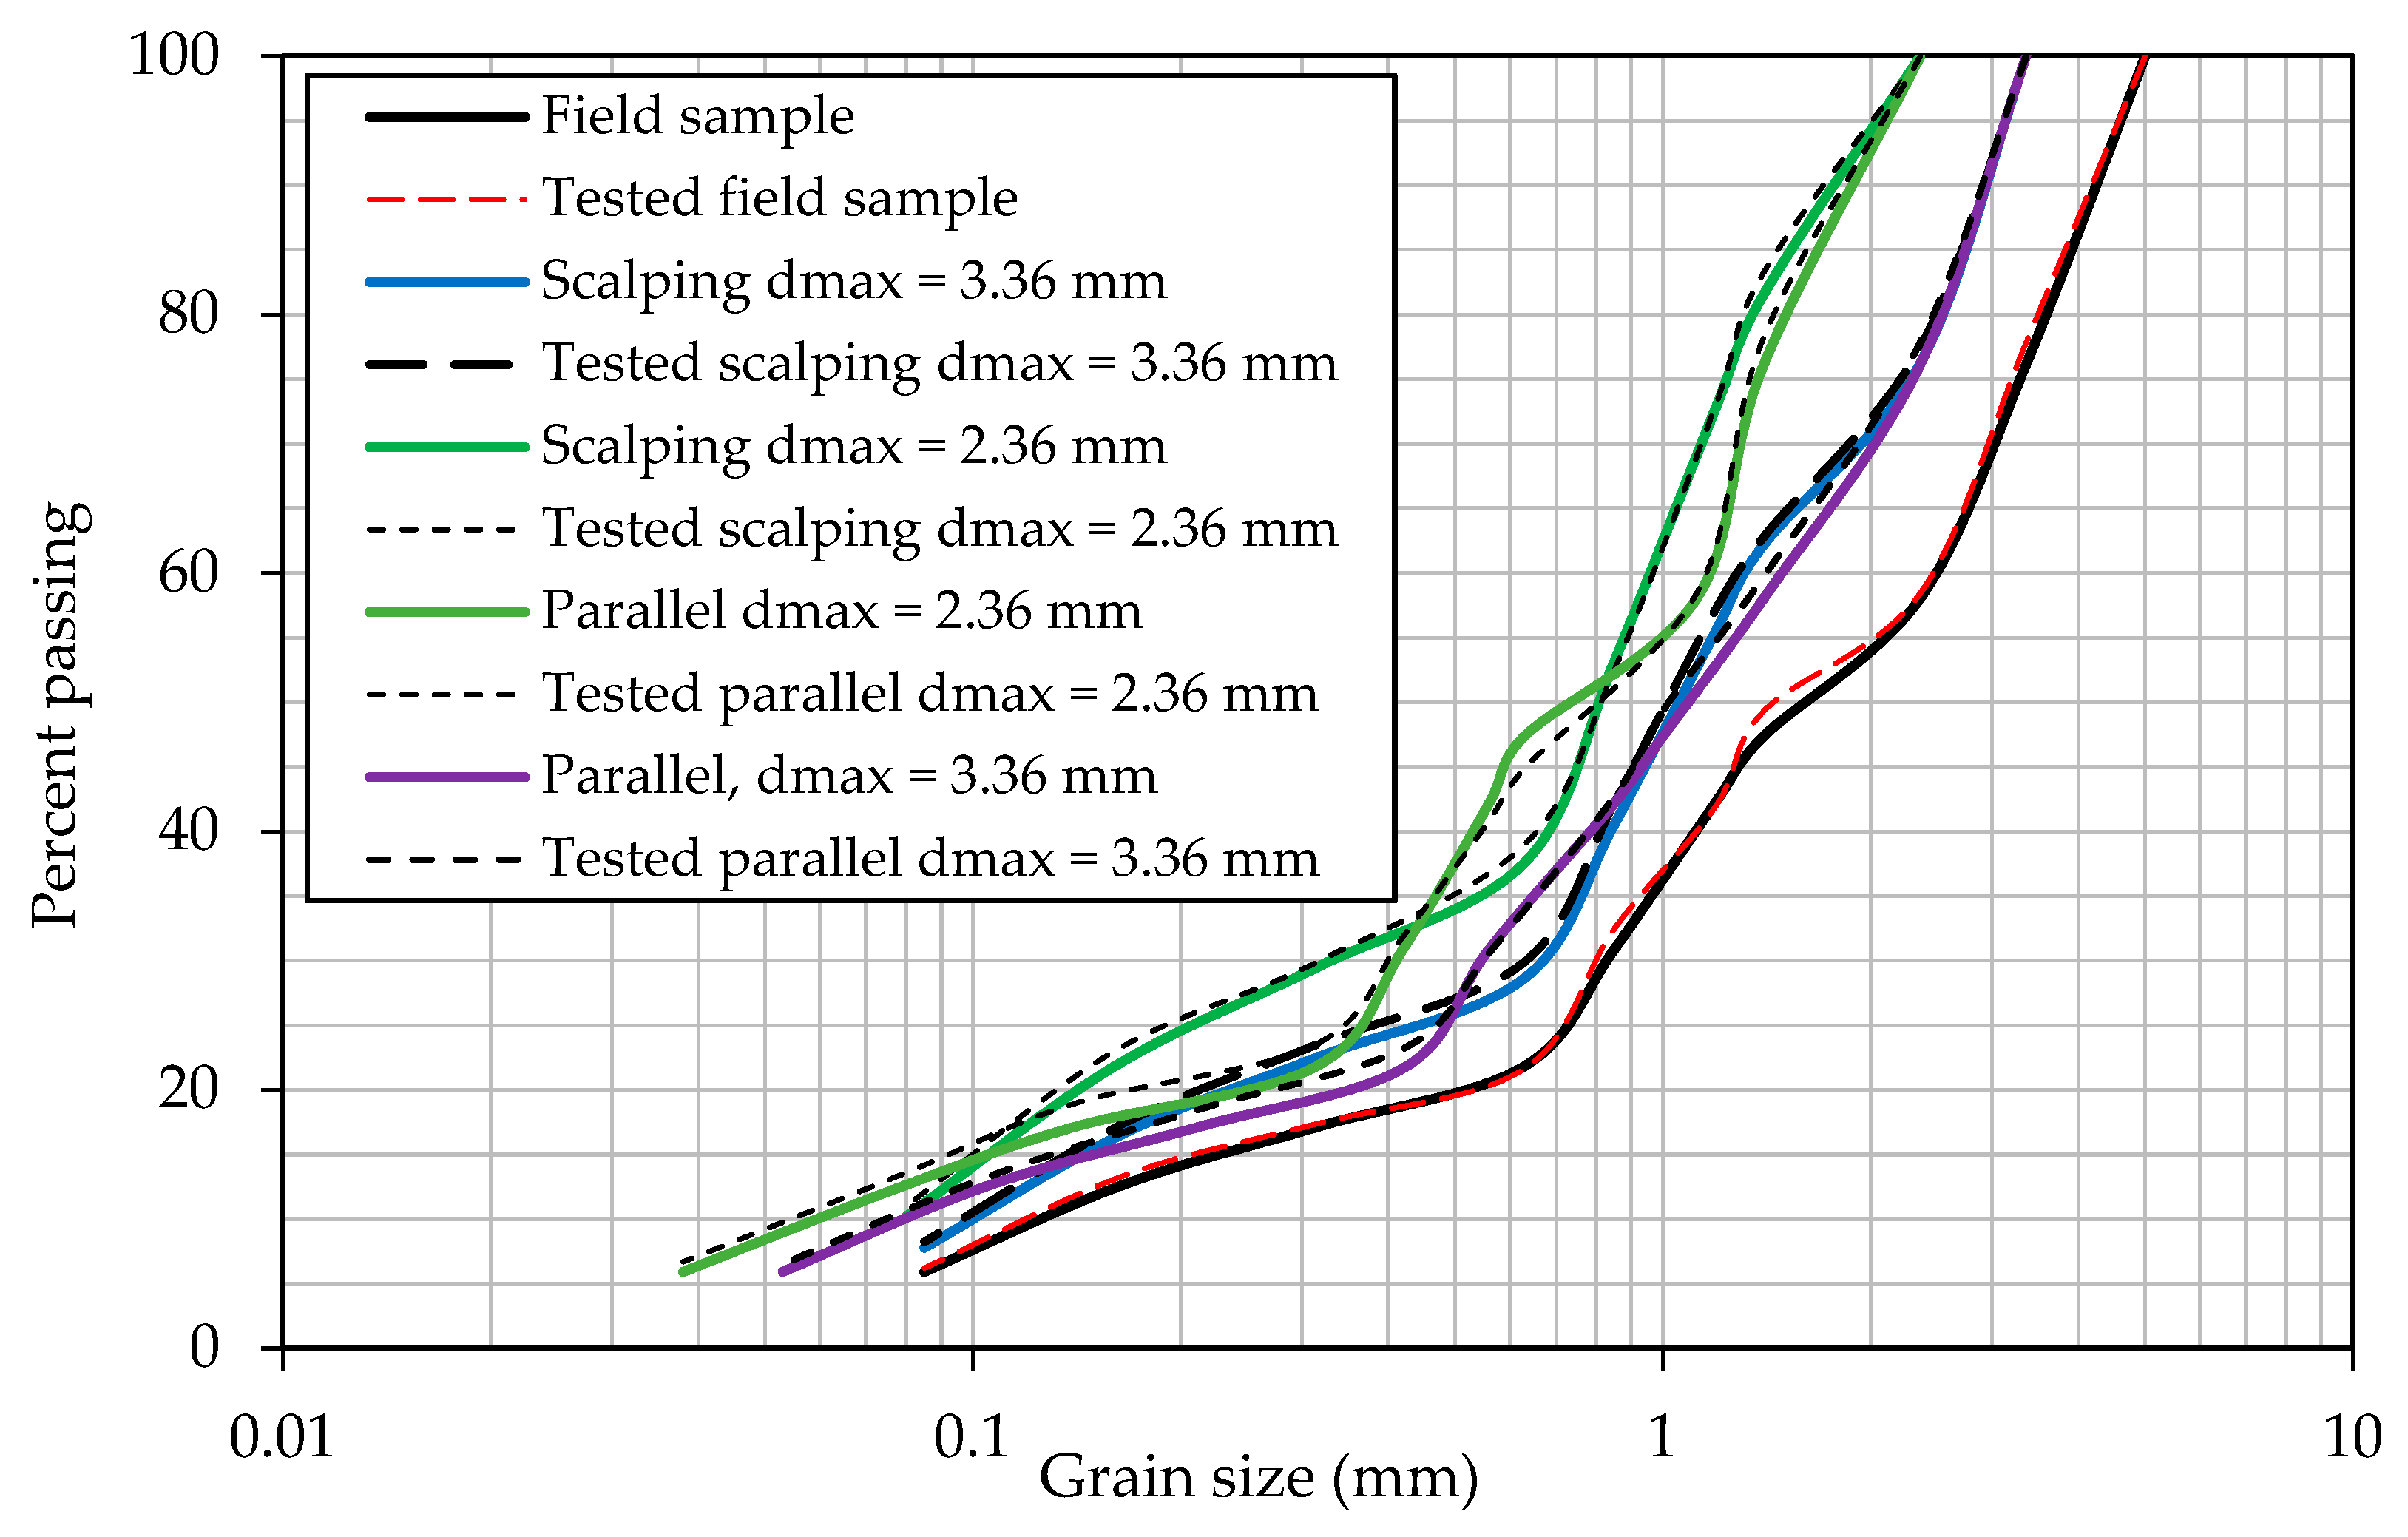
- Draw the PSDC of the scaled down sample, which is parallel to the PSDC of the field sample in the semi-log plane;
- Determine the percentage of each available sieve.
5. Conclusions
Author Contributions
Funding
Data Availability Statement
Acknowledgments
Conflicts of Interest
References
- ASTM D3080/D3080M-11; Standard Test Method for Direct Shear Test of Soils under Consolidated Drained Conditions (Withdrawn 2020). ASTM International: West Conshohocken, PA, USA, 2011.
- Rathee, R.K. Shear strength of granular soils and its prediction by modeling techniques. J. Inst. Eng. 1981, 62, 64–70. [Google Scholar]
- Palmeira, E.M.; Milligan, G.W.E. Scale effects in direct shear tests on sand. In Proceedings of the 12th International Conference on Soil Mechanics and Foundation Engineering, Rio De Janeiro, Brazil, 13–18 August 1989; Volume 1, pp. 739–742. [Google Scholar]
- Cerato, A.; Lutenegger, A. Specimen size and scale effects of direct shear box tests of sands. Geotech. Test. J. 2006, 29, 507–516. [Google Scholar]
- Wu, P.-K.; Matsushima, K.; Tatsuoka, F. Effects of specimen size and some other factors on the strength and deformation of granular soil in direct shear tests. Geotech. Test. J. 2008, 31, 45–64. [Google Scholar]
- Mirzaeifar, H.; Abouzar, A.; Abdi, M.R. Effects of direct shear box dimensions on shear strength parameters of geogrid-reinforced sand. In Proceedings of the GeoMontreal 2013, Montreal, QC, Canada, 29 September–3 October 2013. [Google Scholar]
- Omar, T.; Sadrekarimi, A. Effect of triaxial specimen size on engineering design and analysis. Int. J. Geo-Eng. 2015, 6, 1–17. [Google Scholar] [CrossRef] [Green Version]
- Moayed, R.Z.; Alibolandi, M.; Alizadeh, A. Specimen size effects on direct shear test of silty sands. Int. J. Geotech. Eng. 2016, 11, 198–205. [Google Scholar] [CrossRef]
- Zahran, K.; Naggar, H.E. Effect of sample size on TDA shear strength parameters in direct shear tests. Transp. Res. Rec. 2020, 2674, 1110–1119. [Google Scholar] [CrossRef]
- Deiminiat, A.; Li, L.; Zeng, F.; Pabst, T.; Chiasson, P.; Chapuis, R. Determination of the shear strength of rockfill from small-scale laboratory shear tests: A critical review. Adv. Civ. Eng. 2020, 2020, 1–18. [Google Scholar] [CrossRef]
- Deiminiat, A.; Li, L.; Zeng, F. Experimental study on the minimum required specimen width to maximum particle size ratio in direct shear tests. CivilEng, 2021; Submitted. [Google Scholar]
- Drugan, W.; Willis, J. A micromechanics-based nonlocal constitutive equation and estimates of representative volume element size for elastic composites. J. Mech. Phys. Solids 1996, 44, 497–524. [Google Scholar] [CrossRef]
- Kanit, T.; Forest, S.; Galliet, I.; Mounoury, V.; Jeulin, D. Determination of the size of the representative volume element for random composites: Statistical and numerical approach. Int. J. Solids Struct. 2003, 40, 3647–3679. [Google Scholar] [CrossRef]
- Wen, R.; Tan, C.; Wu, Y.; Wang, C. Grain size effect on the mechanical behavior of cohesionless coarse-grained soils with the discrete element method. Adv. Civ. Eng. 2018, 2018, 4608930. [Google Scholar] [CrossRef]
- Gupta, A.K. Triaxial behavior of rockfill materials. Electron. J. Geotech. Eng. 2009, 14, 1–18. [Google Scholar]
- Pankaj, S.; Mahure, N.; Gupta, S.; Sandeep, D.; Devender, S. Estimation of shear strength of prototype rockfill materials. Int. J. Eng. Sci. 2013, 2, 421–426. [Google Scholar]
- Honkanadavar, N.P.; Kumar, N.; Ratnam, M. Modeling the behavior of alluvial and blasted quarried rockfill materials. Geotech. Geol. Eng. 2014, 32, 1001–1015. [Google Scholar] [CrossRef] [Green Version]
- Amirpour Harehdasht, S.; Hussien, M.N.; Karray, M.; Roubtsova, V.; Chekired, M. Influence of particle size and gradation on shear strength–dilation relation of granular materials. Can. Geotech. J. 2019, 56, 208–227. [Google Scholar] [CrossRef]
- Zhang, Z.; Sheng, Q.; Fu, X.; Zhou, Y.; Huang, J.; Du, Y. An approach to predicting the shear strength of soil-rock mixture based on rock block proportion. Bull. Int. Assoc. Eng. Geol. 2019, 79, 2423–2437. [Google Scholar] [CrossRef]
- Cai, H.; Wei, R.; Xiao, J.Z.; Wang, Z.W.; Yan, J.; Wu, S.F.; Sun, L.M. Direct shear test on coarse gap-graded fill: Plate opening size and its effect on measured shear strength. Adv. Civ. Eng. 2020, 2020, 1–13. [Google Scholar] [CrossRef]
- Nicks, J.E.; Gebrenegus, T.; Adams, M.T. Interlaboratory large-scale direct shear testing of open-graded aggregates: Round one. In Proceedings of the IFCEE 2021, Dallas, TX, USA, 10–14 May 2021; pp. 361–370. [Google Scholar] [CrossRef]
- Rasti, A.; Adarmanabadi, H.R.; Pineda, M.; Reinikainen, J. Evaluating the effect of soil particle characterization on internal friction angle. Am. J. Eng. Appl. Sci. 2021, 14, 129–138. [Google Scholar] [CrossRef]
- Saberian, M.; Li, J.; Perera, S.T.A.M.; Zhou, A.; Roychand, R.; Ren, G. Large-scale direct shear testing of waste crushed rock reinforced with waste rubber as pavement base/subbase materials. Transp. Geotech. 2021, 28, 100546. [Google Scholar] [CrossRef]
- AS 1289.6.2.2; Soil Strength and Consolidation Tests-Determination of the Shear Strength of a Soil-Direct Shear Test Using a Shear Box. Standards Australia: Sydney, Australia, 1998.
- Eurocode 7; Geotechnical Design-Part 1: General Rules. EN 1997–1. British Standards: London, UK, 2004.
- BS 1377. Methods of Test for Soils for Civil Engineering Purposes; Shear Strength Tests (Total Stress); British Standard Institution: London, UK, 1990. [Google Scholar]
- Hall, E.B. A triaxial apparatus for testing large soil specimens. In Triaxial Testing of Soils and Bitminous Mixtures; ASTM: West Conshohocken, PA, USA, 1951; Volume 106, p. 152. [Google Scholar] [CrossRef]
- Holtz, W.; Gibbs, H.J. Triaxial shear tests on pervious gravelly soils. J. Soil Mech. Found. Div. 1956, 82, 1–22. [Google Scholar] [CrossRef]
- Leslie, D. Large scale triaxial tests on gravelly soils. In Proceedings of the Second Panamerican Conference on Soil Mechanics and Foundation Engineering, Sao Paulo, Brazil, 1 July 1963; Volume 1, pp. 181–202. [Google Scholar]
- Marachi, N.; Seed, H.; Chan, C. Strength characteristics of rockfill materials. In Proceedings of the 7th International Conference on Soil Mechanics and Foundation Engineering, Mexico City, Mexico, 25–29 August 1969; pp. 217–224. [Google Scholar]
- Marachi, N.D.; Chan, C.K.; Seed, H.B. Evaluation of properties of rockfill materials. J. Soil Mech. Found. Div. 1972, 98, 95–114. [Google Scholar] [CrossRef]
- Varadarajan, A.; Sharma, K.G.; Venkatachalam, K.; Gupta, A.K. Testing and modeling two rockfill materials. J. Geotech. Geoenviron. Eng. 2003, 129, 206–218. [Google Scholar] [CrossRef]
- Hamidi, A.; Azini, E.; Masoudi, B. Impact of gradation on the shear strength-dilation behavior of well graded sand-gravel mixtures. Sci. Iran. 2012, 19, 393–402. [Google Scholar] [CrossRef] [Green Version]
- Ovalle, C.; Frossard, E.; Dano, C.; Hu, W.; Maiolino, S.; Hicher, P.-Y. The effect of size on the strength of coarse rock aggregates and large rockfill samples through experimental data. Acta Mech. 2014, 225, 2199–2216. [Google Scholar] [CrossRef] [Green Version]
- Chang, W.-J.; Phantachang, T. Effects of gravel content on shear resistance of gravelly soils. Eng. Geol. 2016, 207, 78–90. [Google Scholar] [CrossRef]
- Yang, G.; Jiang, Y.; Nimbalkar, S.; Sun, Y.; Li, N. Influence of particle size distribution on the critical state of rockfill. Adv. Civ. Eng. 2019, 2019, 1–7. [Google Scholar] [CrossRef]
- Dorador, L.; Villalobos, F.A. Scalping techniques in geomechanical characterization of coarse granular materials. Obras Proy. 2020, 28, 24–34. [Google Scholar] [CrossRef]
- Ovalle, C.; Linero, S.; Dano, C.; Bard, E.; Hicher, P.-Y.; Osses, R. Data compilation from large drained compression triaxial tests on coarse crushable rockfill materials. J. Geotech. Geoenviron. Eng. 2020, 146, 06020013. [Google Scholar] [CrossRef]
- Kouakou, N.; Cuisinier, O.; Masrouri, F. Estimation of the shear strength of coarse-grained soils with fine particles. Transp. Geotech. 2020, 25, 100407. [Google Scholar] [CrossRef]
- MotahariTabari, S.; Shooshpasha, I. Evaluation of coarse-grained mechanical properties using small direct shear test. Int. J. Geotech. Eng. 2018, 15, 667–679. [Google Scholar] [CrossRef]
- Hennes, R.G. The strength of gravel in direct shear. In International Symposium on Direct Shear Testing of Soils; ASTM: West Conshohocken, PA, USA, 1953; Volume 131, pp. 51–62. [Google Scholar]
- Zeller, J.; Wullimann, R. The shear strength of the shell materials for the Go-Schenenalp Dam, Switzerland. In Proceedings of the 4th International Conference on Soil Mechanics and Foundation Engineering, London, UK, 12–24 August 1957; Volume 2, pp. 399–415. [Google Scholar]
- Morgan, C.C.; Harris, M.C. Portage mountain dam—II materials. Can. Geotech. J. 1967, 4, 142–166. [Google Scholar] [CrossRef]
- Hall, E.B.; Smith, T. Special tests for design of high earth embankments on US-101. In Highway Research Record; University of Michigan: Ann Arbor, MI, USA, 1971. [Google Scholar]
- Williams, D.J.; Walker, L.K. Laboratory and Field Strength of Mine Waste Rock; Research Report No. CE 48; University of Queensland: Brisbane, Australia, 1983. [Google Scholar]
- Donaghe, R.T.; Torrey, V.H. Strength and Deformation Properties of Earth-Rock Mixtures; No. WES/TR/GL-85-9; Army Engineer Waterways Experiment Station Vicksburg, Geotechnical Lab, USACE: Vicksburg, MI, USA, 1985. [Google Scholar]
- Seif El Dine, B.S.; Dupla, J.C.; Frank, R.; Canou, J.; Kazan, Y. Mechanical characterization of matrix coarse-grained soils with a large-sized triaxial device. Can. Geotech. J. 2010, 47, 425–438. [Google Scholar] [CrossRef]
- Fragaszy, R.J.; Su, J.; Siddiqi, F.H.; Ho, C.L. Modeling strength of sandy gravel. J. Geotech. Eng. 1992, 118, 920–935. [Google Scholar] [CrossRef]
- Bareither, C.A.; Benson, C.H.; Edil, T.B. Comparison of shear strength of sand backfills measured in small-scale and large-scale direct shear tests. Can. Geotech. J. 2008, 45, 1224–1236. [Google Scholar] [CrossRef]
- Lowe, J. Shear strength of coarse embankment dam materials. In Proceedings of the 8th International Congress on Large Dams, Edinburgh, UK, 4–8 May 1964; Volume 3, pp. 745–761. [Google Scholar]
- Tombs, S.G. Strength and Deformation Characteristics of Rockfill. Ph.D. Thesis, Imperial College, London, UK, 1969. [Google Scholar]
- Charles, J.A. Correlation between Laboratory Behaviour of Rockfill and Field Performance with Particular Preference to Scammonden Dam. Ph.D. Thesis, Imperial College, London, UK, 1973. [Google Scholar]
- Frost, R.J. Some testing experiences and characteristics of boulder-gravel fills in earth dams. In Evaluation of Relative Density and its Role in Geotechnical Projects Involving Cohesion-Less Soils; ASTM International: West Conshohocken, PA, USA, 1973; pp. 207–233. [Google Scholar]
- Donaghe, R.T.; Townsend, F.C. Compaction Characteristics of Earth-Rock Mixtures; Report 1, No. WES-MP-S-73-25-1; Army Engineer Waterways Experiment Station Vicksburg: Vicksburg, MS, USA, 1973. [Google Scholar]
- Houston, W.; Houston, S.L.; Walsh, K.D. Compacted high gravel content subgrade materials. J. Transp. Eng. 1994, 120, 193–205. [Google Scholar] [CrossRef]
- Donaghe, R.T.; Townsend, F.C. Scalping and replacement effects on the compaction characteristics of earth-rock mixtures. In Soil Specimen Preparation for Laboratory Testing; ASTM: West Conshohocken, PA, USA, 1976; pp. 248–277. [Google Scholar]
- Feng, G.; Vitton, S.J. Laboratory determination of compaction criteria for rockfill material embankments. In Proceedings of the International Conference on Soil Mechanics and Foundation Engineering, Hamburg, Germany, 6–12 September 1997; Volume 1, pp. 485–488. [Google Scholar]
- Varadarajan, A.; Sharma, K.G.; Abbas, S.M.; Dhawan, A.K. The role of nature of particles on the behavior of rockfill material. Soils Found. 2006, 46, 569–584. [Google Scholar] [CrossRef] [Green Version]
- Abbas, S.M. Behavior of Rockfill Materials (Based on Nature of Particles); Lambert Academic Publishing: Saarbrücken, Germany, 2011. [Google Scholar]
- Rao, S.V.; Bajaj, S.; Dhanote, S. Evaluations of strength parameters of rockfill material for Pakaldul hydroelectric project, Jammu and Kashmir—A case study. In Proceedings of the Indian Geotechnical Conference, Kochi, India, 15–17 December 2011; pp. 991–994. [Google Scholar]
- Stober, J.N. Effects of Maximum Particle Size and Sample Scaling on the mechanical Behavior of Mine Waste Rock; A Critical State Approach. Master’s Thesis, Colorado State University, Fort Collins, CO, USA, 2012. [Google Scholar]
- Vasistha, Y.; Gupta, A.K.; Kanwar, V. Medium triaxial testing of some rockfill materials. Electron. J. Geotech. Eng. 2013, 18, 923–964. [Google Scholar]
- Honkanadavar, N.P.; Dhanote, S.; Bajaj, S. Prediction of shear strength parameter for prototype alluvial rockfill material. In Proceedings of the Indian Geotechnical Conference, Chennai, India, 15–17 December 2016. [Google Scholar]
- Sukkarak, R.; Pramthawee, P.; Jongpradist, P.; Kongkitkul, W.; Jamsawang, P. Deformation analysis of high CFRD considering the scaling effects. Geomech. Eng. 2018, 14, 211–224. [Google Scholar]
- Ovalle, C.; Dano, C. Effects of particle size–strength and size–shape correlations on parallel grading scaling. Geotech. Lett. 2020, 10, 191–197. [Google Scholar] [CrossRef]
- Dorador, L.; Villalobos, F.A. Analysis of the geomechanical characterization of coarse granular materials using the parallel gradation method. Obras y Proy. 2020, 27, 50–63. [Google Scholar] [CrossRef]
- Lee, K.L.; Seed, H.B. Drained strength characteristics of sands. J. Soil Mech. Found. Div. 1967, 93, 117–141. [Google Scholar] [CrossRef]
- Charles, J.A.; Watts, K.S. The influence of confining pressure on the shear strength of compacted rockfill. Geotechnique 1980, 30, 353–367. [Google Scholar] [CrossRef]
- Ramamurthy, T. A geo-engineering classification for rocks and rock masses. Int. J. Rock Mech. Min. Sci. 2004, 41, 89–101. [Google Scholar] [CrossRef]
- Wang, Y.; Shao, S.; Wang, Z. Effect of particle breakage and shape on the mechanical behaviors of granular materials. Adv. Civ. Eng. 2019, 2019, 1–15. [Google Scholar] [CrossRef]
- Wei, H.; Frossard, E.; Hicher, P.Y.; Dano, C. Method to evaluate the shear strength of granular material with large particles. In Proceedings of the Soil Behavior and Geo-Micromechanics, GeoShanghai 2010 International Conference, Shanghai, China, 3–5 June 2010; pp. 247–254. [Google Scholar]
- Frossard, É.; Hu, W.; Dano, C.; Hicher, P.Y. Rockfill shear strength evaluation: A rational method based on size effects. Géotechnique 2012, 62, 415–427. [Google Scholar] [CrossRef] [Green Version]
- Xu, Y. Shear strength of granular materials based on fractal fragmentation of particles. Powder Technol. 2018, 333, 1–8. [Google Scholar] [CrossRef]
- Bagherzadeh, A.; Mirghasemi, A.A. Numerical and experimental direct shear tests for coarse grained soils. Particuology 2009, 7, 83–91. [Google Scholar] [CrossRef]
- Xu, Y.; Williams, D.J.; Serati, M.; Vangsness, T. Effects of scalping on direct shear strength of crusher run and crusher run/geogrid interface. J. Mater. Civ. Eng. 2018, 30, 04018206. [Google Scholar] [CrossRef]
- Yaghoubi, E.; Arulrajah, A.; Yaghoubi, M.; Horpibulsuk, S. Shear strength properties and stress–strain behavior of waste foundry sand. Constr. Build. Mater. 2020, 249, 118761. [Google Scholar] [CrossRef]
- Lambe, T.; Whitman, R. Soil Mechanics; John Wiley & Sons: New York, NY, USA, 1969. [Google Scholar]
- ASTM C128-15; Standard Test Method for Relative Density (Specific Gravity) and Absorption of Fine Aggregate. ASTM International: West Conshohocken, PA, USA, 2015.
- ASTM C29/C29M-07; Standard Test Method for Bulk Density (Unit Weight) and Voids in Aggregate. ASTM International: West Conshohocken, PA, USA, 2007.
- Dorador, L.; Anstey, D.; Urrutia, J. Estimation of geotechnical properties on leached coarse material. In Proceedings of the 70th Canadian Geotechnical Conference, Ottawa, ON, Canada, 1–4 October 2017. [Google Scholar]
- Matsuoka, H.; Liu, S. Simplified direct box shear test on granular materials and its application to rockfill materials. Soils Found. 1998, 38, 275–284. [Google Scholar] [CrossRef] [Green Version]
- Boakye, K. Large In Situ Direct Shear Tests on Rock Piles at the Questa Min, Taos County, New Mexico. Ph.D. Thesis, Institute of Mining and Technology, Socorro, NM, USA, 2008. [Google Scholar]
- Li, L.; Aubertin, M.; Simon, R. A multiaxial failure criterion with time and size effects for intact rock. In Rock Mechanics for Industry, Proceedings of the 37th US Rock Mechanics Symposium, Vail, CO, USA, 6–9 June 1999; Amadei, B., Kranz, R.L., Scott, G.A., Smeallie, P.H., Eds.; A.A. Balkema: Rotterdam, The Netherlands, 1999; Volume 2, pp. 653–659. [Google Scholar]
- Li, L.; Aubertin, M.; Simon, R. Stability analyses of underground openings using a multiaxial failure criterion with scale effects. In Frontiers of Rock Mechanics and Sustainable Development in the 21st Century, Proceedings of the 2nd Asian Rock Mechanics Symposium, Beijing, China, 11–14 September 2001; Wang, S., Fu, B., Li, Z., Eds.; A.A. Balkema: Lisse, The Netherlands, 2001; pp. 251–256. [Google Scholar]
- Li, L.; Aubertin, M.; Simon, R.; Deng, D.; Labrie, D. Influence of scale on the uniaxial compressive strength of brittle rock. In Rock Mechanics: Meeting Society’s Challenges and Demands; Eberhardt, E., Stead, D., Morrison, T., Eds.; Taylor & Francis: Abingdon, UK, 2007; Volume 1, pp. 785–792. [Google Scholar]


| Range of Particle Size | Portion (%) | Sieve Opening Size (mm) | Passing (%) | ||
|---|---|---|---|---|---|
| M1 and M3 | M2 | M1 and M3 | M2 | ||
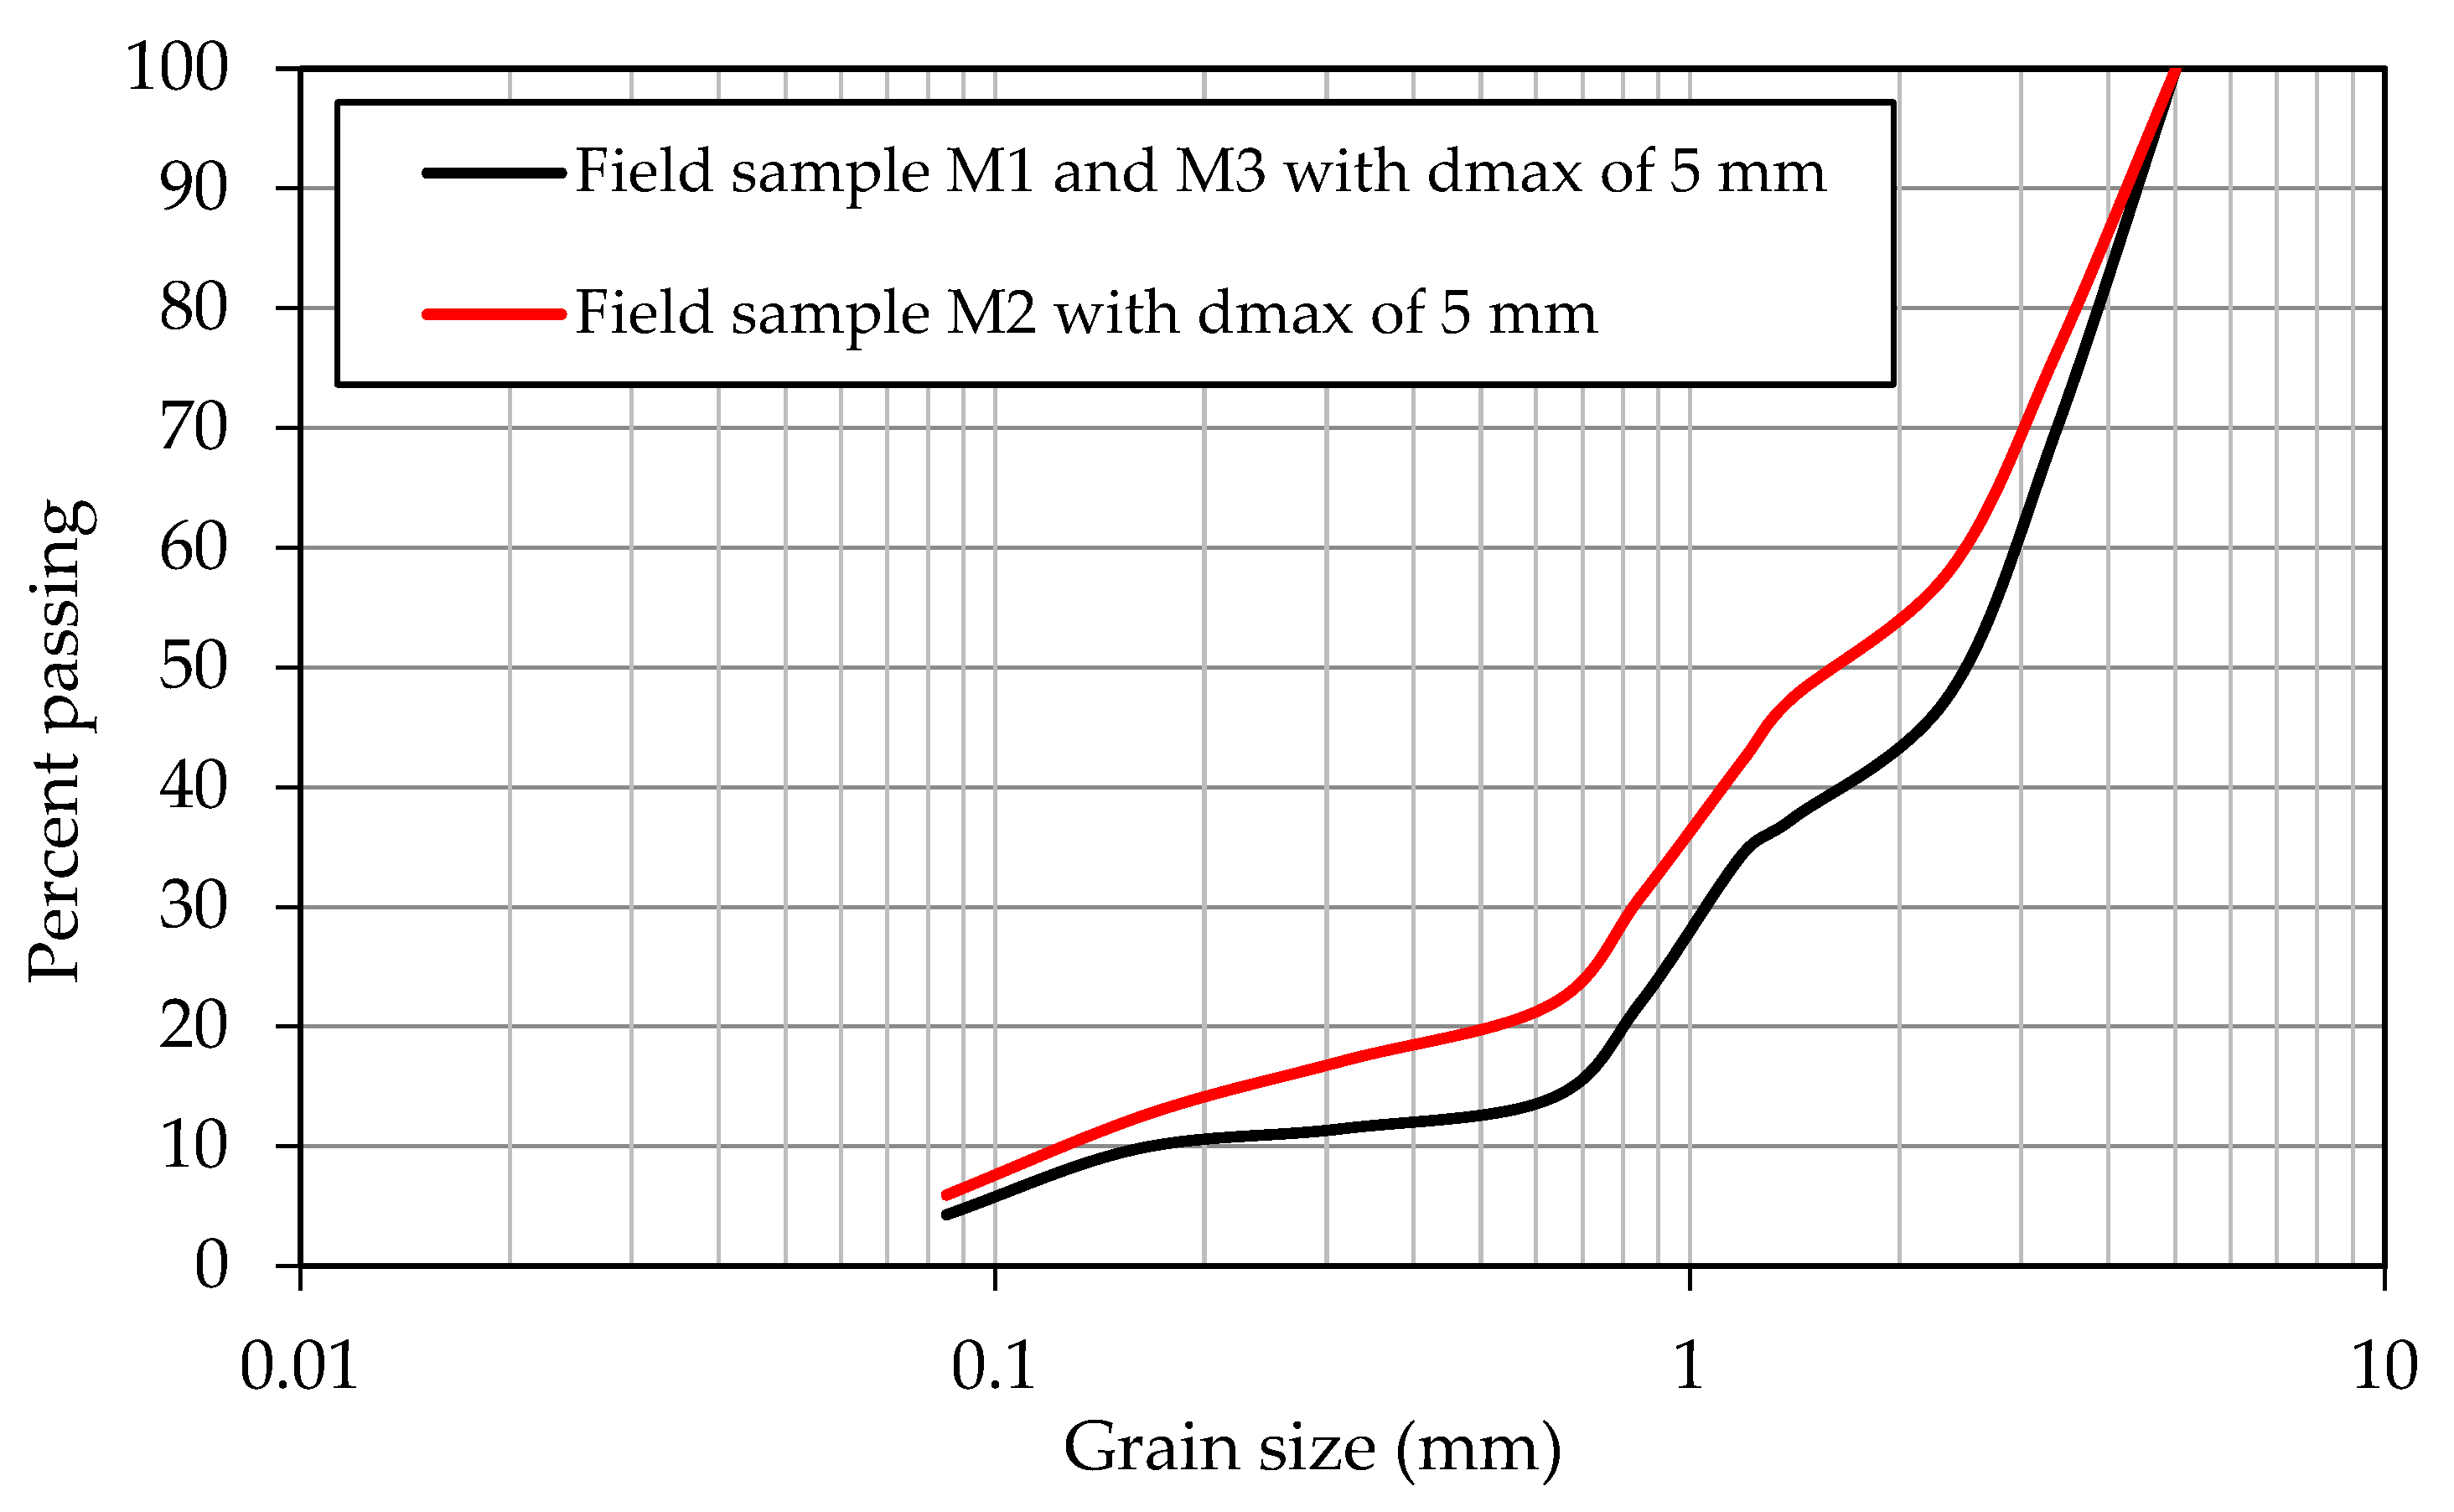
| 3.36–5 mm | 30.3 | 23.8 | 5 | 100.0 | 100.0 |
| 2.36–3.36 mm | 22.0 | 18.1 | 3.36 | 69.7 | 76.2 |
| 1.40–2.36 mm | 10.4 | 10.7 | 2.36 | 47.7 | 58.1 |
| 1.19–1.40 mm | 2.9 | 5.2 | 1.4 | 37.3 | 47.4 |
| 0.85–1.19 mm | 12.3 | 11.3 | 1.19 | 34.4 | 42.2 |
| 0.63–0.85 mm | 8.0 | 9.1 | 0.85 | 22.1 | 30.9 |
| 0.315–0.63 mm | 2.5 | 4.7 | 0.63 | 14.0 | 21.8 |
| 0.16–0.315 mm | 1.8 | 4.5 | 0.315 | 11.5 | 17.1 |
| 0.08–0.16 mm | 5.4 | 6.7 | 0.16 | 9.8 | 12.7 |
| <0.08 mm | 4.3 | 5.9 | 0.08 | 4.3 | 5.9 |
| Range of Particle Size of Field Material | Range of Particle Sizes of Parallel Scaled Down Samples | Portion (%) | ||
|---|---|---|---|---|
| Calculated | Chosen | M1 and M3 | M2 | |
| 3.36–5 mm | 2.26–3.36 mm | 2.36–3.36 mm | 30.3 | 23.8 |
| 2.36–3.36 mm | 1.60–2.26 mm | 1.60–2.36 mm | 22.0 | 18.1 |
| 1.40–2.36 mm | 0.95–1.60 mm | 1.0–1.60 mm | 10.4 | 10.7 |
| 1.19–1.40 mm | 0.80–0.95 mm | 0.80–1.0 mm | 2.9 | 5.2 |
| 0.85–1.19 mm | 0.56–0.80 mm | 0.56–0.80 mm | 12.3 | 11.3 |
| 0.63–0.85 mm | 0.42–0.56 mm | 0.42–0.56 mm | 8.0 | 9.1 |
| 0.315–0.63 mm | 0.21–0.42 mm | 0.21–0.42 mm | 2.5 | 4.7 |
| 0.16–0.315 mm | 0.10–0.21 mm | 0.10–0.21 mm | 1.8 | 4.5 |
| 0.08–0.16 mm | 0.053–0.10 mm | 0.053–0.10 mm | 5.4 | 6.7 |
| <0.08 mm | <0.053 mm | <0.053 mm | 4.3 | 5.9 |
| Samples | dmax (mm) | emax [79] | Large Shear Box | Small Shear Box | ||||
|---|---|---|---|---|---|---|---|---|
| M1 | M2 | M3 | W/dmax | T/dmax | W/dmax | T/dmax | ||
| Field sample | 5 | 0.59 | 0.70 | 0.68 | 60 | 36 | -- | -- |
| Scalping down technique samples | 3.36 | 0.58 | 0.69 | 0.66 | 89 | 54 | -- | -- |
| 2.36 | 0.57 | 0.68 | 0.68 | 127 | 76 | -- | -- | |
| 1.4 | 0.60 | 0.67 | 0.65 | 214 | 129 | 71 | 32 | |
| 1.19 | 0.60 | 0.66 | 0.67 | 252 | 151 | 84 | 38 | |
| Parallel scaling down technique samples | 3.36 | 0.58 | 0.68 | 0.66 | 89 | 54 | -- | -- |
| 2.36 | 0.61 | 0.67 | 0.65 | 127 | 76 | -- | -- | |
| 1.4 | 0.60 | 0.68 | 0.68 | 214 | 129 | 71 | 32 | |
| 1.19 | 0.62 | 0.67 | 0.66 | 252 | 151 | 84 | 38 | |
| Samples | dmax (mm) | e of M1 under σn of | e of M2 under σn of | e of M3 under σn of | ||||||
|---|---|---|---|---|---|---|---|---|---|---|
| 50 kPa | 100 kPa | 150 kPa | 50 kPa | 100 kPa | 150 kPa | 50 kPa | 100 kPa | 150 kPa | ||
| Field sample | 5 | 0.52 | 0.51 | 0.49 | 0.64 | 0.63 | 0.63 | 0.62 | 0.62 | 0.61 |
| Scalping down technique samples | 3.36 | 0.50 | 0.49 | 0.48 | 0.65 | 0.62 | 0.62 | 0.60 | 0.60 | 0.60 |
| 2.36 | 0.49 | 0.48 | 0.48 | 0.64 | 0.61 | 0.61 | 0.63 | 0.63 | 0.62 | |
| 1.4 | 0.52 | 0.51 | 0.50 | 0.63 | 0.60 | 0.61 | 0.60 | 0.60 | 0.59 | |
| 1.19 | 0.52 | 0.50 | 0.50 | 0.63 | 0.60 | 0.60 | 0.62 | 0.61 | 0.61 | |
| Parallel down technique samples | 3.36 | 0.51 | 0.50 | 0.49 | 0.62 | 0.61 | 0.60 | 0.60 | 0.60 | 0.59 |
| 2.36 | 0.52 | 0.51 | 0.50 | 0.63 | 0.61 | 0.61 | 0.61 | 0.60 | 0.59 | |
| 1.4 | 0.53 | 0.52 | 0.50 | 0.64 | 0.62 | 0.61 | 0.62 | 0.62 | 0.61 | |
| 1.19 | 0.53 | 0.52 | 0.51 | 0.63 | 0.61 | 0.61 | 0.60 | 0.60 | 0.60 | |
| Samples | dmax (mm) | M1 | M2 | M3 | |||
|---|---|---|---|---|---|---|---|
| φ (°) | Avg. φ (°) | φ (°) | Avg. φ (°) | φ (°) | Avg. φ (°) | ||
| Field sample | 5 | 39.5 | 39.8 | 38.7 | 38.7 | 38.4 | 38.5 |
| 40.1 | 38.6 | 38.3 | |||||
| 39.8 | 38.9 | 38.7 | |||||
| Scalping down technique samples | 3.36 | 38.7 | 39.0 | 37.6 | 37.5 | 37.4 | 37.8 |
| 39.1 | 37.5 | 38.1 | |||||
| 39.2 | 37.3 | 37.8 | |||||
| 2.36 | 37.9 | 38.2 | 37.3 | 37.0 | 37.1 | 37.2 | |
| 38.4 | 37.2 | 37.5 | |||||
| 38.2 | 36.6 | 36.9 | |||||
| 1.40 | 37.6 | 37.3 | 35.4 | 35.6 | 36.2 | 35.9 | |
| 37.2 | 35.8 | 35.9 | |||||
| 37.1 | 35.6 | 35.6 | |||||
| 1.19 | 37.2 | 37.1 | 35.2 | 35.5 | 35.9 | 35.6 | |
| 37.0 | 35.5 | 35.7 | |||||
| 37.0 | 35.7 | 35.3 | |||||
| Parallel down technique samples | 3.36 | 39.0 | 38.6 | 37.1 | 37.8 | 37.5 | 37.2 |
| 38.7 | 37.9 | 36.8 | |||||
| 38.0 | 38.5 | 37.2 | |||||
| 2.36 | 38.7 | 38.0 | 36.2 | 36.6 | 37.3 | 36.7 | |
| 38.1 | 36.6 | 36.8 | |||||
| 37.2 | 37.2 | 36.1 | |||||
| 1.4 | 37.4 | 37.1 | 35.5 | 36.0 | 36.4 | 36.0 | |
| 36.9 | 35.8 | 35.7 | |||||
| 37.1 | 36.8 | 36.0 | |||||
| 1.19 | 37.0 | 36.3 | 35.4 | 35.9 | 35.9 | 35.5 | |
| 36.1 | 35.9 | 35.1 | |||||
| 35.7 | 36.5 | 35.6 | |||||
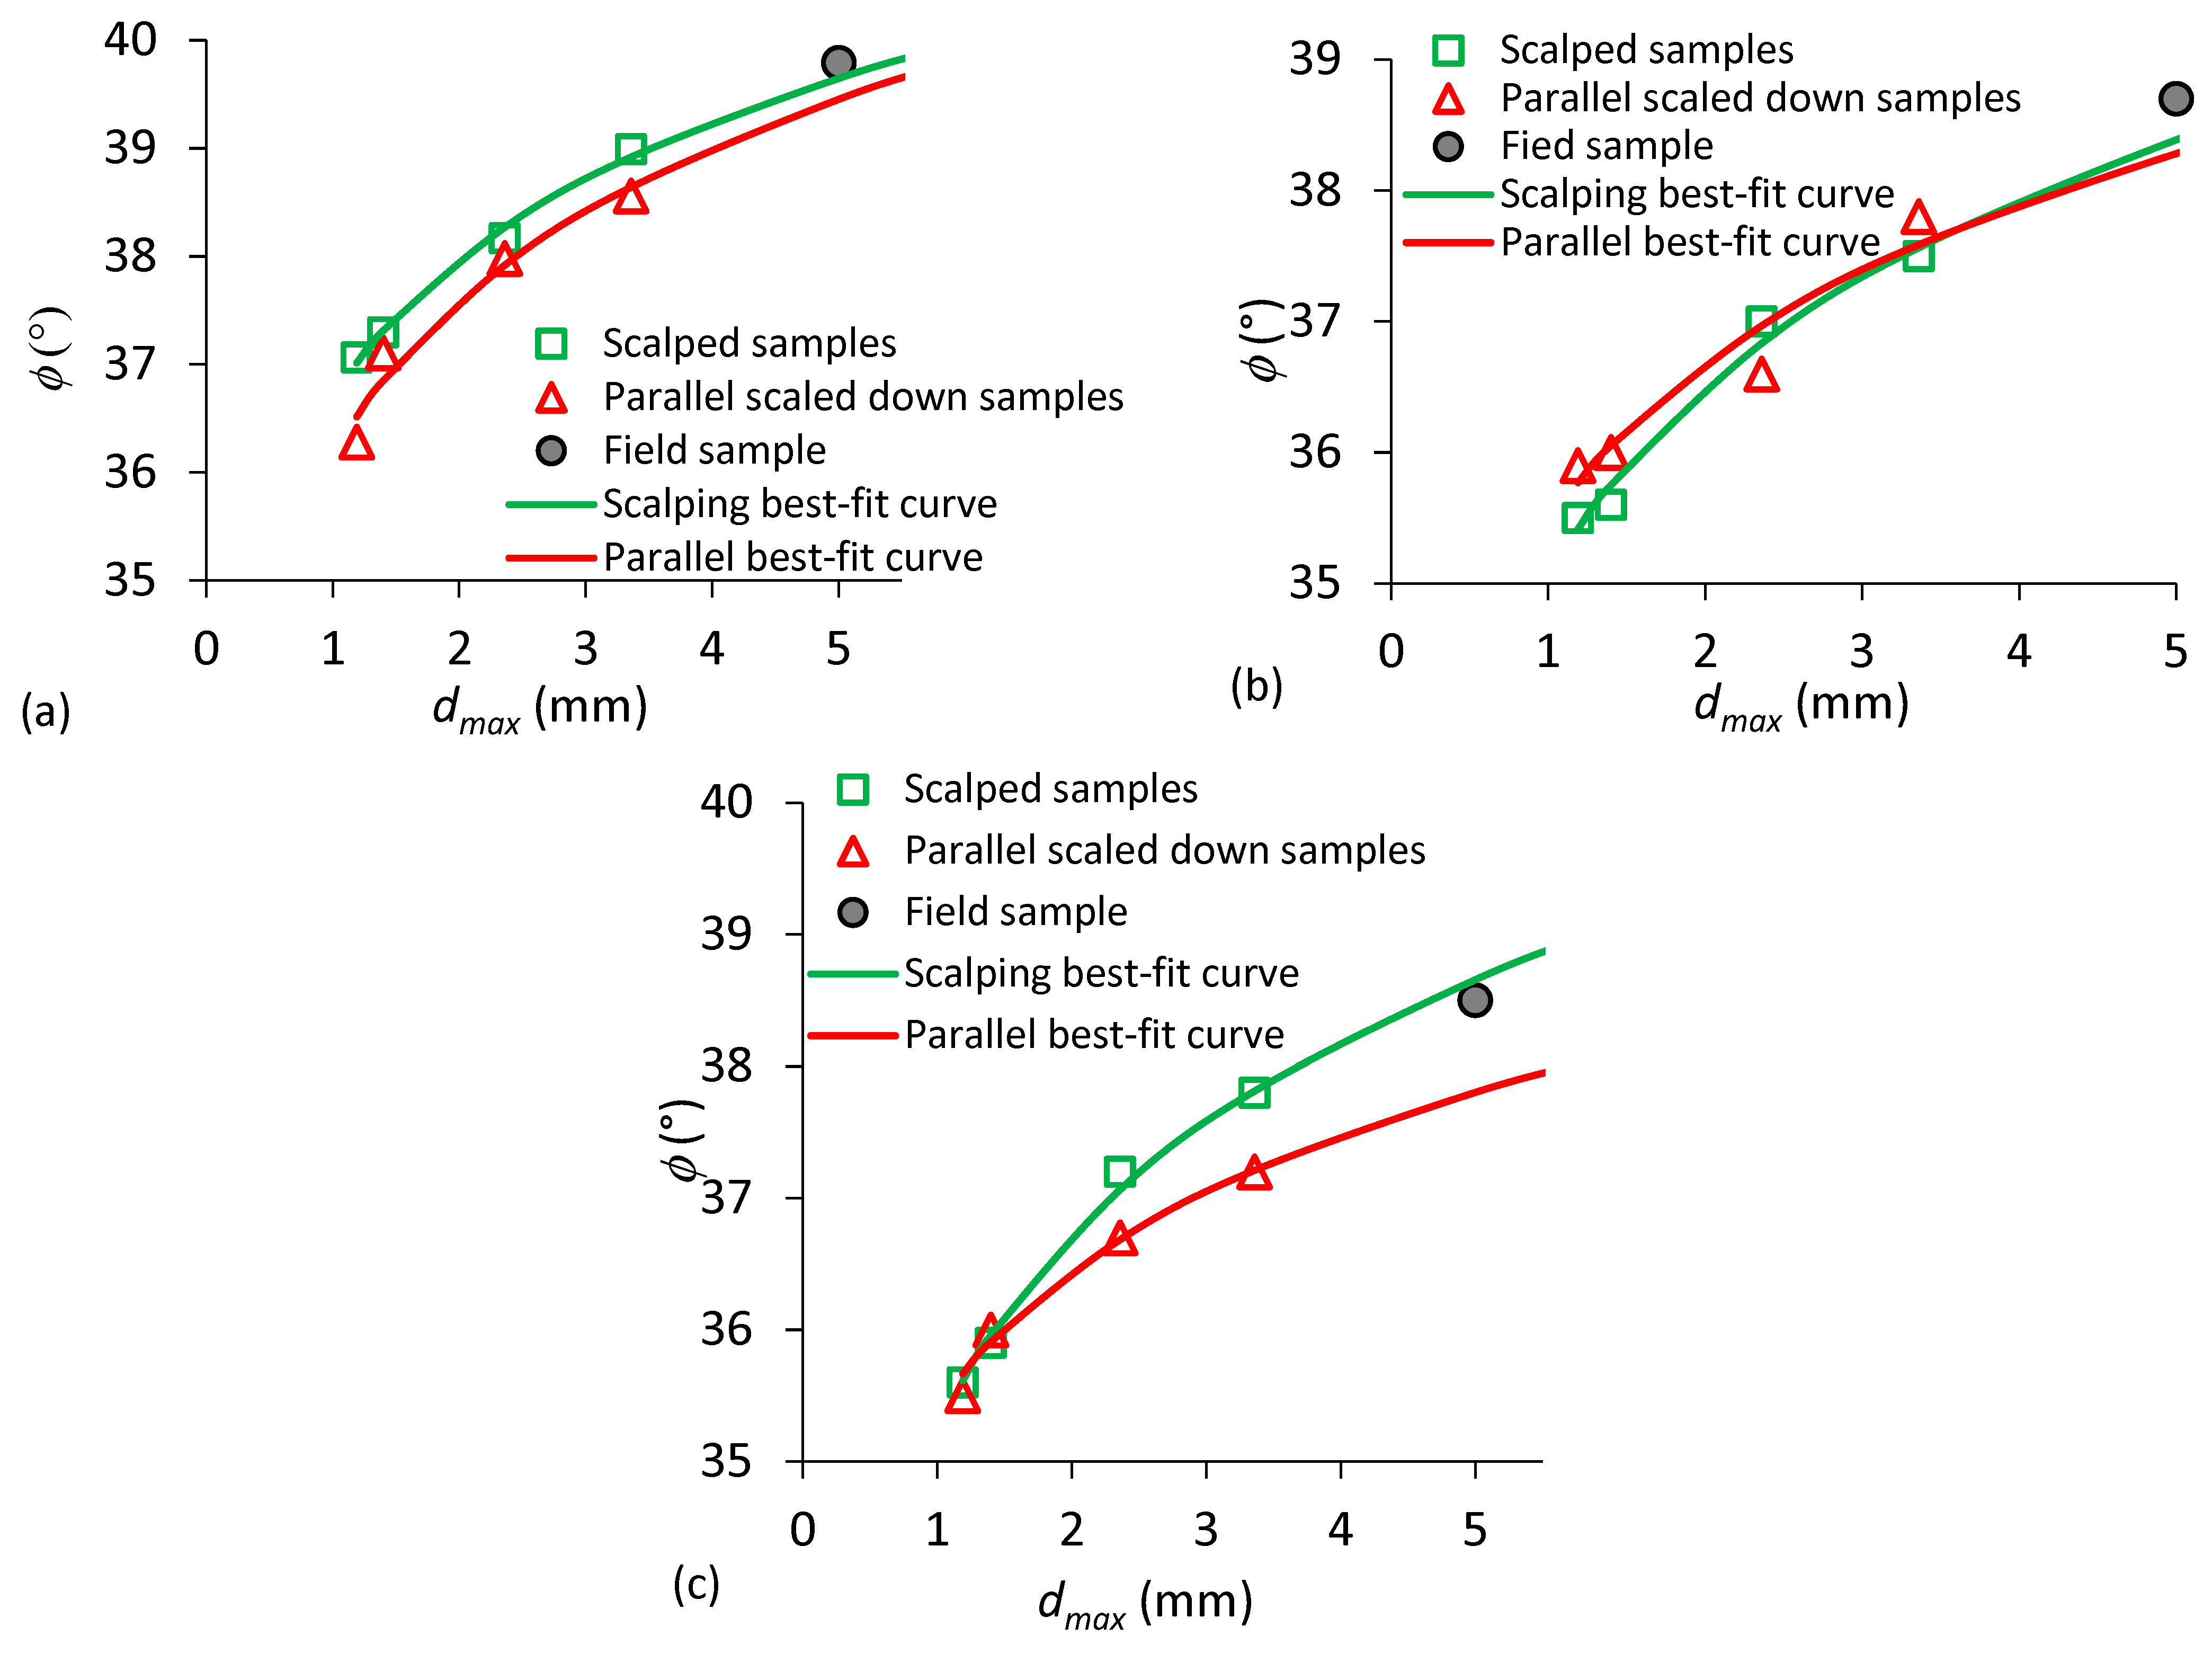
| Material | Scaling down Technique | Curve Fitting Equations Based on the Test Results of Scaled Down Samples | R2 | Friction Angle φ (°) of Field Samples (dmax = 5 mm) | |
|---|---|---|---|---|---|
| Predicted | Measured | ||||
| M1 | Scalping | 0.97 | 39.6 | 39.8 | |
| Parallel | 0.86 | 39.4 | |||
| M2 | Scalping | 0.96 | 38.4 | 38.7 | |
| Parallel | 0.80 | 38.3 | |||
| M3 | Scalping | 0.96 | 38.7 | 38.5 | |
| Parallel | 0.86 | 37.8 | |||
Publisher’s Note: MDPI stays neutral with regard to jurisdictional claims in published maps and institutional affiliations. |
© 2022 by the authors. Licensee MDPI, Basel, Switzerland. This article is an open access article distributed under the terms and conditions of the Creative Commons Attribution (CC BY) license (https://creativecommons.org/licenses/by/4.0/).
Share and Cite
Deiminiat, A.; Li, L. Experimental Study on the Reliability of Scaling Down Techniques Used in Direct Shear Tests to Determine the Shear Strength of Rockfill and Waste Rocks. CivilEng 2022, 3, 35-50. https://0-doi-org.brum.beds.ac.uk/10.3390/civileng3010003
Deiminiat A, Li L. Experimental Study on the Reliability of Scaling Down Techniques Used in Direct Shear Tests to Determine the Shear Strength of Rockfill and Waste Rocks. CivilEng. 2022; 3(1):35-50. https://0-doi-org.brum.beds.ac.uk/10.3390/civileng3010003
Chicago/Turabian StyleDeiminiat, Akram, and Li Li. 2022. "Experimental Study on the Reliability of Scaling Down Techniques Used in Direct Shear Tests to Determine the Shear Strength of Rockfill and Waste Rocks" CivilEng 3, no. 1: 35-50. https://0-doi-org.brum.beds.ac.uk/10.3390/civileng3010003