
Optimization of Workability and Compressive Strength of Self-Compacting Mortar Using Screening Design


Institute of Ceramics, Refractories and Composite Materials, TU Bergakademie Freiberg, 09599 Freiberg, Germany
*
Author to whom correspondence should be addressed.
CivilEng 2022, 3(4), 998-1012; https://0-doi-org.brum.beds.ac.uk/10.3390/civileng3040056
Submission received: 14 October 2022
/
Revised: 4 November 2022
/
Accepted: 6 November 2022
/
Published: 9 November 2022
(This article belongs to the Special Issue Concrete in Structural Engineering for Sustainability)
Abstract
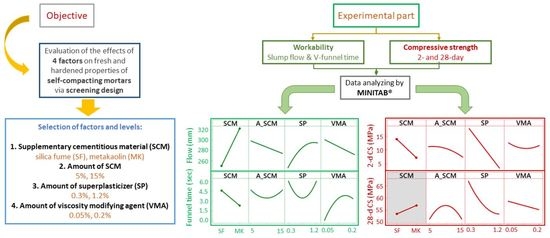
:In this study, the significance of several factors in the performance of self-compacting mortar was statistically investigated. A screening design was used as a suitable design to identify the most important factors that can affect workability and compressive strength. The purpose of the study was to obtain the optimal conditions which can lead to optimal workability (slump flow, funnel time) and maximal compressive strength (2 and 28 days). Four experimental factors each at two levels, the type of supplementary cementitious material (SCM) as silica fume (SF) and metakaolin (MK); the amount of (SCM) at 5% and 15%; superplasticizer (SP) at 0.3% and 1.2% and viscosity modifying agent (VMA) at 0.05% and 0.2% were selected as potential candidates affecting the experimental outputs. The analysis of the data to obtain optimal values of the outputs was carried out by using MINITAB®. To establish the factor levels selected in this study in order to achieve optimal workability and maximal compressive strength, response optimization was applied. The predicted conditions for optimal workability were found to be 8.84% SF, 1.2% SP and 0.15% VMA. The solution proposed to maximize the compressive strength was 0.3% SP, 0.05% VMA and 9% or 9.75% SF for 2 and 28 days, respectively. By setting the factors at the specified levels, experimental values of the slump flow at 278 mm; funnel time at 8.3 s; 2- and 28-day compressive strength at 22.8 and 66.1 MPa were achieved. This resulted in the predicted and experimental values at the optimum conditions being in strong agreement.
1. Introduction
1.1. Background
Self-compacting concrete (SCC) is a new category of high-performance concrete characterized by high flowability, high segregation resistance, and sufficient passing ability. Since it was first proposed by Okamura in 1986, many investigations and various testing methods have been carried out to achieve such durable concrete structures, with high deformability, and segregation resistance [1]. Okamura and Ozawa have worked on improving the self-compatibility of the concrete and mortar by paying close attention to the use of limited aggregate content, the use of a low water-powder ratio and the incorporation of superplasticizers [1]. Self-compacting mortar (SCM) can be defined as a mortar that can be compacted into the formwork under its own weight, without the need for mechanical vibration. SCM is a sensitive mix, strongly dependent on the composition and the characteristics of its constituents. It is characterized by high durability, high viscosity and sufficient segregation resistance due to its low water–powder ratio. This balance is made possible by the water-reducing admixtures combined with additional filler materials [2,3]. One of the disadvantages of self-compacting mortar is its high cost associated with its high content of Portland cement and the addition of chemical admixtures. To reduce the cost of self-compacting mortar one alternative is to use supplementary cementitious materials such as silica fume, fly ash, slag and metakaolin [4]. Self-compatibility in the fresh state and their strong resistance to environmental factors are the most important properties of such high-performance mortars [5]. However, self-compacting mortar can be additionally optimized for better rheology and physic-chemical properties, as reported by several studies [6,7,8]. The optimization of mix proportions based on targeted fresh and hardened properties of SCC was recently evaluated by grey relational analysis [9]. Various variables such as the content of sand, fly ash, granulated ground blast furnace slag (GGBS) and the particle size of coarse aggregates have been adjusted from multiple points of view to accomplish the ideal fresh and hardened properties of SCC. Different experimental designs have been recently used to design the experiments, and analyze the outputs with the goal of achieving the optimal result, as already reported by different investigators [10,11,12,13,14].
1.2. Design of Experiments (DOE)
According to Box et al. [15], “The use of statistical experimental design makes it possible, while minimizing the influence of experimental error, to experiment with numbers of factors simultaneously and to get a clear picture of how they behave separately and together”. Furthermore, to have a better understanding of the data, and achieve the optimal result, it is also important to have a general knowledge of the problem, keep the design as simple as possible, and recognize the difference between practical and statistical significances [16]. The best-known optimization strategy is one-factor-at-a-time and is carried out by checking the impact of one factor at a time, while the others are kept at a constant level. This method selects the optimal combination of factor levels, but it comes with the inconvenience of not including the interactions between the factors. The appropriate design to deal with several factors and consider the interactions between them when they are present is the factorial design [17].
A factorial design considers all possible combinations of all factors across all levels. A general factorial design with k factors, at n levels, results in nk factorial runs. The number of experiments required increases exponentially as the number of factors increases. When dealing with a large number of factors, fractional factorial designs with nk−p experiments, where k is the number of factors and p is the size of the fraction, reduced the number of experiments [18].
Screening designs are part of fractional factorial designs (saturated fractional factorial designs), which can estimate the main effects of all the studied factors only with a low number of runs [19]. Factor screening is a process of starting with a long list of possibly significant factors and ending with a smaller number of significant factors that affect the response. More specifically, the screening method permits the simultaneous screening of several factors using a number of runs comparable to, but greater than, the number of factors [20]. Part of the screening design is the Plackett–Burman set of designs and the definitive screening design [21]. Definitive screening designs are a kind of resolution IV. In resolution IV designs, the main effects are not confounded with any two-factor interactions or with each other; however, two-factor interactions are confounded with each other [22]. The mathematical model of a screening function can be represented as a dependence between the observed response and the experimental factors as shown in Equation (1).
y = f (x1, x2, …, xk) + e
According to this, the response is a measure of the result which is of interest (f) and the error (e) [23].
2. Materials and Methods
2.1. Composition and Mix Design
Experimental work was carried out on self-compacting mortars. The mortar was composed of Portland cement (PC), supplementary cementitious materials (SCMs), and fine aggregates. Portland cement of CEM I 42.5 R by Opterra, was used as a binder. Silica fume (SF) and metakaolin (MK) were used as SCMs. Roba sand with a maximum grain size of 2 mm was used as fine aggregate. Two chemical admixtures were additionally used. A polycarboxylic ether-based superplasticizer (SP) of the type Melflux® 2561 F and a viscosity modifying agent (VMA) of the type Starvis® 3003 F supplied from BASF were used to enhance the workability. The formulations used are shown in Table 1. Compositions of 25% binder, 27% aggregate and 5, 10 or 15% SCM, respectively for formulation 1, 2 and 3 were used. The chemical and mineralogical compositions of the materials are shown in Table 2. The chemical composition was estimated by EDAX and the mineralogical composition was determined by XRD.
The mortars were prepared in a Hobart mixer with two grading speeds, according to DIN EN 196-1 [24], with the lower speed at 62 ± 5 rpm and the high speed at 125 ± 10 rpm. The experiments were performed at 20 ± 1 °C. The water-to-powder ratio (where the term powder includes PC and SCM) was fixed at 0.6. The water was added to the premixed dry components and afterwards, the mortar was mixed for 90 s at low speed. A manual mixing process was then performed for 30 s to scrape off the walls and the bottom of the bowl and the mortar was subsequently mixed at high speed for another 90 s.
The experimental work consists of the evaluation of the effect of four controllable factors, each at two levels, on workability and strength development. Screening design resulting in 14 experimental runs was chosen to determine the optimal conditions. The high, low, and central levels defined for the screening design are listed in Table 3. The low and high levels for the factors were selected according to the technical data sheet and some preliminary trials.
The design matrix of 14 experimental runs (54 required for a full factorial design) is shown in Table 4. Experiments on fresh (slump flow, V-funnel time) and solid states (2- and 28-day compressive strength) were conducted and the outputs were statistically evaluated by design of experiments. The purpose of the work was to achieve optimal workability and maximize compressive strength, based on the selected factor levels, and perform as few experiments as possible.
2.2. Analytical Methods
- The slump flow test
The slump flow test is used to assess the horizontal free flow of self-compacting mortar using Hagerman’s mini-slump cone (6 × 7 × 10 cm3) according to the DIN EN 196-1 standard [24]. After the cone is filled with freshly mixed mortar, it is raised upwards and the mortar is permitted to flow out freely. After the mortar’s stream has halted, the diameter in two perpendicular directions is estimated and the mean of the two measured diameters is recorded.
- V-funnel test
A V-funnel test on the self-compacting mortar is used to evaluate the mortar’s ability to pass through a narrow space. The equipment used in this research consists of a V-shaped funnel. To carry out this test, the V-funnel is filled up with mortar without packing or vibrating. After the form has been filled with mortar, the trap door is opened permitting the mortar to flow out under gravity, and the time taken for it to flow through the apparatus (starting when the trap door is opened until the light is seen from above through the funnel) is estimated. For SCC, a flow time in the range of 7 to 11 s is considered appropriate according to the EFNARC (2002) [25].
- Strength test
Compressive strength tests are performed according to DIN EN 196-1 [24]. Moulds (prisms 40 × 40 × 160 mm3) of the prepared samples were placed in a climatic chamber with 100% RH for the first 24 h, and afterwards the demolded specimens were cured underwater at 20 ± 1 °C before strength-testing. At the required age, the specimens were taken from their wet storage, covered with a damp cloth until tested, broken in flexure into two halves and each half was tested for strength in compression.
- Minitab
MINITAB® was used as a statistical software program to analyze the data. DOE in Minitab provides the user with several designs such as screening, factorial, response surface, mixture, and Taguchi design [26]. In this study, a screening design was used as an appropriate method to deal with several factors.
As a statistical program for data analysis, Minitab uses different statistical tools such as analysis of variance (ANOVA) (see [27]), a regression model, a t-test, a p-value, coefficients of determination (), desirability values, etc. [28]. The regression model describes the data variation by various types of models: linear or quadratic models; with linear, interaction, quadratic or cubic terms (see [29]). The coefficient of determination () determines the proportion of variation in the observed response that is explained by the model. In other words, it indicates the goodness of fit for the model. The adjusted coefficient of determination (), which does not necessarily increase when a new term is added to the regression model, has been taken into consideration. The coefficient of determination lies in the interval [0, 1]. Generally, a higher coefficient indicates a better fit for the model [30,31].
Minitab offers the opportunity to optimize the result. With regard to the point of the study, it is possible to maximize, minimize or assign a target for one or more responses at the same time. Minitab calculates the desirability value (D) which evaluates how each factor optimizes the response. The individual desirability function can take any value between 0 and 1.
3. Results
3.1. Fresh Properties
- Slump flow and V-funnel time
The results of the impact of all factors as the type of SCM, amount of SCM, SP, and VMA in the slump flow and V-funnel time of self-compacting mortar are shown in Table 5. The regression coefficients, standard errors of the coefficients, t values, and p-values for each parameter in the slump flow and funnel time are summarized in Table 6. According to the p-values, for the slump flow, the main effects (SCM, A_SCM, SP, VMA), the quadratic effect of SP, and the interactions (SCM*A_SCM, SCM*SP) were statistically significant at a 95% confidence level (p < 0.05).
For the funnel time only the SCM and the VMA were significant as the main effects. The quadratic effects of the A_SCM, SP, VMA, and the interaction SCM*SP were also statistically significant (p < 0.05), indicating that the effect of the A_SCM, SP, or VMA on the funnel time was not linear, or that the response surface contains curvature. The coefficient columns (Table 6) show the regression coefficients for the models. The coefficients demonstrate the mean change in response from changing by one the level of one factor while holding other factors in the model constant. For instance, according to the regression coefficients, it is visible that by increasing the level of the VMA by one, the slump flow will decrease by an average of 14.5 mm, while the funnel time will increase by 1.7 s.
The polynomial functions that fit the data and explain most of the variation in the slump flow and funnel time are represented by Equations (2) and (3), respectively. As is shown here, the polynomial functions include linear terms and second-degree terms, which are both quadratic and two-factor interaction terms.
Slump flow = 286.5 + 35.8 SCM − 12.2 A_SCM + 24.1 SP − 14.5 VMA − 16.2 SP*SP
+ 19 SCM*A_SCM − 14.5 SCM*SP
+ 19 SCM*A_SCM − 14.5 SCM*SP
Funnel time = 3.5 − 1.2 SCM + 1.7 VMA + 1.3 A_SCM*A_SCM + 2.7 SP*SP
− 1.8 VMA*VMA + 0.8 SCM*
− 1.8 VMA*VMA + 0.8 SCM*
The adjusted coefficients of determination (R2 (adj)), (Table 6) indicate that 96.4% and 83.2% of the total variation are explained by the respective models of the slump flow and funnel time. The predicted coefficients of determinations (R2 (pred)) demonstrate that the predictability of the models was 87.8% and 55.4%, respectively.
Figure 1 shows the Pareto charts of the standardized effects for the slump flow and funnel time. The Pareto chart for flow shows that the type of SCM was the factor that had the greatest impact on the workability of the composition. The SP was the second most important factor in improving the workability of the mortar, the quadratic term of which was also significant, meaning that it affects the response according to a second-order polynomial. Furthermore, all terms which extend beyond the reference line were statistically significant. For the V-funnel time, the VMA plays the most important role, followed by the type of SCM. All factors below the red line, with smaller effects, were not statistically significant. Figure 2 shows the main effect plot for the slump flow. The main effects plot illustrates that the type of SCM and SP had a strong positive effect on the flow values. Differently from the above-mentioned factors, the VMA and A_SCM demonstrate a significant negative effect. The shapes of the lines for the A_SCM, SP and VMA illustrate that only the SP has a non-linear (quadratic) effect on the flow values.
Figure 3 represents the main effect plot for the V-funnel time. The plot demonstrates that the VMA has a strong positive effect on the funnel time. As compared to other factors the addition of the VMA causes a decrease in mortar flow and an increase in flow time (V-funnel test). The type of SCM additionally impacts strongly the funnel time. The use of SF in comparison to MK gives higher funnel time values. The SP and VMA curves illustrate that these effects have significant curvature. Even though the main effect of the SP was not significant (p-value less than 0.05), it was still considered in the model because of the significance of the quadratic term.
After the determination of the factors which had the most significant effects in both responses, the next step was the optimization of the factor levels, to achieve the optimum workability of self-compacting mortar. The response optimizer, as a tool provided by MINITAB® for optimization, was used to obtain optimal conditions based on the current level selection and the chosen models. The goal was to achieve a value of the slump flow between 250 mm and 310 mm and a value of the V-funnel time between 7 s and 11 s (considered appropriate according to the EFNARC (2002)) [25]. Hence the responses need to be in those ranges; the target for the slump flow was 280 mm and the funnel time was 9 s.
The obtained optimized results are summarized in Table 7. These results demonstrate that the use of the specified levels will give the desired output value. The composite desirability function value of 0.96 indicates this. Based on these results, the best conditions were found to be 8.84% of silica fume, 1.20% SP and 0.15% VMA. The predicted values of 280 mm slump flow and 8.5 s funnel time indicate that under these conditions, the goal can be successfully achieved.
The final goal was to perform the slump flow test and V-funnel time test based on the factor levels suggested by response optimization. The results of the experiments were 278 mm for the slump flow and 8.3 s for the V-funnel time. These results demonstrate that the main goal of going to the center of the box was successfully achieved. Figure 4 represents the 14 experimental results of the designed runs and the optimal result.
3.2. Solid State Properties
- Compressive strength
The results of the effects of the four factors on 2-day and 28-day compressive strength are represented in Table 8. The regression coefficients, standard errors of the coefficients, T-values, and p-values are shown in Table 9. p-values for 2-day compressive strength demonstrate that at the studied levels, the four main effects (SCM, A_SCM, SP, VMA), the quadratic terms of A_SCM and VMA, and the interactions SCM*A_SCM, SCM*SP were statistically significant at the 95% confidence level. The regression coefficients and T-values indicate that the effects of these factors are negative. This means that the 2-day compressive strength decreases by 7.2, 3.3, 1.9 and 0.5 MPa with an increase in the level of the SP, SCM, A_SCM and VMA, respectively.
p-values for the 28-day compressive strength indicate that only two main effects (the SP and VMA) and the quadratic terms of the A_SCM and SP are significant. Because the other factors were not significant, they were not included in Table 9.
According to the regression coefficients and T-value signs, the main effects are also negative. The increase in the level of the SP and VMA by one decreased the 28-day compressive strength by 6.7 and 1.7 MPa, respectively.
The polynomial functions that express the relationship between the reported strength values and the factors are represented by Equations (4) and (5), for 2 and 28 days.
2 d comp. str. = 10.6 − 3.3 SCM − 1.9 A_SCM − 7.2 SP − 0.5 VMA
− 1.3 A_SCM*A_SCM + 1.5 VMA*VMA − 1.4 SCM*A_SCM − 1.1 SCM*SP
− 1.3 A_SCM*A_SCM + 1.5 VMA*VMA − 1.4 SCM*A_SCM − 1.1 SCM*SP
28 d comp. str = 57 − 6.7 SP − 1.7 VMA − 5.6 A_SCM*A_SCM + 3.2 SP*SP
The high values of R2 (adj) for the 2-day compressive strength indicate that 99.3% of the total variation is explained by the model. The predicted coefficient of determination value of 98.3% indicates that the predictability of the model is very good.
For the 28-day compressive strength, the R2 (adj) value indicates that the model explains 94% of the total variation. The R2 (pred) value of 88% demonstrates that the model can predict relatively well.
Figure 5 shows the Pareto charts of the standardized effects for the 2-day and 28-day compressive strength. According to the plots, all terms which extend beyond the reference line were statistically significant at the 5% significance level. These plots demonstrate that the SP is the factor with the greatest effect on the compressive strength of both ages.
Figure 6 and Figure 7 show the main effect plot for the 2-day and 28-day compressive strength, respectively. The compressive strength decreases with the SP, which has the highest negative coefficient. The SCM has a significant impact on the 2-day compressive strength, but it does not affect the 28-day compressive strength. The A_SCM was statistically significant especially for the 28-day period, as a quadratic term, expressed by curved lines. These results demonstrate that moderate levels of substitution of 10% improve significantly the strength development of the mortar. The addition of the VMA plays the least significant role in the compressive strength of both ages (almost horizontal lines).
According to the experimental results shown above, the maximum values of the compressive strength (especially for 2-day) can be achieved by setting all factor levels at the lowest levels. The increase in the factor levels indicates a decrease in the strength results. This conclusion was tested by using response optimization in the next step. The optimal conditions for maximizing the responses and the optimized results are summarized in Table 10. The desirability function value of 1 indicates that the response value is very close to the target. Based on these results, the best conditions for a maximum compressive strength were found to be 0.30% SP, 0.05% VMA, and 9.04% or 9.75% silica fume for 2 days and 28 days, respectively. The predicted values of 22.1 MPa and 68.8 MPa for 2 days and 28 days, respectively, indicate that under these conditions, relatively higher values than the upper experimental values (20.9 MPa and 64.3 MPa) can be achieved.
In the final step it was observed if the predicted and experimental values were in good agreement. The experiments for both solutions were performed based on the factor levels suggested by response optimization. Figure 8 shows the experimental results of the 14 designed experiments and the optimized experiments. The 2-day compressive strength result was 22.8 MPa and the 28-day compressive strength result was 66.1 MPa. A comparison between the optimal experimental results and the maximal strength value achieved before optimization shows an increase of around 2 MPa for both periods.
4. Discussion
It was found that different studies, such as [7,8,10,11,12], have evaluated the rheological and physical properties of self-compacting concrete and mortars, including various factors such as different supplementary cementitious materials, different amounts of chemical admixtures, different water-to-powder ratios, etc., by using different DOE methods. They proved that DOE can simplify the design process to optimize a composition by reducing the number of trials needed to achieve a balance among all factors.
In this study, DOE was used to evaluate the effects of the type of SCM, amount of SCM, as well as the amount of SP and VMA on self-compacting mortar. The idea behind the study was to be able to screen the less important factors and focus more on the effect of the most significant factors. In terms of fresh properties, the results proved that the combined use of superplasticizer and viscosity-modifying agent at a precise report plays a key role in enhancing the flow while providing stability. It was found that an increase of 0.3% to 0.75% in the SP addition improved the slump flow and decreased the flow time. When the amount of SP was increased further, from 0.75% to 1.2%, a further improvement in workability, associated with bleeding and segregation as well as an increase in the flow time of the mortar was noticed. Those results lead to the conclusion that an increase in the SP content up to 1.2% enhances the workability of the mixtures up to a mean value of 295 mm slump flow. This conclusion remains in line with other studies that have investigated the influence of SP on cementitious materials [3,32].
The incorporation of the VMA had a drastic effect on the V-funnel time and a considerable effect on the flow behavior of the mortar. The compositions containing the highest amount of VMA exhibited a decrease in flow values, no bleeding and segregation resistance; this was related to the increase in plastic viscosity of the mortar. The increase in VMA from 0.05% to 0.15% caused a high, almost linear increase in the flow time mean from zero to 4 s. Any other addition after that decreased the V-funnel time of the mortar and resulted unnecessarily. The addition of the VMA into the composition enhanced the resistance of the material to bleeding and segregation, especially in combinations with high amounts of SP, as has been reported here and in previous studies [33].
Furthermore, it was observed that the substitution of the MK in comparison to the SF improved the workability and decreased the viscosity of the material. However, the flowability of the material containing the SCM became poorer with the increasing substitution level. The SCM substitution of 10% gave the lowest funnel time values as compared to 5% and 15%.
In terms of mechanical properties, the compressive strength decreased with an increase in SP dosage. As was reported in previous studies, the early-age compressive strength decreased with the increase in the SP dosage at relatively low percentages [34]. It was also found that a 10% replacement of Portland cement by MK or even SF enhanced the mortar’s compressive strength at 28 days. This result is in line with the work by Li and Ding [35], reporting that the maximal compressive strength at 28 days was achieved when the PC was replaced by MK at 10%.
However, the 2-day compressive strength decreases as the SCM substitution increases. For 2-day compressive strength, the effect of the type of SCM used interacts with the effect of the amount of substitution and SP percentage (see Figure 5). This statistical conclusion can be interpreted as follows: the decrease in the compressive strength of samples with MK as compared to SF is more pronounced for 15% of the cement substitution and 1.2% of the SP addition. This may be mostly related to the kinetic of the pozzolanic hydration reactions of the MK at an early age.
The results of this study demonstrate that the design of experiments based on the screening method can be effectively used to help in giving a clear overview of the effect and importance of the factors incorporated in the study.
5. Conclusions
According to the analysis of the results, it can be concluded that:
- Screening the design allows a simple, less costly method to determine the composition of self-compacting mortars and concrete.
- The amounts of admixtures necessary for an optimal or specified workability can be determined with just a few experimental runs.
- Specifically, for the study presented:
- ○
- The desired conditions for optimal workability were found to be 8.84% silica fume, 1.2% SP and 0.15% VMA at w/p = 0.6.
- ○
- The maximal values of strength can be achieved by using 9–9.8% silica fume, 0.3% SP and 0.05% VMA.
- In general, the influence of various constituents of self-compacting mortars on the workability and strength could clearly be identified or confirmed, respectively:
- ○
- The slump flow values increase with the increase in the SP dosage and decrease with the increase in the VMA.
- ○
- VMA has the highest impact on the funnel time, increasing it according to an almost linear function with an optimum at 0.15%.
- ○
- SP has the highest effect on the compressive strength. For any given type and amount of SCM, the increase in SP leads to a decrease in strength.
- ○
- The dosage of VMA showed no significant effect on the compressive strength.
- ○
- The type of SCM used has a considerable impact on the slump flow and funnel time. The use of MK as compared to SF increases the slump flow and decreases the funnel time.
- ○
- The increasing substitution of SCM has a negative effect on the spread flow values of the mortar and no considerable effect on the funnel time.
- ○
- The type and dosage of SCM necessary for optimum strength values can be determined by the screening method used.
Author Contributions
Conceptualization, A.Q. and T.A.B.; methodology, A.Q.; software, A.Q.; validation, A.Q. and T.A.B.; formal analysis, A.Q.; investigation, A.Q.; resources, A.Q.; data curation, A.Q.; writing—original draft preparation, A.Q.; writing—review and editing, A.Q. and T.A.B.; visualization, A.Q. and T.A.B.; supervision, T.A.B.; project administration, T.A.B.; funding acquisition, A.Q. and T.A.B. All authors have read and agreed to the published version of the manuscript.
Funding
This research was funded by the German Academic Exchange Service (DAAD), grant number 57381412. The authors are grateful for the generous support.
Data Availability Statement
The data presented in this study are available on request from the corresponding author.
Conflicts of Interest
The authors declare no conflict of interest.
References
- Okamura, H.; Ouchi, M. Self-Compacting Concrete. J. Adv. Concr. Technol. 2003, 1, 5–15. [Google Scholar] [CrossRef]
- Su, Y.; Luo, B.; Luo, Z.; Huang, H.; Li, J.; Wang, D. Effect of Accelerators on the Workability, Strength, and Microstructure of Ultra-High-Performance Concrete. Materials 2022, 15, 159. [Google Scholar] [CrossRef] [PubMed]
- Leemann, A.; Winnefeld, F. Influence of workability and admixtures on the segregation of concrete during compaction. In Proceedings of the 2nd International Symposium on Advances in Concrete through Science and Engineering, Quebec City, QC, Canada, 11–13 September 2006. [Google Scholar]
- Ramanathan, P.; Baskar, I.; Muthupriya, P.; Venkatasubramani, R. Performance of self-compacting concrete containing different mineral admixtures. KSCE J. Civ. Eng. 2013, 17, 465–472. [Google Scholar] [CrossRef]
- Ozawa, K.; Sakata, N.; Okamura, H. Evaluation of Self-Compactibility of fresh concrete using the funnel test. Concr. Libr. JSCE 1994, 1994, 61–70. [Google Scholar]
- Sonebi, M.; Grünewald, S.; Walraven, J. Filling Ability and Passing Ability of Self-Consolidating Concrete. ACI Mater. J. 2007, 104, 162–170. [Google Scholar]
- Sonebi, M. Medium strength self-compacting concrete containing fly ash: Modelling using factorial experimental plans. Cem. Concr. Res. 2004, 34, 1199–1208. [Google Scholar] [CrossRef]
- Huseni, K.; Vilasrao, P.S.; Tamang, T.D.; Abdul Rahim, A. Optimization of strength properties for Self-Compacting Concrete byTaguchi Method. Int. J. Sci. Eng. Res. 2016, 7, 1719–1724. [Google Scholar] [CrossRef]
- Ding, X. The Optimization of Mix Proportion Design for SCC: Experimental Study and Grey Relational Analysis. Materials 2022, 15, 1305. [Google Scholar] [CrossRef]
- Mandal, A.; Roy, P. Modeling the compressive strength of molasses–cement sand system using design of experiments and back propagation neural network. J. Mater. Process. Technol. 2006, 180, 167–173. [Google Scholar] [CrossRef]
- Ghezal, A.; Khayat, K. Optimizing self-consolidating concrete with limestone filler by using statistical factorial design methods. ACI Mater. J. 2002, 99, 264–272. [Google Scholar]
- Shaheen, N.; Rizwan, S.A.; Khushnood, R.A.; Bier, T.A. Mechanical and energy performance of variably cured effective microorganisms cementitious composite designed via Taguchi. J. Clean. Prod. 2021, 310, 127350. [Google Scholar] [CrossRef]
- Siamardi, K. Optimization of fresh and hardened properties of structural light weight self-compacting concrete mix design using response surface methodology. Constr. Build. Mater. 2022, 317, 125928. [Google Scholar] [CrossRef]
- Suji, D.; Adesina, A.; Mirdula, R. Optimization of self-compacting composite composition using Taguchi-Grey relational analysis. Materialia 2021, 15, 101027. [Google Scholar] [CrossRef]
- Box, G.E.P.; Hunter, J.S.; Hunter, W.G. Statistics for Experimenters: Design, Innovation, and Discovery; John Wiley & Sons: Hoboken, NJ, USA, 2005; Volume 672. [Google Scholar]
- Montgomery, D. Design and Analysis of Experiments, 9th ed.; John Wiley & Sons: Hoboken, NJ, USA, 2017. [Google Scholar]
- Barrentine, L.B. An Introduction to Design of Experiments: A Simplified Approach; ASQ Quality Press: Milwaukee, WI, USA, 1999; Volume 114. [Google Scholar]
- Cavazzuti, M. Optimization Methods; Springer: Berlin/Heidelberg, Germany, 2013. [Google Scholar]
- Deming, S.N.; Morgan, S.L. Experimental Design: A Chemometric Approach, 2nd ed.; Elsevier Science: Amsterdam, The Netherlands, 1993; Volume 11, p. 436. [Google Scholar]
- Allen, T.T. Introduction to Engineering Statistics and Lean Sigma, 2nd ed.; Springer: London, UK, 2010; Volume 572. [Google Scholar]
- Box, G.E.P.; Meyer, R.D. Finding the Active Factors in Fractionated Screening Experiments. J. Qual. Technol. 1993, 25, 94–105. [Google Scholar] [CrossRef]
- Anderson, M.; Whitcomb, P. Screening process factors in the presence of interactions. In Annual Quality Congress Proceedings-American Society for Quality Control; ASQ: Milwaukee, WI, USA, 2004; pp. 471–480. [Google Scholar]
- Carlson, R. Preludes to a screening experiment: A tutorial. Chemom. Intell. Lab. Syst. 1992, 14, 103–114. [Google Scholar] [CrossRef]
- DIN EN 196-1: 1995-5; Methods of Testing Cement-Part 1: Determination of Strength. DIN Deutsches Institut für Normen: Berlin, Germany, 2005.
- EFNARC. Specification and Guidelines for Self-Compacting Concrete, European Federation of Producers and Applicators of Specialist Product for Structures; EFNARC: Norfolk, UK, 2002. [Google Scholar]
- Mathews, P.G. Design of Experiments with MINITAB; ASQ: Milwaukee, WI, USA, 2004. [Google Scholar]
- Sawyer, S.F. Analysis of Variance: The Fundamental Concepts. J. Man. Manip. Ther. 2009, 17, 27E–38E. [Google Scholar] [CrossRef]
- Bass, I. Six Sigma Statistics with Excel and Minitab, 1st ed.; Mcgraw-Hill Professional: New York, NY, USA, 2007; Volume 353. [Google Scholar]
- Larose, D.T. Data Mining Methods and Models, 1st ed.; Wiley-IEEE Press: Hoboken, NJ, USA, 2006; Volume 344. [Google Scholar]
- Srivastava, A.K.; Srivastava, V.K.; Ullah, A. The coefficient of determination and its adjusted version in linear regression models. Econom. Rev. 1995, 14, 229–240. [Google Scholar] [CrossRef]
- Akossou, A.; Palm, R. Impact of data structure on the estimators R-square and adjusted R-square in linear regression. Int. J. Math. Comput. 2013, 20, 84–93. [Google Scholar]
- Ferrari, L.; Kaufmann, J.; Winnefeld, F.; Plank, J. Multi-method approach to study influence of superplasticizers on cement suspensions. Cem. Concr. Res. 2011, 41, 1058–1066. [Google Scholar] [CrossRef]
- Leemann, A.; Winnefeld, F. The effect of viscosity modifying agents on mortar and concrete. Cem. Concr. Compos. 2007, 29, 341–349. [Google Scholar] [CrossRef]
- Rasheed, A.; Usman, M.; Farooq, H.; Hanif, A. Effect of Super-plasticizer Dosages on Fresh State Properties and Early-Age Strength of Concrete. In IOP Conference Series: Materials Science and Engineering; IOP Publishing: Bristol, UK, 2018; Volume 431. [Google Scholar]
- Li, Z.; Ding, Z. Property improvement of Portland cement by incorporating with metakaolin and slag. Cem. Concr. Res. 2003, 33, 579–584. [Google Scholar] [CrossRef]
Figure 1.
Pareto chart of the standardized effects for slump flow (a), and V-funnel time (b).

Figure 2.
The main effects plot for slump flow.

Figure 3.
The main effects plot for V-funnel time.

Figure 4.
Workability box of self-compacting mortar. Gray dots represent the experimental values of 14 designed experiments. The red dot represents the experimental result of the optimized solution.
Figure 4.
Workability box of self-compacting mortar. Gray dots represent the experimental values of 14 designed experiments. The red dot represents the experimental result of the optimized solution.

Figure 5.
Pareto chart of the standardized effects for 2-day (a) and 28-day compressive strength (b).
Figure 5.
Pareto chart of the standardized effects for 2-day (a) and 28-day compressive strength (b).

Figure 6.
Main effects plot for 2-day compressive strength.

Figure 7.
Main effects plot for 28-day compressive strength.

Figure 8.
2-day and 28-day compressive strength results of all formulations.


Table 1.
Formulations of the investigated compositions.
| Formulation | PC (%) | Aggregate (%) | SCM (%) |
|---|---|---|---|
| 1 | 23.75 | 71.25 | 5 |
| 2 | 22.50 | 67.50 | 10 |
| 3 | 21.25 | 63.75 | 15 |
Table 2.
Mineralogical and chemical composition of the materials used.
| PC (%) | SF (%) | MK (%) | PC (%) | SF (%) | MK (%) | ||
|---|---|---|---|---|---|---|---|
| C3S | 55.2 | 62.2 | 0.1 | 0.1 | |||
| C2S | 16.4 | 20.0 | 97.4 | 54.2 | |||
| C4AF | 14.8 | 3.8 | 0.5 | ||||
| C3Acubic | 5.3 | 1.4 | 0.4 | ||||
| C3Aorth | 1.3 | 4.8 | 1.1 | 42.9 | |||
| C | 0.5 | 0.9 | 0.8 | 2.0 | |||
| CH0.5 | 1.6 | 2.7 | 0.2 | 0.2 | |||
| CaCO3 | 1.4 | 0.1 | |||||
| Arcanite | 0.6 | 0.2 | |||||
| Quartz | 3.5 | ||||||
| Feldspares (Microcline, orthoclase) | 9.9 | ||||||
| Illite | 4.0 | ||||||
| Amorphous | 2.8 | 100 | 82.6 |
Table 3.
Factors and levels used in the screening design.
| Factor | Low Level | Center Level | High Level |
|---|---|---|---|
| Supplementary cementitious material (SCM) | SF | - | MK |
| Amount of SCM (A_SCM) (%) | 5 | 10 | 15 |
| Superplasticizer (SP) (%) | 0.30 | 0.75 | 1.20 |
| Viscosity modifying agent (VMA) (%) | 0.05 | 0.12 | 0.20 |
Table 4.
Design matrix of all formulations.
| The Factor Levels | ||||
|---|---|---|---|---|
| Run | SCM | A_SCM | SP | VMA |
| 1 | SF | 15 | 1.20 | 0.20 |
| 2 | MK | 5 | 0.30 | 0.05 |
| 3 | MK | 10 | 1.20 | 0.05 |
| 4 | SF | 10 | 0.30 | 0.20 |
| 5 | MK | 15 | 0.75 | 0.20 |
| 6 | SF | 5 | 0.75 | 0.05 |
| 7 | MK | 5 | 1.20 | 0.12 |
| 8 | SF | 15 | 0.30 | 0.12 |
| 9 | MK | 5 | 0.30 | 0.20 |
| 10 | SF | 15 | 1.20 | 0.05 |
| 11 | MK | 15 | 0.30 | 0.05 |
| 12 | SF | 5 | 1.20 | 0.20 |
| 13 | SF | 10 | 0.75 | 0.12 |
| 14 | MK | 10 | 0.75 | 0.12 |
Table 5.
Design matrix and the results on slump flow spread and V-funnel time.
| Factor Levels | Results | |||||
|---|---|---|---|---|---|---|
| Run | SCM | A_SCM | SP | VMA | Slump Flow (mm) | Funnel Time (s) |
| 1 | SF | 15 | 1.20 | 0.20 | 235 | 8.2 |
| 2 | MK | 5 | 0.30 | 0.05 | 302 | 2.3 |
| 3 | MK | 10 | 1.20 | 0.05 | 334 | 2.7 |
| 4 | SF | 10 | 0.30 | 0.20 | 192 | 7.6 |
| 5 | MK | 15 | 0.75 | 0.20 | 310 | 3.3 |
| 6 | SF | 5 | 0.75 | 0.05 | 298 | 2.5 |
| 7 | MK | 5 | 1.20 | 0.12 | 309 | 5.4 |
| 8 | SF | 15 | 0.30 | 0.12 | 150 | 11.2 |
| 9 | MK | 5 | 0.30 | 0.20 | 277 | 5.7 |
| 10 | SF | 15 | 1.20 | 0.05 | 255 | 3.2 |
| 11 | MK | 15 | 0.30 | 0.05 | 322 | 2.1 |
| 12 | SF | 5 | 1.20 | 0.20 | 282 | 7.2 |
| 13 | SF | 10 | 0.75 | 0.12 | 257 | 4.1 |
| 14 | MK | 10 | 0.75 | 0.12 | 319 | 2.8 |
Table 6.
Regression coefficients, standard error of the coefficients, T-values, and p-values of the factors affecting slump flow and funnel time.
Table 6.
Regression coefficients, standard error of the coefficients, T-values, and p-values of the factors affecting slump flow and funnel time.
| Term | Slump Flow (mm) | Funnel Time (s) | ||||||
|---|---|---|---|---|---|---|---|---|
| Coef | SE Coef | T-Value | p-Value | Coef | SE Coef | T-Value | p-Value | |
| Constant | 286.5 | 5.3 | 53.8 | 0.000 | 3.5 | 0.8 | 4.3 | 0.003 |
| SCM | 35.8 | 2.8 | 12.8 | 0.000 | −1.2 | 0.3 | −3.8 | 0.007 |
| A_SCM | −12.2 | 3.2 | −3.8 | 0.009 | ||||
| SP | 24.1 | 3.2 | 7.5 | 0.000 | ||||
| VMA | −14.5 | 3.2 | −4.5 | 0.004 | 1.7 | 0.4 | 4.7 | 0.002 |
| A_SCM*A_SCM | 1.3 | 0.8 | 1.6 | 0.149 | ||||
| SP*SP | −16.2 | 6.8 | −2.4 | 0.056 | 2.7 | 0.7 | 3.6 | 0.008 |
| VMA*VMA | −1.8 | 0.8 | −2.3 | 0.056 | ||||
| SCM*A_SCM | 19.0 | 3.7 | 5.2 | 0.002 | ||||
| SCM*SP | −14.5 | 3.2 | −4.5 | 0.004 | 0.8 | 0.5 | 1.8 | 0.116 |
R2 = 98.3%, R2 (adj) = 96.4%, R2 (pred) = 87.8%; R2 = 90.9%, R2 (adj) = 83.2%, R2 (pred) = 55.4%.
Table 7.
Optimized results for slump flow and funnel time.
| Setting | Solution | |||
|---|---|---|---|---|
| Response | ||||
| Slump Flow (mm) | V-Funnel Time (s) | SCM | Silica Fume | |
| Goal | Target | Target | A_SCM | 8.84% |
| Lower | 150 | 2.1 | SP | 1.20% |
| Target | 280 | 9 | VMA | 0.15% |
| Upper | 334 | 11.2 | Funnel time fit | 8.5 s |
| Weight | 1 | 1 | Slump flow fit | 280 mm |
| Importance | 1 | 1 | D | 0.96 |
Table 8.
Design matrix and results on 2- and 28-day compressive strength.
| Factor Levels | Results on Compressive Strength (MPa) | |||||
|---|---|---|---|---|---|---|
| Run | SCM | A_SCM | SP | VMA | 2-Day | 28-Day |
| 1 | SF | 15 | 1.20 | 0.20 | 6.7 | 44.9 |
| 2 | MK | 5 | 0.30 | 0.05 | 19.2 | 63.9 |
| 3 | MK | 10 | 1.20 | 0.05 | 1.3 | 57.3 |
| 4 | SF | 10 | 0.30 | 0.20 | 20.8 | 64.3 |
| 5 | MK | 15 | 0.75 | 0.20 | 3.7 | 50.1 |
| 6 | SF | 5 | 0.75 | 0.05 | 14.9 | 53.7 |
| 7 | MK | 5 | 1.20 | 0.12 | 1.0 | 48.0 |
| 8 | SF | 15 | 0.30 | 0.12 | 18.2 | 62.2 |
| 9 | MK | 5 | 0.30 | 0.20 | 19.1 | 61.6 |
| 10 | SF | 15 | 1.20 | 0.05 | 8.1 | 48.9 |
| 11 | MK | 15 | 0.30 | 0.05 | 13.1 | 60.4 |
| 12 | SF | 5 | 1.20 | 0.20 | 8.0 | 45.7 |
| 13 | SF | 10 | 0.75 | 0.12 | 14.5 | 55.2 |
| 14 | MK | 10 | 0.75 | 0.12 | 6.5 | 57.7 |
Table 9.
Regression coefficients, standard error of the coefficients, T-values, and p-values of the factors affecting 2-day and 28-day compressive strength.
Table 9.
Regression coefficients, standard error of the coefficients, T-values, and p-values of the factors affecting 2-day and 28-day compressive strength.
| Compressive Strength | ||||||||
|---|---|---|---|---|---|---|---|---|
| Term | 2-Day | 28-Day | ||||||
| Coef | SE Coef | T-Value | p-Value | Coef | SE Coef | T-Value | p-Value | |
| Constant | 10.6 | 0.4 | 26.4 | 0.000 | 57.0 | 1.0 | 58.3 | 0.000 |
| SCM | −3.3 | 0.2 | −20.5 | 0.000 | ||||
| A_SCM | −1.9 | 0.2 | −10.3 | 0.000 | ||||
| SP | −7.2 | 0.2 | −38.7 | 0.000 | −6.7 | 0.5 | −12.9 | 0.000 |
| VMA | −0.5 | 0.2 | −2.6 | 0.048 | −1.7 | 0.5 | −3.3 | 0.009 |
| A_SCM*A_SCM | −1.3 | 0.4 | −3.3 | 0.021 | −5.6 | 1.0 | −5.5 | 0.000 |
| SP*SP | 3.2 | 1.0 | 3.1 | 0.012 | ||||
| VMA*VMA | 1.5 | 0.4 | 3.7 | 0.013 | ||||
| SCM*A_SCM | −1.4 | 0.2 | −7.2 | 0.001 | ||||
| SCM*SP | −1.1 | 0.2 | −4.5 | 0.006 | ||||
| R2 = 99.7%, R2(adj) = 99.3%, R2(pred) = 98.3% | R2 = 96%, R2(adj) = 94%, R2(pred) = 88% | |||||||
Table 10.
Optimized results for 2-day and 28-day compressive strength.
| Setting | Solution | ||||
|---|---|---|---|---|---|
| Compressive Strength (MPa) | 2-Day | 28-Day | |||
| Response | 2-day | 28-day | SCM | Silica fume | Silica fume |
| Goal | Maximum | Maximum | A_SCM | 9.04% | 9.75% |
| Lower | 1.0 | 44.9 | SP | 0.30% | 0.30% |
| Upper | 20.9 | 64.3 | VMA | 0.05% | 0.05% |
| Weight | 1 | 1 | Comp. streng. fit | 22.1 MPa | 68.8 MPa |
| Importance | 1 | 1 | D | 1 | 1 |
Publisher’s Note: MDPI stays neutral with regard to jurisdictional claims in published maps and institutional affiliations. |
© 2022 by the authors. Licensee MDPI, Basel, Switzerland. This article is an open access article distributed under the terms and conditions of the Creative Commons Attribution (CC BY) license (https://creativecommons.org/licenses/by/4.0/).
Share and Cite
MDPI and ACS Style
Qorllari, A.; Bier, T.A. Optimization of Workability and Compressive Strength of Self-Compacting Mortar Using Screening Design. CivilEng 2022, 3, 998-1012. https://0-doi-org.brum.beds.ac.uk/10.3390/civileng3040056
AMA Style
Qorllari A, Bier TA. Optimization of Workability and Compressive Strength of Self-Compacting Mortar Using Screening Design. CivilEng. 2022; 3(4):998-1012. https://0-doi-org.brum.beds.ac.uk/10.3390/civileng3040056
Chicago/Turabian StyleQorllari, Anxhelina, and Thomas A. Bier. 2022. "Optimization of Workability and Compressive Strength of Self-Compacting Mortar Using Screening Design" CivilEng 3, no. 4: 998-1012. https://0-doi-org.brum.beds.ac.uk/10.3390/civileng3040056