
Scene Understanding for Dimensional Compliance Checks in Mixed-Reality


Division of Sustainable Energy and Environmental Engineering, Graduate School of Engineering, Osaka University, 2-1 Yamadaoka, Suita 565-0871, Japan
*
Author to whom correspondence should be addressed.
CivilEng 2024, 5(1), 1-29; https://0-doi-org.brum.beds.ac.uk/10.3390/civileng5010001
Submission received: 3 October 2023
/
Revised: 14 December 2023
/
Accepted: 24 December 2023
/
Published: 27 December 2023
Abstract
:Building inspections are critical for ensuring compliance with construction standards, but conventional methods, often manual, face challenges in efficiency and consistency due to heavy reliance on human factors. Mixed-reality (MR) solutions could potentially address these challenges as they reportedly achieve good efficiency and accuracy in mapping indoor environments. This research investigates the potential of utilizing a wearable MR device to perform dimensional checks through edge computing of device sensor data, reducing the reliance on human factors. The accuracy of MR-computed dimensions against ground truth data for common building elements was assessed. Results indicate that MR-computed dimensions align well with ground truth for simple objects, but complex objects such as staircases presented limitations in achieving satisfactory results. If-then checks applied to MR-computed dimensions for automated detection of non-compliance were successfully experimented. However, automating compliance checks for standards with complex rules requires further investigation. This research sheds light on the potential of MR solutions for building inspections and highlights future research directions to enhance its applicability and effectiveness in the construction industry.
1. Introduction
Building inspections are crucial in the construction process to ensure buildings are safe and serviceable for the general public [1]. These inspections often involve dimensional, verticality, and flatness checks and are usually conducted manually. The inspection process is often time-consuming as records are largely paper-based [2,3]. In addition, inspections are often conducted visually and manually by multiple experts with the help of basic measuring tools. This often leads to inconsistencies due to heavy reliance on human factors [4]. Despite the commercial availability of various construction technologies that could assist with site inspections, their adoption remains low. This is primarily attributed to factors such as a lack of knowledge, cost and time constraints, and the absence of necessary underlying process models to utilize these technologies effectively [3]. Nonetheless, investments in construction technology have been increasing over the years [5], and construction companies have a high interest in investing in augmented reality (AR) technologies [6].
Extended reality (XR) encompasses AR, virtual reality (VR), and mixed reality (MR), which is defined as a combination of AR and augmented virtuality where both the virtual and real world are presented together [7]. A review of these technologies revealed that VR’s strength is in its immersive capabilities, but applications are restricted to virtual environments, whereas AR facilitates decision-making through improved visualization of virtual objects augmented on physical space, and MR offers a unique combination of VR’s immersive qualities and AR’s enhanced visualization capabilities [8]. Due to these qualities, MR is highly suited for on-site applications that require interactive immersion. Apart from built industry applications, it has been widely studied for applications such as virtual tourism [9,10], augmenting instructions in medical applications [11,12], enhancing education by facilitating understanding of complex problems [13,14], and for heritage BIM creation and heritage experiences [15,16,17]. Despite the successful MR applications in various fields that demonstrate the advantages of MR in enhancing interactivity, visualization, and understanding of complex issues, each use case encounters unique challenges that require further developments to realize the potential of MR fully.
Specifically in the Architecture, Engineering, Construction, and Operations (AECO) industry, it was observed that 49% of the research focused on construction phase use cases such as site monitoring and inspections, construction simulations, training tools for assembly, and enhancing construction safety [18]. However, a recent study on XR applications for sustainable construction revealed that most use cases focus on the pre-construction stage [19]. The more prominent occurrence of use cases in the pre-construction stages can be attributed to the focus on sustainable construction, where decisions, such as the selection of sustainable materials, must occur during the pre-construction stages. Nonetheless, these studies suggest that there is strong interest in the use of XR for various applications in the AECO industry.
Various XR devices are commercially available, and five common MR devices were identified [8,19,20]. The key specifications of each of these devices are presented in Table 1. Among the devices, the Microsoft HoloLens 2 has the best potential for on-site inspections due to its versatility, the availability of a developer community, ease of purchase, and spatial mapping capabilities. Khoshelham et al. [21] reported that the Microsoft HoloLens headset achieved centimeter accuracy for mapping indoor environments. Notably, its mobility allowed for significantly more efficient mapping when compared with laser scanning technologies.
Similarly, Lee et al. [22] demonstrated the potential of MR for edge computing of staircase dimensions using the Microsoft HoloLens 2. The MR application exhibited good accuracy for vertical measurements of large surfaces, such as headroom, when compared with ground truth data. Hence, this paper aims to explore the applicability of MR in automating dimensional compliance checks of staircase measurements, including headroom, riser heights, and widths. The investigation seeks to ascertain whether an MR application can firstly, be used to automate dimensional checks, secondly, reduce variability in reporting dimensional inspection checks, and thirdly, serve as a viable hands-free solution as compared with tape measures, by evaluating the accuracy it can attain for rapid dimensional measurements.

Table 1.
MR Devices Specifications.
| Hardware | ODG R9 [23] | Microsoft HoloLens 2 [24] | Magic Leap 2 [25] | Nreal Varjo XR-4 [26] | DAQRI Smart Glasses |
|---|---|---|---|---|---|
| Year available | 2018 | 2019 | 2022 | 2023 | Discontinued [20] |
| Display |
|
|
|
| |
| Sensors |
|
|
|
| |
| Camera |
|
|
| ||
| Weight |
|
|
|
| |
| Battery Life |
|
|
|
| |
| Retail price |
|
|
|
| |
| Availability |
|
|
|
| |
| Developer community/tools |
|
|
|
| |
| Others |
|
|
|
In this research, we propose to develop an MR application for a wearable MR head-mounted device where we could leverage the native spatial mapping and scene understanding device capabilities to perform edge computing of sensor data, particularly the Microsoft HoloLens 2. The application aims to compute dimensions of building spaces that can be visualized within the MR environment without additional tools. The application will be validated by conducting tests on existing staircases in Singapore. Subsequently, ground truth data using conventional measuring tools will be obtained for comparison with the MR computed dimensions.
The paper is presented as follows. Section 2 offers an overview of current research on MR in the construction inspection domain and a discussion of the capabilities of the HoloLens 2 hardware. It also explores the existing compliance requirements to offer context for the study. Details of the development of the MR application, explaining the methods employed to leverage the native spatial mapping and scene understanding functionalities of the HoloLens 2, are also presented. Finally, it sets out the experimental application for data collection. Section 3 presents the results of the experiments, and Section 4 provides an evaluation of the results to offer insights into the variability of inspection data and whether the accuracy achieved could be used for regulation checks. Lastly, Section 5 concludes with key findings and future work.
2. Materials and Methods
2.1. XR Applications in the AECO Industry
Extensive research has been conducted on applications of XR in the built industry for use in various construction phases [18,19]. Applications of MR, in particular, facilitate decision-making in the pre-construction phase, as alternative designs can be projected onto existing spaces, enhancing communication [27]. In the construction phase, applications are focused on monitoring, training, and inspections. These include use cases such as facilitating progress monitoring visualization [28], safety and hazard identification training [29,30], lean project delivery [31], and the direct use of a Building Information Model (BIM) to MR for the installation of electrical [32] and piping services [33,34].
Apart from the use cases mentioned above, inspections are another key construction phase focus of MR research. In a study integrating BIM and AR in construction management, Machado and Vilela found that 48% of research focused on building inspections and context visualization [35]. Chung and Chun [36] introduced a Microsoft HoloLens application designed for trade inspection, allowing visual comparison of BIM with the real world and using digital checklists to record inspection details and progress. Using BIM, AR markers, and AR glasses, inspection of tunnel segment displacements could be conducted with acceptable accuracy and precision by comparing site images with BIM elements [37]. Kwon et al. also used BIM, AR markers, and image-matching technologies to identify on-site defects [38]. However, both authors concluded that markerless AR would improve the effectiveness of the systems due to the time-consuming effort of placing markers on site and that BIM objects are required. Various MR applications for bridge inspections have also been investigated to improve the manual nature of such inspections. Bridge inspection and maintenance were enhanced by providing inspectors with packaged design information needed for conducting inspections in an MR environment, providing a structured record of inspection data linked to BIM [39,40]. Using artificial intelligence to provide inspectors with a history of damage records also improved the efficiency and accuracy of evaluating the structural integrity of bridges [41].
In summary, current research on MR applications for inspections predominantly requires manual input from users to record data, highlighting a potential area for advancement wherein sensor technology from MR devices could be integrated to automate inspections. Additionally, a common theme among MR applications for inspections is the use of BIM, which may only sometimes be readily available, underscoring the need for adaptable solutions where BIM is unavailable.
2.2. Current Technologies for Dimensional Checks for Regulatory Compliance
Metal or cloth tape measures and surveying chains are commonly used for measuring linear distances in the construction industry [42]. For regulatory measurements, including site boundaries, building heights, and setbacks, registered surveyors must use specialized survey equipment like total stations to meet specific accuracy standards [43]. However, using a total station for as-built measurements in indoor environments can be labor-intensive as the equipment requires point-by-point comparisons within line-of-sight for data acquisition. While total stations provide notable precision, such detailed accuracy may exceed the requirements of numerous indoor mapping applications. Laser scanners employed for documentation purposes have demonstrated comparable accuracy [44]. However, external targets for registration of scans are necessary, and post-processing is required to align the scans and extract as-built dimensions [45]. Considering the costs and expertise needed to operate these specialized surveying instruments, tape measures continue to be frequently used in the construction industry, even though they have lower accuracies.
2.3. Regulatory Compliance Dimensional Requirements
Regulatory requirements for building compliance are complex and diverse, necessitating inspectors to be well-versed in these standards. Table 2 highlights the variability of design standards, both internationally and within the same country, dependent on the intended function of the staircase [46,47,48,49]. While these specifications are intended to be accurately represented in the design and consequently constructed as specified, unforeseen site situations or tolerances may result in unintended deviations. Hence, post-construction inspections are necessary to ensure compliance.
In this context, leveraging sensor data from MR technology presents a significant opportunity. By defining these standards within the MR application, dependence on an inspector’s knowledge for identifying the correct dimensions could be reduced. This approach would streamline the inspection process, ensuring that inspections are consistent, thereby enhancing accuracy and efficiency in compliance verification.
2.4. Microsoft HoloLens 2 Hardware, Spatial Mapping, and Scene Understanding
Introduced commercially in 2019, the Microsoft HoloLens 2 is a mobile AR head-mounted device (HMD) with on-device processing capabilities. Detailed hardware specifications of the HoloLens 2 used to determine hardware selection, along with those of other commercially available MR devices, are presented in Table 1. The Nreal Varjo is a tethered device that utilizes VR passthrough to transit into an MR environment, allowing users to see the actual physical space via camera lenses [26]. As such, this device is not suitable for on-site usage due to its limited mobility. Although the ODG R9 [23] offers benefits in terms of weight and price, it falls short in terms of both developer community support and commercial availability. The Magic Leap 2 emerges as a primary alternative to the HoloLens 2; however, its user accessibility is diminished due to the necessity of acquiring additional prescription inserts [25], a factor that potentially limits its deployment for users requiring prescription eyewear. Considering these factors, the Microsoft HoloLens 2 was selected for this study.
It has been reported that the HoloLens utilizes its visible light cameras for localization and the depth sensor for spatial mapping. The depth sensor records data in the ‘short throw’ mode for objects within 0 m to 0.8 m and the ‘long throw’ mode for objects within 0.8 m to 3.5 m [50].
Spatial mapping, in the context of the HoloLens 2, provides a virtual twin of real-world surfaces. These are represented as triangle meshes termed ‘Spatial Surfaces’. These surfaces enable interaction within virtual spaces as if they were real-world surfaces. As the HoloLens 2 surveys its surroundings, these spatial surfaces update, reflecting the device’s dynamic environmental data acquisition [51].
Scene Understanding allows a static query of the spatial surfaces with unlimited range when initialized. It transforms the unstructured environment sensor data into labeled surfaces, known as SceneObjects, such as ‘Wall’, ‘Floor’, ‘Ceiling’, ‘Platform’, ‘Background’, etc. [52]. The segmentation of these surfaces leverages Microsoft’s custom-built processor, which is equipped with Deep Neural Network (DNN) capabilities [53]. Notably, this capability is available only on the newer Microsoft HoloLens 2 and is absent in its predecessor [54].
Several studies have been conducted to evaluate indoor mapping capabilities using the Microsoft HoloLens. Hübner et al. [50,55] established a scale factor between 0.9879 and 0.9887 for HoloLens-generated meshes against a Terrestrial Laser Scanner (TLS) ground truth mesh. A comparison of the mesh for a corrected scale achieved 1.7 cm accuracy [50]. A separate study revealed that the HoloLens mesh achieved a local plane-fitting precision of 2.25 cm and a mean distance of 5 cm compared with a TLS mesh [21]. The more significant error observed in the mesh comparison could be due to point cloud registration accuracy, as different brands of TLSs were used in each study.
While the above studies primarily utilized the original HoloLens, Terrugi, and Fassi presented their research on the HoloLens 2 for mapping heritage environments [17]. Their research highlighted the device’s efficacy in acquiring a 3D mesh model of a cathedral’s interior in Italy. The accuracy of the HoloLens 2, when compared to data from a TLS, showed variations depending on the environment. Most significant deviations were observed in large spaces that exceeded the range of the device’s sensors (4 m) and confined spaces where environmental elements were in close proximity of 0.5 m. In these instances, deviations reached up to 0.59 m on XY horizontal planes and 0.1 m vertically. In human-scale spaces, maximum deviations of 0.05 m horizontally and 0.1 m vertically were observed.
2.5. Research Methodology
Given the capabilities of the HoloLens, this study seeks to investigate the potential of HoloLens 2′s scene understanding capabilities for automated computation of dimensions for regulatory compliance checks. Firstly, the MR application, the development of which is detailed in Section MR Application Development, is designed to compute measurements from meshes labeled by the scene understanding SDK. Since the tape measure is a comparatively simple tool to use, the MR application will need to take into consideration intuitiveness as well as user-friendliness. Secondly, the results will be evaluated to examine if the accuracy of MR computed dimensions can be similar to that of a tape measure based on expected measurements derived from design measurements.
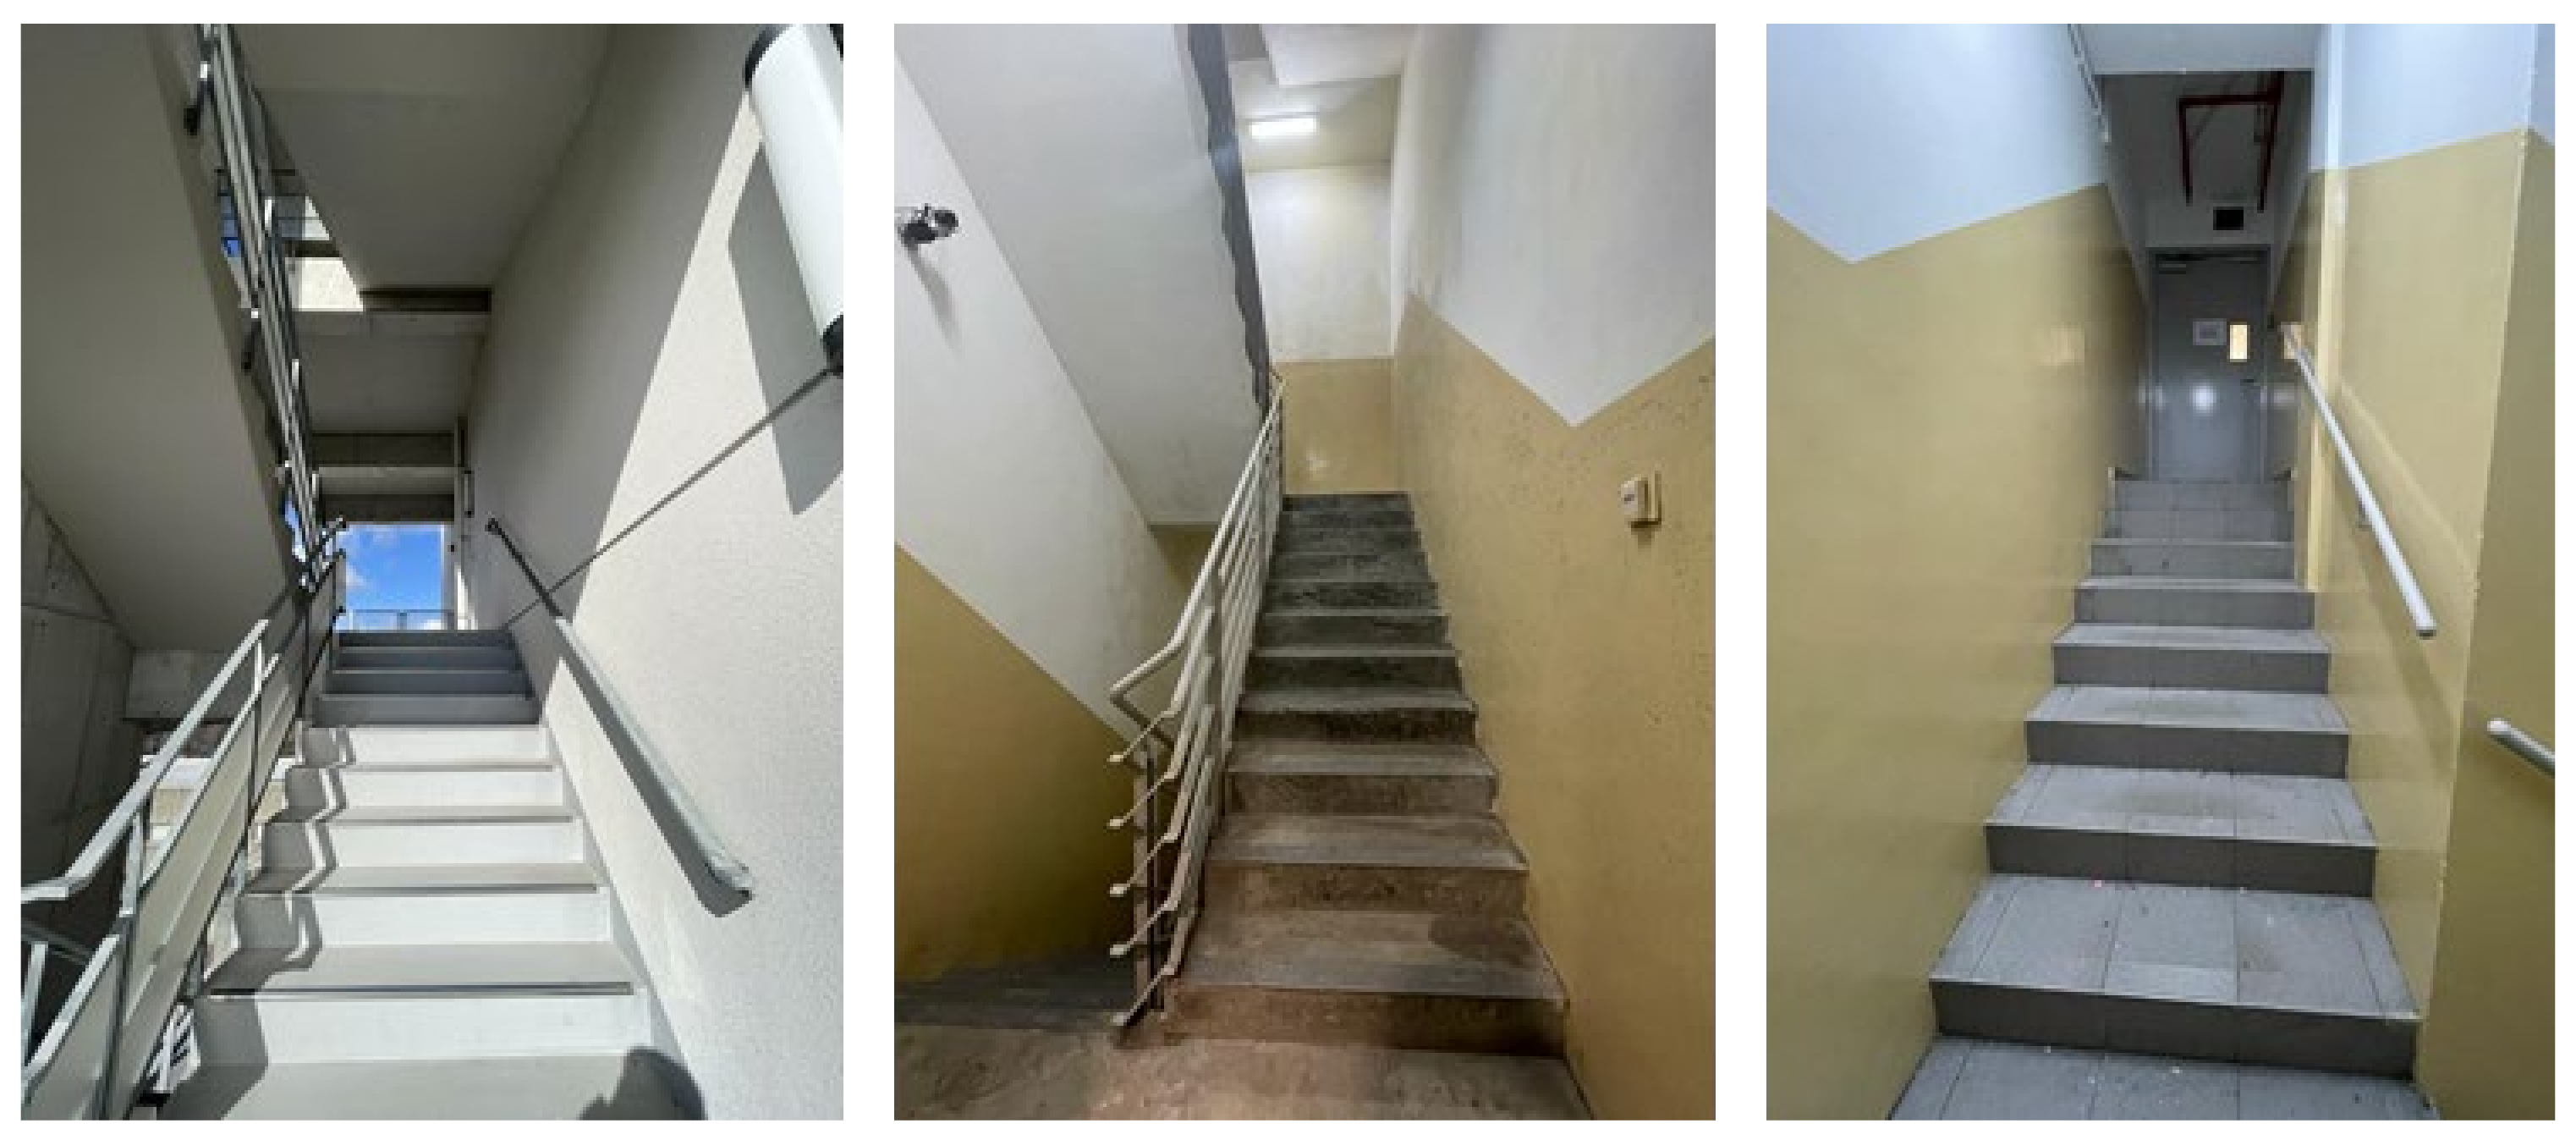
Tests were conducted at a staircase flight in Osaka University, depicted in Figure 1, to evaluate the viability of an MR application in automating measurements by scanning the environment in 1-min increments, up to a maximum of 5 min, to determine if scanning time had an impact on the results. This duration was selected based on the rationale that extended scanning times would be impractical, given that navigating a flight of stairs takes less than a minute.
Before commencing each scan, all previous spatial data on the HoloLens 2 was cleared to ensure that there were no interferences of meshes from previous scans on the experiments. The scanning procedure was initiated at the center of the lower landing of the flight, facing the stairs. Scanning is conducted by ascending and descending the flight of stairs while looking around until the required scanning time has lapsed. Once completed, the application computes the measurements, and the results are recorded in a spreadsheet. The same staircase dimensions were measured using conventional measuring tools to provide a benchmark. The steel tape measure was used to obtain staircase width and riser height measurements, and the laser measure was used for headroom due to the longer distances required to be measured.
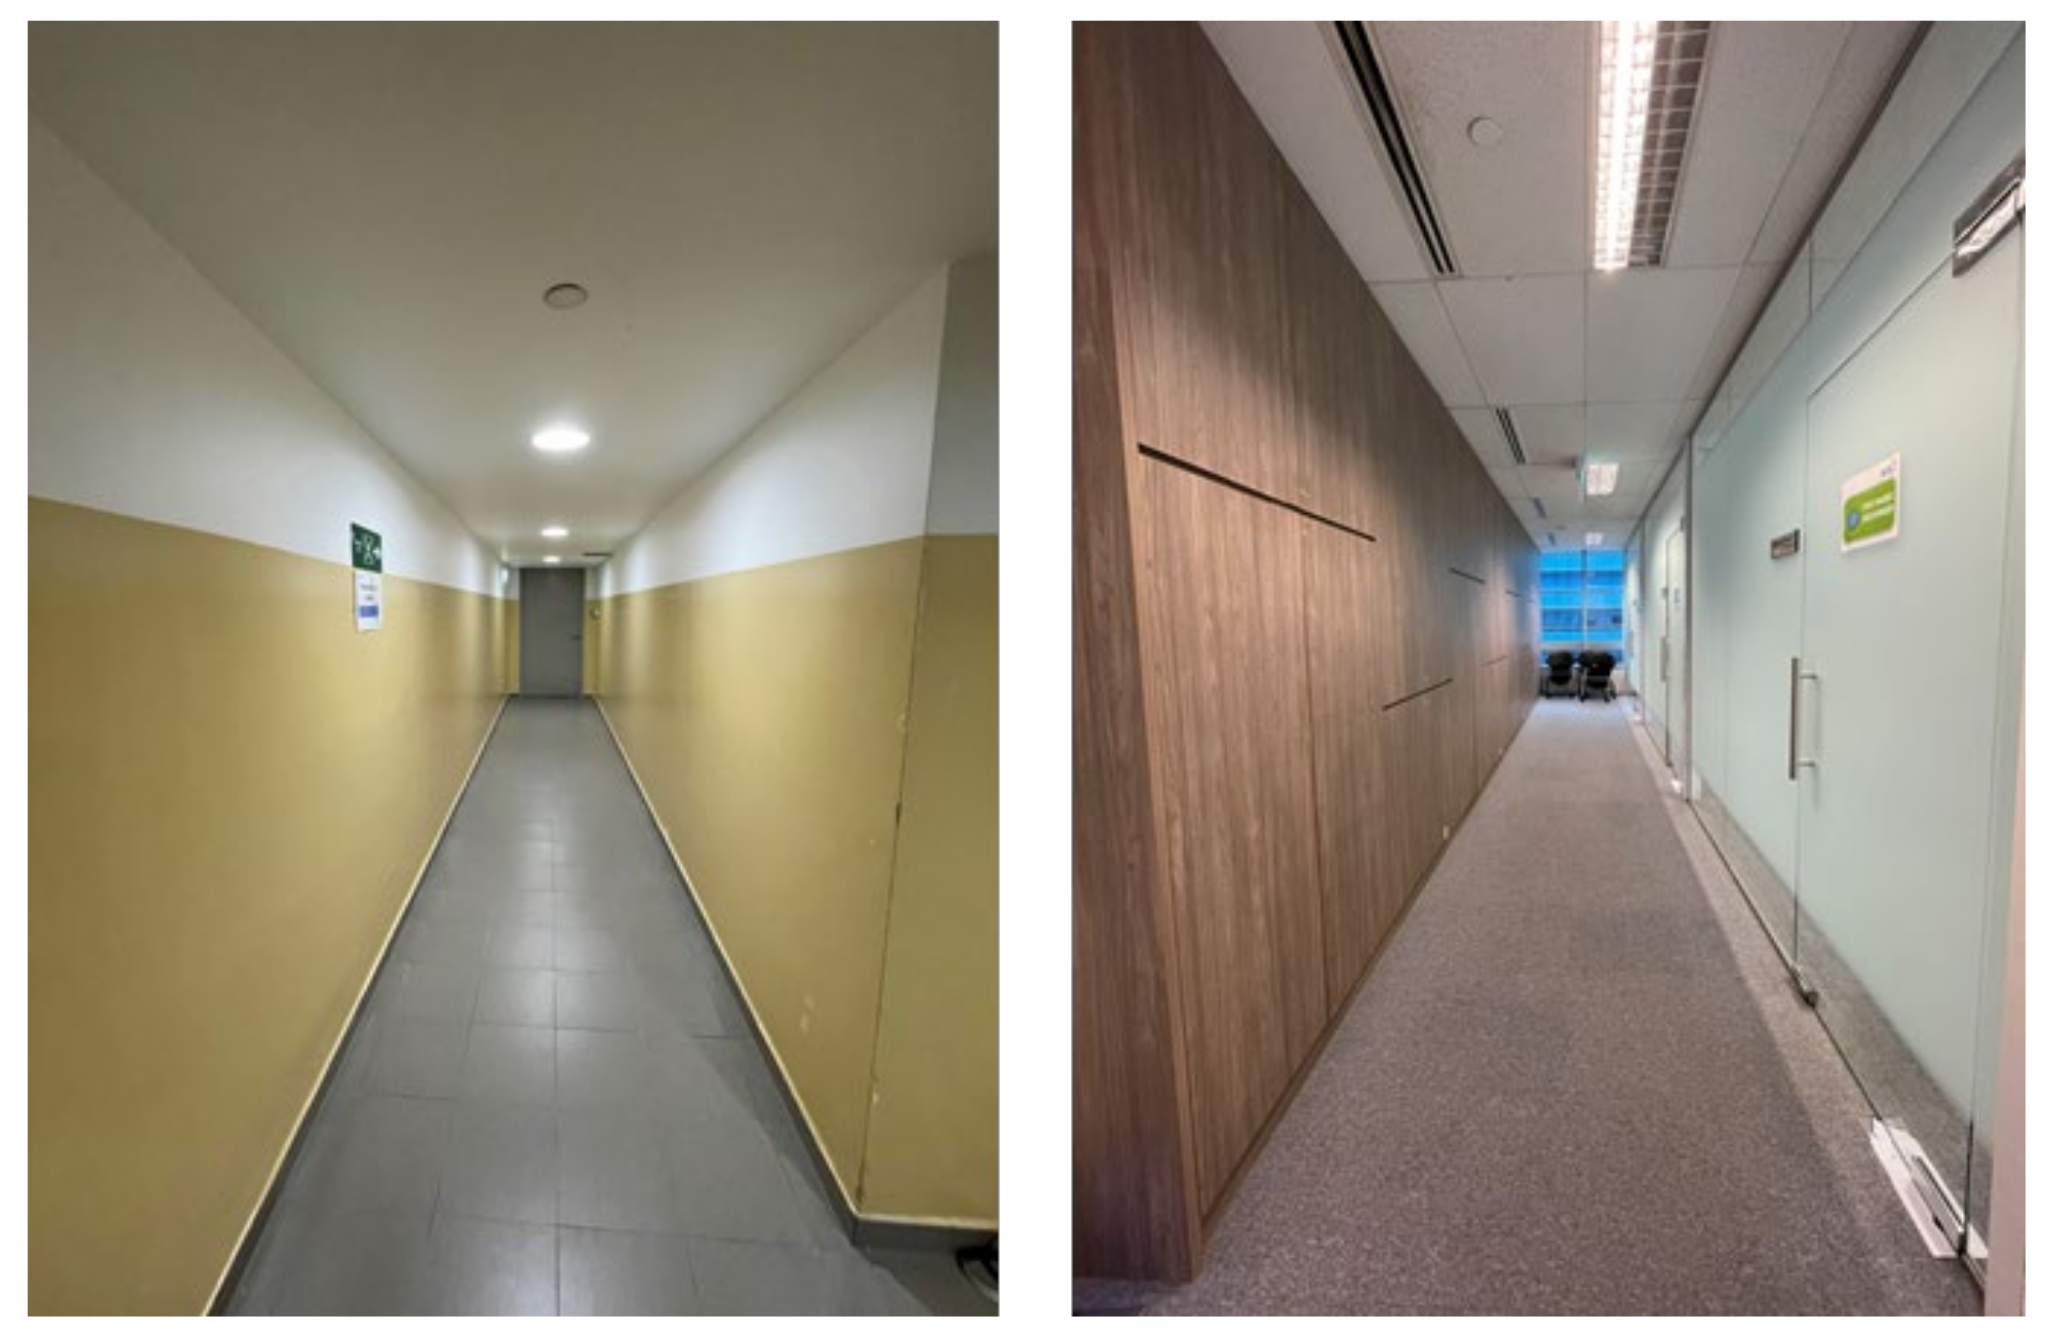
After confirming the application’s functionality, industry professionals were asked to volunteer to use the application and conventional tools for taking measurements at staircases. Each volunteer was asked to manually measure the staircase width and riser height using a steel tape measure and the headroom using a laser measure. Subsequently, they used the HoloLens 2 to capture the same measurements. Since staircase soffits are typically sloping, a slight inclination of a vertical measurement would result in more significant errors. Hence, two corridor heights in Singapore, shown in Figure 2, were also selected for the experiment.
Before each experiment, each volunteer was given a tutorial on using the MR application. For consistency, every participant was directed to initiate the scan facing the flight of stairs from the bottom landing. To maintain a standardized scanning approach, they were instructed to ascend and descend the staircase twice before returning to the starting point to commence computation. All hologram and spatial mapping data were cleared before each new volunteer began scanning.
All dimensions were recorded in a spreadsheet, and a statistical analysis of the results was performed to determine the variability and accuracy of the MR application on the HoloLens 2 compared to conventional measurement techniques. A screen recording of each result was also taken, and the spatial mesh was exported for the record.
MR Application Development
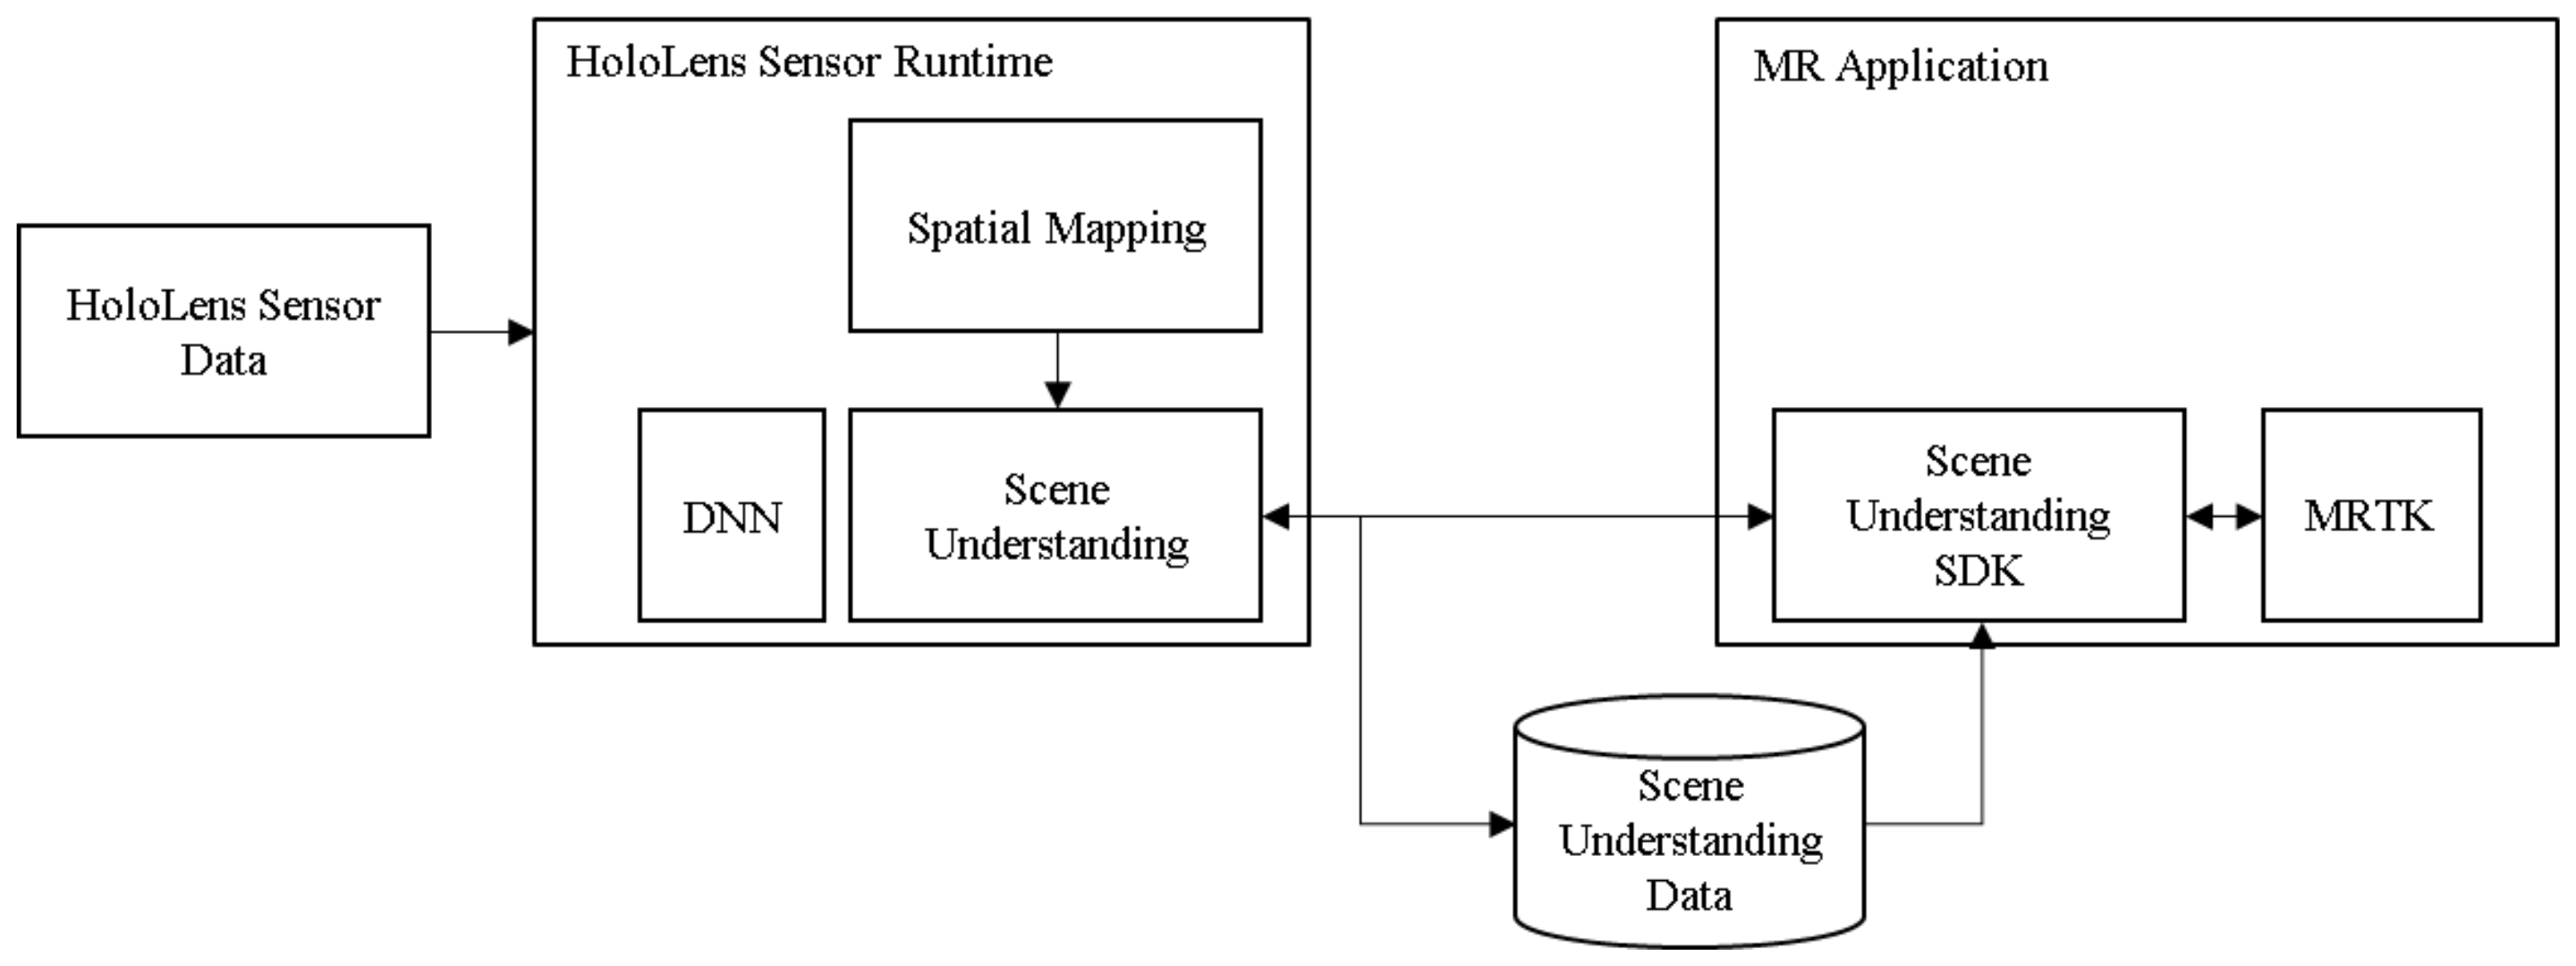
The MR application was developed in Unity Version 2020.3.25f1 [56] utilizing the Mixed Reality Toolkit (MRTK) Version 2.10.2 [57] and the scene understanding Software Development Kit (SDK) Version 0.6.0 [52]. A high-level overview of the MR application’s architecture is presented in Figure 3 [53]. Scene understanding interprets the spatial mesh to predict which parts of the mesh represent walls, ceilings, floors, platforms, backgrounds, etc. [58]. The scene understanding SDK acts as a communication layer between the MR application and the scene understanding runtime. It generates ‘quads’ that classify real-world surfaces into ‘SceneComponents’ categorized by their ‘Kind’ property—Wall, Floor, Ceiling, Background, etc. [52]. Each SceneComponent resides within a 3D coordinate system that can be queried. Automated computation of distances between categorized quads provides the as-built dimensions. Finally, game objects are instantiated in the virtual space, enabling users to visualize the calculated scenes for visual verification.
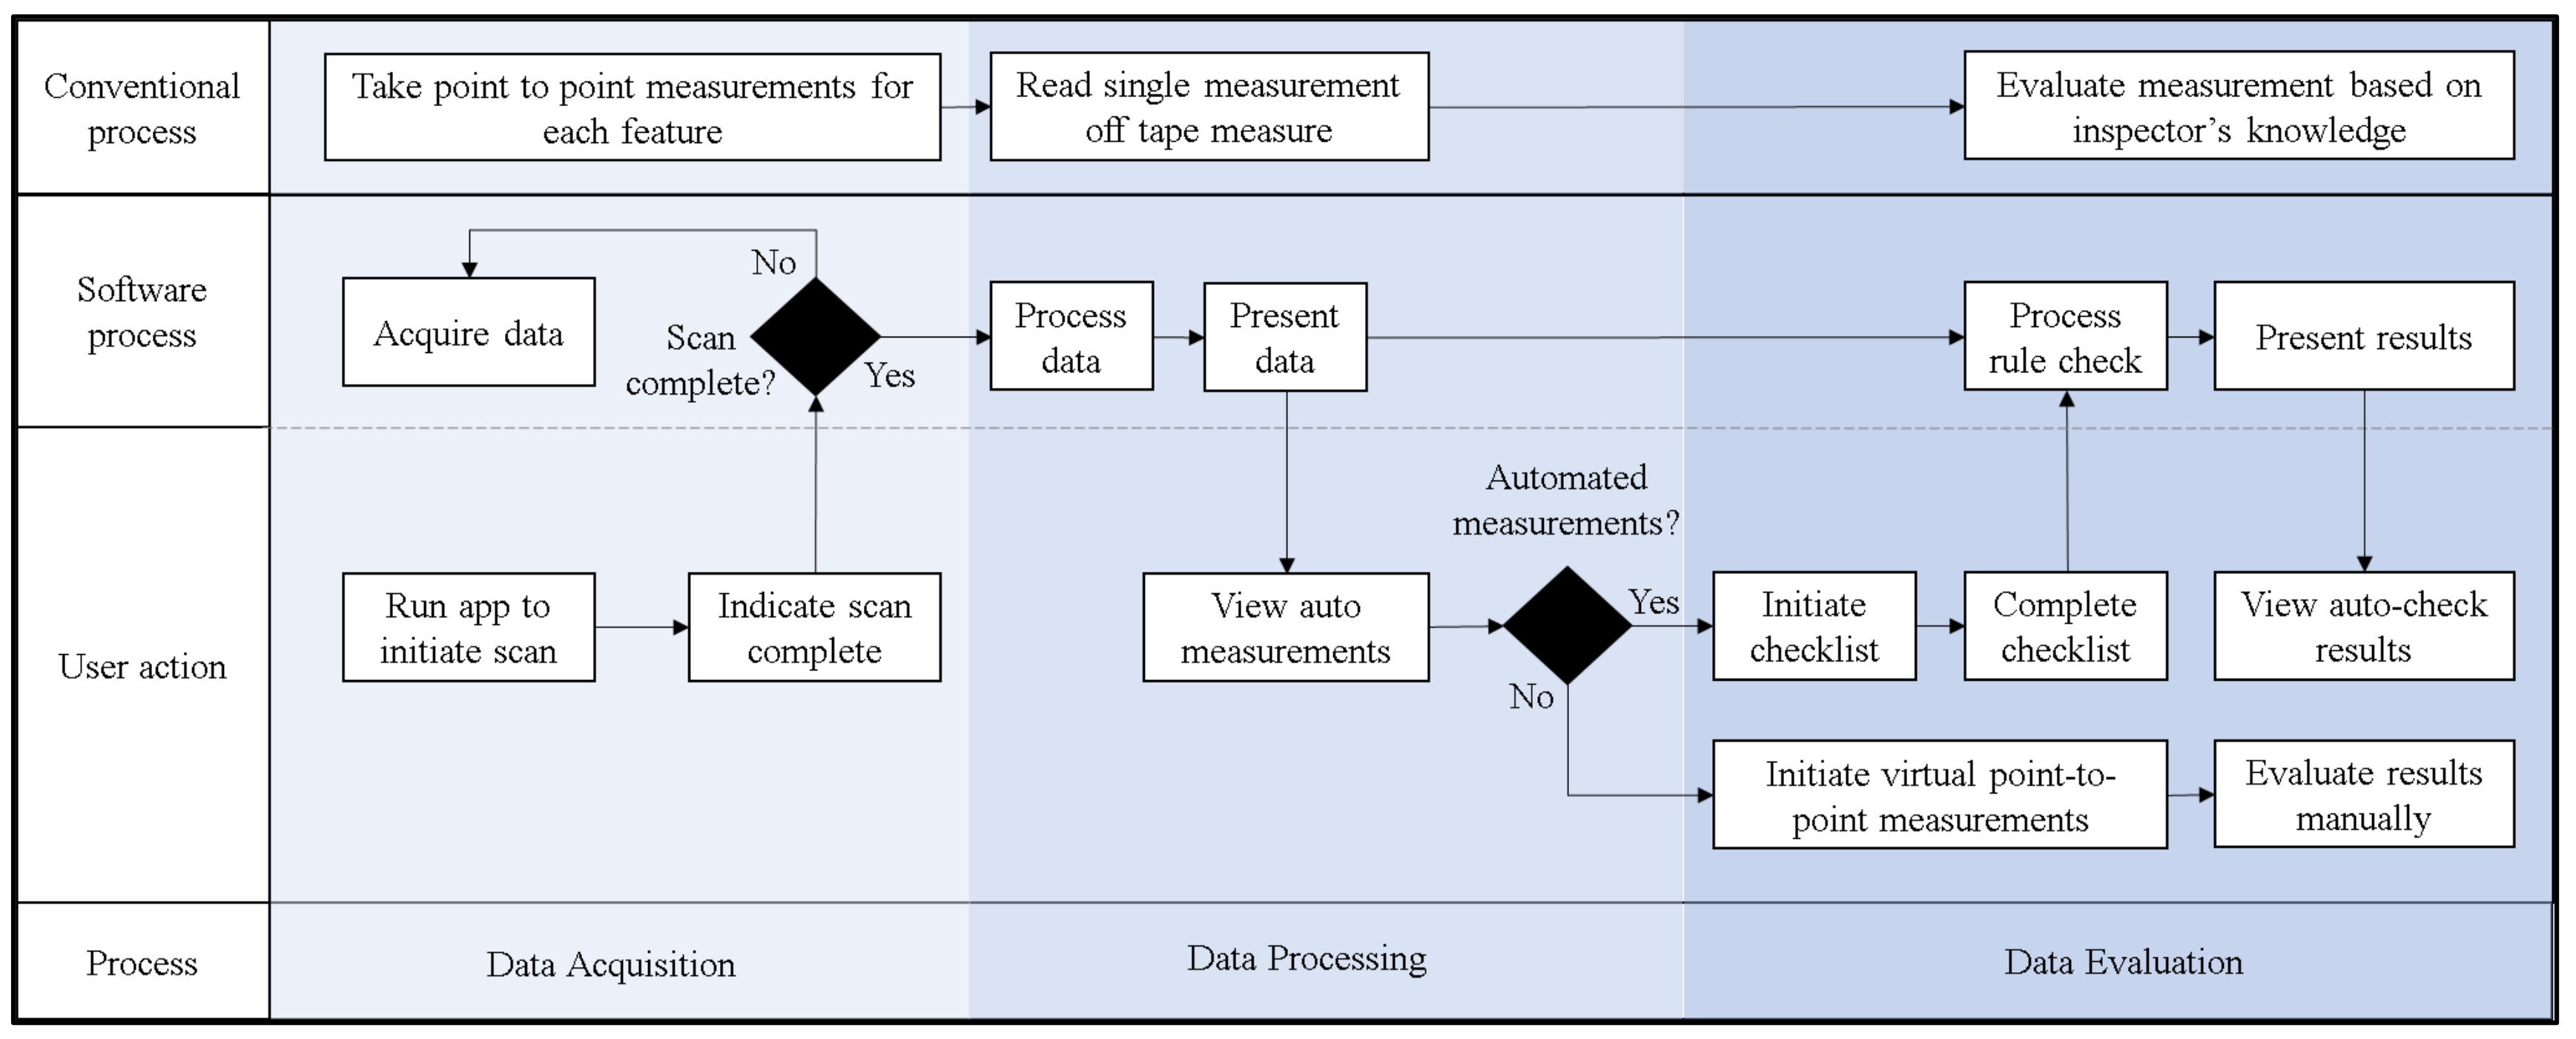
After acquiring the various computed dimensions, the application’s final functional requirement is to facilitate compliance checks. This is achieved by having the user complete a checklist tailored to the specific variations outlined in Table 2. For instance, a residential building might have differing dimensional requirements from an industrial building. The application will employ an if-then logic to automatically verify the dimensions, reporting whether the computed dimensions comply with the selected regulation. Considering potential internet connectivity issues at construction sites, users can export the checklist results as a .txt file, which will be saved locally on the device, ensuring accessibility and reliability of data regardless of network availability.
An overview of the decision flow diagram, as described above, is shown in Figure 4. During application design, user actions are kept similar to the conventional method of acquiring, processing, and evaluating dimensional compliance, except for the user having to fill in a checklist during data evaluation.
3. Results
3.1. MR Application—Computing Measurements
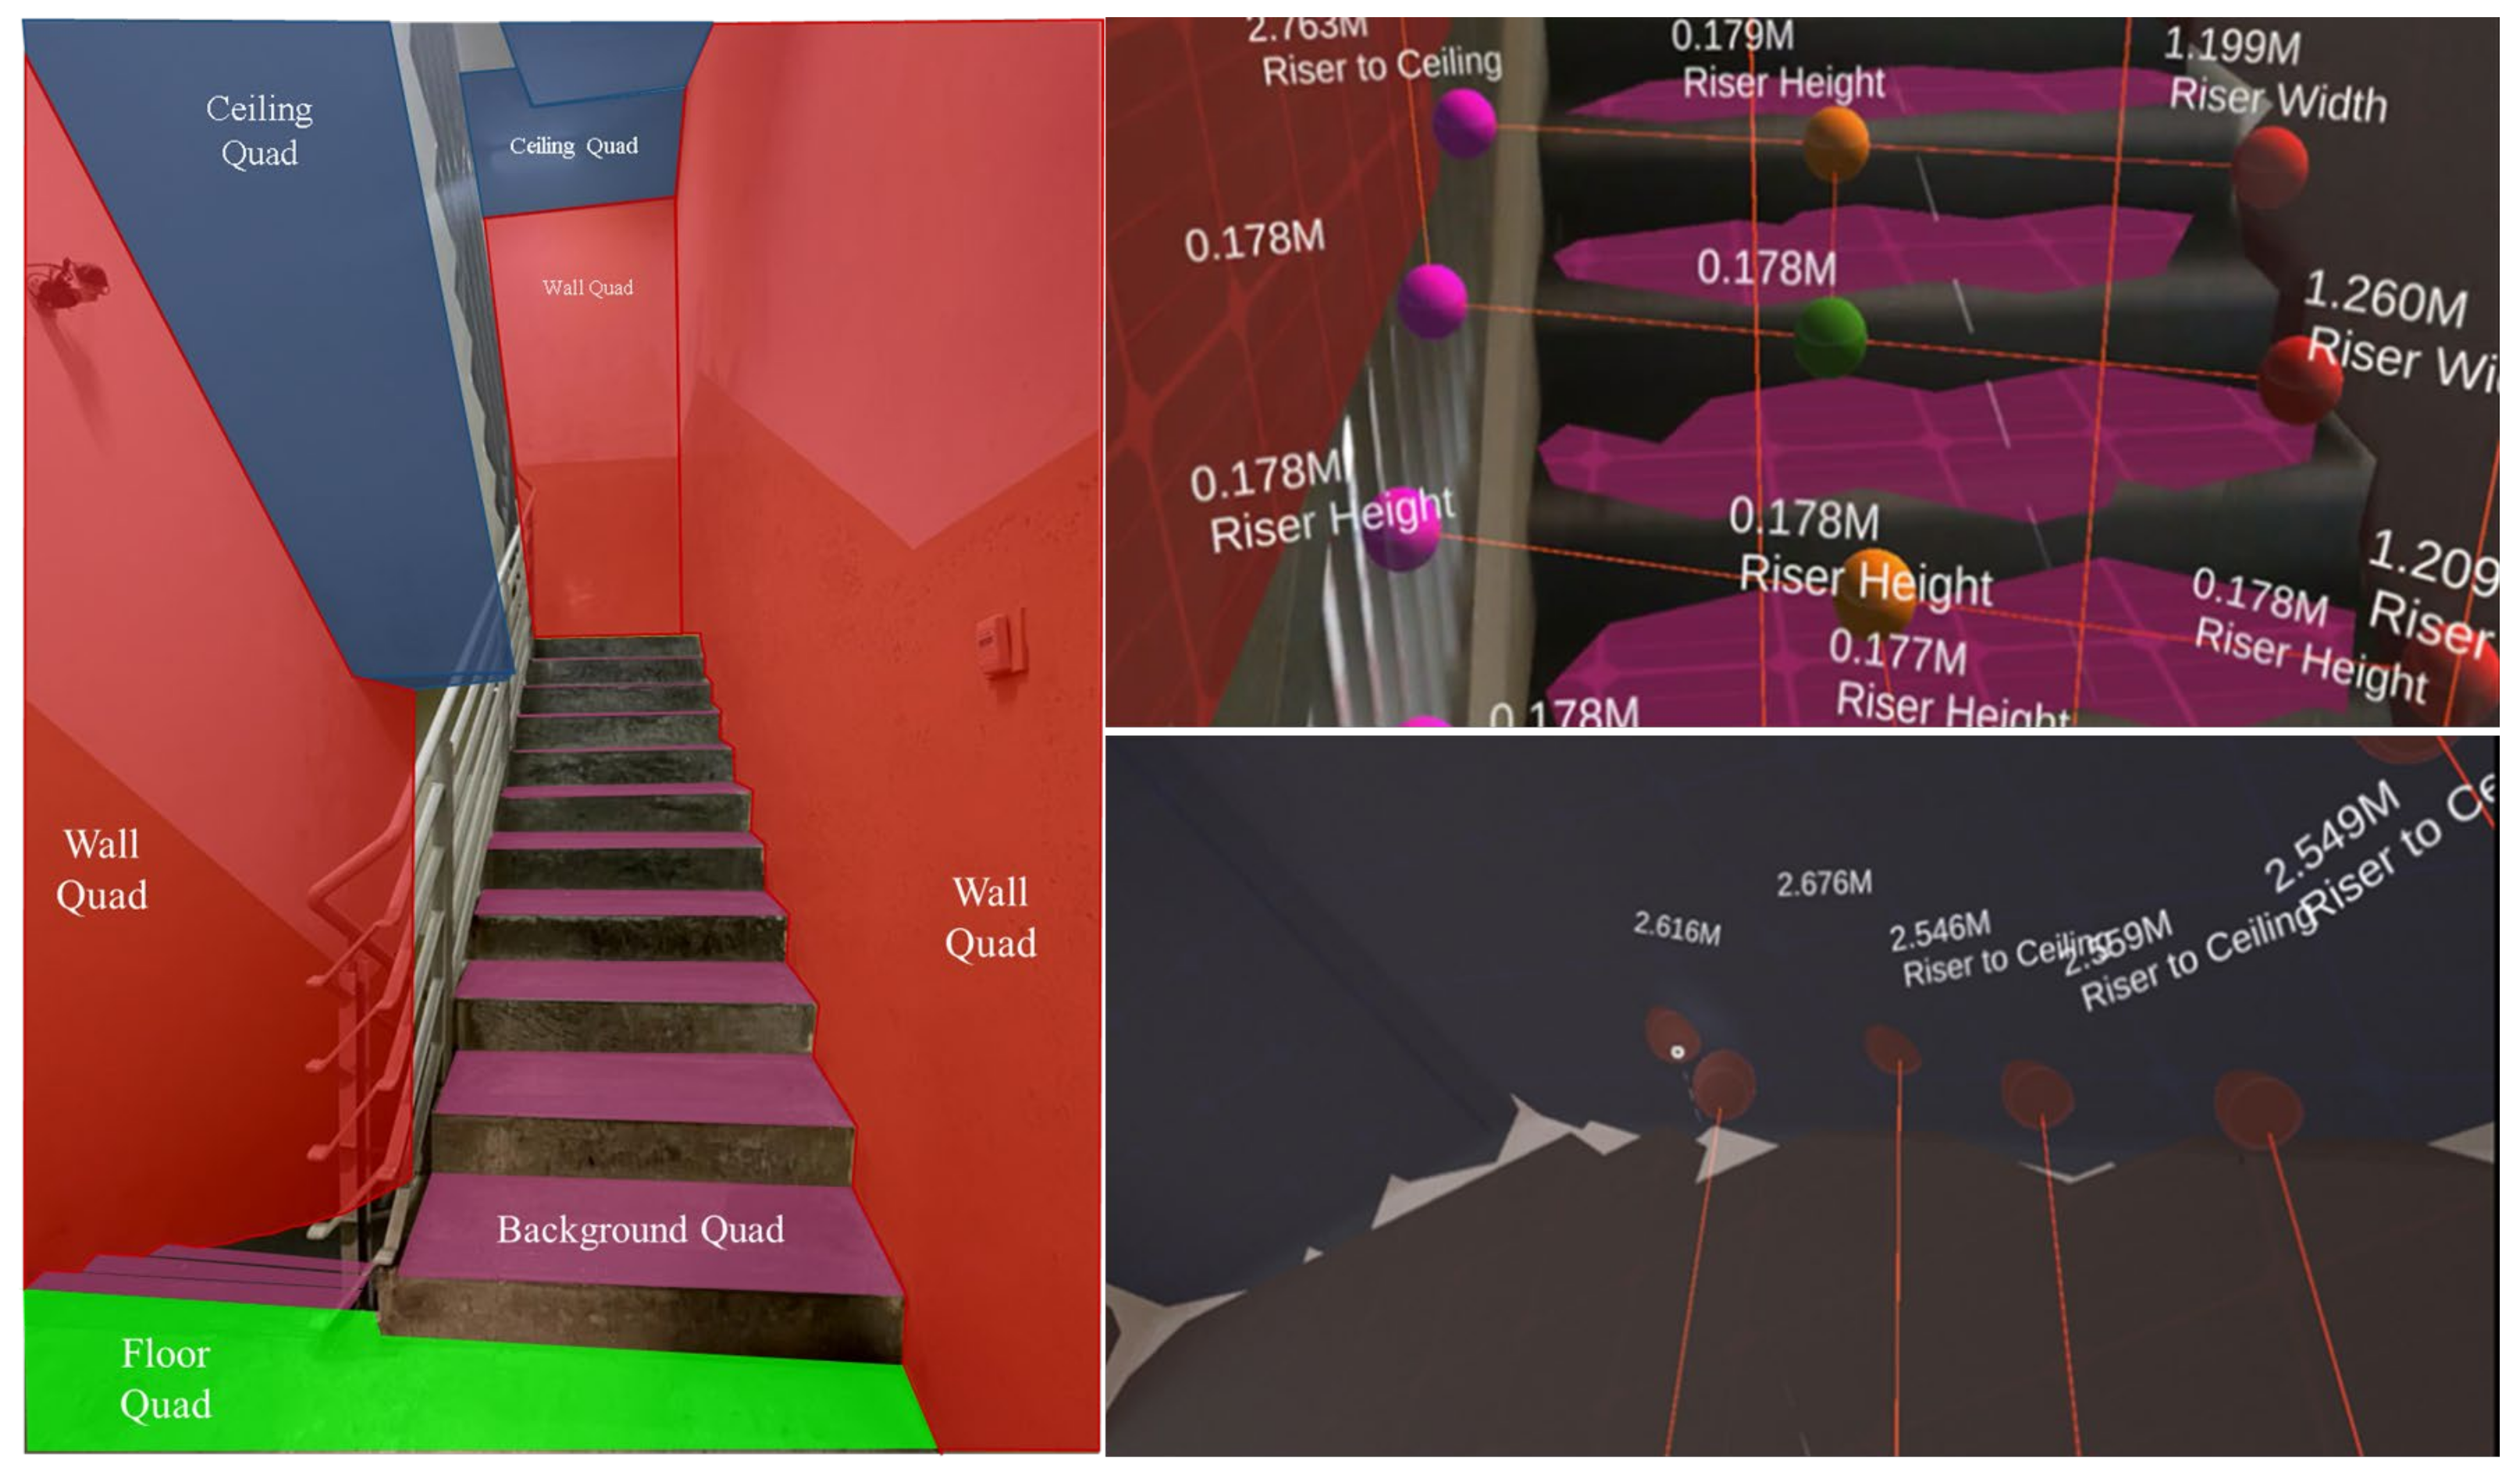
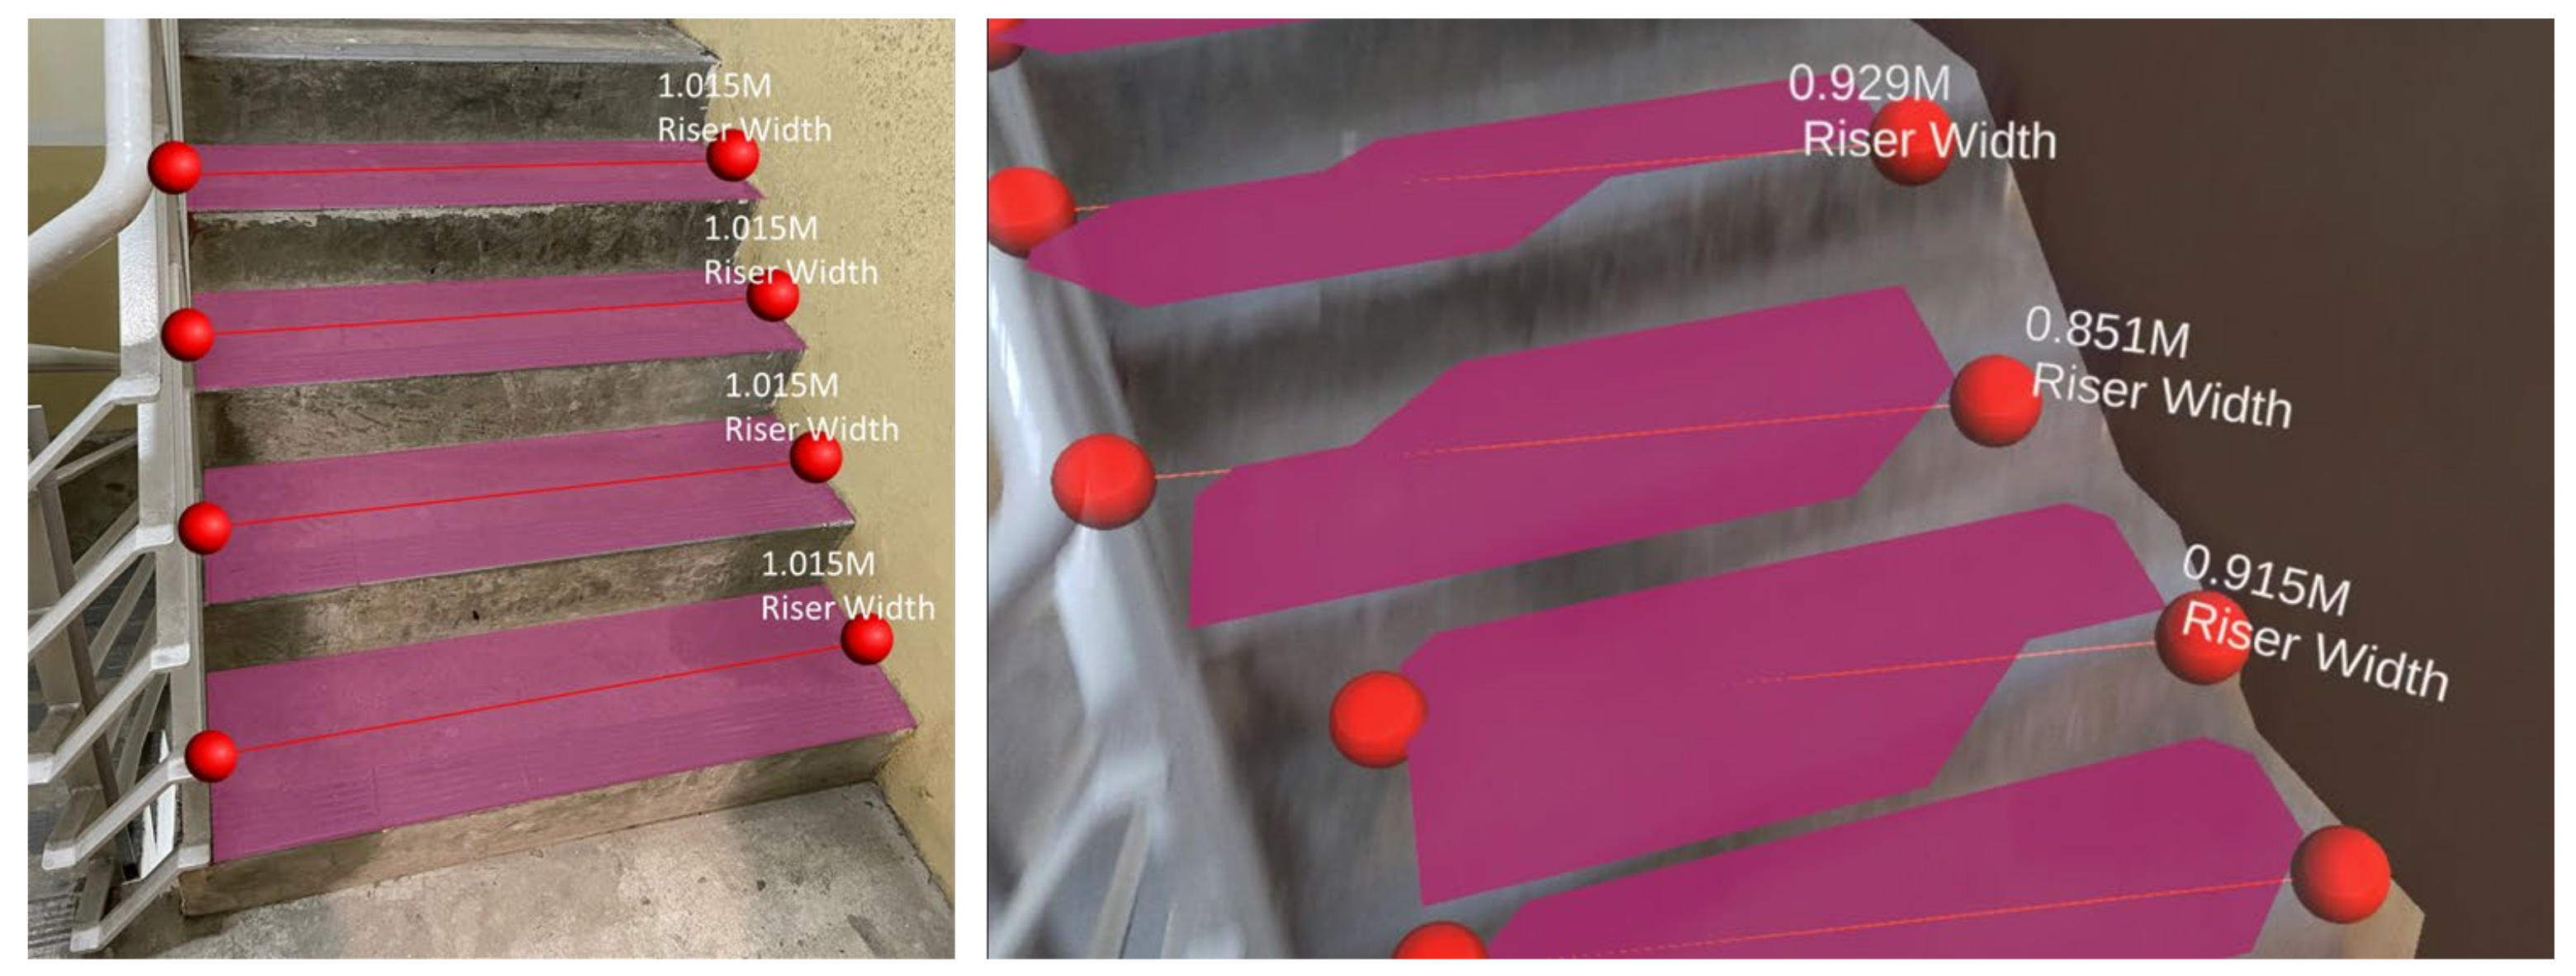
The scene understanding SDK categorizes various surfaces based on their orientation and size, as presented in Figure 5. Large flat surfaces like staircase landings are labeled as ‘Floor’. Vertical surfaces are identified as ‘Walls’, while soffits, whether sloped or flat, are identified as ‘Ceiling’. In the application, these are represented as green, red, and blue surfaces, respectively. On the other hand, due to their smaller surfaces and spatial position, staircase treads were classified as ‘Background’ by the SDK. Thus, to identify these treads, the application compares the vector normal of each quad to the vector normal of defined floors. Once identified, the application presents the quads representing a staircase tread as magenta surfaces. The actual output is shown in Figure 5.
Based on the ‘Kind’ property assigned by the SDK, the identified quads are subsequently organized into lists. The list containing the staircase tread quads is further sorted by each quad’s height. The longer side of the quad is determined, and game objects are placed at the center, leftmost and rightmost extents of the quads, at the edge of each tread. The game objects must be placed at the edges as headroom measurement is defined as the distance from the pitch line, which is taken as the straight line joining each tread’s edges to the soffit.
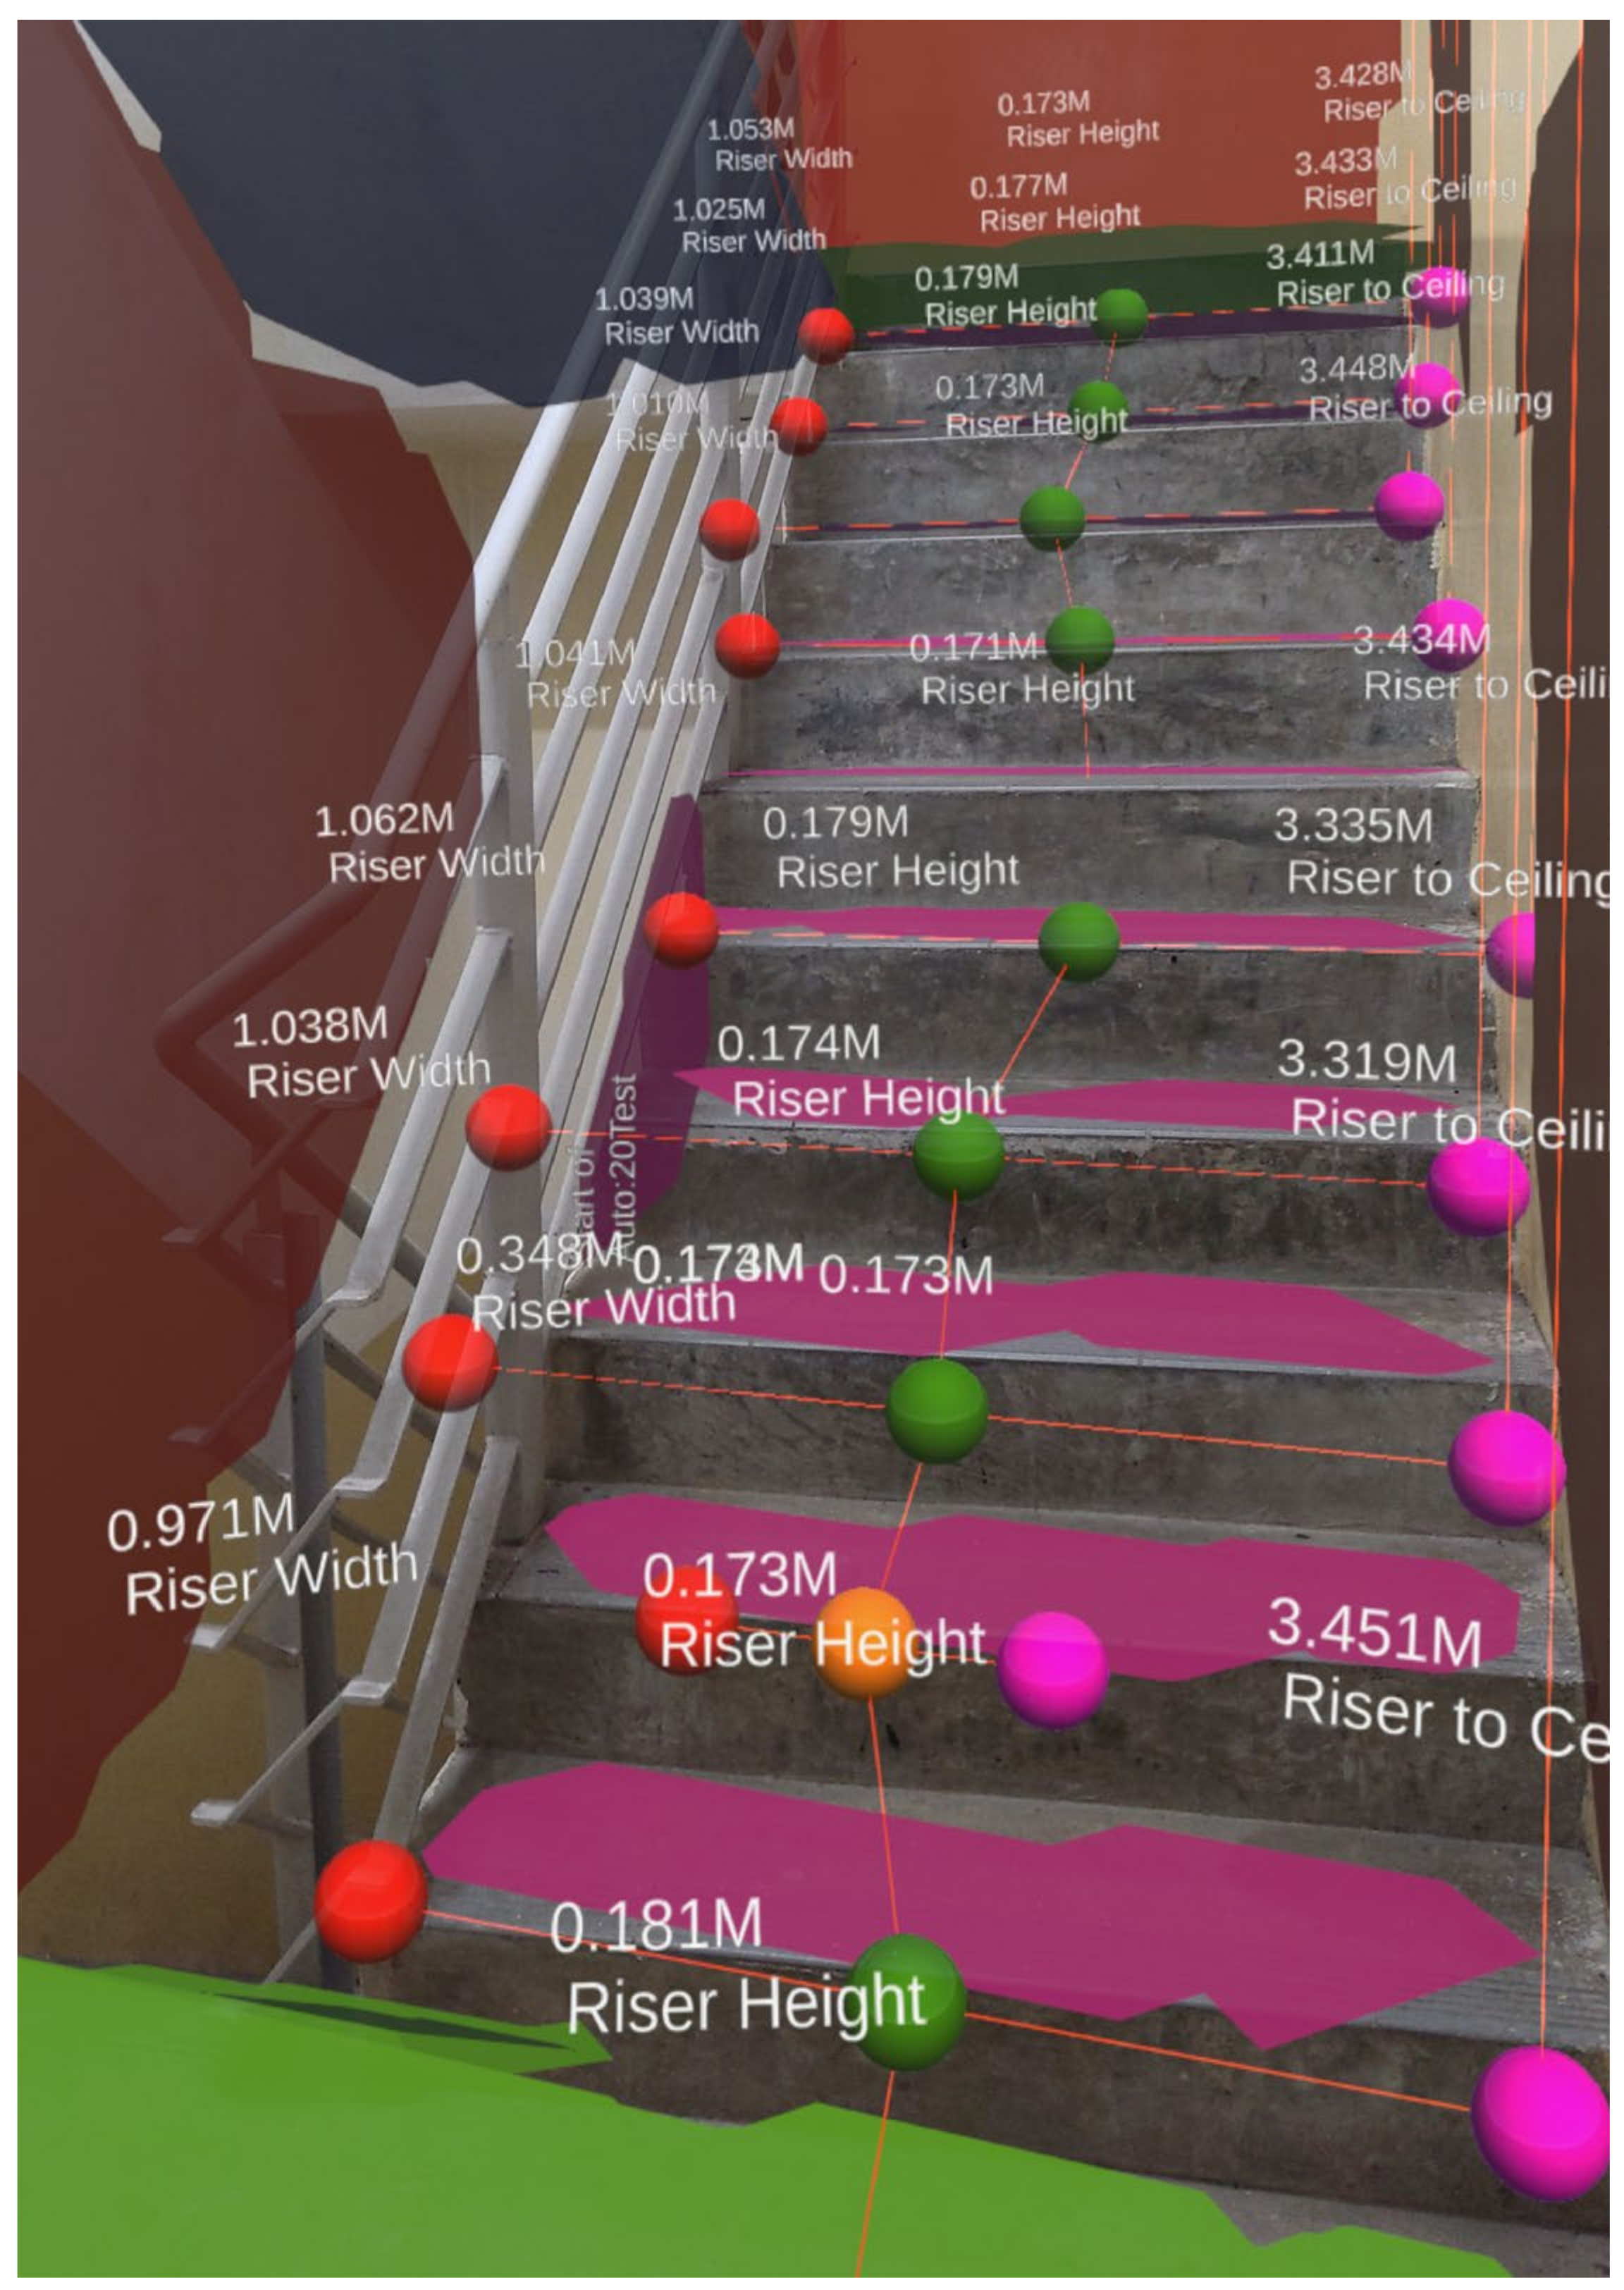
An iterative loop then processes the difference in elevation of each center marker to compute riser heights and distances between the leftmost and rightmost game object to compute widths. However, due to the sloping soffit typical of staircases, simple computation of distances cannot be used to obtain headroom distances. The unity function ’Raycast’ [59] addresses this. It projects a vertical ray from the rightmost game object until it intersects with the ceiling quad. Another game object is placed at the point of intersection, and the length of the ray is recorded as the headroom measurement. Iterative loops of each staircase tread quad enable automatic computation of staircase feature dimensions, as shown in Figure 5 and Figure 6.
3.2. Rule-Based Compliance Check
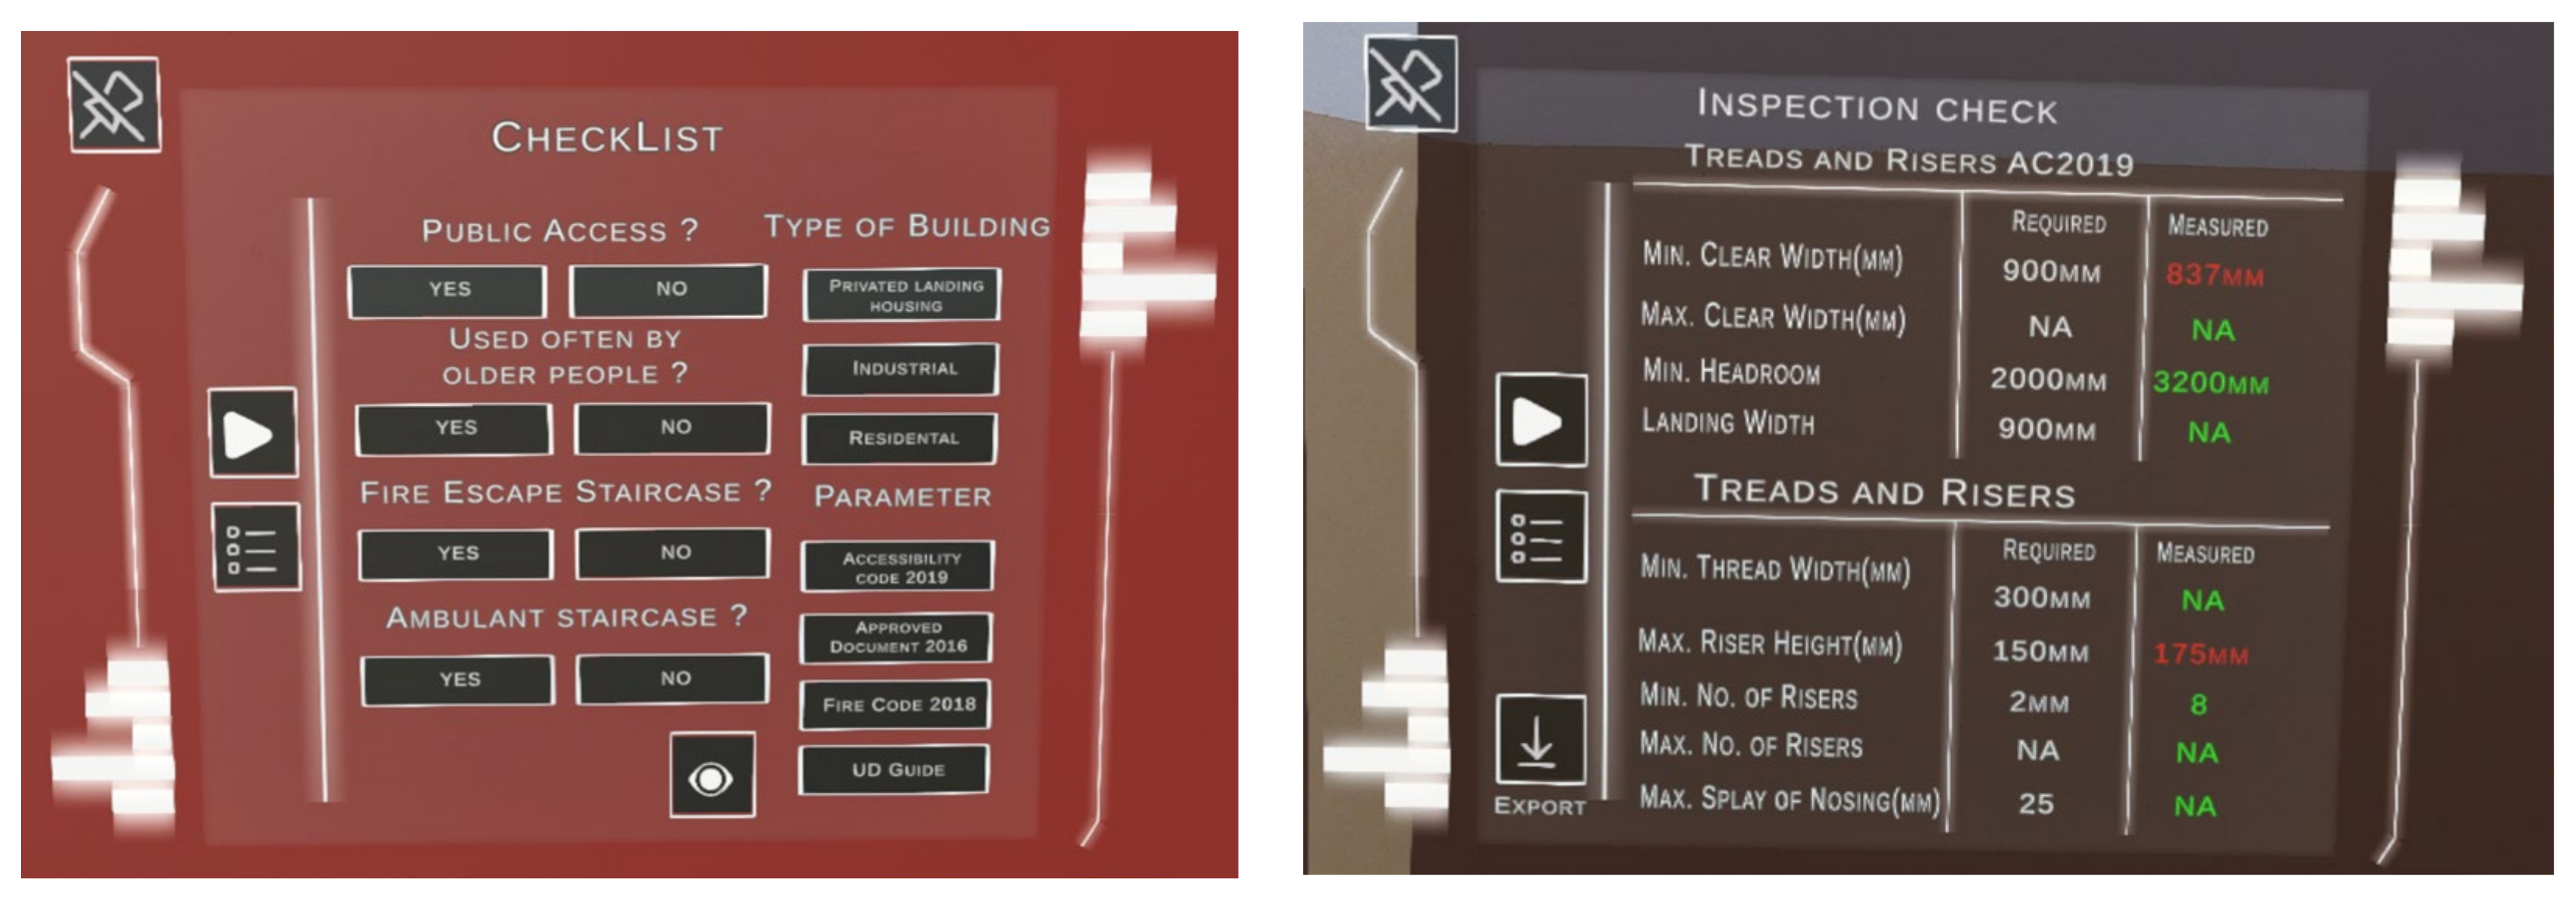
As a proof of concept, the application integrates a checklist tailored to several regulations and guides specific to Singapore. These include the Singapore Building Construction Authority Approved Document [48], Singapore Universal Design Guide 2016 [60], the Code on Accessibility in the Built Environment 2019 [49], and the Code of Practice for Fire Precautions in Buildings 2018 [61]. An analysis of these documents indicates that staircase dimensional specifications differ based on several factors, such as the building type, public accessibility, frequency of use by the elderly, its designation as a fire escape route, and its design catering to ambulant individuals. The dimensions detailed in Section 3.1 are assessed in light of these criteria. The checklist in the MR application is shown in Figure 7, detailing the questions users have to answer on the factors that will affect the dimensional requirements of the staircase features. The results of the automated check after completion of the checklist are also shown. Where there are non-compliances, for example, the staircase width that did not meet the regulatory requirements, results are highlighted in red.
3.3. Automatically Computed Staircase Measurements against Conventional Measurements
The MR application underwent incremental development, with its first application on an outdoor staircase at Osaka University (Figure 1). The main aim was to obtain vertical riser height and headroom measurements automatically.
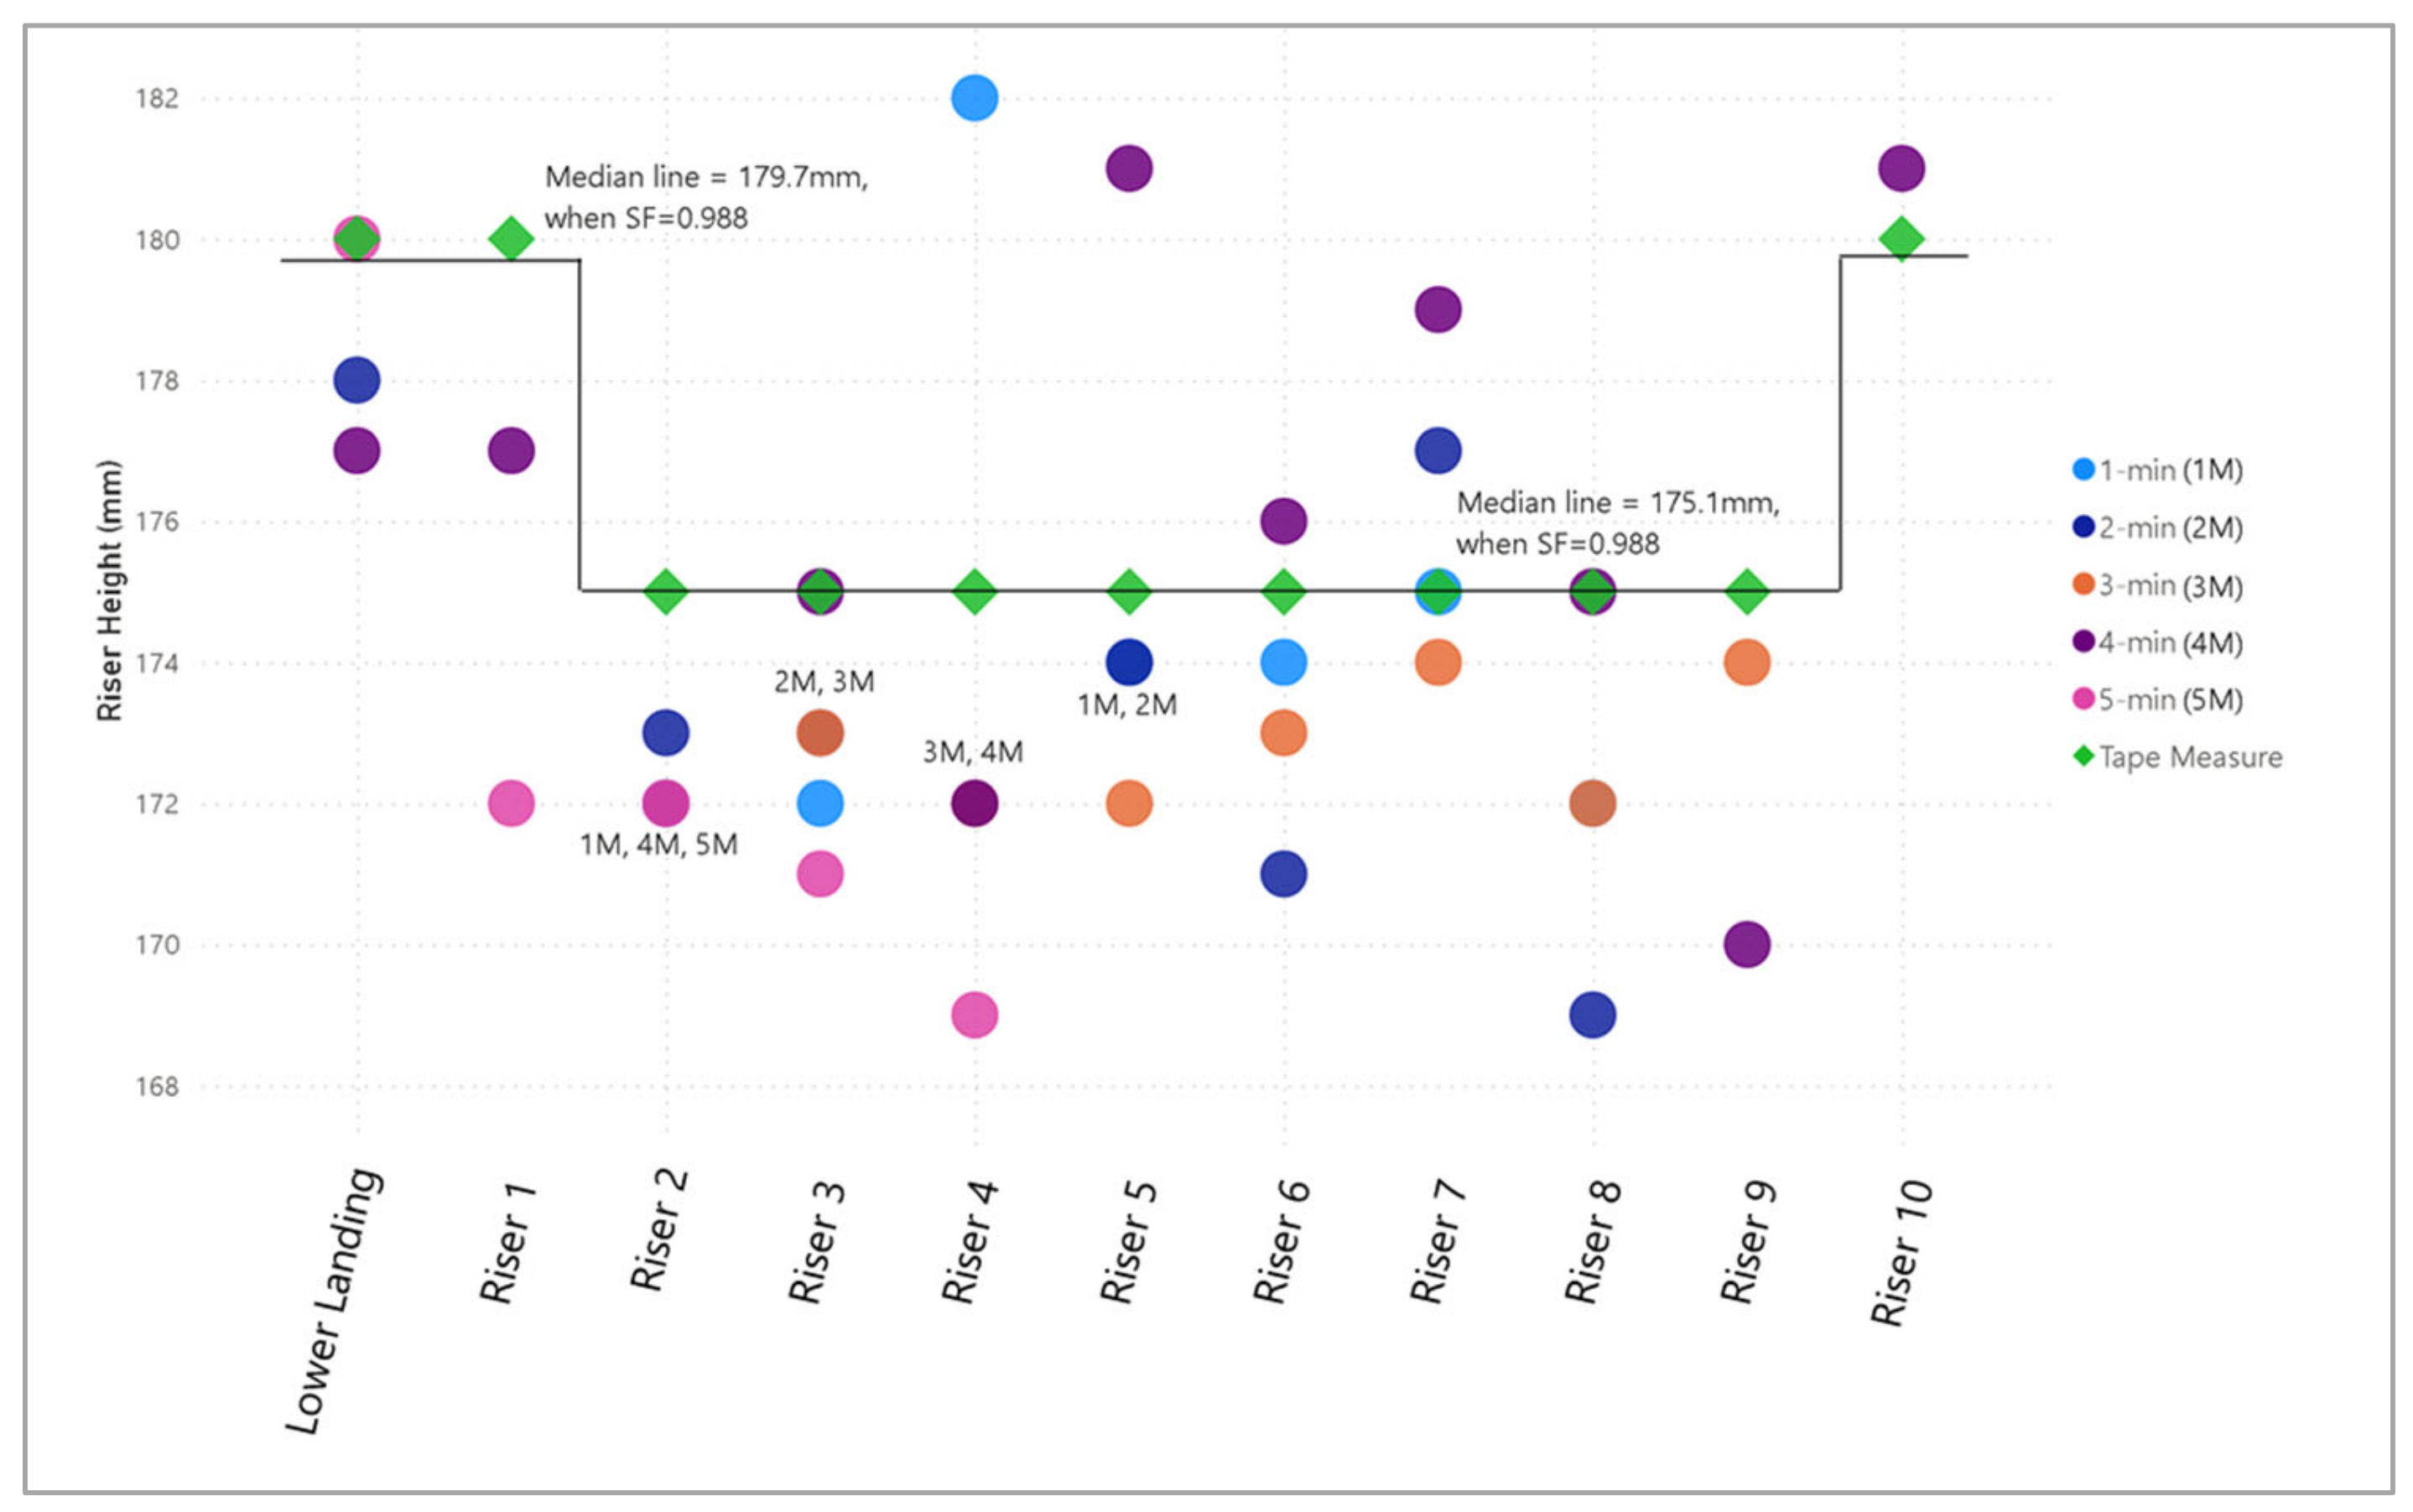
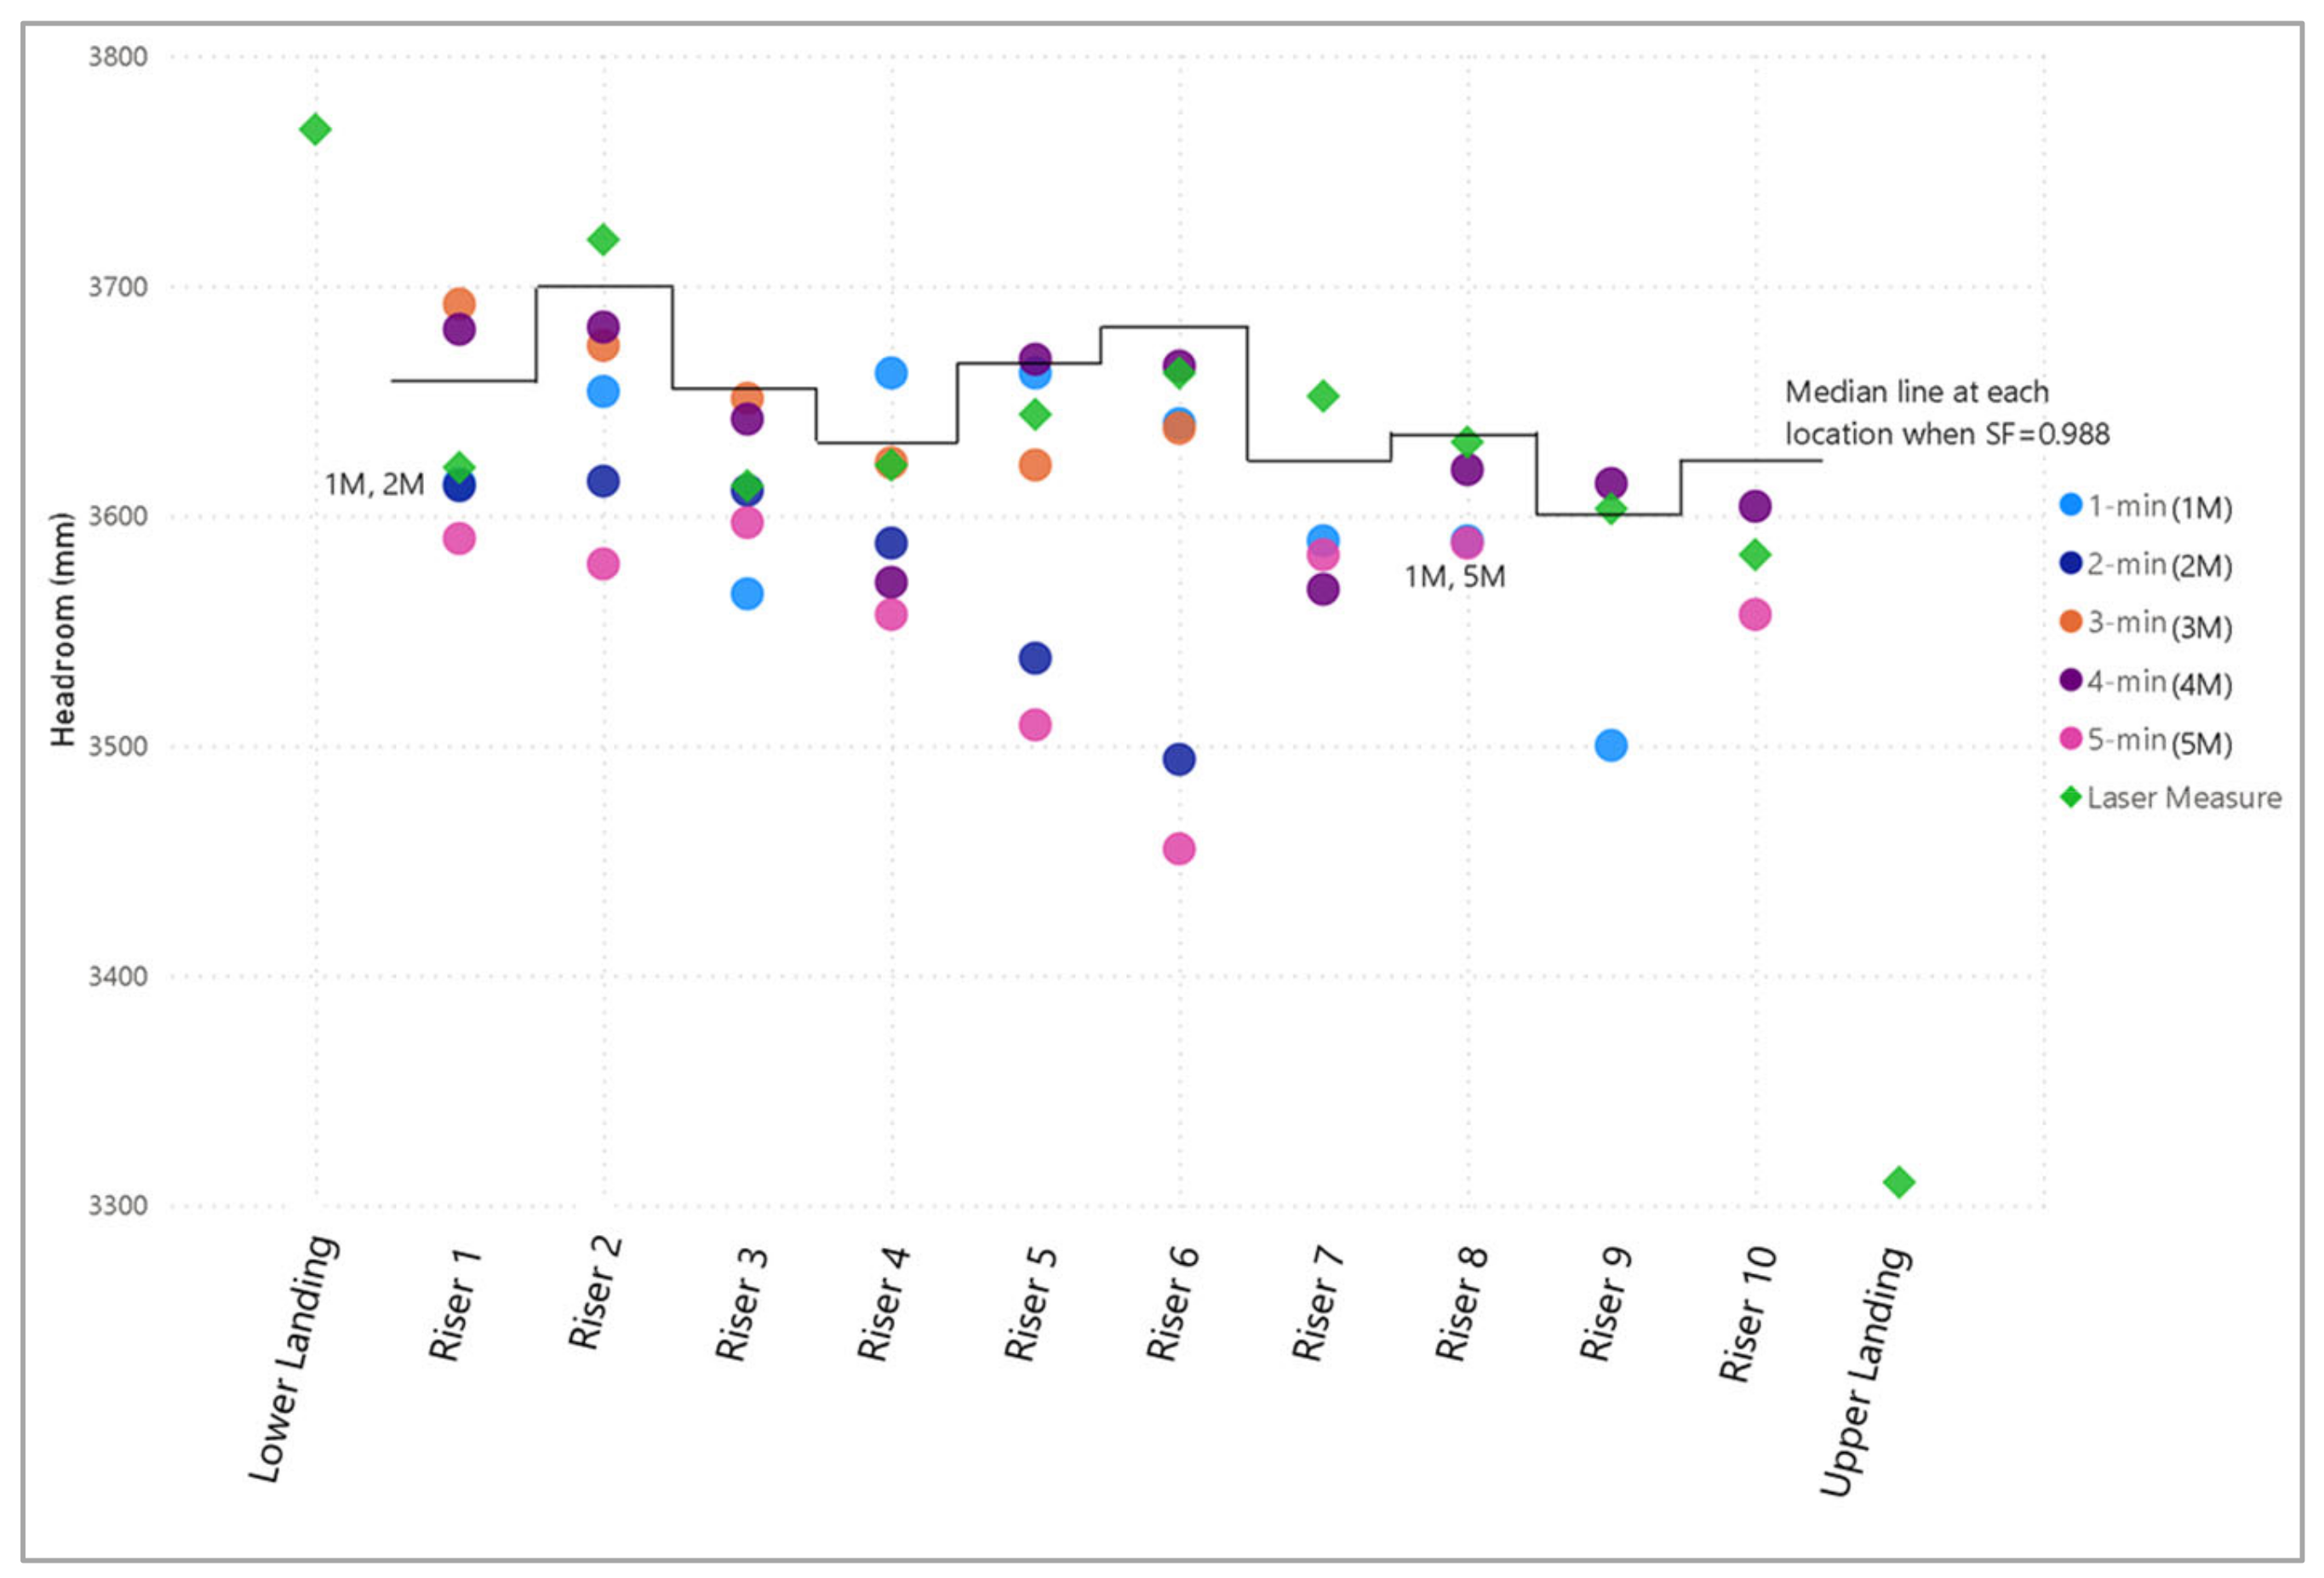
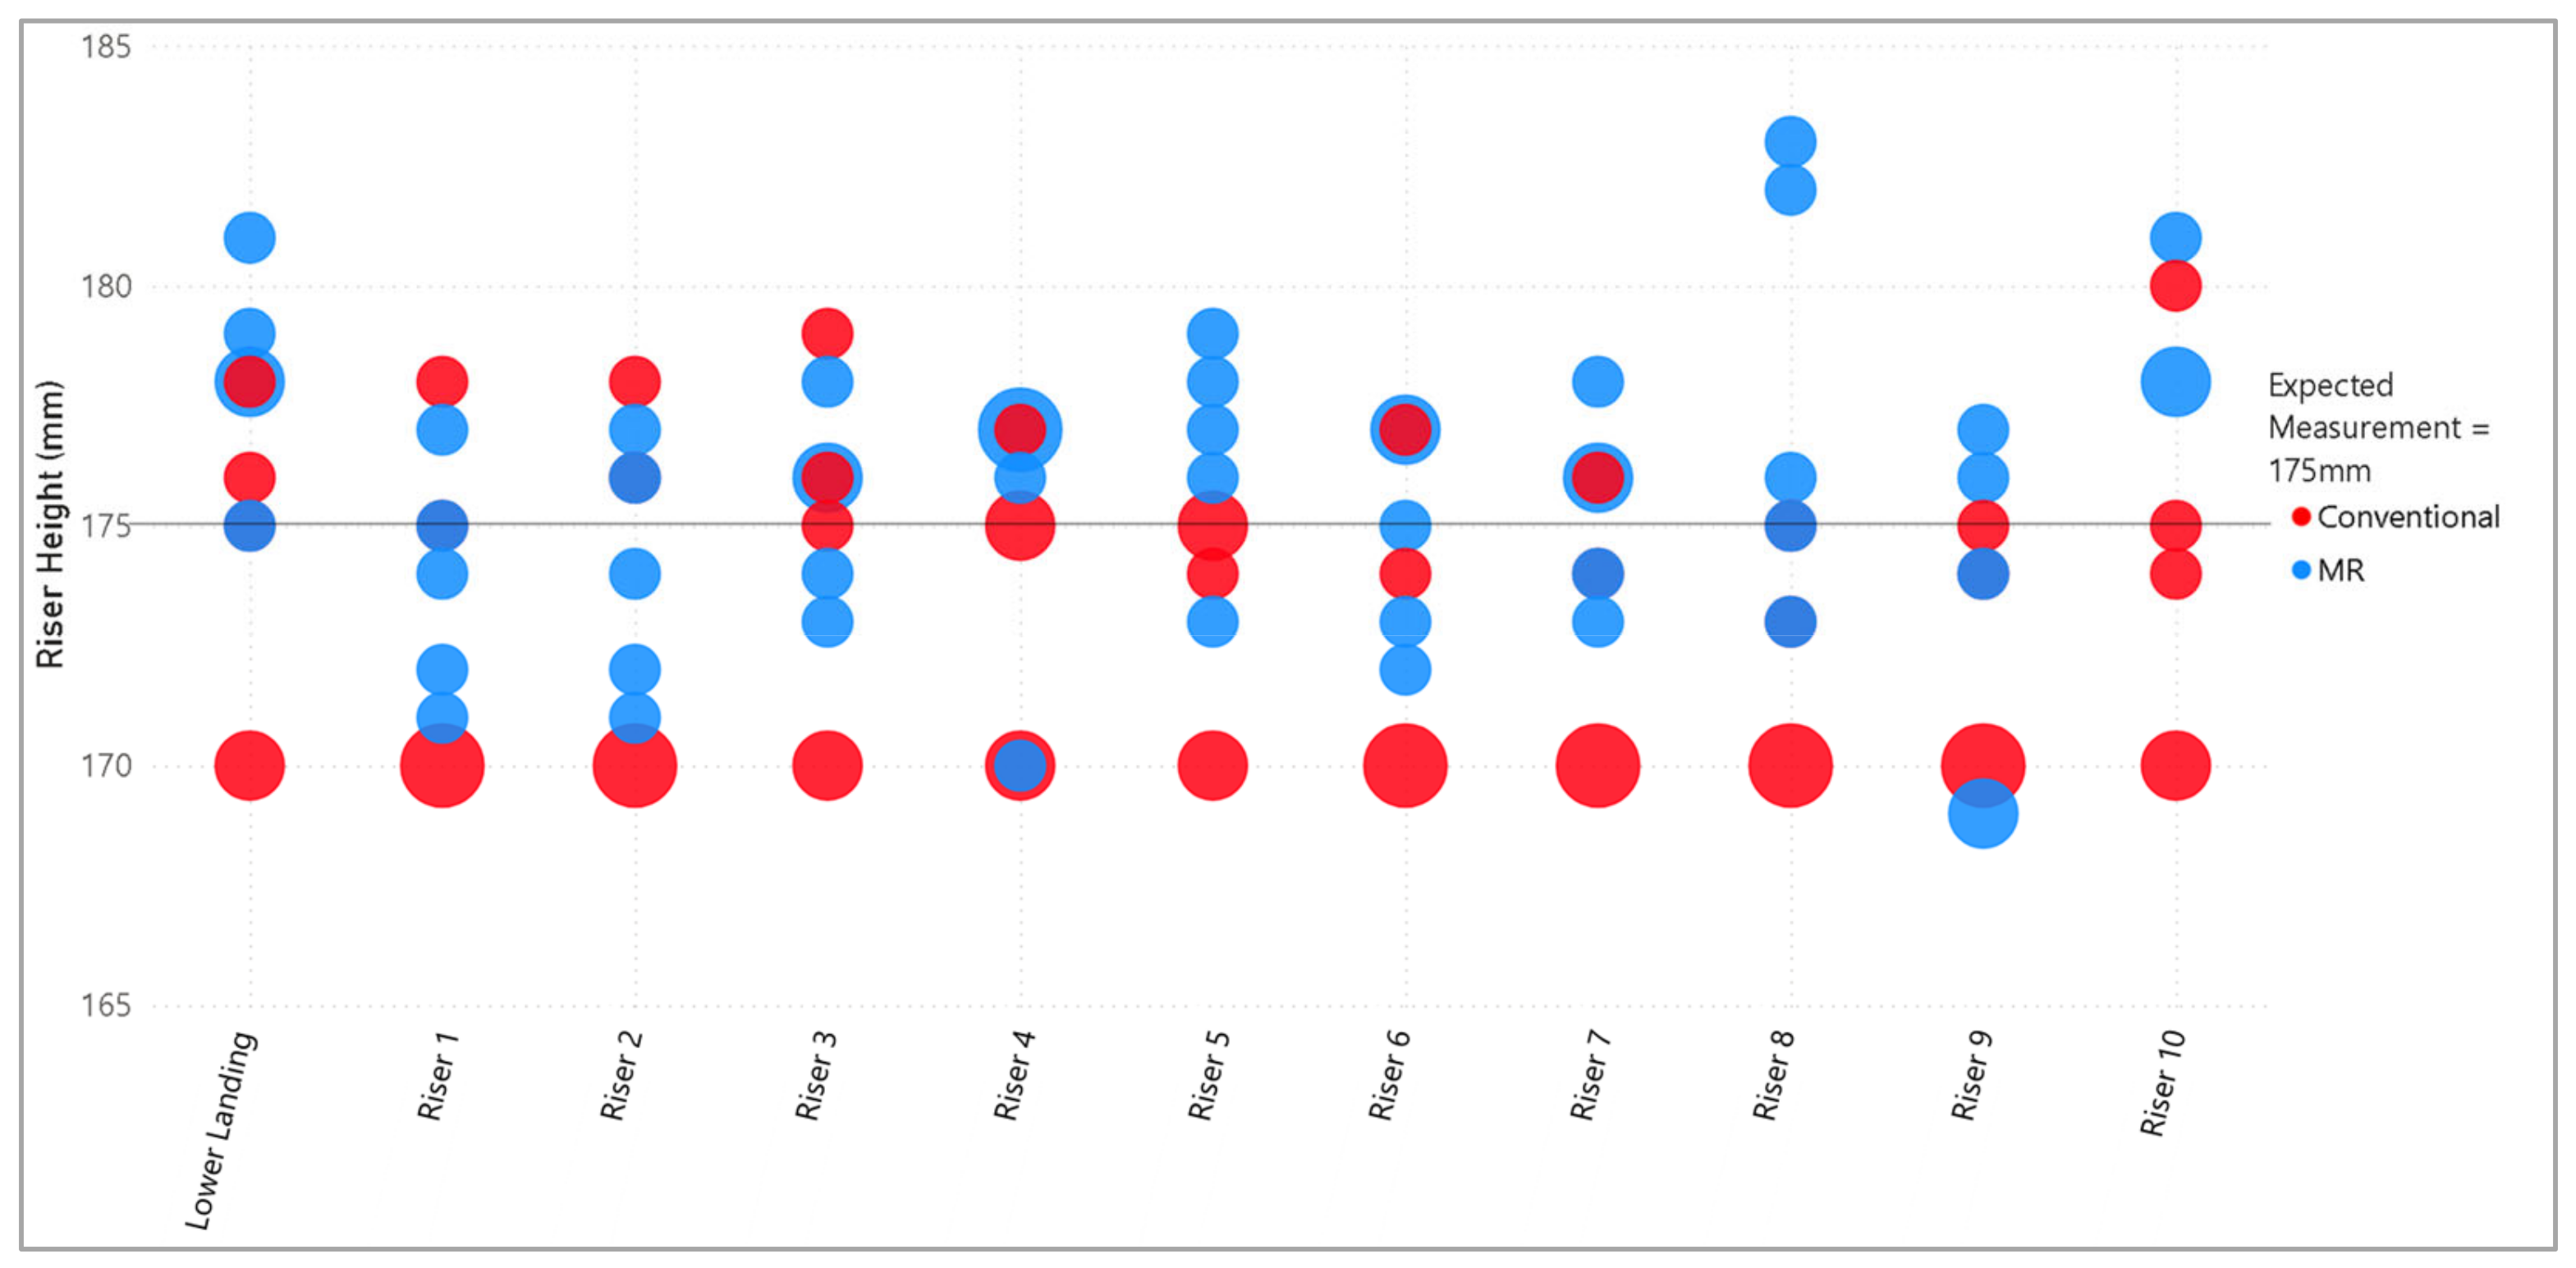
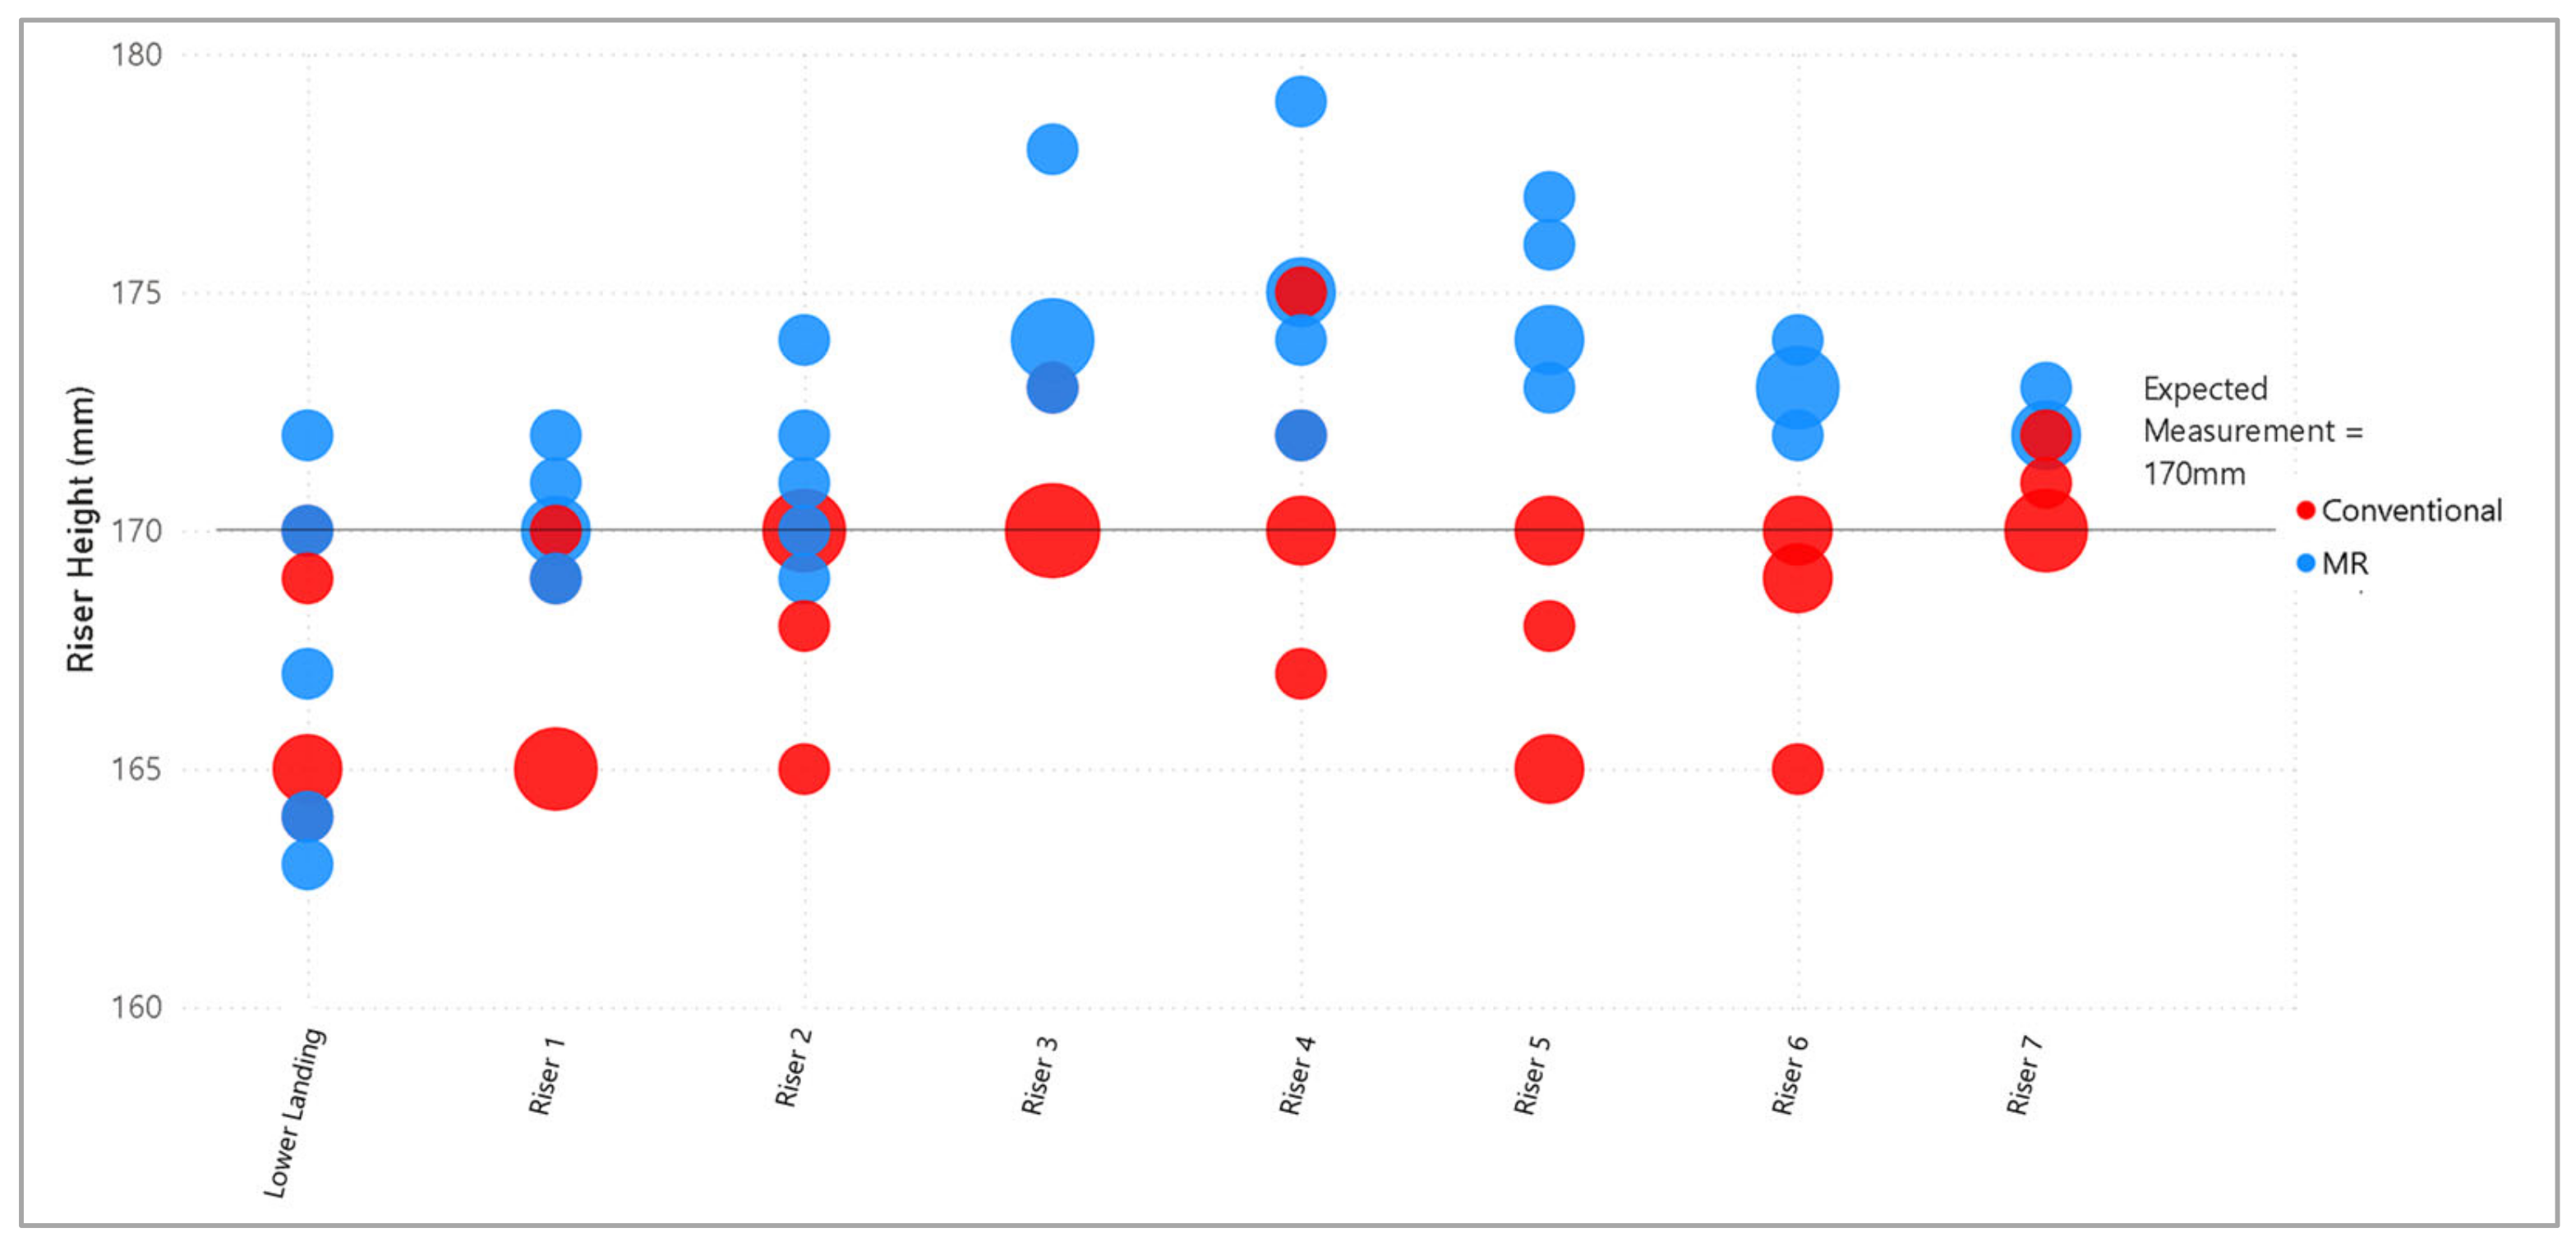
Riser height results at each location are presented in Figure 8. While previous studies indicated that HoloLens meshes had a scale factor of approximately 0.988 compared to TLS data [50,55], the scale factor was observed only for values where conventional measurements were close to 175 mm but not for values close to 180 mm. However, due to the limited MR data available for heights of 180 mm, the shortfall of the applied scale factor was inconclusive. Figure 9 shows the occurrences of automated dimensions across the different scanning times. The data indicates that a 4-min scanning duration produced the most significant number of automated measurements. However, there is no clear correlation between scanning duration and the accuracy of measurements. Since a single user conducted all measurements, the variability of conventionally acquired measurements remains undetermined in this experimental series.
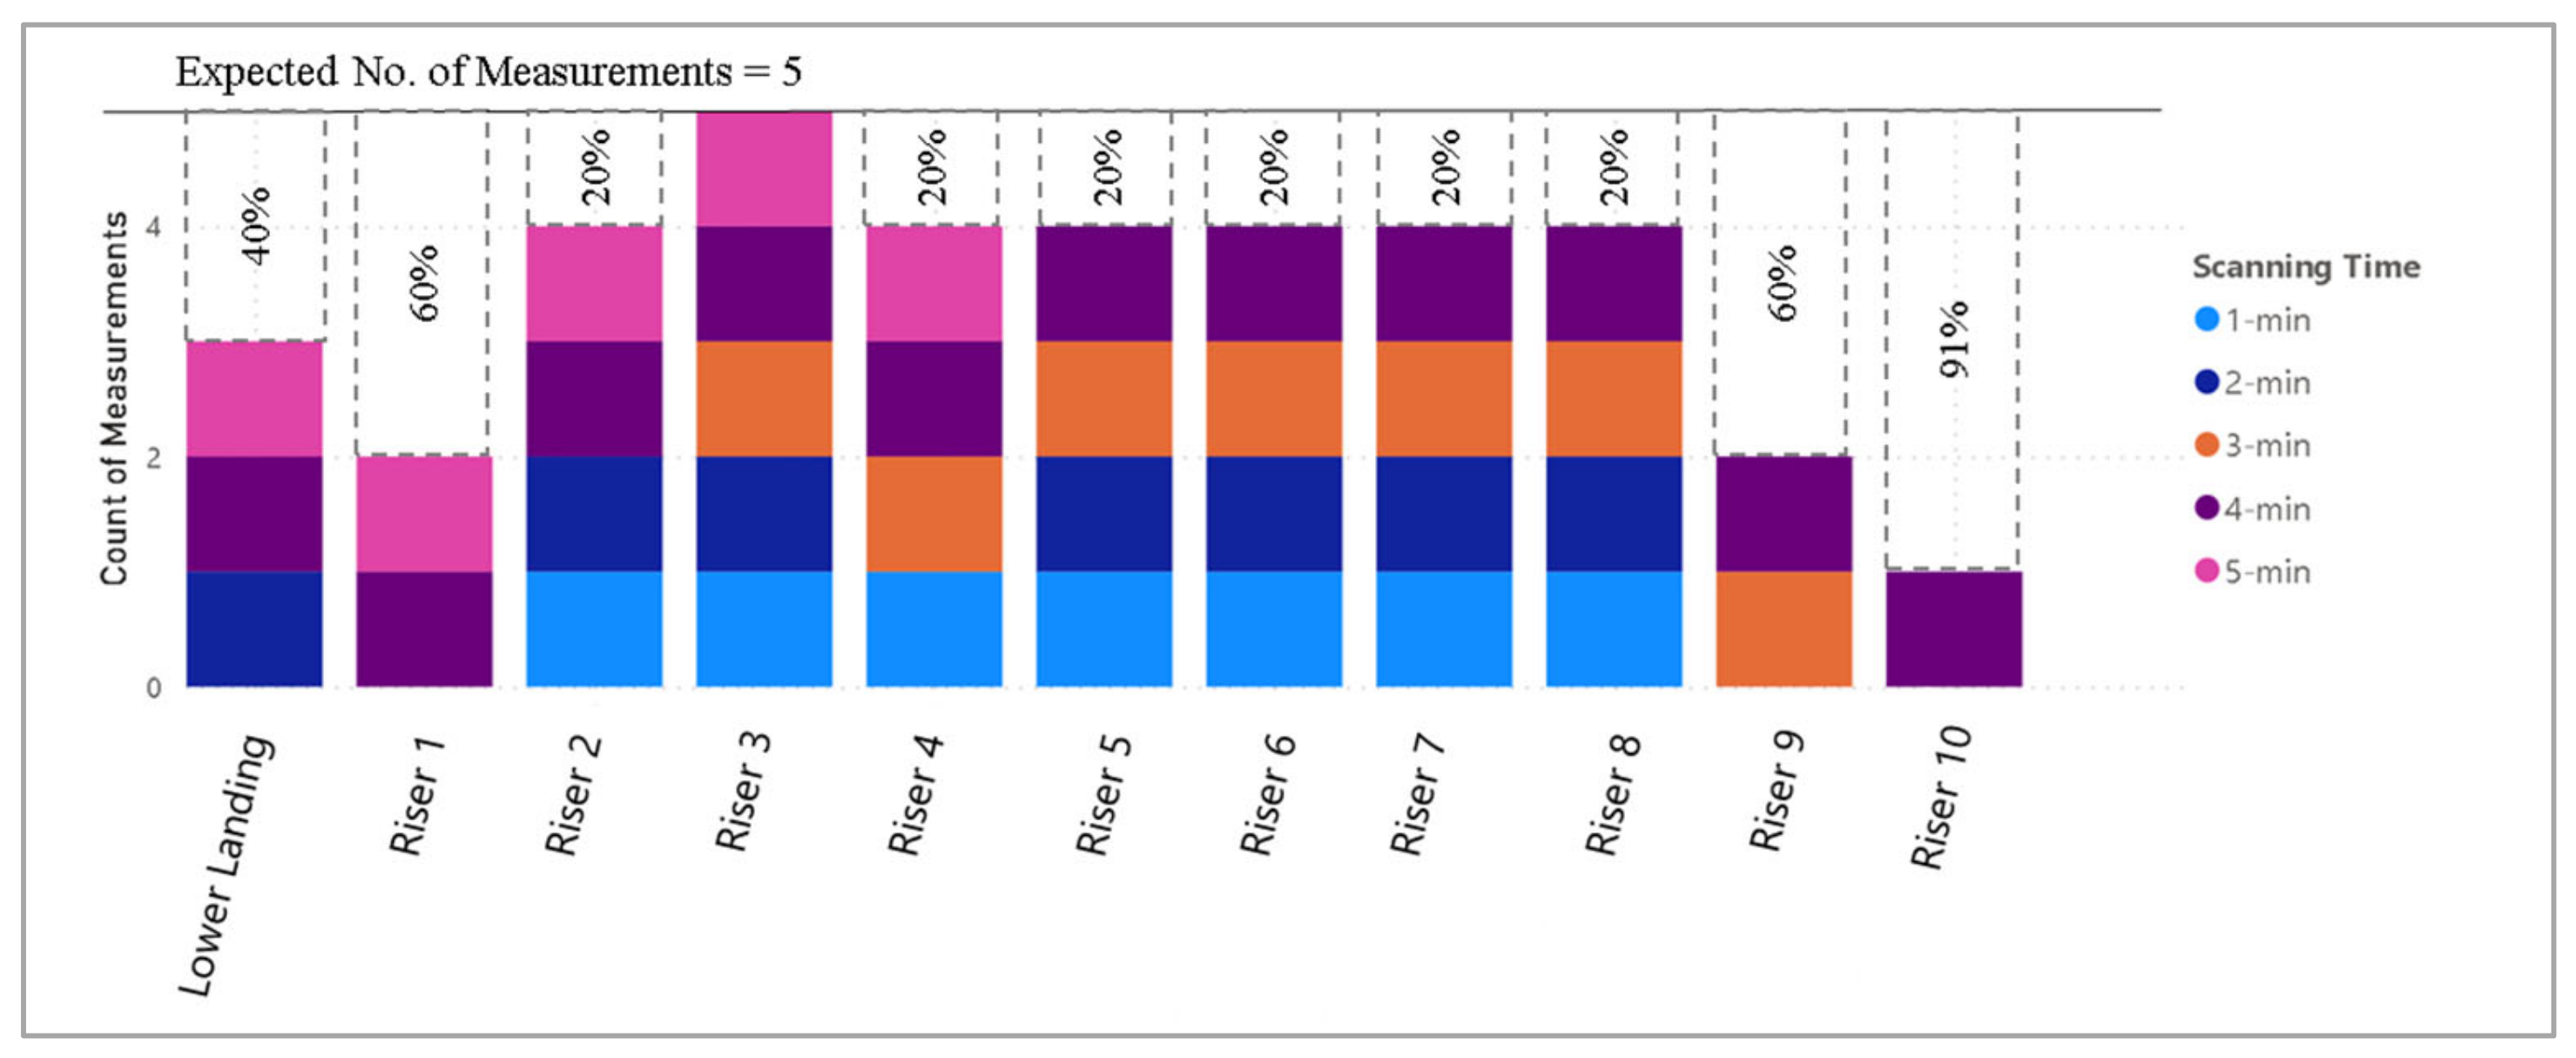
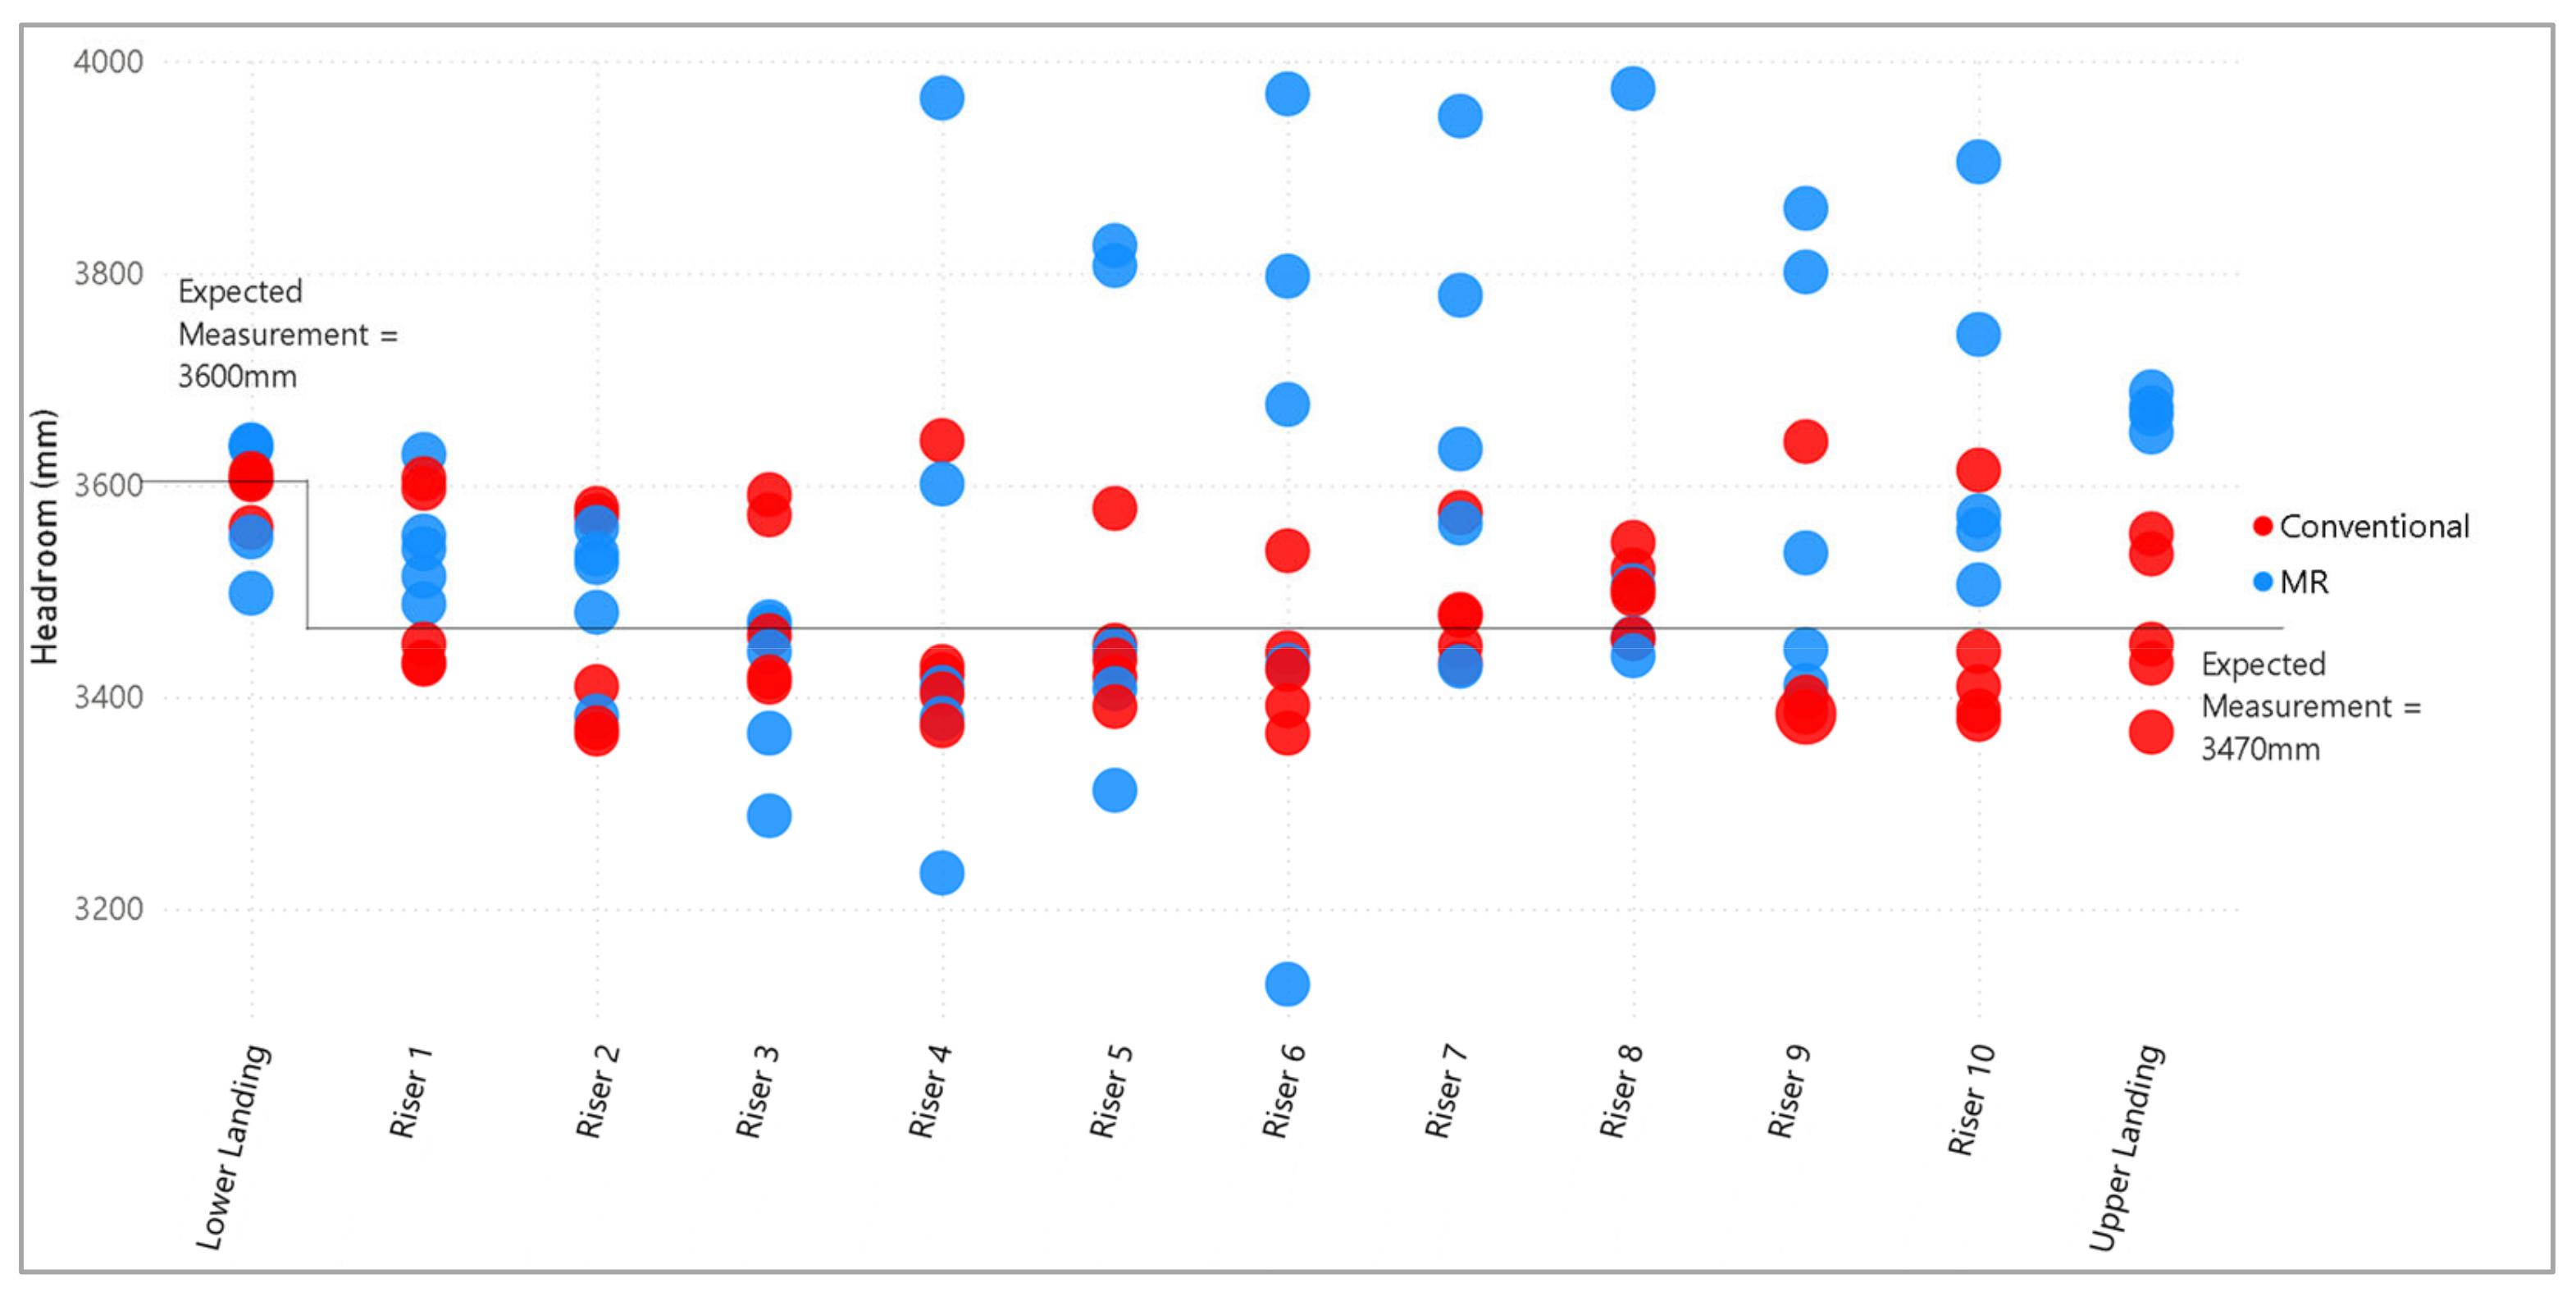
Figure 10 shows the results for headroom measurements. While applying the scale factor brought the results at specific locations closer to the conventional measurement value, there is no clear relationship suggesting a constant scale factor. Due to the small sample of results at each location, it remains inconclusive that there is a constant scale factor in this case. Since the headroom measurements lie close to the device’s sensor range, the observed variations could be attributed to this limitation. While automated measurements for riser heights occur more often in the mid-sections of the flight, the first half of the flight’s headroom measurements could consistently be automated across all scanning durations, as shown in Figure 11. Similar to the riser height results, the 4-min scan yielded the most significant number of automated dimensions generated.
Occurrences of automated dimensions depend on the accuracy of the scene understanding SDK’s classification of meshes. If meshes were not designated with proper attributes, automated computation of measurements cannot be conducted. As such, manual measurements would be required to supplement the automated measurements to obtain a complete set of staircase measurements.
Although spatial data was reset before each test, the experiments were executed consecutively, providing negligible cool-down time for the HoloLens 2 device. The favorable results from the 4-min scan might be attributed to a warmed-up HoloLens. It has been previously reported that sensor data stabilizes after about 60 min of device operation [50]. As the HoloLens ran out of battery after the 4-min scan and had to be recharged before commencing the 5-min scan experiment, the subsequent 5-min scan experiment did not obtain similar success but produced satisfactory headroom data.
Considering the data gaps identified in these tests, the MR application underwent further enhancement to incorporate a manual measurement feature. This was to ensure a complete set of staircase measurements could still be obtained even if there were mesh labeling issues by the scene understanding SDK. The manual function relies on mesh coordinate data but not labels and uses the Unity Raycast function to determine distances between two manually designated points. Subsequently, the enhanced application was used by volunteers on two distinct staircase flights and two approximately 5 m-length corridors in HarbourFront Tower One (HFT1) in Singapore, shown in Figure 1 and Figure 2, respectively. The results are presented in Section 3.4.
3.4. Experimental Results by Volunteers
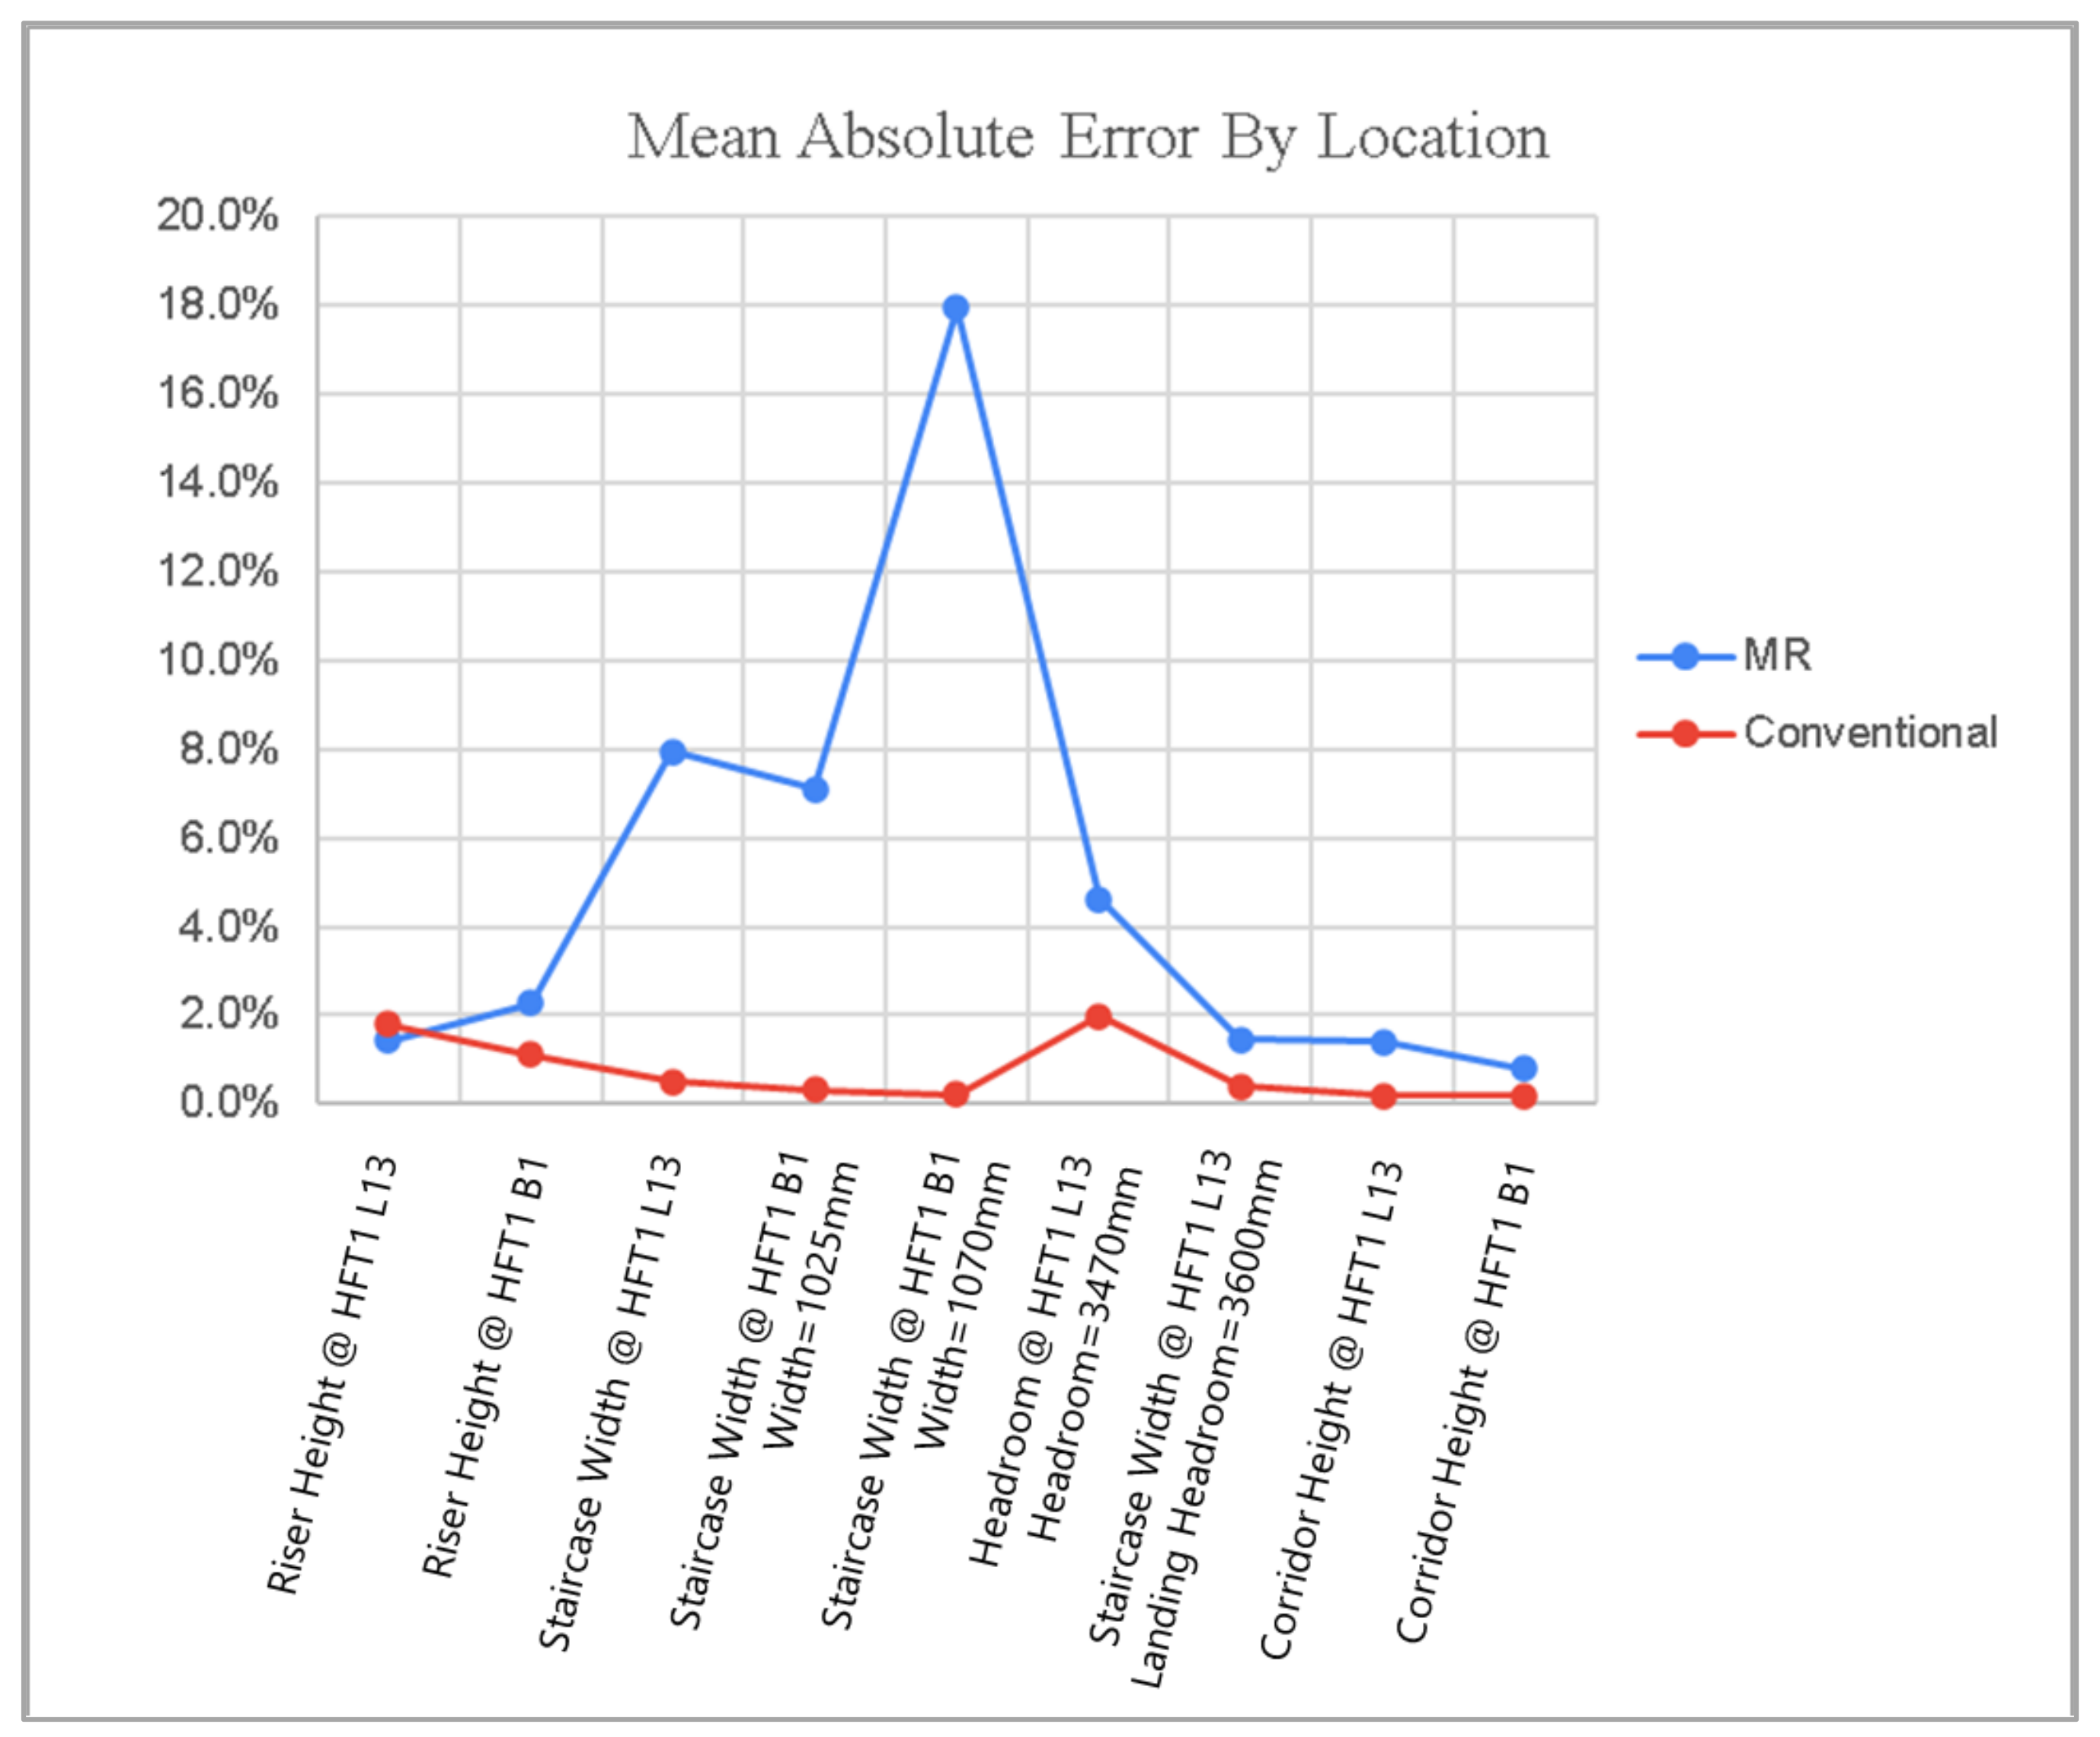
The results derived from experiments by the five volunteers are presented in this section. Key statistical indicators such as Mean Absolute Error (MAE) are evaluated and presented in Figure 12 and summarized in Table 3 to provide insights into the accuracy and reliability of the MR-based measurements. Results for B1′s headroom could not be summarized as the soffit of the stairs was flat, resulting in varied headroom per riser. All raw data can be found in Appendix A. The results show that staircase width results have the highest mean absolute errors of more than 7%, suggesting that using the MR application in this case is not feasible. Headroom results where measurements taken are close to the device’s sensor range exhibited errors close to 5%. In comparison, all other locations exhibited 2% or fewer errors, suggesting the potential to use the MR application for measurements.
Applying the scale factor from previous studies [55] to these results showed that the mean errors were reduced in all cases except for staircase widths. The outcomes with the applied scale factor are tabulated in Table 4. Observed scale factors have also been tabulated for comparison and are further discussed in Section 4.
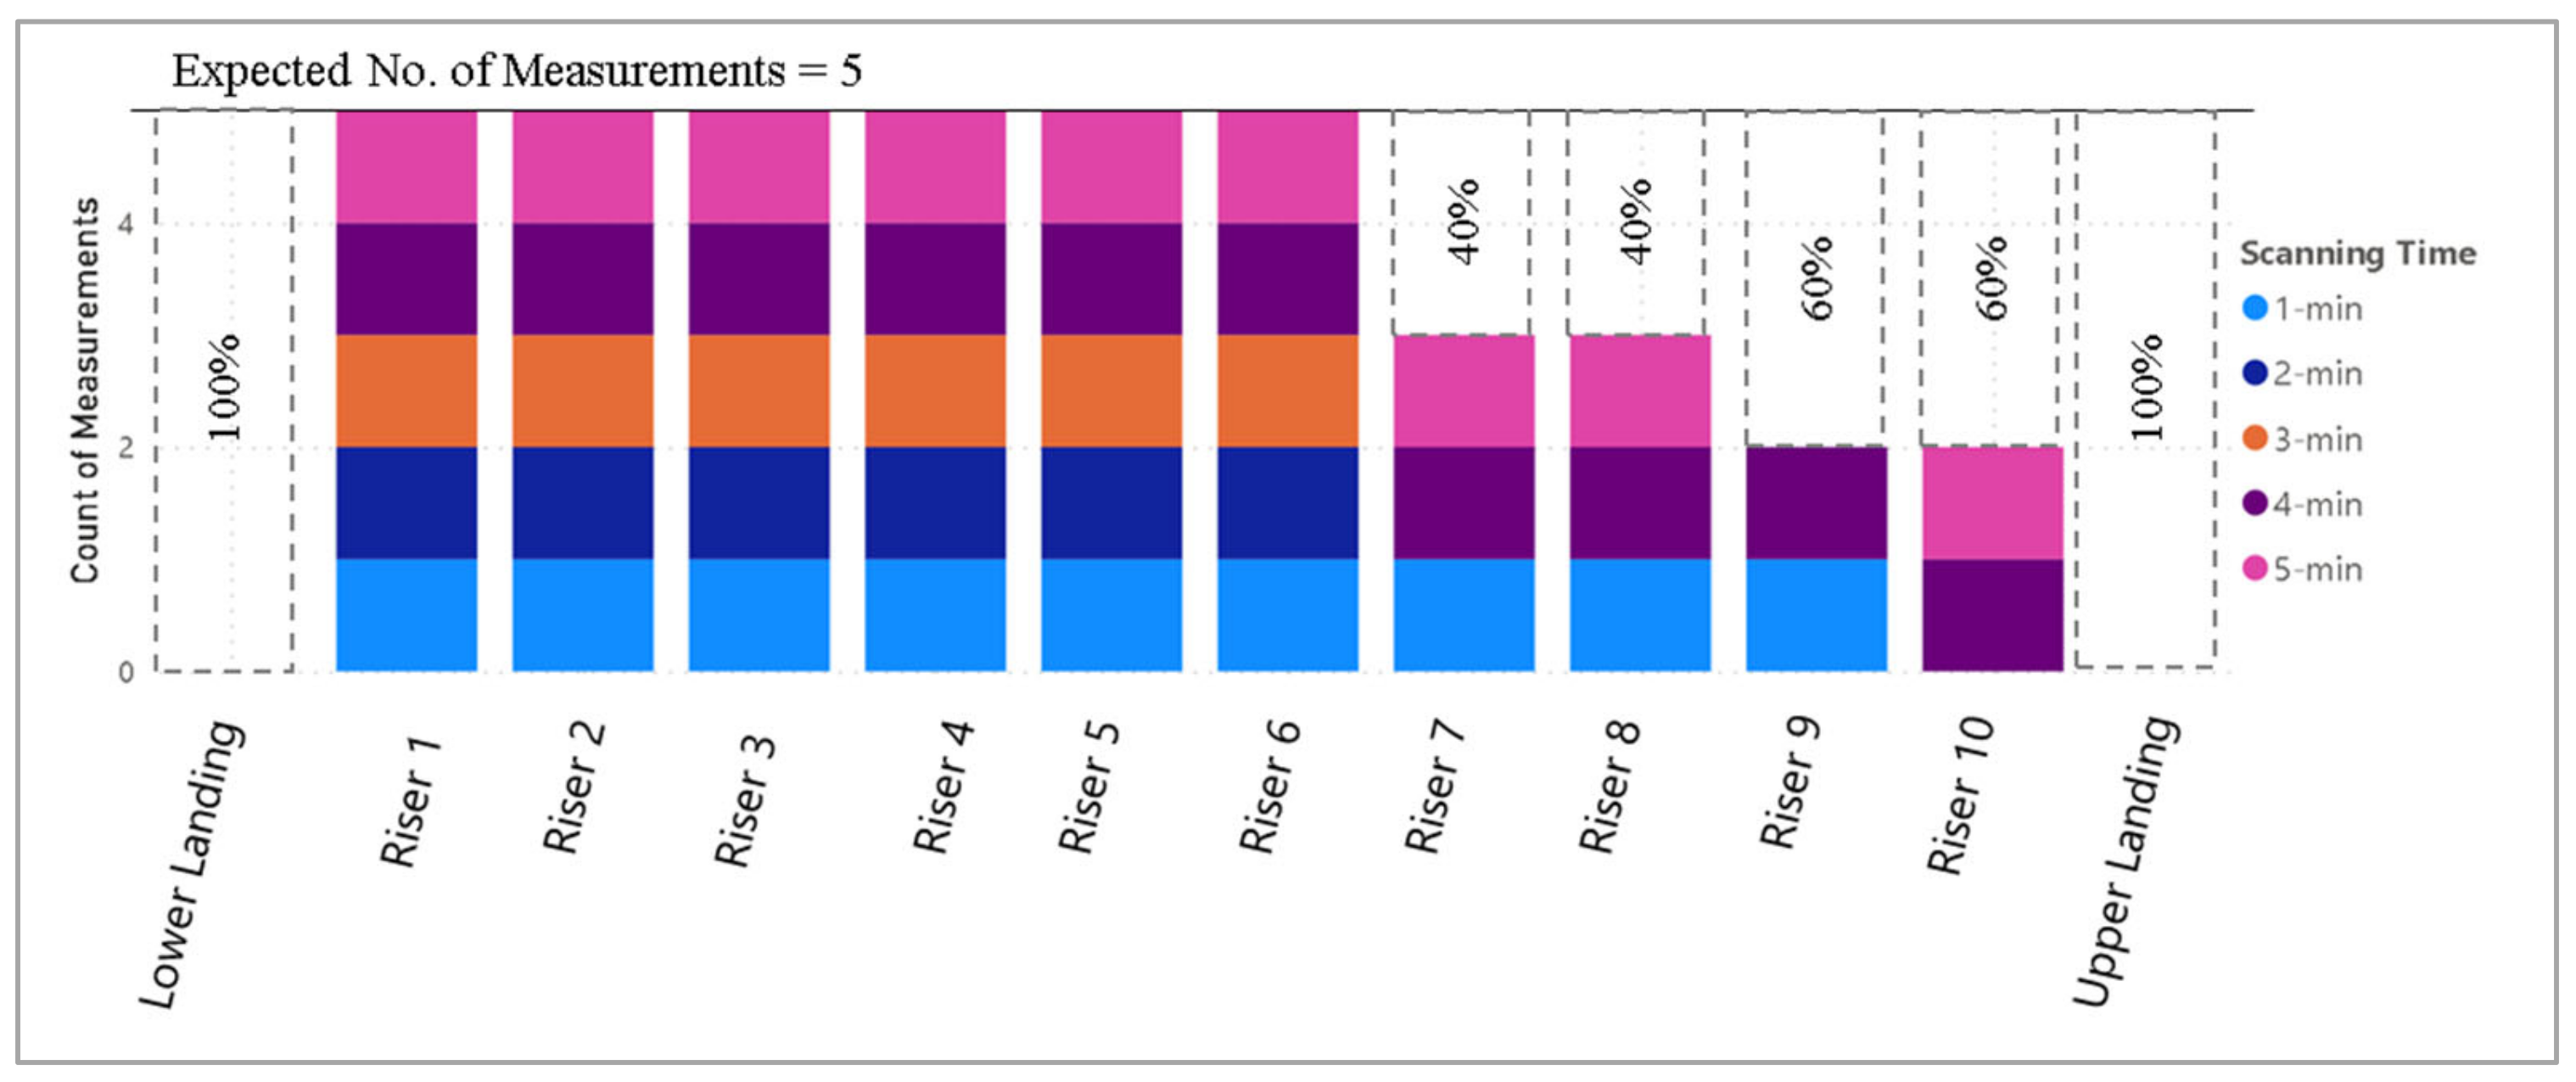
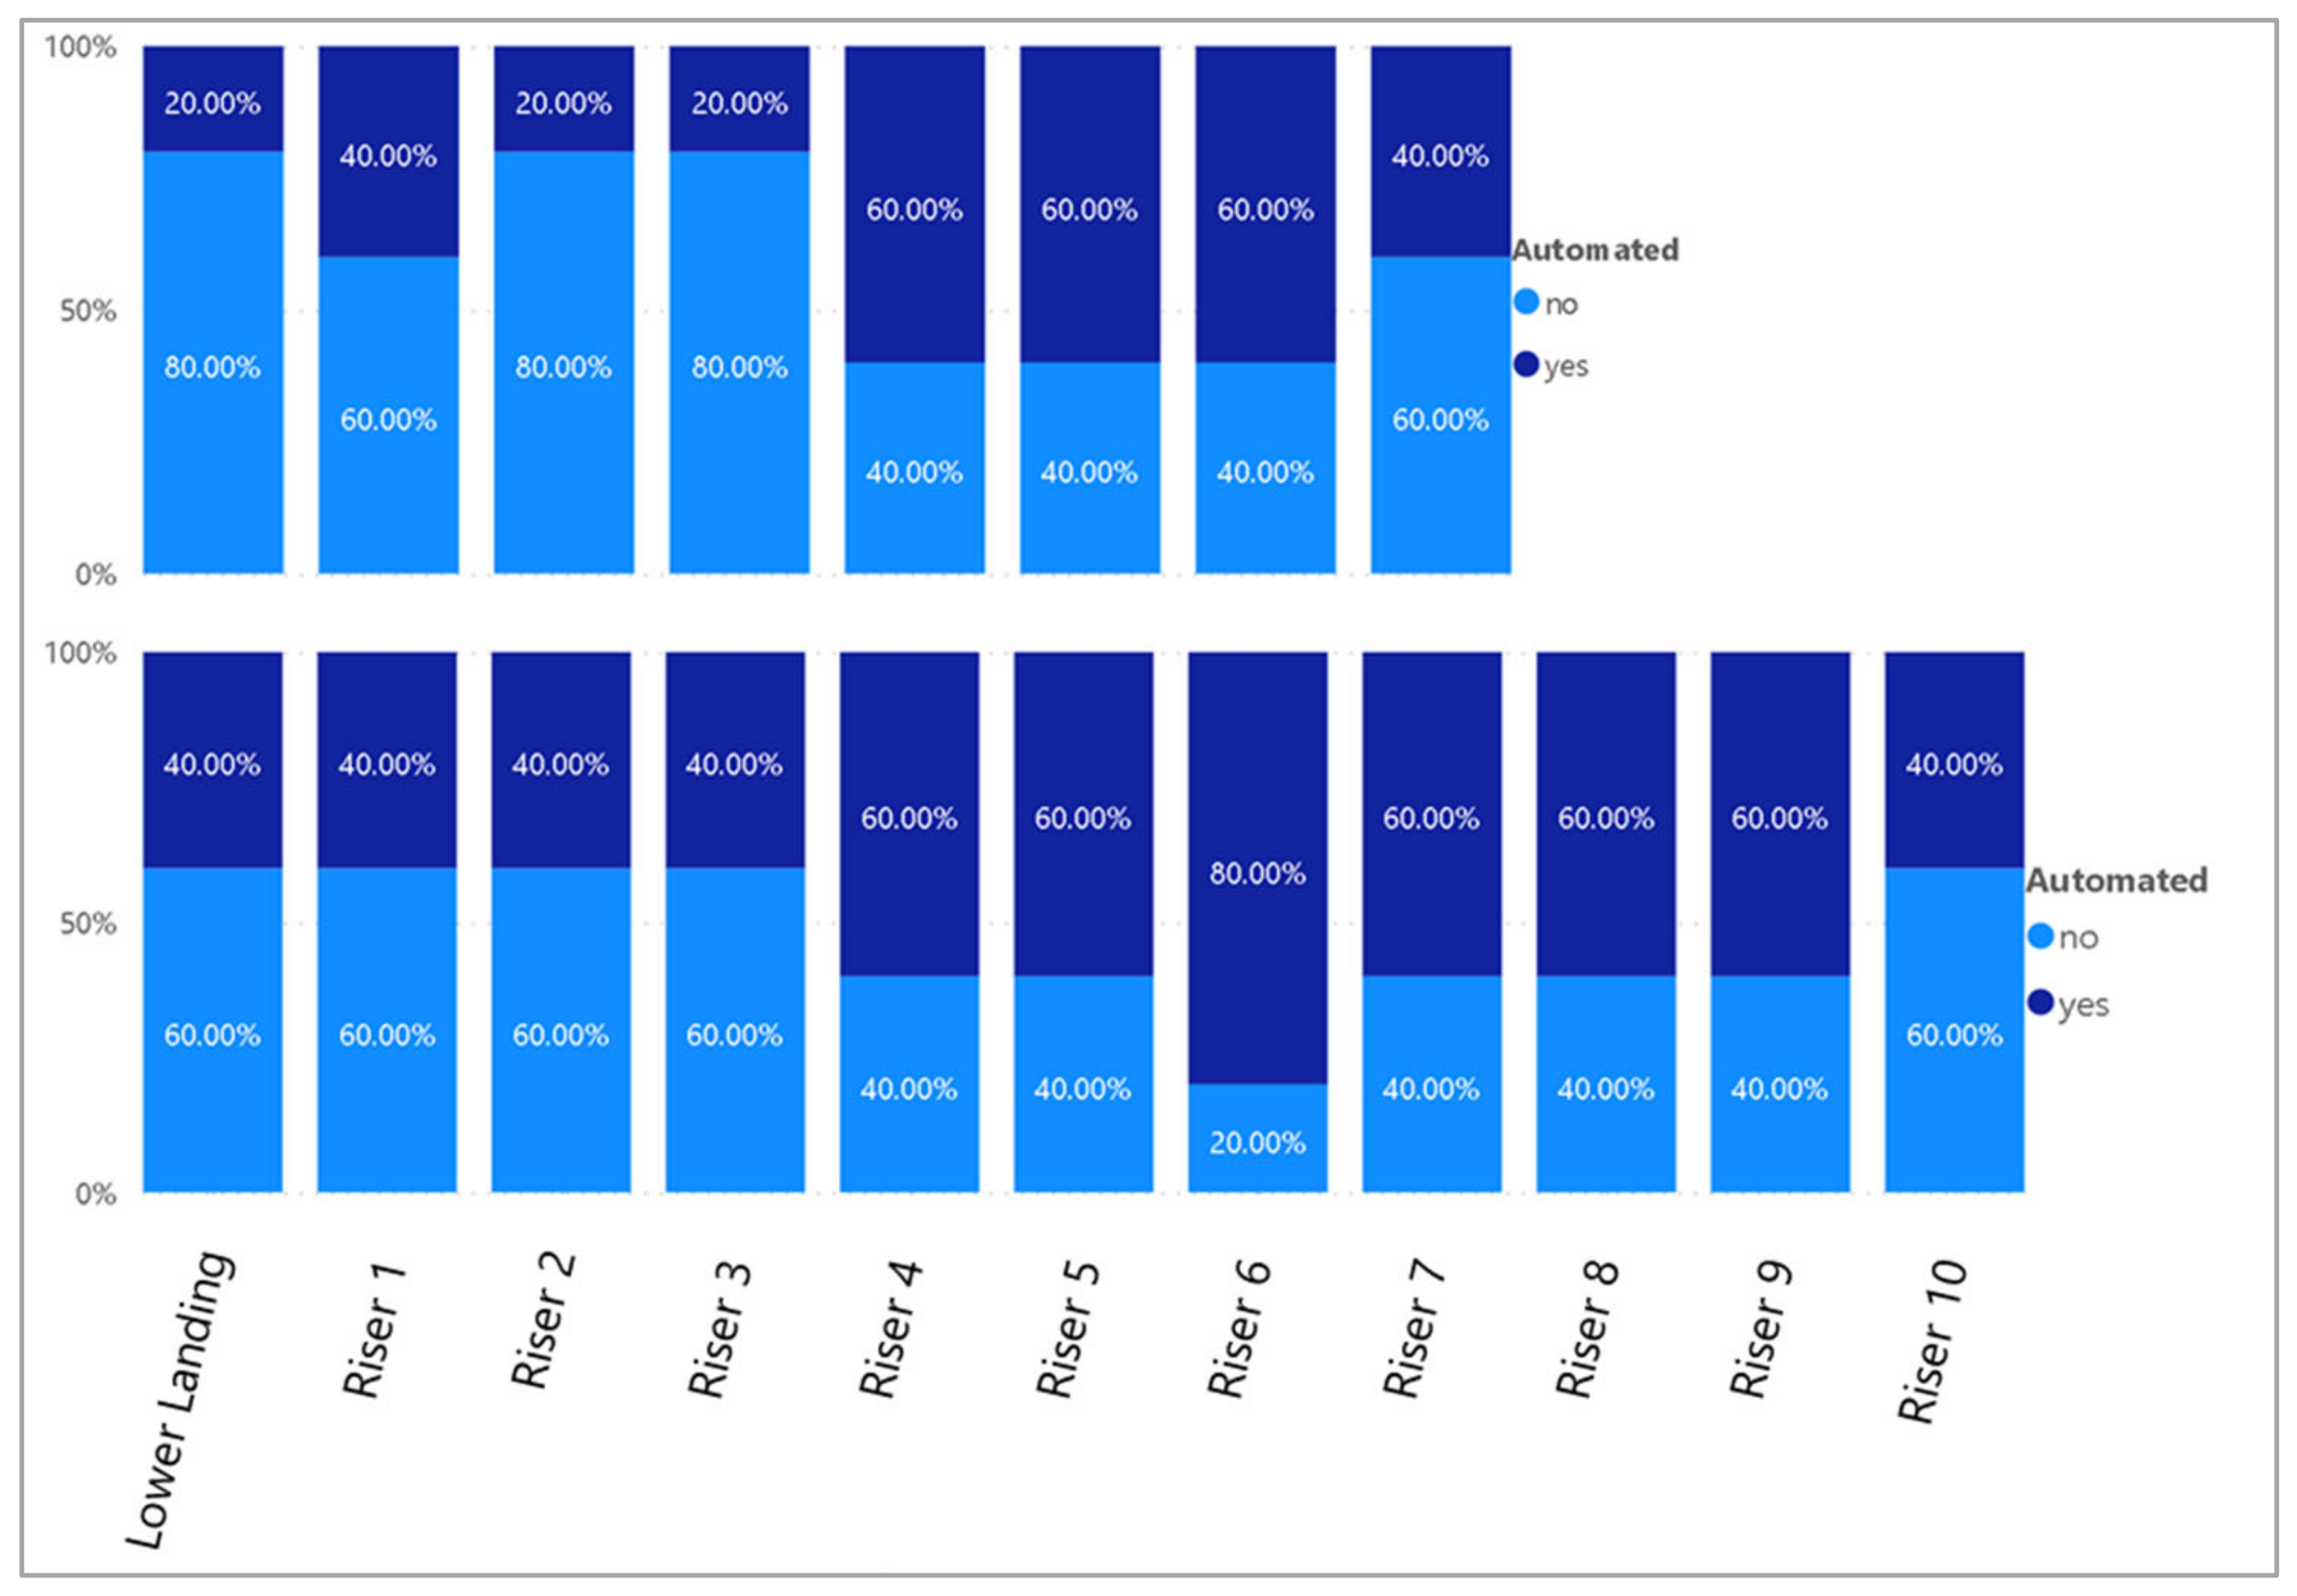
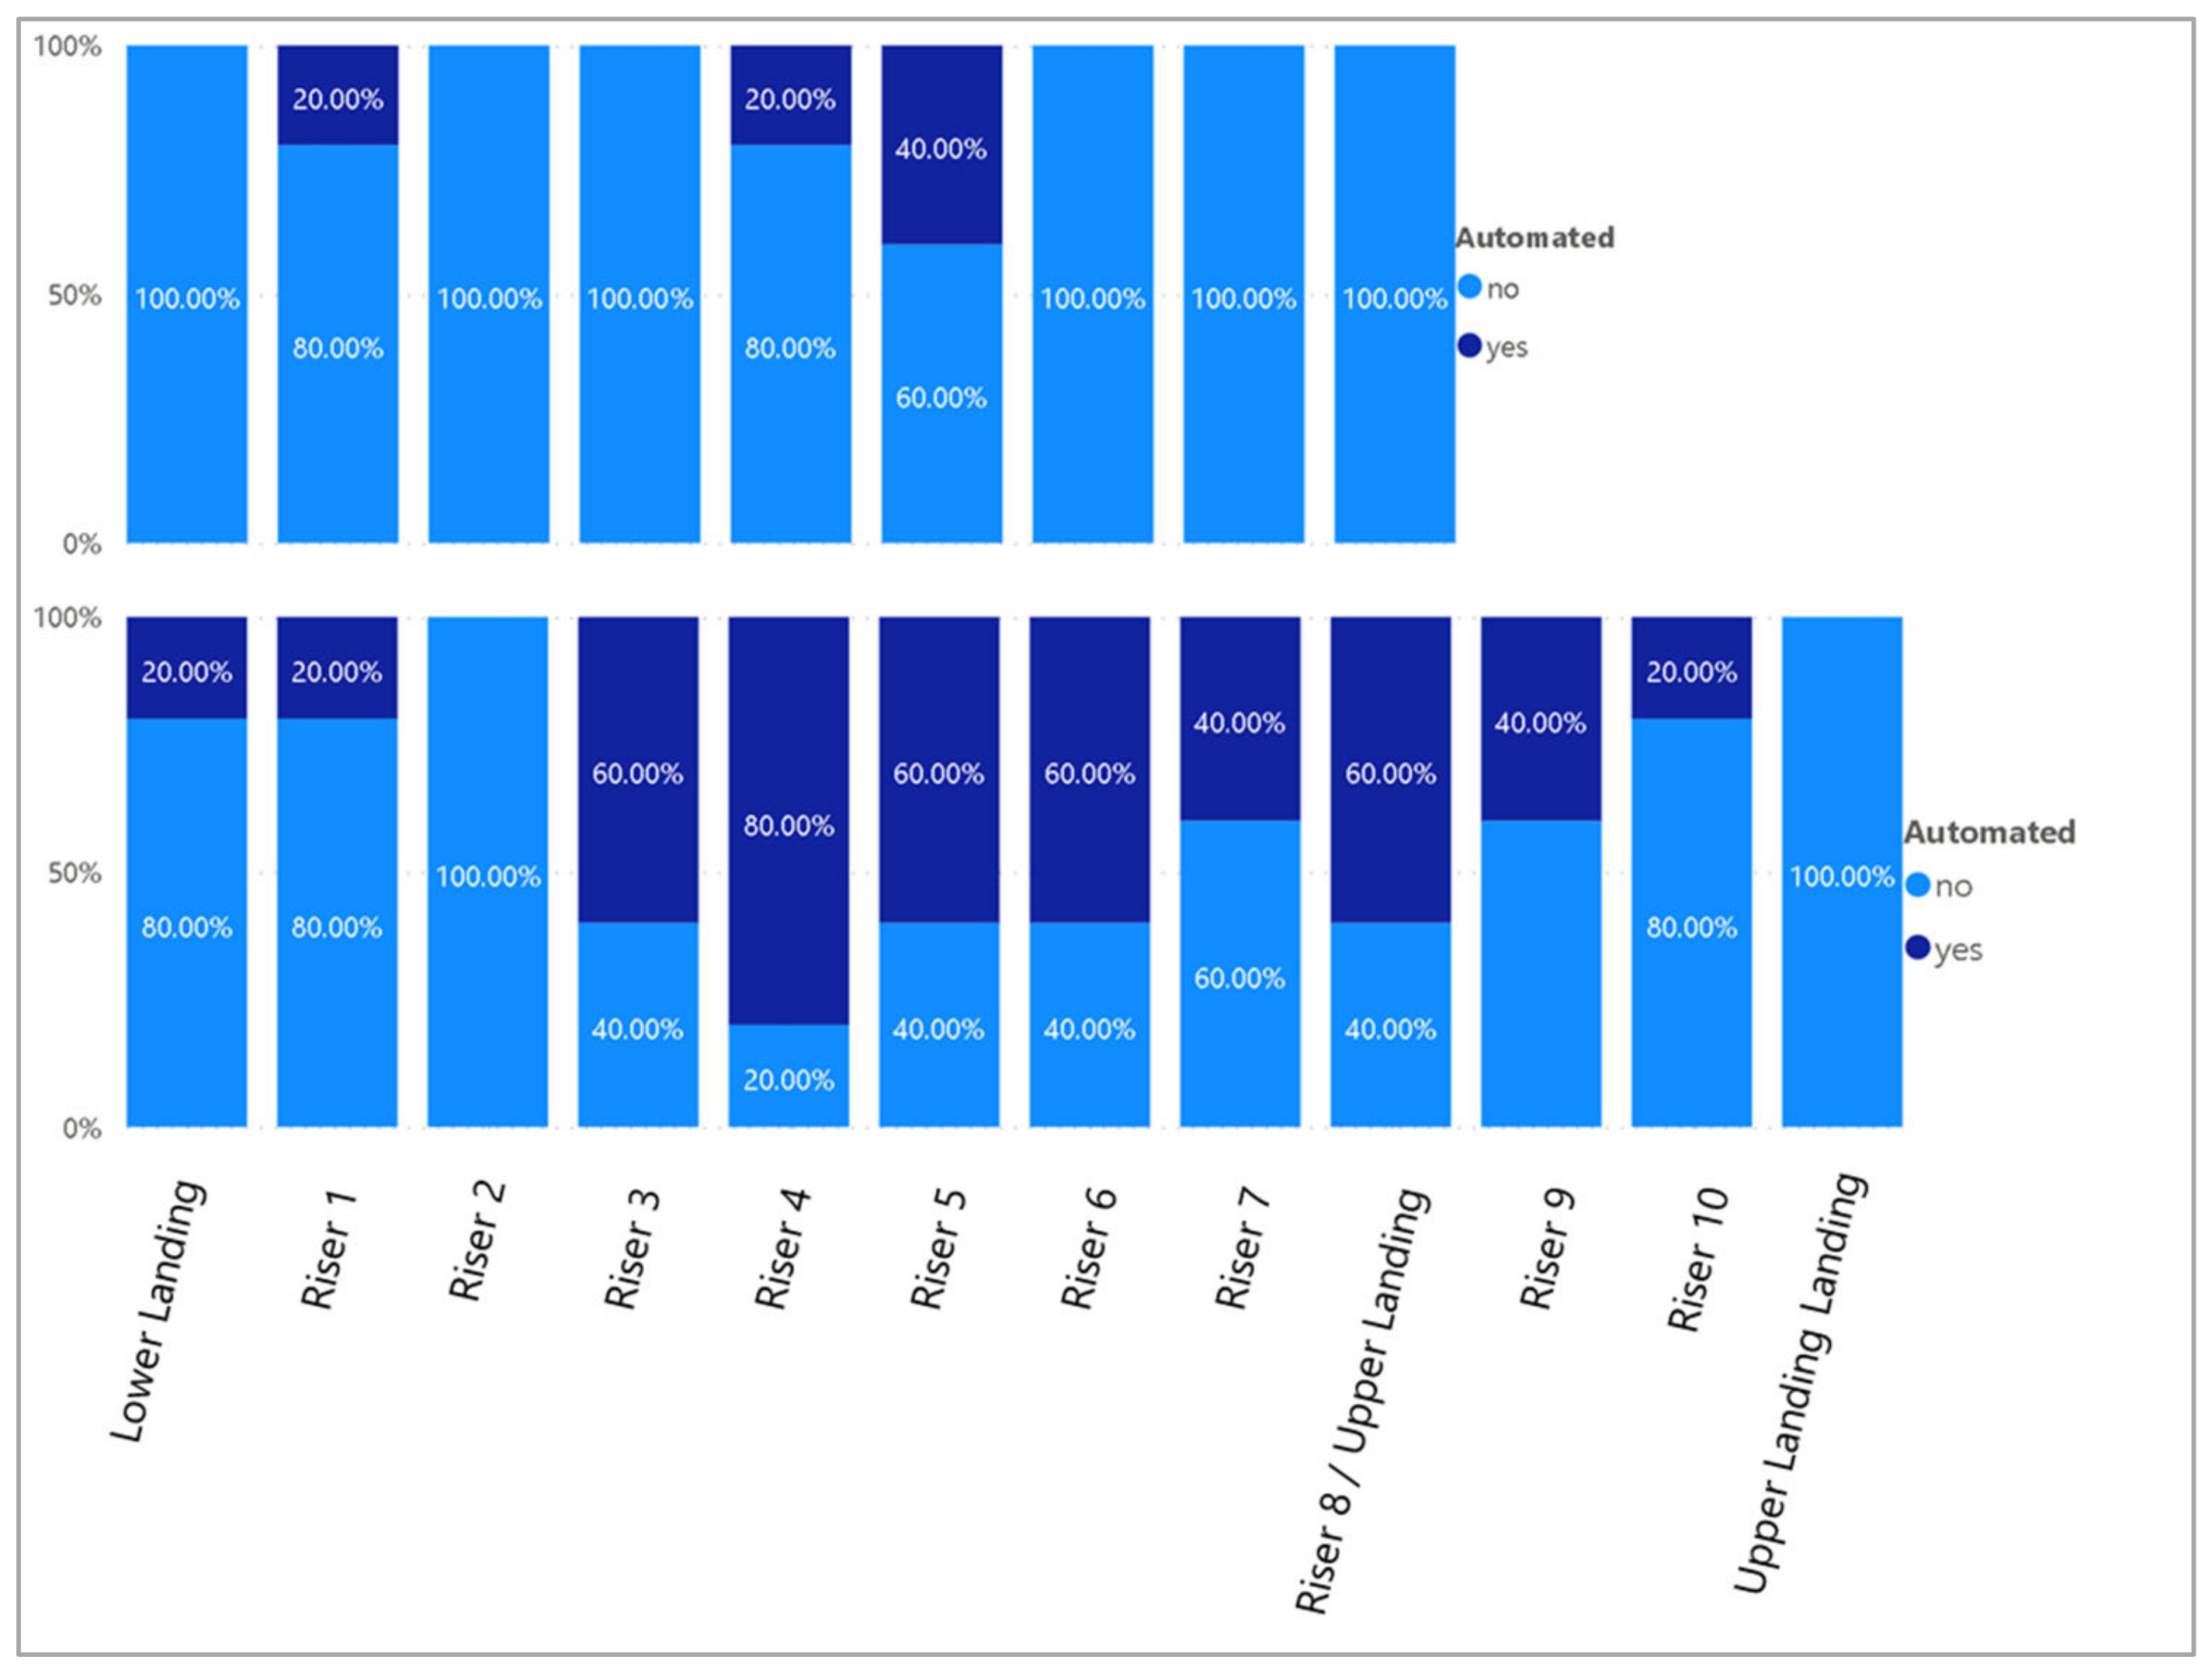
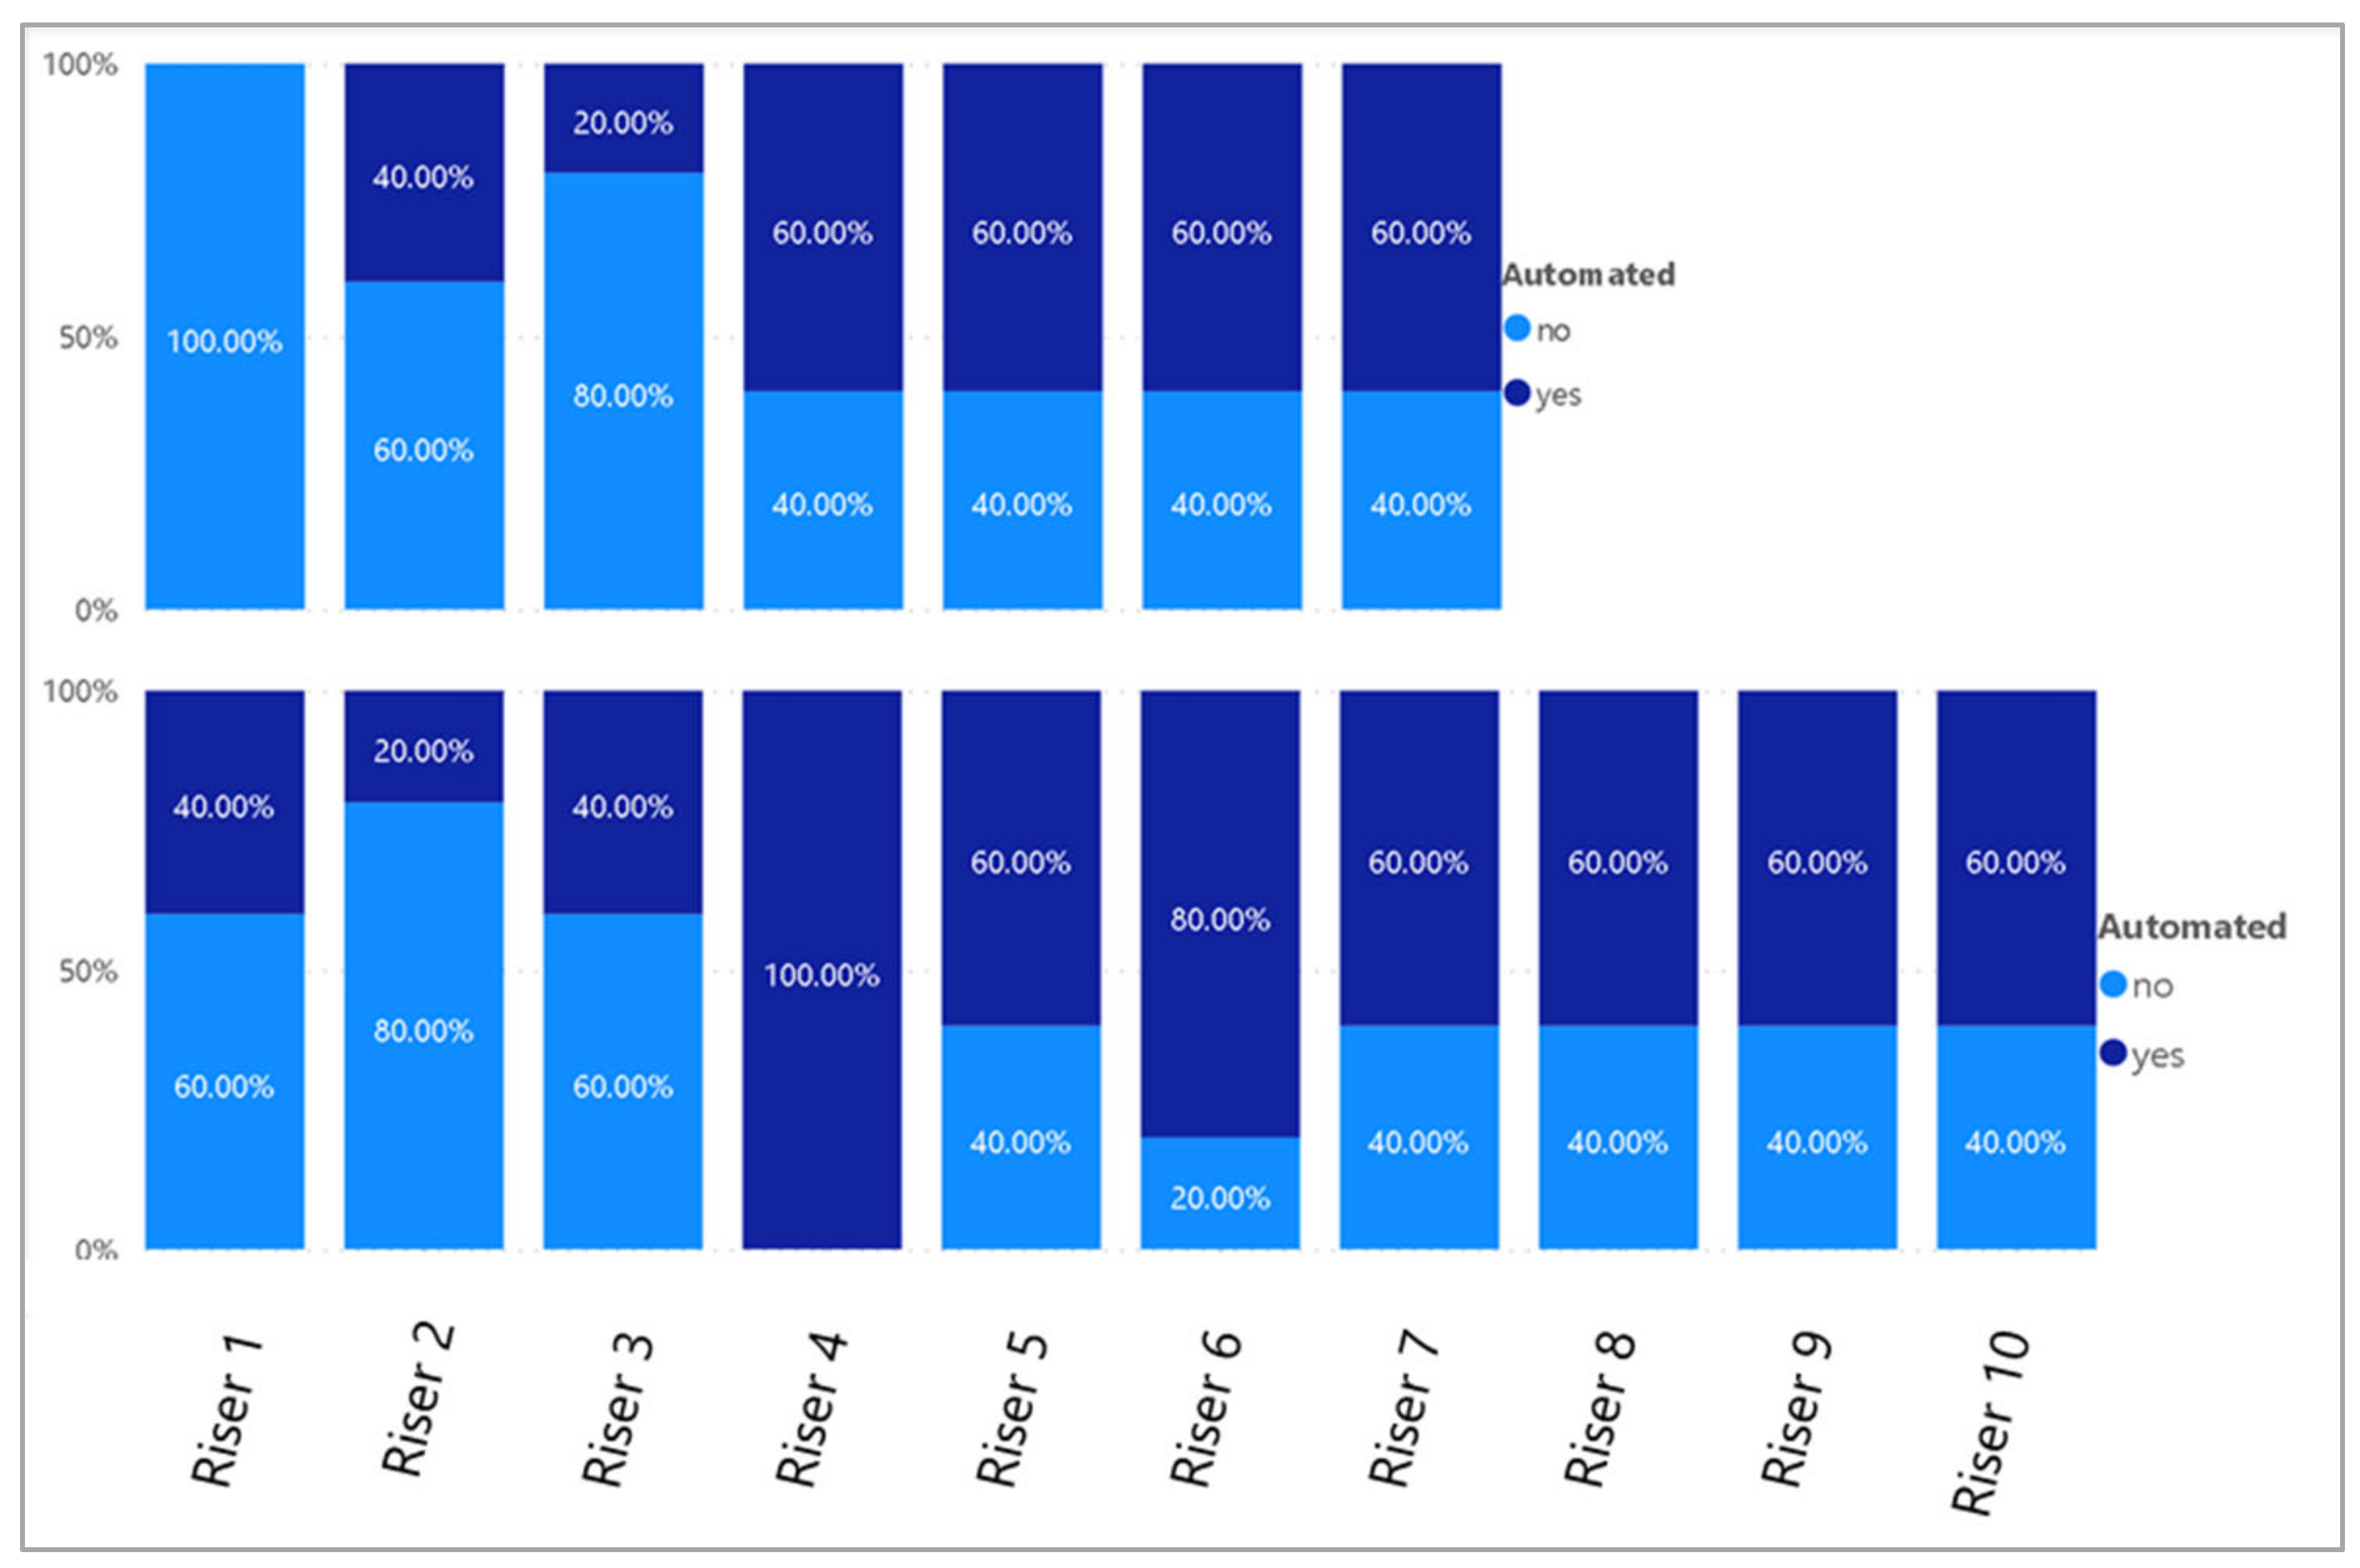
One of the functional requirements of the MR application was to automate the dimensioning of staircase features. Figure 13, Figure 14 and Figure 15 the frequency of dimensions automatically generated during the tests. Contrary to the results obtained during tests at Osaka University, where automated headroom dimensions predominantly occurred in initial risers, the HFT L13 staircase demonstrated a different pattern. Automated dimensions were more frequently generated for risers located further from the initialization point, especially from riser 3 onwards. In the HFT1 B1 staircase context, the application could not generate automated headroom dimensions most of the time, which had to be supplemented with manual MR point-to-point dimensions. The results from these experiments also mirrored the Osaka University results for automatically generated riser heights. They occurred more frequently at further distances from the initialization point, starting from riser 4. Staircase width results also paralleled the patterns observed for riser heights.
4. Discussion
4.1. Variability and Accuracy of Measurements
4.1.1. Riser Heights
The varied means and standard deviations observed in measurements acquired using conventional tools underscore the inconsistency in the reported data. The values suggest inherent variability among users, even though the same tool was used for acquiring data. While the reported variations could be due to genuine variability in the as-built measurements due to construction tolerances, it could also be due to varied techniques individuals adopt when using conventional tools such as tape measures and laser measures, reinforcing the fact that inconsistencies exist due to the heavy reliance on human factors [4]. Given that the MR-computed results for riser heights exhibited standard deviations similar to those of conventional measurements and the application of the scale factor aligned the means more closely with the expected values, the MR application demonstrated potential as a viable alternative to traditional measuring tools, with the added benefit of automatically obtaining dimensions.
According to construction quality standards in Singapore, reinforced concrete structures are generally permitted a tolerance of ±10 mm from its mean level [62]. However, a more stringent regulation stipulates that a tolerance of 5 mm between two consecutive steps is acceptable and that riser heights shall not exceed 175 mm [48]. If the MR application were utilized during an actual regulatory inspection, its observed standard deviation would accommodate the former regulation. However, readings that exceed the 175 mm limit would be flagged as non-compliant. Considering the regulatory requirements in other countries listed in Table 2, where riser height is often stipulated as a maximum, deploying the application specifically for such regulatory checks could pose challenges. Nonetheless, it is worth noting that the building where the experiments took place was constructed in 2002 [63], while the regulatory document stipulating the riser height requirements was only issued on 1 January 2004 [48]. This could explain the numerous measurements that exceeded the 175 mm maximum requirement, even when using conventional measurement tools.
4.1.2. Headroom
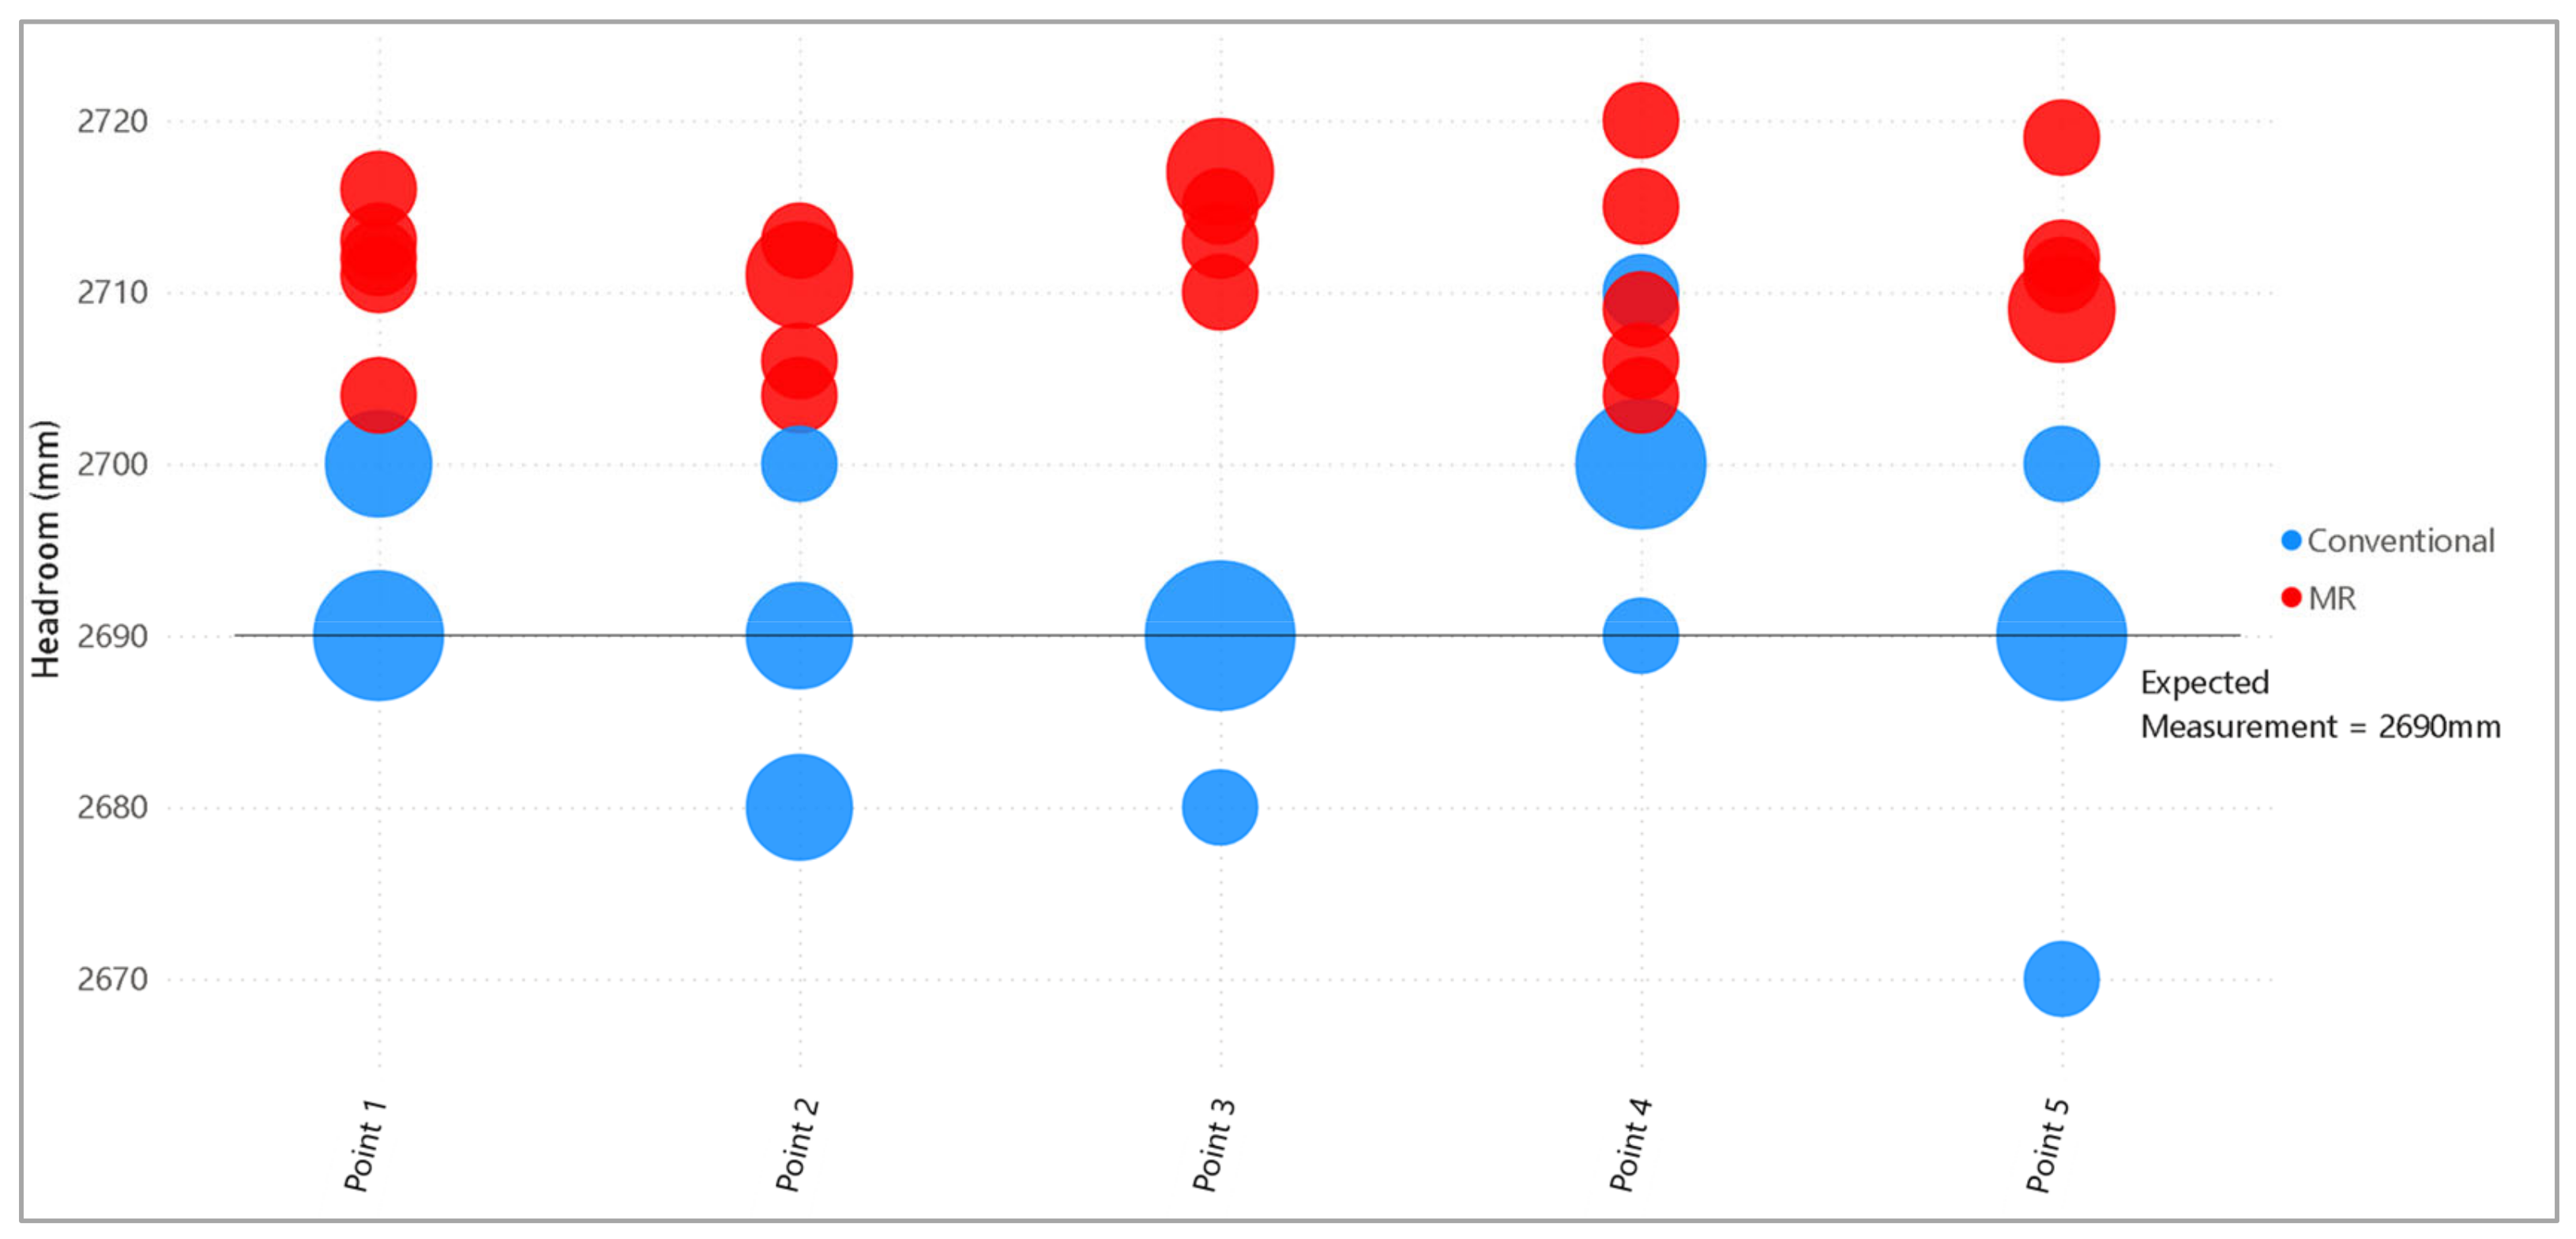
Headroom measurements for the HFT1 L13 staircase demonstrated significant errors in magnitude, with up to 2% error margin for conventional methods and 5% for the MR application. The challenges of acquiring strictly vertical measurements on a sloping surface might account for the substantial errors seen in conventional measurements, as a slight tilt will lead to significant differences in the reported measurements. For the MR application, the headroom measurements at the HFT1 L13 Staircase approached the device’s reported depth sensor range of 3.5 m to 4 m [17,50]. Since the MR application relies on generated meshes and a coordinate system to compute dimensions, it can remove the human variable where measurements taken are not perfectly vertical. However, MR-computed measurements in this case deviated significantly from the mean and exhibited a significant standard deviation. This suggested potential challenges in accurately generating meshes when measuring headroom at specific ranges.
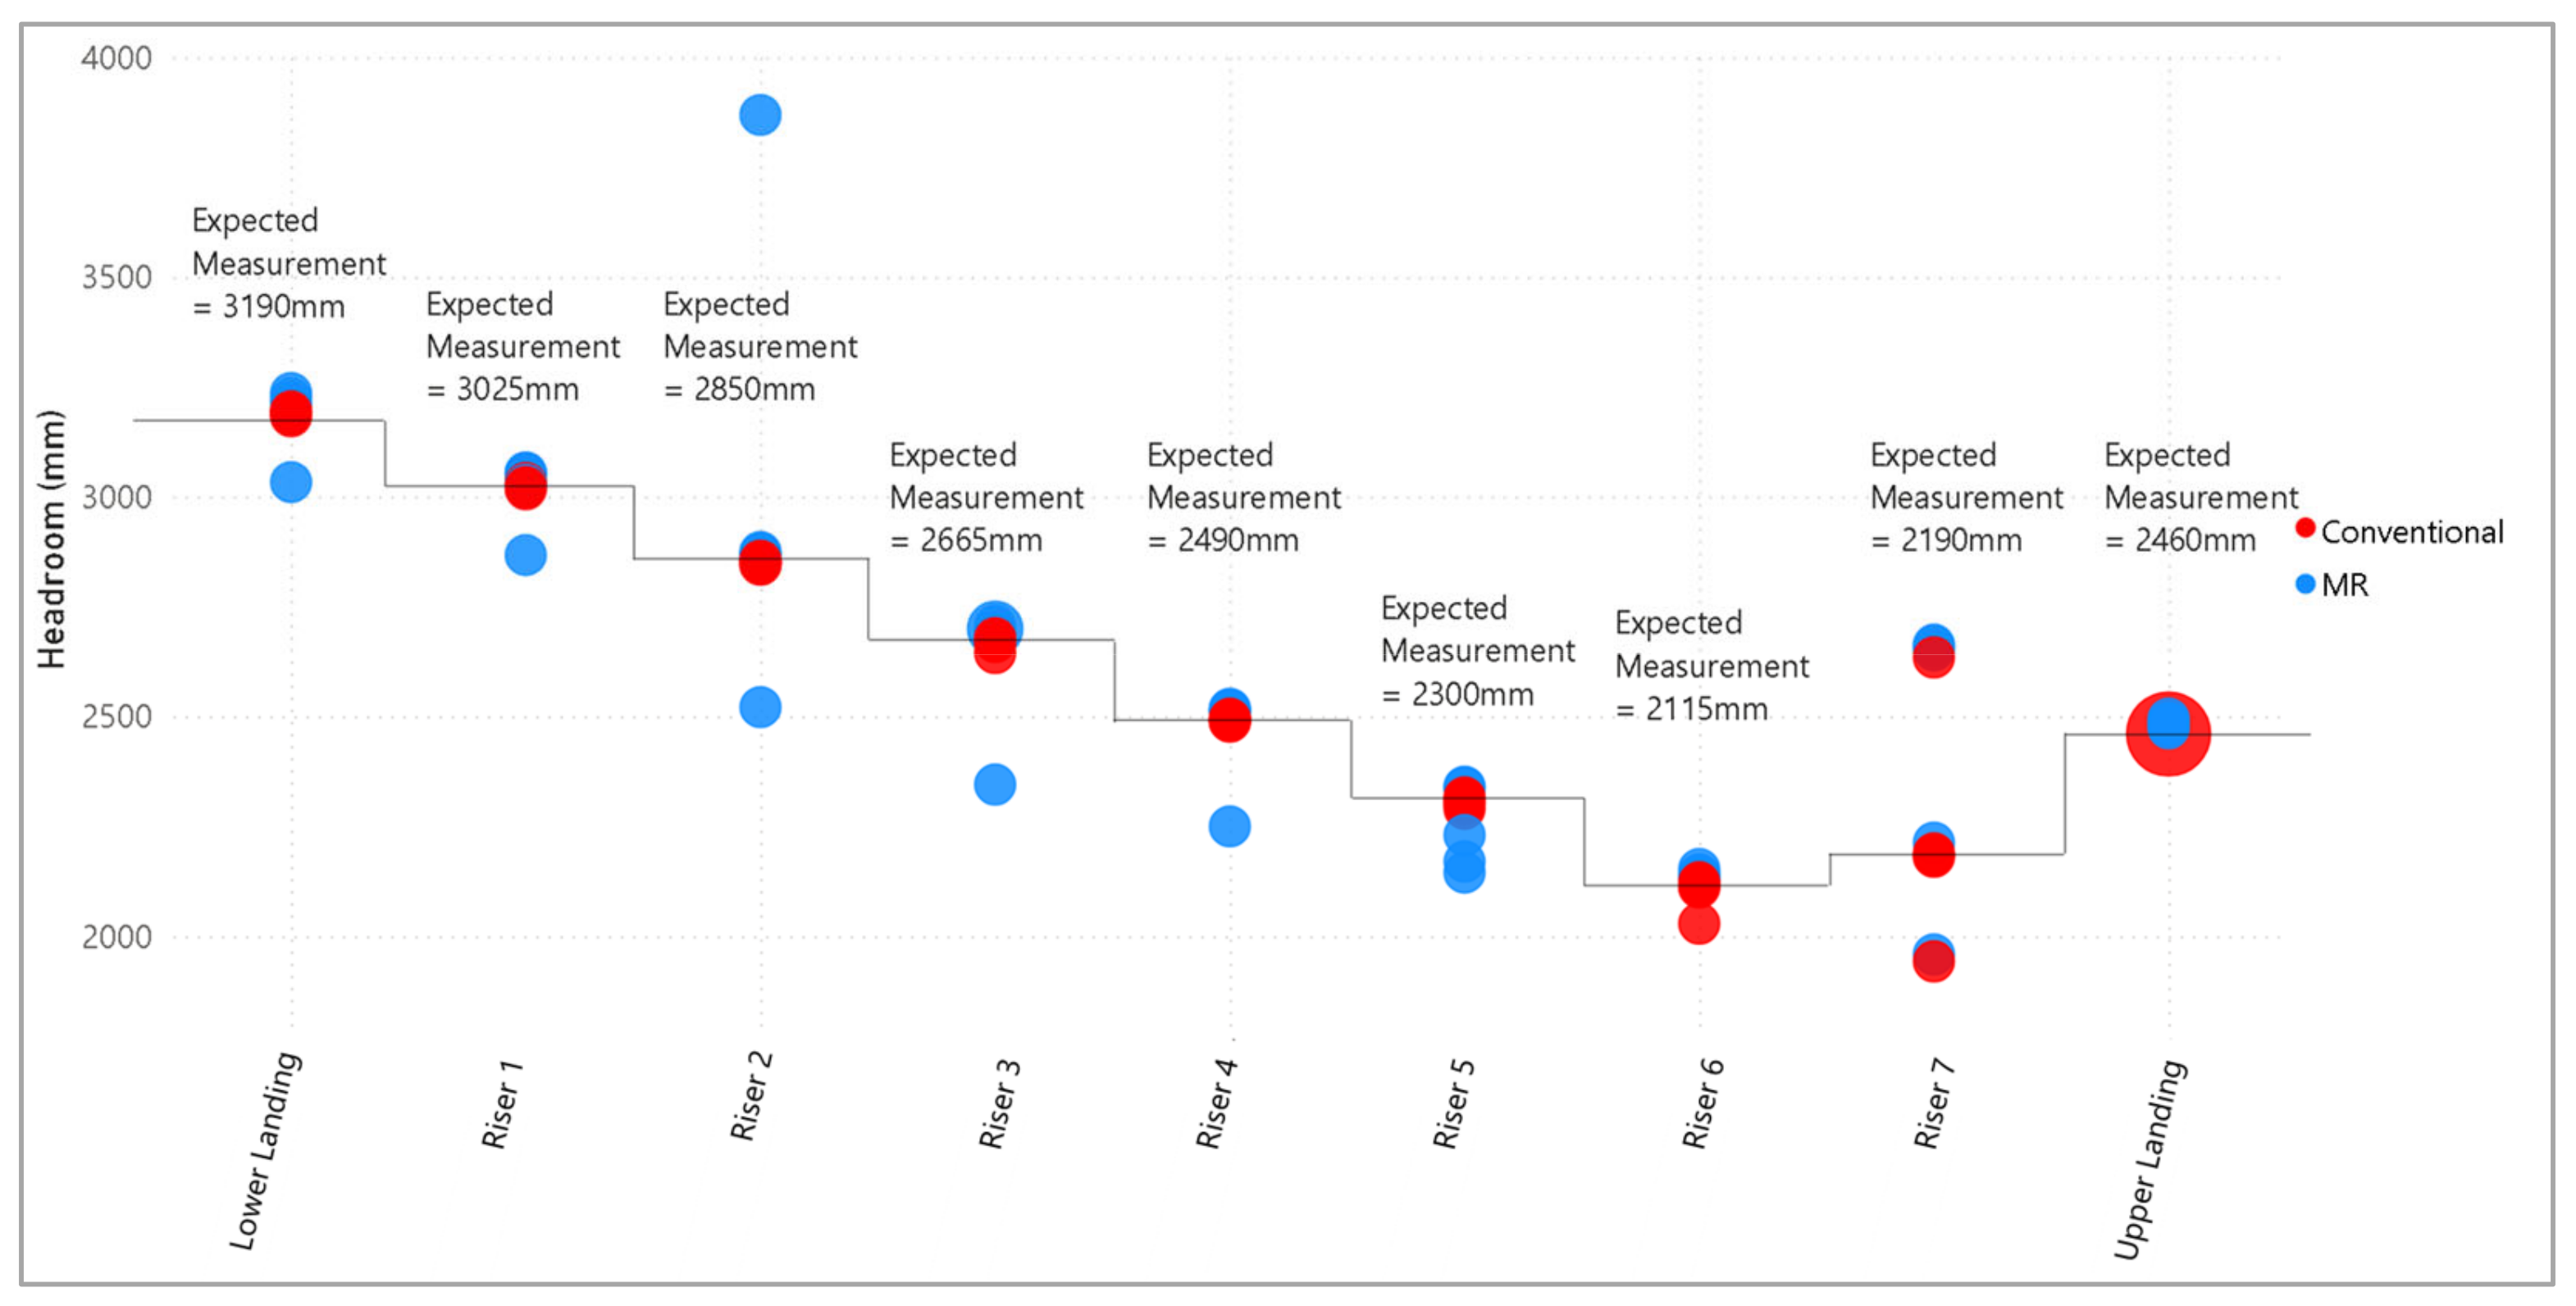
Although measurements on sloping surfaces present challenges, headroom measurements on flat surfaces are promising, with error margins of up to 1.5% and an absolute error of 52 mm. When the scale factor was applied to the MR-computed measurements for the corridor headroom whose heights were within the device’s sensor range, the results closely matched the expected measurement. Additionally, standard deviations for the corridor height measurements are low and remain promising.
Although previously reported scale factors of the HoloLens mesh ranged from 0.9879 to 0.9887 [50,55], which generally reduced error margins, the observed scale factors for riser height and headroom measurements were not consistently within this range. They vary between 0.9699 and 1.0016. Notably, more significant scale factors were observed for headroom measurements near the device’s sensor range limit.
Given that many headroom regulations stipulate a minimum height of 2 m, as indicated in Table 2, all results from the tested scenarios would remain compliant, even -when factoring in the mean errors. In summary, MR for headroom-type measurements remains promising for areas involving flat surfaces within the sensor’s range of 3.5 m with scale factors applied.
4.1.3. Staircase Width
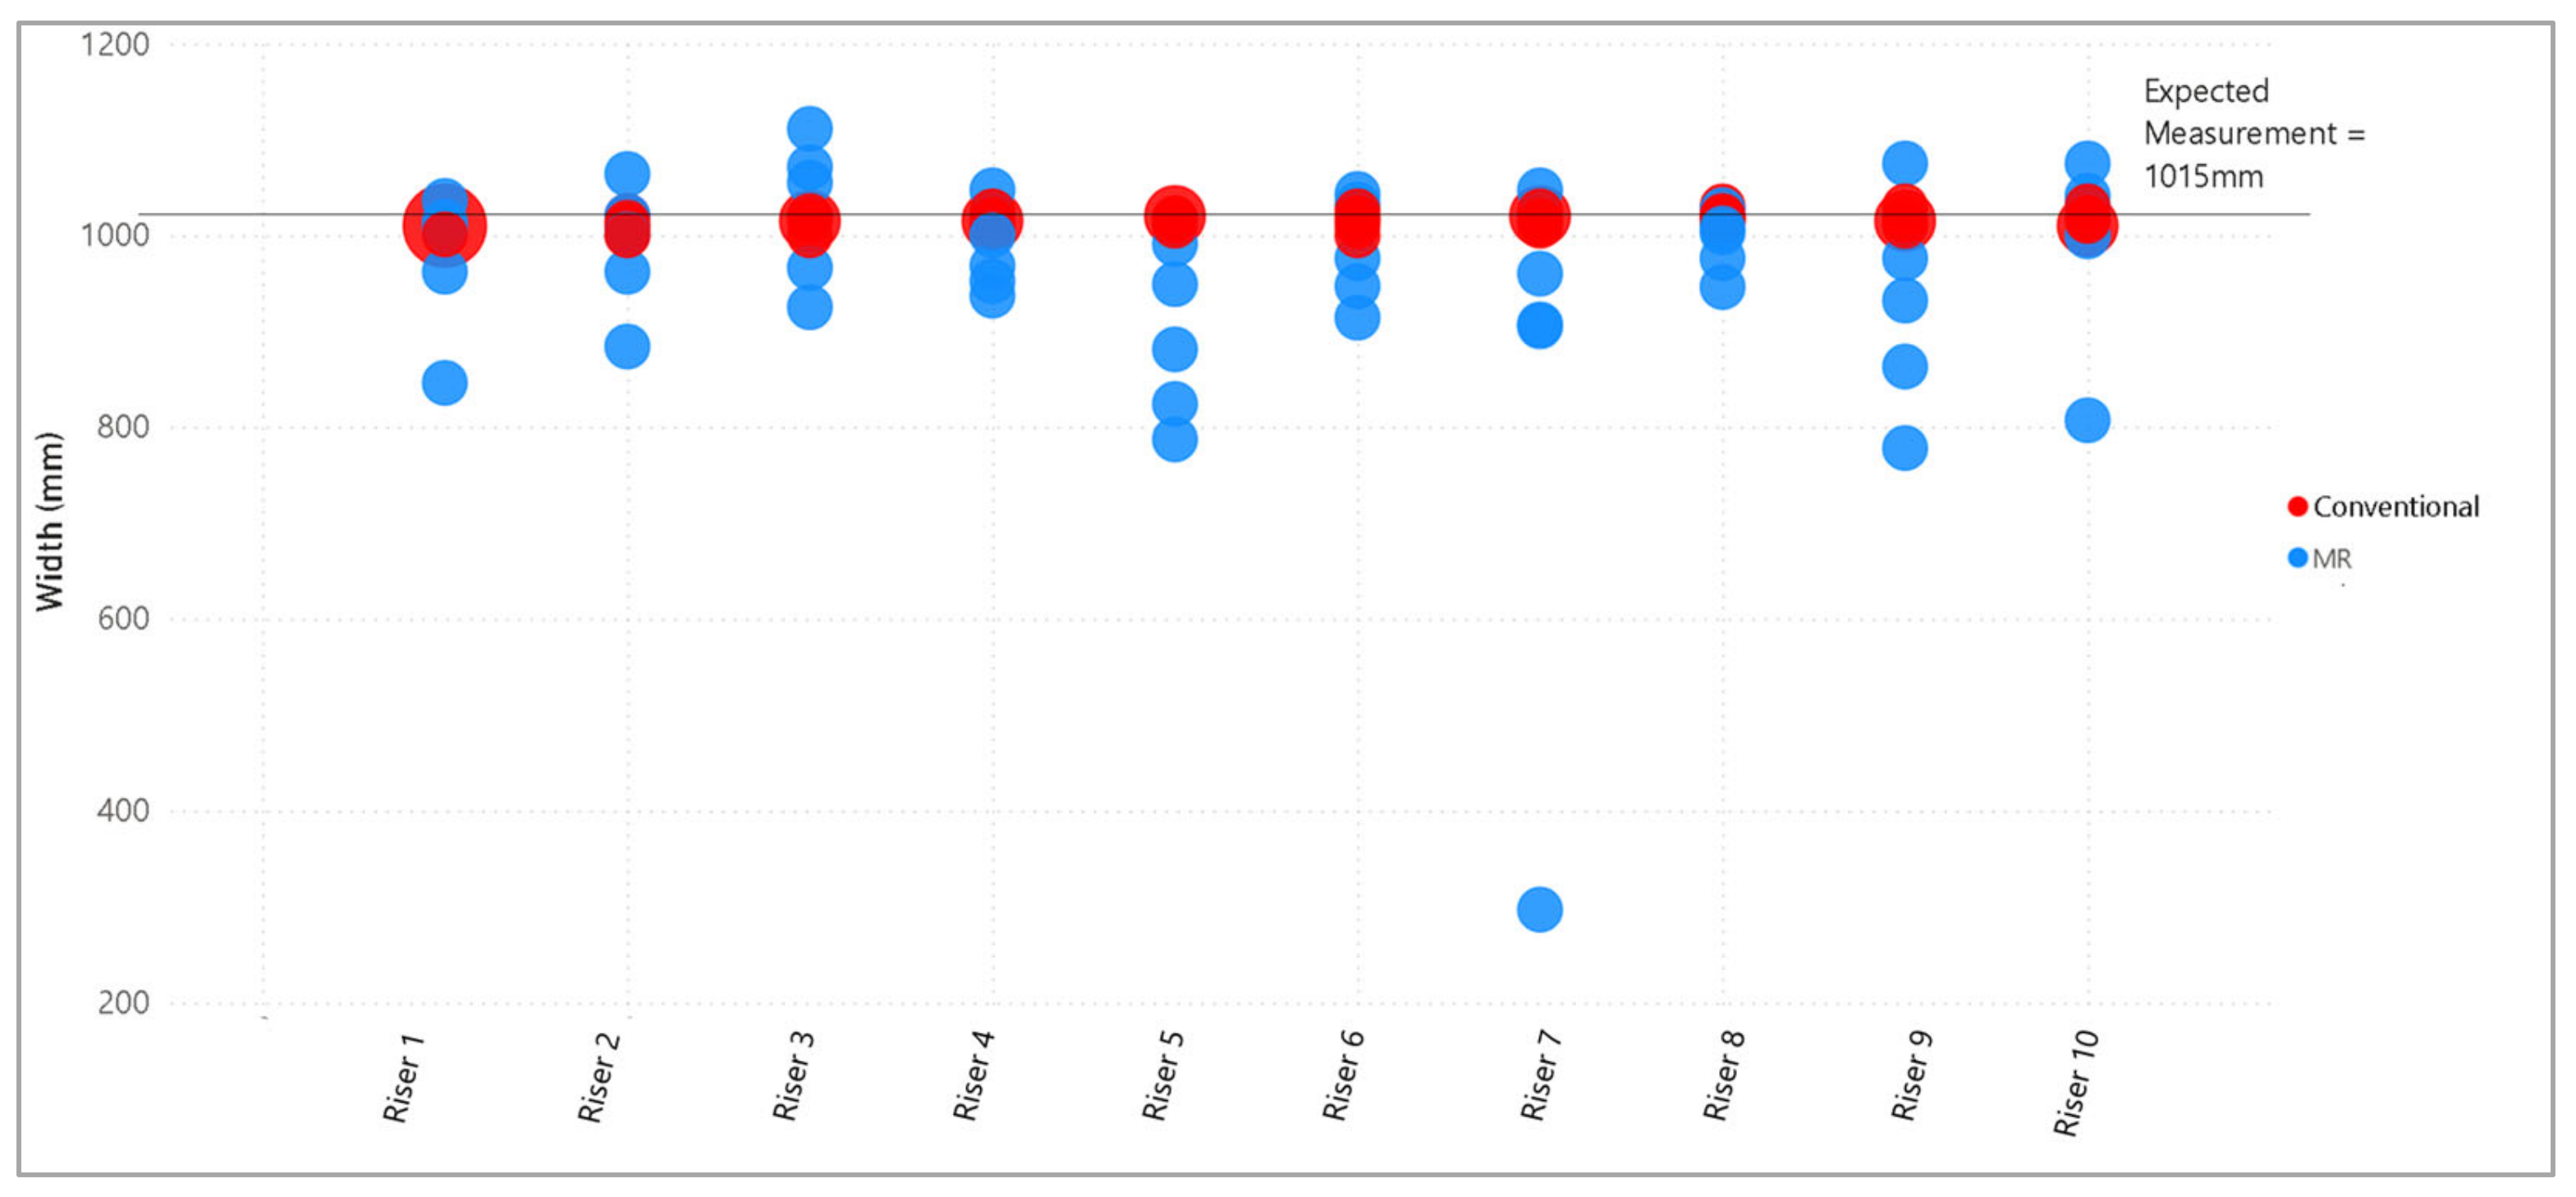
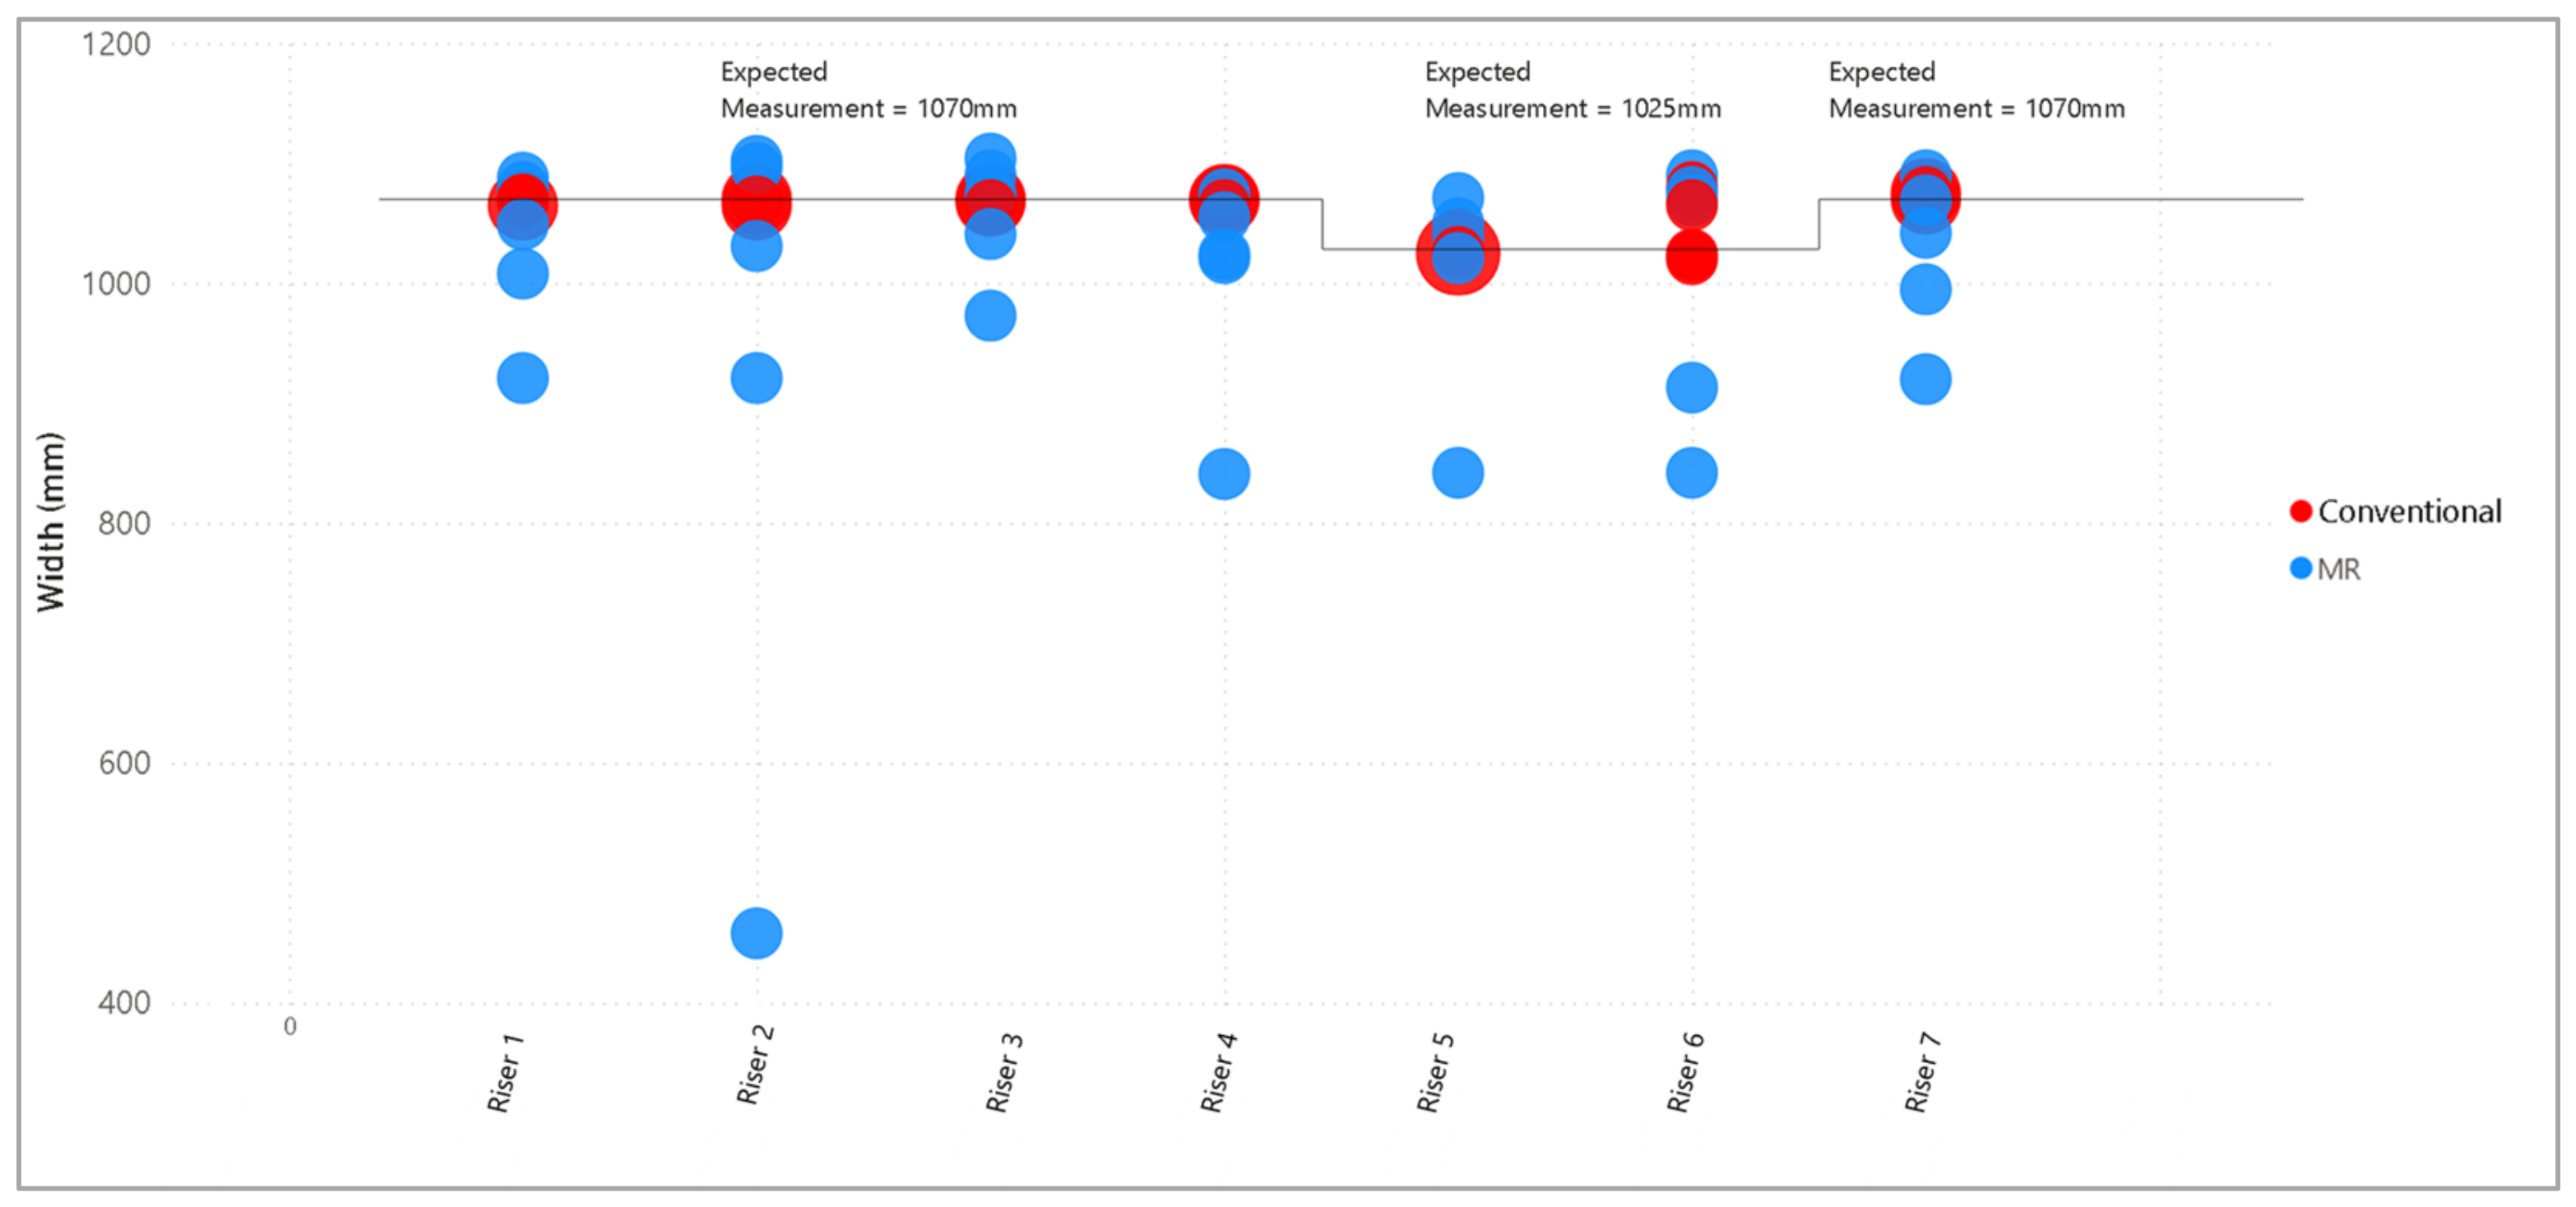
The application determines staircase width using the boundaries of generated quads as described in Section 3.1. While actual regulations have different definitions of staircase width depending on the handrails, railings, or any protrusions into the space of the stairway [48,61], as a proof of concept of obtaining dimensions, we define stair width as the lengthwise distance of each tread.
MR-computed staircase widths have the highest errors and variances among all measured features. This can be largely attributed to poor mesh generation since the width computation relies on the mesh’s boundaries. The expected mesh generation result is shown in contrast to the actual MR results in Figure 16. Several gaps are observed in all tests, resulting in a constant underestimation of the actual staircase width. Hence, results for staircase width are not useful at this stage. Alternative methods of computing staircase width might be required. A detailed discussion on mesh generation is further discussed in Section 4.2.
4.2. Feasibility of Automating Measurements Using Meshes
This study presented a method of utilizing meshes that were automatically labeled by the scene understanding SDK and computing staircase feature measurements using coordinates of meshes. This section discusses issues observed with mesh generation and labeling during the tests.
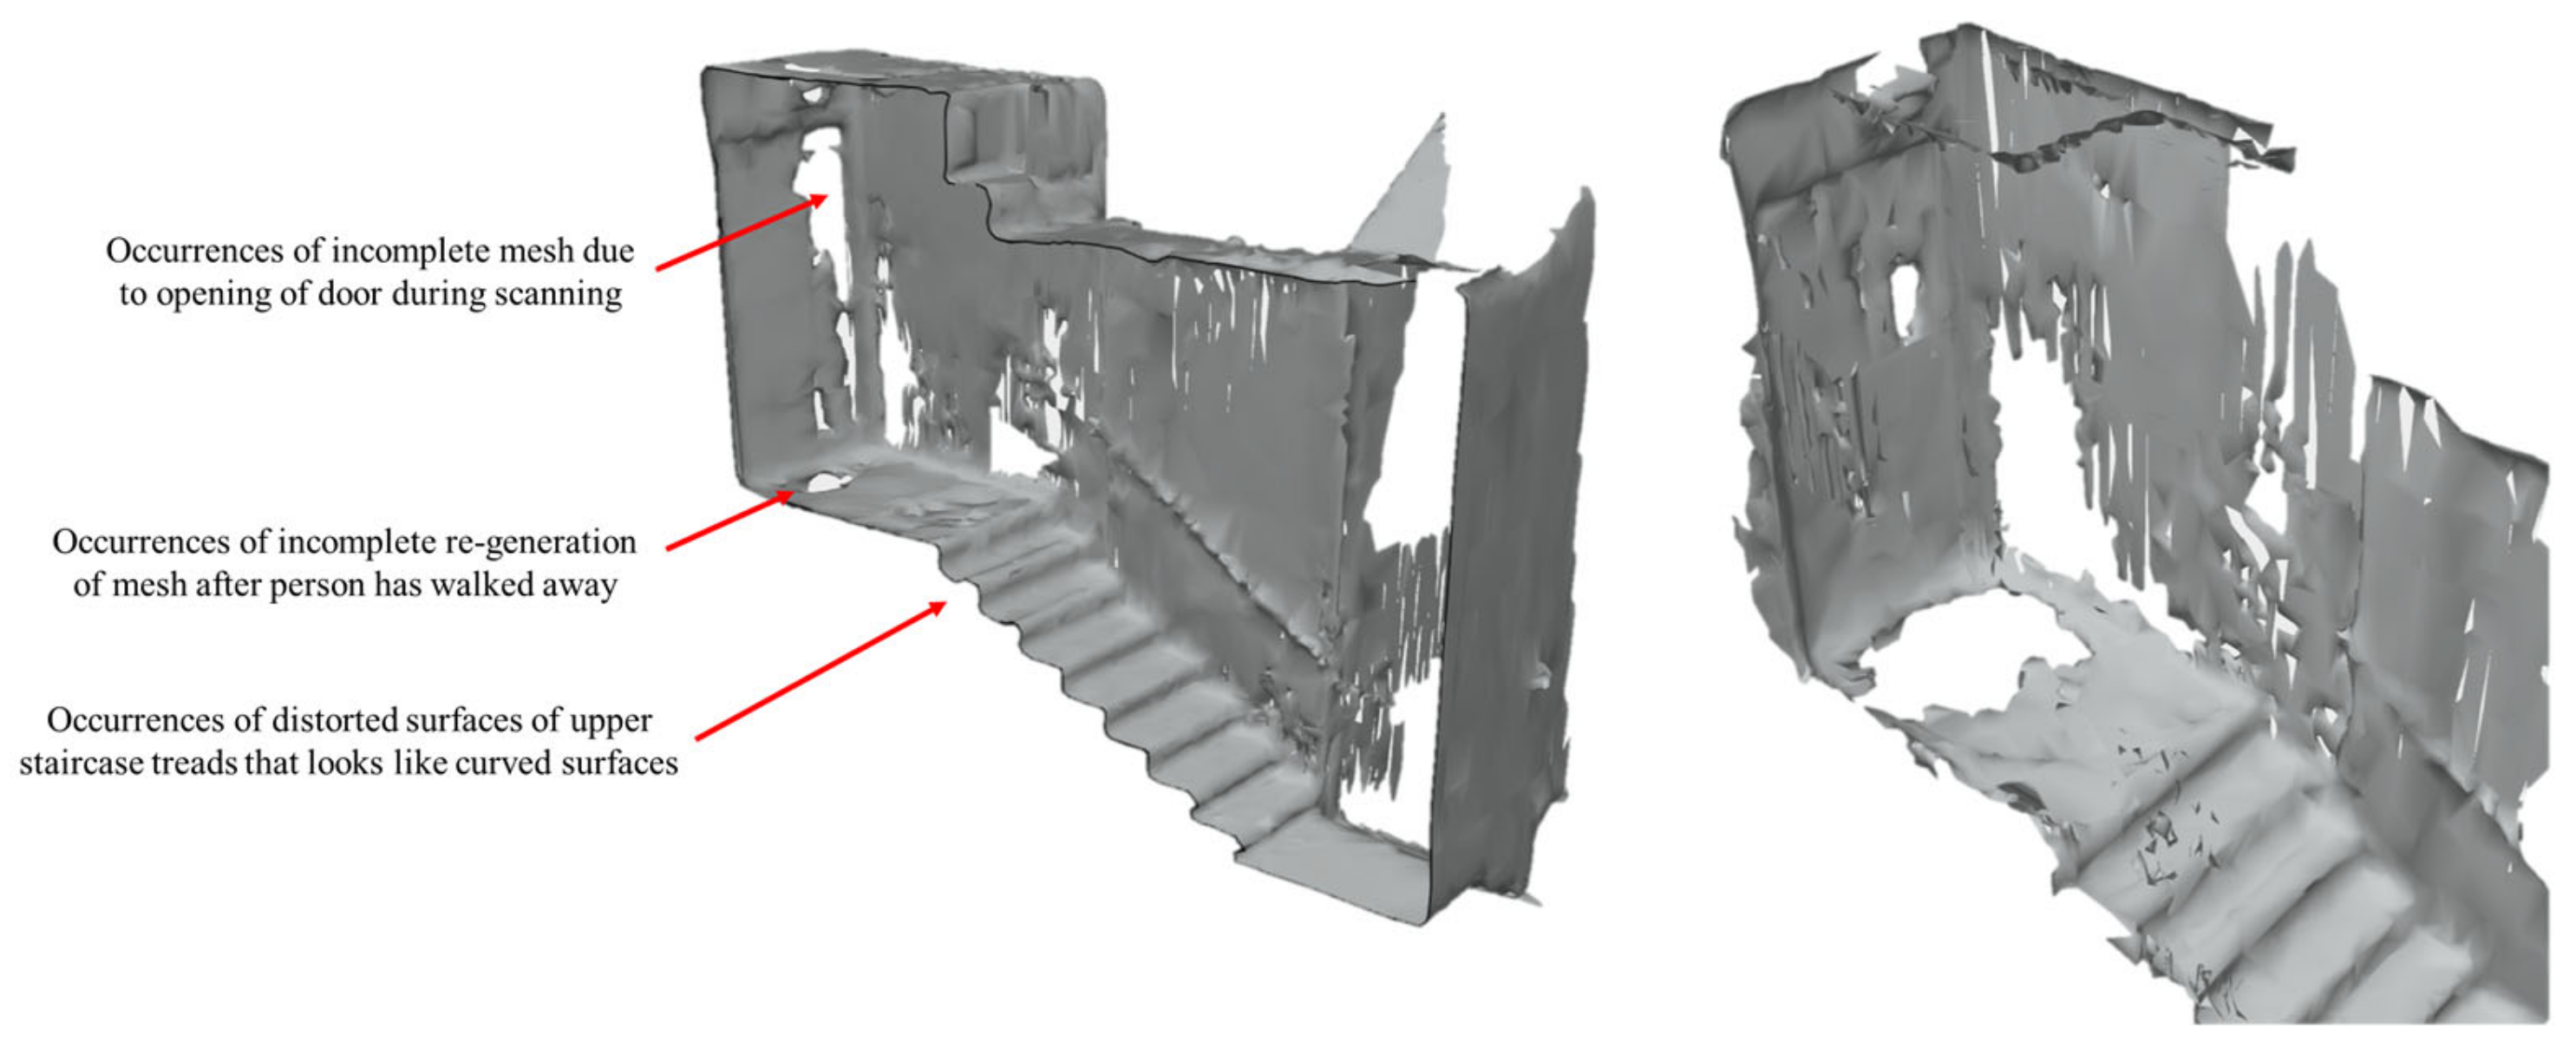
The HoloLens spatial map obtained for a cathedral suffered from hallucinations, wormholes, and bias [17]. The same was observed for meshes exported from the HoloLens while scanning the environment to obtain MR measurements. The scenarios that resulted in a distorted spatial map were as follows:
- Changes in the environment during scanning are caused by people walking past and opening and closing of doors into the scanned space, as shown in Figure 17. The HoloLens 2 required substantial time to regenerate the space after such changes. Further studies would be required to determine the distinct amount of time required for the mesh to regenerate to reflect the original space;
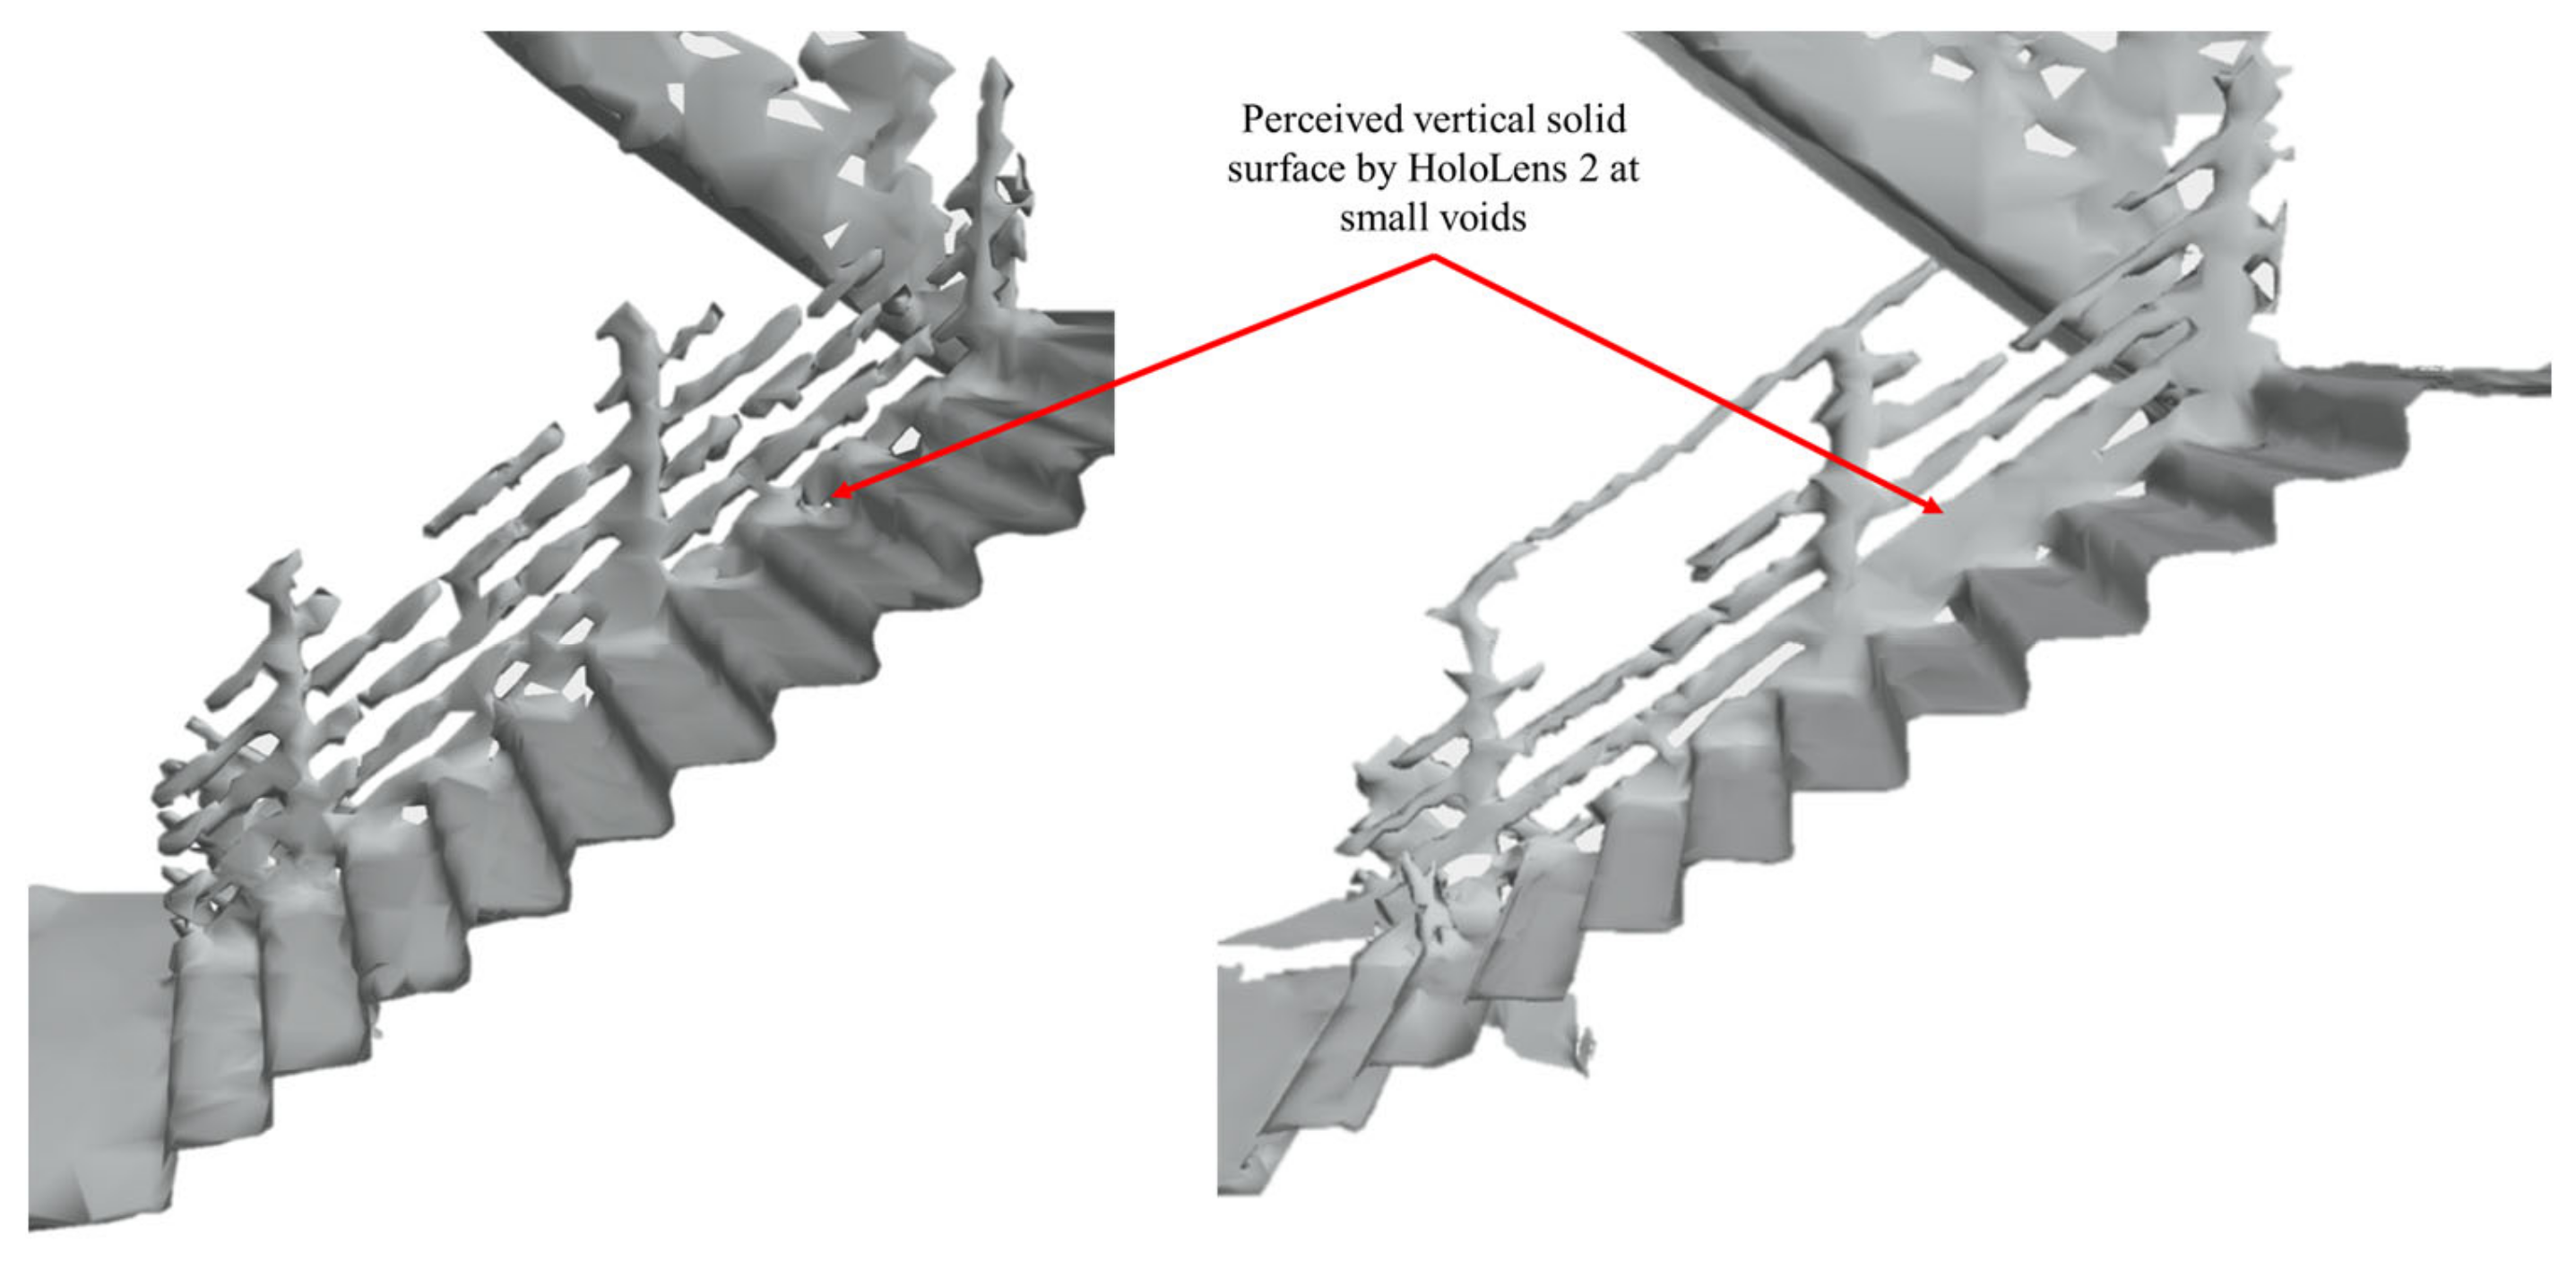
- Gaps that were too small to be identified by the spatial map and were perceived as a surface by the HoloLens 2. This was evident at the left edge of the HFT1 L13 stairs, where there was a small void between the lowest horizontal rail and the staircase tread, as shown in Figure 18.
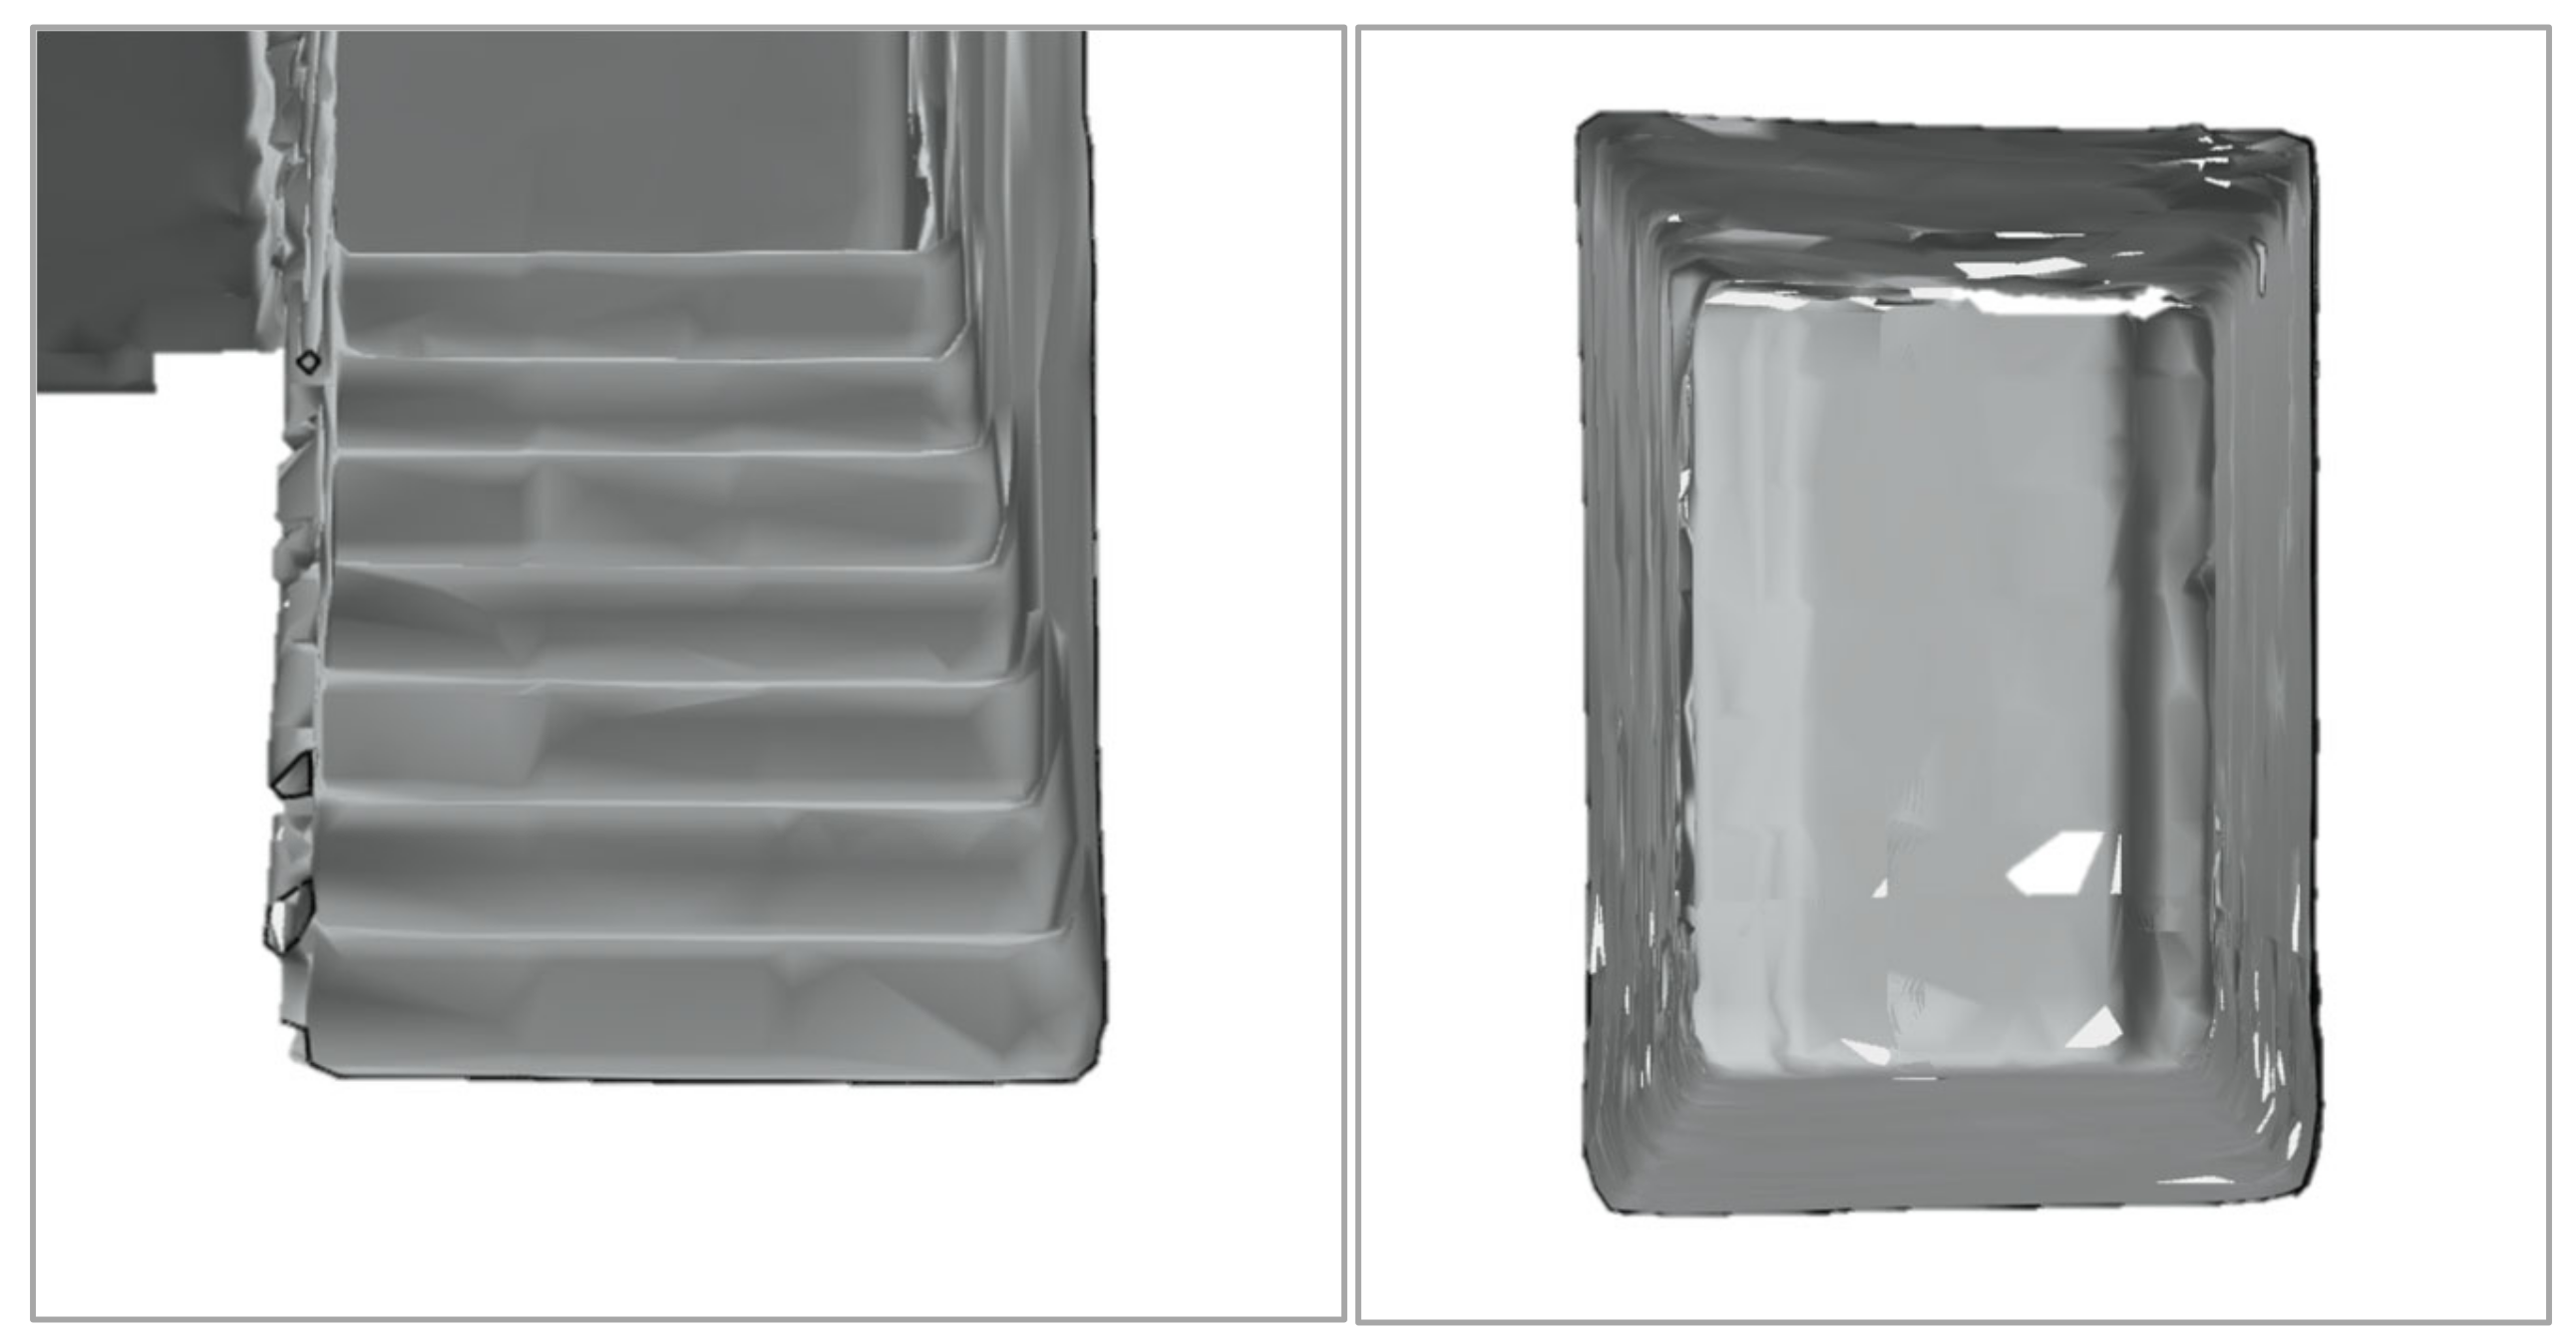
Figure 19 illustrates a sectional mesh of the staircase and corridor. Instead, the expected 90-degree edges are depicted as rounded edges in the HoloLens spatial map. The inaccuracies in the MR-derived staircase widths, which were typically shorter than expected, can be attributed to the scene understanding SDK’s interpretation of surface edge location. The SDK perceives the edge of the horizontal at the onset of the curve rather than where the next vertical surface intersects the horizontal one. Consequently, while the automatically computed riser heights and headroom measurements show promising results, the methodology for determining staircase width appears unfeasible without an alternative to the SDK. Weinmann et al. [64] proposed a technique that utilizes raw sensor data from the HoloLens for semantic segmentation and feature extraction. This approach might warrant further exploration in the context of this application.
4.3. Limitations
4.3.1. Experiment Limitations
One of the limitations of this study concerns the small sample size of five industry practitioners who participated in the experiments. However, it is essential to note that each volunteer used the MR application to obtain measurements at four locations, resulting in 20 unique measurement scenarios. Although the limited number of volunteers limits the generalizability of the findings, the various measurement scenarios provided sufficient data to gather initial insights into the prototype application’s performance and limitations. Since each location’s environmental condition was unique, it provided insights into how the spatial map varied between users and location, suggesting that further studies should be conducted to quantify suitable or ideal environmental conditions to minimize mesh errors. This is further discussed in Section 4.3.2.
Notably, the experiment and MR system design mimicked a conventional measurement approach where users take readings based on single point-to-point measurements. However, due to construction tolerances, every individual point along building features may differ slightly. As such, the inherent variability of building features could not be statistically addressed, even though the methodology reflects real-world practices. This underscores the need for further research on perceptions of acceptable accuracy.
Additionally, while intuitive design was considered during application design to mimic conventional measurement methodology, this study focused primarily on the technical feasibility and accuracy of automated dimension acquisition and checks. Although a comprehensive evaluation of the application’s user friendliness and intuitiveness was outside the scope of this study, it is worth noting that each volunteer could use the MR application effectively after a simple tutorial, indicating its intuitive design. Future work would include further exploration into these aspects on top of technical functionalities.
4.3.2. Technical Limitations
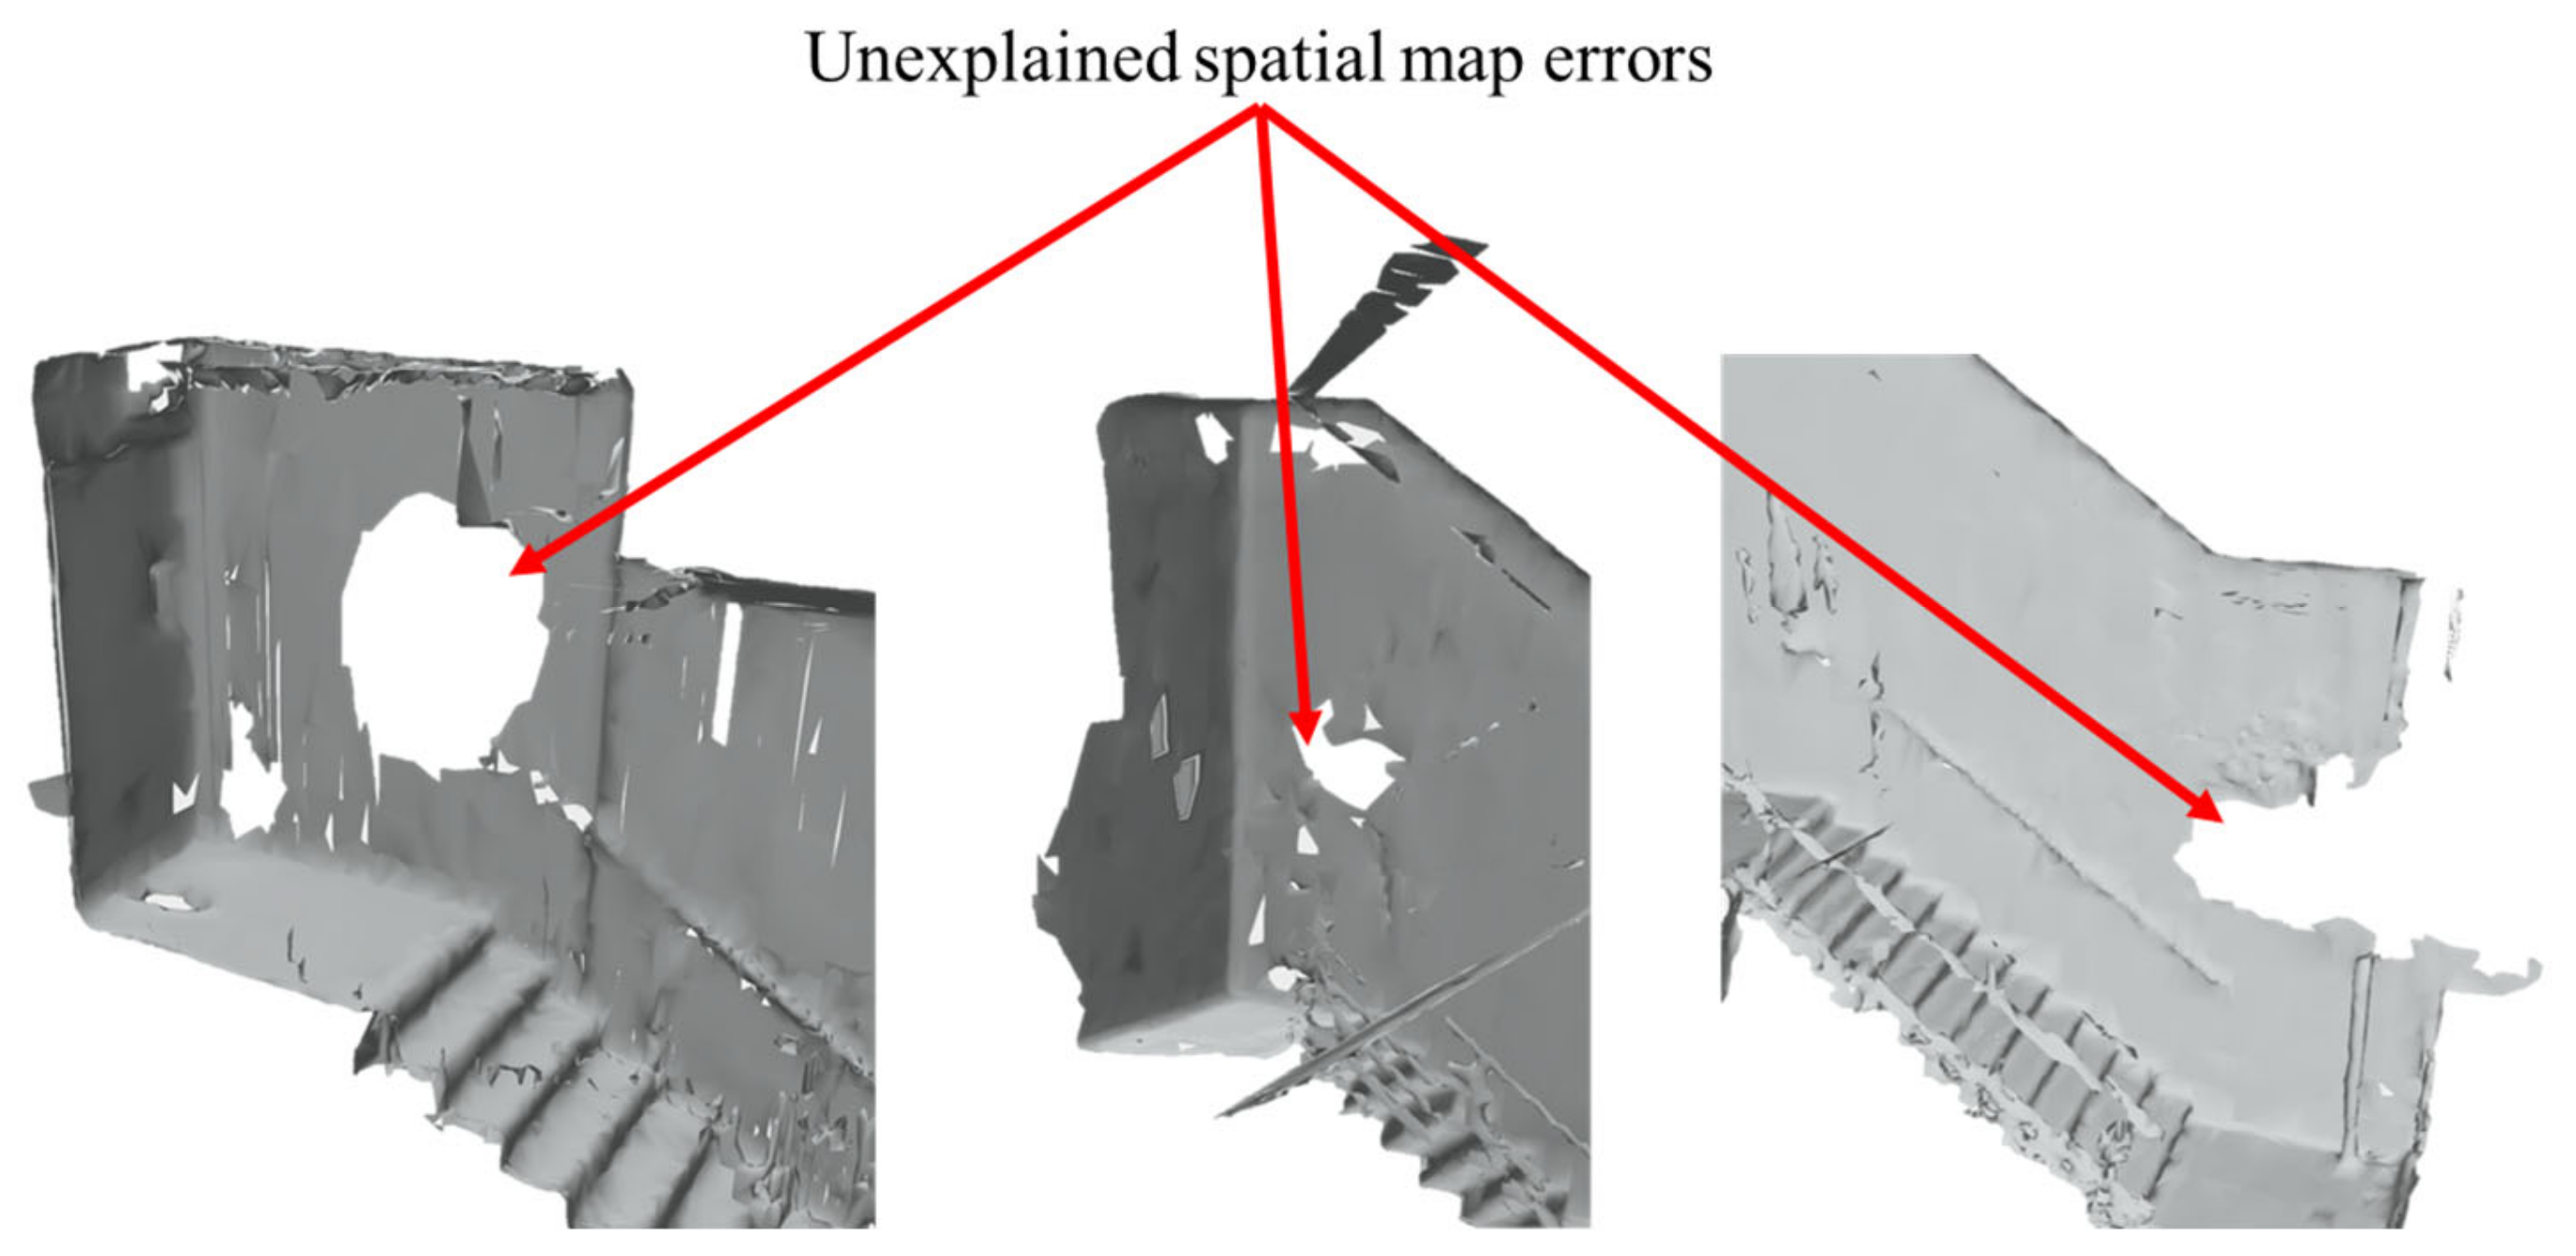
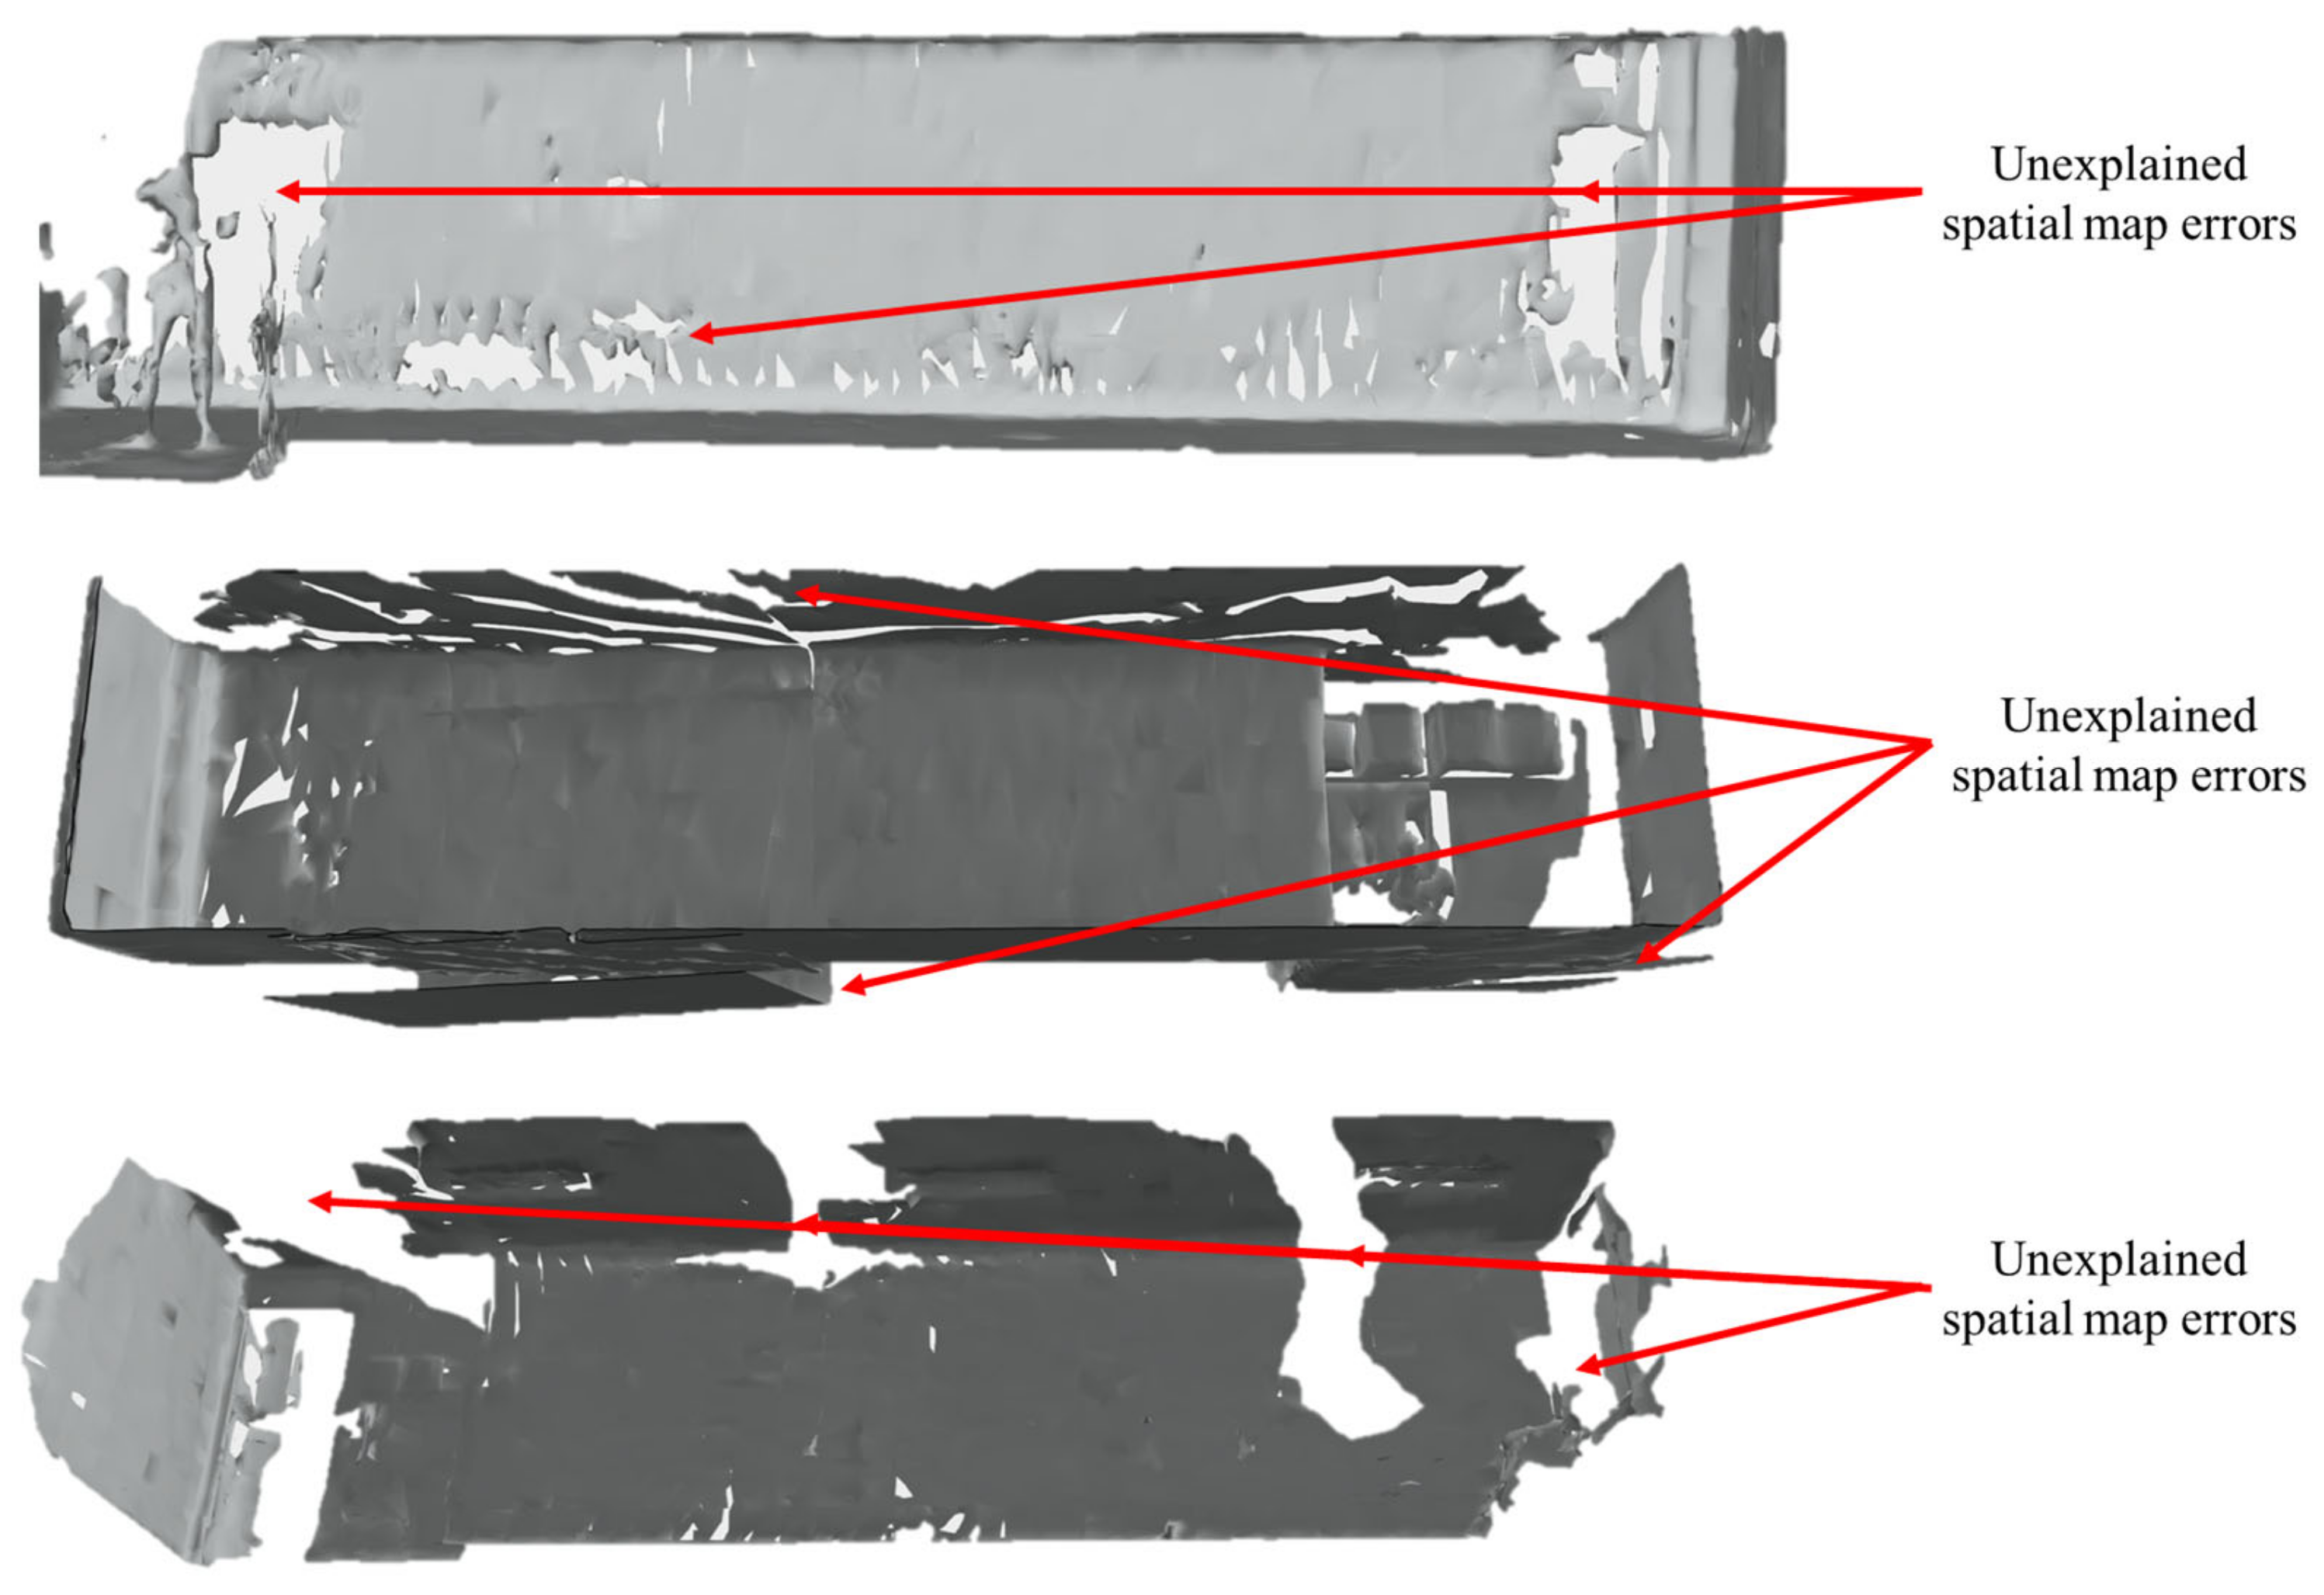
Unexplained holes and distortion in some spatial maps were observed, as shown in Figure 20 and Figure 21. A significant factor that could be at the root of these distortions is the type of lighting present in the testing locations. A known technical challenge arises when using the HoloLens in environments illuminated with 50 Hz fluorescent lighting—a standard electrical frequency in Europe [65]. Given that the HoloLens captures frames at a rate of 60 Hz, this discrepancy can result in frames being captured during non-pulse periods, which might be contributing to the poorly generated meshes observed in our tests conducted under artificial light conditions in Singapore, where the electrical frequency is similarly set at 50 Hz [66]. However, conditions to quantify when lighting might cause an issue need further study as such occurrences seem random in the tests.
The experiments at Osaka University were subjected to a semi-bright sunlight environment, as documented in Figure 1, a factor that might also account for the gaps witnessed in the generated mesh. This implies that varying light conditions, whether artificial light or sunlight, could impact the quality of the spatial map generated using the HoloLens.
In addition to environmental factors, another technical limitation pertains to the application’s data export and storage functionalities. While documentation of experiment results using screen recordings and exported .txt checklist results currently provide visual records of the feasibility of the MR application, this presents a limitation in real-world use cases where inspection records have to be appropriately documented. Although the current checklist export feature offers a concise overview that can be beneficial for quick assessments, future iterations of the application could include the option to export detailed dimensions of each staircase feature to enhance its utility. This additional functionality would facilitate more in-depth analysis and prove valuable for verifying as-built models or drawings, expanding the application’s versatility and applicability in various construction and inspection scenarios. Therefore, apart from investigating the effects of environmental factors on spatial maps, future enhancements will address these data management challenges.
4.3.3. Hardware Limitations
Lastly, it was observed that the HoloLens consistently revealed a battery life close to the 2-h mark as opposed to the reported battery life of 2 to 3 h. This could be due to the extensive computational demands of processing the meshes to automate dimensions. Moreover, during the experiments conducted in mechanically ventilated spaces, the HoloLens experienced overheating after approximately 1.5 h of continuous use. Given that each test session, encompassing scanning, automated and manual measurements, and data recording, lasted about 30 min, this finding raises concerns about the device’s applicability in real-world scenarios, especially construction sites that may lack proper ventilation. Overheating shortens the effective working time and necessitates a cooling-down period before the device can be recharged, further impacting its efficiency in a practical setting. Without modifying off-the-shelf device hardware, utilizing cloud processing could alleviate the overheating issues associated with on-device processing at sites with internet connectivity, meriting further investigation into such alternatives.
In contrast, a combination of a tablet and HMD could be employed at sites with limited connectivity, harnessing the tablet’s computational power for processing while using the HMD for data collection and visualization, an approach previously investigated [41]. While this approach may address the overheating issue, its application solely for automating dimensional checks could be overly complex. However, it could also serve as a potential data management solution. Further research is needed to thoroughly evaluate the utility and advantages of this solution in practical scenarios.
5. Conclusions
This study presented a proof of concept for an MR-based dimensional inspection system, which compares labeled dimensions against pre-set regulations to identify non-compliances. The MR-obtained measurements were evaluated against measurements obtained using conventional construction tools, revealing potential for practical application and limitations that warrant further research.
The application demonstrated the feasibility and accuracy of obtaining measurements for plane-to-plane features, such as riser heights and corridor ceiling heights, that fall within the device’s sensor range of 3.5 m to 4 m. The observed mean absolute error ranges between 0.4% and 1.7% in these scenarios. However, for the measurements along the sloping soffit of the staircase that was close to the sensor’s range of 3.5 m, errors up to 4.3% were observed. While plane-to-plane measurement proved successful, it failed to accurately determine horizontal measurements that required edge-to-edge measurements, such as staircase widths. This is due to the limitations of the HoloLens in generating the spatial map, which tends to form curves at edges, complicating efforts to identify precise edges essential to determining the start and end point of a measurement.
The study also presented a method to conduct automated dimensional checks by leveraging the Microsoft scene understanding SDK’s capabilities to perform semantic segmentation of the spatial map. With the segmented meshes, dimensions can be assigned labels for comparison against regulations to automate compliance checks. However, results show that automated dimensions do not occur at a perfect rate, highlighting limitations in the current SDK’s performance. At the point of this research, there are inherent limitations in the scene understanding SDK functionality.
Experiments revealed that environmental factors might impede the generated spatial map’s quality, as Section 4.2 and Section 4.3 outlined. Thus, further investigation is necessary to quantify conditions that impede consistent application. The study also uncovered a scale factor in the spatial map generated by the HoloLens 2, consistent with past research [50,55]. However, more considerable variability was noted in meshes closer to the device sensor’s limits. Nonetheless, these findings and the study’s limited sample size suggest that further testing is necessary to establish more apparent patterns to understand the full scope of the technology’s capabilities.
Another challenge during the experiments was the limited battery life and overheating issues due to the extensive onboard computation. A potential solution to mitigate these challenges is shifting the computational load to cloud solutions or a companion tablet. Additionally, cloud connectivity could enhance the application’s functionality by enabling it to cross-reference dimensions with various updated regulatory standards.
In conclusion, although the HoloLens was not designed primarily as a scanning tool, its current spatial mapping capabilities allow it to be used as a measurement tool for plane-to-plane type measurements whose surfaces lie within the device’s sensor range of 3.5 m. However, millimeter accuracy is currently not achievable. Plane-to-plane type of measurements in practical applications include floor-to-ceiling measurements. Due to the nature of the spatial map generated, edge-to-edge type measurements, such as staircase widths, will not give accurate results with the proposed system logic for virtual measurements.
Therefore, future work would involve exploring different ways of processing the spatial map so that edge-to-edge type measurements can be accurately achieved to give a comprehensive virtual measurement application. Further research on quantifying environmental factors that affect spatial map generation, followed by more accurate spatial map segmentation, will also be investigated.
Author Contributions
Conceptualization, M.S.Z.L. and N.Y.; methodology, M.S.Z.L.; validation, M.S.Z.L., N.Y. and T.F.; formal analysis, M.S.Z.L.; investigation, M.S.Z.L.; resources, M.S.Z.L., N.Y. and T.F.; writing—original draft preparation, M.S.Z.L.; writing—review and editing, N.Y. and T.F.; supervision, N.Y. and T.F.; project administration, M.S.Z.L. All authors have read and agreed to the published version of the manuscript.
Funding
This research received no external funding.
Data Availability Statement
Data sharing is not applicable. No new data were created or analyzed in this study. Data sharing is not applicable to this article.
Acknowledgments
The authors would like to thank Denley Ng Jun Xiang for the development of the MR application and the staff of Penta-Ocean Construction Co., Ltd. (Singapore) for participating in the experiments. The HoloLens 2 used in this research was manufactured by Microsoft and was purchased in Tokyo, Japan.
Conflicts of Interest
The authors declare no conflicts of interest.
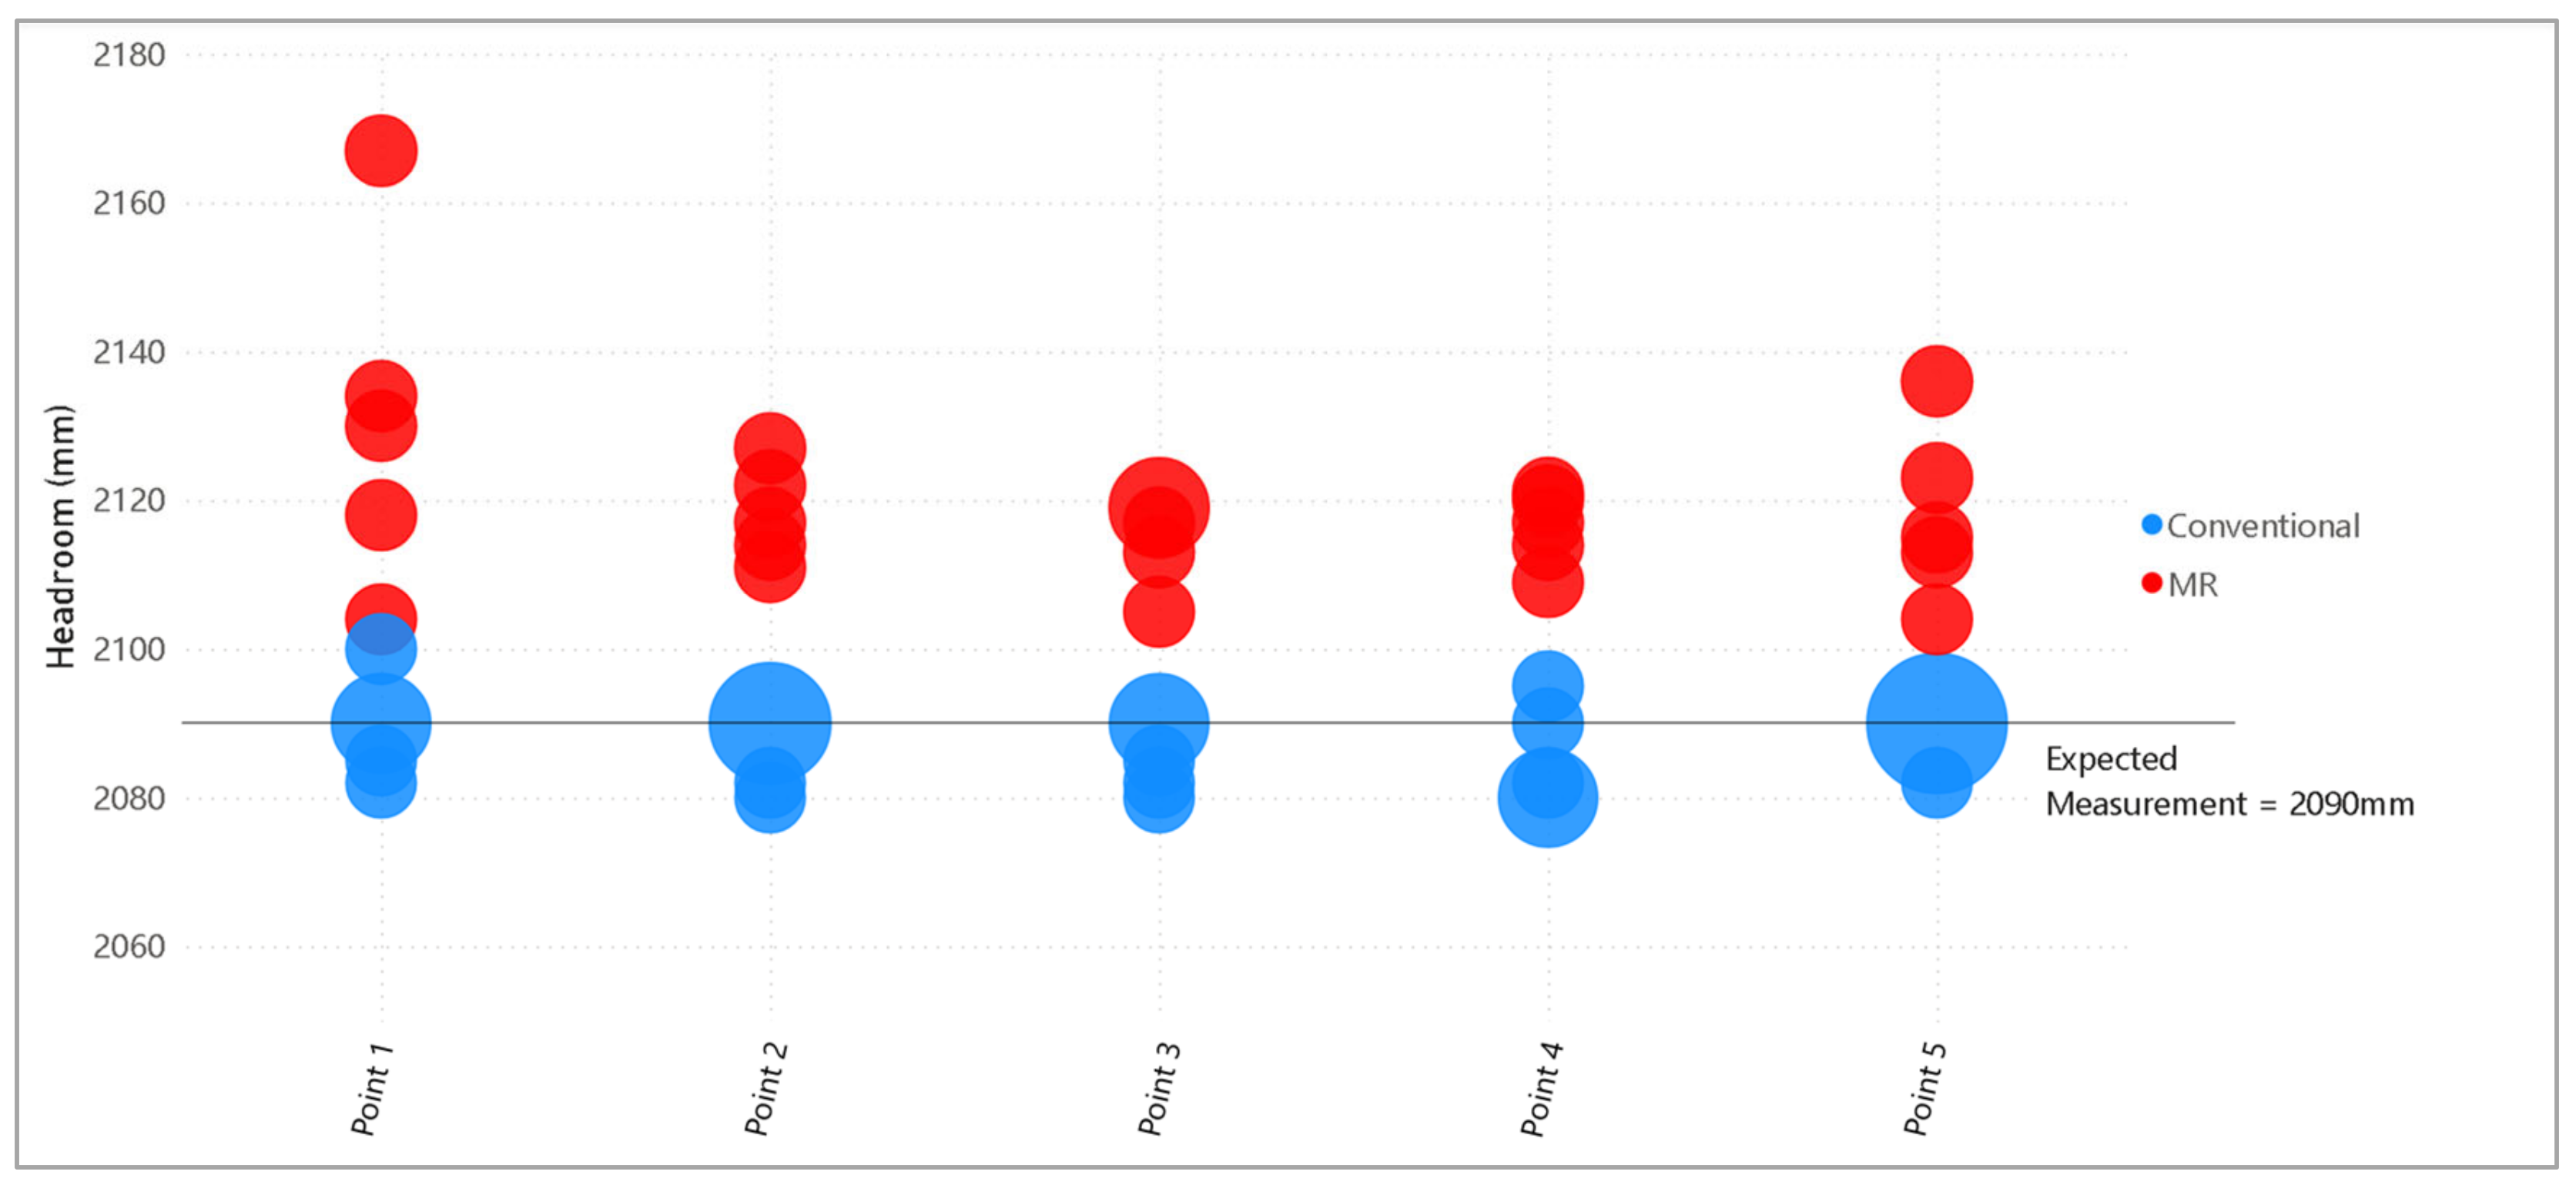
Appendix A. Distinct Measurement Values by Location
The distinct measurements reported by each user for each location are presented in this appendix for reference. The size of each marker represents the number of occurrences of each reported measurement. The bigger the marker, the more times each volunteer reported a particular measurement.
Figure A1.
Headroom measurements at HFT1 L13 Staircase.

Figure A2.
Headroom measurements at HFT1 B1 Staircase.

Figure A3.
Riser height measurements at HFT1 L13 Staircase.

Figure A4.
Riser height measurements at HFT1 B1 Staircase.

Figure A5.
Staircase width measurements at HFT1 L13 Staircase.

Figure A6.
Staircase width measurements at HFT1 B1 Staircase.

Figure A7.
Headroom measurements at HFT1 L13 Corridor.

Figure A8.
Headroom measurements at HFT1 B1 Corridor.

References
- Fakunle, F.F.; Opiti, C.; Sheikh, A.A.; Fashina, A.A. Major barriers to the enforcement and violation of building codes and regulations: A global perspective. SPC J. Environ. Sci. 2020, 2, 12–18. [Google Scholar]
- Zhiliang, M.; Cai, S.; Mao, N.; Yang, Q.; Feng, J.; Wang, P. Construction quality management system based on a collaborative system using BIM and indoor positioning. Autom. Constr. 2018, 92, 35–45. [Google Scholar]
- Hasan, S.; Sacks, R. Building Information Modeling (BIM) and construction tech integration for construction operations: State of the art. In Proceedings of the 2021 European Conference on Computing in Construction, Online Conference, 26–28 July 2021. [Google Scholar] [CrossRef]
- Prieto, S.A.; Giakoumidis, N.; de Soto, B.G. AutoCIS: An Automated Construction Inspection System for Quality Inspection of Buildings. In Proceedings of the 38th International Symposium on Automation and Robotics in Construction, Dubai, United Arab Emirates, 2–4 November 2021; pp. 669–676. [Google Scholar]
- Bartlett, K.; Blanco, J.L.; Fitzgerald, B.; Johnson, J.; Mullin, A.L.; Ribeirinho, M.J. Rise of the Platform Era: The Next Chapter in Construction Technology; Mckinsey & Company: New York, NY, USA, 2020. [Google Scholar]
- Delgado, M.D.J.; Oyedele, L.; Demian, P.; Beach, T. A research agenda for augmented and virtual reality in architecture, engineering and construction. Adv. Eng. Inform. 2020, 45, 101122. [Google Scholar] [CrossRef]
- Milgram, P.; Takemura, H.; Utsumi, A.; Kishino, F. Augmented reality: A class of displays on the reality-virtuality continuum. In Telemanipulator and Telepresence Technologies; SPIE: Bellingham, WA, USA, 1994; Volume 2351. [Google Scholar]
- Alizadehsalehi, S.; Hadavi, A.; Huang, J.C. From BIM to extended reailty in AEC industry. Autom. Constr. 2020, 116, 103254. [Google Scholar] [CrossRef]
- Talwar, S.; Kaur, P.; Nunkoo, R.; Dhir, A. Digitalization and sustainability: Virtual reality tourism in a post pandemic world. J. Sustain. Tour. 2023, 31, 2564–2591. [Google Scholar] [CrossRef]
- Vargas-Cuentas, N.I.; Huamani, E.L.; Roman-Gonzalez, A. System Based on Mixed Reality for the Tourist Promotion of the Municipal Palace of Lima. Int. J. Emerg. Technol. Adv. Eng. 2021, 11, 11. [Google Scholar]
- Pose-Díez-de-la-Lastra, A.; Moreta-Martinez, R.; García-Sevilla, M.; García-Mato, D.; Calvo-Haro, J.A.; Mediavilla-Santos, L.; Pérez-Mañanes, R.; von Haxthausen, F.; Pascau, J. HoloLens 1 vs. HoloLens 2: Improvements in the New Model for Orthopedic Oncological Interventions. Sensors 2022, 22, 4915. [Google Scholar] [CrossRef]
- Galati, R.; Simone, M.; Barile, G.; De Luca, R.; Cartanese, C.; Grassi, G. Experimental Setup Employed in the Operating Room Based on Virtual and Mixed Reality: Analysis of Pros and Cons in Open Abdomen Surgery. J. Healthc. Eng. 2020. [Google Scholar] [CrossRef]
- Kuleto, V.; Mihoreanu, L.; Dinu, D.G.; Ilić, M.P.; Păun, D. Artificial Intelligence, Machine Learning and Extended Reality: Potential Problem Solvers for Higher Education Issues. In Augmented Reality and Artificial Intelligence; Springer Series on Cultural Computing; Geroimenko, V., Ed.; Springer: Cham, Switzerland, 2023; pp. 123–136. [Google Scholar]
- Farzam, K.; Kaiser, L.E. Impact of extended reality on architectural education and the design process. Autom. Constr. 2022, 141, 104393. [Google Scholar] [CrossRef]
- Silva, M.; Teixeira, L. Developing an eXtended Reality platform for Immersive and Interactive Experiences for Cultural Heritage: Serralves Museum and Coa Archeologic Park. In Proceedings of the 2020 IEEE International Symposium on Mixed and Augmented Reality Adjunct (ISMAR-Adjunct), Recife, Brazil, 9–13 November 2020. [Google Scholar]
- Banfia, F.; Brumanaa, R.; Stangab, C. Extended Reality and Informative Models for the Architectural Heritage: From Scan-to-BIM Process to Virtual and Augmented Reality. Virtual Archeaology Rev. 2019, 10, 14–30. [Google Scholar] [CrossRef]
- Terrugi, S.; Fassi, F. HoloLens 2 Spatial Mapping Capabilities in Vast Monumental Heritage Environments. Int. Arch. Photogramm. Remote Sens. Spatial Inf. Sci. 2022, XLVI-2/W1-2022, 489–496. [Google Scholar] [CrossRef]
- Cheng, J.C.P.; Chen, K.; Chen, W.W. State-of-the-Art Review on Mixed Reality Applications in the AECO Industry. J. Constr. Eng. Manag. 2019, 146, 2. [Google Scholar] [CrossRef]
- Li, H.; Fang, S.; Chen, L.; Menadue, V. Extended reality (XR)—A magic box of digitalization in driving sustainable development of the construction industry: A critical review. Sustain. Dev. 2023, 1–16. [Google Scholar] [CrossRef]
- Alizadehsalehi, S.; Hadavi, A. Synergies of Lean, BIM, and Extended Reality (LBX) for Project Delivery Management. Sustainability 2023, 15, 4969. [Google Scholar] [CrossRef]
- Khoshelham, K.; Tran, H.; Acharya, D. Indoor mapping eyewear: Geometric evaluation of spatial mapping capability of hololens. Int. Arch. Photogramm. Remote Sens. Spat. Inf. Sci. 2019, XLII-2/W13, 805–810. [Google Scholar] [CrossRef]
- Lee, M.S.Z.; Yabuki, N.; Fukuda, T. Automated Dimensional Checking in Mixed Reality for Staircase Flight; Likhitruangsilp, V., Ed.; Chulalongkorn University: Bangkok, Thailand, 2023; pp. 557–564. [Google Scholar]
- Osterhout Design Group (ODG). R-9 SMARTGLASSES. 2023. Available online: https://www.osterhoutgroup.com/r-9-smartglasses/ (accessed on 1 December 2023).
- Microsoft. About HoloLens 2. Microsoft, 13 March 2023. Available online: https://learn.microsoft.com/en-us/hololens/hololens2-hardware (accessed on 6 May 2023).
- Magic Leap Inc. Magic Leap 2. 2023. Available online: https://www.magicleap.com/magic-leap-2 (accessed on 1 December 2023).
- Varjo. Varjo XR-4 Series. 2023. Available online: https://varjo.com/products/xr-4/ (accessed on 1 December 2023).
- Carbonari, A.; Franco, C.; Naticchia, B.; Spegni, F.; Vaccarini, M. A Mixed Reality Application for the On-Site Assessment of Building Renovation: Development and Testing. Sustainability 2022, 14, 20. [Google Scholar] [CrossRef]
- Alizadehsalehi, S.; Yitmen, I. Digital twin-based progress monitoring management model through reality capture to extended reality technologies (DRX). Smart Sustain. Built Environ. 2023, 12, 200–236. [Google Scholar] [CrossRef]
- Babalola, A.; Manu, P.; Cheung, C.; Yunusa-Kaltungo, A.; Bartolo, P. A systematic review of the application of immersive technologies for safety and health management in the construction sector. J. Saf. Res. 2023, 85, 66–85. [Google Scholar] [CrossRef]
- Moore, H.F.; Gheisari, M. A Review of Virtual and Mixed Reality Applications in Construction Safety Literature. Safety 2019, 5, 51. [Google Scholar] [CrossRef]
- Alizadehsalehi, S.; Hadavi, A.; Huang, J.C. BIM/MR-Lean construction project delivery management system. In Proceedings of the 2019 IEEE Technology and Engineering Management Conference, TEMSCON 2019, Atlanta, GA, USA, 12–14 June 2019. [Google Scholar]
- Chalhoub, J.; Ayer, S.K. Using Mixed Reality for electrical construction design communication. Autom. Constr. 2018, 86, 1–10. [Google Scholar] [CrossRef]
- Hou, L.; Wang, X.; Truijens, M. Using Augmented Reality to Facilitate Piping Assembly: An Experiment-Based Evaluation. J. Comput. Civ. Eng. 2013, 29, 1. [Google Scholar] [CrossRef]
- Da Valle, A.; Azhar, S. An Investigation of Mixed Reality Technology for Onsite Construction Assembly. MATEC Web Conf. 2020, 312, 06001. [Google Scholar] [CrossRef]
- Machado, R.L.; Vilela, C. Conceptual Framework for Integrating BIM and Augmented Reality in Construction Management. J. Civ. Eng. Manag. 2020, 26, 83–94. [Google Scholar] [CrossRef]
- Chung, W.F.; Chun, W.C. Using BIM and MR to Improve the Process of Job Site Construction and Inspection. Build. Inf. Model. (BIM) Des. Constr. Oper. III 2019, 192, 21–32. [Google Scholar]
- Zhou, Y.; Luo, H.; Yang, Y. Implementation of augmented reality for segment displacement inspection during tuneling construction. Autom. Constr. 2017, 2, 112–121. [Google Scholar] [CrossRef]
- Kwon, O.-S.; Park, C.-S.; Lim, C.-R. A defect management system for reinforced concrete work utilizing BIM, image-matching and augmented reality. Autom. Constr. 2014, 46, 74–81. [Google Scholar] [CrossRef]
- Nguyen, D.-C.; Nguyen, T.-Q.; Jin, R.; Jeon, C.-H.; Shim, C.-S. BIM-based mixed-reality application for bridge inspection and maintenance. Constr. Innov. 2021, 22, 487–503. [Google Scholar] [CrossRef]
- Riedlinger, U.; Klein, F.; Hill, M.; Lambracht, C.; Nieborowski, S.; Oppermann, L.; Bahlau, S.; Holst, R. Evaluation of Mixed Reality Support for Bridge Inspectors Using BIM Data. i-com 2022, 21, 253–267. [Google Scholar] [CrossRef]
- Embers, S.; Zentgraf, S.; Herbers, P.; Celik, F.; Faltin, B.; König, M.; Braun, J.-D.; Steinjan, J.; Schammler, D.; Nieborowski, S.; et al. An Artificial Intelligence and Mixed Reality Approach for Optimizing the Bridge Inspection Workflow. In Proceedings of the 2022 European Conference on Computing in Construction, Ixia, Rhodes, Greece, 24–26 July 2022. [Google Scholar]
- Kattatray, G.V.; Wadalkar, S. To Study the Effective Utilization of Total Station, GPS, Laser Scanning Equipment. Int. J. Res. Appl. Sci. Eng. Technol. 2021, 9, 16. [Google Scholar] [CrossRef]
- Land Surveyors Board Singapore. Land Surveyors Board Directives on Land Survey and Geomatics Practices; Land Surveyors Board Singapore: Singapore, 2022.
- Liscio, E.; Hayden, A.; Moody, J. A Comparison of the Terrestrial Laser Scanner & Total Station for Scene Documentation. J. Assoc. Crime Scene Reconstr. 2016, 20, 1–8. [Google Scholar]
- Tang, P.; Huber, D.; Akinci, B.; Lipman, R.; Lytle, A. Automatic reconstruction of as-built building information models from laser-scanned point clouds: A review of related techniques. Autom. Constr. 2010, 19, 829–843. [Google Scholar] [CrossRef]
- U.S. Department of Labor. Occupational Safety and Health Administration; 1910.25-Stairways; U.S. Department of Labor: Washington, DC, USA, 2019.
- BS 5395-1:2010; Code of Practice for the Design of Stairs with Straight Stairs and Winders. British Standards Institution: London, UK, 2010.
- Building Construction Authority (Singapore). Approved Document—Acceptable Solutions Version 7.03; Commissioner of Building Control: Singapore, 2022.
- Building and Construction Authority (Singapore). Code on Accessibility in the Built Environment 2019. 2019. Available online: https://www1.bca.gov.sg/docs/default-source/docs-corp-news-and-publications/publications/codes-acts-and-regulations/accessibilitycode2019.pdf?sfvrsn=ea84e8b7_0 (accessed on 11 November 2022).
- Hübner, P.; Clintworth, K.; Liu, Q.; Weinmann, M.; Wursthorn, S. Evaluation of HoloLens Tracking and Depth Sensing for Indoor Mapping Applications. Sensors 2020, 20, 4. [Google Scholar] [CrossRef] [PubMed]
- Microsoft. Spatial Mapping. Microsoft, 2 January 2023. Available online: https://learn.microsoft.com/en-us/windows/mixed-reality/design/spatial-mapping (accessed on 17 February 2023).
- Microsoft. Scene Understanding SDK Overview. 8 March 2022. Available online: https://learn.microsoft.com/en-us/windows/mixed-reality/develop/unity/scene-understanding-sdk (accessed on 21 November 2022).
- Stachniak, S. Digitizing the Physical World: An Intro to Mixed Reality Scene Understanding. Microsoft, 9 June 2020. Available online: https://learn.microsoft.com/en-us/shows/mixed-reality/digitizing-the-physical-world-an-intro-to-mixed-reality-scene-understanding (accessed on 23 March 2023).
- Microsoft. Scene Understanding. Microsoft, 22 September 2022. Available online: https://learn.microsoft.com/en-us/windows/mixed-reality/design/scene-understanding (accessed on 15 February 2023).
- Hübner, P.; Landgraf, S.; Weinmann, M.; Wursthorn, S. Evaluation of the Microsoft HoloLens for the Mapping of Indoor Building Environments. In Proceedings of the Dreiländertagung der DGPF, der OVG und der SGPF, Vienna, Austria, 20–22 February 2019. [Google Scholar]
- Unity. Unity Technologies. 2023. Available online: https://unity.com/ (accessed on 6 May 2023).
- Microsoft. Mixed Reality Toolkit 2. Microsoft, 16 December 2022. Available online: https://learn.microsoft.com/en-us/windows/mixed-reality/mrtk-unity/mrtk2/?view=mrtkunity-2022-05 (accessed on 6 May 2023).
- Ong, S.; Siddaraju, V.K. Beginning Windows Mixed Reality Programming: For HoloLens and Mixed Reality Headsets; Apress: Berkeley, CA, USA, 2017. [Google Scholar]
- Unity. Physics.Raycast. 28 April 2023. Available online: https://docs.unity3d.com/ScriptReference/Physics.Raycast.html (accessed on 6 May 2023).
- Building and Construction Authority (Singapore). Universal Design Guide. 2016. Available online: https://www1.bca.gov.sg/docs/default-source/universaldesign/udguide2016.pdf?sfvrsn=1fdac12d_2 (accessed on 13 November 2022).
- Singapore Civil Defense Force. Code of Practice for Fire Precautions in Buildings 2018. 2018. Available online: https://www.scdf.gov.sg/docs/default-source/scdf-library/fssd-downloads/fire7-jan-19.pdf (accessed on 11 November 2022).
- Building Construction Authority (Singapore). Conquas the Bca Construction Quality Assessment System, 9th ed.; Building Construction Authority (Singapore): Singapore, 2020.
- Urban Redevelopment Authority (Singapore). URA SPACE. Urban Redevelopment Authority (Singapore), n.d. Available online: https://www.ura.gov.sg/maps/?link=N4IgDg9gliBcoBsCGAXOBGAdAJgGwBYB2AZgOwE5tiAOAVlwAZiAaEBAOwHMMnNr1y6WpVr5i2CgF9WAZwCmCAMoA3AMZwQAUQAaABQAyAeQBKmxQEkAKppCsAtkjCaAHijns08EAH0ZEAK4oABYA6nIynoioGDiMBPjouMS0hPjkDOS0rBzcsOi8-Nj5TOTkuNh05NI+7BAATsGaSBFwUZ5YeOTE (accessed on 1 September 2023).
- Weinmann, M.; Jäger, M.A.; Wursthorn, S.; Jutzi, B.; Weinmann, M.; Hübner, P. 3D Indoor Mapping with the Microsoft HoloLens: Qualitative and Quantitative Evaluation by Means of Geometric Features. ISPRS Ann. Photogramm. Remote Sens. Spat. Inf. Sci. 2020, V-1-2020, 165–172. [Google Scholar] [CrossRef]
- Microsoft. HoloLens Environment Considerations. 23 March 2022. Available online: https://learn.microsoft.com/en-us/hololens/hololens-environment-considerations (accessed on 19 February 2023).
- National Environmental Agency (Singapore). Extremely Low Frequency (ELF) Radiation. National Environmental Agency (Singapore), 19 April 2023. Available online: https://www.nea.gov.sg/our-services/radiation-safety/extremely-low-frequency-(elf)-radiation/elf-levels-in-singapore (accessed on 19 February 2023).
Figure 1.
Staircase flights used in experiments—Osaka University (Left), HFT1 L13 (Center), and HFT1 B1 (Right).
Figure 1.
Staircase flights used in experiments—Osaka University (Left), HFT1 L13 (Center), and HFT1 B1 (Right).

Figure 2.
Corridors used in experiments—HFT1 B1 (Left) and HFT1 L13 (Right).

Figure 3.
MR application software architecture overview.

Figure 4.
MR application decision flow diagram.

Figure 5.
MR results for quad generation—Expected results (left); Actual results of Riser Height and Width (top right); Actual results of Headroom (bottom right).
Figure 5.
MR results for quad generation—Expected results (left); Actual results of Riser Height and Width (top right); Actual results of Headroom (bottom right).

Figure 6.
Overall view of the staircase with automatically generated dimensions.

Figure 7.
Regulatory dimensional compliance checks in MR—Checklist (left); Compliance check results indicating compliant results in green and non-compliant results in red (right).
Figure 7.
Regulatory dimensional compliance checks in MR—Checklist (left); Compliance check results indicating compliant results in green and non-compliant results in red (right).

Figure 8.
Distribution of measurements of riser height by location and scanning time—Osaka University staircase flight.
Figure 8.
Distribution of measurements of riser height by location and scanning time—Osaka University staircase flight.

Figure 9.
Occurrence of automated riser height measurements by scanning time—Osaka University staircase flight.
Figure 9.
Occurrence of automated riser height measurements by scanning time—Osaka University staircase flight.

Figure 10.
Distribution of measurements of headroom by location and scanning time—Osaka University staircase flight.
Figure 10.
Distribution of measurements of headroom by location and scanning time—Osaka University staircase flight.

Figure 11.
Occurrence of automated headroom measurements by scanning time—Osaka University staircase flight.
Figure 11.
Occurrence of automated headroom measurements by scanning time—Osaka University staircase flight.

Figure 12.
Mean Absolute Error of Measurements by Location.

Figure 13.
Occurrences of auto-generated dimensions—Riser Height.

Figure 14.
Occurrences of auto-generated dimensions—Headroom.

Figure 15.
Occurrences of auto-generated dimensions—Staircase Width.

Figure 16.
Staircase tread mesh visualization—Expected results (left) and Actual results (right).

Figure 17.
Mesh errors due to changes in the environment during scanning—separate occurrences during tests.
Figure 17.
Mesh errors due to changes in the environment during scanning—separate occurrences during tests.

Figure 18.
Hallucinated spatial surfaces in the spatial map.

Figure 19.
Sectioned mesh exported from HoloLens 2—Staircase Mesh (Left) and Corridor Mesh (Right).

Figure 20.
Cases of unexplained spatial map errors were observed in staircases—HFT1 B1 (Left), HFT1 L13 (Center), and Osaka U (Right).
Figure 20.
Cases of unexplained spatial map errors were observed in staircases—HFT1 B1 (Left), HFT1 L13 (Center), and Osaka U (Right).

Figure 21.
Cases of unexplained spatial map errors in Corridors—HFT1 B1 Corridor (Top), HFT B1 Corridor (Center), and HFT L13 Corridor (Bottom).
Figure 21.
Cases of unexplained spatial map errors in Corridors—HFT1 B1 Corridor (Top), HFT B1 Corridor (Center), and HFT L13 Corridor (Bottom).

Table 2.
Dimensional Regulatory Requirements.
| Country | USA | UK | Singapore | |
|---|---|---|---|---|
| Design Parameter | OSHA 1 | BS 5395-1: 2010 2 | Approved Document V7.03 3 | Accessibility Code 2019 |
| Max. riser height | 240 mm | 190 mm a | 175 mm b | 150 mm |
| Min. width | 560 mm | 1000 mm a | 1000 mm c | 900 mm |
| Min. headroom | 2030 mm | 2000 mm | 2000 mm d | 2000 mm |
1 United States Department of Labor, Occupational Safety and Health Administration; 2 British Standard: Stairs, ladders and walkways—Part 1: Code of practice for the design, construction and maintenance of straight stairs and winders; 3 Singapore’s Building Construction Authority Approved Document V7.03; a Varies depending on stair category—dimension shown is for general public stairs; b Heights shall be of uniform height and size, where a tolerance of 5 mm between two consecutive steps in any flight of staircase is acceptable; c Revised in December 2022 from 900 mm to 1000 mm; Varies depending on type of building use—dimension shown is for general buildings; d Varies depending on space function—dimension shown is for general public stairs.
Table 3.
Statistical Evaluation of Experimental Results of MR Measurements.
| Building Feature | Tool | Location | Expected Value (mm) | Mean Absolute Error (mm) | Mean Absolute Error (%) | Mean (mm) | Standard Deviation (mm) |
|---|---|---|---|---|---|---|---|
| Riser Height | Conventional | HFT1 L13 | 175 | 3 | 1.8% | 173 | 3 |
| Riser Height | MR | HFT1 L13 | 175 | 2 | 1.4% | 176 | 3 |
| Riser Height | Conventional | HFT1 B1 | 170 | 2 | 1.1% | 169 | 3 |
| Riser Height | MR | HFT1 B1 | 170 | 4 | 2.3% | 173 | 4 |
| Stair Width | Conventional | HFT1 L13 | 1015 | 5 | 0.5% | 1015 | 7 |
| Stair Width | MR | HFT1 L13 | 1015 | 81 | 7.9% | 956 | 123 |
| Stair Width | Conventional | HFT1 B1 | 1025 | 3 | 0.3% | 1035 | 21 |
| Stair Width | MR | HFT1 B1 | 1025 | 73 | 0.2% | 1001 | 98 |
| Stair Width | Conventional | HFT1 B1 | 1070 | 2 | 7.1% | 1069 | 3 |
| Stair Width | MR | HFT1 B1 | 1070 | 192 | 17.9% | 1007 | 133 |
| Headroom | Conventional | HFT1 B1 | Varies | 22 | - | - | - |
| Headroom | MR | HFT1 B1 | Varies | 115 | - | - | - |
| Headroom | Conventional | HFT1 L13 | 3470 | 69 | 2.0% | 3467 | 81 |
| Headroom | MR | HFT1 L13 | 3470 | 160 | 4.6% | 3571 | 195 |
| Headroom | Conventional | HFT1 L13 | 3600 | 14 | 0.4% | 3598 | 21 |
| Headroom | MR | HFT1 L13 | 3600 | 52 | 1.5% | 3592 | 64 |
| Headroom | Conventional | HFT1 B1 | 2090 | 4 | 0.2% | 2087 | 5 |
| Headroom | MR | HFT1 B1 | 2090 | 30 | 1.4% | 2120 | 13 |
| Headroom | Conventional | HFT1 L13 | 2690 | 6 | 0.2% | 2692 | 9 |
| Headroom | MR | HFT1 L13 | 2690 | 21 | 0.8% | 2711 | 5 |
Table 4.
Summary of errors for scaled measurements and observed scale factors.
| Building Feature | Tool | Location | Expected Value (mm) | Mean—Scale Factor = 0.988 (mm) | Mean Absolute Error—Scaled (mm) | Mean Absolute Error—Scaled (%) | Observed Scale Factor against Measured Values | Observed Scale Factor against Expected Values |
|---|---|---|---|---|---|---|---|---|
| Riser Height | Conventional | HFT1 L13 | 175 | - | - | - | - | - |
| Riser Height | MR | HFT1 L13 | 175 | 174 | 3 | 1.4% | 0.9836 | 0.9963 |
| Riser Height | Conventional | HFT1 B1 | 170 | - | - | - | - | - |
| Riser Height | MR | HFT1 B1 | 170 | 171 | 3 | 1.7% | 0.9751 | 0.925 |
| Stair Width | Conventional | HFT1 L13 | 1015 | - | - | - | - | - |
| Stair Width | MR | HFT1 L13 | 1015 | 945 | 85 | 8.4% | 1.0576 | 1.0577 |
| Stair Width | Conventional | HFT1 B1 | 1025 | - | - | - | - | - |
| Stair Width | MR | HFT1 B1 | 1025 | 989 | 69 | 6.8% | 1.0327 | 1.0230 |
| Stair Width | Conventional | HFT1 B1 | 1070 | - | - | - | - | - |
| Stair Width | MR | HFT1 B1 | 1070 | 995 | 204 | 18.9% | 1.0583 | 1.0592 |
| Headroom | Conventional | HFT1 B1 | Varies | - | - | - | - | - |
| Headroom | MR | HFT1 B1 | Varies | - | - | - | - | - |
| Headroom | Conventional | HFT1 L13 | 3470 | - | - | - | - | - |
| Headroom | MR | HFT1 L13 | 3470 | 3528 | 150 | 4.3% | 0.9699 | 0.9709 |
| Headroom | Conventional | HFT1 L13 | 3600 | - | - | - | - | - |
| Headroom | MR | HFT1 L13 | 3600 | 3549 | 51 | 1.4% | 1.0016 | 1.0022 |
| Headroom | Conventional | HFT1 B1 | 2090 | - | - | - | - | - |
| Headroom | MR | HFT1 B1 | 2090 | 2094 | 8 | 0.4% | 0.9844 | 0.9859 |
| Headroom | Conventional | HFT1 L13 | 2690 | - | - | - | - | - |
| Headroom | MR | HFT1 L13 | 2690 | 2679 | 11 | 0.4% | 0.9926 | 0.9920 |
Disclaimer/Publisher’s Note: The statements, opinions and data contained in all publications are solely those of the individual author(s) and contributor(s) and not of MDPI and/or the editor(s). MDPI and/or the editor(s) disclaim responsibility for any injury to people or property resulting from any ideas, methods, instructions or products referred to in the content. |
© 2023 by the authors. Licensee MDPI, Basel, Switzerland. This article is an open access article distributed under the terms and conditions of the Creative Commons Attribution (CC BY) license (https://creativecommons.org/licenses/by/4.0/).
Share and Cite
MDPI and ACS Style
Lee, M.S.Z.; Yabuki, N.; Fukuda, T. Scene Understanding for Dimensional Compliance Checks in Mixed-Reality. CivilEng 2024, 5, 1-29. https://0-doi-org.brum.beds.ac.uk/10.3390/civileng5010001
AMA Style
Lee MSZ, Yabuki N, Fukuda T. Scene Understanding for Dimensional Compliance Checks in Mixed-Reality. CivilEng. 2024; 5(1):1-29. https://0-doi-org.brum.beds.ac.uk/10.3390/civileng5010001
Chicago/Turabian StyleLee, Michelle Siu Zhi, Nobuyoshi Yabuki, and Tomohiro Fukuda. 2024. "Scene Understanding for Dimensional Compliance Checks in Mixed-Reality" CivilEng 5, no. 1: 1-29. https://0-doi-org.brum.beds.ac.uk/10.3390/civileng5010001