
Methods to Increase Fatigue Life at Rib to Deck Connection in Orthotropic Steel Bridge Decks

1
Department of Civil and Environmental Engineering, University of Toledo, Toledo, OH 43606, USA
2
Geotechnology, LLC., 1780 Carillon Blvd, Cincinnati, OH 45240, USA
3
Department of Civil Engineering, Pulchowk Campus, Institute of Engineering, Tribhuvan University, Lalitpur 44600, Nepal
4
Western Australian School of Mines: Minerals, Energy and Chemical Engineering, Curtin University, Kalgoorlie, WA 6430, Australia
*
Author to whom correspondence should be addressed.
CivilEng 2024, 5(1), 288-306; https://0-doi-org.brum.beds.ac.uk/10.3390/civileng5010015
Submission received: 4 February 2024
/
Revised: 3 March 2024
/
Accepted: 11 March 2024
/
Published: 20 March 2024
(This article belongs to the Special Issue Feature Papers in CivilEng)
Abstract
:Orthotropic steel bridge decks (OSDs) are very popular all over the world because of the low dead load, high stiffness in the longitudinal direction, high strength ratio to weight, and can be used in various types of bridges. The life of these bridges is affected by fatigue cracks in different portions. One of major areas where the fatigue cracks appear in these bridges is rib-to-deck connection. In this research finite element analysis is carried out by using ABAQUS/CAE 2022 software to determine the ways to increase the fatigue life at rib to deck connection in OSDs. In the first part, smaller models are simulated; stress concentration is analyzed and hot spot stress (HSS) is calculated according to International Institute of Welding (IIW) and Det Norske Veritas (DNV) recommendations. In the second part, a parametric analysis is carried out to analyze the effect of weld penetration, thickness of deck, thickness of rib and rib to deck connection type. In the third part, simulation of models similar to the real field is carried out to determine whether the double welded connections are better than single welded connections. Different models are analyzed for different load cases like single wheel load, double wheel load and also the position of the wheels is changed. The boundary conditions are changed to analyze whether the boundary condition has any significant effect on the result obtained. It is found that thicker decks, thinner ribs, and low penetrated welded connections reduce the stress concentrations at rib to deck connections which ultimately increase fatigue life. Among the parameters examined, deck thickness is the most important parameter. It is found that the percentage of stress increase with percentage decrease in deck thickness follows a power relation. The overall fatigue life of double welded connection is excepted to be lower since the stress concentration is maximum at the weld toe at deck on the outer side of the closed stiffener; however, if the cracks initiate on the inner side of closed stiffener, the cracks at the weld root of single welded connection can propagate much rapidly than the cracks initiating on the inner side of the closed stiffener at the weld toe, thereby reducing the fatigue life of the single-welded specimen significantly.
1. Introduction
1.1. General Introduction
Orthotropic steel bridge decks are very popular. They are most economical in terms of the material used as a lesser amount of material is enough for the construction. Structurally they are complex, having longitudinal and transverse (diaphragm) stiffeners. As there are large numbers of members connected together by weld joints, the length of welding in OSD can be more than 10 times the actual length of the bridge. These bridges have been constructed since the 1930s in Germany but they became more common after the Second World War. The reason behind that is, after the World War, countries were suffering from the economic recession, so to sustain the weak economy, it was very necessary to save materials for civil construction. These bridges are constructed all over the world with Germany and Netherlands possessing the largest numbers [1]. With the improvement in these types of bridge decks and development of movable bridge systems the combination of these became very promising [2]. The trend of construction of these bridges has decreased after the 1990s. The decrease in their popularity is because of the fatigue problems [1].
Fatigue can be defined as slow progressive localized structural damage of a material due to cyclic or repetitive loading. According to American Society for Testing and Materials, fatigue is the process of progressive localized permanent structural change occurring in a material subjected to conditions that produce fluctuating stresses and strains at some point or points and that may culminate in cracks or complete fracture after a sufficient number of fluctuations [3]. The fusion of filler material, heating and subsequent cooling affects the material homogeneity and residual stresses are produced by welding [4,5]. It is also one of the concerning points that ideal weld is never possible; it always has defects like inclusions, pores, cavities, undercuts, etc. from where cracks initiate. Mathddox [6] reported that welding decreases the fatigue life of specimens from experimental study.
1.2. Researches on Fatigue at Rib to Deck Connections in OSD
Fatigue cracks develop if there is insufficient weld penetration [7]. To avoid the insufficient weld penetration and protect the structures from fatigue different codes have different provisions of weld penetration. American Association of State Highway and Transportation Official [8] specifies that it should be 80% of the rib wall thickness for the rib-to-deck welds. The Japan Road Association [9] species it to be at least 75% of the rib wall. The Chinese Code [10] specifies it to be 85% of the rib wall and Eurocode [11] specifies that the nominal penetration should be 80% and the minimum must be at least 50%.
Xiao et al. [12] introduced the fatigue cracks at rib to deck connections, which depend upon the load position and weld penetration. The other types of cracks discussed are due to flexural stresses that are affected very less by weld penetration. Pfeli et al. [13] conducted a parametric study about the factors affecting the fatigue life along with the test and recommended various ratios of the deck to rib thickness and the depth of rib mentioning that deeper stiffeners increase fatigue life. Some of the researchers worked on the influence of weld types on fatigue life. From the full scale test of 12 specimens, Kainuma et al. [14] made a parametric study on the fatigue behavior of a rib-to-deck weld in OSD. The specimens were 1.4 m wide, with two ‘U’ ribs having spans of 2 m between two cross beams. Loading was applied similar to double and single tire. It was found that the tensile stress cracks are longer in 0% penetrated welds than in 75% and 100% penetrated welds; furthermore, it was reported that very high weld penetration decreases fatigue life. From finite element analysis, Sim and Uang [15] concluded that among the 40%, 60%, and 80% percent partial weld penetration, lower weld penetrated specimens have higher fatigue life.
Samol et al. [16] investigated the fatigue in OSD at rib-to-deck welded joints by testing eight 80% partial joint penetration (PJP), six weld melt through (WMT) and six combinations of 80% PJP and WMT specimens. Two types of tests were conducted, one to simulate the root-deck crack and the next to simulate the toe-deck crack. It was found that the failure by root crack is more likely to occur and the comparison of fatigue strength between the 80% PJP and WMT showed that 80% of PJP has slightly higher fatigue strength than WMT. Dung et al. [17] tested four single ribbed specimens with 75% and 100% weld penetration. From the test, it was reported that the fatigue life of 100% weld penetrated specimen is higher. Mori [18] performed the pure tensile bending test of different weld penetrated specimens. The test specimens had weld penetration of 0%, 25%, 50%, and 75%. From the test, it was found that deeper weld penetrated specimens have lower fatigue life. From the finite element analysis, Miki and Tateishi [19] concluded that single side welds and PJP at toe in rib and deck are prone to fatigue cracks. Using Linear Elastic Fracture Mechanics (LEFM) and eXtended FEM (XFEM) approach, Nagy et al. [20] recommended to use thicker decks and thinner closed ribs to increase the fatigue life at rib to deck connections. From the study “Effect of deck plate thickness of OSD on fatigue life” Murakoshi et al. [21] concluded that the high-stress concentration induced at the root can be minimized by using thicker decks.
From the above studies, it is clear that the outcomes of the research do not align with each other. It is not clear whether the deeper welds increase fatigue life or shallower. There is no unified conclusion whether a single-welded connection increases fatigue life or a double-welded connection. Therefore, it is necessary to investigate the ways to increase fatigue life at rib to deck connections. In this study, different kinds of models are simulated using the Finite Element Method (FEM) employing ABAQUS/CAE 2022 software to analyze the effect of different parameters viz single welds, double welds, weld penetration, deck thickness, rib thickness, the boundary condition and the position of load on fatigue life at the rib-to-deck connection.
The fatigue life of welded structures depends on the concentrated stress at the weld toe or weld root; the stress concentration at the weld toe and weld root can be easily determined by proper simulation using FEM [15]. Upon the determination of stress concentration upon loading and unloading the structures, the fatigue life of cyclic or repeatedly loaded structures can be estimated using SN fatigue curves and mathematical equations [15,16].
2. Simulations of Small Models
2.1. Model Introduction
The ribs (stiffeners) connected to the deck are mainly divided into two groups, viz open stiffeners, and closed stiffeners. The types of closed ribs are trapezoidal, U-shaped and V-shaped and the most popular among these is trapezoidal [1]. Flat, angle and bulb-shaped stiffeners are the major types of open stiffeners. According to the US Department of Transportation [2], the advantage of open ribs is ease in production, assembly, inspection, maintenance, and flexibility. These general advantages are overshadowed by their limited torsional and flexural stiffness that decrease the efficiency to transfer loads between the neighboring ribs [22]. Therefore, in this study closed trapezoidal ribs are chosen for investigation.
The models for simulations were prepared based on the study of K C [23] and Zhu et al. [24]. The deck and rib thickness and weld size are selected in par with the thickness deck and rib and the size of weld used in the real scenario [24]. With the improvement and development of in internal welding technology, i.e., welding U-ribs and deck plates together by an internal weld using welding Roberts along with conventional outside groove weld, the production of bridge decks with a double-welded rib-to-deck connection has become feasible [24]. Therefore, this study intends to analyze such structures.
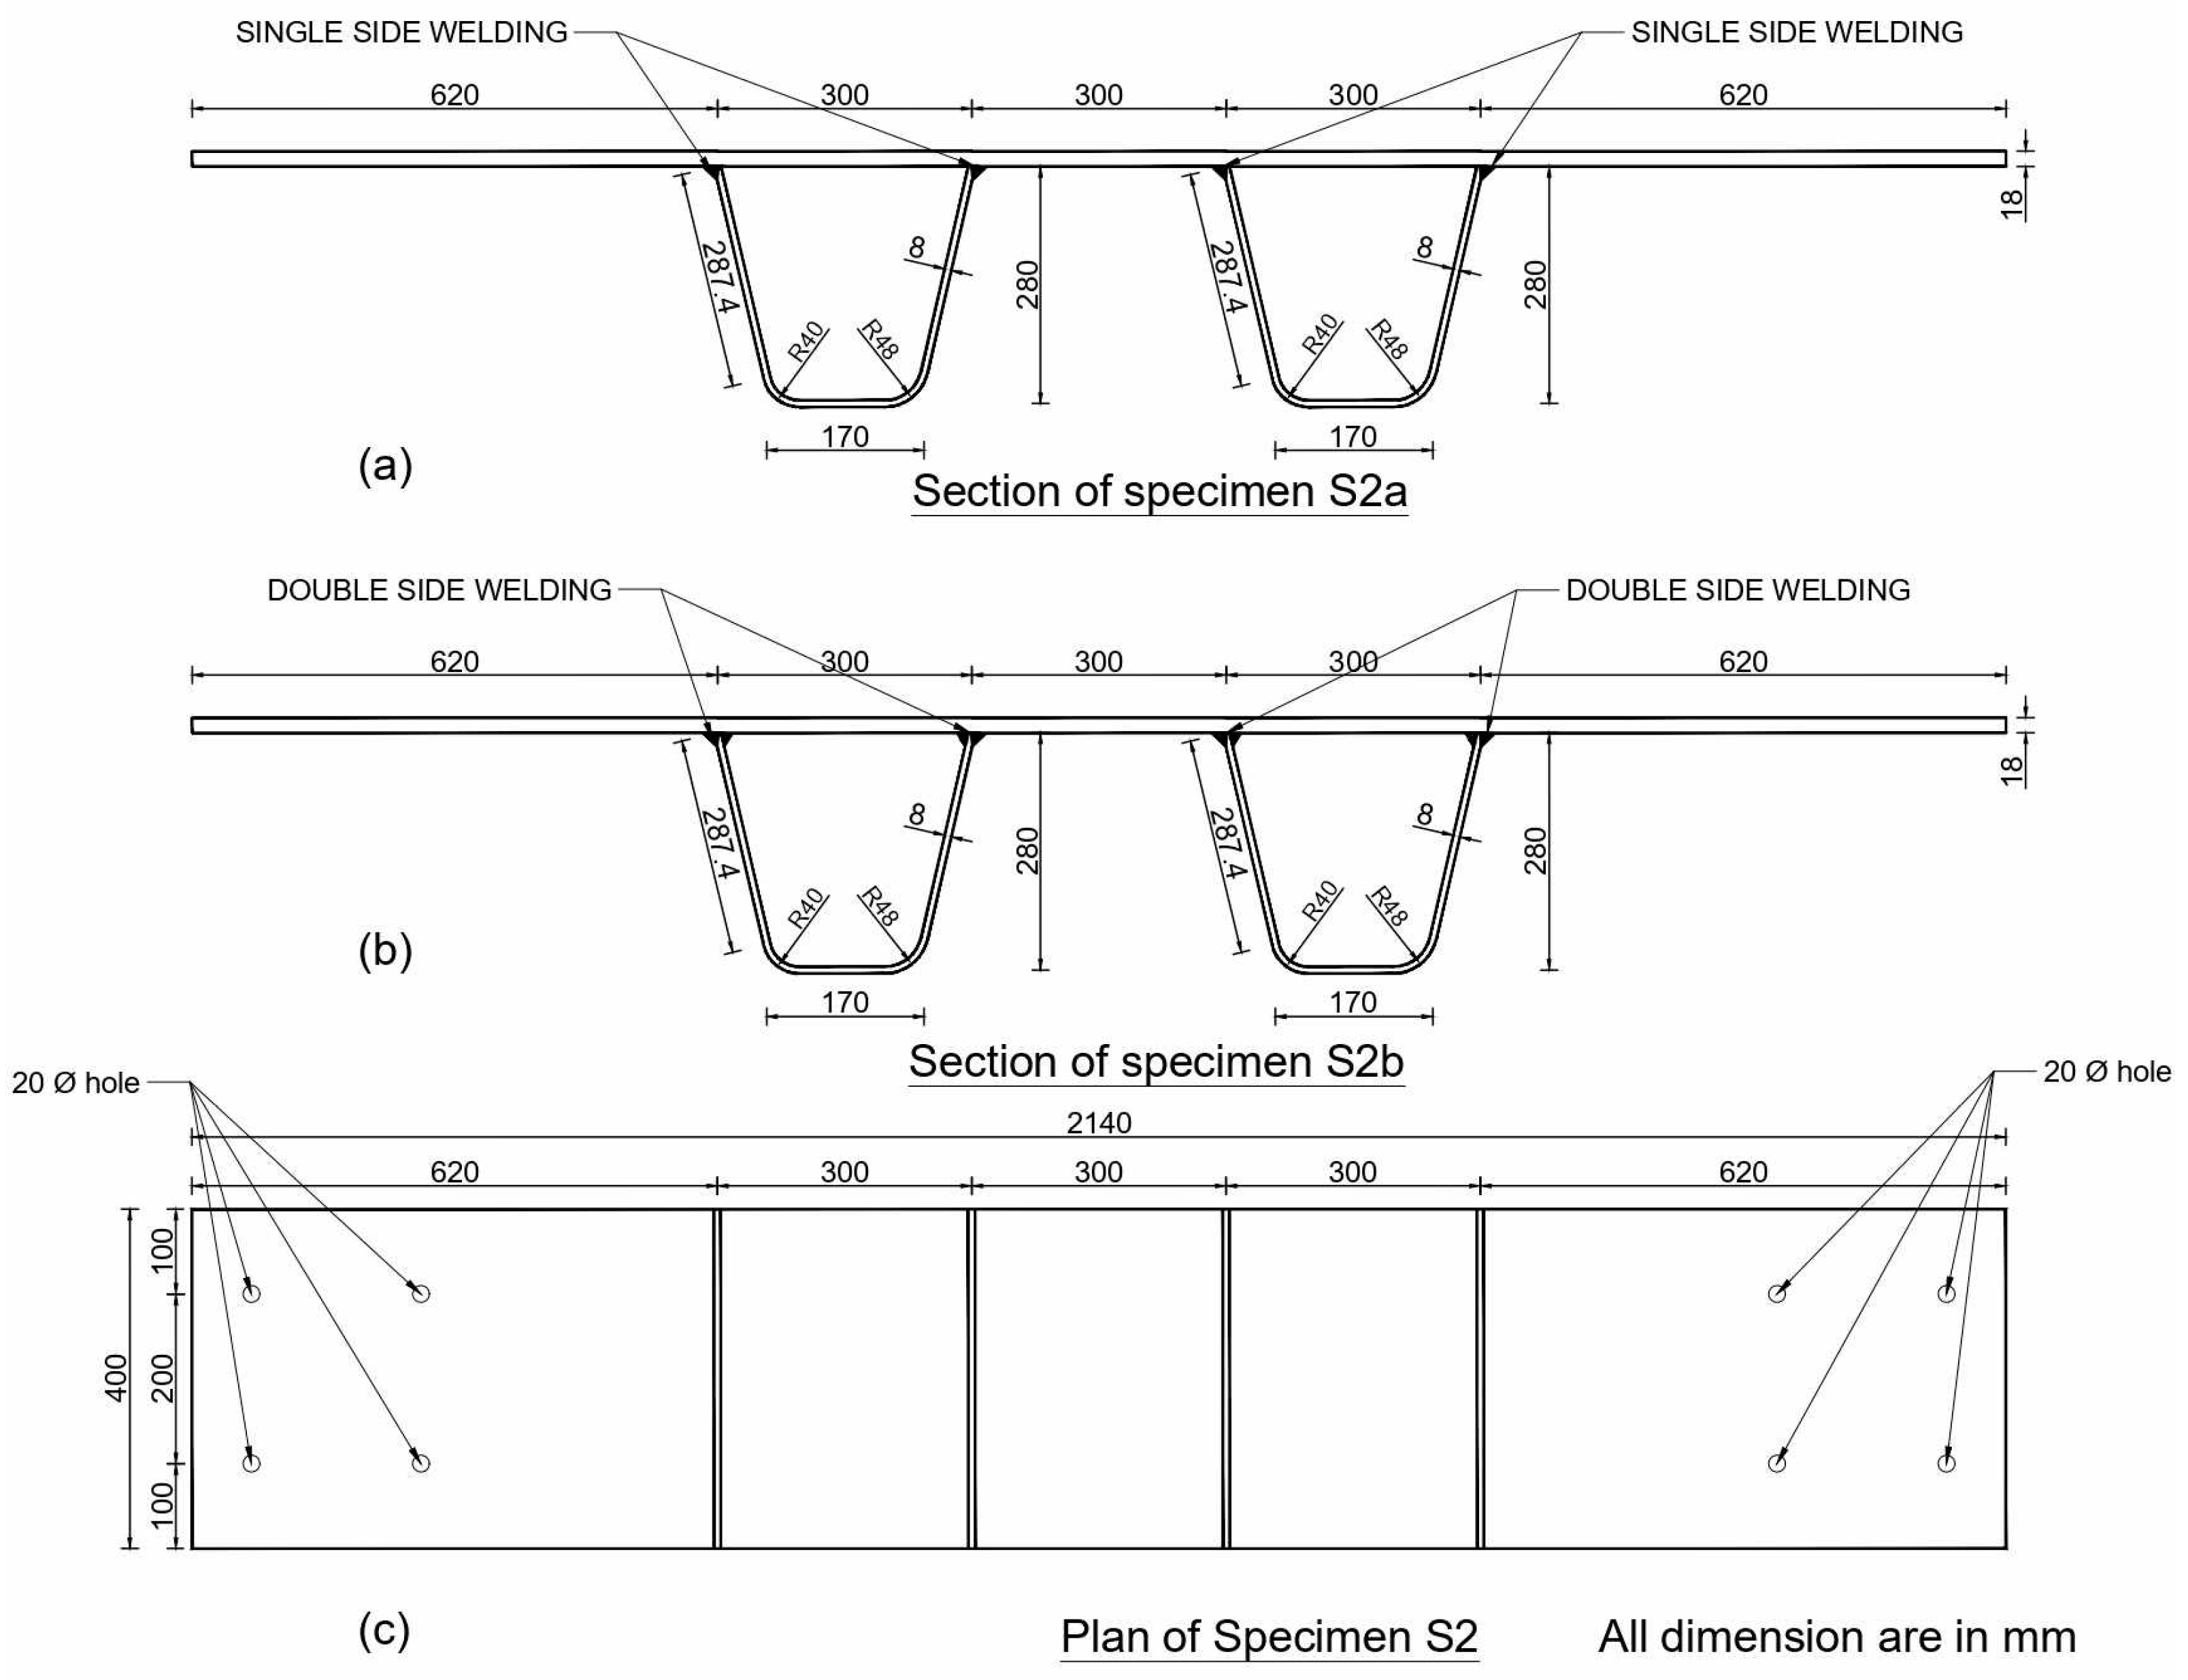
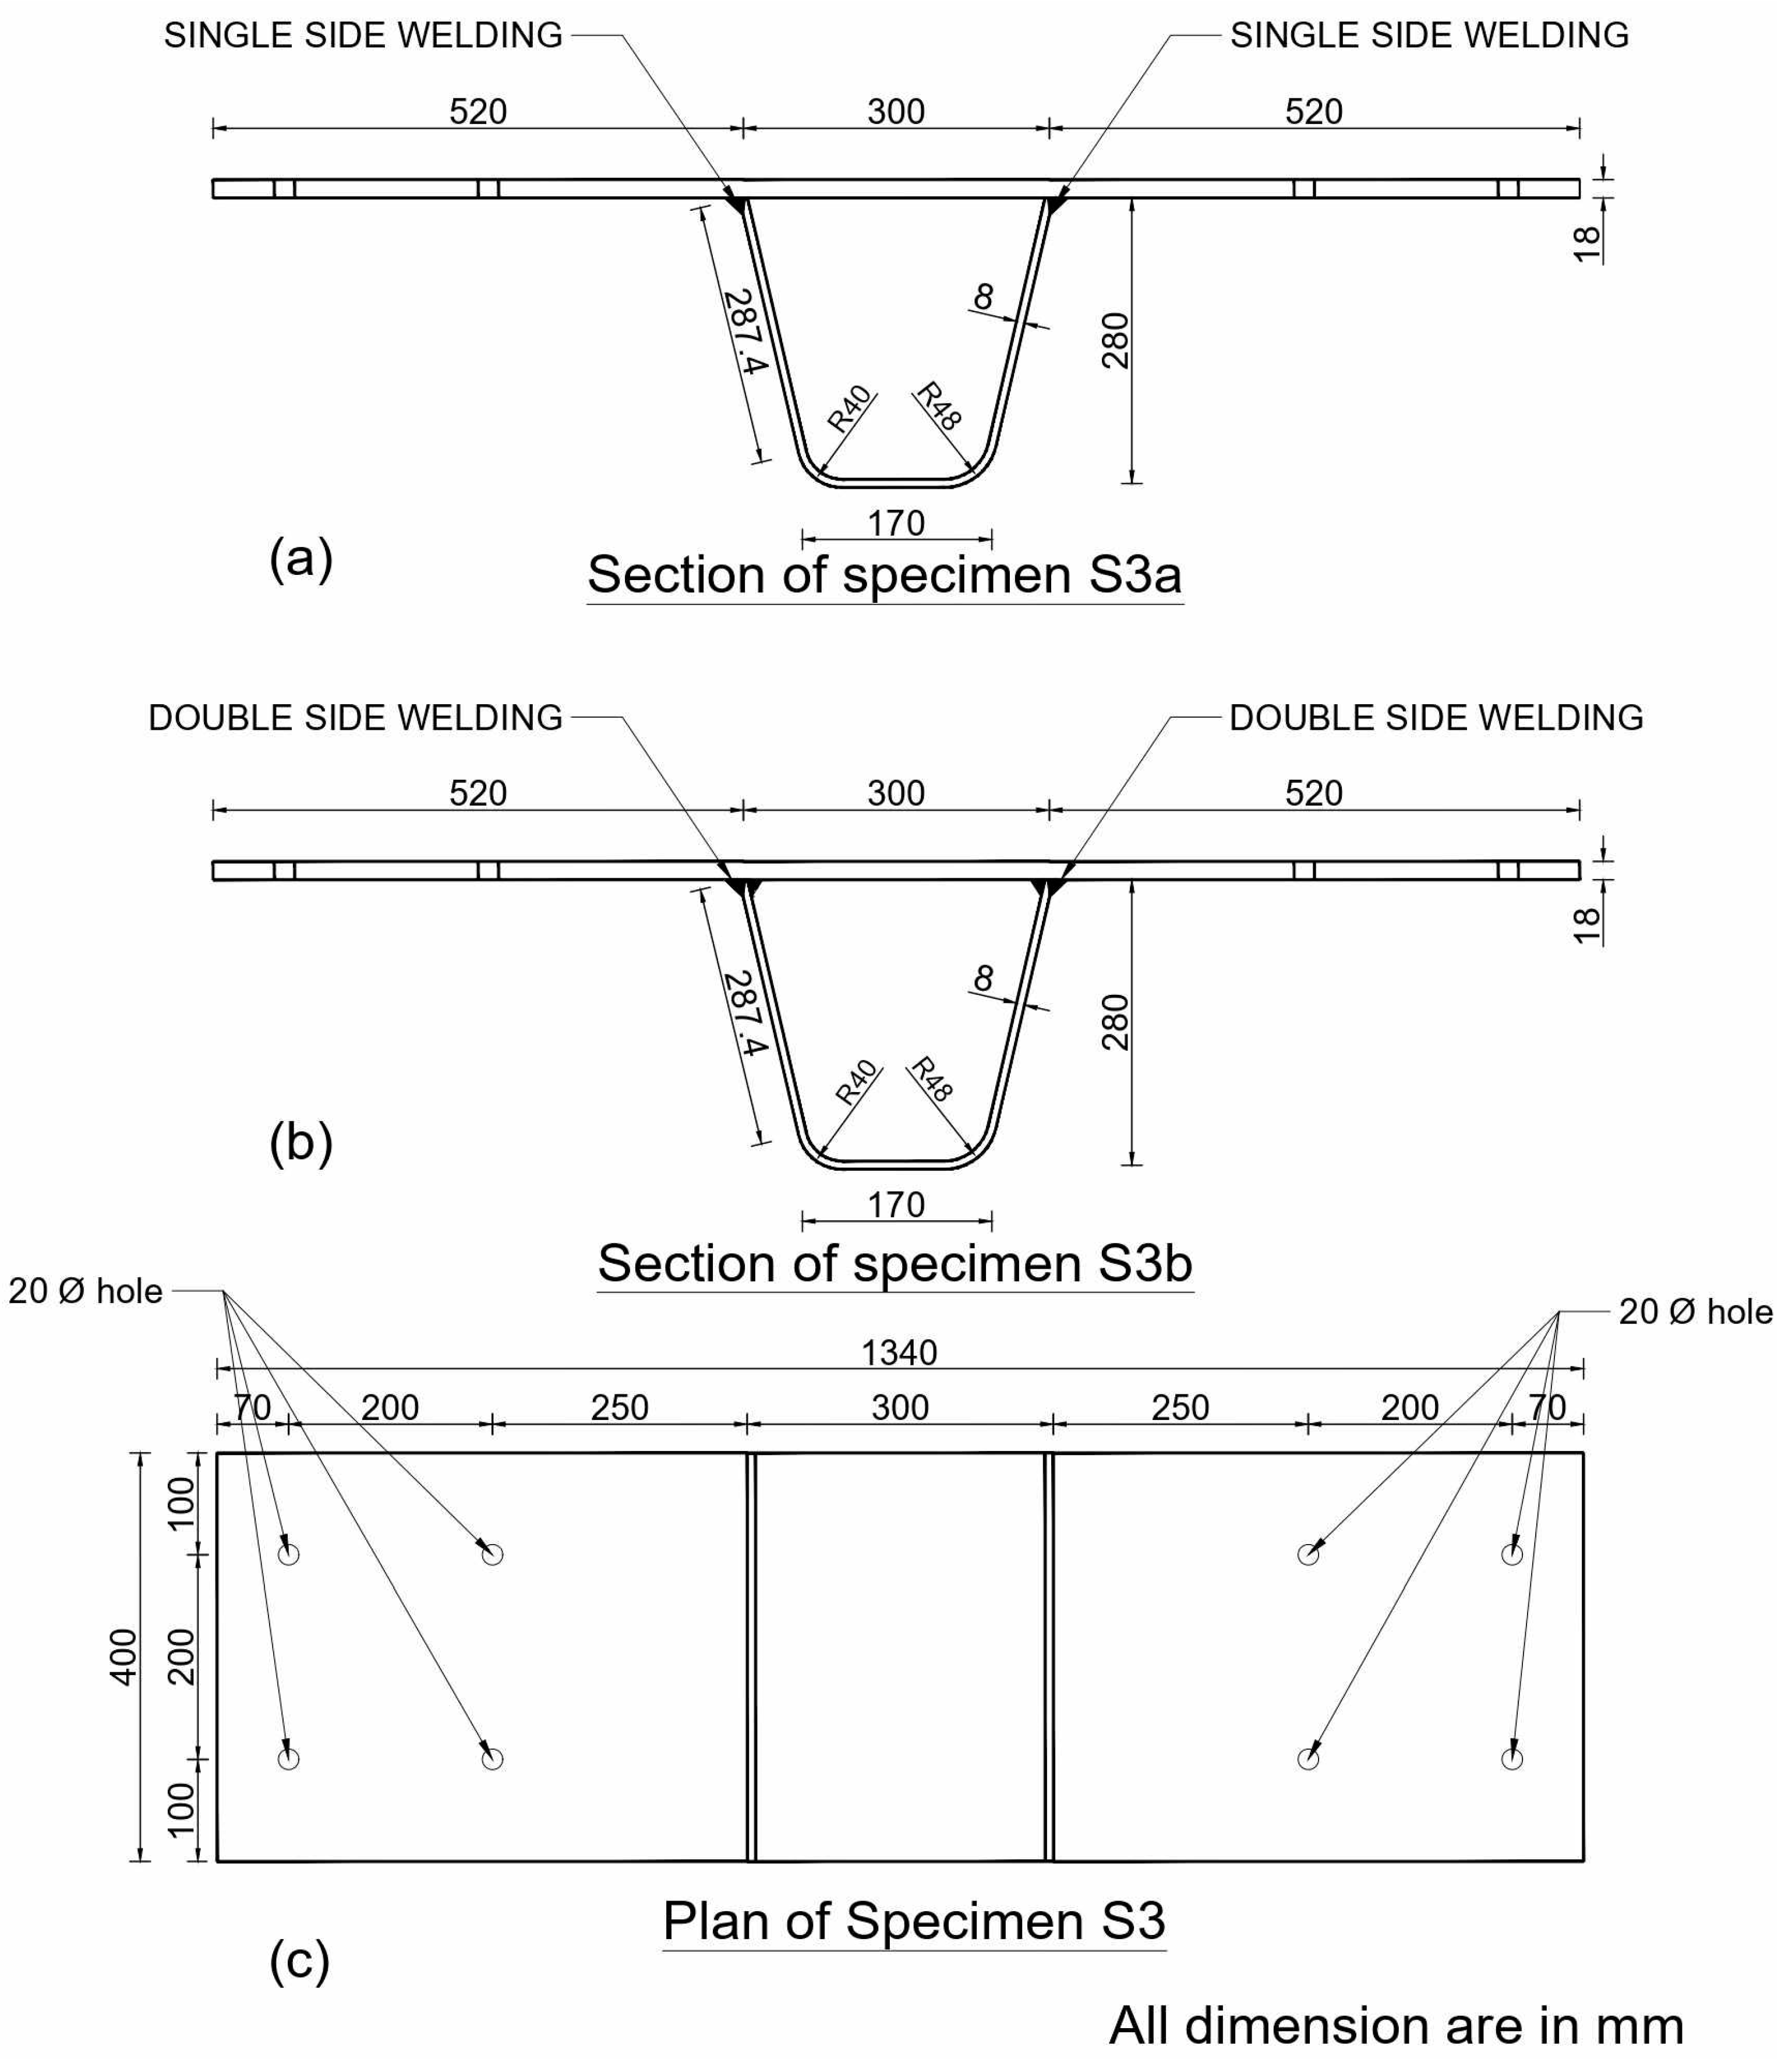
The small models prepared for simulations are shown in Figure 1 and Figure 2. All the dimensions in these figures are in millimeters. The test specimens were divided into two categories—double ribbed specimens and single ribbed specimens. The reason for simulating small test models is to save time for parametric analysis. In Figure 1, S2a is a double-ribbed single welded model, and S2b is a double-ribbed double-welded specimen. In Figure 2, S3a is a single-ribbed single-welded specimen; S3b is a single-ribbed double-welded specimen. The single weld connection was modeled considering 80 percent weld penetration. In the models, the four holes on each side of the ribs are shown to show the boundary condition, as shown in Figure 3.
2.2. Modeling in ABAQUS
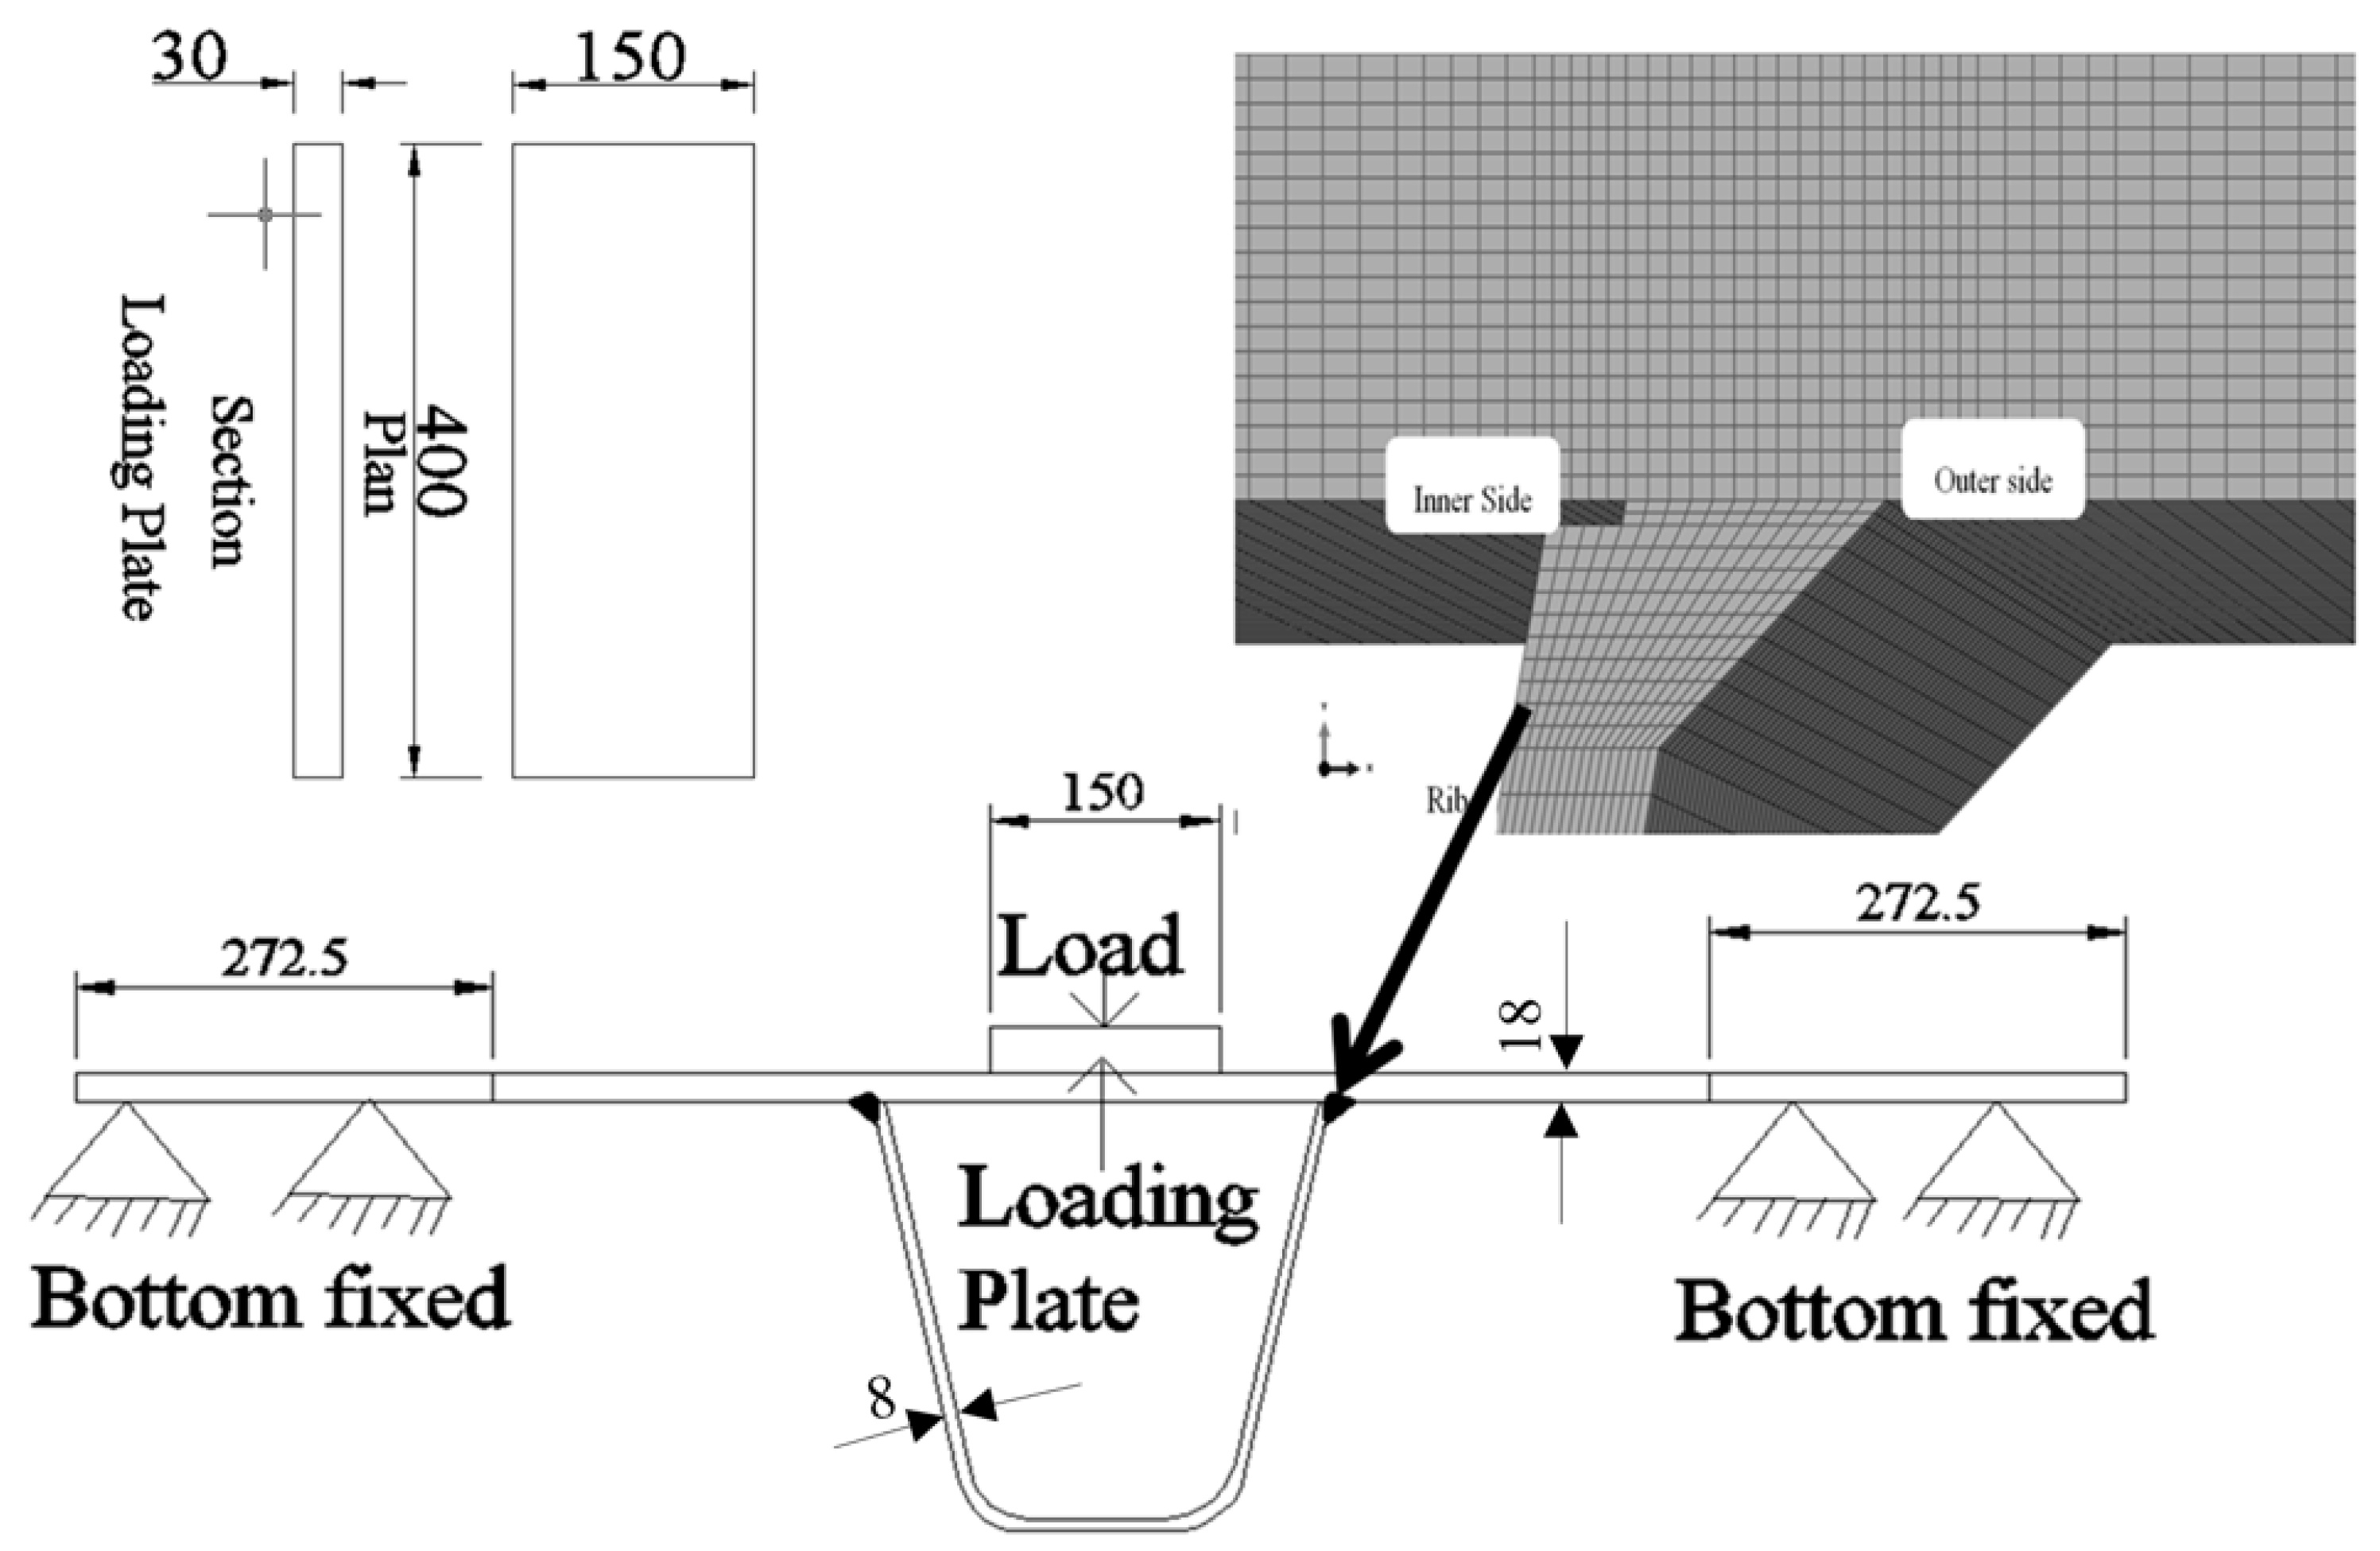
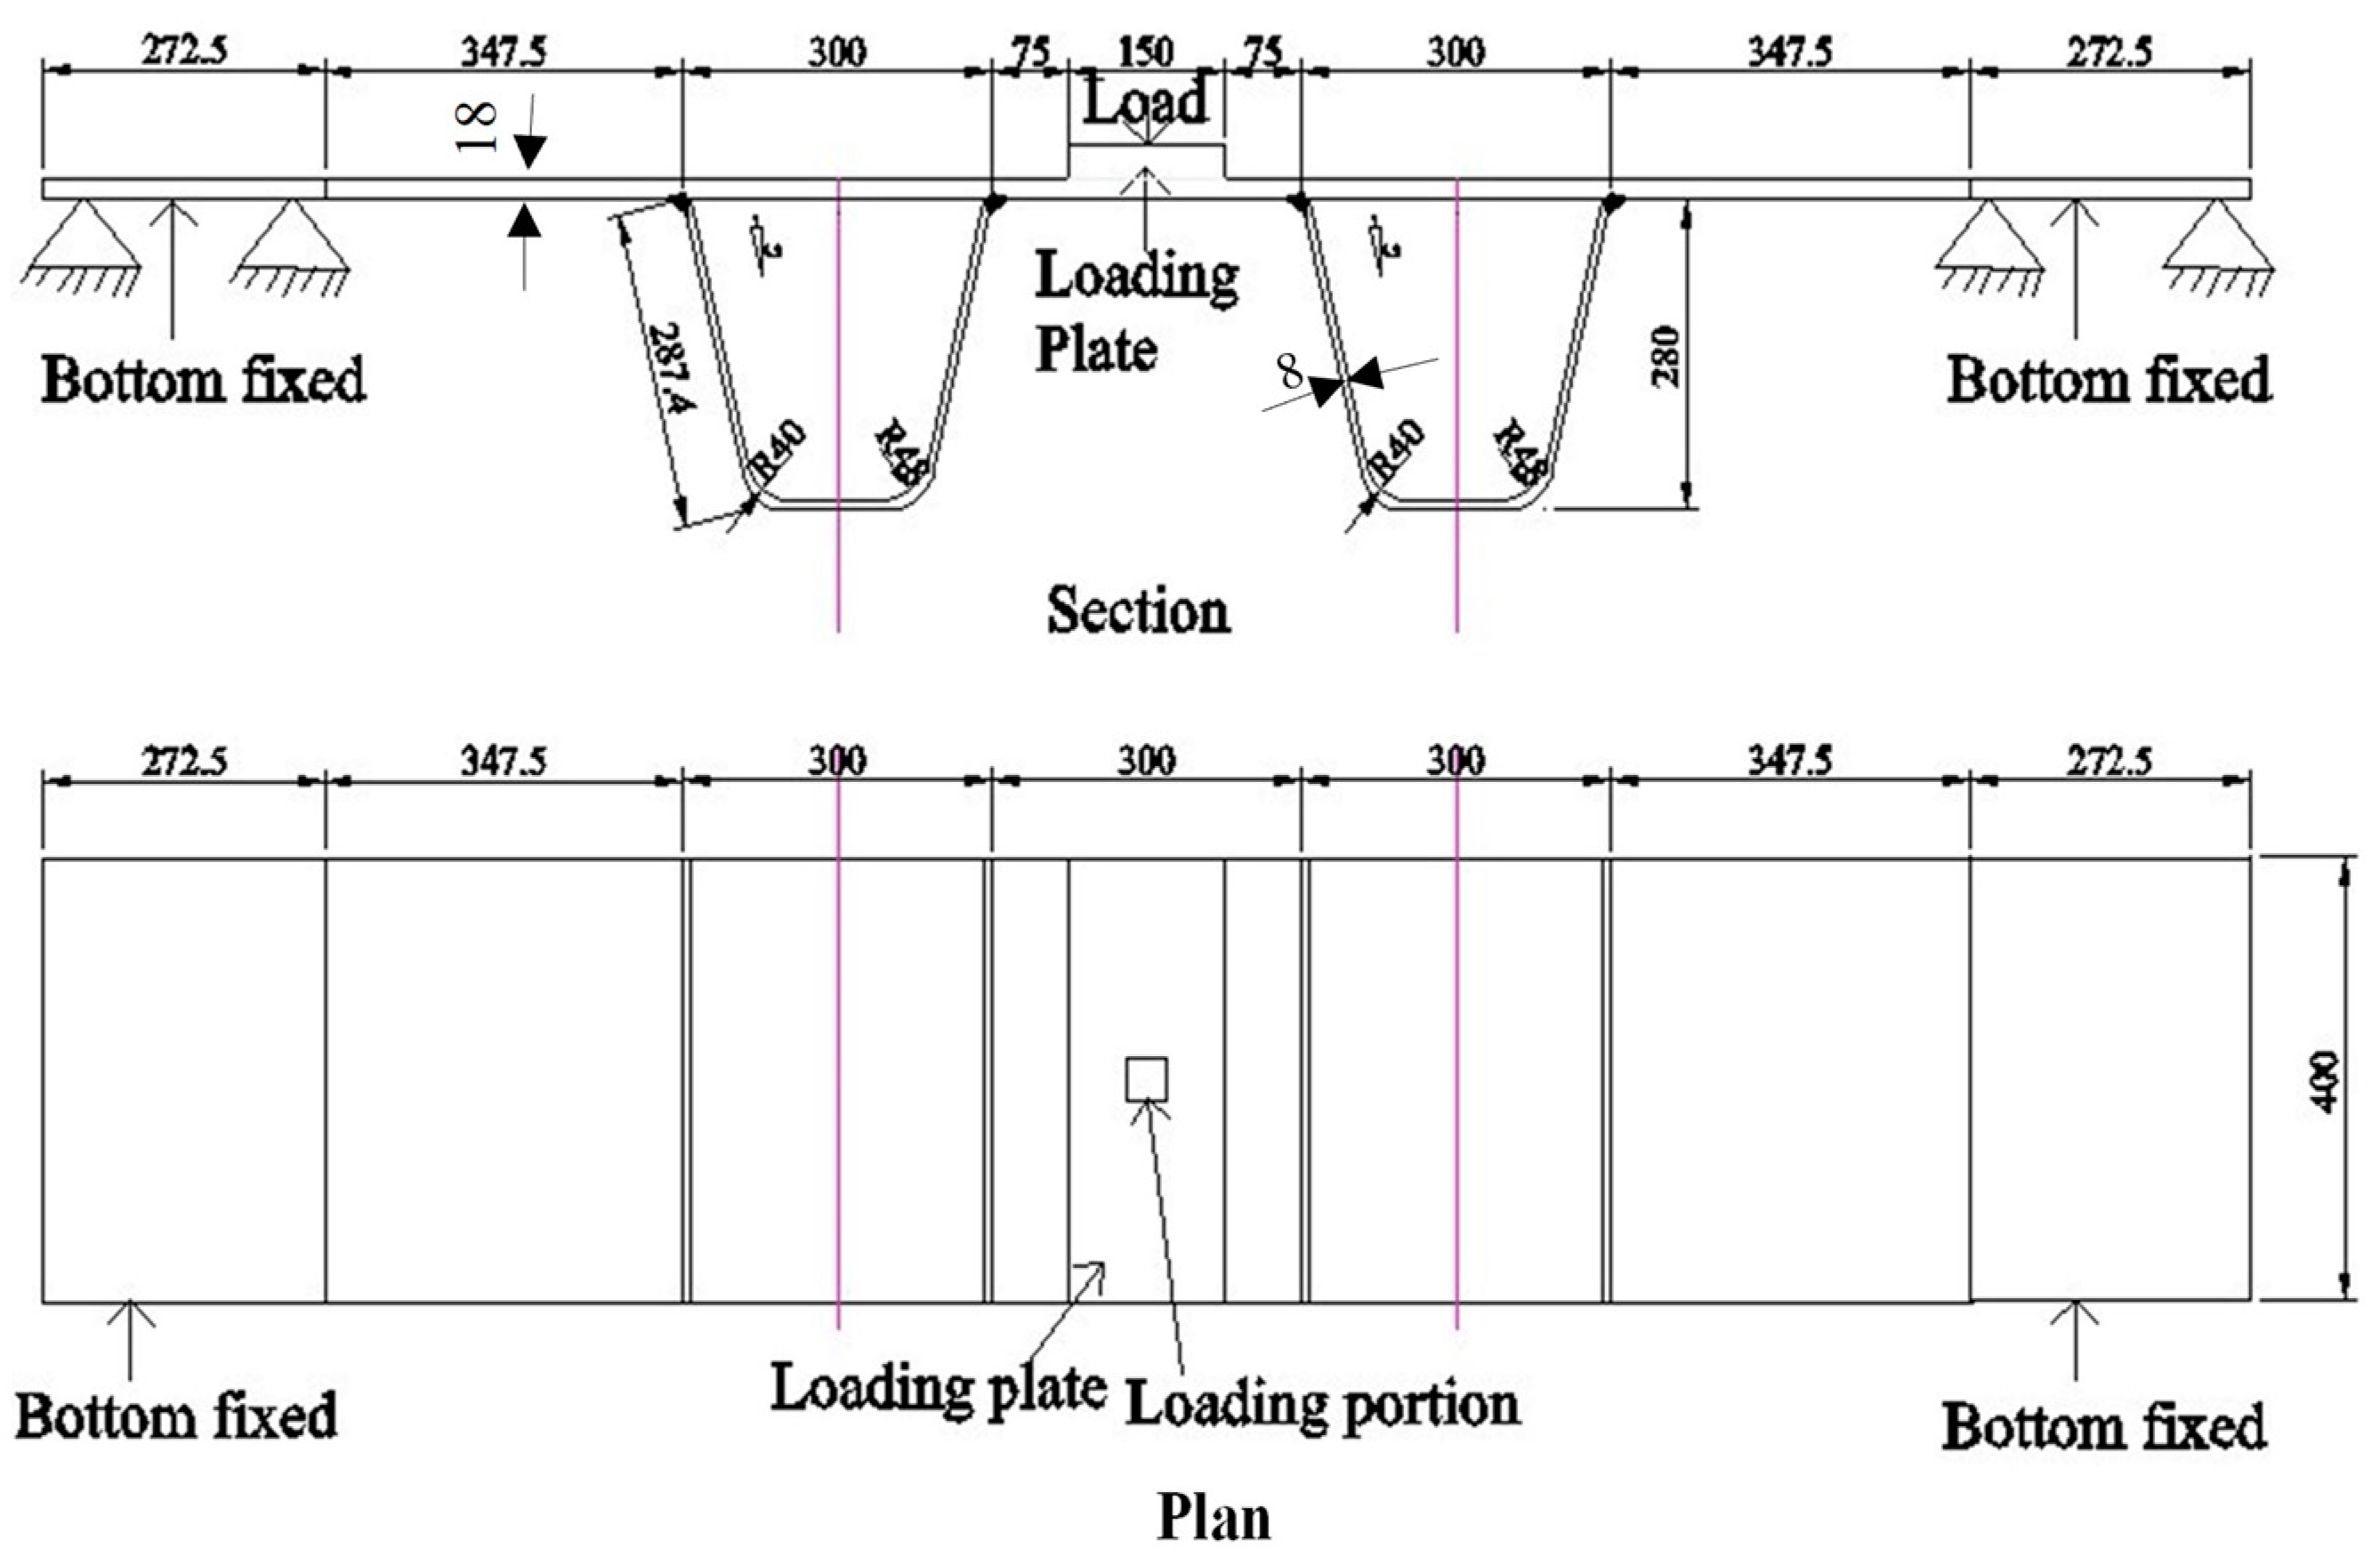
An elastic modulus of 2.1 GPa and Poisson ratio of 0.3 were assigned to all specimens. The meshing was carried out according to IIW [25] guidelines. The mesh element is a structured C3D8 [26] type. Loads of 5 kN to 40 kN were applied in intervals of 5 kN on the surface of the loading plate, which was placed in the middle portion of the specimens. The load was applied in the form of point load, creating a coupling constraint 10 cm above the loading plate and creating a coupling surface of 75 × 75 mm2 in the middle. The loading plate was tied to the specimen surface creating constraint to all degrees of freedom. A fixed boundary condition was created on the lower surface of the deck from both edges to 272.5 mm, as shown in Figure 4. The name of stress components are expressed as per the output given by ABAQUS Version 6.12 [26] throughout the paper except when mentioned otherwise.
2.2.1. Double-Ribbed (S2) Specimens
2.2.2. Single-Ribbed (S3) Specimens
For S3 specimens, analysis was performed at 45 kN load. The maximum values of stresses at root and toe are given in Table 2.
The profile of maximum principal stress in the weld starting from the point at a point in the deck to point in the rib is shown in Figure 5.
The stress profile above demonstrates that stress concentration is much higher at weld toe in deck than weld toe in rib. The stress concentrated by double welds is higher than single weld at weld toe at deck. The stress concentrated by double weld is less than stress concentrated by single weld at weld toe at rib.
3. Parametric Analysis
For parametric analysis, forty-two simulations were conducted. The effect of weld penetration, deck thickness, and rib thickness and the combined effect of deck thickness, rib thickness, with single and double weld connections were analyzed.
3.1. Effect of Weld Penetration
To analyze the effect of a weld, the single-ribbed specimen S3 was simulated applying 25 kN load. The results are tabulated in Table 3.
From Table 3, it can be seen that hot spot stress goes on increasing with the increase in weld penetration. The stress concentration at the root seems to increase with the increase in weld penetration from 50 to 80%. From an 80 to 100% increase in weld penetration the stress concentration increase very negligibly which may be because of an increase in contact angle [17]. The stress concentration at the inner toe of double weld seems less for 100% weld because of farther distance from load.
3.2. Effect of Deck Thickness
To analyze the effect of deck thickness, five models were prepared with deck thickness of 20 mm, 18 mm, 16 mm, 14 mm, and 12 mm. The models were similar to S2a specimens with weld penetration of 50% and loading of 25 kN. The maximum stress values at the weld toe in deck and rib are tabulated in Table 4.
3.3. Combined Effect of Weld, Deck Thickness and Rib Thickness
For this analysis, S2a and S2b were simulated in combination with different deck thickness and rib thickness. The single weld was modeled 100% penetrated. A total of 25 kN load was applied to each of the models. Hot spot stress was calculated by using the 1 mm stress method [28]. The results are tabulated in Table 5 and Table 6.
- DT is the deck thickness in millimeter.
- RT is the rib thickness in millimeter.
- WS is the welded sides; 2 means double welded and 1 means single welded.
- Δσw is the stress difference between double and single weld.
- Δσr is the stress difference between 8 mm and 6 mm rib thickness.
- Δσd4 is the stress increase with each 4 mm decrease in deck thickness.
- Δσd2 is the stress increase with each 2 mm decrease in deck thickness.
- Δd is the decrease in deck thickness, keeping 18 mm as reference deck thickness.
- Δσ is the increase in stress keeping the stress at 18 mm deck thickness as reference stress.

Table 6.
Hot spot stress in rib at weld toe.
| Thickness of | Welded Side | σhs | Δσ (%) | Δσr (%) | |
|---|---|---|---|---|---|
| Deck (mm) | Rib (mm) | ||||
| 18 | 8 | 2 | 46.30 | 7.80 | 30.50 |
| 18 | 8 | 1 | 49.91 | 29.74 | |
| 18 | 6 | 2 | 35.48 | 8.43 | |
| 18 | 6 | 1 | 38.47 | ||
| 16 | 8 | 2 | 59.41 | 13.21 | 34.47 |
| 16 | 8 | 1 | 67.26 | 29.65 | |
| 16 | 6 | 2 | 44.18 | 17.43 | |
| 16 | 6 | 1 | 51.88 | ||
| 14 | 8 | 2 | 76.15 | 13.28 | 36.59 |
| 14 | 8 | 1 | 86.26 | 34.15 | |
| 14 | 6 | 2 | 55.75 | 15.34 | |
| 14 | 6 | 1 | 64.30 | ||
| 12 | 8 | 2 | 121.28 | 9.51 | 24.02 |
| 12 | 8 | 1 | 132.81 | 22.95 | |
| 12 | 6 | 2 | 97.79 | 10.46 | |
| 12 | 6 | 1 | 108.02 | ||
- σhs is the hotspot stress at the weld.
- Δσ is the percentage higher stress value in the single weld with reference to double weld.
- Δσr is the percentage higher stress in 8 mm ribbed specimens with reference to 6 mm ribbed specimens, taking all other parameters as constant.
Table 6 demonstrates that the stress concentration at the toe in the rib is higher in case of a single-welded connection, but the stress is much lower than at the weld toe in deck in Table 5, where the stress concentration due to double welds is higher than the stress concentration due to a single weld, so the failure is more likely to occur at the deck than at the rib. Similarly, the stress concentrated by 8 mm ribs is always higher than stress concentrated by the 6 mm rib, as shown in Table 5 and Table 6.
4. Simulations of Models Similar to Field Structures
Obviously, the magnitude of concentrated stress depends on the magnitude of applied load and the size of the structure (i.e., dimension of the structure); but the pattern of stress concentration can be analyzed even with the models smaller than the actual structures in the field [17,24]. The accuracy of FEM results depends on the mesh size. The finer the mesh is the higher the accuracy obtained. In this study, the mesh size applied in FEM modeling was as small as 1 mm; therefore, it was extremely cumbersome to run the large models as in the real field with the mesh size employed. Therefore, models from 1 m to 3 m length were prepared in this section; however, the loading pattern and boundary conditions were similar to the real world structures.
4.1. Single Ribbed Model
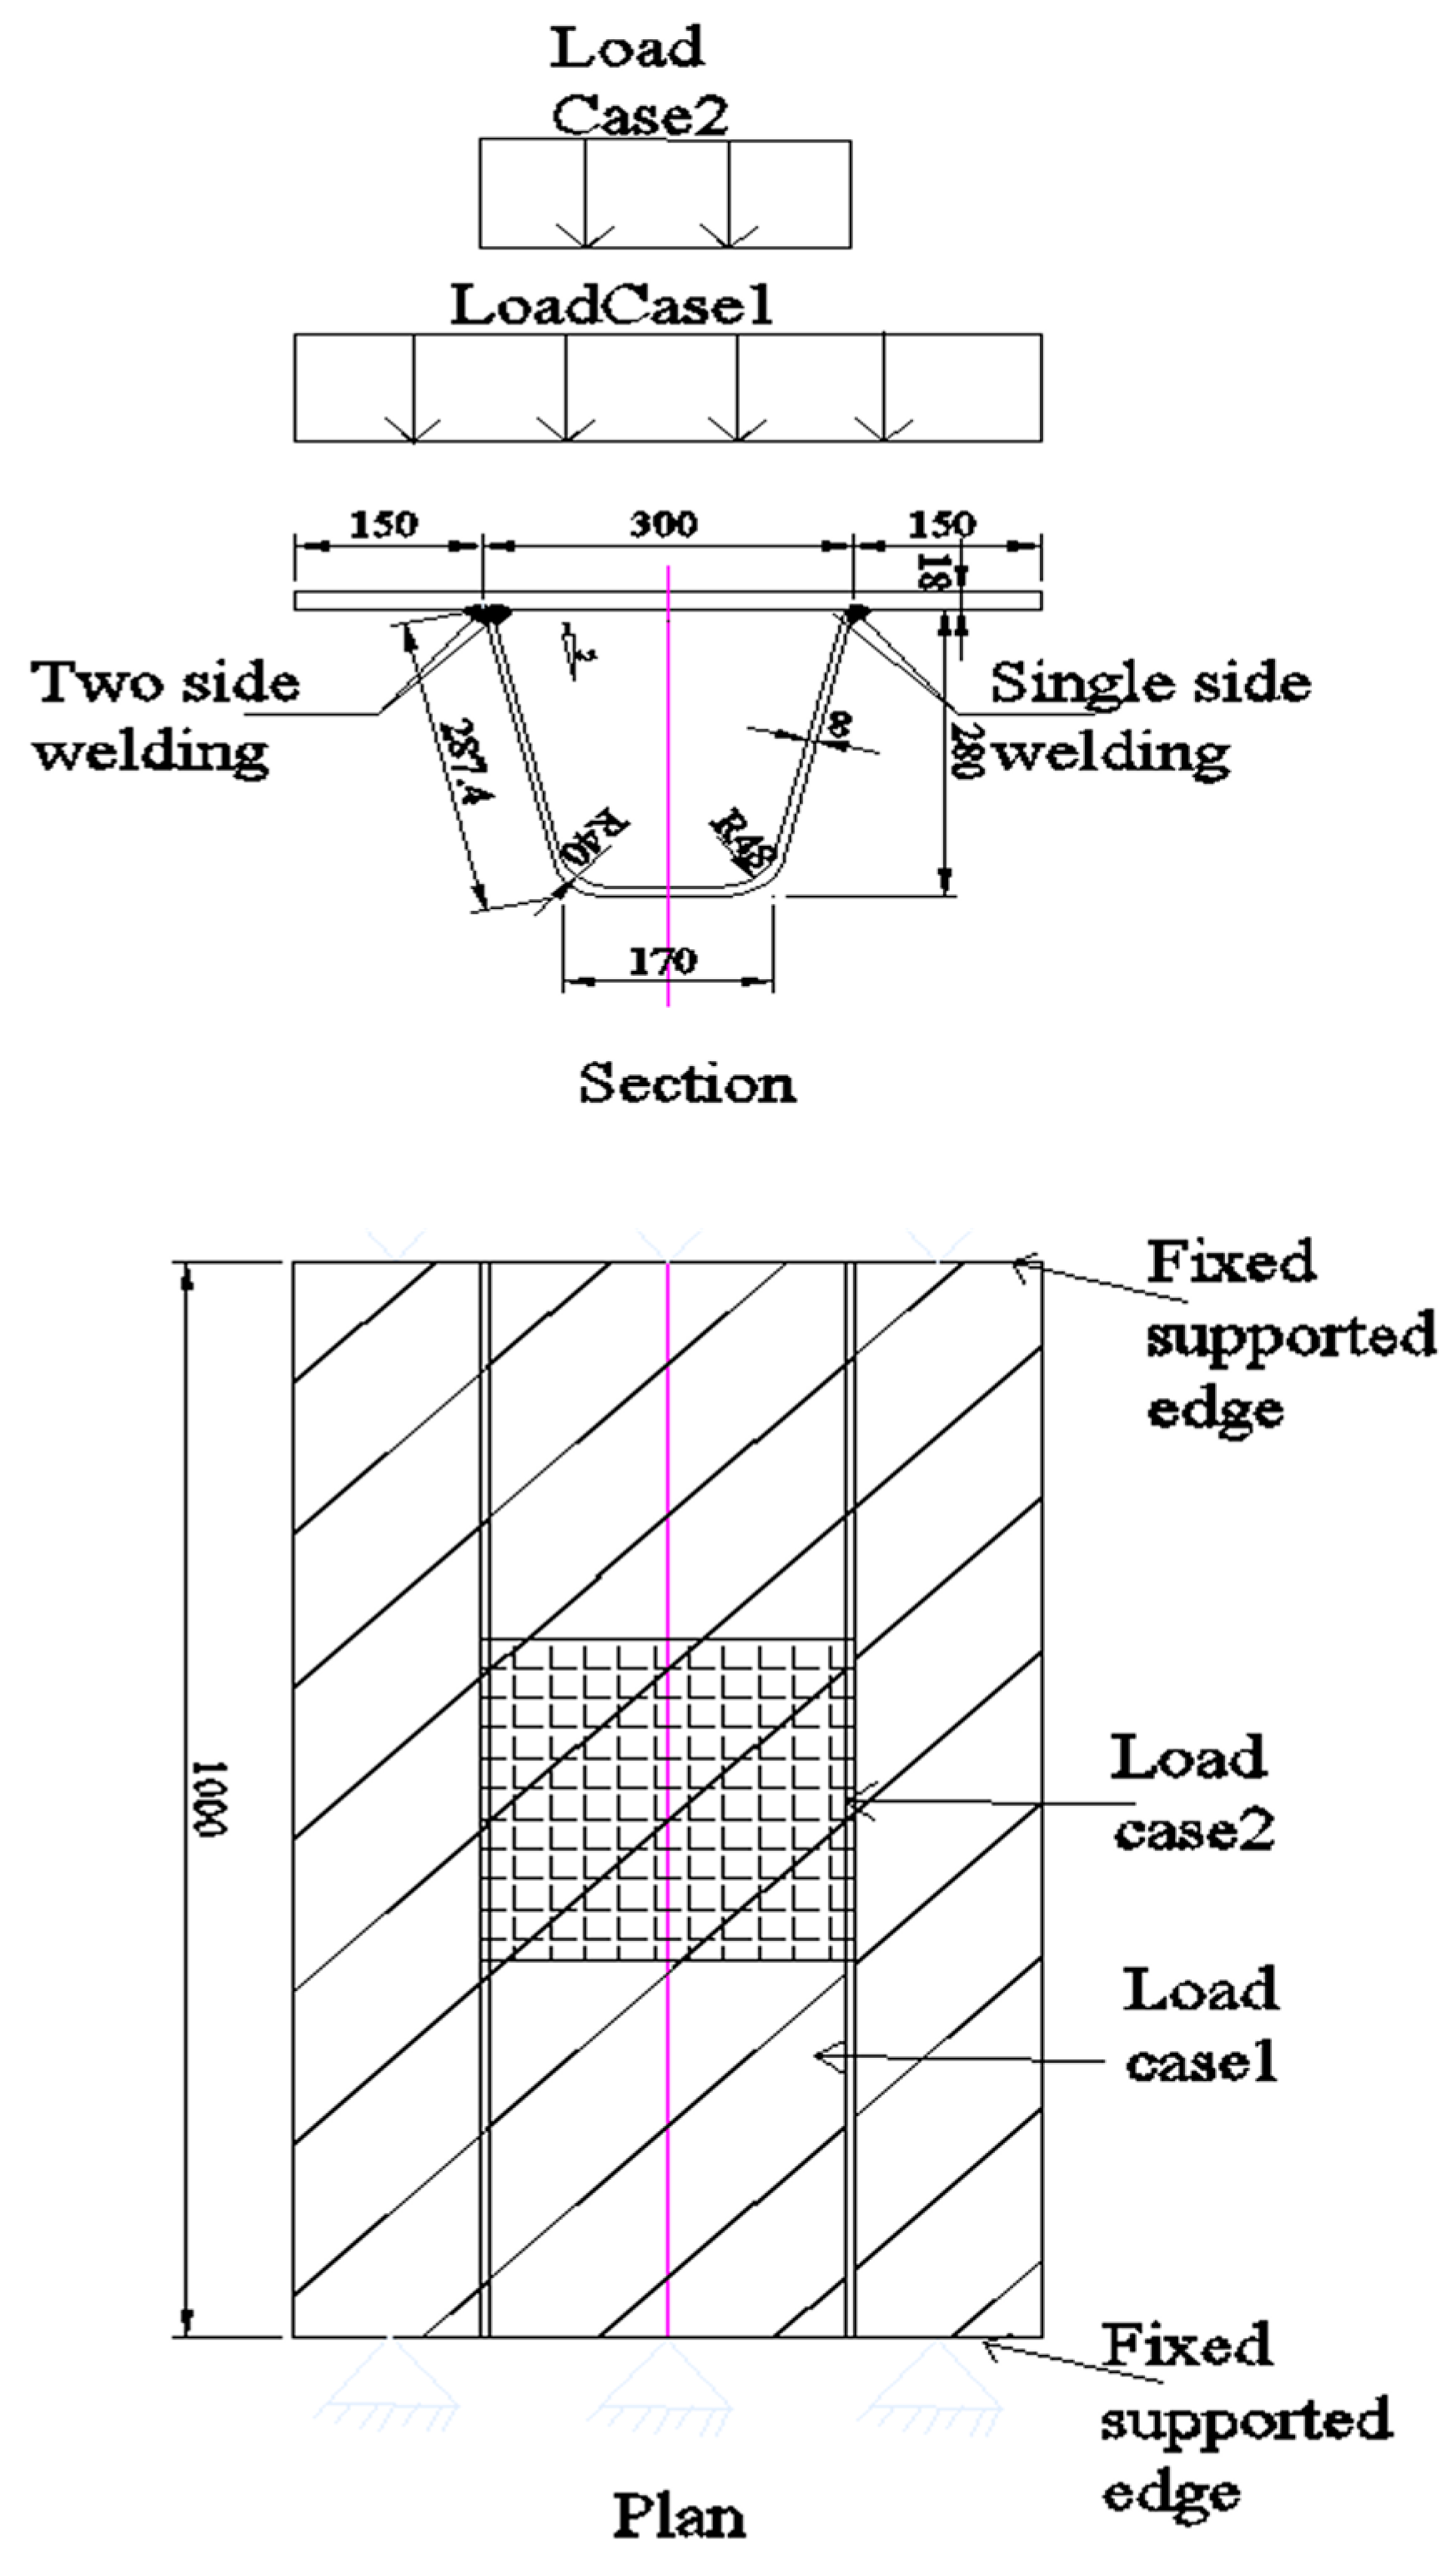
The length of the model was 1 m and the width was 0.6 m, and a rib was placed at the center along the longitudinal direction, as presented in Figure 6. The rib and deck thicknesses were 18 mm and 8 mm, respectively. Among the two legs of rib, one was connected with double weld and the other was connected with a single weld of 80% penetration. The reason for choosing this model is that the model can give the idea of stress produced within the rib and outside of the rib when the wheel of the vehicle is in between the two legs of the closed ribs. Load case 1 was 30 kN, which was uniformly distributed throughout the surface of the deck as pressure, and load case 2 was 50 kN, distributed in the middle portion of area 0.3 × 0.3 square meters, as presented in Figure 6.
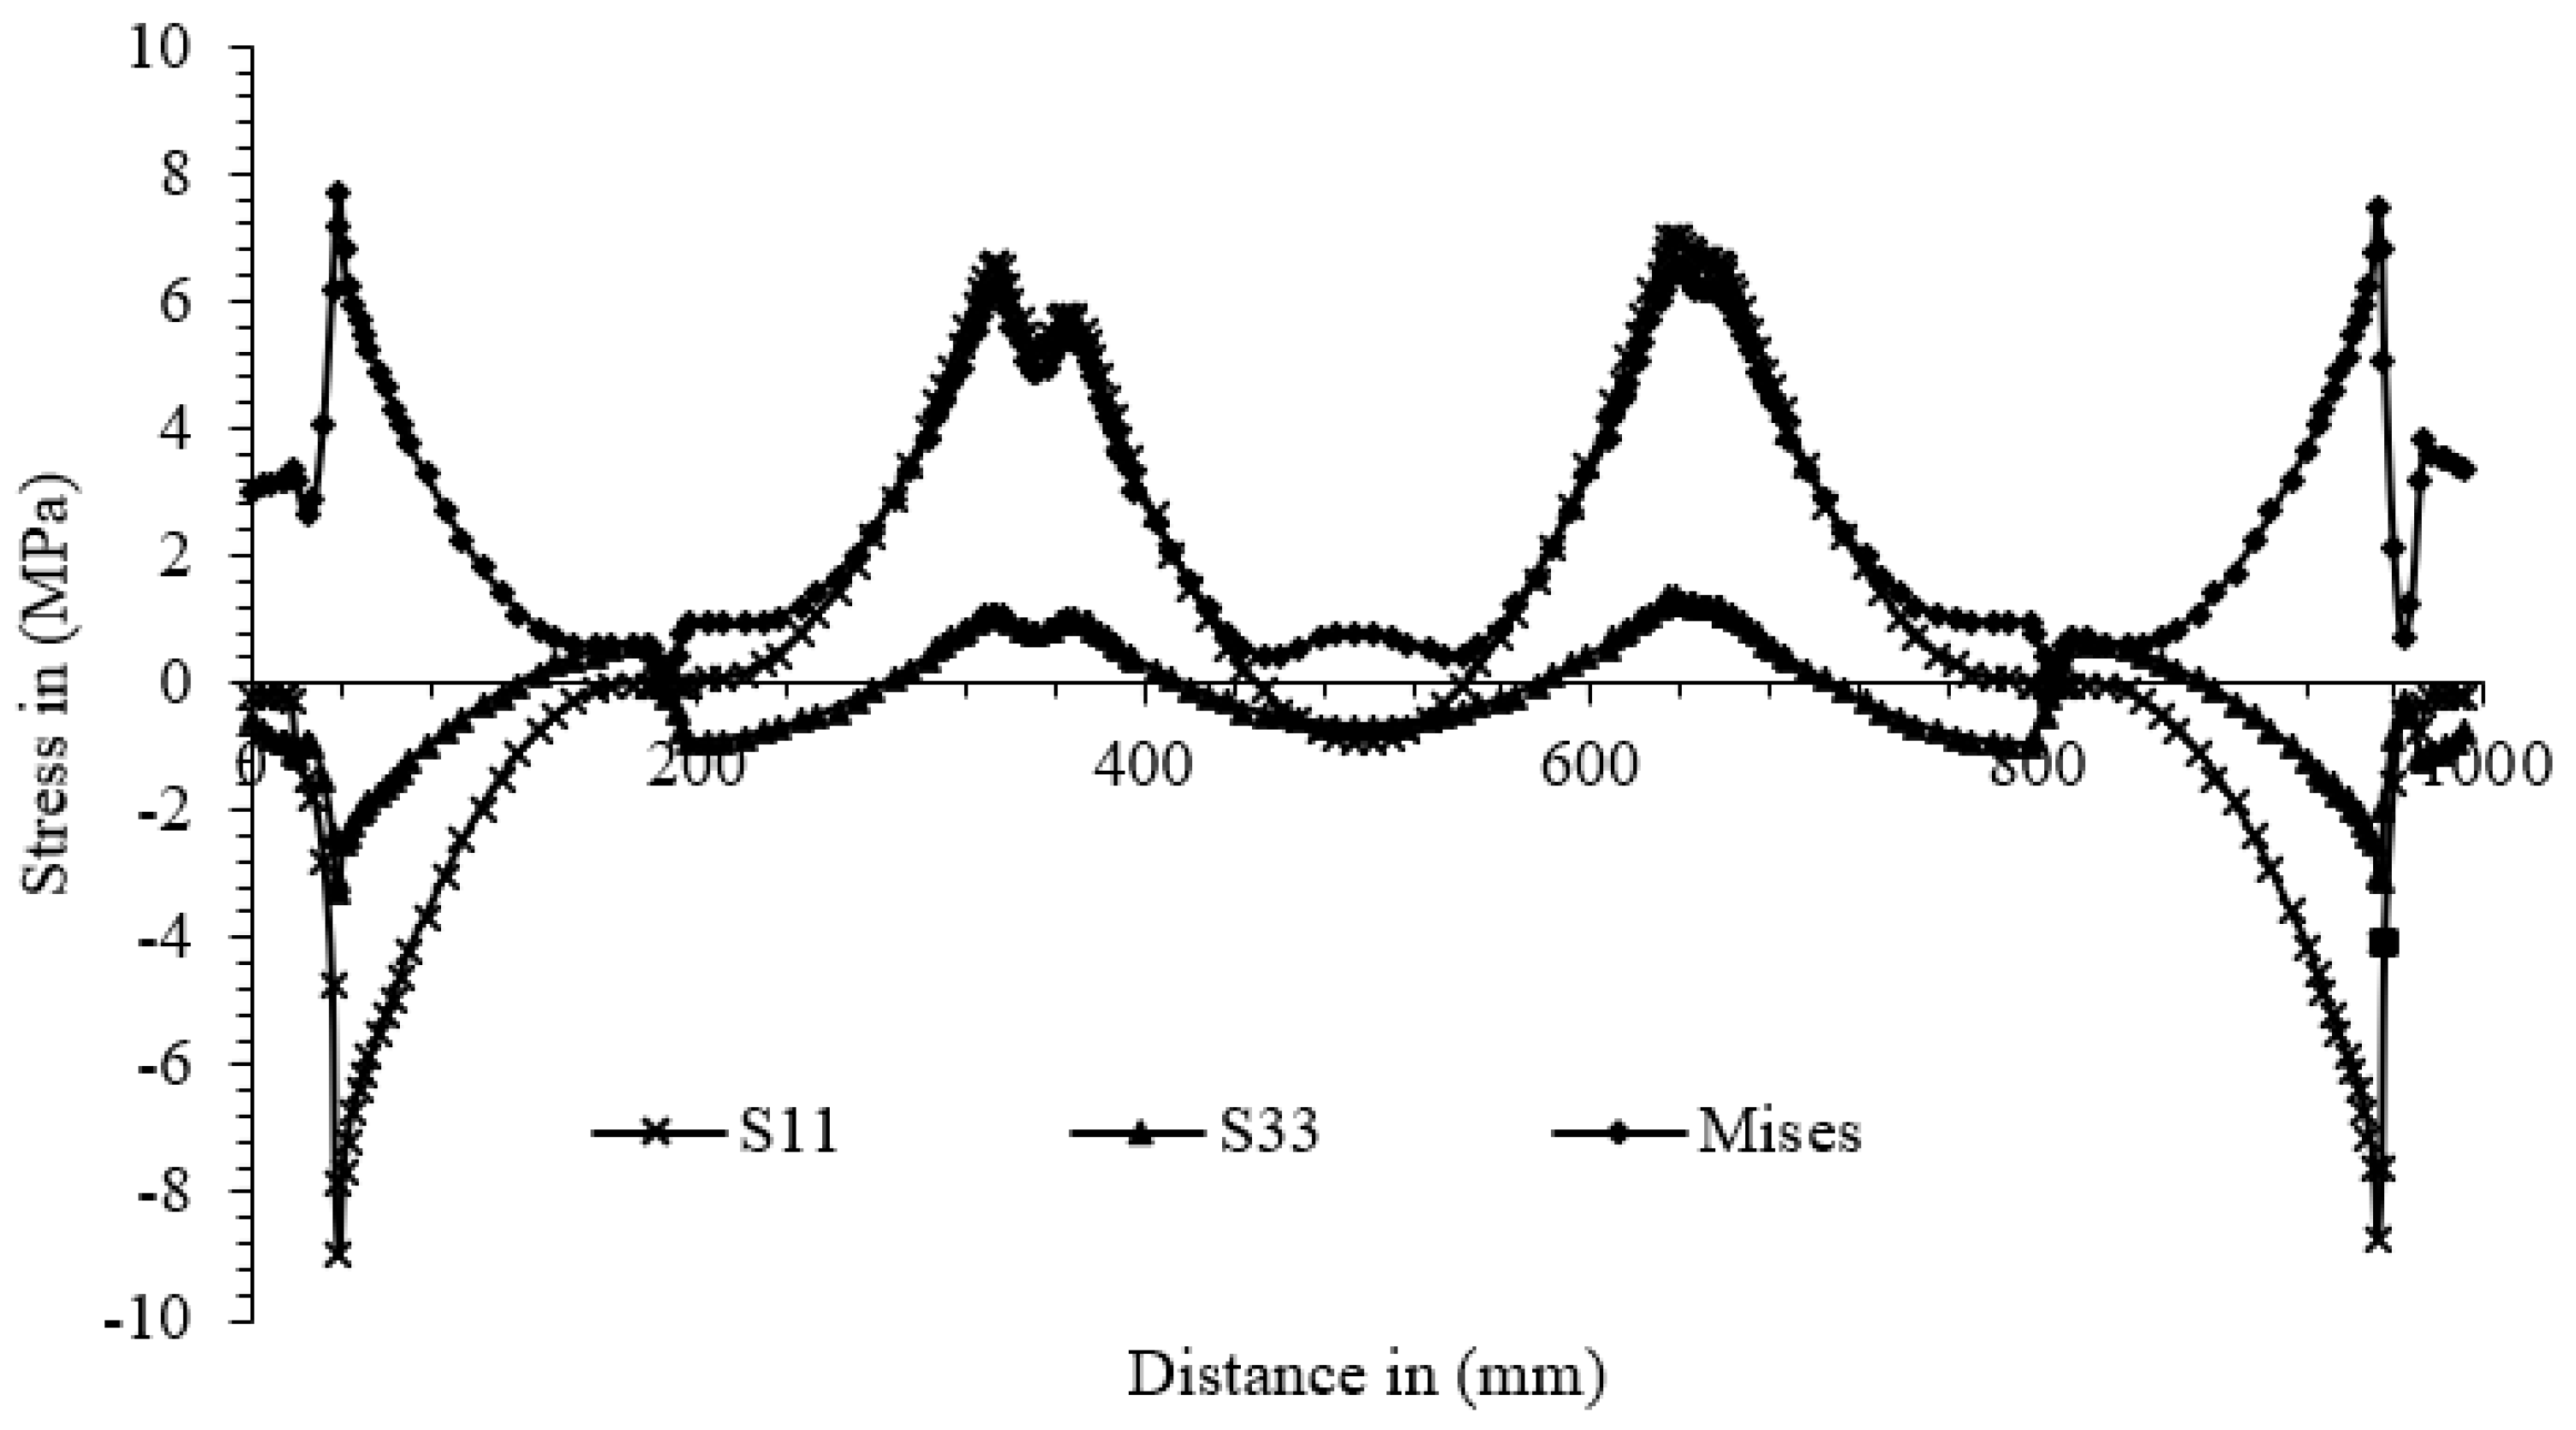
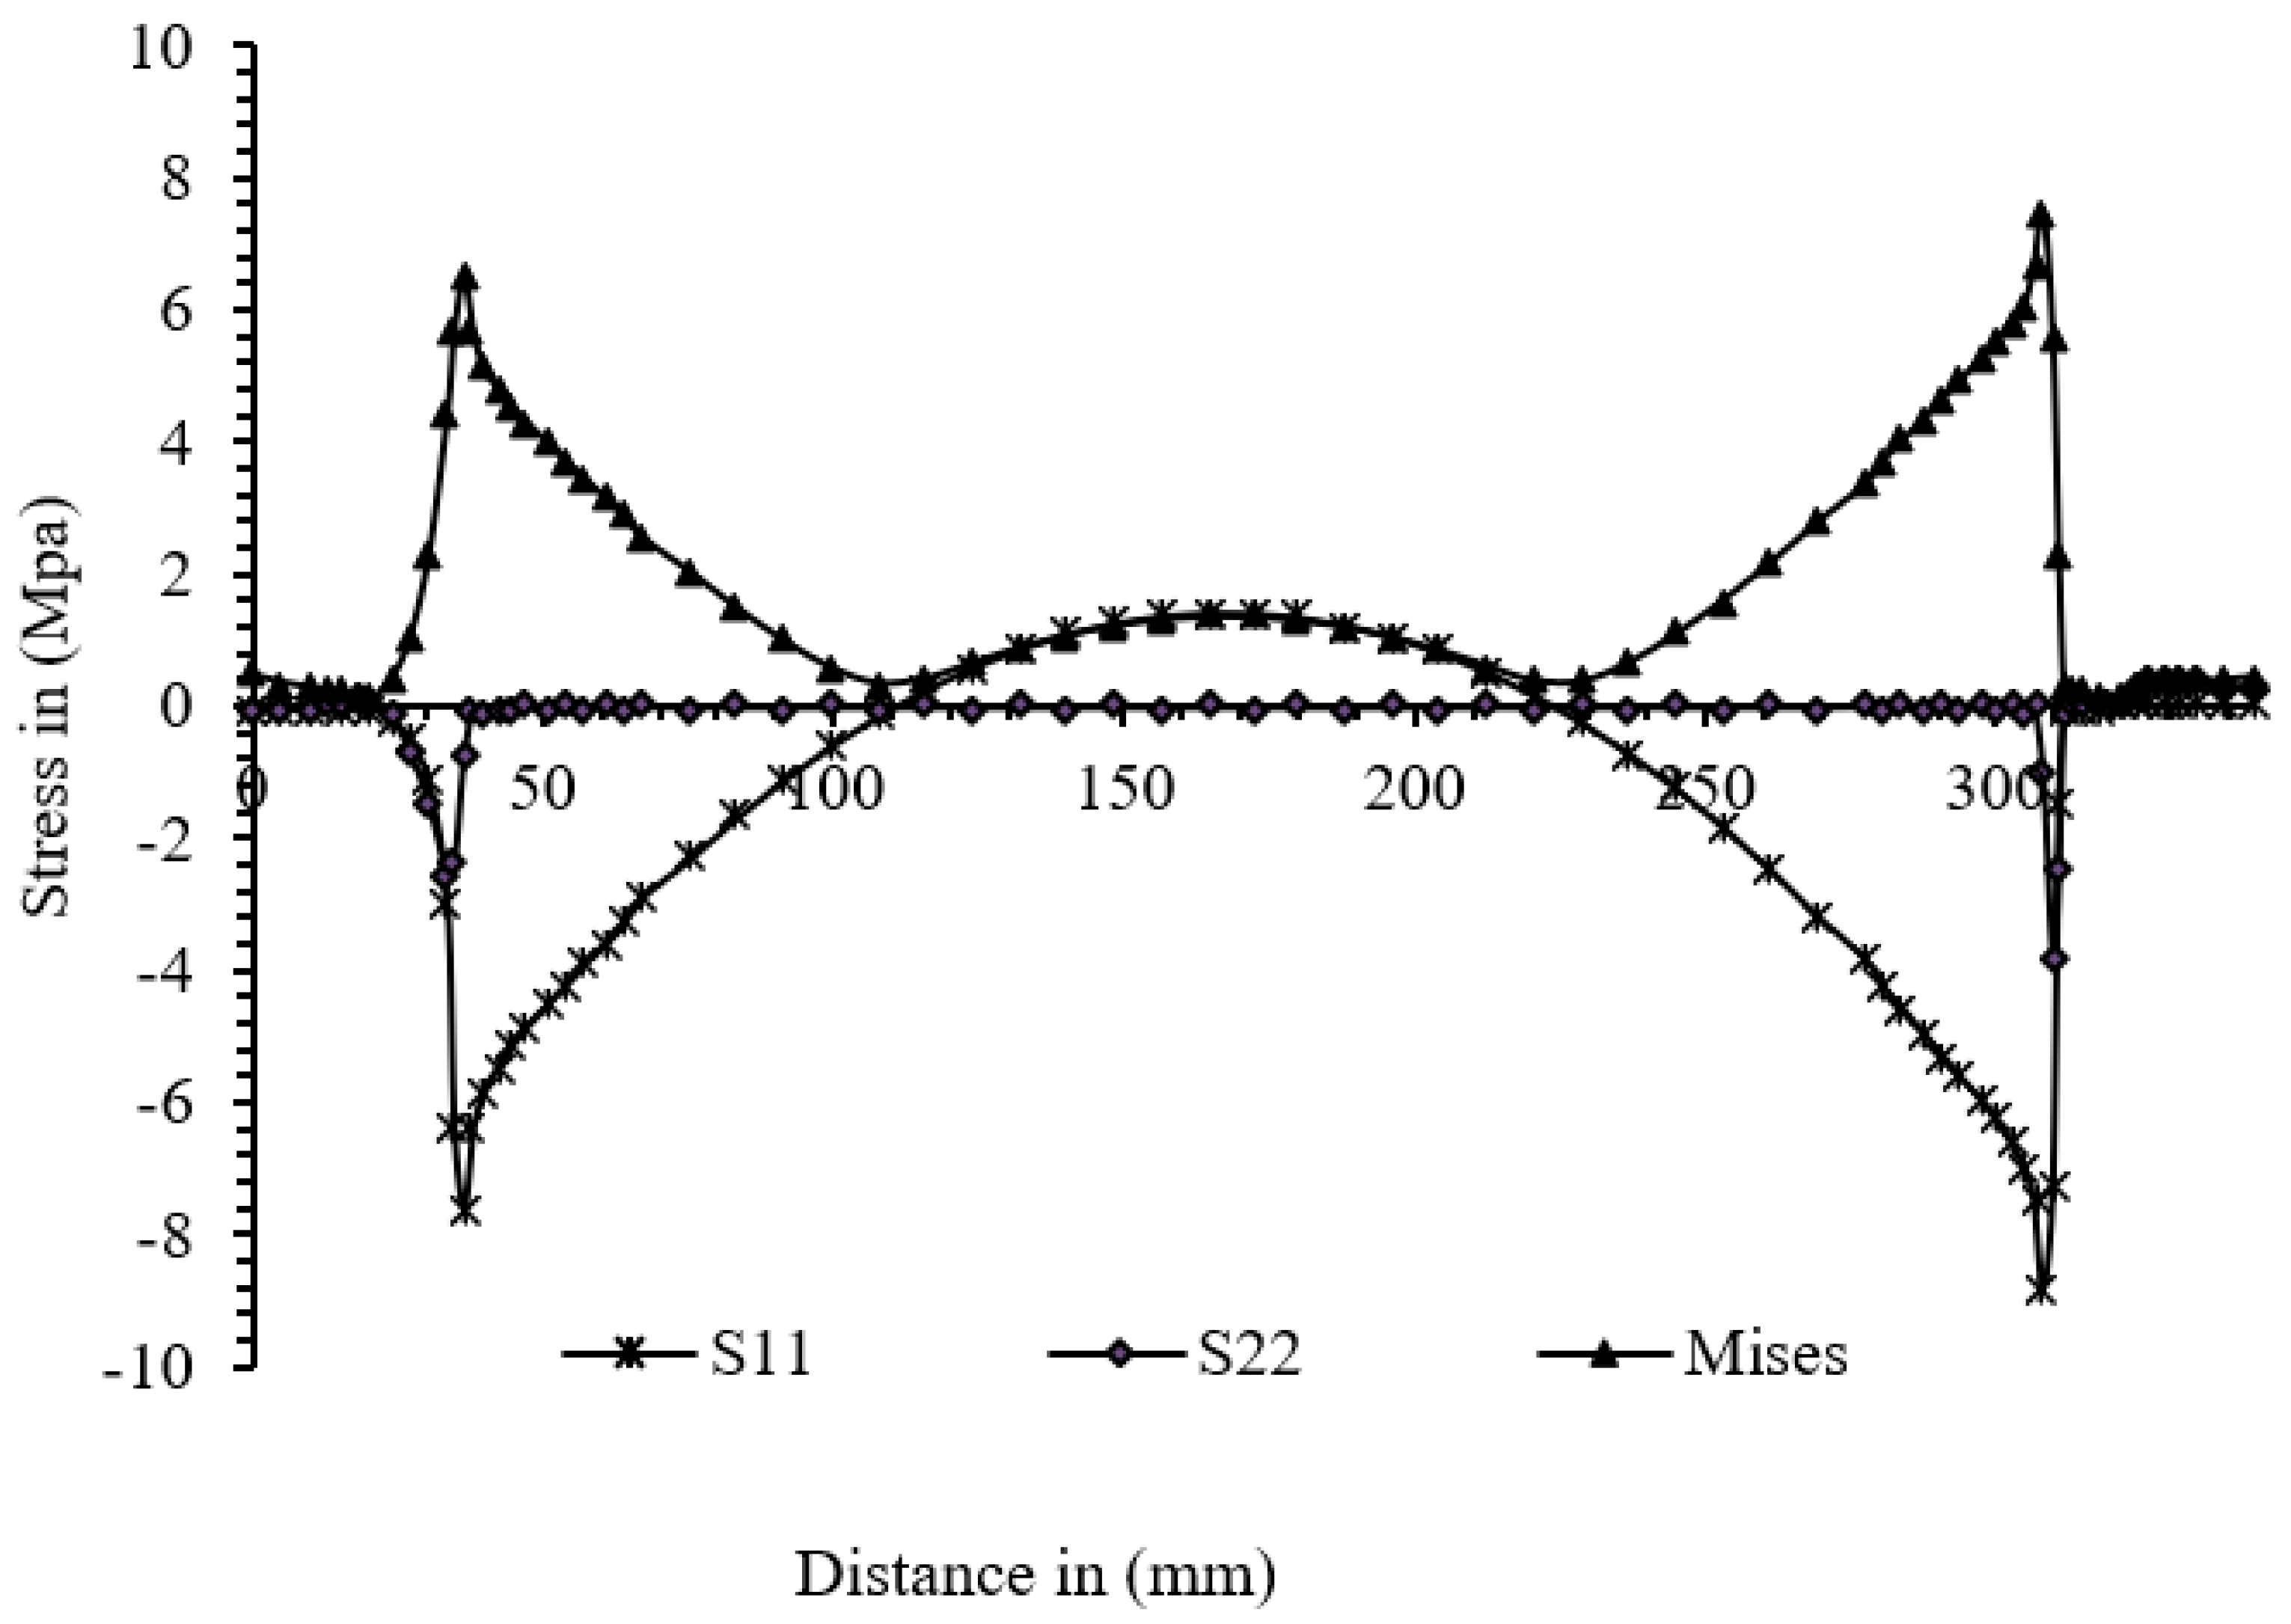
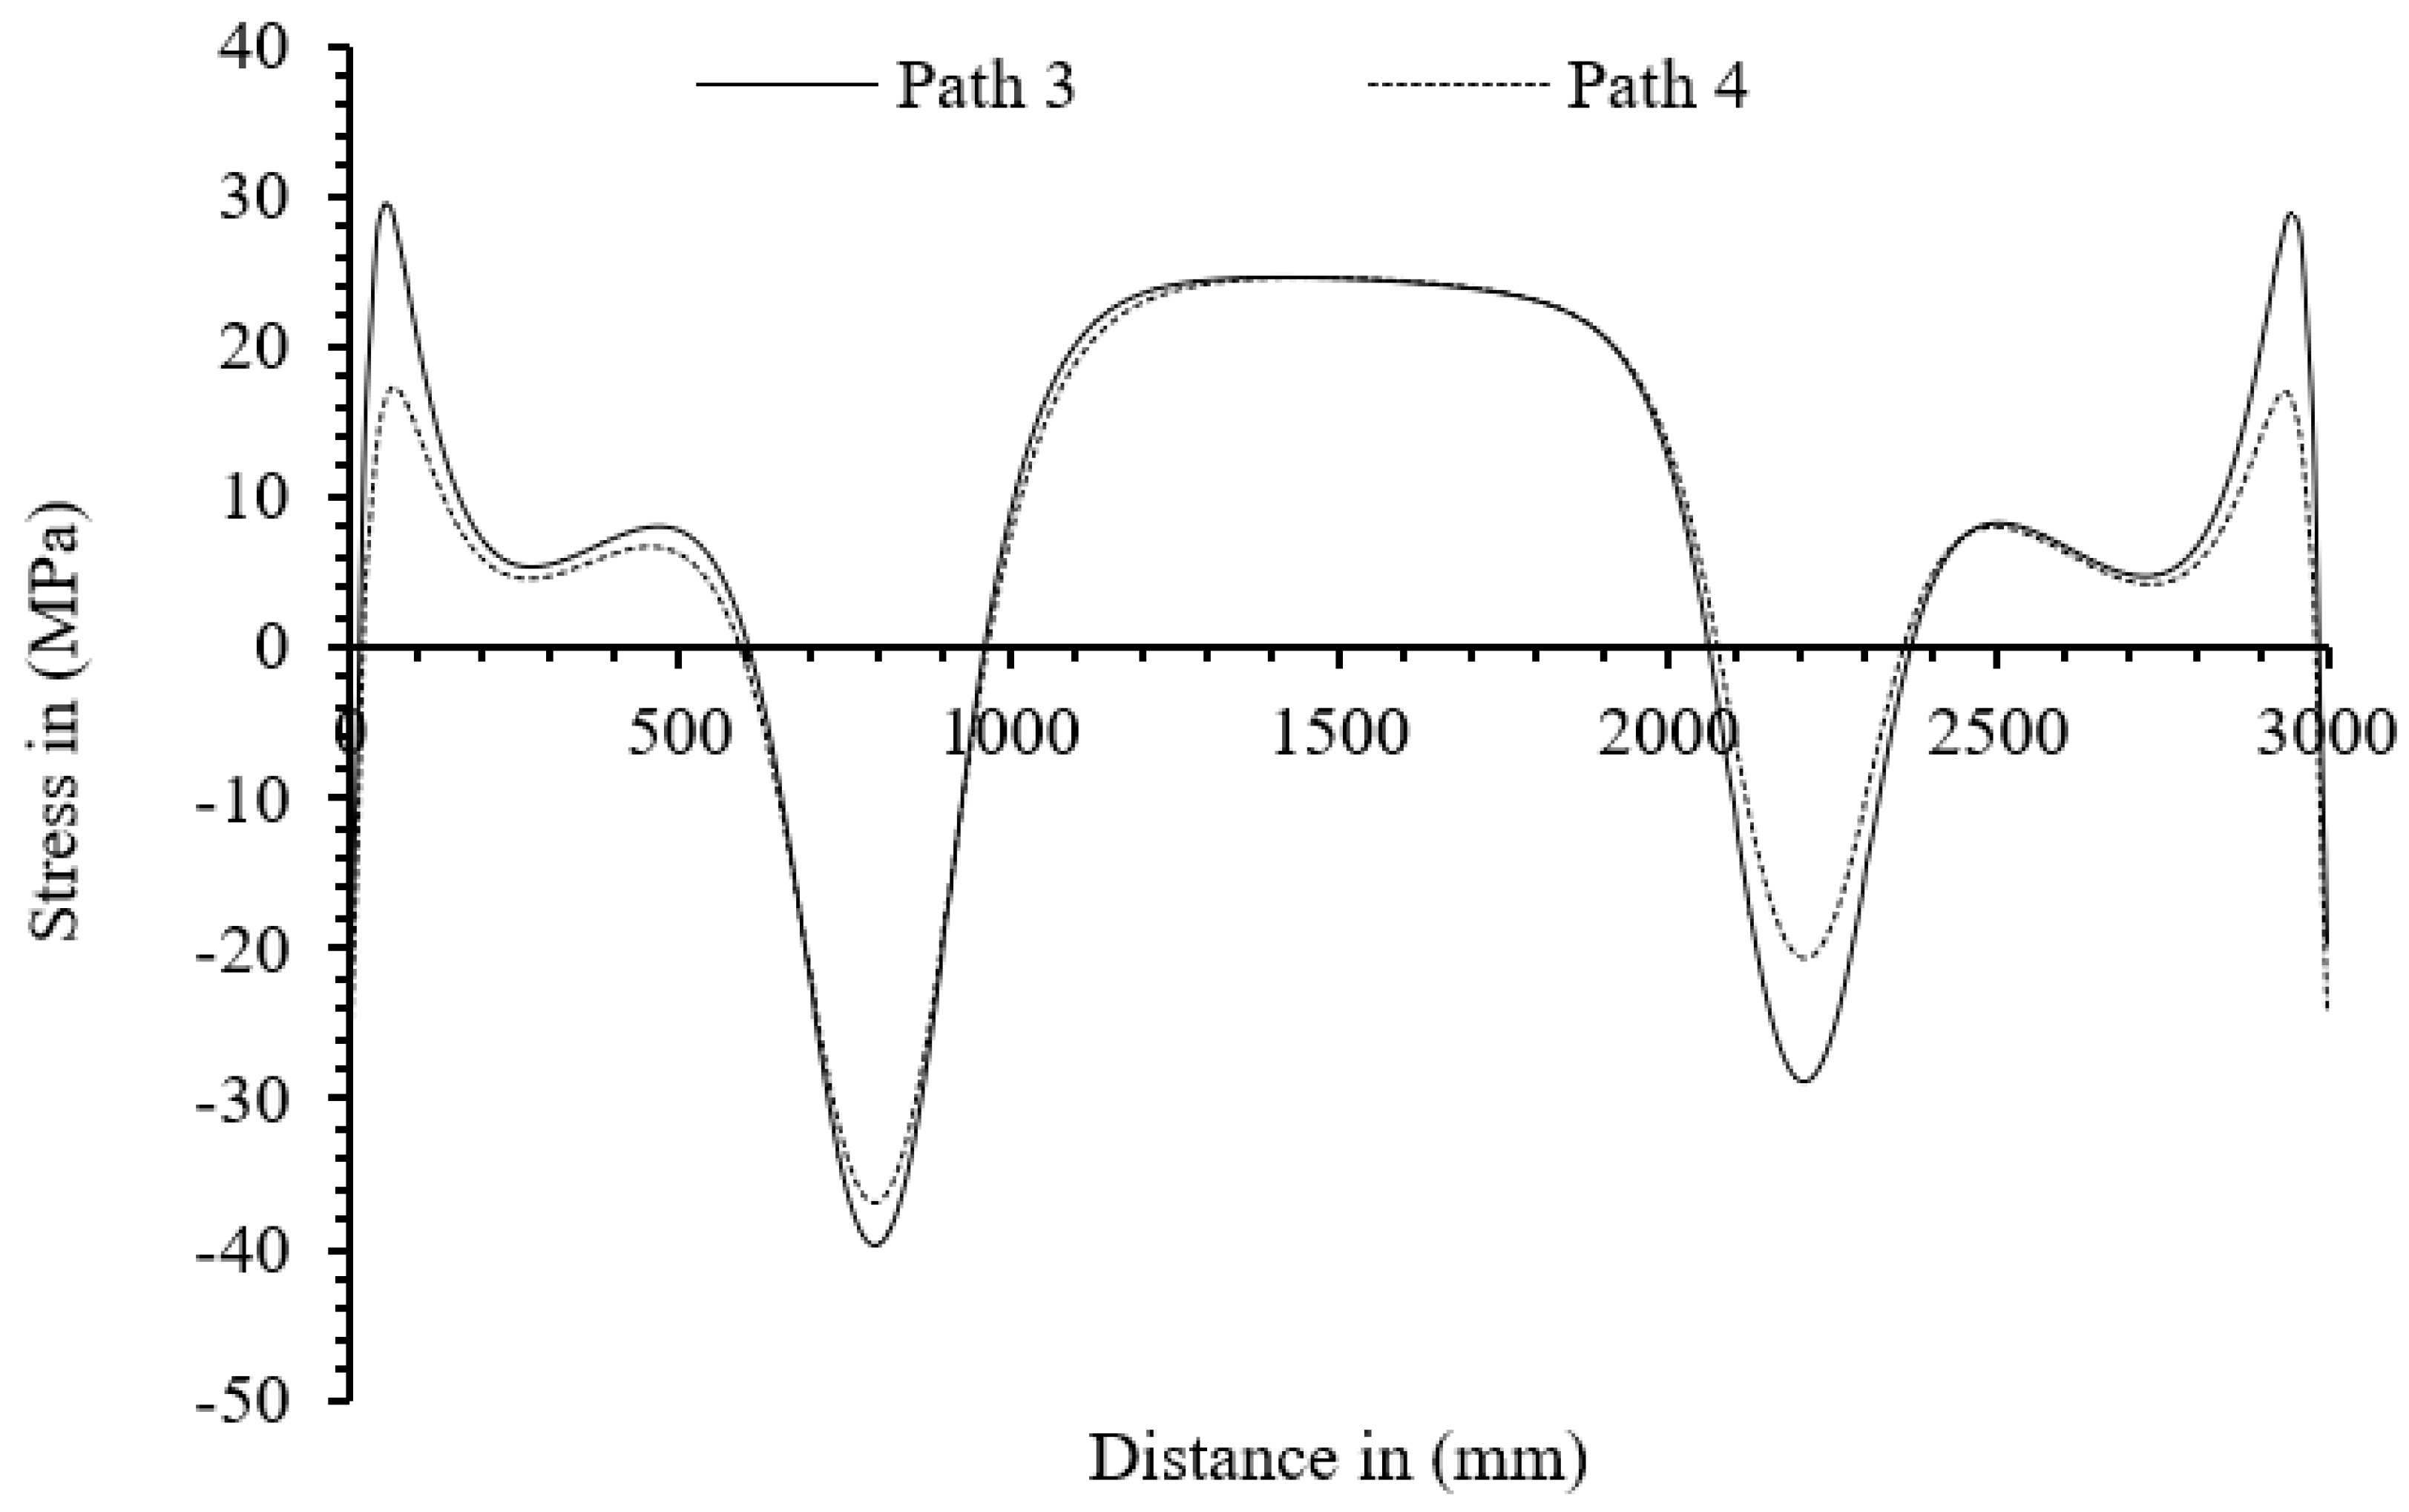
Stress was collected creating a path in post-processing module. For load case 1, the stress values were taken at the outer side of the ribs and inner side of the ribs, starting from the double-welded connection to single-welded connections. The stress profiles are illustrated in Figure 7 and Figure 8.
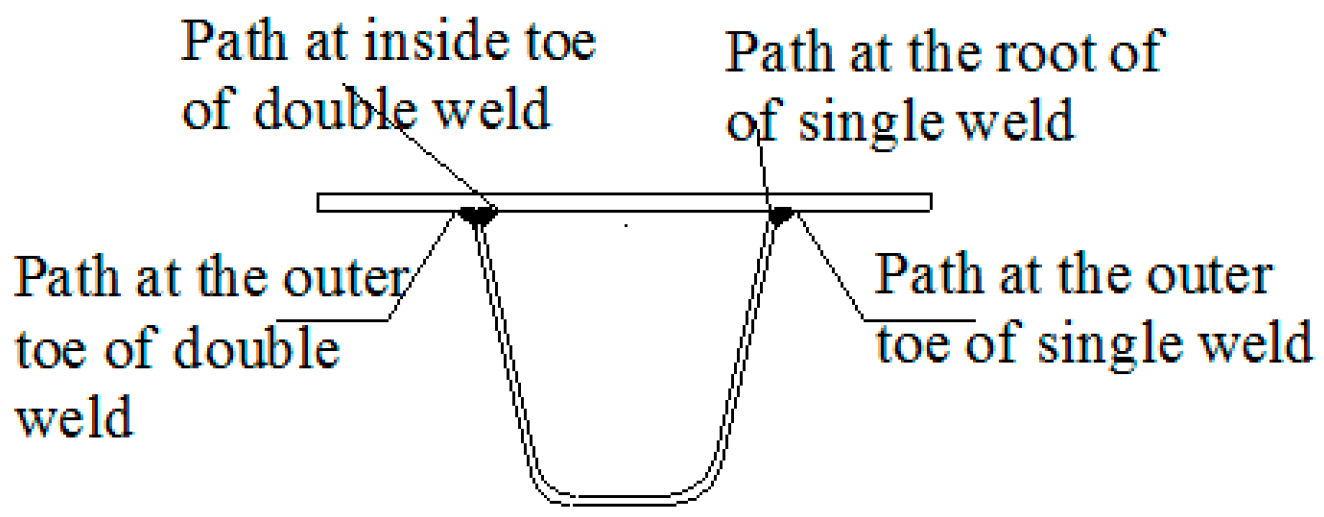
For load case 2, the extreme values of stress collected at different paths along the weld (Figure 9) are tabulated in Table 7.
From Table 7, the stress concentration at the inner side of the single-welded connection (root) was higher than other locations.
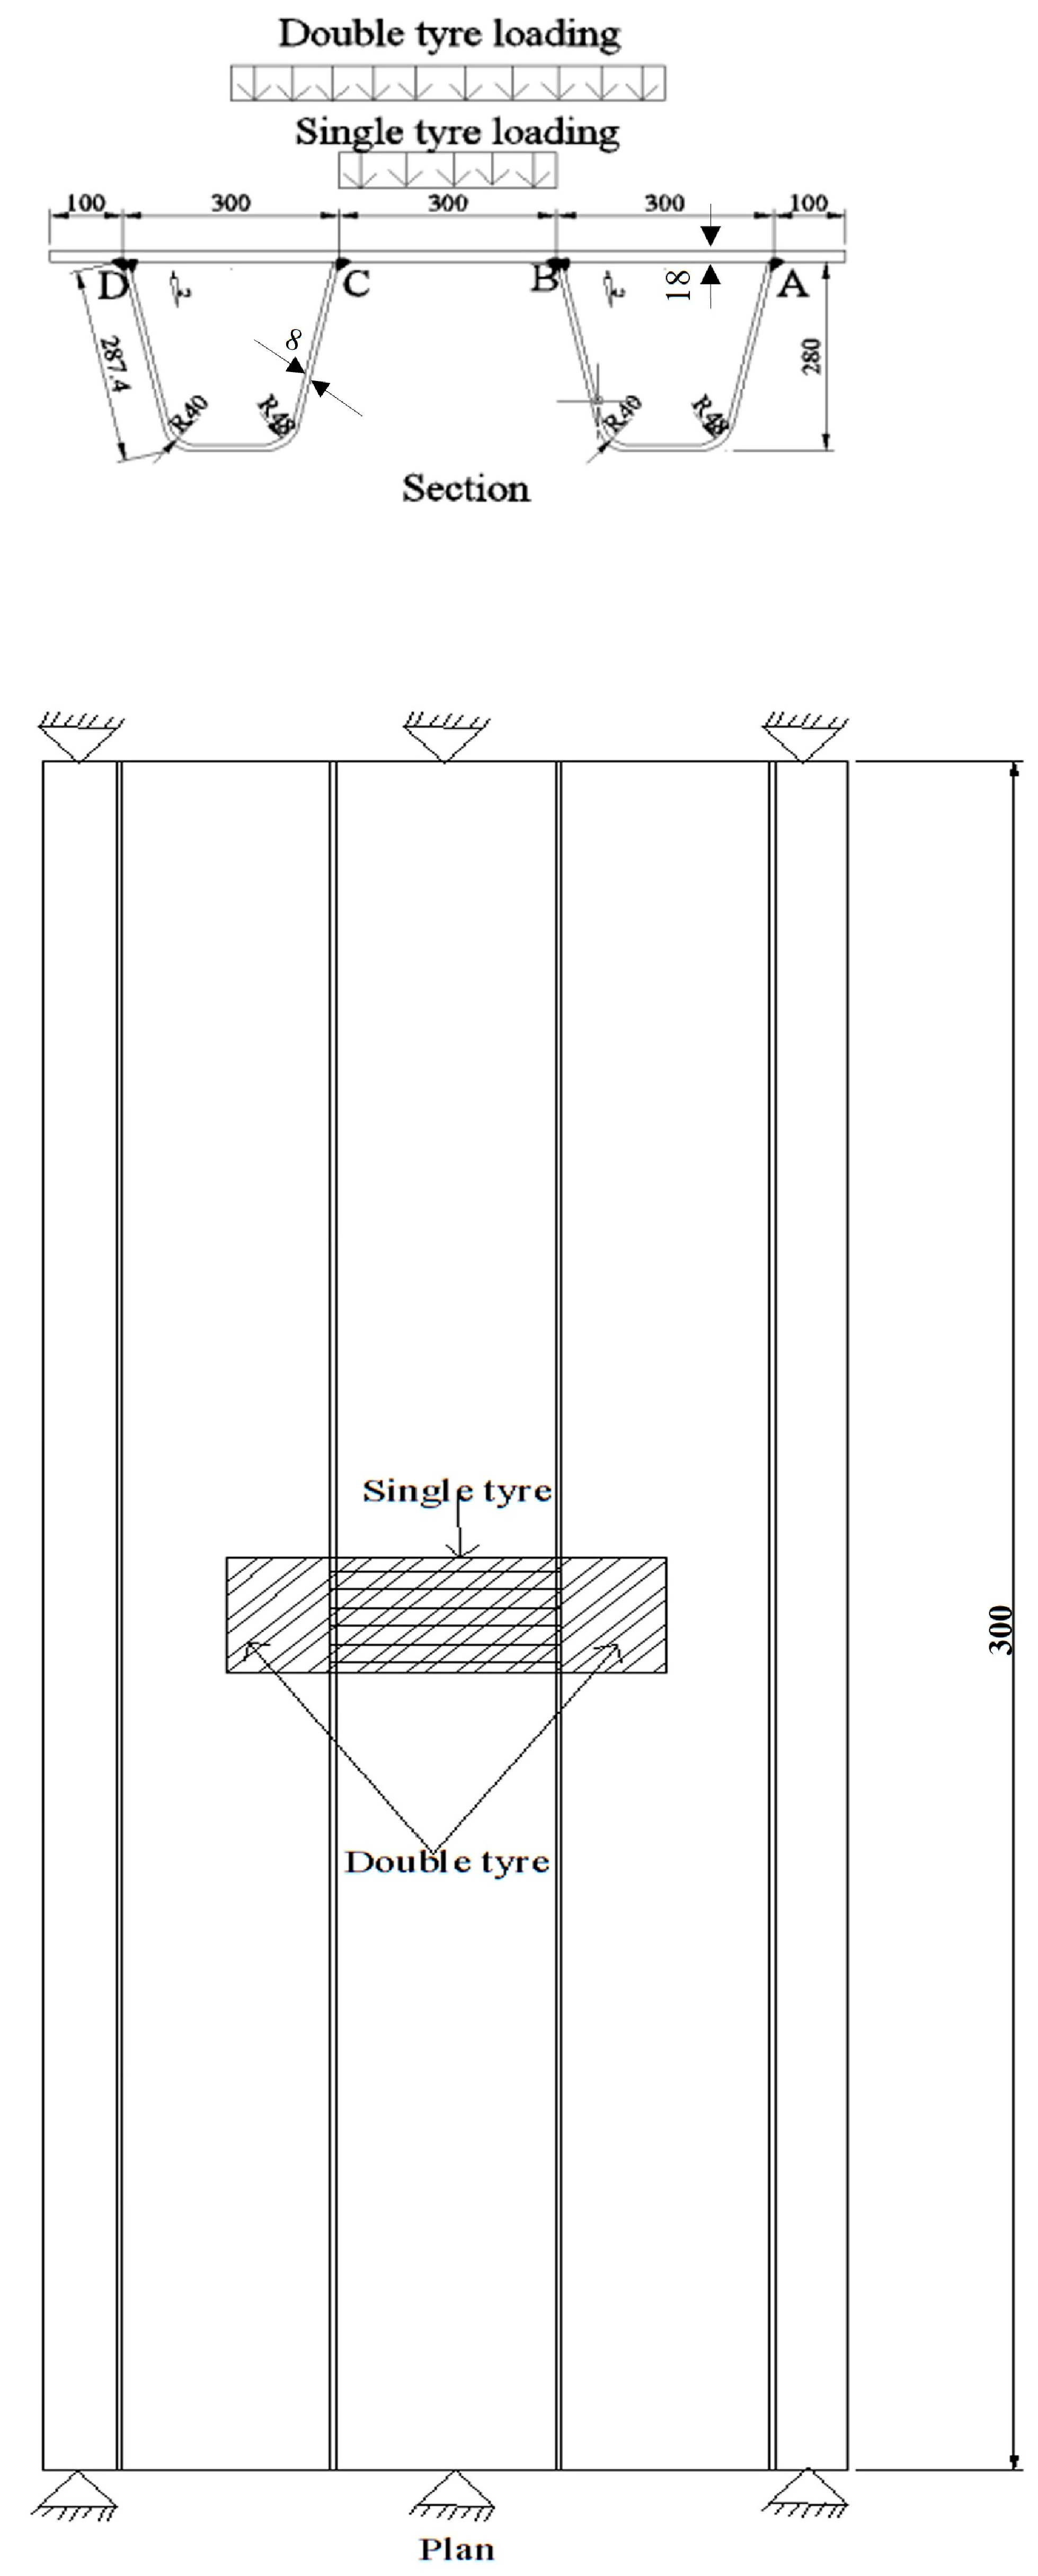
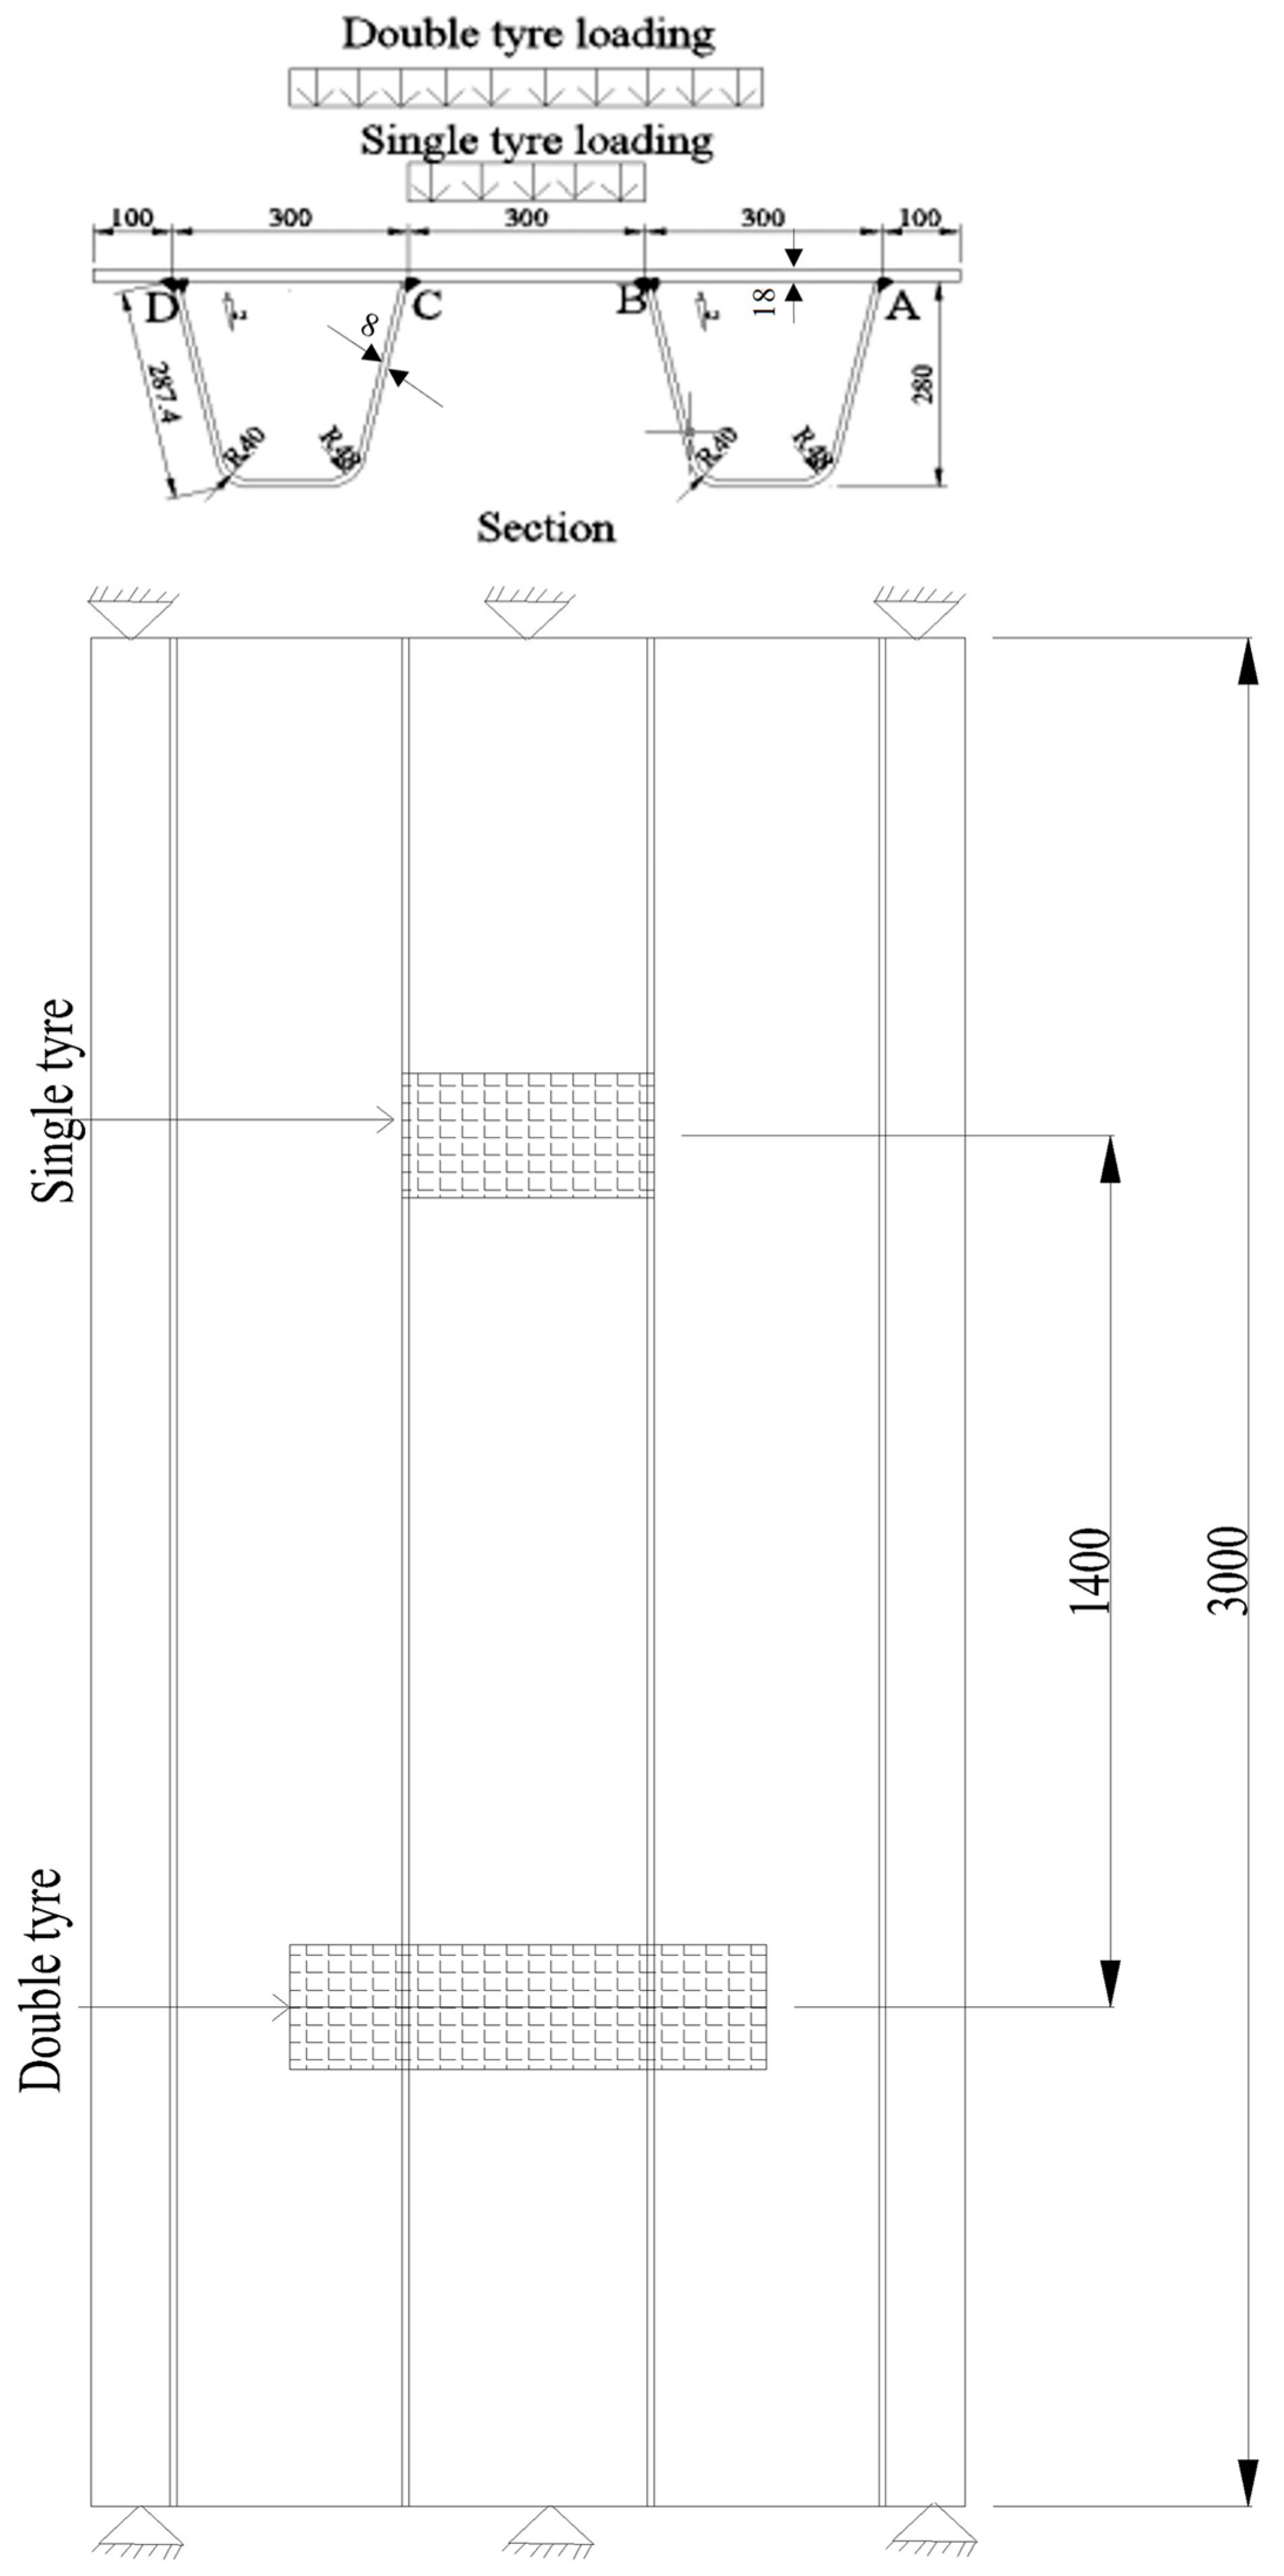
4.2. Double-Ribbed Specimen
The specimen was 1.1 m wide and 3 m long; the reason for choosing this specimen was that two ribs of a 300 mm width can be adjusted with a 300 mm gap between them so that the stress condition can be analyzed when the load is in between the two ribs. The deck thickness was 16 mm; the rib thickness was 8 mm. The legs of ribs were alternatively connected with a single and double weld, as illustrated in Figure 10 and Figure 11. The maximum stress values at connection B (both toes) and connection C (inner root and outer toe) are tabulated in Table 8 and Table 9, which were extracted by creating a path in the post-processing module. For simplicity toe and root of single welded connection at ‘C’ are referred to as 1 and 3, respectively; similarly, the outer toe and inner toe of the double welded connection at ‘B’ are referred to as 2 and 4.
The first loading was applied in two steps: in the first step the double tyre load was applied in the middle and then in second step the double tyre load was removed and single tyre load was applied in the middle, as illustrated in Figure 8. The single tyre load was 50 kN, distributed uniformly in the area of 0.2 × 0.3 m2. The double tyre load was 75 kN uniformly distributed in the area of 0.2 × 0.6 m2. The results of first loading are given in Table 8
5. Validation of Simulation Results
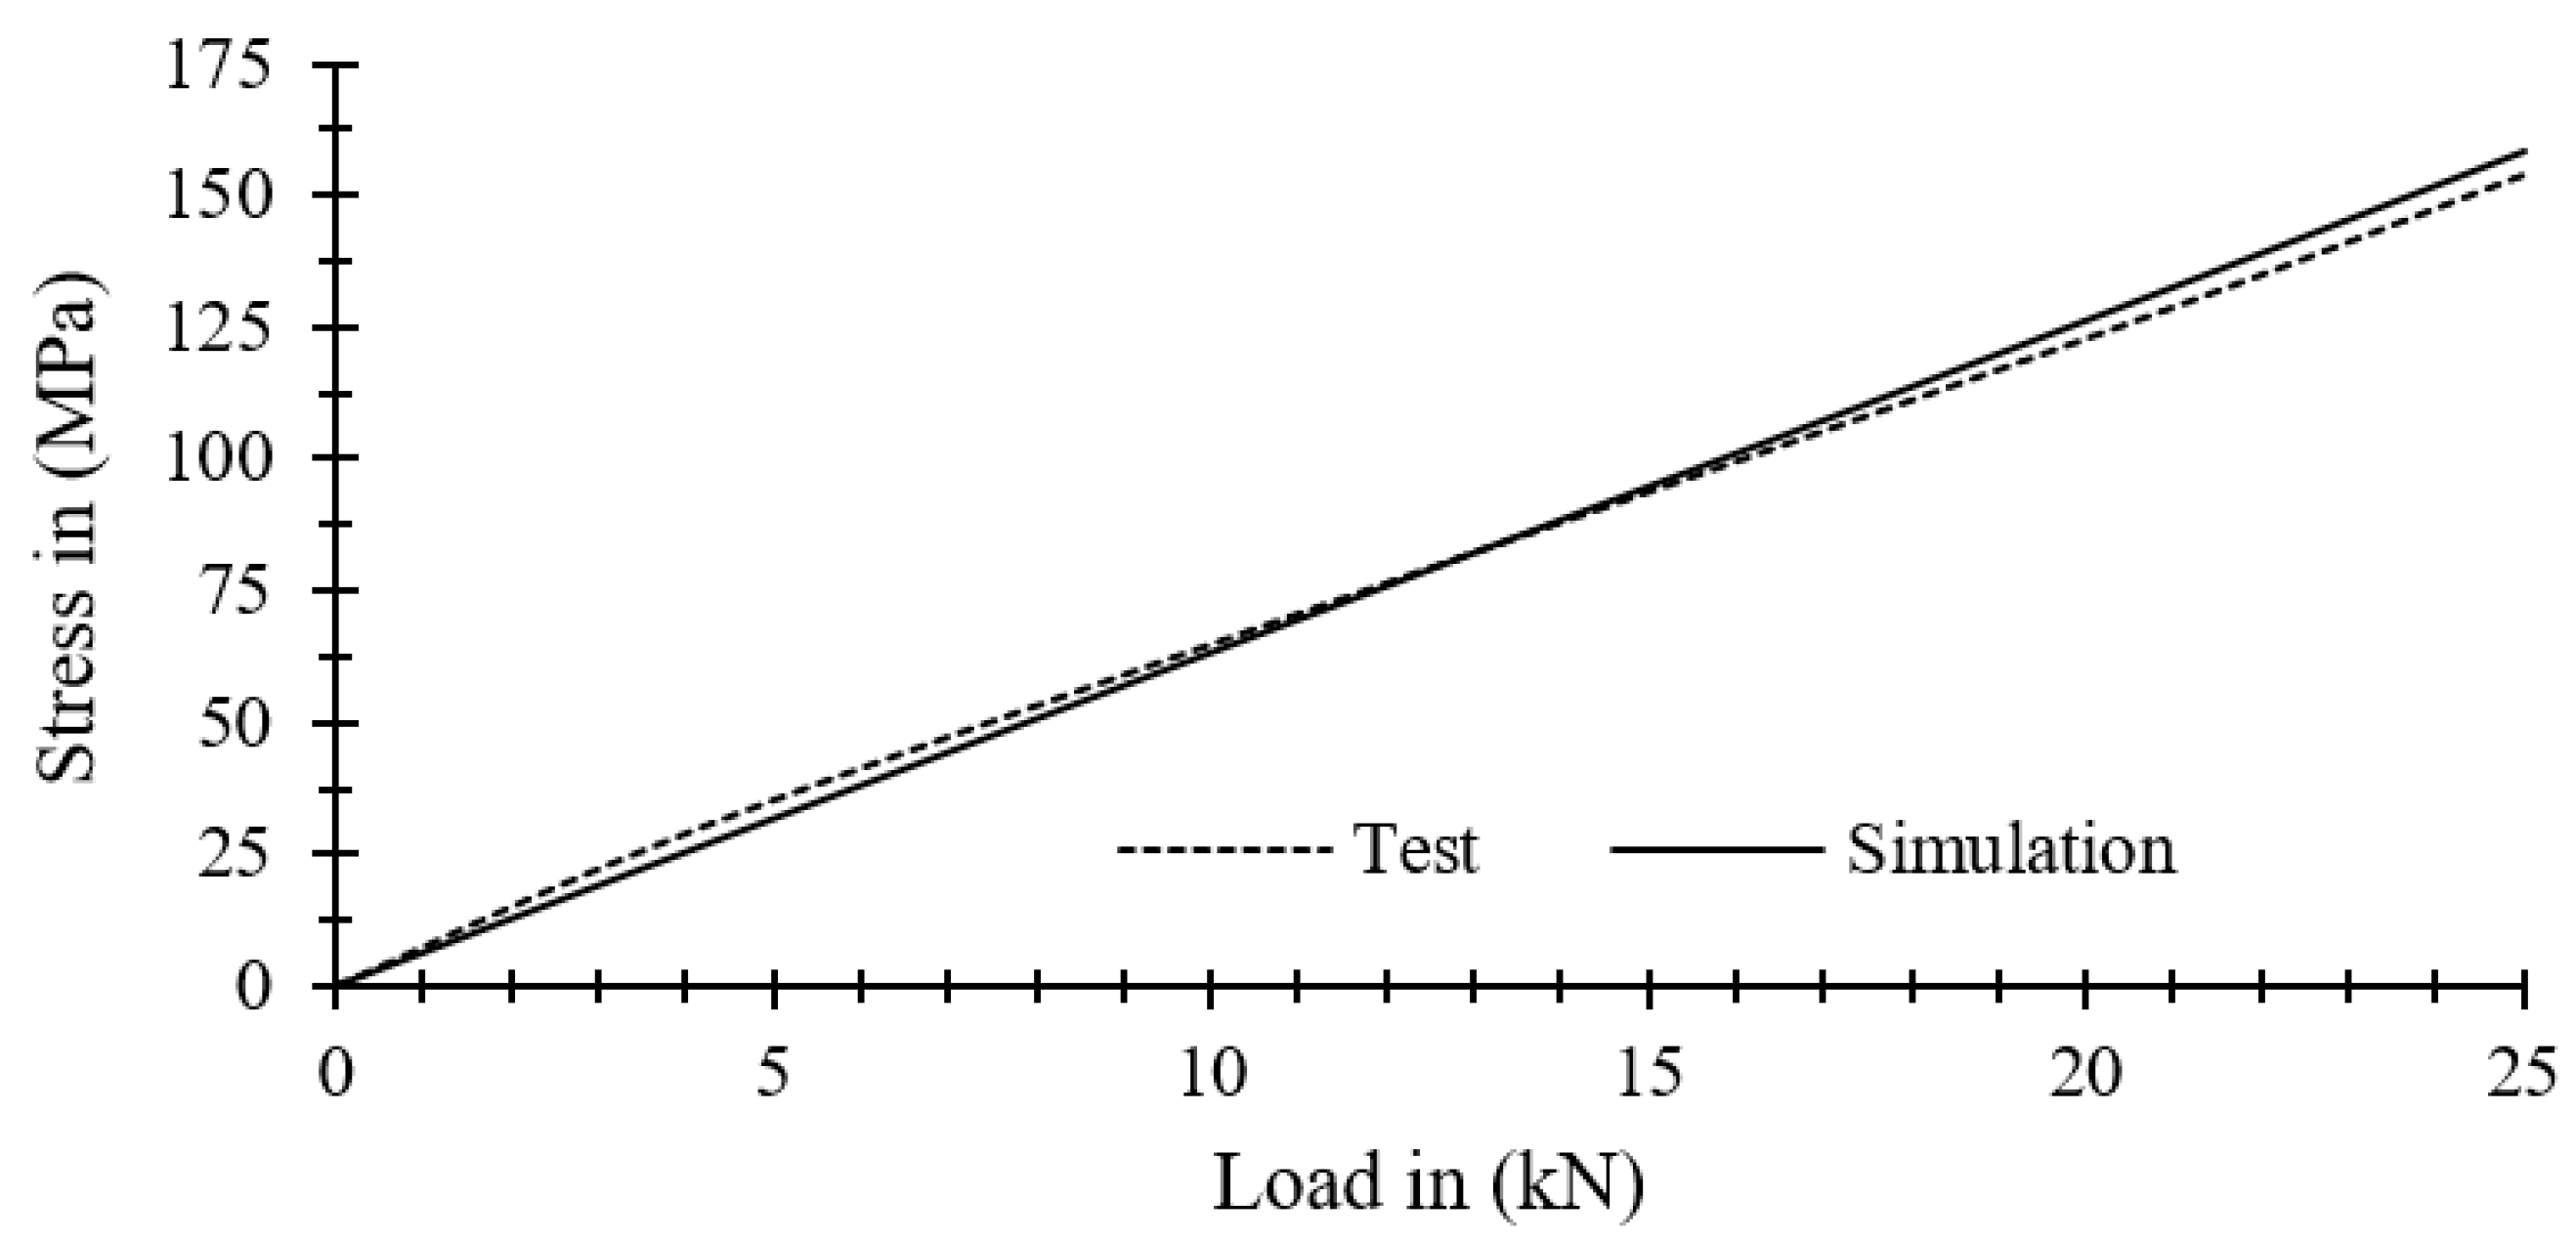
For the validation of results from simulation, the results of S2a model f from simulation were compared with the stress generated from laboratory test results reported by Zhu et al. [24] and are plotted in Figure 14. The average percentage difference between the test results from simulation and test was 3.8%, which demonstrates that the simulated results were consistent with the test results.
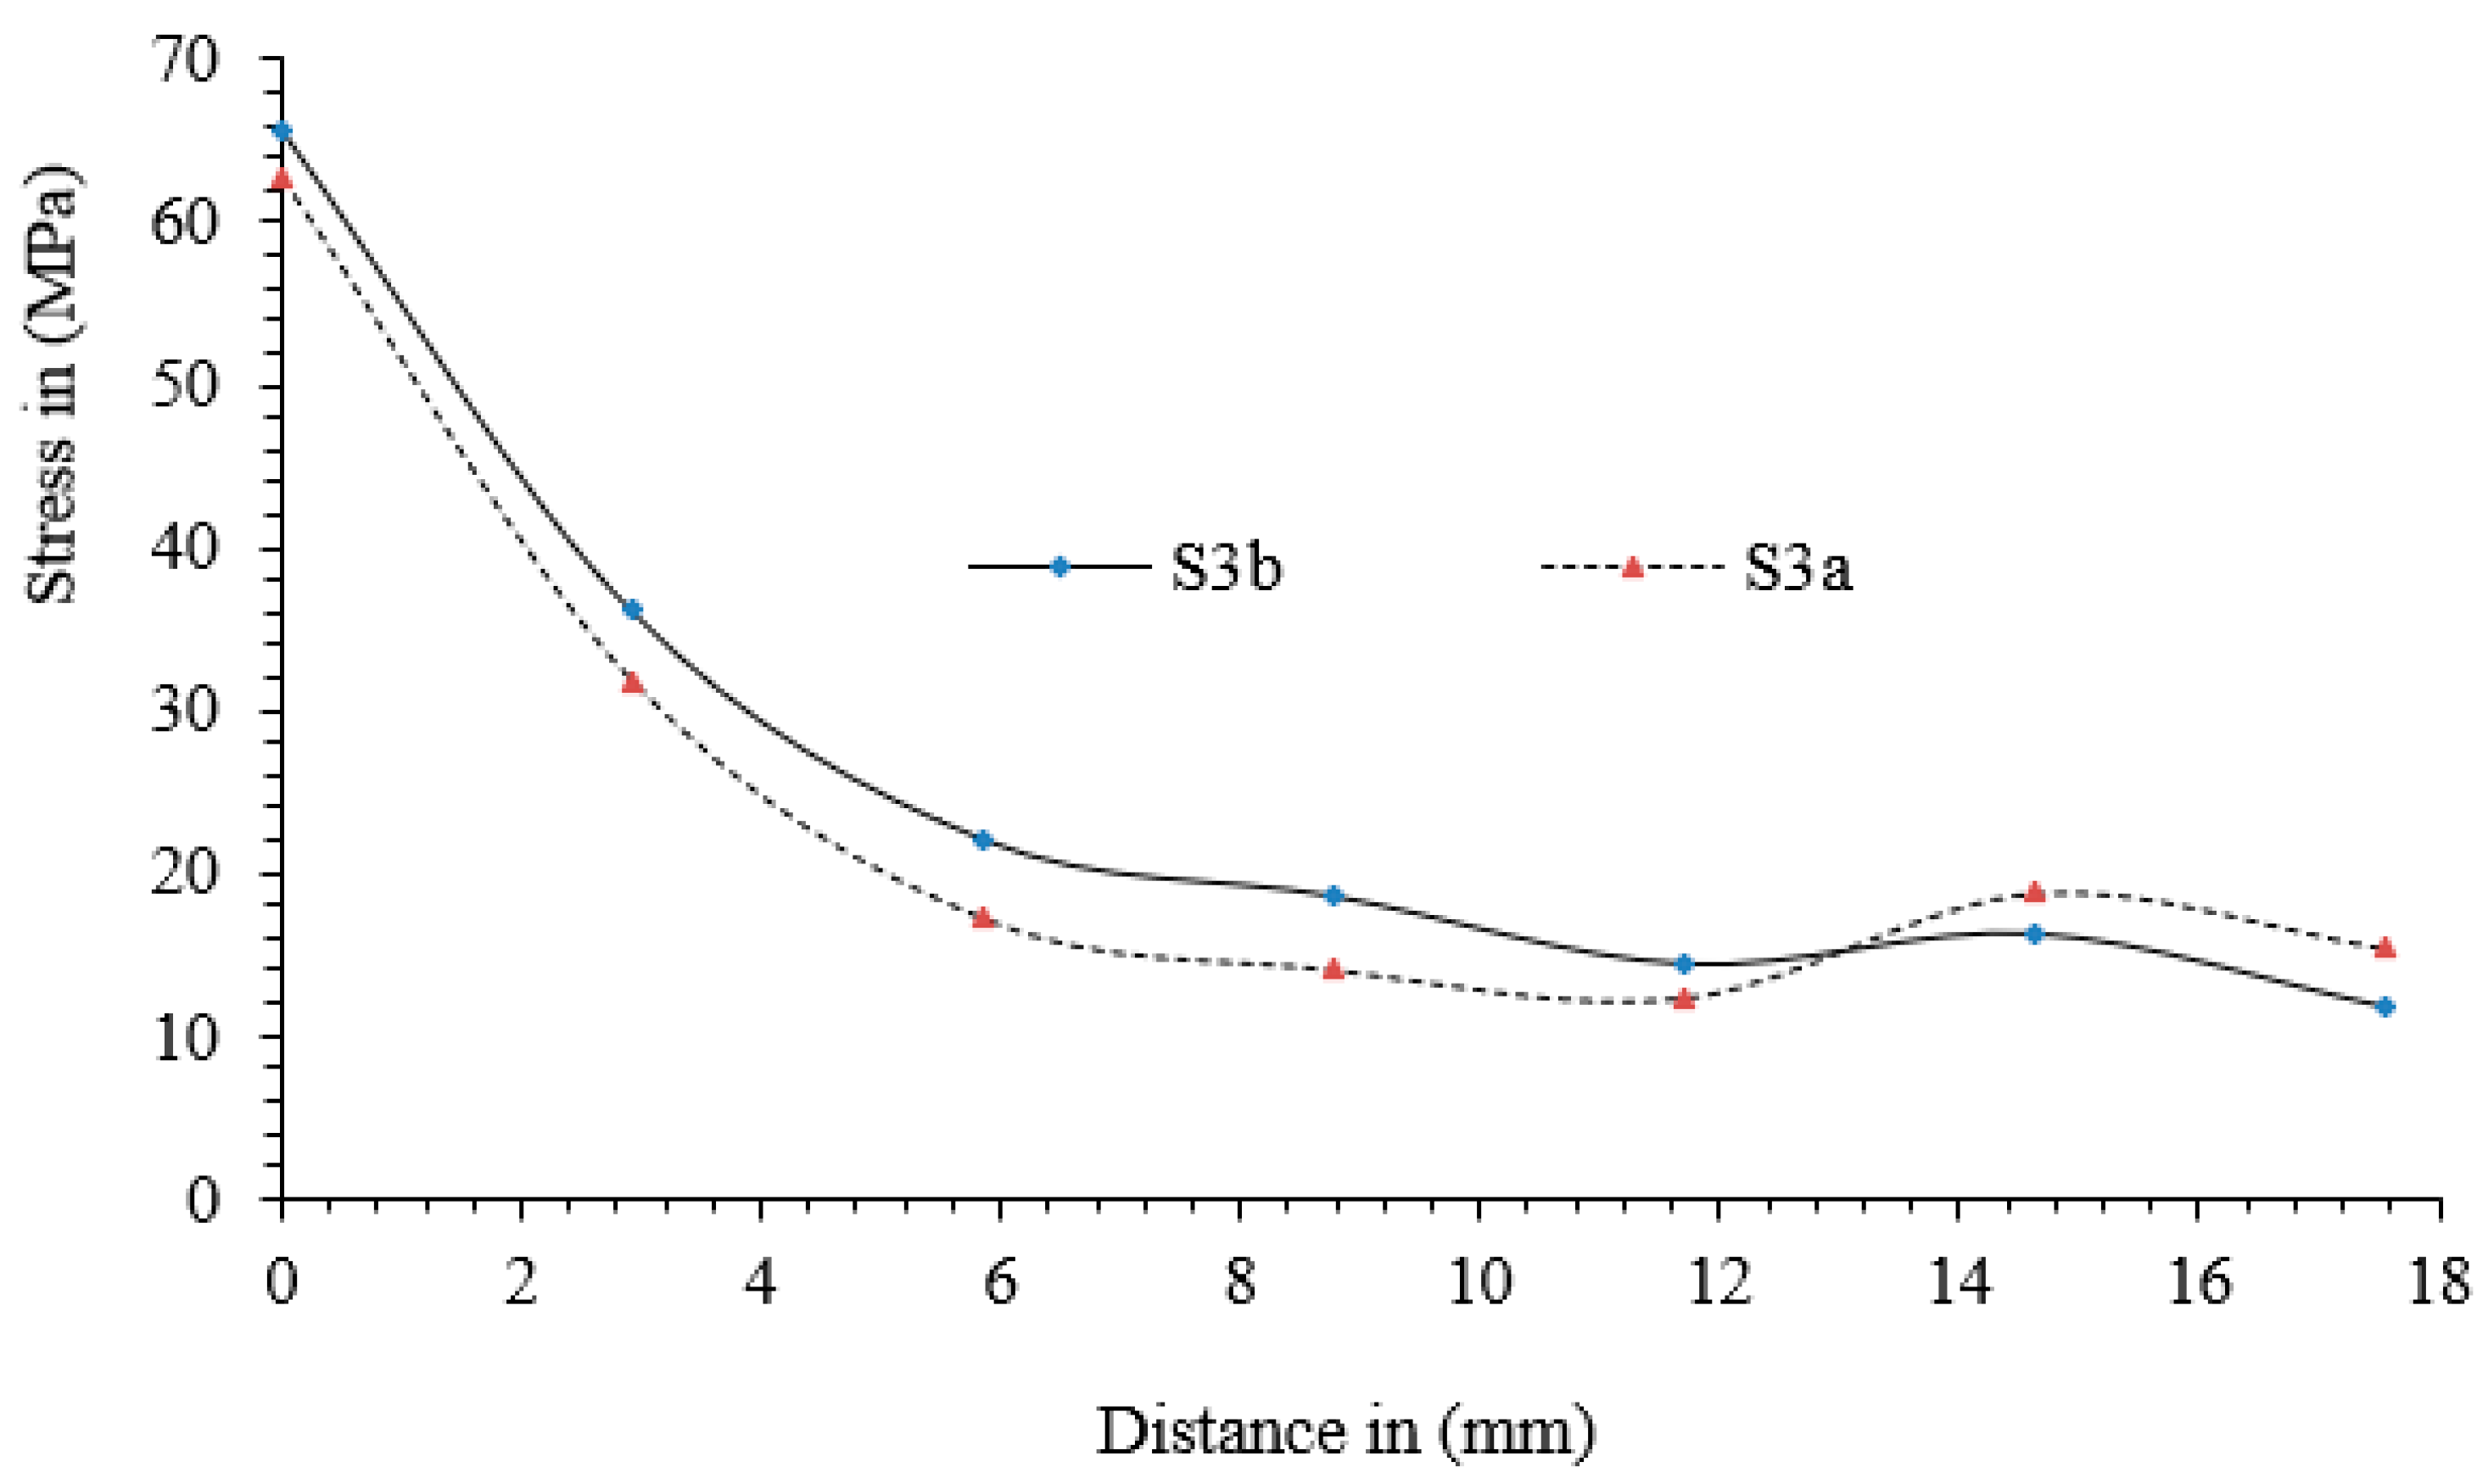
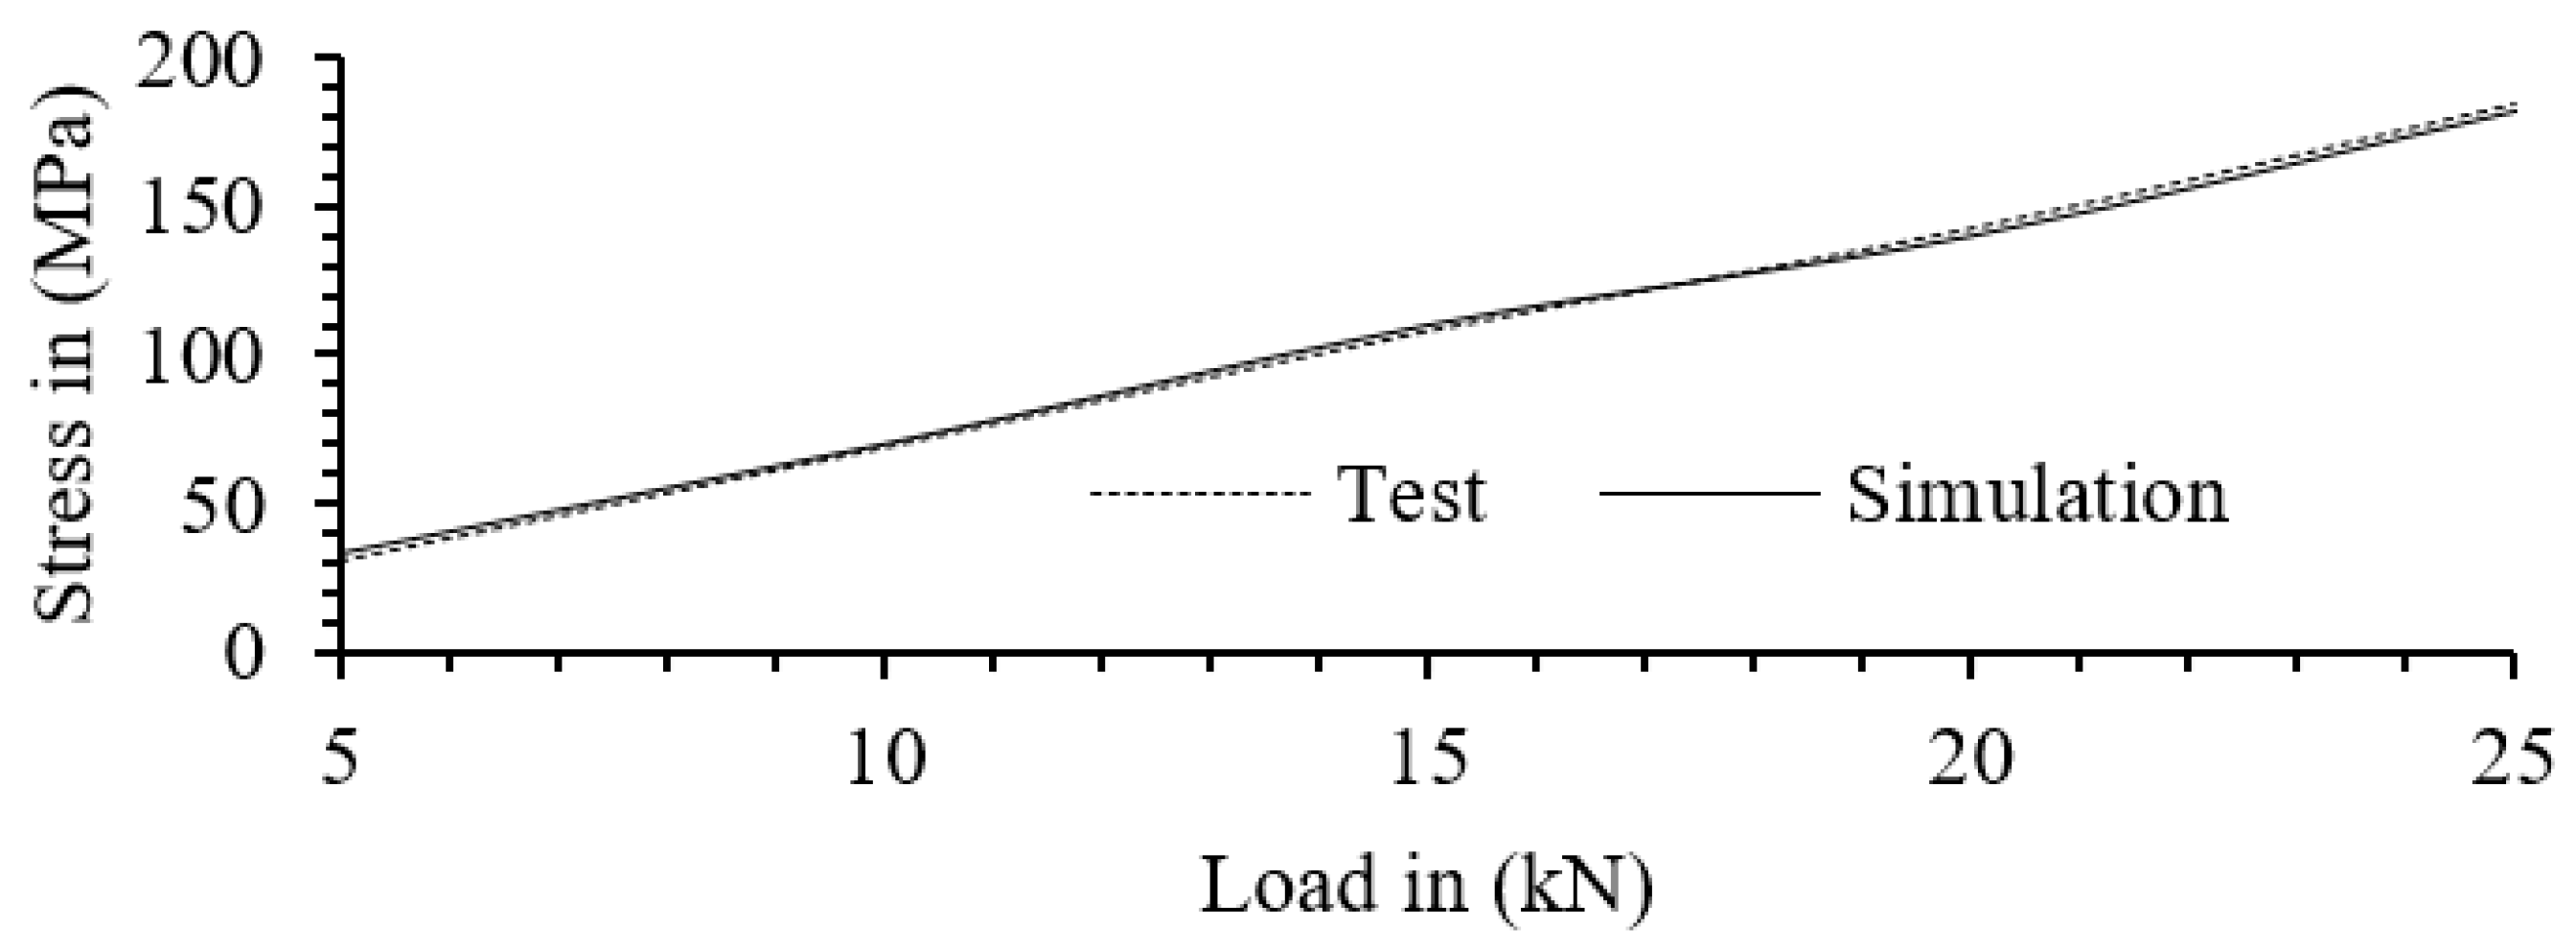
Similarly, the results of S3a model from simulation were compared with the stress generated from laboratory test reported by K C [23] and are plotted in Figure 15. The average percentage difference between the test results from simulation and test was 2.9%, which demonstrated that the simulated results were consistent with the test results.
6. Analysis
The fatigue of life of structures can be determined by using SN curves or equations. With a Linear Elastic Facture Mechanics (LEFM) approach, Equation (1) can be used to calculate the fatigue life of structures.
where ‘N’ is the number of cycles, ‘a’ is the crack depth, ‘C’ is a constant which value is 3.1 × 10⁻¹³ N·mm. For old bridges, value of ‘C’ and ‘m’ can be taken as 4.1 × 10⁻¹³ and 3, respectively [29]. In Equation (1), when keeping all other parameters constant, if stress amplitude decreases the number of cycles (fatigue life) increases drastically.
The stress concentration increases a little due to double welds or increase in weld penetration, which can be seen in Table 1, Table 3 and Table 5. In Table 8, the extreme values of stress is highest at ‘2’ which is the outer toe of the double welded connection. If we compare the stress at ‘3’ and ‘4’ in Table 8, the stress concentration at inner root (at ‘3’) seems higher; one of the reasons is that ‘3’ is closer to load proximity than ‘4’; however, ‘1’ and ‘2’ are at same proximity from load and support but stress concentration at ‘2’ significantly higher than at ‘1’. This demonstrates that double welds concentrate more stress, although stress concentration at the root of single weld is also significant. From Table 4 and Table 5, it is seen that stress concentration at the weld toe in deck decreases with an increase in the thickness of deck. From Table 5 and Table 6, it is clear that the stress decreases when rib thickness decreases. In Table 5, the stress is higher for double-welded connection and in Table 6 stress is higher for single-welded connection, but the magnitude of stress is higher in Table 5, which is the stress at toe in deck; therefore, failure is more likely to occur at the weld toe in the deck. A higher stress concentration means higher stress amplitude due to loading, so from Equation (1), the fatigue life of specimens’ decreases where the stress concentration is higher.
In Section 2 and Section 3, the models are supported on lateral sides of the rib/ribs (fixed supports are parallel to ribs) but in Section 4, the models are supported such that the direction of ribs and support is perpendicular. Although the boundary condition is different in Section 4 from Section 2 and Section 3 the results on single and double welds were consistent, which shows double welds concentrate higher stress.
7. Discussion and Limitations
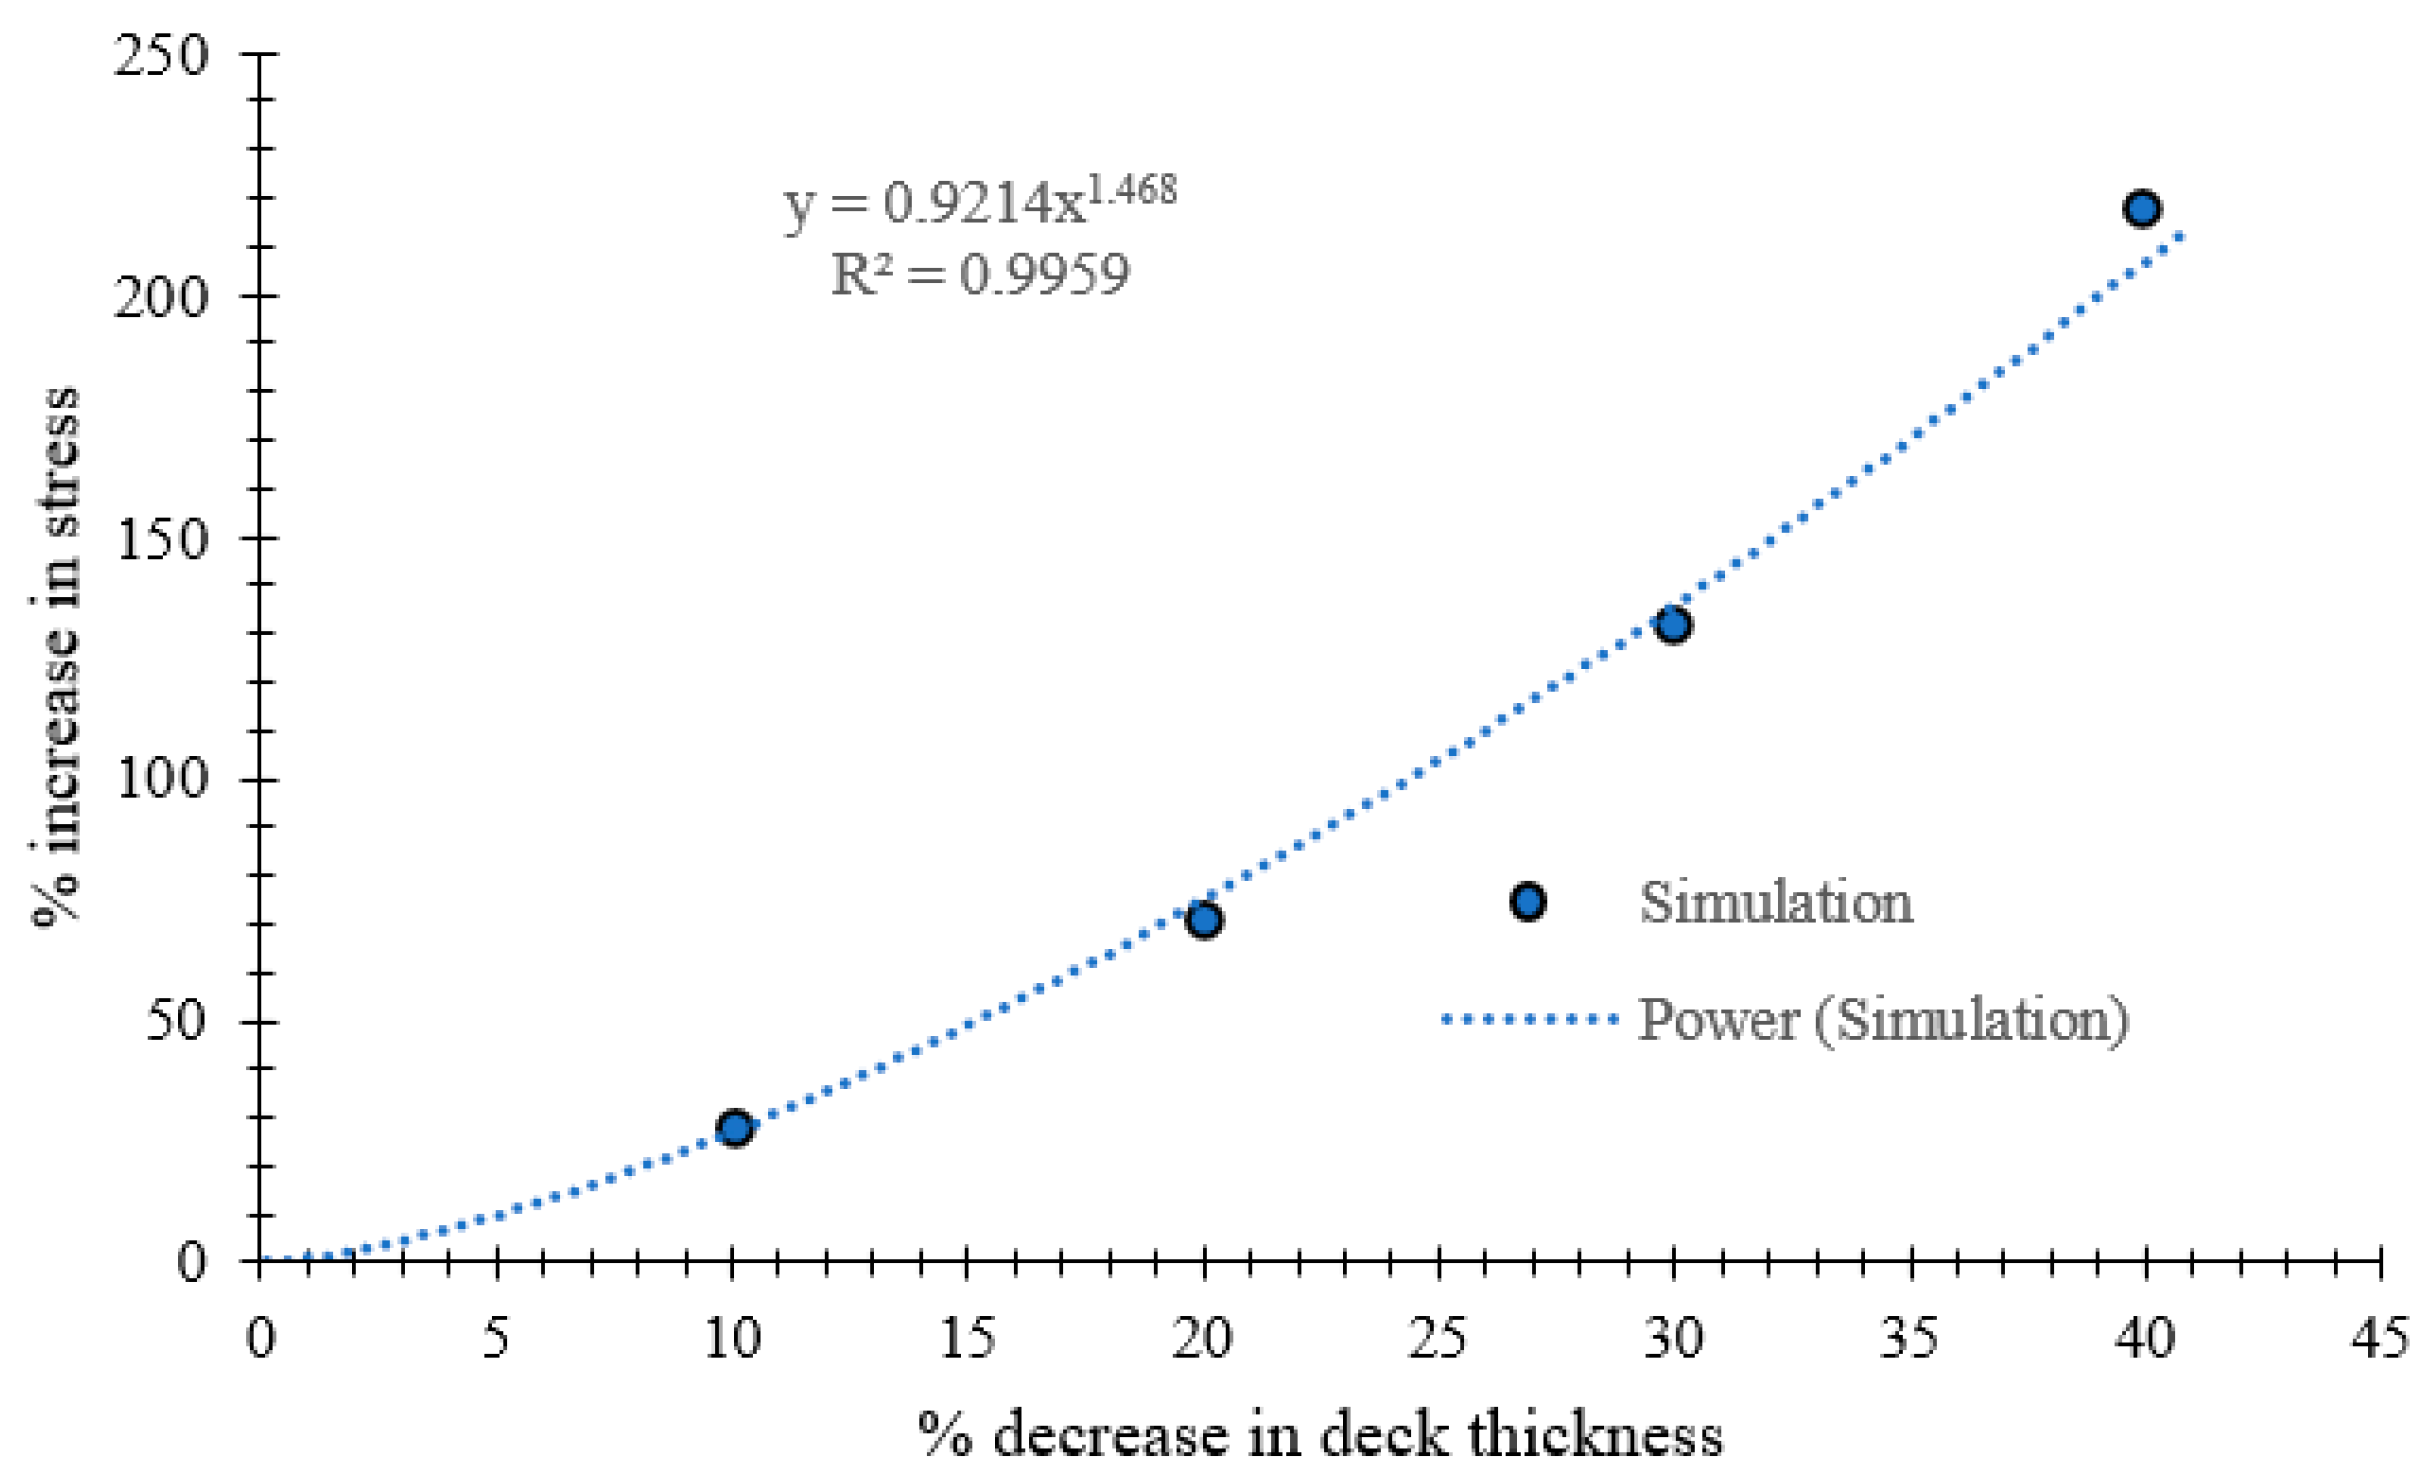
From the extensive simulation of different models, it was found that the increase in weld penetration increases the stress concentration slightly, which is similar to the findings by Dung et al. [17] and Mori [18]. Double welds at rib to deck connection can increase stress concentration slightly, which is more dependent on the thickness of the rib and deck. In addition, it was found that the stress concentration on a double-welded connection is higher if the deck and rib thickness is higher. Furthermore, it was found that the increase in rib thickness increases the stress concentration and decrease in rib thickness decreases the stress concentration, which is similar to the findings by Nagy et al. [20]. Among the examined parameters, the most important component that influences the fatigue life of OSD at the rib-to-deck connection was deck thickness. Considering the standard thickness of deck as 20 mm, a power relationship of percentage increase in stress concentration (y) and percentage decrease in deck thickness (x) was determined. The mathematical relation is given in Equation (2) which has the coefficient of determination (R2) of 0.9959. The relationship of stress concentration with decrease in deck thickness is also illustrated in Figure 16.
y = 0.9214x1.468
From the earlier studies, Kainuma et al. [14] and Sim et al. [15] reported the decrease in fatigue life with an increase in weld penetration. Hung et al. [17] reported higher fatigue life in a 100% weld-penetrated specimen than in a 75% weld-penetrated specimen. In recent study, Zhu et al. [24] reported the increase in fatigue life in double-welded specimens is longer than in single welded specimens, while Yang et al. [30] reported that there is no significant difference between fatigue life of single-welded and double-welded U-shaped ribs connection to deck in orthotropic steel bridge decks.
This study was focused on the groove weld on single and double welds through numerical simulations. The modification made in the weld toe during the welding process was not considered in this study. All fabrication procedures of welding are unknown and the induced residual stress which might have been induced due to welding were not considered. The welds always have some defects; for instance, the welding material may not have the same property as parent material, but they were considered the same in this study. The weld is never uniformly penetrated but, in the simulations, it was considered uniformly penetrated.
8. Conclusions
Orthotropic steel bridges gained immense popularity due to their straightforward construction techniques and cost-effectiveness. However, their prevalence waned after the 1990s, primarily due to fatigue-related issues. In this paper, we delve into numerical simulations aimed at identifying potential design solutions for enhancing fatigue resistance in these bridges. Specifically, the impact of various factors, including weld fusion, deck thickness, rib thickness, and the use of single and double welds was explored. The key findings of the of this study which involved forty-two simulations, include the following:
- The decks are the most important component influencing the fatigue life at rib to deck connection. The percentage of stress increase with percentage decrease in deck thickness follows a power relation with coefficient 0.9214 and exponent 1.468, with a coefficient of determination R2 equal to 0.9959. Therefore, an increase in deck thickness increases the fatigue life significantly.
- Thicker ribs increase stress concentration which may be due to an increase in stiffness.
- The overall stress concentration on the outer side of the closed stiffener at toe at the deck of double welded connection is maximum; however, on the inner side of the closed stiffener, the tensile stress concentration at the weld root of single welded connection is significantly higher than weld toe of double welded connection. Therefore, in general the fatigue cracks are expected to initiate on the outer side of closed stiffener at the weld toe at deck and the fatigue life of double welded connection is expected to be shortest, but in situation when micro cracks or weld defects are present at the inner side of the rib or if the crack initiate on the inner side of the rib, the cracks at the weld root of single welded connections can propagate much faster than the double welded connections.
- An increase in weld penetration slightly increases stress concentration possibly due to increase in stiffness at the connection.
- Double welds concentrate more stress which decrease fatigue life; however, for deep weld penetration the degradation of parent material is more severe so lower weld penetration from both sides may reduce the flaws during welding hence reduce the probability of crack initiation.
- The position of load also plays role in stress concentration. In Table 7, stress concentration at root is highest when the load is located entirely in between the two legs of a closed stiffener. Therefore, in this case the fatigue cracks are likely to occur at weld root.
Author Contributions
Conceptualization, D.K.; methodology, D.K.; software, D.K.; validation, D.K.; formal analysis, D.K., B.K.D. and H.D.; investigation, D.K. and B.K.D.; resources, D.K.; data curation, D.K. and B.K.D.; writing—original draft preparation, D.K.; writing—review and editing, D.K., B.K.D. and H.D.; visualization, D.K., B.K.D. and H.D.; supervision, D.K.; project administration, D.K.; All authors have read and agreed to the published version of the manuscript.
Funding
This research received no external funding.
Data Availability Statement
The raw data supporting the conclusions of this article will be made available by the authors on request.
Conflicts of Interest
The authors declare no conflict of interest.
References
- Kolstein, M.H. Fatigue Classification of Welded Joints on Orthotropic Steel Bridge Decks. Ph.D. Thesis, Delft University, Delft, The Netherlands, 2007. [Google Scholar]
- US Department of Transportation of Federal Highway Administration. Manual for Design, Construction and Maintenance of Orthotropic Steel Deck Bridges; Federal Highway Administration: Washington, DC, USA, 2012.
- Stephens, R.I.; Fatemi, A.; Stephens, R.R.; Fuchs, H.O. Metal Fatigue in Engineering; John Wiley & Sons: New York, NY, USA, 2000. [Google Scholar]
- Fricke, W. Fatigue analysis of welded joints: State of development. Mar. Struct. 2003, 16, 185–200. [Google Scholar] [CrossRef]
- Radaj, D. Review of Fatigue Strength assessment of nonwelded and welded structures based on local parameters. Int. J. Fatigue 1996, 18, 153–170. [Google Scholar] [CrossRef]
- Maddox, S.J. Fatigue Strength of Welded Structures; Woodhead Publishing: Sawston, UK, 1991. [Google Scholar]
- Xiao, Z.G.; Yamada, K.; Inoue, J.; Yamaguchi, K. Fatigue cracks in longitudinal ribs of steel orthotropic deck. Int. J. Fatigue 2006, 28, 409–416. [Google Scholar] [CrossRef]
- American Association of State Highway and Transportation Officials (AASTHO). LRFD Bridge Design Specifications, 5th ed.; AASTHO: Washington, DC, USA, 2010. [Google Scholar]
- Japan Road Association (JRA). Japanese Specifications for Steel Bridges; Japan Road Association: Tokyo, Japan, 2002. (In Japanese) [Google Scholar]
- JTG D64-2015; Specification for Design of Highway Steel Bridge. S.K. Kataria & Sons: Delhi, India, 2015.
- European Committee of Standardization. Eurocode 3, Design for Steel Structures, Part2: Steel Bridges; European Committee of Standardization: Brussels, Belgium, 2003. [Google Scholar]
- Xiao, Z.G.; Yamada, K.; Ya, S.; Zhao, X.L. Stress analyses and fatigue evaluation of rib-to-deck joints in steel orthotropic decks. Int. J. Fatigue 2008, 30, 1387–1397. [Google Scholar] [CrossRef]
- Pfeil, M.S.; Battista, R.C.; Mergulhao, A.J.R. Stress Concentration in Steel bridge orthotropic decks. J. Constr. Steel Res. 2005, 61, 1172–1184. [Google Scholar] [CrossRef]
- Kainuma, S.; Yang, M.; Jeong, Y.S.; Inokuchi, S.; Kawabata, A.; Uchida, D. Experiment on fatigue behavior of rib-to-deck weld root in orthotropic steel decks. J. Constr. Steel Res. 2016, 119, 113–122. [Google Scholar] [CrossRef]
- Sim, H.B.; Uang, C.M. Stress analysis and parametric study on full-Scale fatigue tests of rib-to-deck welded joints in steel orthotropic decks. J. Bridge Eng. 2012, 17, 765–773. [Google Scholar] [CrossRef]
- Samol, Y.; Kentaro, Y.; Toshiyuki, I. Fatigue Evaluation of Rib-to-Deck Welded Joints of Orthotropic Steel Bridge Deck. J. Bridge Eng. 2011, 16, 492–499. [Google Scholar]
- Dung, C.V.; Sasaki, E.; Tajima, K.; Susuki, T. Investigation on the effect of Weld penetration on Fatigue Strength of Rib-to-Deck Joints in Orthotropic Steel Decks. Int. J. Steel Struct. 2015, 15, 299–310. [Google Scholar] [CrossRef]
- Mori, T. Influence of weld penetration of fatigue strength of single sided fillet welded joints. J. Constr. Steel JSSC 2003, 10, 9–15. (In Japanese) [Google Scholar]
- Miki, C.; Tateishi, K. Fatigue damage in orthotropic steel bridge decks and retrofit works. Int. J. Steel Struct. 2006, 19, 255–267. [Google Scholar]
- Nagy, W.; Van Bogaert, P.; De Backer, H. LEFM based fatigue design for welded connections in orthotropic steel bridge decks. Procedia Eng. 2015, 133, 758–769. [Google Scholar] [CrossRef]
- Murakosi, J.; Hirano, S.; Harada, H. Effect of Deck Plate Thickness of Orthotropic Steel Deck on Fatigue Durability; Centre for Advanced Engineering Structural Assessment and Research (CAESAR), PWRI: Tsukuba, Japan, 2008.
- Aygül, M. Fatigue Strength of Welded Details in Steel Bridges with Orthotropic Plates. Master’s Thesis, Chalmers University of Technology, Goteborg, Sweden, 2004. [Google Scholar]
- K C, D. Parametric Analysis on Fatigue Life at Rib-to-Deck Connection in OSD. Master’s Thesis, Huazhong University of Science and Technology, Wuhan, China, 2017. [Google Scholar]
- Zhu, A.; Ouyang, S.; Chen, Y.; Sun, Y. Fatigue test and life evaluation of rib-to-deck connections in orthotropic steel bridge decks. J. Constr. Steel Res. 2022, 197, 107442. [Google Scholar] [CrossRef]
- Hobbacher, A. Recommendations for Fatigue Design of Welded Joints and Components; International Institute of Welding: Paris, France, 2008. [Google Scholar]
- ABAQUS User Manual, Version 6.12; Dassault Systemes Simulia, Inc.: Johnston, RI, USA, 2012.
- DNV-RP-C203; Fatigue Design of Offshore Steel Structures. Det Norske Veritas AS: Høvik, Norway, 2012.
- Xiao, Z.G.; Yamada, K. A method of determining geometric stress for fatigue strength evaluation of steel welded joints. Int. J. Fatigue 2004, 26, 1277–1293. [Google Scholar] [CrossRef]
- Kühn, B.; Lukic, M.; Nussbaumer, A.; Günther, H.P.; Helmerich, R.; Herion, S.; Kolstein, M.H.; Walbridge, S.; Androic, B.; Dijkstra, O.; et al. Assessment of Existing Steel Structures: Recommendations for Estimation of Remaining Fatigue Life (No. BOOK); Joint Research Center: Aachen, Germany, 2008. [Google Scholar]
- Yang, H.; Wang, P.; Qian, H.; Niu, S.; Dong, P. An experimental investigation into fatigue behaviors of single-and double-sided U rib welds in orthotropic bridge decks. Int. J. Fatigue 2022, 159, 106827. [Google Scholar] [CrossRef]
Figure 1.
Double-ribbed specimen. (a) section of specimen S2a, (b) section of specimen S2b, and (c) plan of specimen S2.
Figure 1.
Double-ribbed specimen. (a) section of specimen S2a, (b) section of specimen S2b, and (c) plan of specimen S2.

Figure 2.
Single-ribbed specimen. (a) section of specimen S3a, (b) section of specimen S3b, and (c) plan of specimen S3.
Figure 2.
Single-ribbed specimen. (a) section of specimen S3a, (b) section of specimen S3b, and (c) plan of specimen S3.

Figure 3.
Illustration of loading and boundary conditions in single-ribbed specimen. The arrow shows the enlarged view of mesh at welded connection.
Figure 3.
Illustration of loading and boundary conditions in single-ribbed specimen. The arrow shows the enlarged view of mesh at welded connection.

Figure 4.
Illustration of load and boundary condition of double-ribbed specimen. The pink lines represent the centerlines of the closed stiffeners.
Figure 4.
Illustration of load and boundary condition of double-ribbed specimen. The pink lines represent the centerlines of the closed stiffeners.

Figure 5.
Maximum principal stress profile in the weld starting from weld toe in deck to weld toe in rib.
Figure 5.
Maximum principal stress profile in the weld starting from weld toe in deck to weld toe in rib.

Figure 6.
Loading area of single ribbed specimen.

Figure 7.
Stress profile at outer side of rib.

Figure 8.
Stress concentration at inner side of rib.

Figure 9.
Location of path of stress collection for load case 2.

Figure 10.
Specimen and first loading details.

Figure 11.
Specimen and second loading details.

Figure 12.
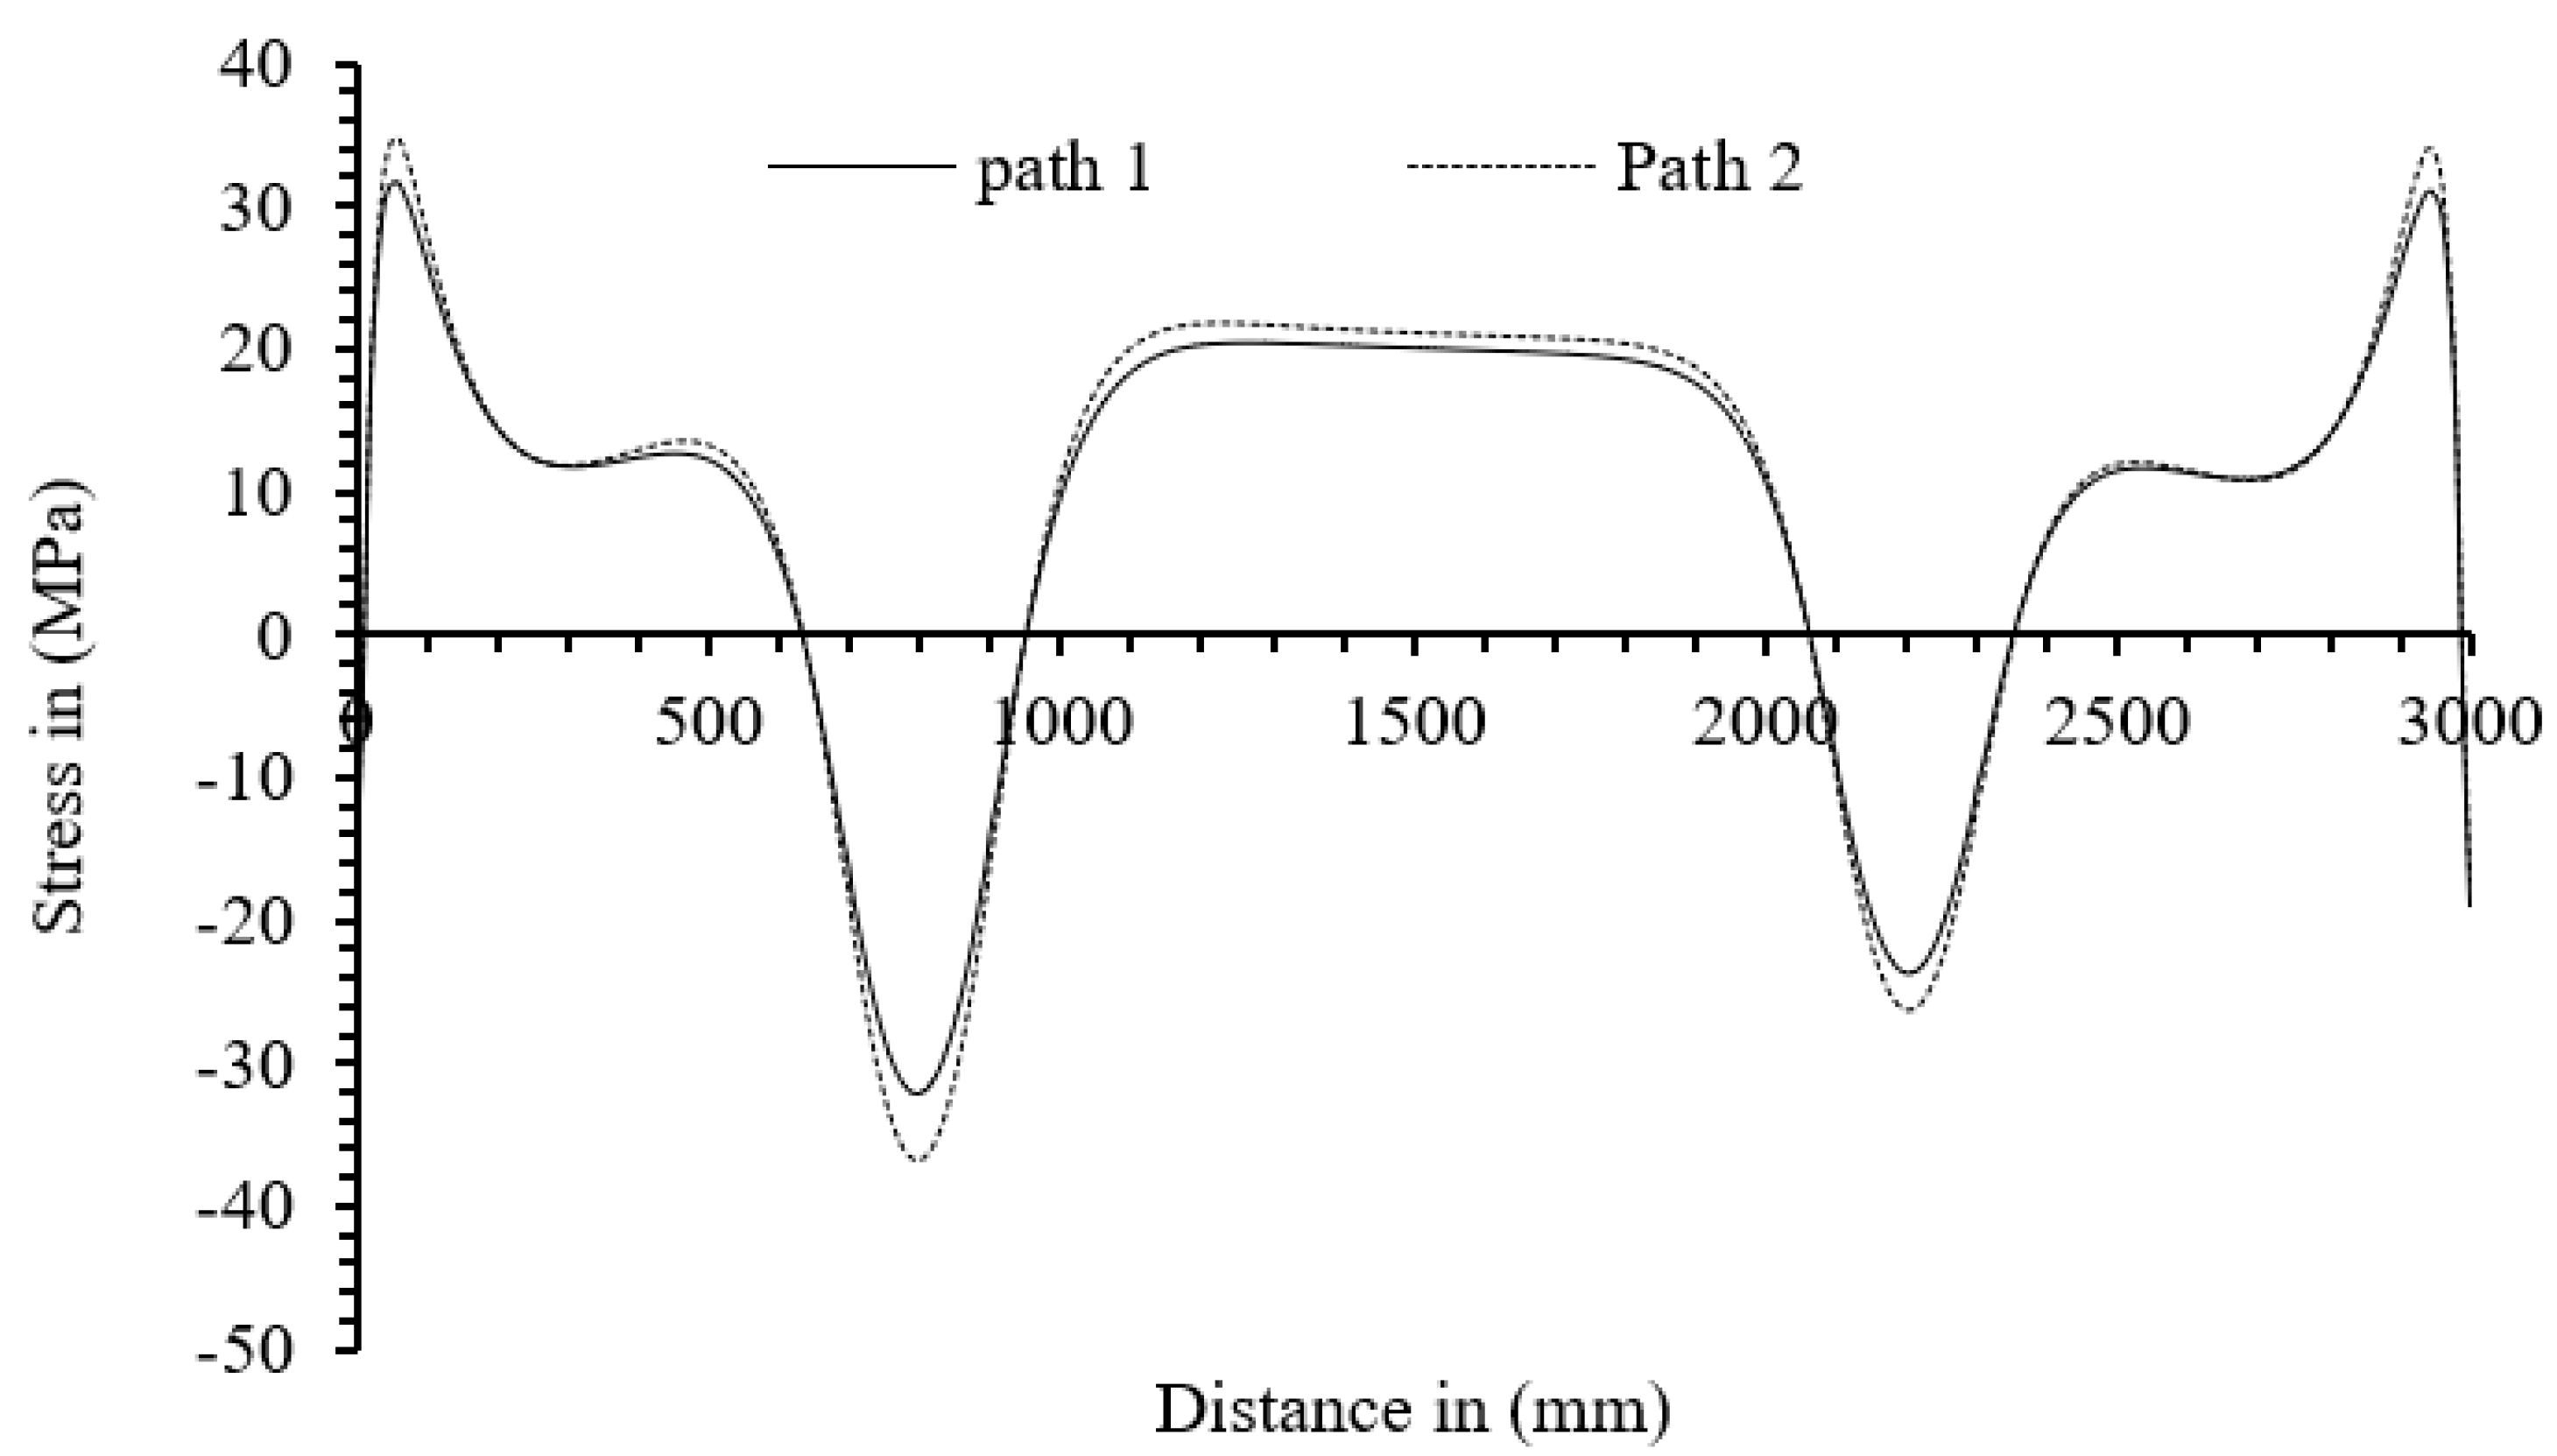
Stress profile of path at 1 and 2.

Figure 13.
Stress profile of path at 3 and 4.

Figure 14.
Comparison of simulation results with test results from Zhu et al. [24].
Figure 14.
Comparison of simulation results with test results from Zhu et al. [24].

Figure 15.
Comparison of simulation results with test results from K C [23].
Figure 15.
Comparison of simulation results with test results from K C [23].

Figure 16.
Illustration of relation of deck thickness and stress concentration at weld toe at deck at deck to U-rib connection.
Figure 16.
Illustration of relation of deck thickness and stress concentration at weld toe at deck at deck to U-rib connection.

Table 1.
Hotspot stress.
| Stress (MPa) Produced at Different Loadings | Remark | |||||
|---|---|---|---|---|---|---|
| 5 kN | 20 kN | 25 kN | 35 kN | 40 kN | ||
| HSS in S2a (MPa) | 32.050 | 128.201 | 160.251 | 224.241 | 253.985 | IIW [25] |
| 31.637 | 126.547 | 158.183 | 221.349 | 251.527 | DNV [27] | |
| HSS in S2b (MPa) | 32.454 | 129.816 | 162.270 | 227.179 | 259.632 | IIW [25] |
| 32.187 | 128.046 | 160.056 | 223.329 | 256.090 | DNV [27] | |
Table 2.
Maximum stress values.
| Stress | Maximum Stress Values in MPa at the | |||
|---|---|---|---|---|
| Outer Weld Toe in Deck | Inner Weld Root/Toe in Deck | |||
| S3a | S3b | S3a | S3b | |
| Maximum Principal | 76.16 | 81.36 | 80.24 | 98.14 |
| S11 | 74.73 | 77.22 | 78.28 | 94.26 |
| Mises | 61.61 | 62.31 | 74.13 | 76.18 |
Table 3.
Stress at different weld penetration.
| Penetration | σhs (MPa) | σ1 (MPa) | σ2 (MPa) | σ3 (MPa) | σ4 (MPa) |
|---|---|---|---|---|---|
| 50% | 164.65 | 208.43 | 187.67 | 135.87 | 75.69 |
| 80% | 164.78 | 213. 50 | 189.88 | 134.12 | 75.34 |
| 100% | 165.29 | 215.89 | 190.12 | 133.51 | 74.47 |
| Double weld | 166.96 | 218.47 | 185.51 | 128.47 | 63.35 |
σhs is hotspot stress at weld toe calculated as per IIW [25]. σ1 is tress concentration at the toe of outer weld in the deck. σ2 is stress concentration at root (for single weld) or toe (for double weld) at inner side of the rib. σ3 is stress concentration at 10 mm away from root or toe in inner side. σ4 is stress concentration at the toe in the rib.
Table 4.
Tabulation of maximum stress values.
| Deck Thickness (mm) | Stress Concentration (MPa) at | |
|---|---|---|
| Deck | Rib | |
| 20 | 169.85 | 58.70 |
| 18 | 208.43 | 75.12 |
| 16 | 261.52 | 100.34 |
| 14 | 334.76 | 136.2 |
| 12 | 412.94 | 186.42 |
Table 5.
Hot spot stress at weld toe in deck.
| DT | RT | WS | σhs (MPa) | Δσw (%) | Δσr | Δσd4 (%) | Δσd2 (%) | Δd (%) | Δσ (%) |
|---|---|---|---|---|---|---|---|---|---|
| 18 | 8 | 2 | 173.71 | 3.21 | 6.238 | 54.96 | 20.45 | 11.11 | 20.45 |
| 18 | 8 | 1 | 168.3 | 4.866 | 55.16 | 21.35 | 11.11 | 21.35 | |
| 18 | 6 | 2 | 163.51 | 1.88 | 45.1 | 24.68 | 11.11 | 24.68 | |
| 18 | 6 | 1 | 160.49 | 45.29 | 23.75 | 11.11 | 23.76 | ||
| 16 | 8 | 2 | 209.23 | 2.44 | 2.629 | 66.95 | 28.68 | 22.22 | 54.96 |
| 16 | 8 | 1 | 204.24 | 2.830 | 65.72 | 27.86 | 22.22 | 55.17 | |
| 16 | 6 | 2 | 203.87 | 2.64 | 62.69 | 16.37 | 22.22 | 45.10 | |
| 16 | 6 | 1 | 198.62 | 65.72 | 17.4 | 22.22 | 45.29 | ||
| 14 | 8 | 2 | 269.18 | 3.07 | 13.454 | 29.77 | 33.33 | 101.09 | |
| 14 | 8 | 1 | 261.15 | 11.995 | 29.6 | 33.33 | 101.11 | ||
| 14 | 6 | 2 | 237.26 | 1.75 | 39.79 | 33.33 | 102.84 | ||
| 14 | 6 | 1 | 233.18 | 41.16 | 33.33 | 105.09 | |||
| 12 | 8 | 2 | 349.32 | 3.21 | 5.322 | ||||
| 12 | 8 | 1 | 338.46 | 2.828 | |||||
| 12 | 6 | 2 | 331.67 | 0.77 | |||||
| 12 | 6 | 1 | 329.15 |
Table 7.
Stress concentration at weld toes and roots of double and single-welded connections.
| Connection | Stress | Stress Values in (MPa) Inner Side | Stress Values in (MPa) Outer Side | ||||||
|---|---|---|---|---|---|---|---|---|---|
| Value | Mises | S11 | S33 | S13 | Mises | S11 | S33 | S13 | |
| Double welded | Max | 27.24 | 8.27 | 5.42 | 15.51 | 19.03 | 8.99 | 6.17 | 9.85 |
| Min | 8.89 | −12.12 | −22.44 | −15.51 | 7.16 | −18.06 | −19.17 | −9.85 | |
| Single welded | Max | 35.38 | 14.28 | 8.89 | 16.22 | 23.45 | 8.96 | 7.04 | 8.70 |
| Min | 18.45 | −19.53 | −28.24 | −16.22 | 6.45 | −16.48 | −26.05 | −8.70 | |
Table 8.
Extreme values of stresses for first loading condition.
| Max Stresses | Stress for Double Tyre Loading (MPa) at | Stress for Single Tyre Loading (MPa) at | ||||||
|---|---|---|---|---|---|---|---|---|
| 1 | 2 | 3 | 4 | 1 | 2 | 3 | 4 | |
| S11(−ve) | −51.27 | −55.23 | −55.40 | −42.58 | −41.43 | −46.10 | −46.30 | −43.12 |
| S11(+ve) | 23.12 | 25.19 | 22.04 | 12.78 | 17.91 | 19.36 | 15.94 | 9.18 |
| S33(−ve) | −46.85 | −45.63 | −47.44 | −45.50 | −35.06 | −34.13 | −35.39 | −33.82 |
| S33(+ve) | 14.90 | 15.32 | 14.54 | 11.14 | 11.17 | 11.43 | 10.48 | 7.87 |
| Mises | 42.74 | 46.04 | 48.83 | 39.42 | 36.29 | 39.12 | 37.53 | 35.11 |
Table 9.
Extreme values of stresses for second loading.
| Stresses | Stress (MPa) at | Stress (MPa) at | ||
|---|---|---|---|---|
| 1 | 2 | 3 | 4 | |
| S11(−ve) | 32.73 | 31.09 | 39.89 | 28.76 |
| S11(+ve) | 31.56 | 33.47 | 29.75 | 15.38 |
| S33(−ve) | 10.38 | 11.97 | 67.18 | 67.97 |
| S33(+ve) | 19.87 | 19.76 | 17.38 | 17.38 |
| Mises | 66.41 | 66.23 | 76.71 | 62.17 |
Disclaimer/Publisher’s Note: The statements, opinions and data contained in all publications are solely those of the individual author(s) and contributor(s) and not of MDPI and/or the editor(s). MDPI and/or the editor(s) disclaim responsibility for any injury to people or property resulting from any ideas, methods, instructions or products referred to in the content. |
© 2024 by the authors. Licensee MDPI, Basel, Switzerland. This article is an open access article distributed under the terms and conditions of the Creative Commons Attribution (CC BY) license (https://creativecommons.org/licenses/by/4.0/).
Share and Cite
MDPI and ACS Style
KC, D.; Dahal, B.K.; Dangi, H. Methods to Increase Fatigue Life at Rib to Deck Connection in Orthotropic Steel Bridge Decks. CivilEng 2024, 5, 288-306. https://0-doi-org.brum.beds.ac.uk/10.3390/civileng5010015
AMA Style
KC D, Dahal BK, Dangi H. Methods to Increase Fatigue Life at Rib to Deck Connection in Orthotropic Steel Bridge Decks. CivilEng. 2024; 5(1):288-306. https://0-doi-org.brum.beds.ac.uk/10.3390/civileng5010015
Chicago/Turabian StyleKC, Diwakar, Bhim Kumar Dahal, and Harish Dangi. 2024. "Methods to Increase Fatigue Life at Rib to Deck Connection in Orthotropic Steel Bridge Decks" CivilEng 5, no. 1: 288-306. https://0-doi-org.brum.beds.ac.uk/10.3390/civileng5010015