Reducing Bridge Pier Scour Using Gabion Mattresses Filled with Recycled and Alternative Materials


Department of Civil Engineering, School of Architecture, Design and the Built Environment, Nottingham Trent University, Nottingham NG1 4FQ, UK
*
Authors to whom correspondence should be addressed.
Eng 2020, 1(2), 188-210; https://0-doi-org.brum.beds.ac.uk/10.3390/eng1020013
Submission received: 8 September 2020
/
Revised: 7 October 2020
/
Accepted: 27 October 2020
/
Published: 31 October 2020
(This article belongs to the Special Issue Advanced Research in Hydraulics and Water Engineering)
Abstract
:Scour is caused by the erosive action of flowing water, which causes materials from the bed and the banks of a river to be moved or unsettled. Hydraulic structures can be drastically impacted as a result of scour, which is why it is one of the most common causes of bridge failure around the world. With a predicted increase in climate conditions, the subsequent failure of hydraulic structures due to scour is likely to proliferate as the flooding of waterways is projected to rise. This study aims to determine the viability of introducing alternative materials to a scour countermeasure used in construction—gabion models—in a bid to improve the sustainability of a project whilst providing suitable scour mitigation measures. Existing literature was examined to comprehend the different scour countermeasures used, as well as the use of alternative materials that can be used as a scour countermeasure. A laboratory experiment was then carried out using a bridge pier embedded in a flume channel protected by gabion mattresses filled with alternative materials—stone, clothing and plastic—to analyse their effectiveness. The results demonstrate that stone filled gabions are most effective at reducing bridge pier scour. However, recycled clothing as a gabion fill could prove to be a viable alternative in construction projects, potentially leading to reduced construction costs and greater sustainability. However, more research on a greater scale is required to test this thesis.
1. Introduction
Various investigations have been undertaken which aim to determine the effectiveness of reducing bridge pier scour using different countermeasures. Yoon [1] specifically investigated the use of wire gabions (boxes filled with stones wrapped in wire mesh), containing uniform stone in a flume. By varying the depth, coverage and thickness to length ratio, Yoon determined that gabion mattresses were more cost effective than using riprap stones as a countermeasure. Similarly, Akib et al. [2] looked at reducing local bridge pier scour by combining geobags filled with alternative materials (using crushed concrete and oil palm shells) and collars, providing research into environmentally friendly solutions to scour countermeasures. Akib et al. [2] concluded that using a geobag and steel collar was 96% more effective than other countermeasures tested.
1.1. Scour
There are three main forms of scour that occur, and it is mainly driven by an increase in flow rate, either due to flooding or changes to the flow of the river.
- Local scour is related to the presence of a hydraulic structure and occurs directly around the hydraulic structure; a bridge pier or abutment is a good example of this. Local scour can lead to sediment being removed from the bed and subsequent undermining of the bridge foundation leading to failure.
- Contraction scour can also affect hydraulic structures and tends to be caused by a reduction in the width of the river channel (naturally or manmade). In times of flooding, excess water from the adjacent floodplain may be channelled into the bridge opening, increasing flow rate and leading to potential undermining of the bridge foundation.
- General scour encompasses any types of scour that occur naturally, not in the presence of hydraulic structures. Over time, natural scour occurs as a result of erosion and degradation; therefore, non-cohesive deposits, such as gravels and sands in rivers, are more likely to experience scour. However, during floods, the process of natural scour is rapidly increased.
Local scour can take place in clear-water conditions, where flow velocity upstream (µ) is lower than the velocity threshold (µTC) of the material surrounding the bridge pier and before general movement of sediment from the riverbed has occurred. Scour will only occur if the velocity threshold is exceeded, due to an increase in flow, possibly caused by a blockage in the river or installation of flow-altering measures, such as groynes or vanes. If the velocity threshold is exceeded, then sediment is eroded and removed from the scour hole and is deposited downstream. This will continue until no more material is removeable from the scour hole. In live-bed conditions, scour can also occur where µ is greater than µTC; sediment is then removed from around the bridge pier creating a scour hole. As the flow velocity upstream is greater than the material velocity threshold, sediment is continuously transported in and around the scour hole from upstream to offset the removal of local material from around the bridge pier. The depth of local scour can therefore be written as .
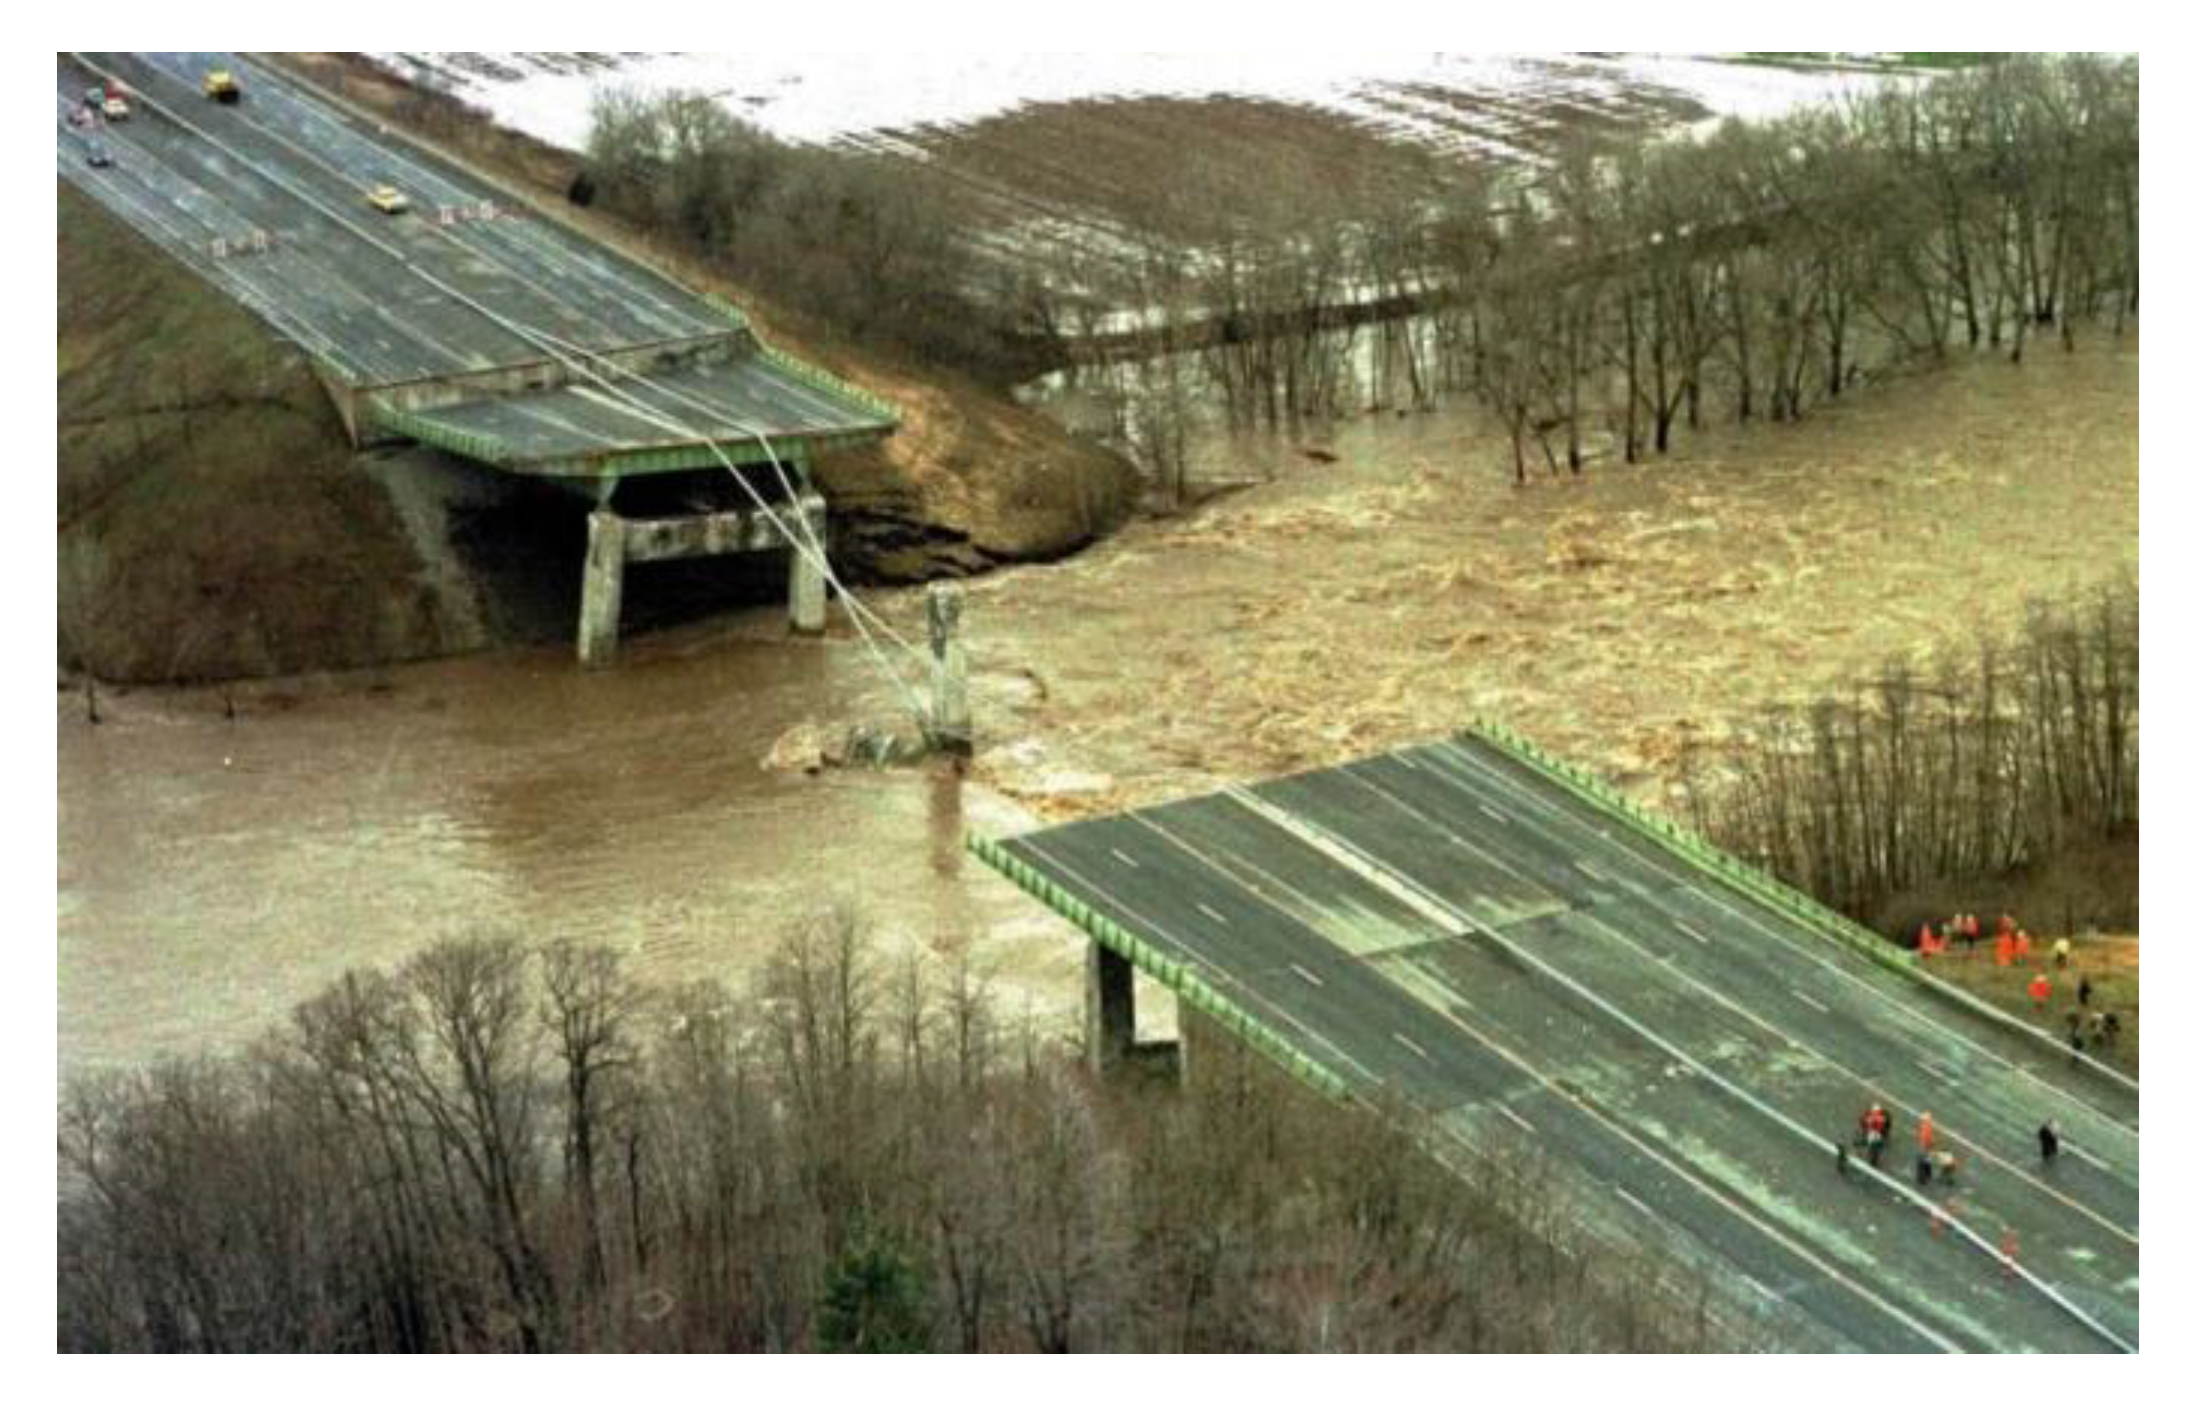
Bridge scour is a predominant issue around the world; in the USA between 1989 and 2000, 503 bridge failures were examined and it was found that flooding and scour contributed to 53% of all of these failures [3]. The study outlined that the average age of a bridge before failure was 52.5 years, revealing that almost half of the bridges examined were failing earlier than their anticipated design life. In New Zealand, an annual budget of NZD 36 million is allocated to resolve scour actions as a result of flooding [4]. More relevant to this research proposal, in the UK between 1846 and 2013, there have been a recorded 100 incidents of rail bridge/culvert failures related to flooding and scour, leading to a number of closures to railway lines and 15 deaths [5]. These findings highlight that there is a high expense to bridge failures as a result of scour, in terms of human life as well as financially. One example is the Schoharie Creek bridge collapse in 1987, as shown in Figure 1, which occurred because of local flooding, intensifying scour which weakened the bridge piers’ foundations causing them to collapse, which resulted in 10 fatalities.
1.2. Horseshoe and Wake Vortex
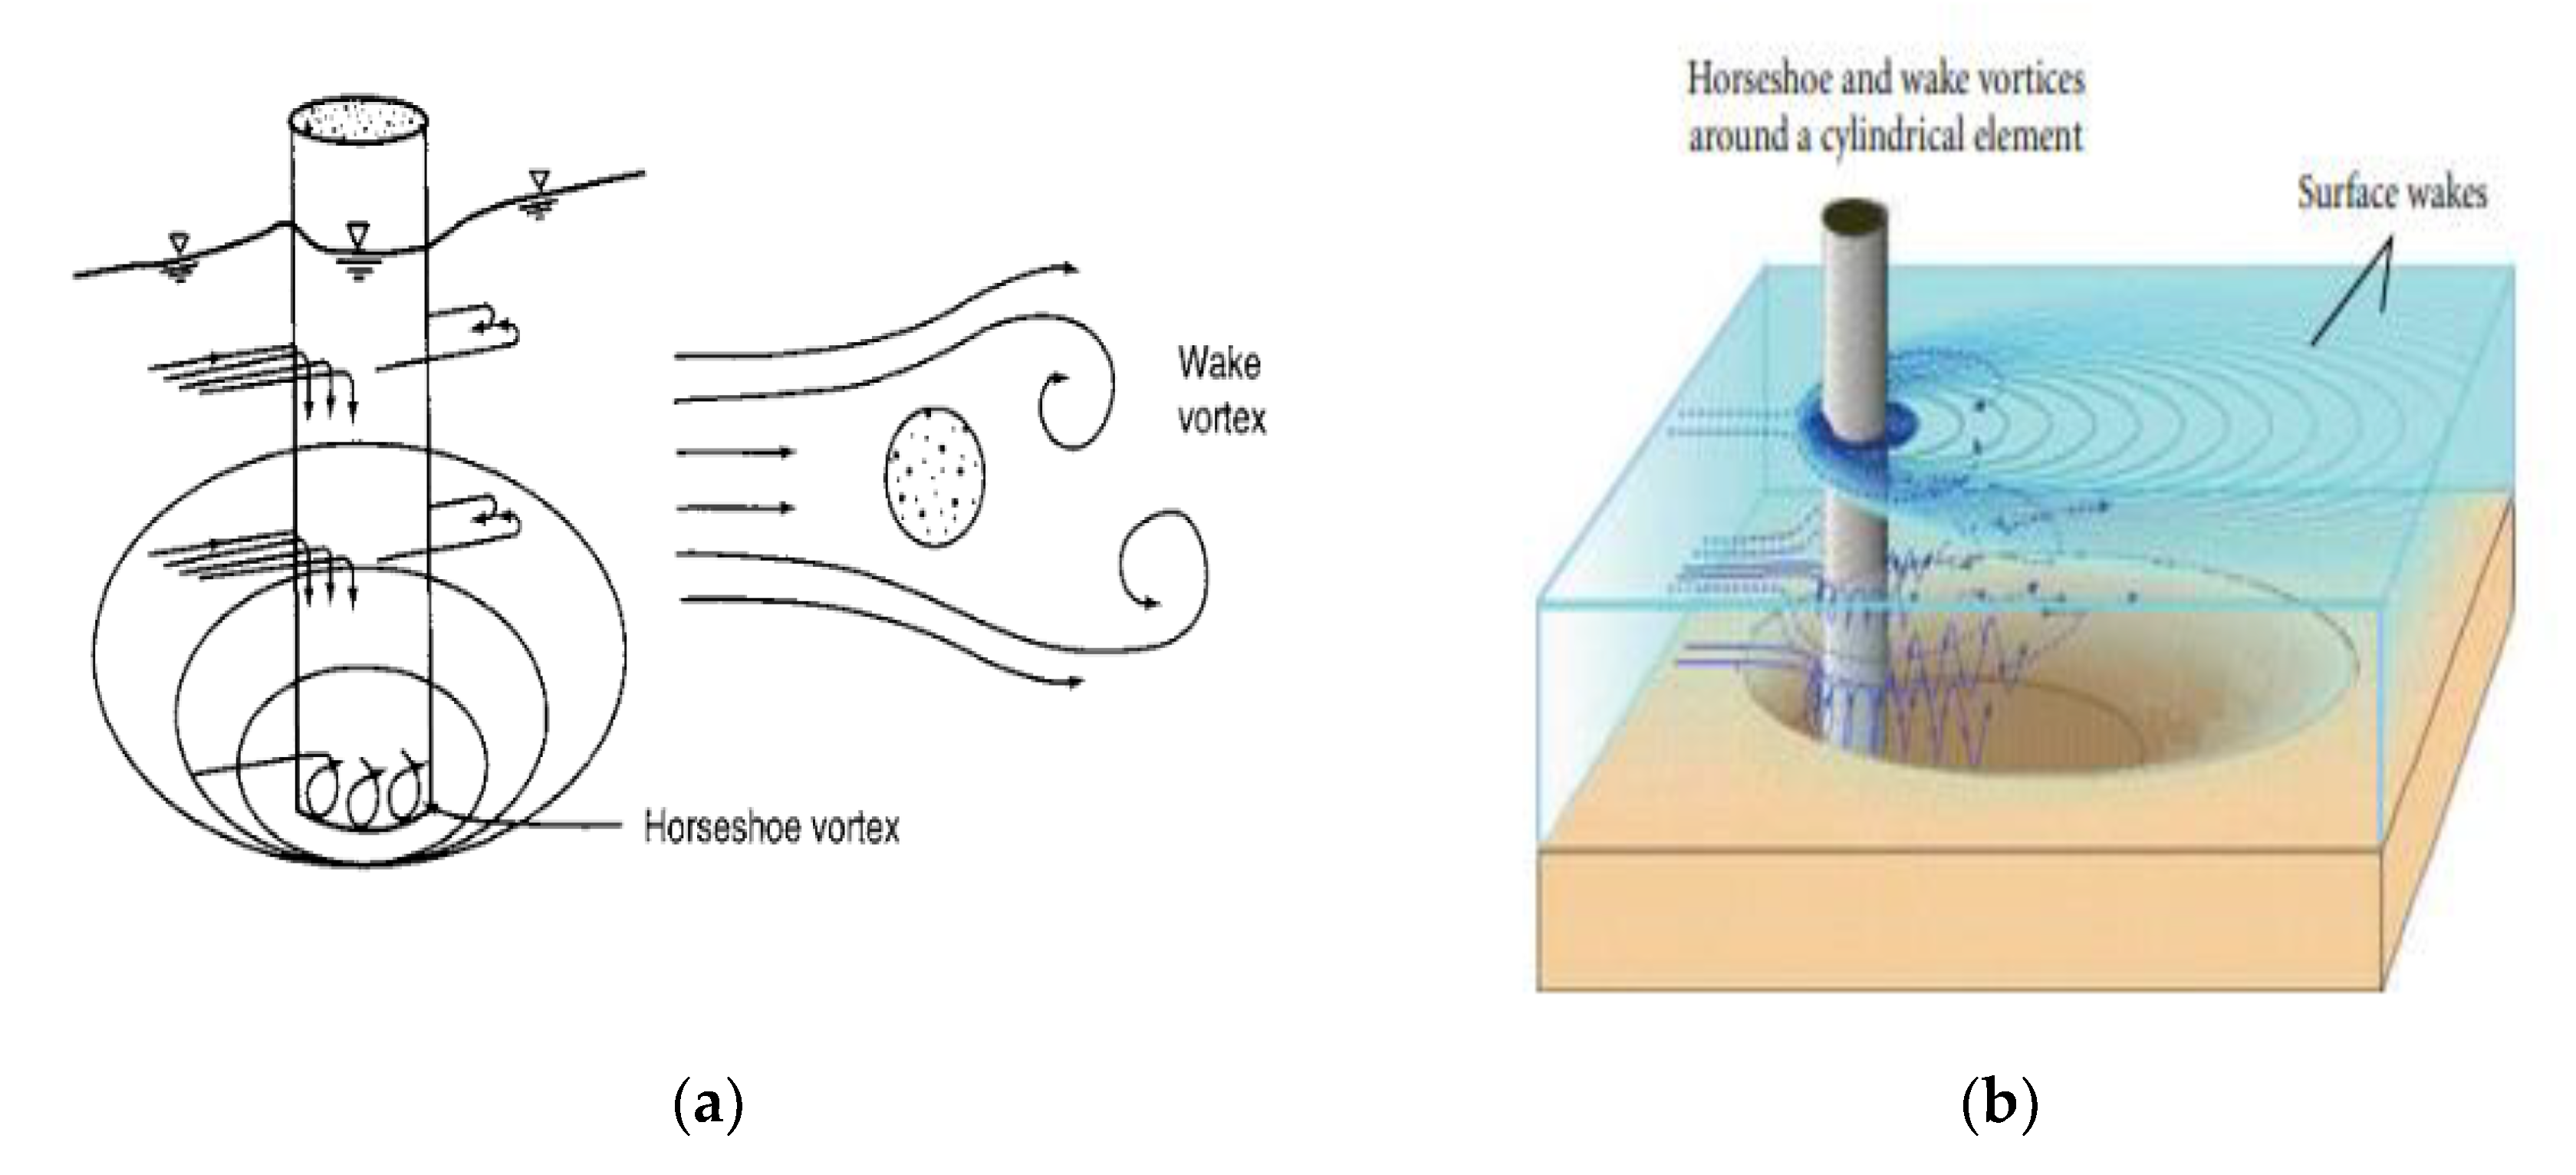
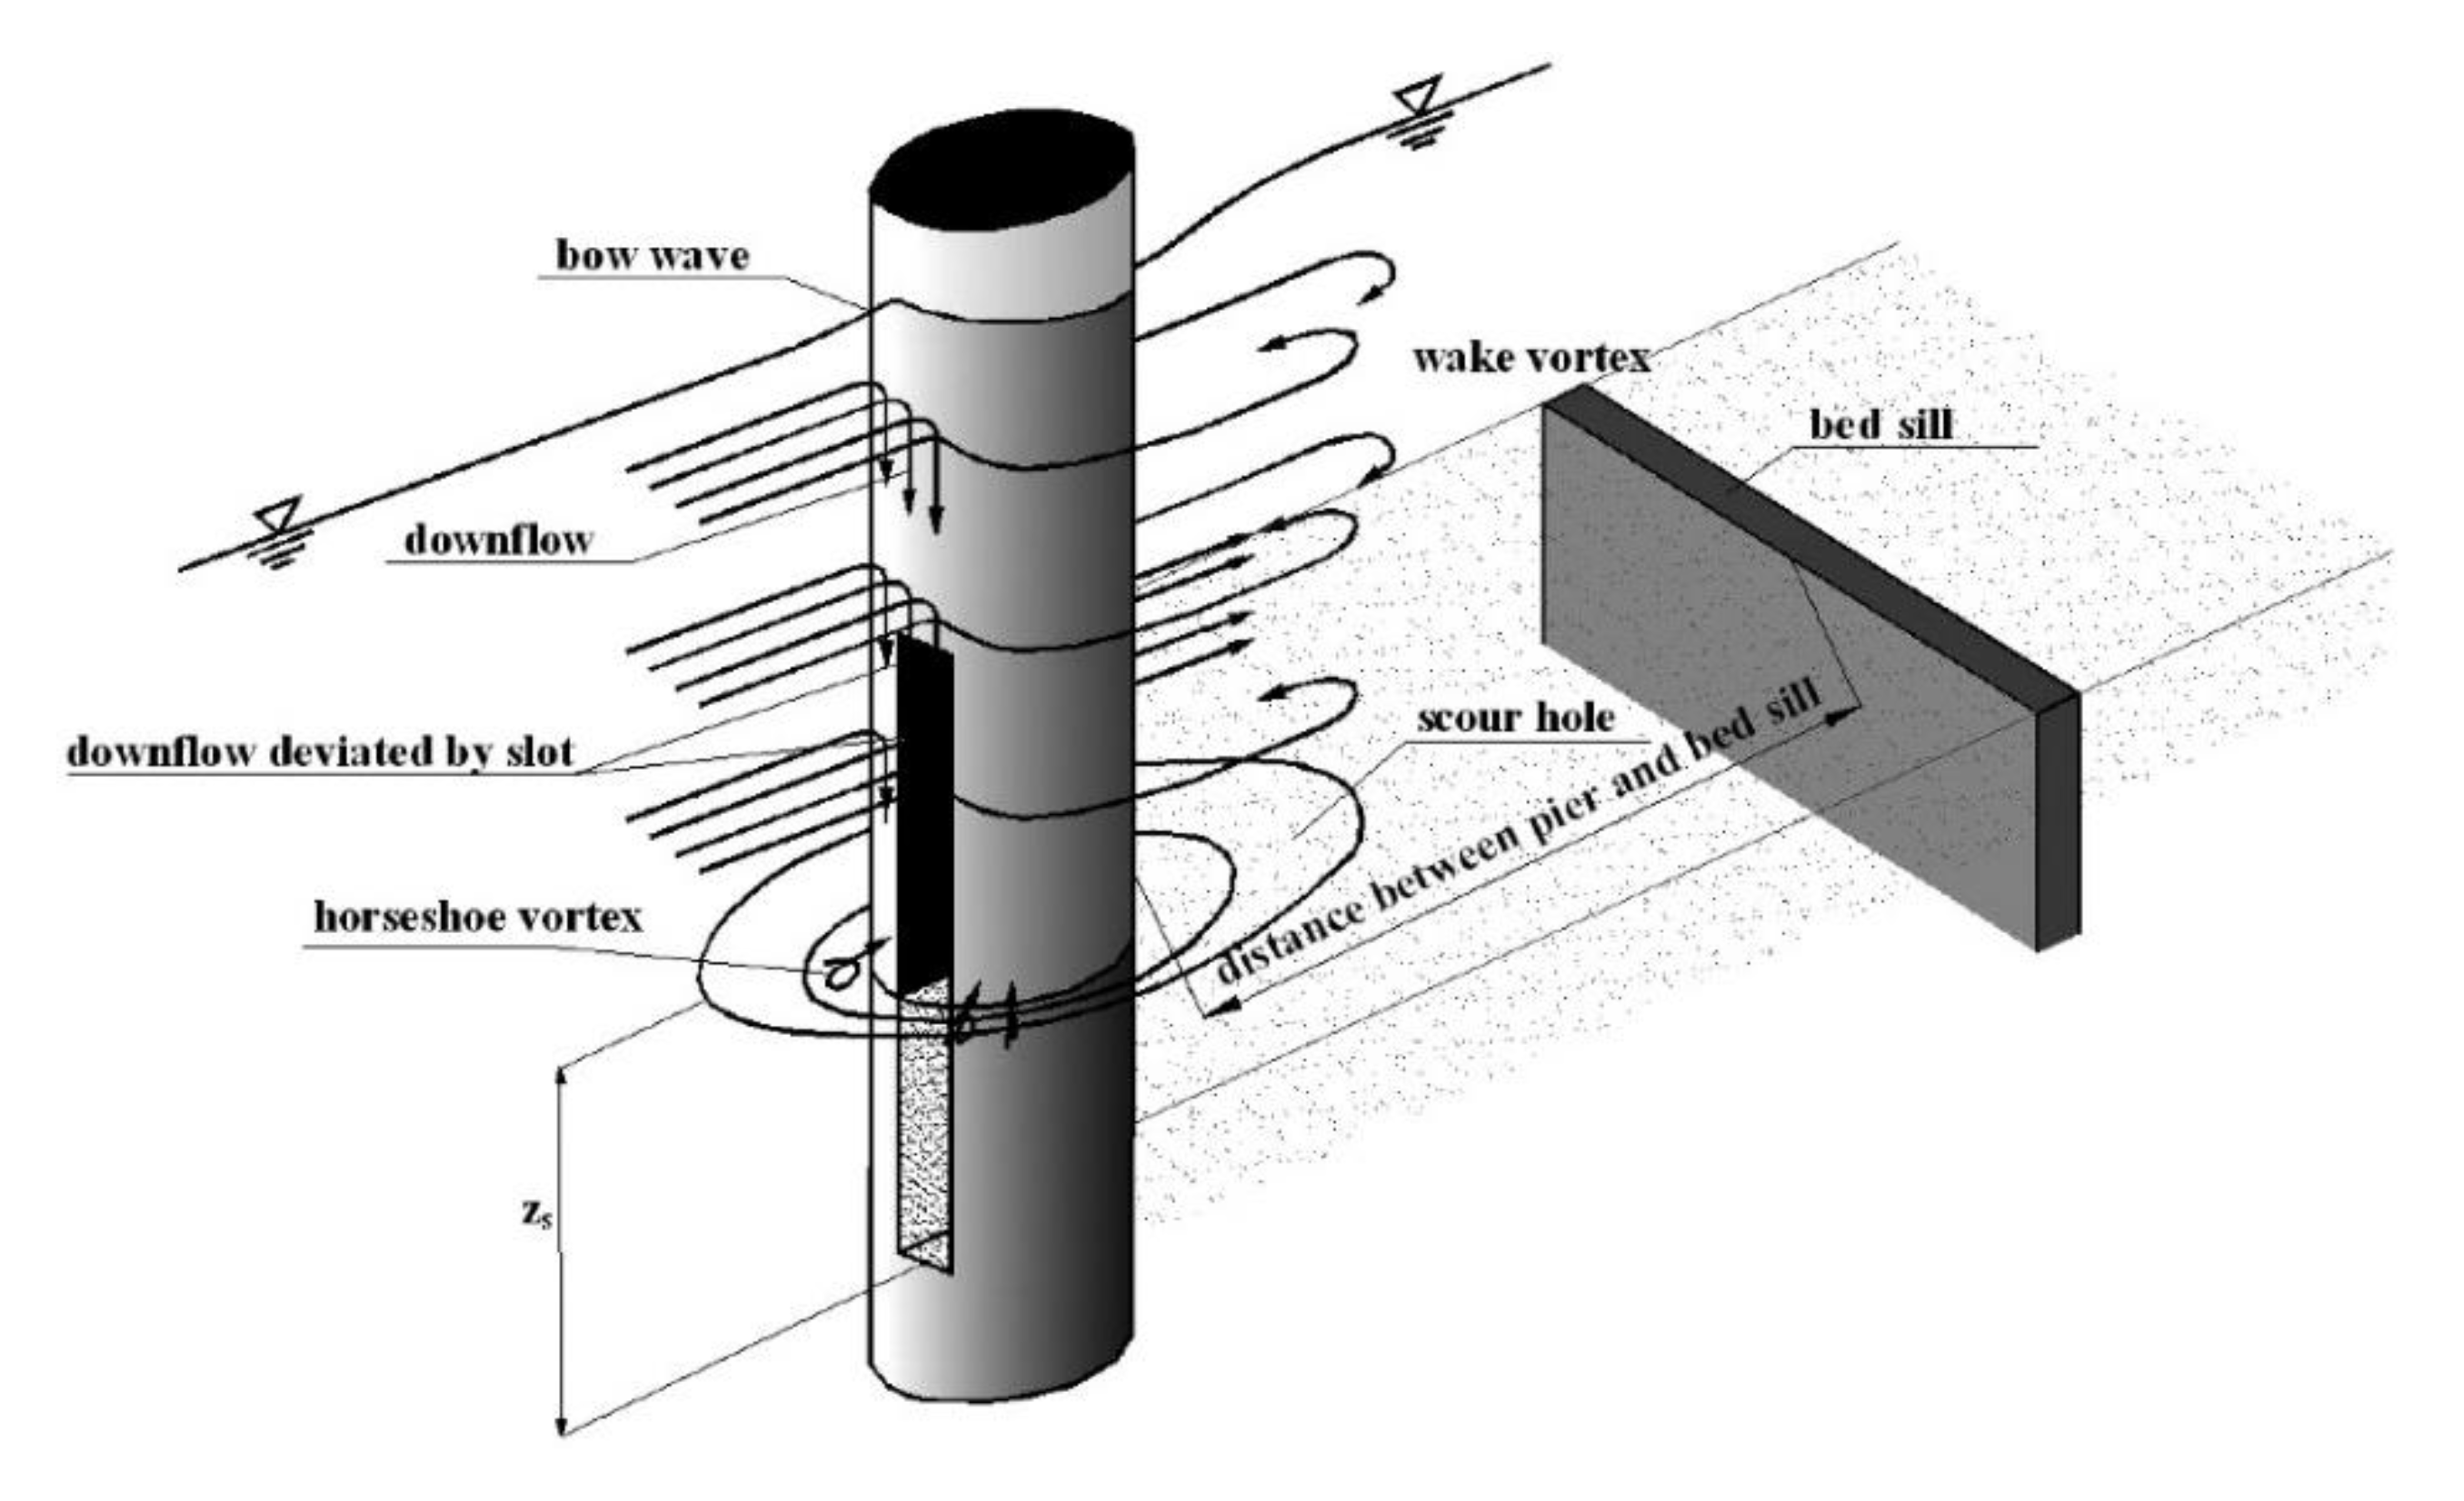
When a bridge pier obstructs flow in a stream, a boundary layer separation occurs, where a point in contact with the bridge pier reverses in direction from the upstream bed in the approach flow, resulting in a horseshoe vortex [7]. This leads to the creation of a scour hole as shown in Figure 2. Various studies have investigated the causes of bridge scour by studying horseshoe vortices, as this is believed to be the primary factor in causing bridge scour.
A strong horseshoe vortex occurs in front of a bridge pier whereas a weaker wake-vortex system occurs in the rear of a cylindrical bridge pier downstream [9]. The mean size of a primary horseshoe vortex size is approximately 20% of the pier diameter [10]. From these investigations, it is evident that local scour countermeasures are required primarily upstream of the bridge pier, where the stronger horseshoe vortex forms, as well as downstream of the bridge pier where the weaker wake vortex system forms. Scour countermeasures can be installed downstream of a bridge pier, such as bed sills. Bed sills can reduce the scour depth around bridge piers by more than 80% in optimum conditions and when the distance from the bed sill to the bridge pier is smaller, the greater the reduction in depth [11]. Scour holes can occur downstream of bed sills where it was discovered that higher bed sills had a lower relative maximum scour depth compared to lower bed sills [12]; this was due to the build-up of sediment on the sills taking longer on higher bed sills. Whilst this information is insightful and provides a solid indication of the interaction between hydraulic structures and their relation to scour, it is notable that the experiment was not conducted using model bridge piers, therefore these findings may not be applicable.
1.3. Flow-Altering Scour Countermeasures
Local scour has been extensively investigated by various researchers who have focused on methods which aim to reduce scour. Haque et al. [13] and Chang and Karim [14] investigated the use of sacrificial piles and concluded that piles reduce the scour depth. Park et al. [15] explored further the effect of debris accumulation at sacrificial piles, finding that an increase in debris further reduced scour depth. Ghorbani and Kells [16] and Odgaard and Wang [17] investigated the use of Iowa vanes (also called deflector vanes) and found that at certain positioning and angle, the scour depth can be reduced drastically by up to 87.7%. It is worth noting that the scour hole which typically forms at the bridge pier is transferred to the corner of the Iowa vane, meaning that the Iowa vane then becomes more prone to failure, and could impact the stability of the bridge if it does so.
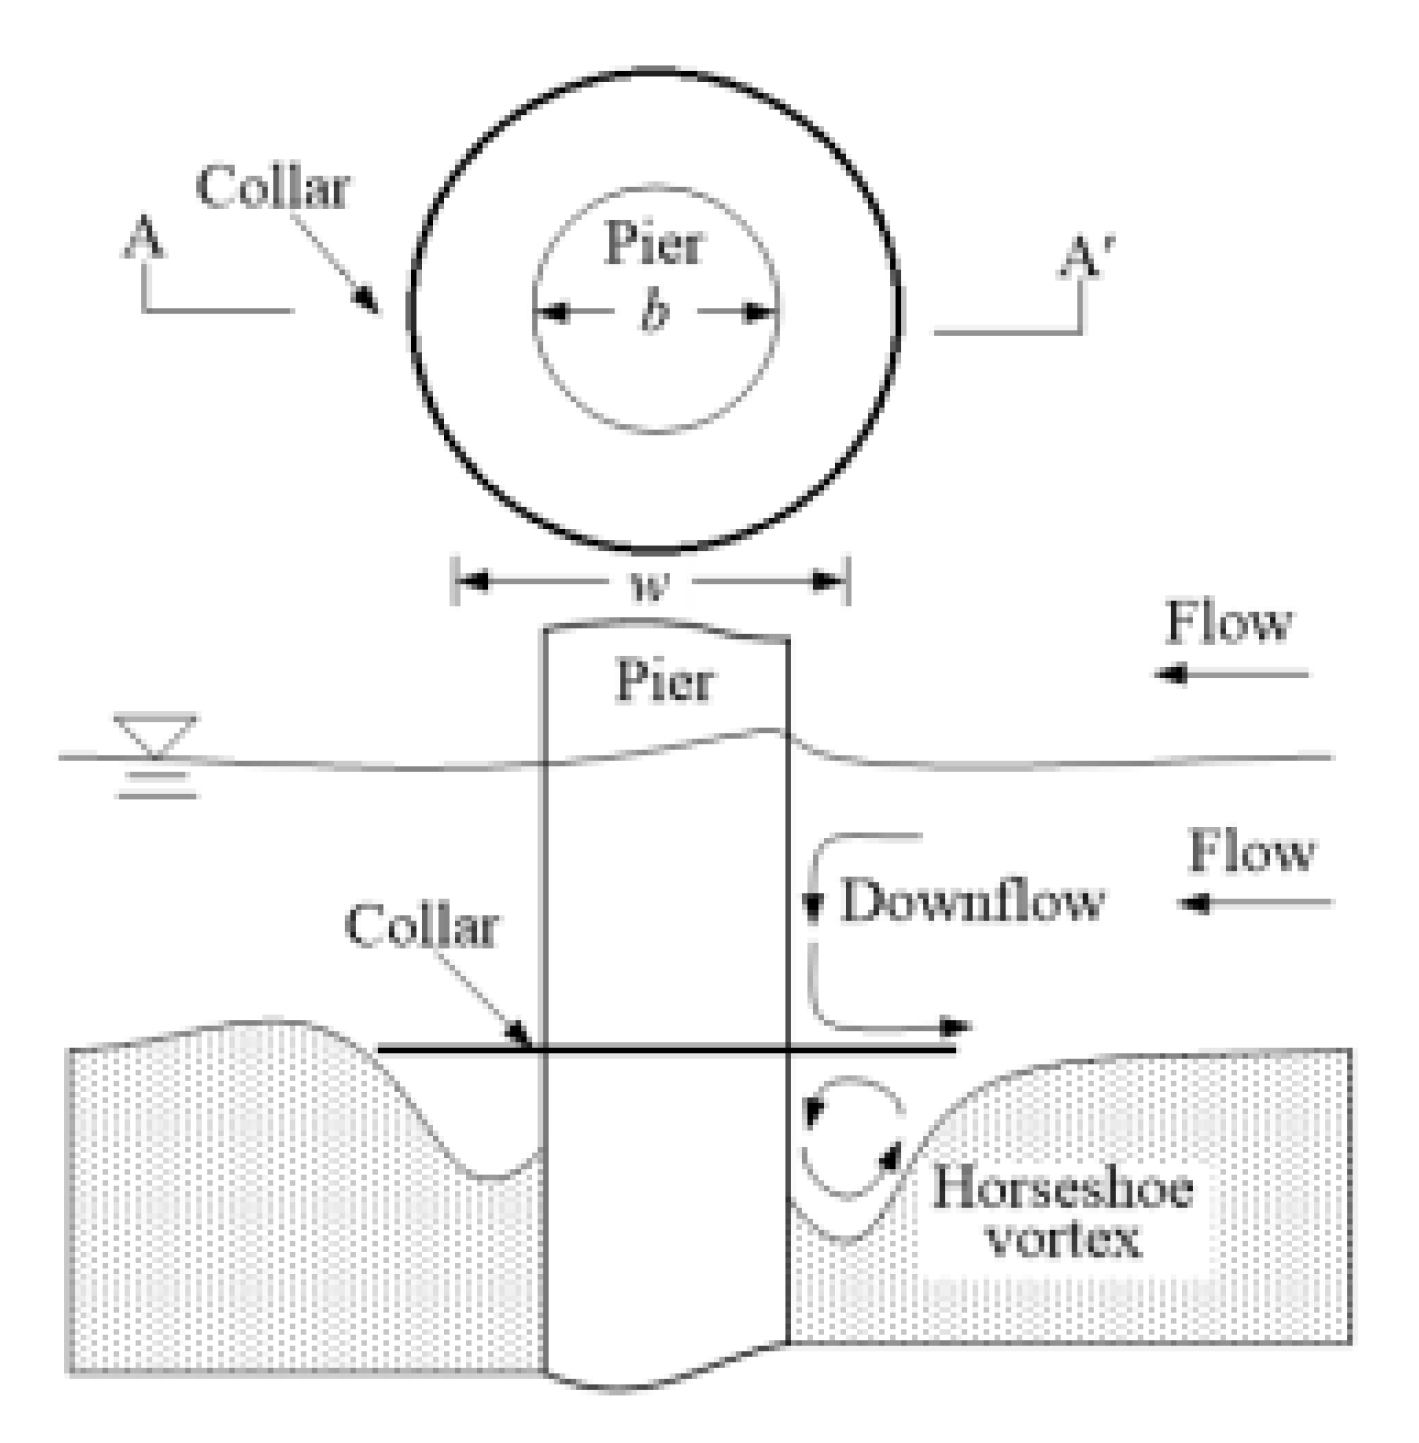
Jahangirzadeh et al. [18] and Zarrati [19] experimented with the impact of collars on bridge piers and both confirmed that a larger collar (W/D, where W = width of collar and D = pier diameter) resulted in a larger reduction in scour depths. The shape of the collar applied is also a factor in scour reduction (in the former experiment, rectangular collars provided a further 8% reduction in scour). The placement of a collar under the bed of the sediment also leads to a reduction in scour, although the benefit is quite low as the collar becomes part of the scour hole as shown in Figure 3. Flow-altering scour countermeasures have been investigated extensively compared with other forms of scour countermeasures, however, the flow-altering countermeasures are more effective at reducing scour compared with bed armouring countermeasures. These experiments are all examples of flow-altering countermeasures; other types of this measure include tetrahedron frames, bed sills, groynes and spurs (the latter tend to be deployed to prevent contraction scour as opposed to local scour).
1.4. Bed Armouring Scour Countermeasures
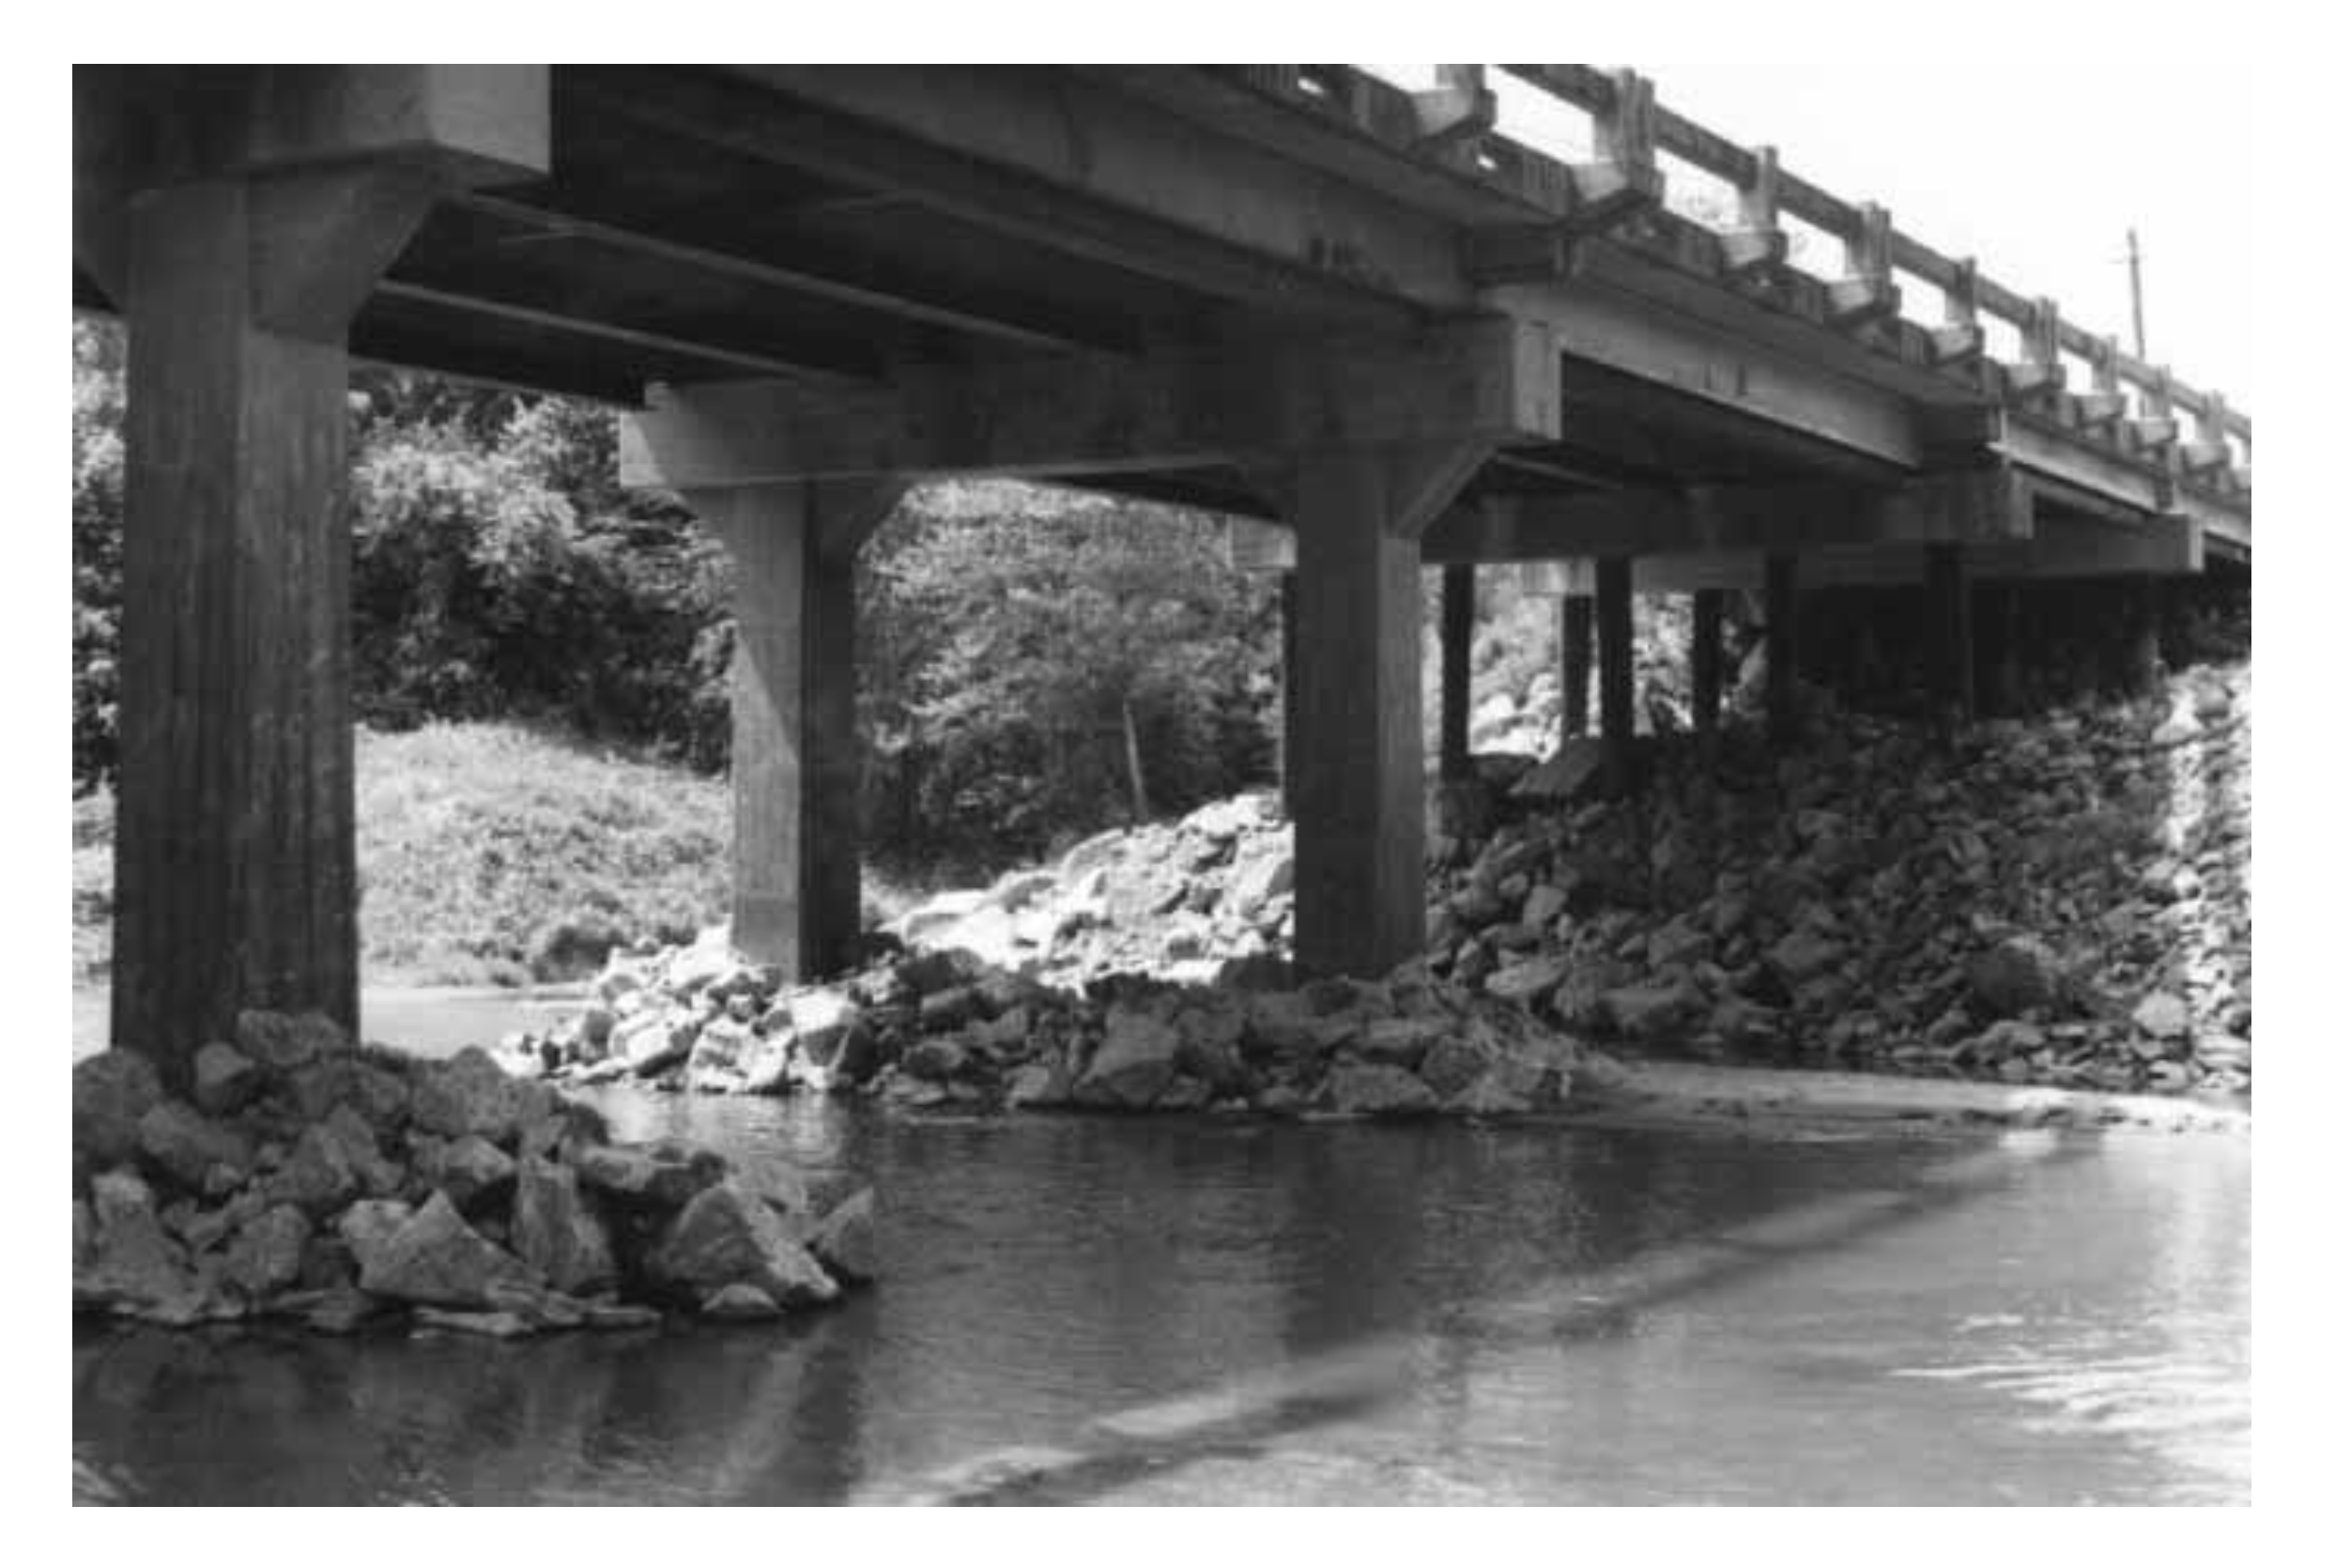
Another type of scour countermeasure is bed armouring; countermeasures in this category include riprap protection, as shown in Figure 4, reno mattresses, gabion baskets, concrete slabs and armed soil with geotextile. Research has been undertaken in this area by Unger and Hager [21] and Lauchlan and Melville [22], where it was identified that the larger the size and area of the riprap placement, the greater the reduction of scour at bridge piers is. Although, it was found that when riprap stones fail and are transported, some may deposit in the scour hole, providing additional scour protection to the bridge pier [22], and therefore may provide skewed results.
Akib et al. [24] investigated the use of geobags at skewed bridge piers, discovering that geobags filled with recycled crushed concrete is a highly effective method to reduce local bridge pier scour, with results ranging from 50% to 81%, all at varying flow velocities. Whilst the results showed that the larger the size of the concrete used in the geobag, the better the reduction in scour, it still showed that the geobags failed within 24 h, after being moved from their original location by the flow velocity.
Similarly, Korkut et al. [25] found that at bridge abutments when collections of geobags were tested, they reduced scour depth; however, failure at the perimeter of the geobags occurs, leading to transportation from the flow into the scour hole. The failure of geobags and transportation into the scour hole could provide further scour protection to the bridge abutment, which is supported by Lauchlan and Melville’s [22] research into the use of riprap stones. The investigation by Korkut et al. [25] also determined that geobags should be placed under the sediment depth to increase effectiveness against scour. It must be noted that both the geobag investigations feature different bridge foundations (skewed pier compared to abutments), therefore results could potentially fluctuate even if the bridge foundations are similar, such as a skewed pier and a regular pier.
Limited research has been conducted in the use of cable-tied blocks (concrete blocks/slabs which are connected) as a scour countermeasure. Parker et al. [26] found that cable-tied blocks are prone to failure by uplift and, in absence of geotextile, leading to settlement of the cable-tied blocks due to leaching of sand from pores of the mattress. When a partial geotextile was used, results improved vastly, particularly due to the concrete blocks acting as an anchor to the geotextile. In some cases, the location of scour was transferred from the bridge pier to the edge of the cable-tied blocks; whilst scour was not eliminated, it had a favourable effect as it helped to bury the block further and anchor the mattress. Hoe [27] considered using cable-tied blocks in the form of ceramic tiles at a 5 mm thickness surrounding bridge abutments. Whilst significant amounts of scour developed downstream from the bridge abutment, the spill-through slope downstream of the abutment did not fail. The implementation of a geotextile could have contributed to a reduction in scour; however, it must be noted that the experiment was conducted at bridge abutments, therefore geotextile may not have been as effective as at bridge piers. Cable-tied blocks with geotextile should be considered as a viable alternative to riprap in sand bed streams.
1.5. Pier Adjustment Scour Countermeasures
More recently, there have been investigations into newer methods of local scour countermeasures which focus on changing the properties of the bridge pier by introducing a bridge pier slot or by altering the pier shape and inclination. Karimi et al. [28] and Kitsikoudis et al. [29] studied the effect of pier inclination on bridge pier scour and both supported each other’s findings that higher inclination angles led to a greater reduction in scour depth compared to other inclination angles tested during their relative experiments. The reduction in scour is due to the reduction in the wake vortex depth and area coverage.
Varying the bridge pier shape can also be effective in reducing scour; Murtaza et al. [30] investigated the use of square, circular, oval and octagonal pier shapes. Findings from this research discovered that octagonal pier shapes resulted in the largest scour reduction and square pier shapes were the worst performing in reducing scour. Oval and circular pier shapes provided mostly results within 10% of each other, whilst all pier shapes displayed evidence of scouring in the upstream side of the pier. Likewise, Farooq and Ghunman [31] found similar results, determining that square-shaped piers resulted in the greatest scour depth results, whereas the octagonal-shaped pier led to the greatest percentage scour reduction (34% when pier size was 5 cm and 31% when bed material median grain size was increased). Furthermore, the research revealed that scour profiles were similar in that the upstream face of the pier had a larger scour depth compared to the downstream face.
Hajikandi and Golnabi [32] investigated changing the various configuration of slots on bridge piers, including Y, T and straight slots. Results revealed that the installation of any slot reduces the scour dimensions, depth and width; straight slots were found to be the most effective out of the three slot types tested, resulting in a 38% scour reduction compared to 33% from Y-shaped slots. The depth of the embedment of the slot towards the bed material also led to reduction of the scour depth in all slot types. An example of a pier slot is shown in Figure 5.
Obied and Khassaf [33] tested the impact of rectangular slots with rounded edges on scour depth, and the results identified that increasing the slot length leads to a proportional decrease in the scour depth ratio. Through testing five different slot lengths, scour depth reduction increased from 31% to 49% as slot length increased. Similar to the findings of Hajikandi and Golnabi [32], this research highlights that adding a slot to a bridge pier is an effective method to reduce scour, due to the downstream flow being diverted and the horseshoe vortex being reduced, and it also suggests that additional measures including embedment and slot length may also provide further reductions. Whilst installing slots to a bridge pier reduces scour, it poses the risk of also reducing the structural strength of the bridge pier due to the loads from the bridge not having a suitable pathway to transfer to the bridge foundations. A weakened bridge pier could lead to collapse. To prevent this, the bridge foundations may require larger or stronger foundations to compensate for the loss of strength, therefore making the insertion of a slot into the bridge pier potentially less viable.
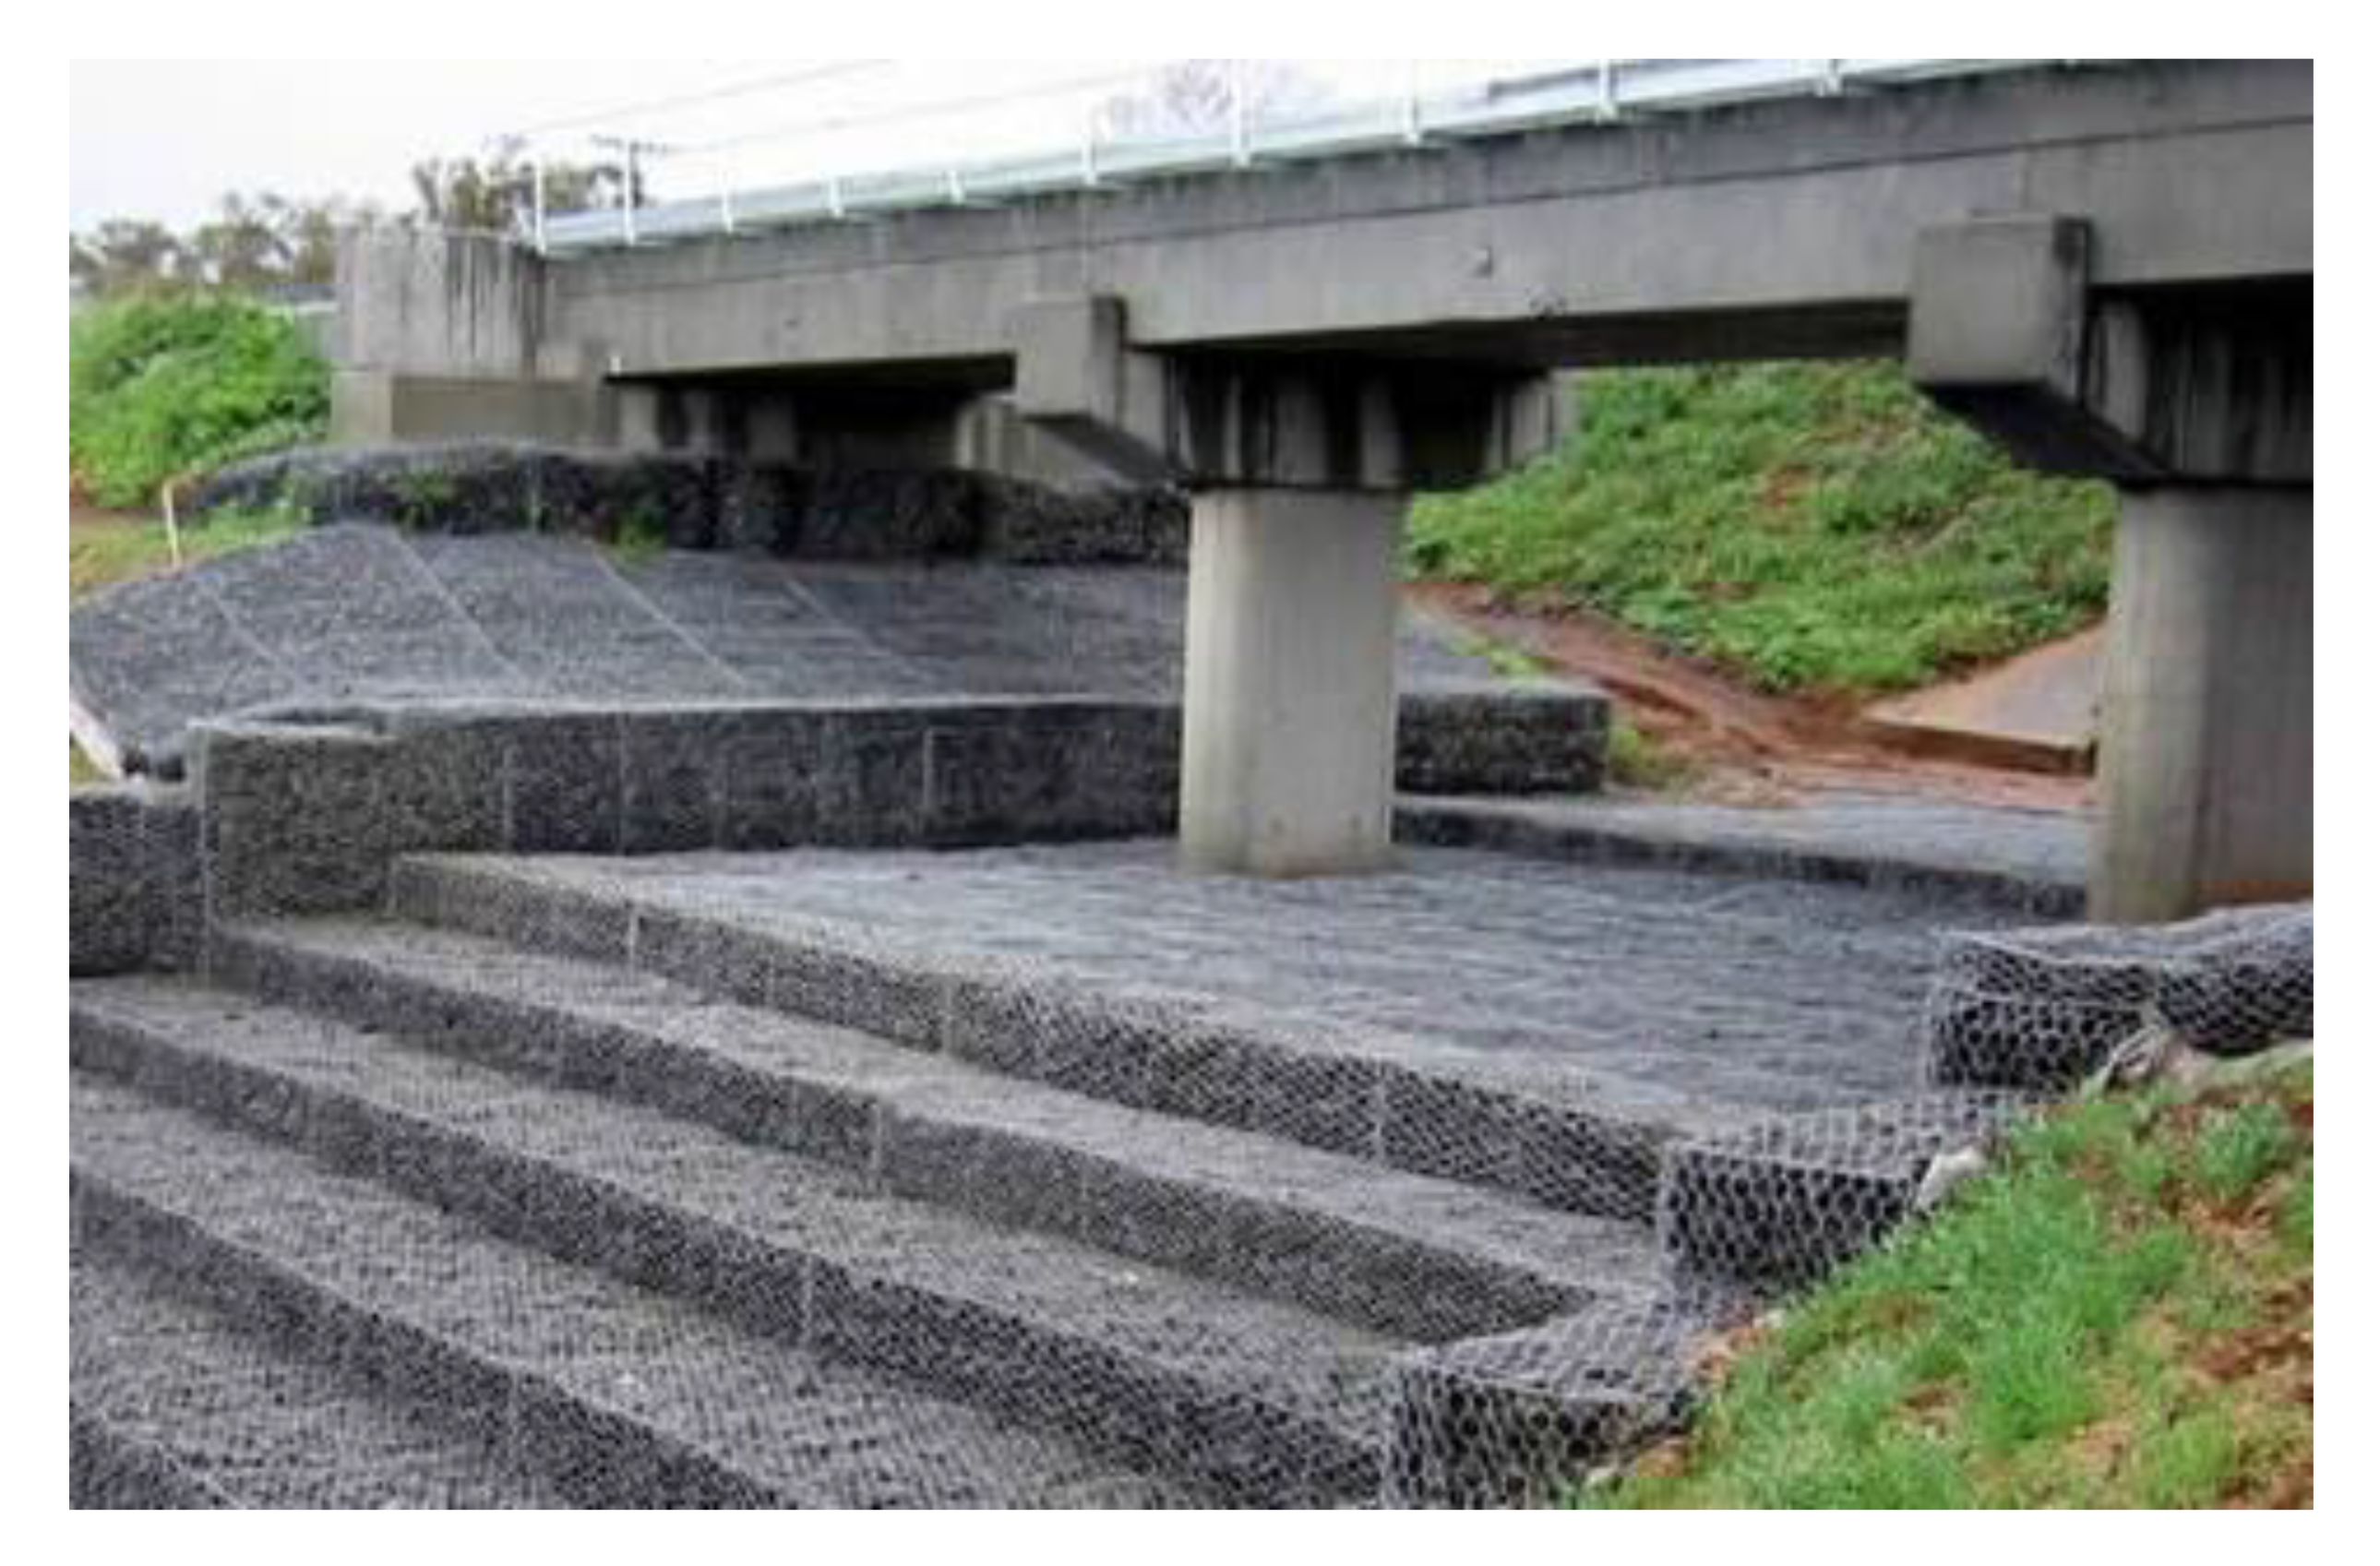
1.6. Gabion Scour Countermeasures
Gabions are wire mesh baskets filled with stones of varying size as shown in Figure 6. There are various types of gabions, including sack gabions, gabion mattresses and box gabions, which vary in shape, size and use. Little research has been performed into the use of gabions for reducing bridge pier scour, and current practice involves using gabions as revetment along river channels. Gabions are at risk of failure in several ways; they may pull away from the bridge pier if exposed to excessive edge scour, leading to the failure of the gabion, typically caused by winnowing, which is the removal of fine material (of the sediment), dependant on the size of particles of two different sediments. The wire used in the gabion is however the most likely to fail; it can be damaged from corrosion (if the water contains contaminants), abrasion from debris accumulation or if excessive settlement occurs it could lead to failure of the wire in tension as the gabion deforms; therefore, lacing wire should be used to tie the gabion mattresses together. All these failure mechanisms would likely lead to the transport of fill material downstream, and therefore the placement of gabions into certain waterways may not be viable; for example, coarse bed rivers.
Yoon [1] investigated the use of wire gabions filled with stone, finding that as the length to thickness ratio increased, the gabion stability also increased, up to a limiting factor of L/t = 3. Any value greater than L/t = 3 is likely to induce extra material costs which may offset any additional gabion stability obtained, demonstrating that increasing L/t is not advantageous. Furthermore, wire gabions can provide better performance in reducing scour than ripraps of the same size, or equivalent sizing of gabions can result in more cost-effective solutions to reducing scour [1]. However, the gabion sizing equation used in this research is based on riprap sizing equations found in Lauchlan and Melville [22]; therefore, due to the lack of research into gabion models, it may not provide an accurate sizing method for gabion baskets.
Lagasse et al. [35] concludes that the best performance of gabion mattresses as a pier scour countermeasure occurs when mattresses are extended a distance at least double the pier width in all directions. A geotextile filter also provides further stability to the mattress, similar to Parker et al.’s findings [26]. Higher debris loads can be detrimental to gabion mattresses [35], which is validated by Pagliara et al. [36], which suggests that debris accumulation may reduce the efficiency of gabions.
Although there is a current practice of using gabions in construction, there is a lack of research on the effect of gabions on reducing bridge pier scour. With the increase in global warming expected to reach 1.5 °C between 2030 and 2052 [37], severe weather developments could be a consequence. In the future, severe rainfall in both summer and winter could lead to flash flooding in the UK [38], and this in turn could lead to scouring at bridge piers, resulting in high financial costs and fatalities, not only during the flooding peaks but also as flow recedes [39]. The introduction of recyclable materials into gabions could provide a solution to scouring at bridge piers, as well as contributing to sustainable and cost-effective construction by reusing material compared to alternatives such as riprap, which requires twice the rock size as the ones used in gabion mattresses to provide the same stability [26].
2. Materials and Methods
As previously discussed, data produced from the investigation of gabion baskets has been relatively limited with the most recent dataset being produced by Yoon [1]. Whilst Lagasse et al. [22] partly investigated the effect of gabion mattresses in reducing bridge pier scour, both sources are outdated to have been used for datasets. No research has been conducted into the use of gabion baskets constructed with recyclable materials. Therefore, primary data was collected by performing an experiment in order to obtain depth of the scour by measuring from the pier to the bottom of the scour hole. This is required as it is needed to calculate the scour hole depth and subsequent scour reduction percentage when compared with values from the different variables tested.
2.1. Design Methodology
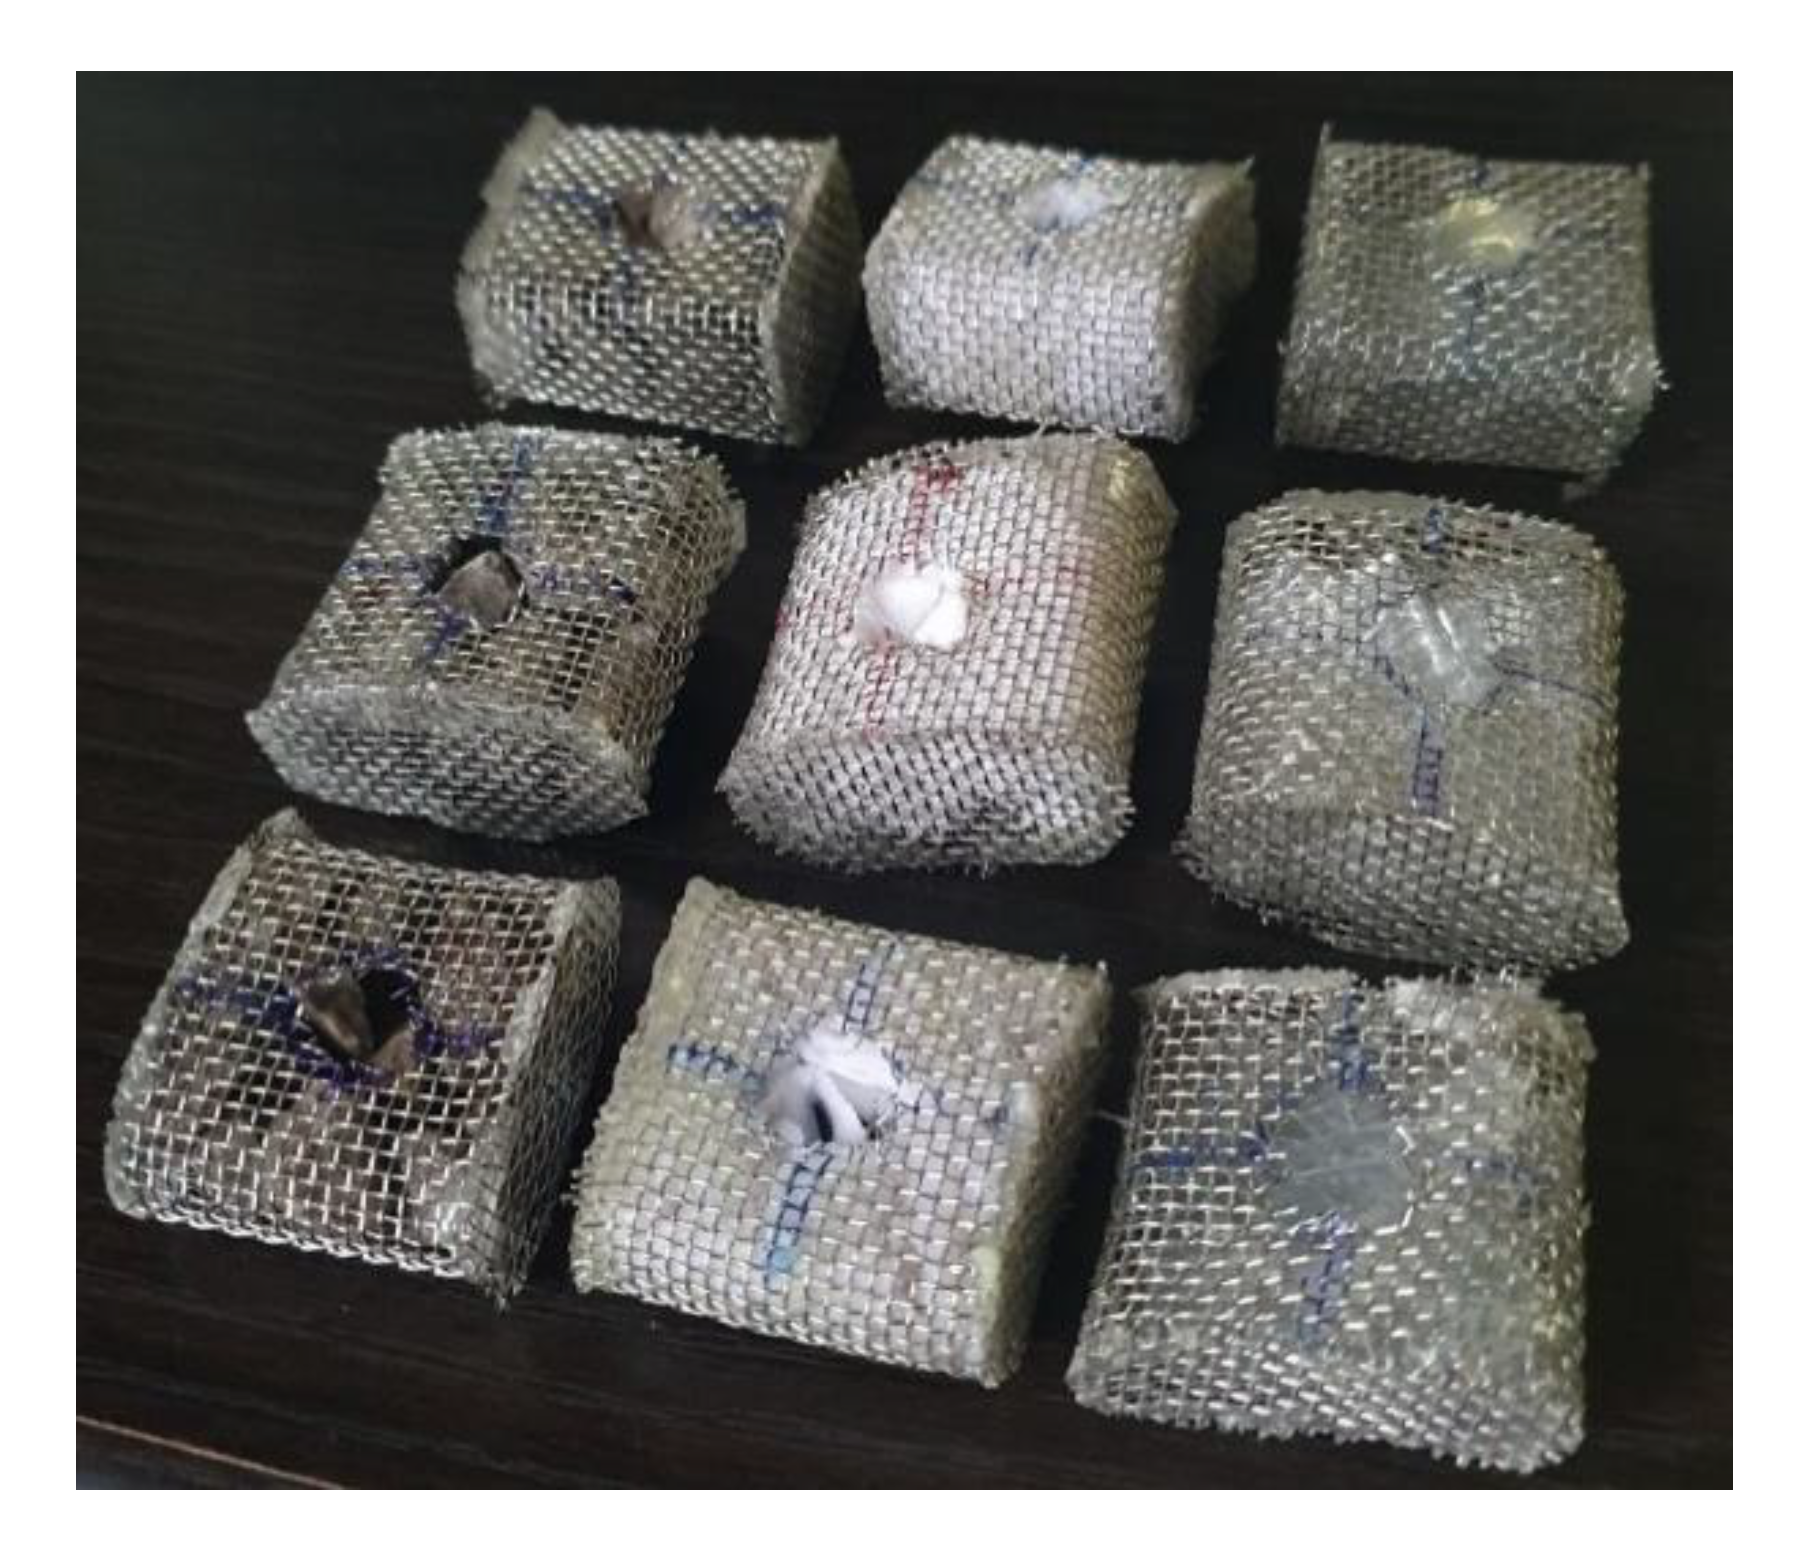
The design methodology was mainly performed by changing variables throughout the experiment including: the type of material used in the gabion baskets, placement depth of the gabion baskets, thickness of gabion baskets and depth of flow used in the flume. By using grade 304 stainless steel wire mesh with an aperture of 1.2 mm, it was then possible to model the gabions. The wire mesh was cut into varying dimensions and filled with different types of material, as shown in Figure 7, and the wire mesh was then bonded using epoxy resin.
Table 1 summarises the dimensions of the gabion models used. The materials used in models C8, C12 and C16 consisted of cotton recycled clothing cut into small squares of 5 mm × 5 mm × 1 mm. Likewise, the plastic used in P8, P12 and P16 was also cut into small squares of 5 mm × 5 mm × 1 mm. Due to nature of the stone aggregate used in models S8, S12 and S16, this material varied in size; however, the average size of aggregate was 5 mm. An acrylic circular straight rod with the dimensions 8 mm × 25 mm was selected to be used as the bridge pier model. Initially, the experiment analysed in this project was undertaken at Nottingham Trent University in the Hydraulics Laboratory in a Perspex flume channel of 5 m length, 0.08 m width and 0.25 m height, as prior research had established that the pier diameter should not be more than 10% of channel width [40] so that the sides of the Perspex channel did not interfere with the experiment.
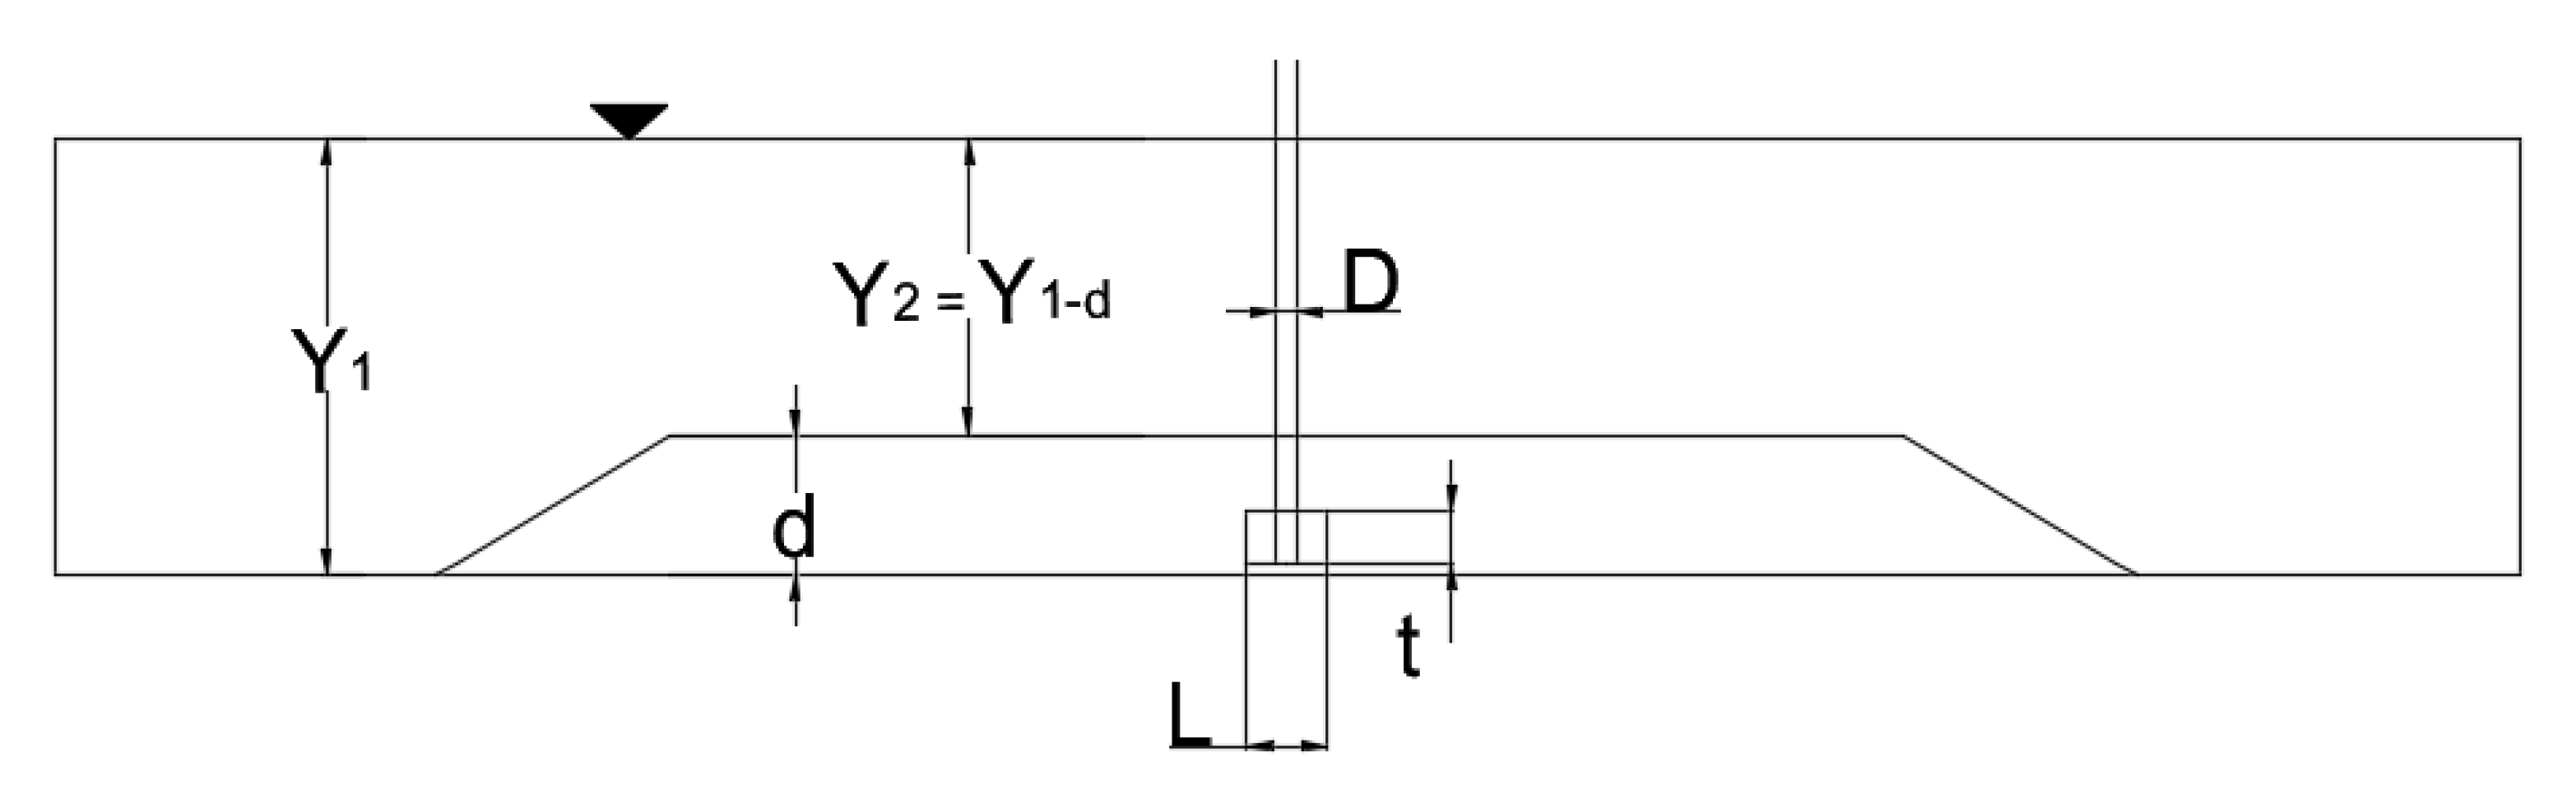
Raudkivi and Ettema [41] determined that if D/d50 (pier diameter/sediment size) is greater than 20–25, then the sediment size has a negligible impact on the scour hole; therefore, uniform sand sediment of a mean particle size (d50) 0.6 mm was used. In the experiment conducted, D/d50 = 8 mm/0.6 mm = 13.3 and may therefore impede the erosion process caused by the horseshoe and wake vortices. Raudkivi and Ettema [41] further clarified the impact of the value of D/d50, which in this research project will lead to a large proportion of energy dissipation of the downflow into material at the bottom of the scour hole. The coverage of the gabions was selected as the optimum performance of gabion mattresses, which occurred when mattresses extended 2 times the pier width in all directions around the pier [35]. Therefore, as the pier diameter was 8 mm, the gabions used in the experiment had dimensions of 32 mm width × 32 mm length in order to satisfy this constraint. The sketch of the experiment layout can be understood by Figure 8 shown below.
2.2. Testing Methodology
The initial experiment conducted in the 5 m flume channel proved to be unsuccessful; the flow rate of the flume could not be regulated at a low enough rate to allow enough time to measure the scour hole depth without a substantial amount of sand sediment being transported downstream. Therefore, a smaller flume channel, as shown in Figure 8, was used, which was 2.5 m long and 0.05 m width with a height of 0.25 m. The pier diameter (8 mm) remained the same and therefore would not meet the recommendations of previous research in regard to the 10% of channel width [40]. Although, alternative findings state that if the flume width to pier width is greater than 6.25, then the flume walls will have a negligible impact on the scour effect [41]. In the experiment conducted, the flume width to pier width ratio was calculated as 50 mm/8 mm = 6.25, which suggests that, theoretically, the flume walls should have no impact on the scour development around the bridge pier.
The bridge pier was installed at a distance 1.25 m from the start of the flume surrounded by the gabion model, with the sand sediment installed at a depth of 40 mm or 50 mm (depending on sediment depth selected) extending 0.25 m either side of the bridge pier, and then gradually sloped to 0 mm of the bed, as shown in Figure 9. The flume was filled slowly with water until the sand sediment was submerged. Once completed, the depth from the top of the pier was recorded to the top of sand sediment, as well as from the top of the pier to the bottom of the scour hole, which allowed for the calculation of the scour hole depth per gabion model at different time intervals.
The flow rate, Q, was maintained at a constant rate of 0.0001 m3/s and was monitored using a digital hydraulic bench. A vertical sluice gate was installed at the end of the flume in order to control flow depth (Y1), which throughout the experiment was lowered at varied time intervals shown in Table 2. Measurements of Y1 and Y2 were not observed during the experiment, and therefore it was not possible to calculate the approach flow velocity and velocity threshold of the sediment. The inflow discharge of the sediment (Qs) was also not considered during this experiment.
2.3. Hypothesis
It is anticipated that the research conducted in this project will contribute to the development of alternative materials in effectively reducing bridge pier scour. There is vast potential for this topic to become cost effective and sustainable whilst also being fully operational. It is predicted that the varying parameters used in the testing will directly contribute to the reduction or enhancement of a scour hole around the bridge pier; furthermore, it is predicted the test parameters may change the width and length of the scour hole. It is expected that the stone filled gabion models will be more effective at reducing scour hole depth than any other form of gabion models due to the aggregates’ larger surface area compared to the smaller surface areas of clothing and plastic materials used in the other gabion models.
3. Results
The experiment was conducted first with the use of a control variable; initially, no gabions were used to surround the bridge pier at different sediment depths as this enabled a baseline of data to be generated so that later in the investigation comparable data could be calculated against it to produce a percentage in scour reduction. This is summarized in Table 3.
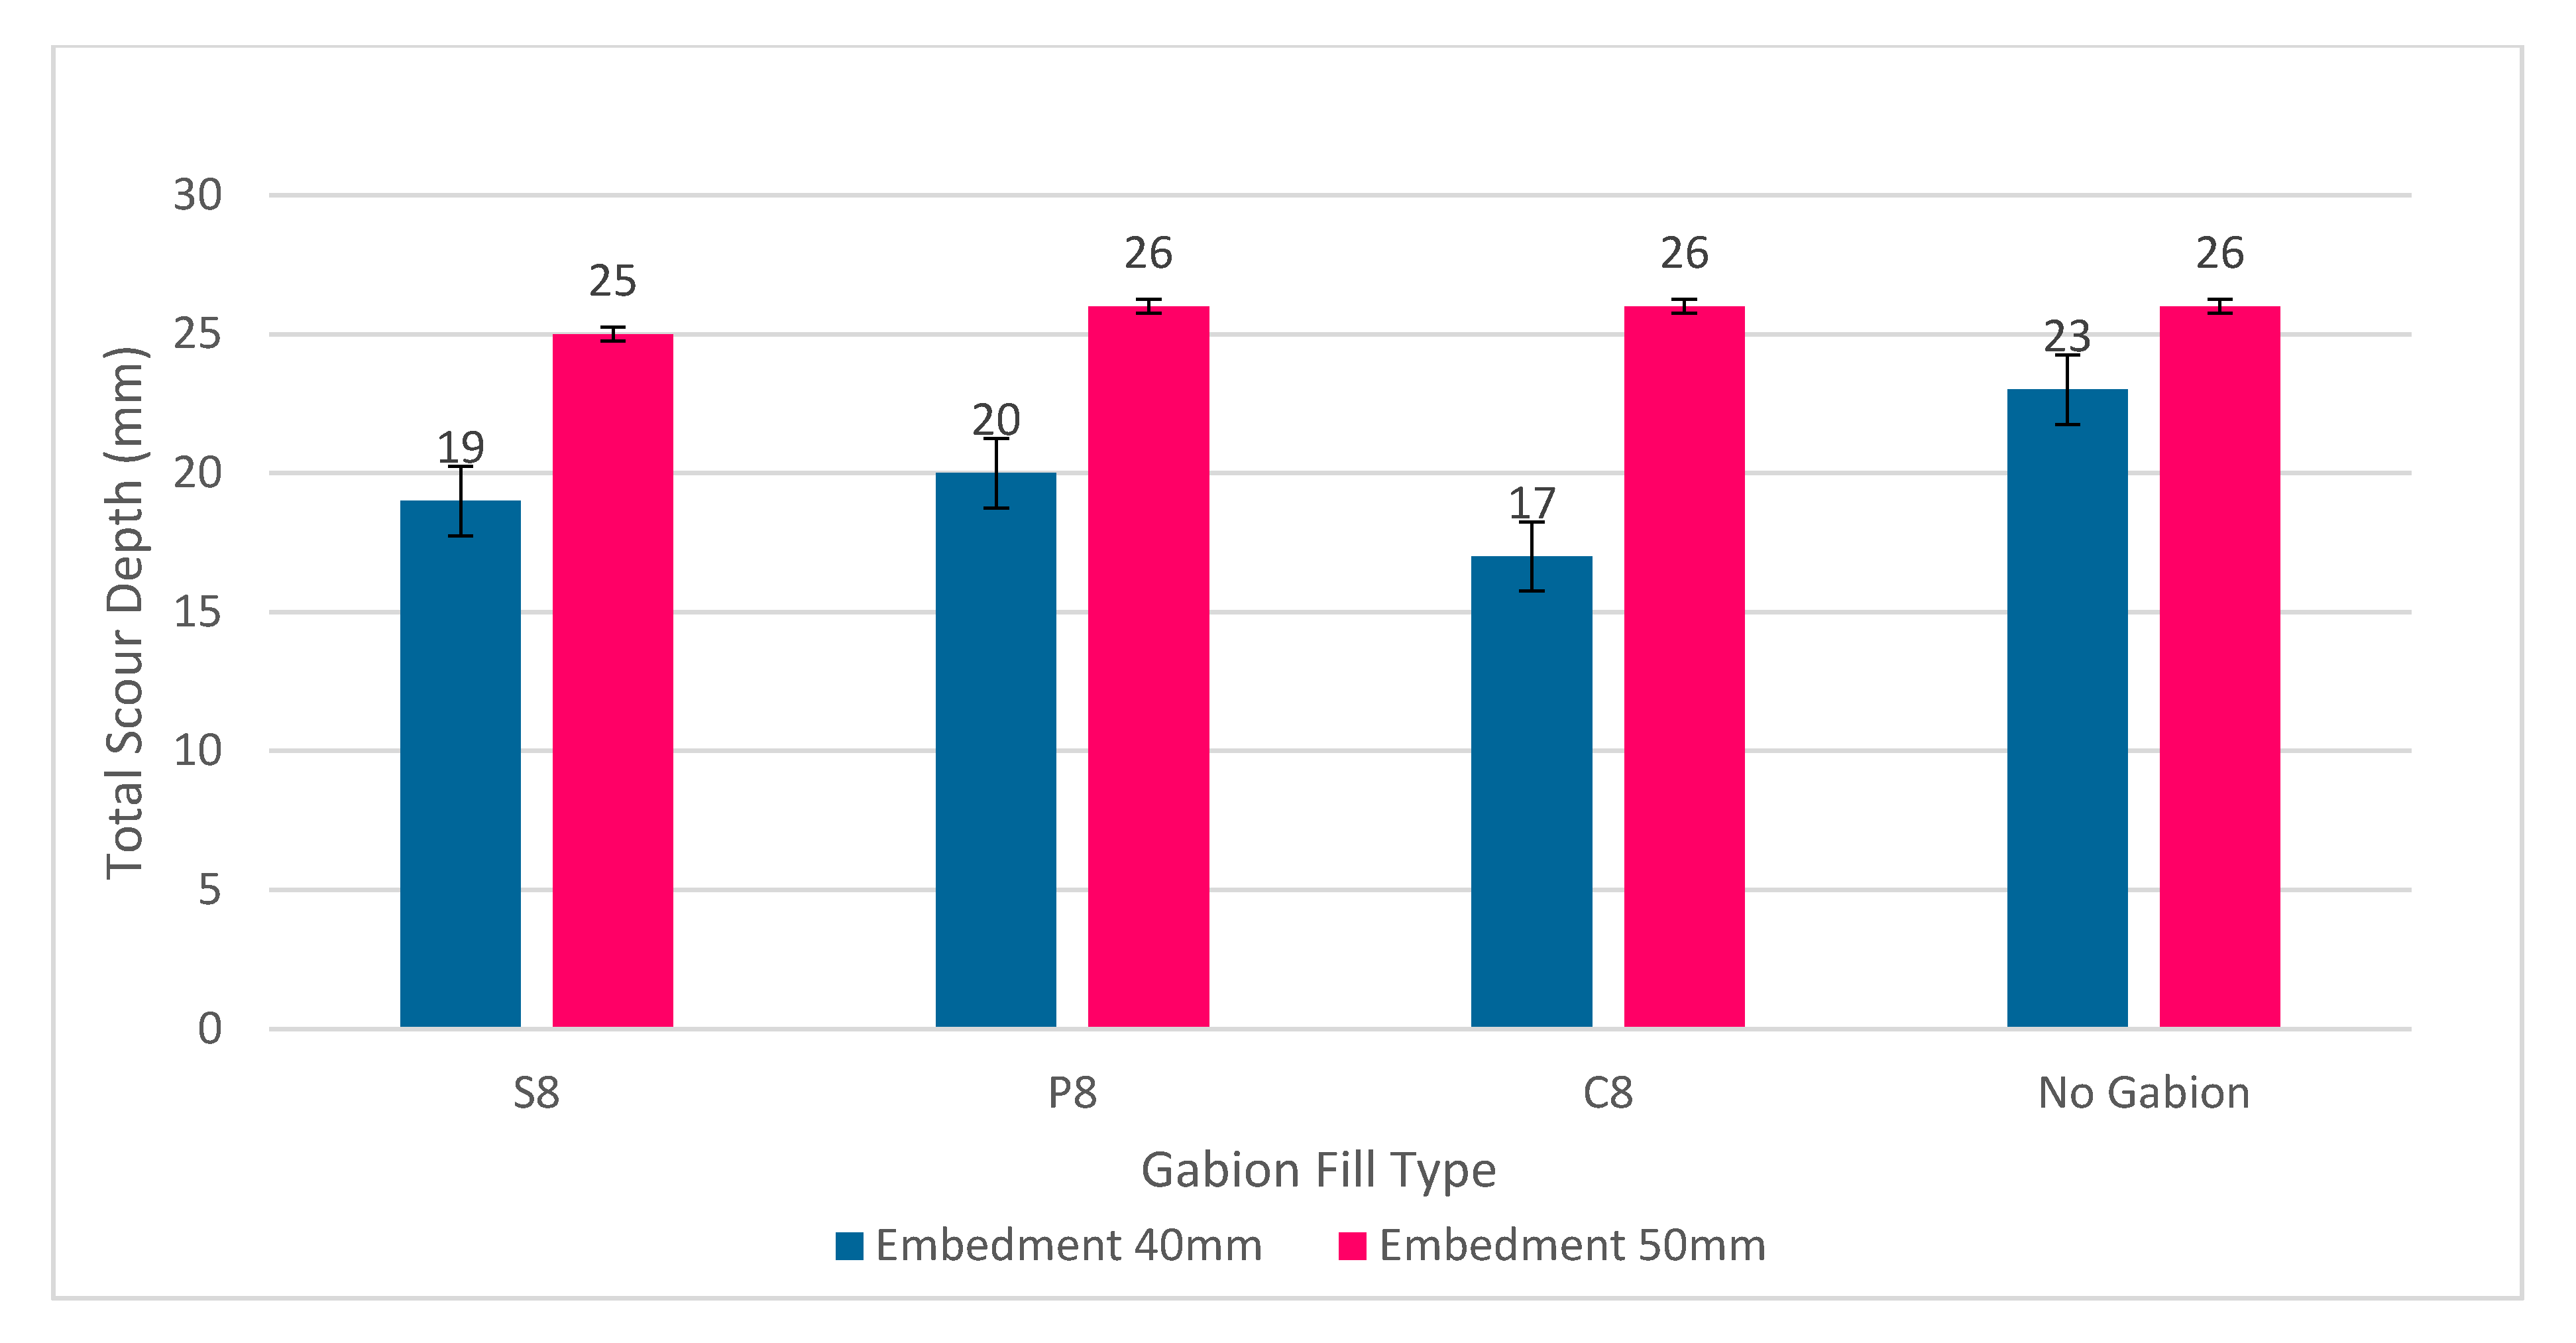
3.1. Effect of Gabion Fill—8 mm Thickness
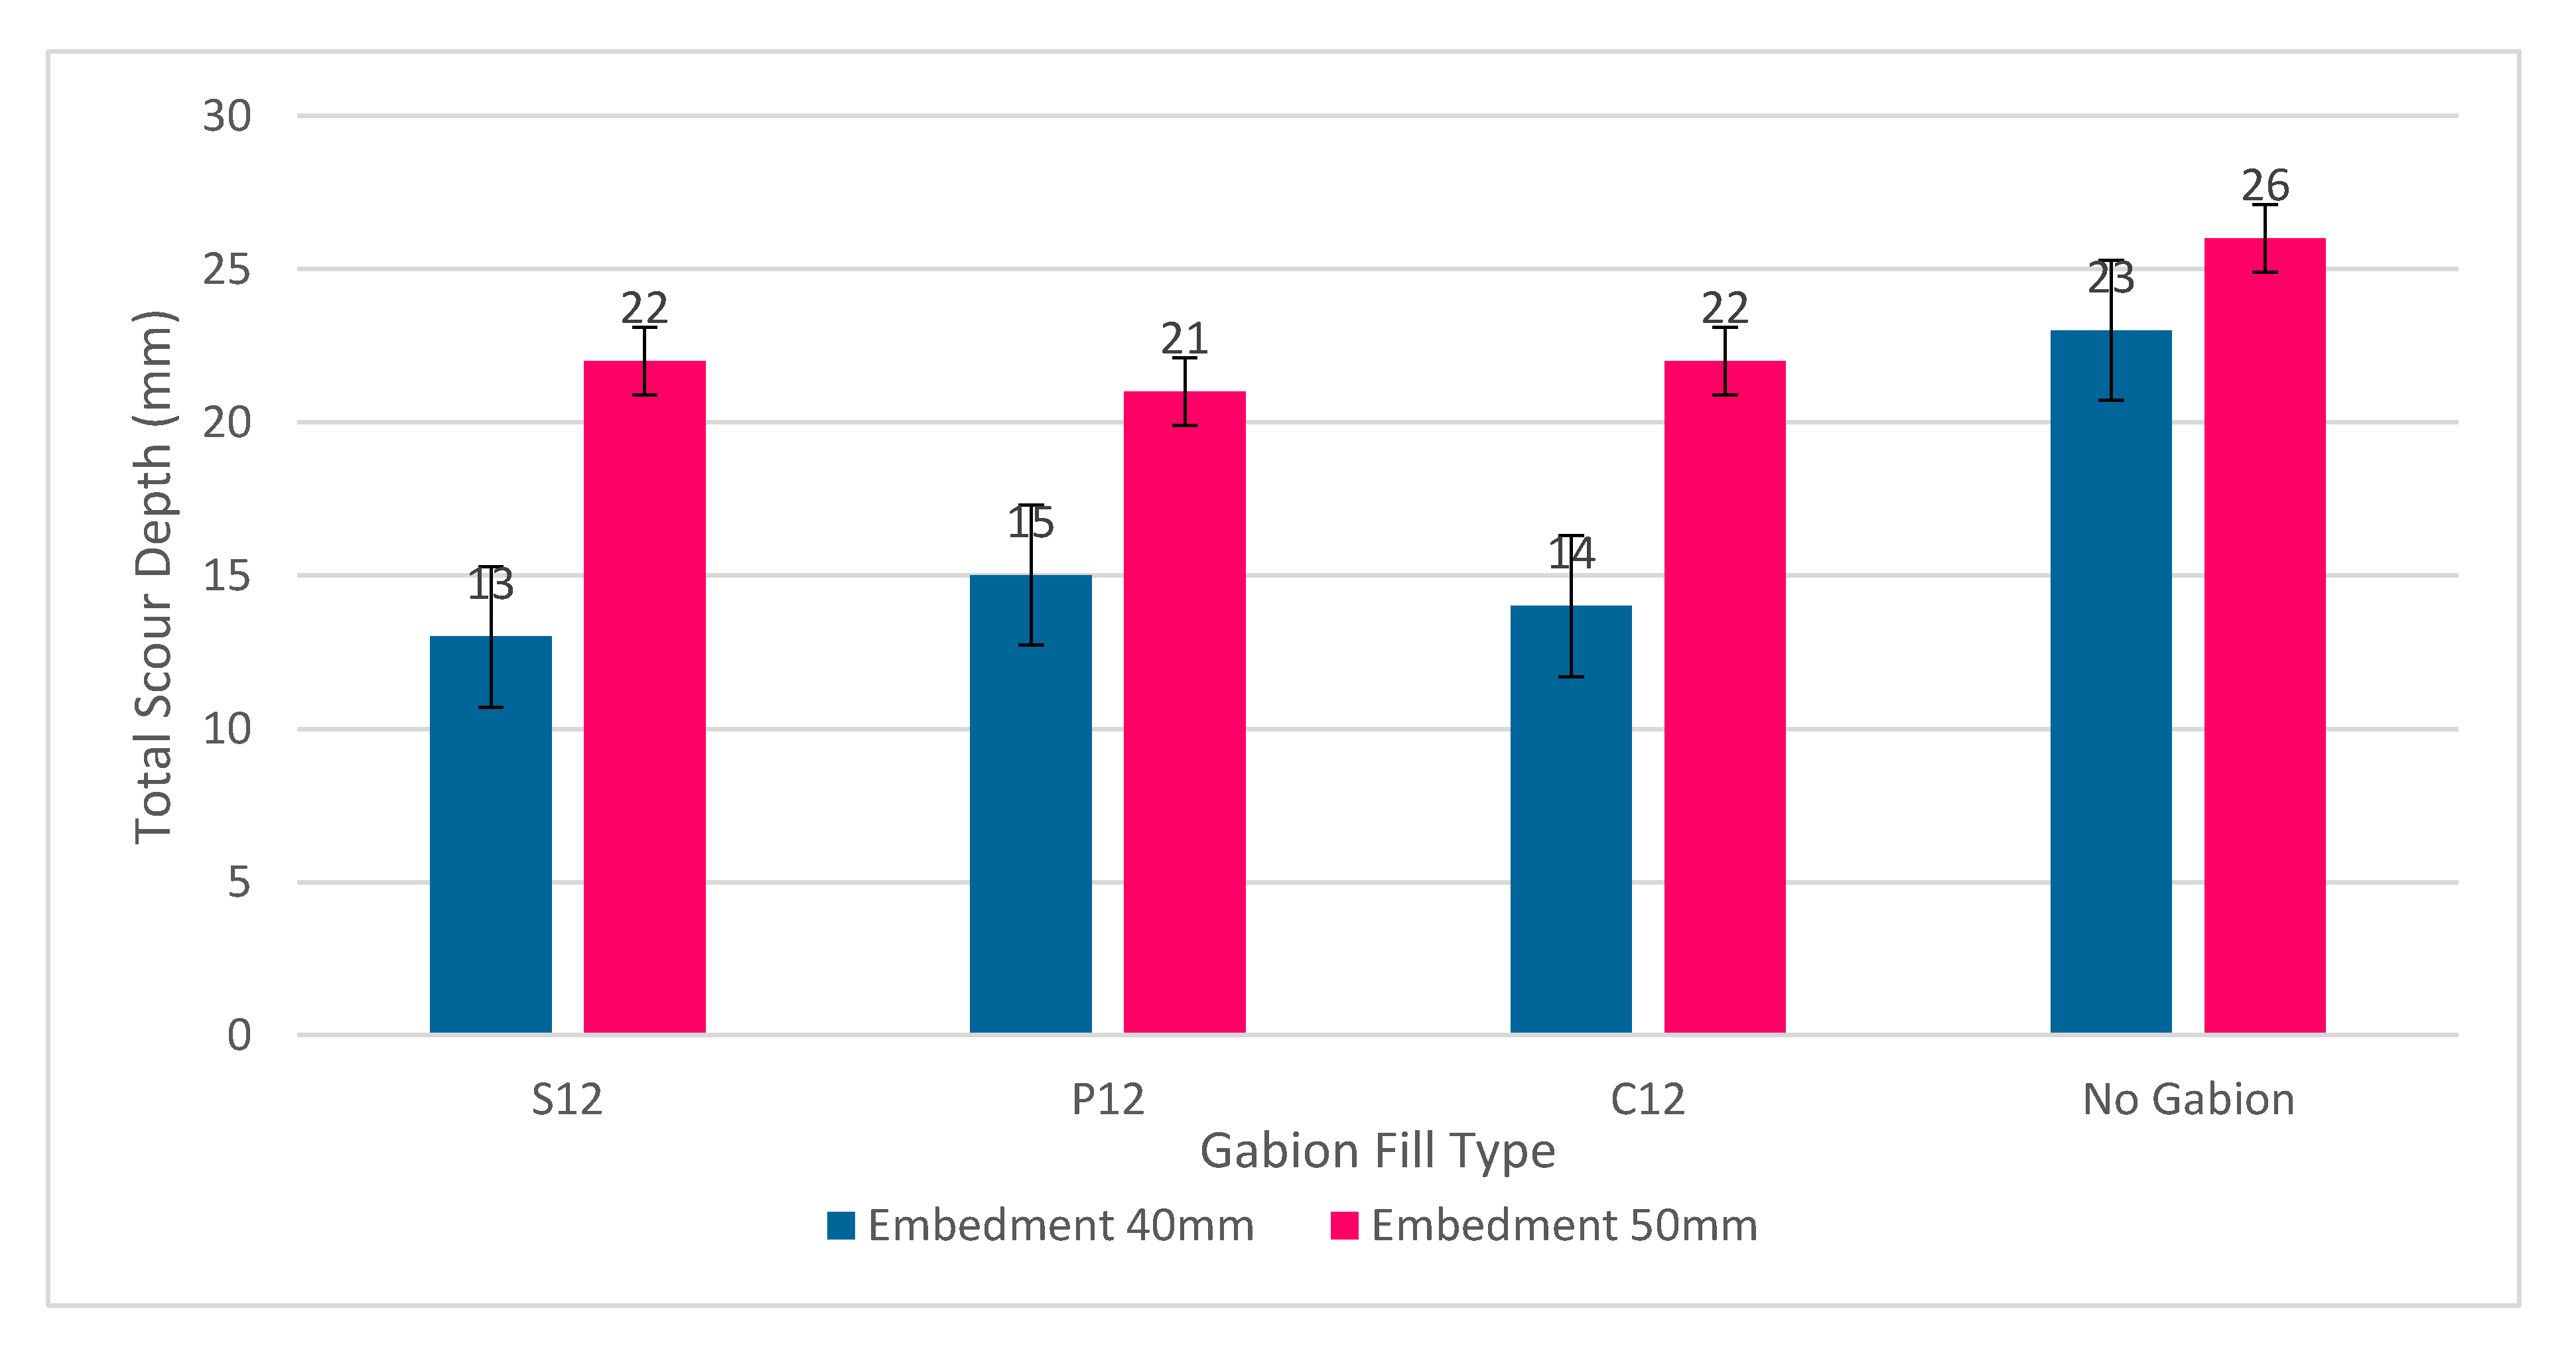
3.2. Effect of Gabion Fill—12 mm Thickness
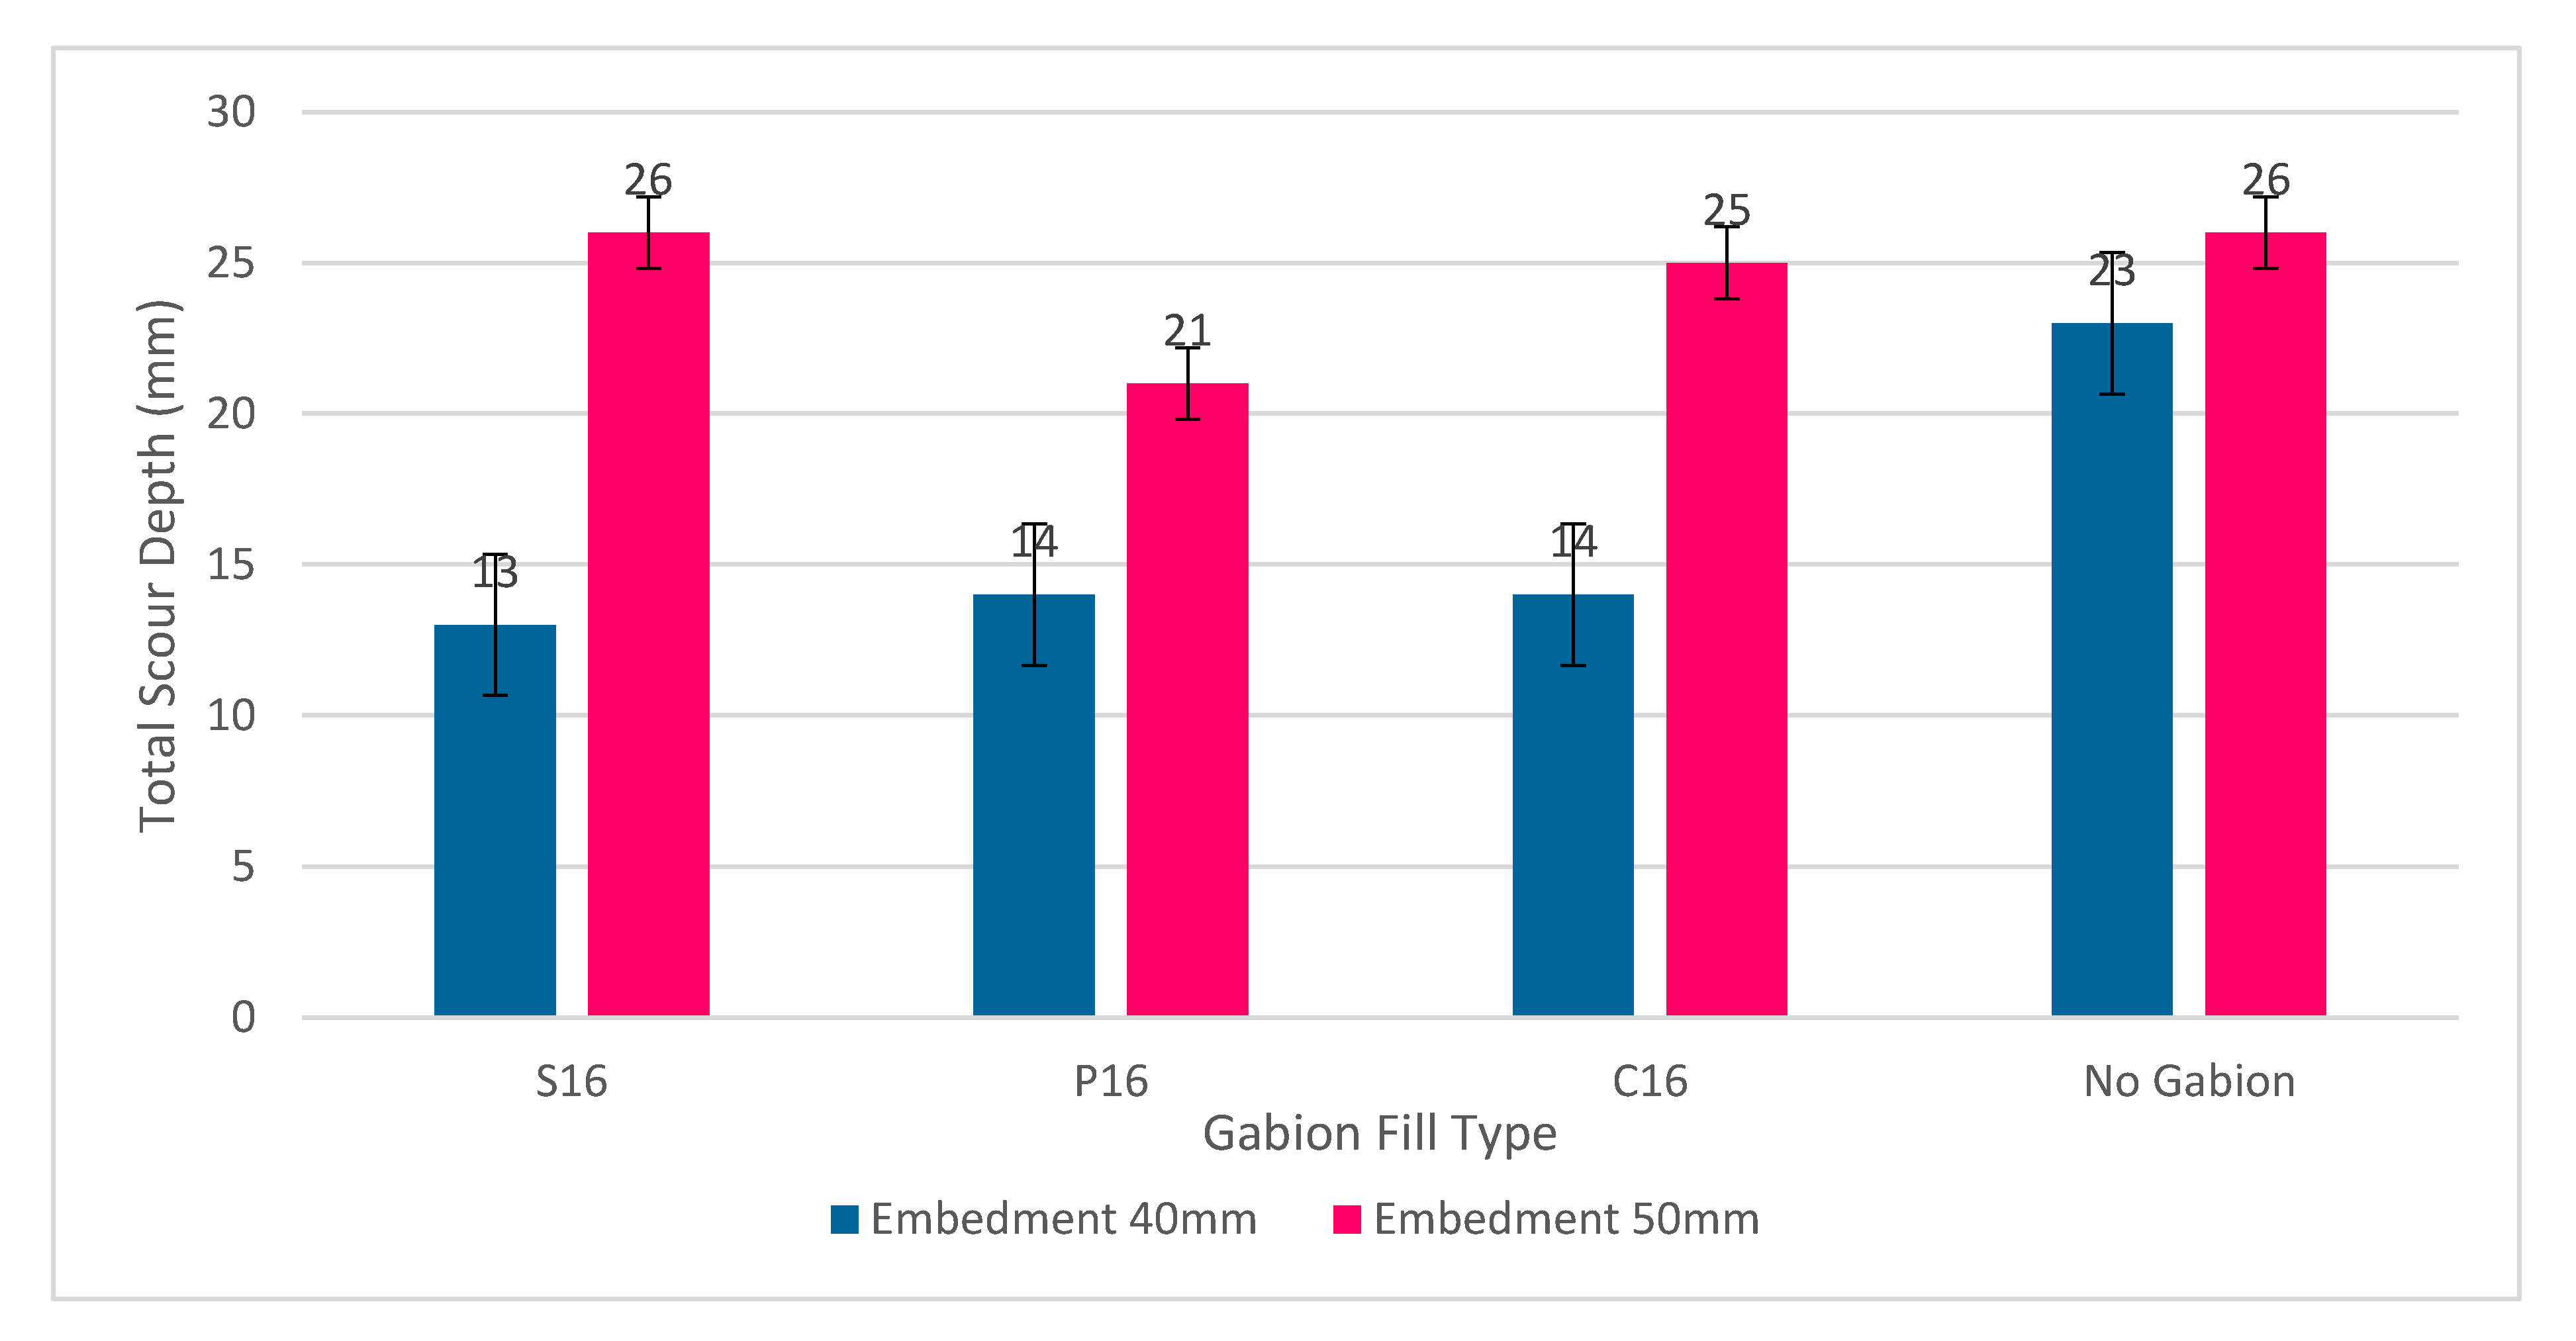
3.3. Effect of Gabion Fill—16 mm Thickness
3.4. Effect of Gabion Fill—50 mm Sediment Depth
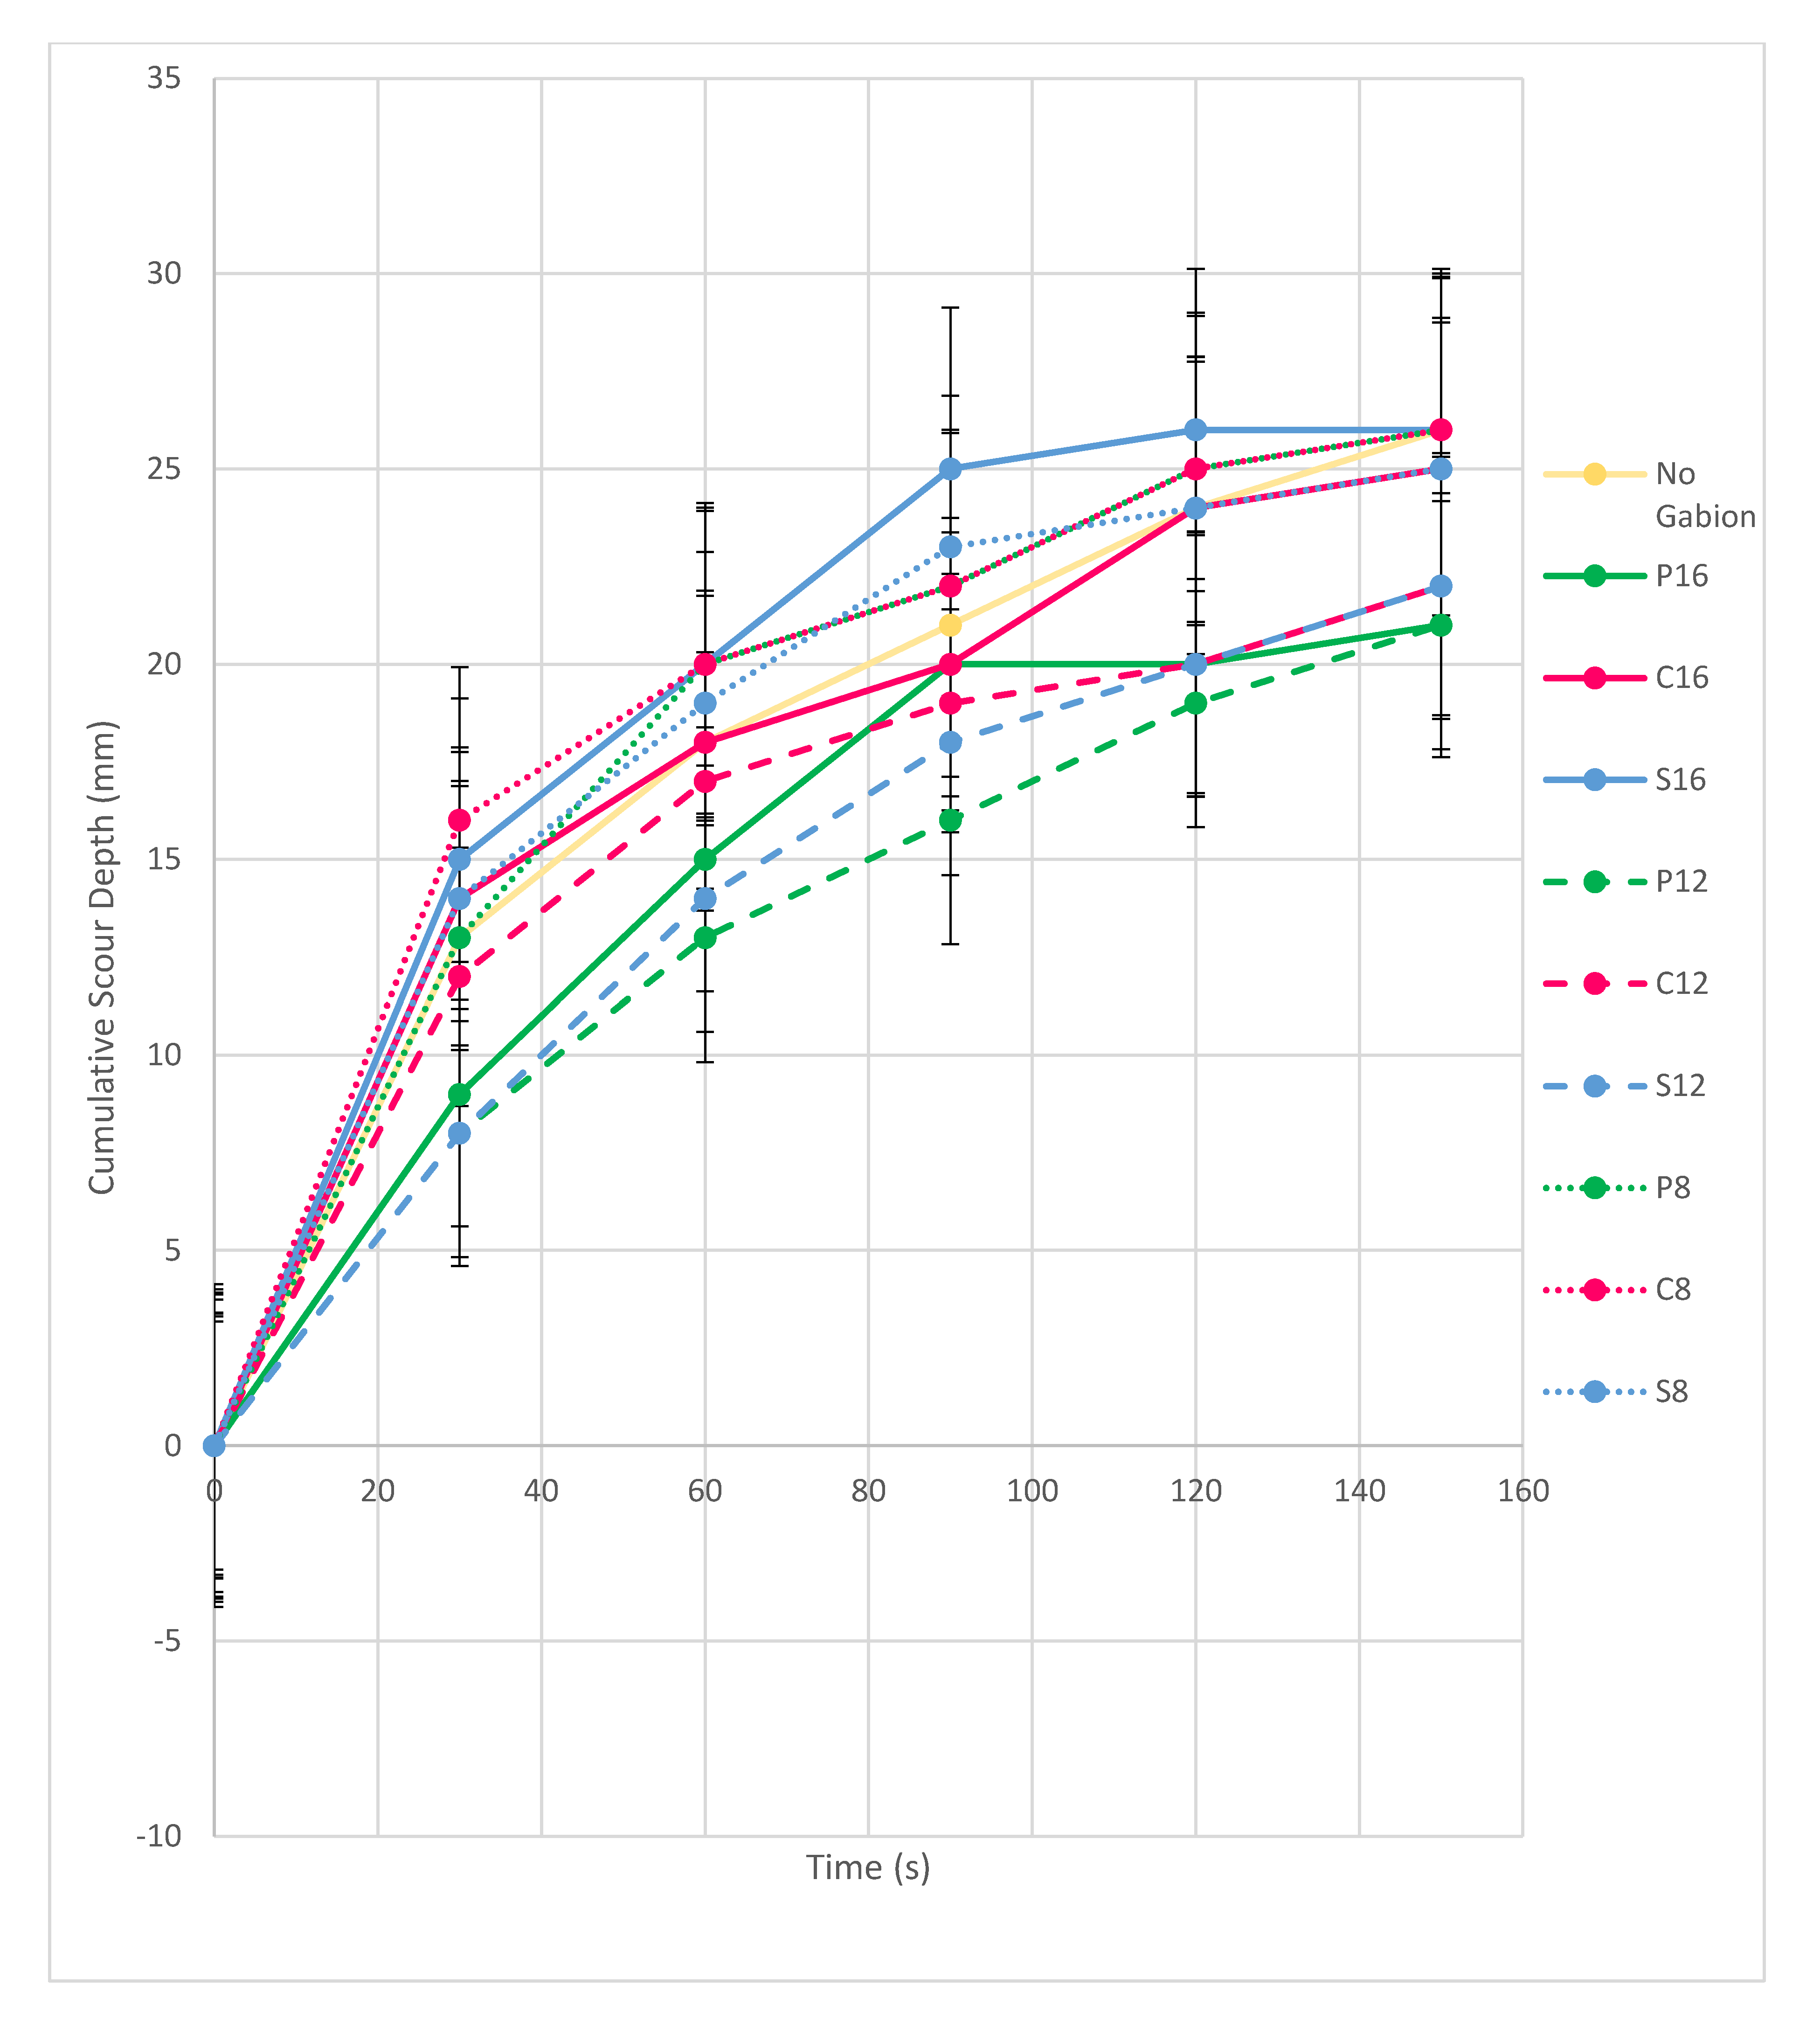
The cumulative scour at various time intervals were recorded for each model of each fill type. This is represented in graphical form for when sediment depth varied from 40 mm and 50 mm. At certain time intervals, the height of the vertical sluice gate downstream of the bridge pier was lowered in order to increase the flow depth and simulate river flooding, as shown in Table 2.
The results from all thicknesses of gabion, as shown in Figure 13, generally show that the fill of the gabion models is largely irrelevant in the reduction of scour when the sediment depth of the sand sediment was 50 mm. This is evident when the thickness of the gabion models was 8 mm (C8, S8, P8), which resulted in the three different materials all following the same trendline as when the experiment was performed with no scour countermeasure surrounding the bridge pier.
When the gabion models were at a thickness of 16 mm, the trendline of the graph (C12, S12, P12) again closely resembles that of the no gabion experiment, except for P16, which appears to be an anomalous result, considering the drastic reduction of the scour depth (4 mm less than C16), when compared to P16 and S16. Furthermore, if plastic was the most effective material in the gabions at reducing scour, then this result would be expected to be replicated at gabion thicknesses 8 mm and 12 mm. Whilst P12 does produce the lowest total scour depth in the materials tested, it is only by 1 mm, which is a fine margin and therefore inconclusive. The results of C12, P12 and S12 follow the same trendline as when the no gabion model test was conducted, however, there was a much more significant reduction in the total scour depth when compared to the 8 mm thickness gabion models.
At 8 mm thickness, the gabions were not successful at reducing bridge pier scour, as both P8 and C8 contributed to no reduction in the scour depth, and the effectiveness of the gabion models was not advantageous. In two out of three cases, no scour reduction was observed when compared with the original experiment when conducted with no scour countermeasures enabled. At 12 mm thickness, the gabion models led to a reduced total scour depth. The results were, however, not as effective as when the gabions were at a 40 mm sediment depth, as the percentage reduction in scour was less than 20% for all cases of varied fill types when compared to results higher than 34.8%. Increasing the thickness of the gabion models from 8 to 12 mm led to a reduction in scour; for example, increasing the thickness of the stone gabion model from 8 to 12 mm led to a further 26.1% reduction in the total scour depth. At 16 mm thickness, the total scour depth was similar to the results gathered from when no scour countermeasure was installed, excluding P16, which remained the same total scour depth as P12 (a decrease of 15.4%) and C16 which decreased by 3.8%.
The increase in thickness of the gabion models were also not as effective at reducing bridge pier scour; this can be seen in the similarities between S16 and S8, and C16 and C12. Both gabion models increased in thickness, which would indicate a better capacity to prevent scour; however, in the case of S16, the total scour increased by 1 mm to 26 mm, and C16 obtained the same total scour depth of 25 mm. The exception to this, once the anomaly P16 is excluded, is the 12 mm thick gabion models, all of which performed better than their respective material types in the 8 mm and 16 mm thick gabion models.
Time also impacts the cumulative scour depth, as in all but four cases (P16, S12, P12 and no gabion), and the majority of scour accumulated in the first 30 s of the experiment. In each model tested, there was no additional deposition of sand sediment into the developing scour hole, as can be seen from Figure 13; all models led to an increase, or maintenance of scour depth. Overall, the type of gabion fill used at a sediment depth of 50 mm sand sediment was largely irrelevant in the reduction of the total scour depth surrounding bridge piers. All types of fill and thicknesses performed relatively poorly in the reduction of total scour depth, with the highest reduction of scour 19.2%, being obtained when using plastic material at thicknesses 12 and 16 mm. Although plastic material does appear the most effective material at reducing scour, the result of P16 must be disregarded, as its results differ drastically from that of C16 and S16 and the results are inconclusive.
3.5. Effect of Gabion Fill—40 mm Sediment Depth
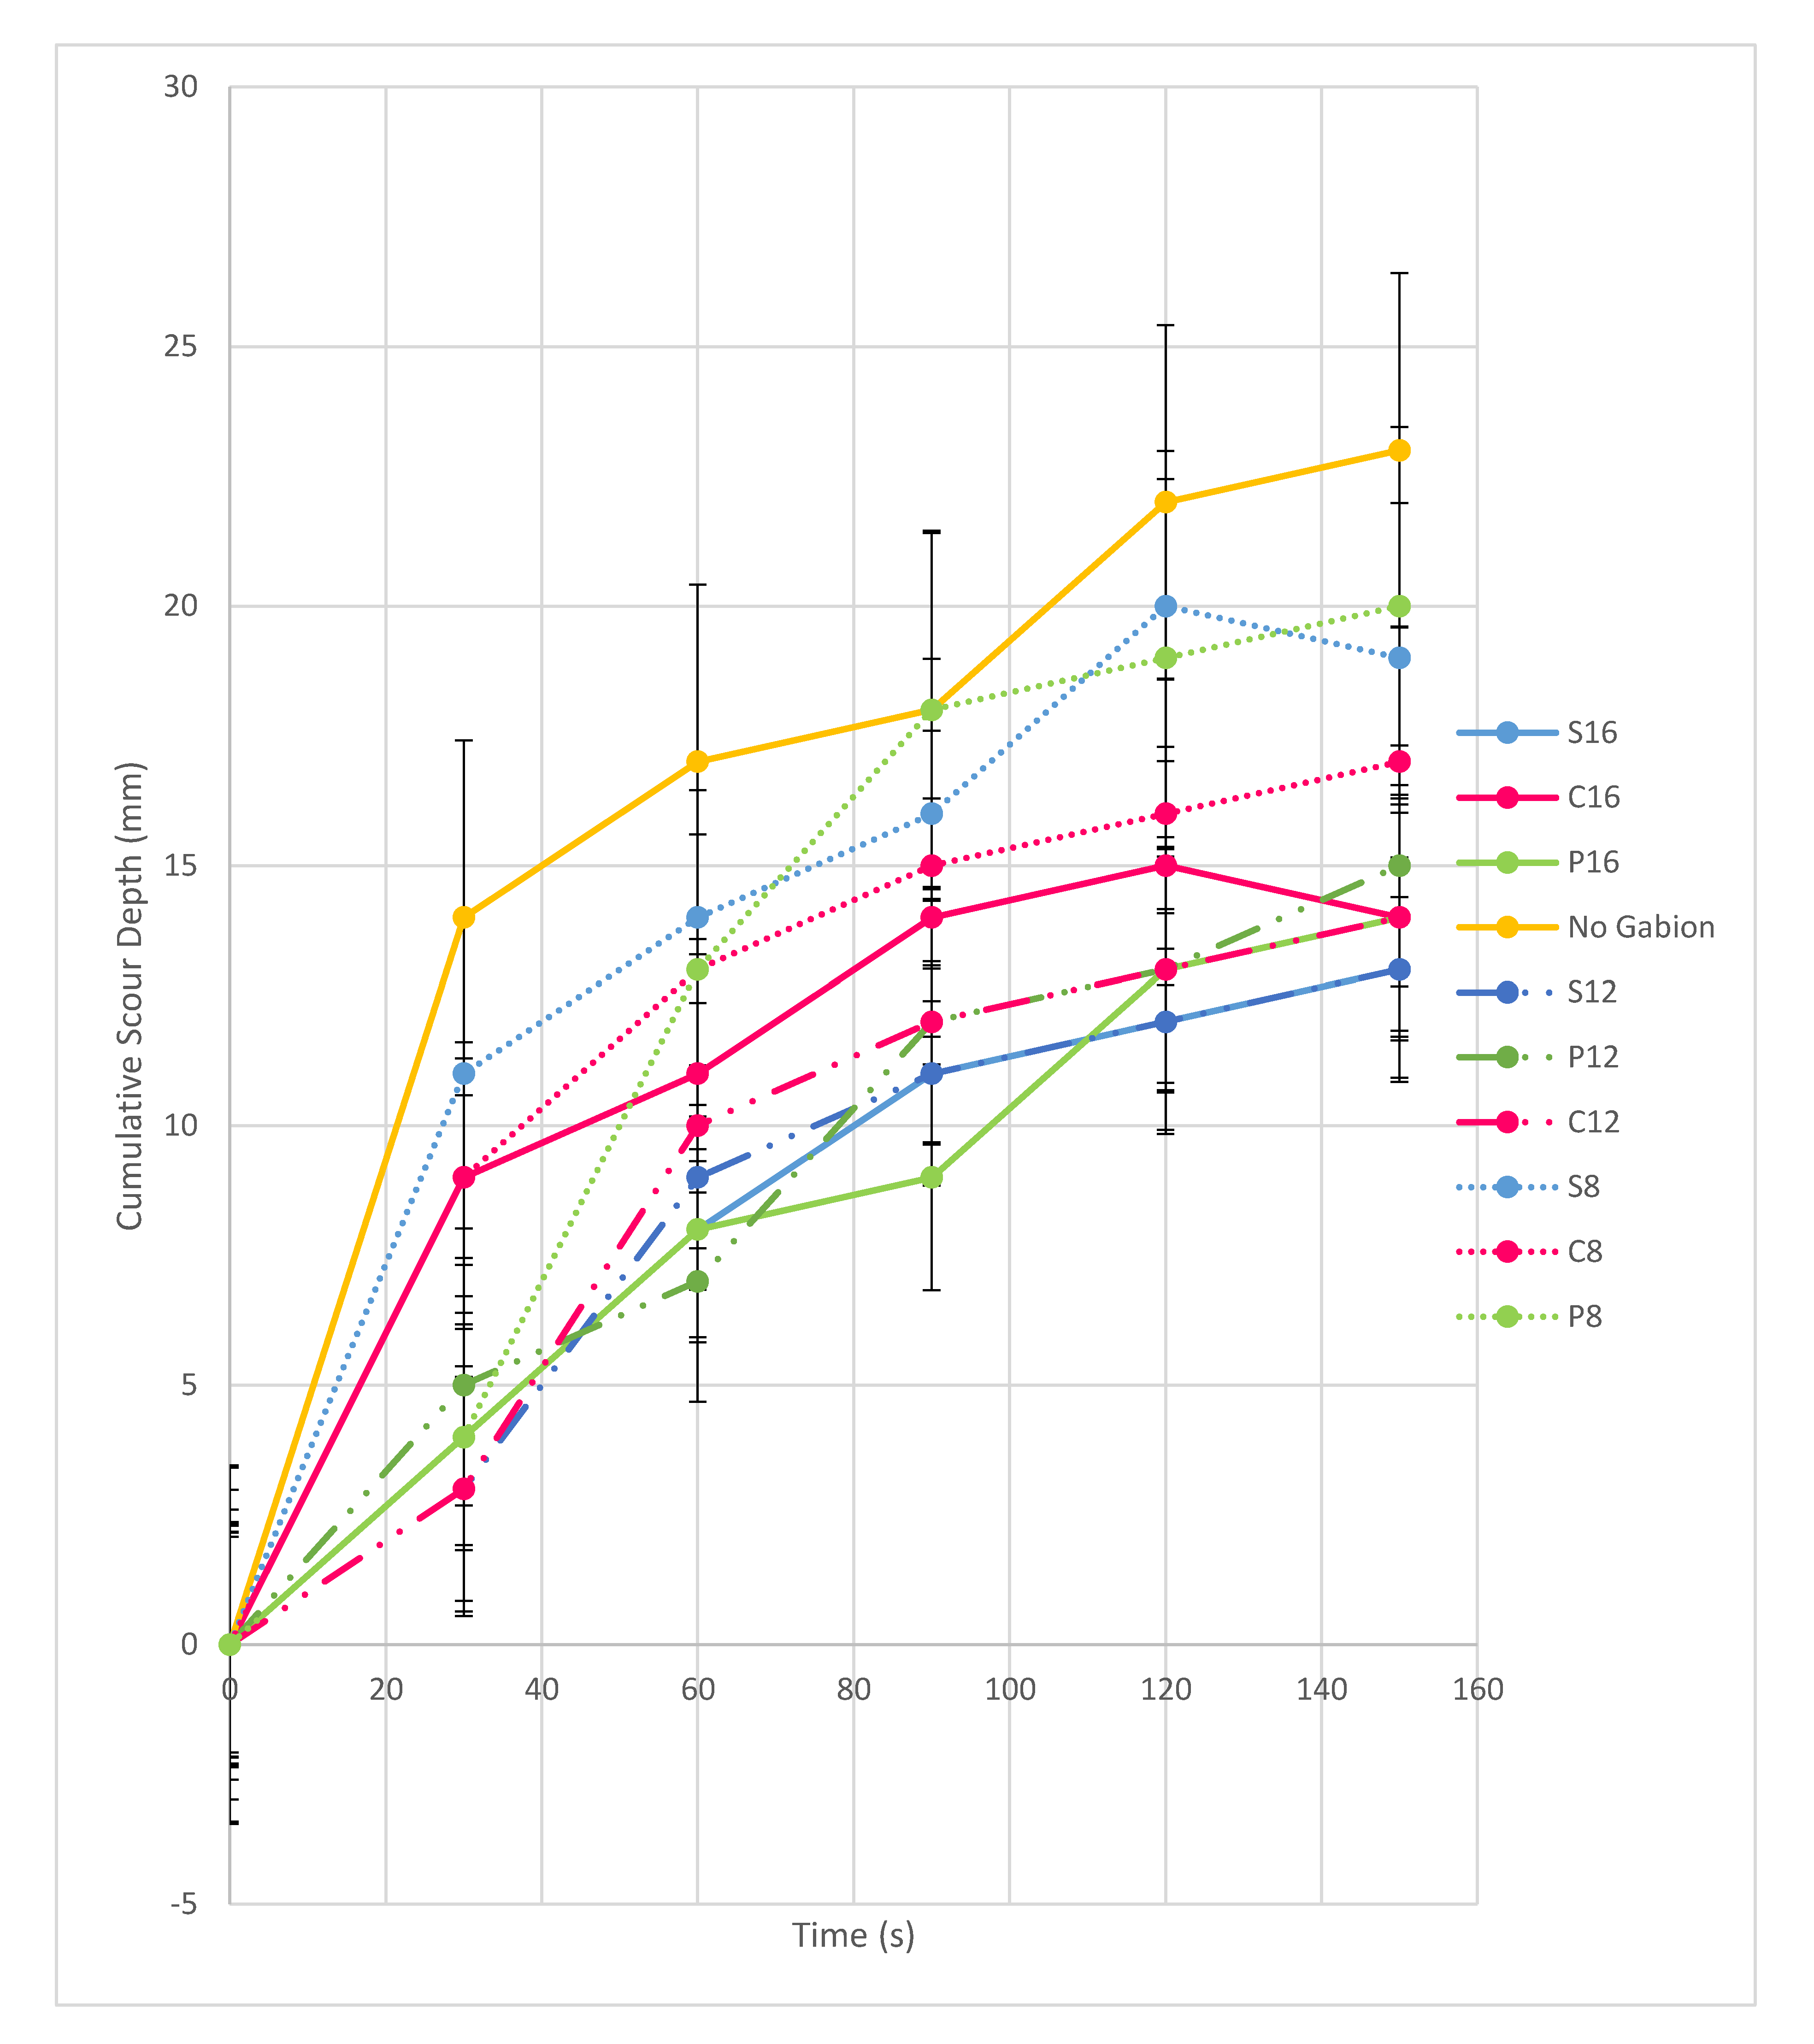
The placement depth of the gabions was decreased by 10 mm and set to 40 mm sediment depth. Figure 14 summarises all results at a 40 mm sediment depth.
The results of all gabion thicknesses and their various fills, as shown in Figure 14, show that at a sediment depth of 40 mm, the effect of gabion fills and their thicknesses are much more effective than when the same models were installed beneath a level of 50 mm. The most effective fill type of the gabions in reducing local scour was the stone and plastic filled gabions, both of which have an average scour depth of 15 mm, which meant an average reduction of 28.57% when comparing to the original experiment undertaken with no scour countermeasure present. The results conclude that the plastic gabions were the least effective material at reducing pier scour, with an average of 16.3 mm, or a total scour reduction of 22.38%. However, the percentage reduction between the three different types of fill is relatively small, as stone and clothing are 6.2% more effective than the plastic filled gabions at reducing scour. At 12 and 16 mm thicknesses, the gabion models which were most effective were the stone aggregate filled gabions, although the results are very similar to both plastic and clothing at these thicknesses. At 8 mm thickness (C8, S8, P8), the reduction in scour was largest for C8, the gabion filled with clothing, as it had a 26.1% reduction in scour hole depth from the original experiment conducted, followed by the stone filled gabion, S8, which reduced bridge pier scour by 17.4%.
The plastic gabion, P8, reduced the scour depth surrounding the bridge pier, but was not as successful as S8 and C8. At 12 mm thickness (C12, S12, P12), the use of a gabion model as a scour countermeasure was effective, as the percentage reduction of scour was higher than 34.8% for each fill type used within the gabions. The stone filled gabion, S12, was most effective at reducing scour depth when it had a greater thickness of gabion, although there is not much deviation from the results, with P12 and C12 results only having a larger scour depth by 2 and 1 mm, respectively. At 16 mm thickness (C16, S16, P16), the total scour depth results are almost identical to the 12 mm thickness gabions, except for P16, which reduced by 1 mm. Therefore, the percentage reduction of scour remained the same, apart from P16, which increased by 4.3%. Again, the thickness of the gabion models used also impacted the development of scour. At 8 mm thickness, in the worst-performing value of P8, the scour depth increased by 42.86% when compared to P16. There are, however, close similarities between the results of 12 and 16 mm gabion models. The 12 mm gabions had an average scour depth of 14 mm, whereas the 16 mm gabion models had an average scour depth of 13.67 mm, proving that an increase in the thickness of a gabion affects scour. Time appears to have an impact on the cumulative scour depth. At 60 s, all gabion models had accumulated most of the scour depth (with exception to P12). For gabions S8 and C12, the cumulative scour depth decreased slightly between 120 s and 150 s; this is due to the deposition of sand sediment into the developing scour hole, therefore decreasing the total scour depth formed.
4. Discussion
4.1. Scour Hole Development
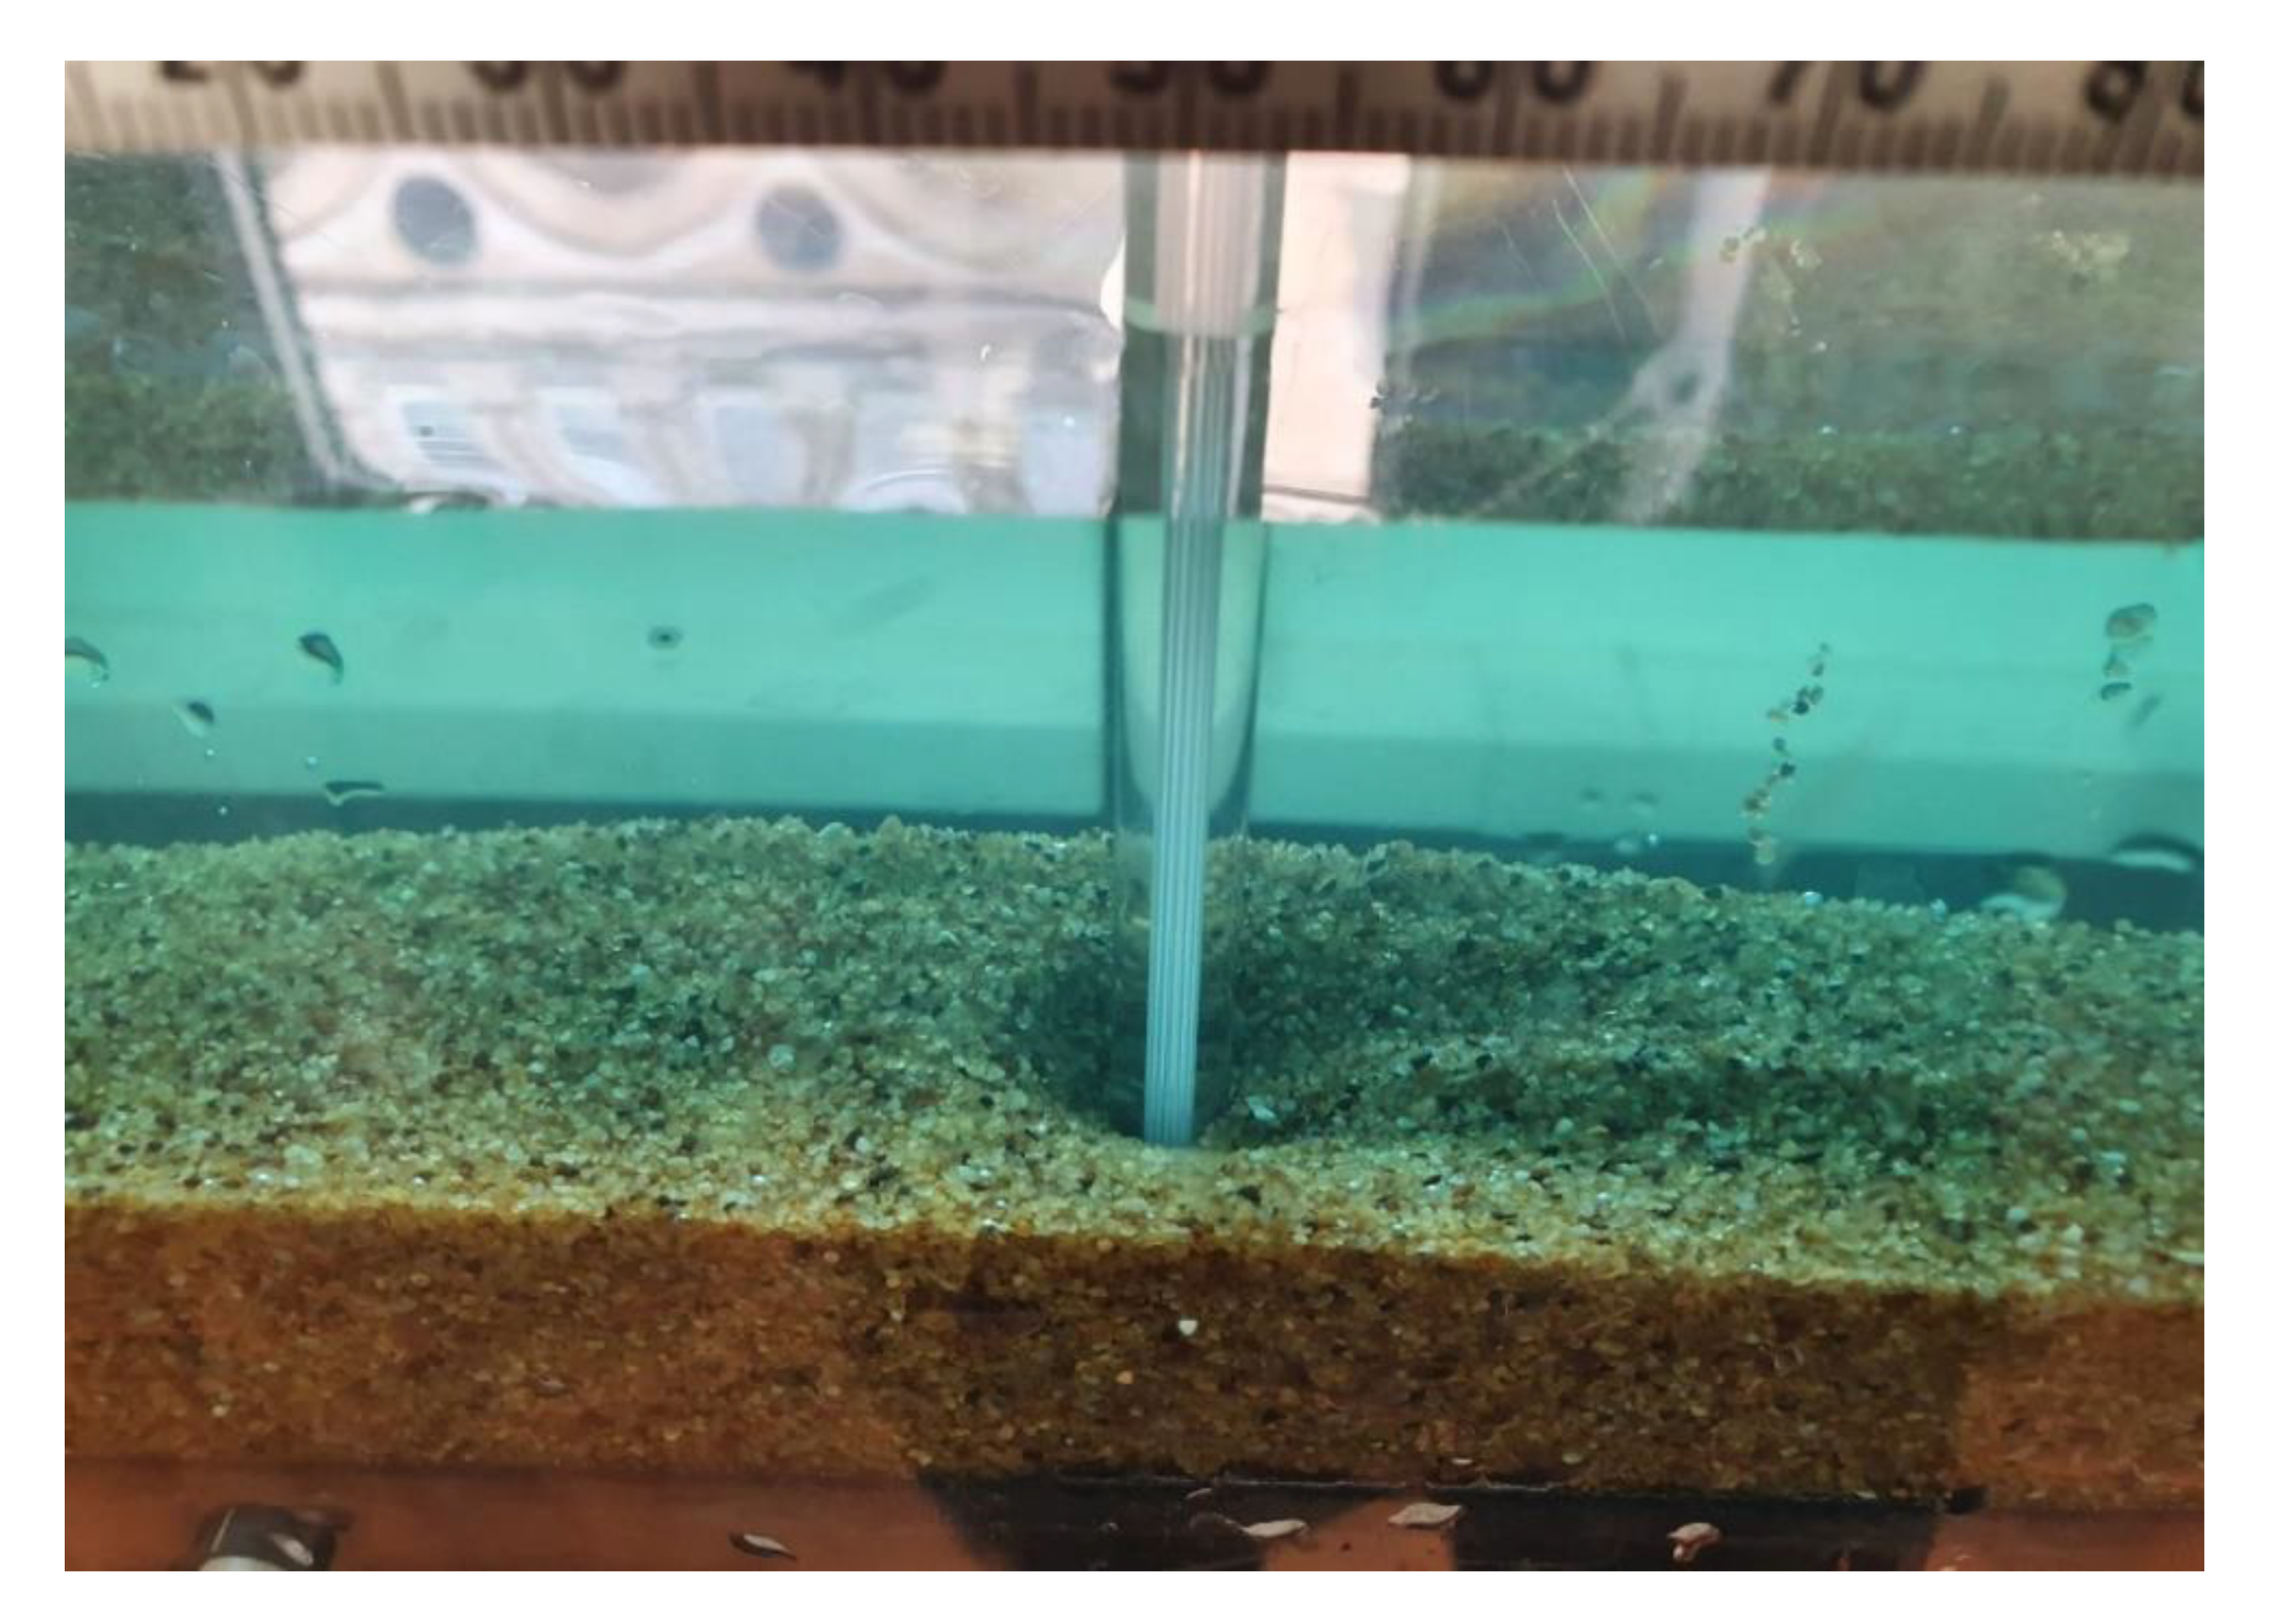
When a bridge pier obstructs flow in a stream, a boundary layer separation occurs, and where a point in contact with the bridge pier reverses in direction from the upstream bed in the approach flow, a horseshoe vortex occurs [7]. This was evident in the majority of experiments conducted and caused the formation of a scour hole in front of the bridge pier similar to the scour hole displayed in Figure 15. There was, however, an exception for the gabions of an 8 mm thickness, where in some instances the top layer of the gabion was exposed.
Muzzammil and Gangadhariah [10] investigated horseshoe vortex systems and concluded that the mean size of a primary horseshoe vortex size is approximately 20% of pier diameter. Results from this research project satisfy this finding and, in some cases, is higher than the approximation. Graf and Istiarto [9] substantiate the findings of this research project as a weaker wake vortex system led to the formation of a reduced scour hole size downstream of the bridge pier as well. However, the development of the downstream scour hole may have been adversely impacted when measuring the scour hole depth, as it required placing measuring equipment temporarily behind the bridge pier. This may have led to diversion of flow towards the sides of the flume channel and a reduction in the velocity of the wake vortex, leading to a subsequent reduction in the downstream scour hole size and depth. This phenomenon may also explain the raised level of the sediment downstream of the bridge pier when compared to its surroundings shown in Figure 15. A more accurate method of measuring the scour hole depth and size would be to use an acoustic doppler velocity profiler [9], alongside a radar device, or a buried rod system. The effect of sediment has not been considered when investigating the local scour depth, as at uniform sediments, local scour depths are unaffected by sediment size unless it is relatively coarse [39]. As the experiment did not observe measurements for the inflow discharge of sediment (Qs), the research mainly focuses on clear-water scour, where initial scour development occurs proportional to the flow rate (as flow rate increases so does the scour hole depth). After a significant scour depth is reached and there is large sediment movement, then sediment movement of the bed upstream may occur and deposit in the local scour area surrounding the bridge pier [42]. This is known as live-bed scour. Clear-water scour was the main form of scour throughout this experiment, although live-bed scour could have occurred at a sediment depth of 40 mm, as in C16 and S8, where the scour hole depth reduced from 120 to 150 s. This suggests that sediment was deposited into the scour hole from upstream. Whilst this may provide stability to the bridge pier in the short term, it could lead to faster scour development in the future.
4.2. Summary of Effect of Gabion Fill
The results display that, at a sediment depth of 40 mm throughout all thicknesses of gabions tested, the most effective fill material is stone, which had an average of 13 mm once the anomaly of S8 was corrected for. Closely followed by the clothing gabion, which had a total scour depth average of 15 mm, and the least effective fill material is plastic, which had an average of 16.3 mm. The gabion filled with stone aggregate was one of the most effective fills (leading to an average 43.5% reduction in scour compared to when no scour countermeasure was installed), which was expected due to the greater weight and larger surface area of the stone aggregate, when compared with other fills. Furthermore, as the stone aggregate had a larger surface area than the other materials tested, this may have put it at an advantage to the other gabion fills in the experiment, although research suggests this is not an issue [43].
The effectiveness of the clothing filled gabion is also prominent, as although it had a lower weight than the stone filled gabion, it produced the same average result over the three different thicknesses tested. The results can be attributed to the fact that the fill material replicates a geotextile (filter cloth) and therefore winnowing (the removal of fine material) of the sand sediment is reduced, leading to a reduction in scour. In this experiment conducted, winnowing could not have occurred, as a uniform sand sediment was selected and winnowing depends on the size of particles of two different sediments [44].
The results at a 50 mm sediment depth suggest that the type of fill used in gabion models is largely irrelevant in reducing local bridge scour. The most effective performing gabion fill at this level was the plastic filled gabion, which had an average scour depth of 23.5 mm, once the anomalous result of P16 was removed. Even then, the reduction in scour was only 9.61% from the original test when it was performed using no gabion models. Stone gabion models and the clothing gabion models at all thicknesses had a scour depth average of 24.33 mm, leading to an average reduction of scour of 6.42% from the original no gabion experiment. The difference between the different fills of the gabions is therefore 3.19%, which is a low percentage when considering the total scour depth. Therefore, the type of fill used at a 50 mm sediment depth in gabion models is not a major factor in the development of local scour at bridge piers. Additionally, a valid average of the plastic gabion models has not been calculated, as only two readings have been considered; therefore, the impact of plastic fill in gabions at a 50 mm sediment depth may not be fully representative of its effectiveness at reducing scour. At a 50 mm sediment depth, the average scour depths assessed for the different fill types are skewed, as at 8 mm thickness there is a much larger value of results for the scour depth, and therefore this has impacted the effectiveness of the stone, plastic and clothing materials, which would have had a reduced average scour depth if the 8 mm gabion thickness was not considered.
To summarise, the results at a 40 mm sediment depth, showed that the stone filled gabion proved to be the most effective at reducing bridge pier scour as expected, due to the heavier weight when compared to the clothing or plastic filled gabions. This is supported by research which found that a heavier countermeasure has a significant effect on the scour depth [35]. Furthermore, the fill of the stone gabions had the largest surface area compared to the clothing and plastic filled gabions, reinforcing findings that the larger the size and area of the scour countermeasure, the greater the reduction in scour [21,22]. The findings were contrary to some research which suggests that the size of the fill has no effect on the behaviour of the gabions [43]. As there are conflicting opinions on whether the size of the gabion impacts the scour depth, further research is required in this area. The results indicate that plastic filled gabions are not as effective as stone and clothing filled gabions, due to its higher average scour depth. However, the advantages of using plastic as a recycled material in construction could lead to environmental and economic benefits; therefore, further research should also be undertaken into the use of plastic as an alternative material.
Clothing does appear to be a viable alternative to stone filled gabions, in terms of reducing scour and reducing project costs. Although geotextiles were not used as a fill beneath the gabion mattresses, in the experiments of Parker et al. [26], the installation of geotextiles beneath riprap stones led to a 93% reduction in maximum scour depth, which identifies the influence that geotextiles or similar cloth-like materials can have in reducing scour. As previously mentioned, the implementation of clothing into the gabion mattresses will not only reduce the financial overheads of the project, but will also increase the overall sustainability of the project due to the re-use of recycled materials. Further research would need to be conducted to analyse the extent to which the reduced weight of the recycled clothing or fabric can be impacted by the flow velocity, as this could result in dislodging of the gabion due to its lightness. One method that could be used to resolve the issue of dislodging would be to seal the clothing filled gabion to the bridge pier using either an adhesive or a cable, or alternatively, the clothing could be anchored to the channel bed providing reinforcement and protection against failure by uplift.
4.3. Summary of Gabion Thickness
The best performing thickness on average was the largest of the thicknesses tested—gabion which had a thickness of 16 mm—as this thickness of gabion had an average scour depth of 13.67 mm, compared with the thickness of 12 mm, which had an average scour depth of 14 mm, and the 8 mm thick gabion models, which had an average scour depth of 18.67 mm. As all gabion models had a length of 32 mm, it is therefore possible to calculate a length to thickness ratio (L/t) for the models, which is provided in Table 7.
The 12 mm gabion models had a larger L/t ratio than the 16 mm gabion models (2.67 compared to 2), however the L/t ratios are similar, which may explain the small difference between the two. Although the 12 mm gabion had a larger ratio, this did not correlate with a greater reduction in the total scour of the bridge pier. This contradicts Yoon [1], who concluded that a larger L/t ratio will increase the critical velocity, which is the maximum velocity that the bed material can resist, up to a limiting factor of L/t = 3. This would indicate that the 16 mm thick gabions were not as effective at withstanding critical velocity as the 12 mm gabions; however, the scour reduction was slightly larger in the 16 mm gabions than the 12 mm gabions. This is due to the extended thickness of the 16 mm gabion model providing more embedment for the bridge pier, therefore providing greater resistance to scour in the immediate vicinity of the bridge pier.
The least effective thickness of gabion models was 8 mm, and this could be explained due to its large L/t ratio, as L/t = 4 is the largest value considered in the experiment. Highlighting that as the length to thickness ratio of the 8 mm gabions is larger than the limiting value L/t = 3, then the gabions do not have an increased capacity to resist critical velocity, and instead provide reduced cover for the bridge pier, adversely impacting scour reduction. Furthermore, the thickness of a gabion must be at least twice the average diameter of the fill [35]. In the experiment conducted, an average fill size used was 5 mm; therefore, when a gabion thickness of 8 mm was used, the T ≥ 2(d50) constraint was not satisfied, which could further explain the lack of effectiveness of the 8 mm thick gabions.
The results at a 50 mm sediment depth indicate that varying the fill of the gabion models is largely irrelevant in reducing the total scour depth. In most cases, the effect of the 8 and 16 mm thick gabions resembled the effect of when no scour countermeasures were installed. Additionally, the models S16, C8 and P8 led to the development of scour at a faster rate than the effect of no scour countermeasure installation, until the scour rate plateaued, and the models S16, C8 and P8 equalled the cumulative scour depth when no scour countermeasures were installed. The results at a 50 mm sediment depth corroborate the findings of Yoon [1], as the 12 mm thick gabions have a larger ratio of L/t compared to the 16 mm gabions (by 0.67), which increase the critical velocity and are better suited to reduce scour.
Based on Yoon [1], however, the results should also show that at 8 mm thickness, where the L/t ratio is 4 (and the highest), the total scour reduction should be similar to the results of the 12 mm gabions; conversely, this is not the case, which suggests that the results do not fully validate the findings [1]. Similar to the results at a 40 mm sediment depth, although the 8 mm thick gabions exceed the limiting factor of 3, this did not increase the capacity of the gabions in the results to resist the scour surrounding bridge piers, but instead led to increased stability of the gabions against failure, and if installed practically, would lead to decreased material costs at the expense of reducing bridge pier scour.
To summarise, the thickness of the gabions were an important factor in the reduction of local scour surrounding bridge piers, and at a 40 mm sediment depth, the greater the thickness of the gabion, the greater the reduction of the total scour depth, as a riprap layer (similar to gabions) can resist a higher flow velocity as its thickness increases [44]. Although the greater thickness meant a reduction in the L/t ratio, and therefore contradicts Yoon [1], who suggested this would lead to a reduced capacity to withstand critical velocity, this was not the case at the 40 mm sediment depth for all gabion models tested. However, it is worth stating that the L/t ratios were very similar between 12 and 16 mm thickness gabions (0.67 difference) and the results were also largely similar—a 14 mm average scour depth when compared to 13.67 mm. Therefore, it is difficult to draw conclusions from the results due to the similarity of results.
4.4. Summary of Effect of Sediment Depth and Placement Depth
At a 50 mm sediment depth, the most effective fill on average was the plastic filled gabion model, which had an average total scour depth of 22.6 mm compared to stone and clothing models, which both had a scour depth of 24.3 mm. At an increased depth of sediment depth, however, the results are largely ineffective at reducing bridge pier scour, as the total scour depth surrounding the bridge pier with no scour protection is 26 mm; consequently, the gabion models used at this depth are not practical. When the placement depth to pier diameter ratio (Y/b) is larger, then the higher the critical entrainment velocity and the greater the protection of the pier against local scour [1]. When placement depth of the gabion models was closer to the sediment depth at 40 mm, the gabion models were considerably more effective at reducing scour.
The results support the findings of Yoon [1], which state that the Y/b ratio is limited to 0.2, and any further increase in the Y/b ratio does not provide further scour protection. This is evident in the results, as the increase in the sediment depth from 40 to 50 mm, and therefore the placement depth, as shown in Table 8, led to an increase in the Y/b ratio; however, because the Y/b ratio exceeded 0.2, no additional scour protection was provided. Additionally, the scour protection provided at the 50 mm sediment depth was reduced when compared to the 40 mm sediment depth. This may imply that increasing the placement depth past a certain value may be detrimental to bridge piers as the top level of the gabions is closer to the sediment depth at 40 mm, which suggests there is a reduced stability in the gabions; but with the gabions being placed under a sizeable layer of sand sediment, there is little potential for this to occur, although this substantially reduces the gabions’ ability to reduce scour.
4.5. Summary of Effect of Time on Scour
The experiments were conducted in a short time period, over 150 s, with measurements being performed at 30 s intervals. The selection of time period and intervals were based on a trial and error process from when the scour depth increase appeared to slow or stop. As seen from the results, when the sediment depth was 50 mm (with exception to P16, S12, P12 and no gabion), the majority of the scour occurred within the first 30 s of the experiment, whereas when the sediment depth was 40 mm, most of the scour development occurs within 60 s (with exception to P12). Throughout the experiment, scour development was generally maintained or increased progressively as the gabions were tested; however, this was not the case for S8 and C12 at the 40 mm sediment depth, as between 120 and 150 s the cumulative scour depth decreased due to deposition of the sand sediment into the developing scour hole, causing a reduced total scour depth. It is unclear whether further deposition would have occurred if the experiment was conducted for a longer time period. However, the deposition of sand into the scour hole may lead to greater impact on the bridge pier’s structural strength in the long term.
Whilst the test was conducted over 150 s, when combining the results of all the gabion models respectively at both the 40 and 50 mm sediment depths, scour commonly occurred within 30 and 60 s. At a 50 mm sediment depth, the findings support the research of Melville and Chiew [39], who stated that scour depths after 10% of the time to equilibrium vary between 50% and 80% of the equilibrium depth. In terms of this investigation, the majority of scour would be expected to therefore occur within 15 s of the experiment beginning, which is the case at the 50 mm sediment depth, where the majority of scour depth for all models occurred within 30 s of the experiment. However, the lowering of the vertical sluice gate from 30 s onwards would have led to larger depths of water at Y1 and Y2; therefore, as the width of the flume channel remains the same, using the continuity equation V = Q/A, the flow velocity would have decreased as the sluice gate depth was lowered. This could explain the quick development of scour at a 50 mm sediment level prior to the sluice gate being in use.
The results differ at the 40 mm sediment depth, and the majority of scour depth occurs under 60 s, which, therefore, does not validate other research into the area [39]. In addition to this, due to the lack of time that the gabions were tested for, it is difficult to determine the stability of the gabions. In some studies, after fifteen minutes a riprap layer was stable, but after one hour of testing the riprap failed [44]. This underlines the importance of the need to extend the timeframe of this experiment because although the scour depth accumulation appeared to slow towards the end of the experiment, it could have failed completely when subject to a prolonged time period.
5. Conclusions and Recommendations
The use of alternative materials in gabion models in order to reduce local bridge pier scour was investigated in this project. The following conclusions can therefore be stated:
- Stone filled gabion models proved the most effective overall at reducing local pier scour, mainly due to the greater weight of the gabion. This is supported by Akib et al. [35].
- Clothing filled gabion models offer a sustainable alternative to stone filled gabions due to the resemblance between the results of the two different gabions, as the clothing acts similarly to a geotextile.
- Thickness of the gabions is a major factor in the development of scour; where gabion models had a L/t ratio less than 3, the scour reduction results proved more effective. This supports the findings of Yoon [1].
- The majority of scour development occurred between 20% and 40% of the time the experiment was conducted, offering a different value to that of Melville and Chiew [42], who stated 10%.
- Increasing the placement depth of the gabion models by 10 mm for all thicknesses of gabions led to large increases in the scour hole depth. Though the Y/b ratio increased, the ratio exceeded 0.2 and therefore the increase in ratio was ineffective; this supports the findings of Yoon [1].
- The effect of changing the gabion fill is largely irrelevant when installed at excessive sediment depths and placement depths as shown in the results at a 50 mm sediment depth.
Overall, the accuracy of the results produced were limited due to the experimental set up. The main issue was the disruption of the wake vortices when the downstream scour hole was measured, which may have affected the formation of the scour hole by impacting the sediment surrounding the bridge pier. The sediment depth considered was also excessive to successfully determine the impact that alternative gabion fills can have on reducing bridge pier scour, and placement depths which were relative to Y/b = 0.2 should have been considered. The time frame of the experiment was also too short to determine the prolonged stability of the gabion models.
Recommendations and Further Research
The research project has helped to identify a gap in existing knowledge on the use of alternative materials in gabion mattresses. Additional research could be performed reinvestigating the methodology used, with various parameters from the experiment altered. This may include increasing the time period for considerably longer, such as 24 h, and reducing the placement depth of the gabions so that the tops of the gabion mattresses are immediately below the sediment depth. Further research could also investigate the combined use of alternative materials (vegetation) with other scour countermeasures, such as collars. This project was conducted in uniform sediment conditions, which does not affect scour formation; therefore, further research may consider the use of coarse sediment, which may lead to abrasion of the gabion mattresses, as well as affecting the scour hole development.
Author Contributions
Conceptualization, T.C. and S.A.; Methodology, T.C. and S.A.; Formal Analysis, T.C.; Investigation, T.C.; Resources, T.C.; Data Curation, T.C.; Writing—Original Draft Preparation, T.C.; Writing—Review & Editing, S.A.; Visualization, T.C and S.A.; Supervision, S.A.; Project Administration, S.A. All authors have read and agreed to the published version of the manuscript.
Funding
This research received no external funding.
Conflicts of Interest
The authors declare that there is no conflict of interests regarding the publication of this paper.
References
- Yoon, T.H. Wire Gabion for Protecting Bridge Piers. J. Hydraul. Eng. 2005, 131, 942–949. [Google Scholar] [CrossRef]
- Akib, S.; Mamat, N.L.; Basser, H.; Jahangirzadeh, A. Reducing Local Scouring at Bridge Piles Using Collars and Geobags. Sci. World J. 2014, 2014, 128635. [Google Scholar] [CrossRef] [PubMed] [Green Version]
- Wardhana, K.; Hadipriono, F.C. Analysis of Recent Bridge Failures in the United States. J. Perform. Constr. Facil. 2003, 17, 144–150. [Google Scholar] [CrossRef] [Green Version]
- Melville, B.W.; Coleman, S.E. Bridge scour; Water Resources Publications, LLC: Littleton, CO, USA, 2000. [Google Scholar]
- Lamb, R.; Aspinall, W.; Odbert, H.M.; Wagener, T. Vulnerability of bridges to scour: Insights from an international expert elicitation workshop. Nat. Hazards Earth Syst. Sci. 2017, 17, 1393–1409. [Google Scholar] [CrossRef] [Green Version]
- Times Union. 31 Years Ago: Schoharie Creek Bridge Collapse Kills 10. [Online]. 2017. Available online: https://www.timesunion.com/local/article/30-years-ago-Bridge-collapse-kills-10-12807492.php (accessed on 26 March 2020).
- Akan, A.O. Open Channel Hydraulics; Elsevier BV: Amsterdam, The Netherlands, 2006. [Google Scholar]
- Yu, X.; Yu, X. Laboratory Evaluation of Time-Domain Reflectometry for Bridge Scour Measurement: Comparison with the Ultrasonic Method. Adv. Civ. Eng. 2010, 2010, 508172. [Google Scholar] [CrossRef] [Green Version]
- Graf, W.; Istiarto, I. Flow pattern in the scour hole around a cylinder. J. Hydraul. Res. 2002, 40, 13–20. [Google Scholar] [CrossRef]
- Muzzammil, M.; Gangadhariah, T. The mean charecteristics of horseshoe vortex at a cylindrical pier. J. Hydraul. Res. 2003, 41, 285–297. [Google Scholar] [CrossRef]
- Grimaldi, C.; Gaudio, R.; Calomino, F.; Cardoso, A.H. Countermeasures against Local Scouring at Bridge Piers: Slot and Combined System of Slot and Bed Sill. J. Hydraul. Eng. 2009, 135, 425–431. [Google Scholar] [CrossRef]
- Chinnarasri, C.; Kositgittiwong, D. Laboratory study of maximum scour depth downstream of sills. Proc. Inst. Civ. Eng.—Water Manag. 2008, 161, 267–275. [Google Scholar] [CrossRef]
- Haque, A.; Rahman, M.; Islam, G.; Hussain, M. Scour mitigation at bridge piers using sacrificial piles. Int. J. Sediment Res. 2007, 22, 49–59. [Google Scholar]
- Chang, F.F.; Karim, M. An Experimental Study of Reducing Scour around Bridge Piers Using Piles; South Dakota Department of Highways: Pierre, SD, USA, 1972.
- Park, J.H.; Sok, C.; Park, C.K.; Kim, Y.D. A study on the effects of debris accumulation at sacrificial piles on bridge pier scour: I. Experimental results. KSCE J. Civ. Eng. 2015, 20, 1546–1551. [Google Scholar] [CrossRef]
- Ghorbani, B.; Kells, J. Effect of submerged vanes on the scour occurring at a cylindrical pier. J. Hydraul. Res. 2008, 46, 610–619. [Google Scholar] [CrossRef]
- Odgaard, J.A.; Wang, Y. Scour Prevention at Bridge Piers; Nature Conference of Hydraulic Engineering; ASCE: Williamsburg, VA, USA, 1987. [Google Scholar]
- Jahangirzadeh, A.; Basser, H.; Akib, S.; Karami, H.; Naji, S.; Shamshirband, S. Experimental and Numerical Investigation of the Effect of Different Shapes of Collars on the Reduction of Scour around a Single Bridge Pier. PLoS ONE 2014, 9, e98592. [Google Scholar] [CrossRef] [PubMed]
- Zarrati, A.R.; Gholami, H.; Mashahir, M. Application of collar to control scouring around rectangular bridge piers. J. Hydraul. Res. 2004, 41, 97–103. [Google Scholar] [CrossRef]
- Chen, S.-C.; Tfwala, S.; Wu, T.-Y.; Chan, H.-C.; Chou, H.-T. A Hooked-Collar for Bridge Piers Protection: Flow Fields and Scour. Water 2018, 10, 1251. [Google Scholar] [CrossRef] [Green Version]
- Unger, J.; Hager, W.H. Riprap Failure at Circular Bridge Piers. J. Hydraul. Eng. 2006, 132, 354–362. [Google Scholar] [CrossRef]
- Lauchlan, C.S.; Melville, B.W. Riprap Protection at Bridge Piers. J. Hydraul. Eng. 2001, 127, 412–418. [Google Scholar] [CrossRef]
- Froehlich, D.C. Protecting bridge piers with loose rock riprap. J. Appl. Water Eng. Res. 2013, 1, 39–57. [Google Scholar] [CrossRef]
- Akib, S.; Jahangirzadeh, A.; Wei, L.H.; Shirazi, S.M.; Rahman, S. Experimental study on the skewed integral bridge by using crushed concrete geobags as scour protection. In Proceedings of the 6th International Conference on Scour and Erosion, Paris, France, 27–31 August 2012; pp. 197–203. [Google Scholar]
- Korkut, R.; Martinez, E.J.; Morales, R.; Ettema, R.; Barkdoll, B. Geobag Performance as Scour Countermeasure for Bridge Abutments. J. Hydraul. Eng. 2007, 133, 431–439. [Google Scholar] [CrossRef]
- Parker, G.; Toro-Escobar, C.; Voigt, R.L. Countermeasures to Protect Bridge Piers from Scour; National Cooperative Highway Research Program: Minneapolis, MN, USA, 1998. [Google Scholar]
- Hoe, D. Cable-Tied Block Protection of Bridge Abutments; Fourth Year Project in Resource Engineering; Department of Civil and Resources Engineering, The University of Auckland: Auckland, New Zealand, 2001. [Google Scholar]
- Karimi, N.; Heidarnejad, M.; Masjedi, A. Scour depth at inclined bridge piers along a straight path: A laboratory study. Eng. Sci. Technol. Int. J. 2016, 20, 1302–1307. [Google Scholar] [CrossRef]
- Kitsikoudis, V.; Kirca, V.O.; Yagci, O.; Celik, M.F. Clear-water scour and flow field alteration around an inclined pile. Coast. Eng. 2017, 129, 59–73. [Google Scholar] [CrossRef]
- Murtaza, G.; Hashmi, H.N.; Naeem, U.A.; Khan, D.; Ahmad, N. Effect of Bridge Pier Shape on Scour Depth at Uniform Single Bridge Pier. Mehran Univ. Res. J. Eng. Technol. 2018, 37, 539–544. [Google Scholar] [CrossRef]
- Farooq, R.; Ghumman, A.R. Impact Assessment of Pier Shape and Modifications on Scouring around Bridge Pier. Water 2019, 11, 1761. [Google Scholar] [CrossRef] [Green Version]
- Hajikandi, H.; Golnabi, M. Y-shaped and T-shaped slots in river bridge piers as scour countermeasures. Proc. Inst. Civ. Eng.—Water Manag. 2018, 171, 253–263. [Google Scholar] [CrossRef]
- Obied, N.A.; Khassaf, S.I. Experimental Study for Protection of Piers against Local Scour Using Slots. Int. J. Eng. 2019, 32, 217–222. [Google Scholar]
- Byjssw.com. Bridge Protection Gabion. Anping Baiyi Metal Mesh Products Co., Ltd. [Online]. 2020. Available online: http://www.byjssw.com/Application/39.html (accessed on 26 March 2020).
- Lagasse, P.F.; Clopper, P.E.; Zevenbergen, L.W.; Girard, L.G. NCHRP Report 593—Countermeasures to Protect Bridge Piers from Scour; National Cooperative Highway Research Program: Washington, DC, USA, 2007. [Google Scholar]
- Pagliara, S.; Carnacina, I.; Cigni, F. Sills and gabions as countermeasures at bridge pier in presence of debris accumulations. J. Hydraul. Res. 2010, 48, 764–774. [Google Scholar] [CrossRef]
- IPCC. Global warming of 1.5 °C; An IPCC Special Report on the Impacts of Global Warming; IPCC: Geneva, Switzerland, 2018. [Google Scholar]
- Kendon, E.J.; Roberts, N.M.; Fowler, H.J.; Roberts, M.J.; Chan, S.C.; Senior, C.A. Heavier summer downpours with climate change revealed by weather forecast resolution model. Nat. Clim. Chang. 2014, 4, 570–576. [Google Scholar] [CrossRef] [Green Version]
- Melville, B.W.; Chiew, Y.-M. Time Scale for Local Scour at Bridge Piers. J. Hydraul. Eng. 1999, 125, 59–65. [Google Scholar] [CrossRef]
- Chiew, Y.M.; Melville, B.W. Local scour around bridge piers. J. Hydraul. Res. 1987, 25, 15–26. [Google Scholar] [CrossRef]
- Raudkivi, A.J.; Ettema, R. Clear-Water Scour at Cylindrical Piers. J. Hydraul. Eng. 1983, 109, 338–350. [Google Scholar] [CrossRef]
- May, R.W.; Kirby, A.M.; Ackers, J.C. Manual on Scour at Bridges and Other Hydraulic Structures; CIRIA: London, UK, 2002. [Google Scholar]
- Yoon, T.H.; Kim, D.-H. Bridge Pier Scour Protection by Sack Gabions. Bridg. Gap 2001. [Google Scholar] [CrossRef]
- Chiew, Y.-M. Mechanics of Riprap Failure at Bridge Piers. J. Hydraul. Eng. 1995, 121, 635–643. [Google Scholar] [CrossRef]
Figure 1.
Schoharie Creek bridge collapse in 1987 after the scouring of one of its bridge piers’ foundations [6].
Figure 1.
Schoharie Creek bridge collapse in 1987 after the scouring of one of its bridge piers’ foundations [6].

Figure 2.
(a) Horseshoe and wake vortex around cylindrical bridge pier [7]. (b) Horseshoe and wake vortices around cylindrical bridge pier [8].

Figure 3.
Diagram of a collar installed surrounding a bridge pier to reduce scour [20].
Figure 3.
Diagram of a collar installed surrounding a bridge pier to reduce scour [20].

Figure 4.
Riprap used to protect bridge piers from scour [23].
Figure 4.
Riprap used to protect bridge piers from scour [23].

Figure 5.
Diagram of rectangular pier slot combined with a downstream bed sill used to reduce bridge scour [11].
Figure 5.
Diagram of rectangular pier slot combined with a downstream bed sill used to reduce bridge scour [11].

Figure 6.
Example of a stepped gabion mattress formation to prevent bridge pier scour [34].
Figure 6.
Example of a stepped gabion mattress formation to prevent bridge pier scour [34].

Figure 7.
Image of gabion boxes with various dimensions and fill increasing in height from bottom to top: 8 mm, 12 mm and 16 mm (from left to right: stone, clothing, plastic).
Figure 7.
Image of gabion boxes with various dimensions and fill increasing in height from bottom to top: 8 mm, 12 mm and 16 mm (from left to right: stone, clothing, plastic).

Figure 8.
Sketch diagram of experiment layout, where Y1 = depth of flow, d = sediment depth, Y2 = water depth above sediment depth, D = pier diameter, L = gabion length and t = gabion thickness.
Figure 8.
Sketch diagram of experiment layout, where Y1 = depth of flow, d = sediment depth, Y2 = water depth above sediment depth, D = pier diameter, L = gabion length and t = gabion thickness.

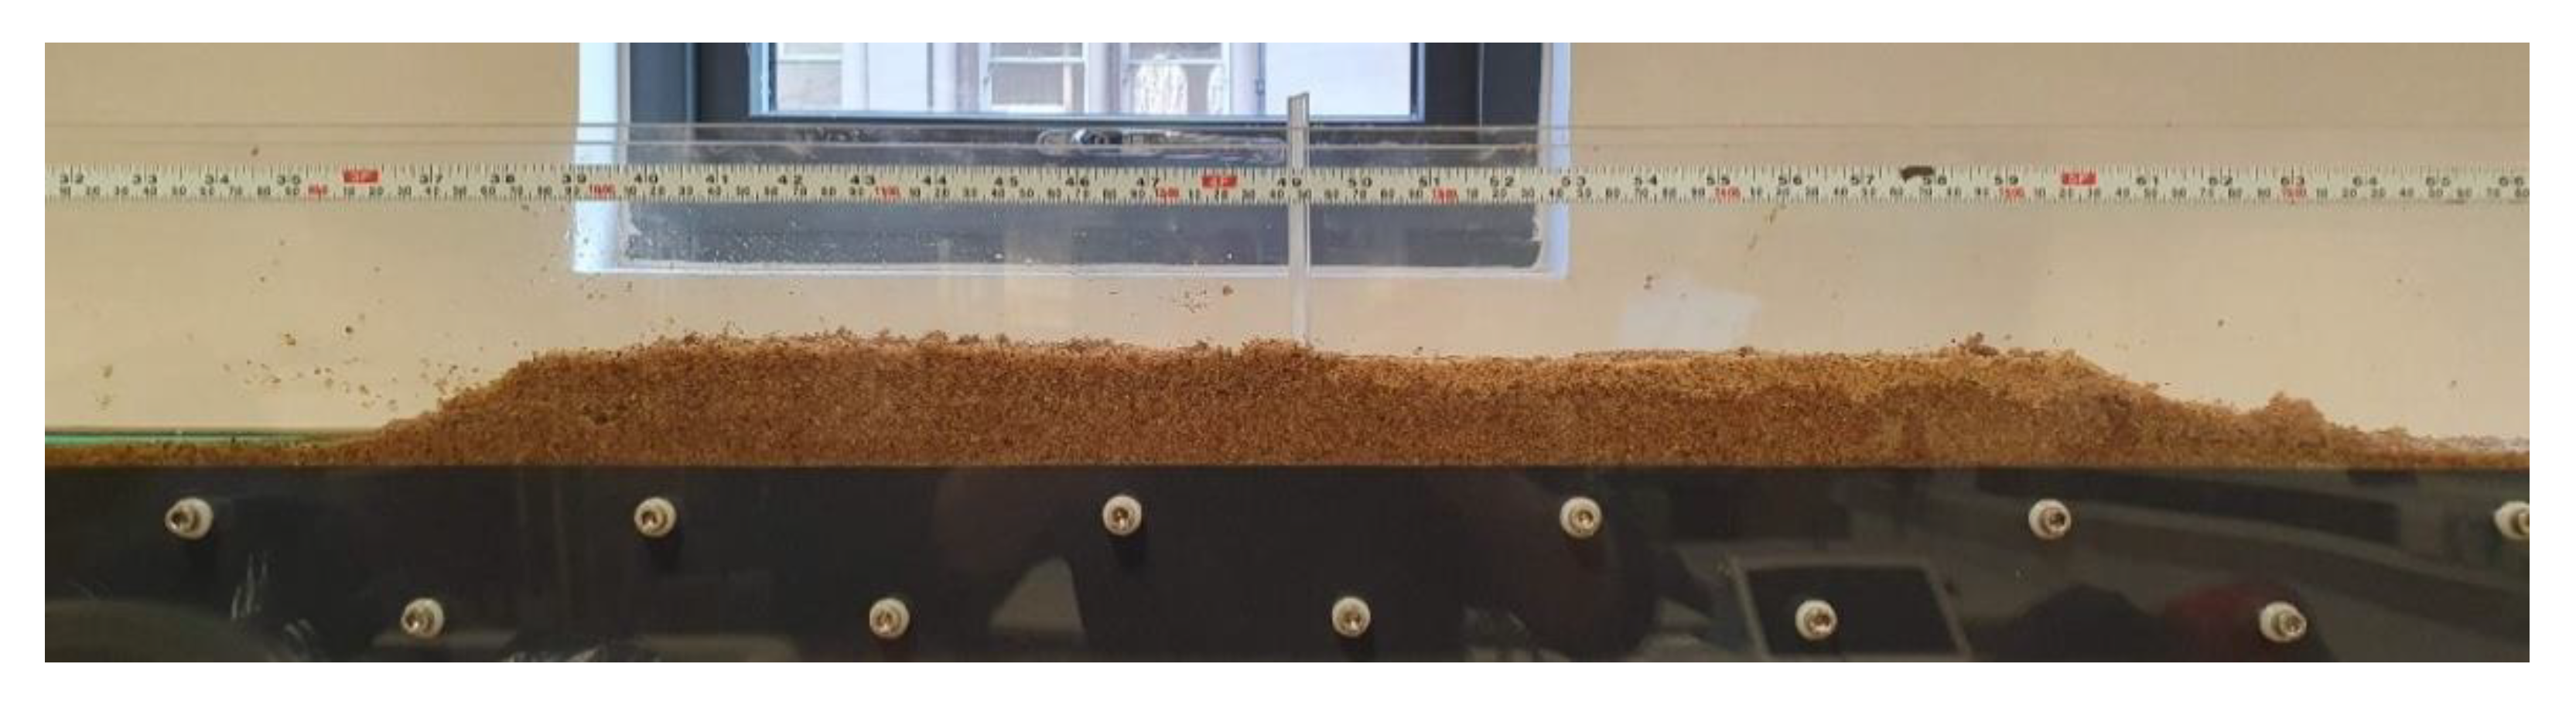
Figure 9.
Image of experimental set up showing the sand sediment depth with sloped sides and cylindrical bridge pier.
Figure 9.
Image of experimental set up showing the sand sediment depth with sloped sides and cylindrical bridge pier.

Figure 10.
Effect of gabion fill type at 8 mm thickness on reducing total scour depth.

Figure 11.
Effect of gabion fill at 12 mm thickness on reducing total scour depth.

Figure 12.
Effect of gabion fill type at 16 mm thickness on reducing total scour depth.

Figure 13.
Graph representing all thicknesses of gabion models and the cumulative scour depth at a sediment depth of 50 mm.
Figure 13.
Graph representing all thicknesses of gabion models and the cumulative scour depth at a sediment depth of 50 mm.

Figure 14.
Graph representing all thicknesses of gabion models and the cumulative scour depth over time at a sediment depth of 40 mm.
Figure 14.
Graph representing all thicknesses of gabion models and the cumulative scour depth over time at a sediment depth of 40 mm.

Figure 15.
Example of a scour hole formation for stone gabion (thickness 8 mm) at a sediment depth of 40 mm.
Figure 15.
Example of a scour hole formation for stone gabion (thickness 8 mm) at a sediment depth of 40 mm.


Table 1.
Summary of gabion model dimensions.
| Material Type | Gabion Length (mm) | Gabion Thickness (mm) | Model Label |
|---|---|---|---|
| Stone | 32 | 8 | S8 |
| 12 | S12 | ||
| 16 | S16 | ||
| Clothing | 32 | 8 | C8 |
| 12 | C12 | ||
| 16 | C16 | ||
| Plastic | 32 | 8 | P8 |
| 12 | P12 | ||
| 16 | P16 |
Table 2.
Summary of vertical sluice gate depths at time intervals.
| Time (s) | Depth of Vertical Sluice Gate (mm) |
|---|---|
| 0 | N/A |
| 30 | 15 |
| 60 | 12 |
| 90 | 9 |
| 120 | 6 |
| 150 | 3 |
Table 3.
Results showing the effects of no gabion models in scour depth development.
| Gabion Type | Sediment Depth, d (mm) | Time Taken (s) | Scour Depth (mm) |
|---|---|---|---|
| No Gabion | 40 | 150 | 23 |
| No Gabion | 50 | 150 | 26 |
Table 4.
Results showing the effect of gabion fill type at 8 mm thickness.
| Gabion Label | Sediment Depth, d (mm) | Total Scour Depth (mm) | Reduction in Scour (%) |
|---|---|---|---|
| S8 | 40 | 19 | 17.4 |
| 50 | 25 | 3.8 | |
| P8 | 40 | 20 | 13 |
| 50 | 26 | 0 | |
| C8 | 40 | 17 | 26.1 |
| 50 | 26 | 0 |
Table 5.
Results of 12 mm thickness gabion models in reducing total scour depth.
| Gabion Label | Sediment Depth, d (mm) | Total Scour Depth (mm) | Reduction in Scour (%) |
|---|---|---|---|
| S12 | 40 | 13 | 43.5 |
| 50 | 22 | 15.4 | |
| P12 | 40 | 15 | 34.8 |
| 50 | 21 | 19.2 | |
| C12 | 40 | 14 | 39.1 |
| 50 | 22 | 15.4 |
Table 6.
Results of 16 mm thickness gabion models in reducing total scour depth.
| Gabion Label | Sediment Depth, d (mm) | Total Scour Depth (mm) | Reduction in Scour (%) |
|---|---|---|---|
| S16 | 40 | 13 | 43.5 |
| 50 | 26 | 0 | |
| P16 | 40 | 14 | 39.1 |
| 50 | 21 | 19.2 | |
| C16 | 40 | 14 | 39.1 |
| 50 | 25 | 3.8 |
Table 7.
Summary of length to thickness ratio of gabion models.
| Gabion Thickness (mm) | Gabion Length (mm) | L/t Ratio |
|---|---|---|
| 8 | 32 | 4 |
| 12 | 32 | 2.67 |
| 16 | 32 | 2 |
Table 8.
Summary of placement depth to pier diameter ratio.
| Sediment Depth (mm) | Gabion Thickness (mm) | Gabion Model Type | Placement Depth, Y (mm) | Y/b Ratio |
|---|---|---|---|---|
| 40 | 8 | C8, P8, S8 | 32 | 4 |
| 12 | C12, P12, S12 | 28 | 3.5 | |
| 16 | C16, P16, S16 | 24 | 3 | |
| 50 | 8 | C8, P8, S8 | 42 | 5.25 |
| 12 | C12, P12, S12 | 38 | 4.75 | |
| 16 | C16, P16, S16 | 34 | 4.25 |
Publisher’s Note: MDPI stays neutral with regard to jurisdictional claims in published maps and institutional affiliations. |
© 2020 by the authors. Licensee MDPI, Basel, Switzerland. This article is an open access article distributed under the terms and conditions of the Creative Commons Attribution (CC BY) license (http://creativecommons.org/licenses/by/4.0/).
Share and Cite
MDPI and ACS Style
Craswell, T.; Akib, S. Reducing Bridge Pier Scour Using Gabion Mattresses Filled with Recycled and Alternative Materials. Eng 2020, 1, 188-210. https://0-doi-org.brum.beds.ac.uk/10.3390/eng1020013
AMA Style
Craswell T, Akib S. Reducing Bridge Pier Scour Using Gabion Mattresses Filled with Recycled and Alternative Materials. Eng. 2020; 1(2):188-210. https://0-doi-org.brum.beds.ac.uk/10.3390/eng1020013
Chicago/Turabian StyleCraswell, Tom, and Shatirah Akib. 2020. "Reducing Bridge Pier Scour Using Gabion Mattresses Filled with Recycled and Alternative Materials" Eng 1, no. 2: 188-210. https://0-doi-org.brum.beds.ac.uk/10.3390/eng1020013