1. Introduction
Due to the high carbon dioxide emissions of conventional petrol and diesel drive systems, automotive producers are forced by governments around the world to develop environmentally friendly alternatives. Many countries have joined the zero-emission vehicle alliance (ZEV) as a result, which is determined to ban fossil fuel cars by the year 2050 [
1]. To achieve this goal, many legislators have created “phase-out” plans, that forbid the sale or registration of brand-new fossil fuel cars by a certain date. An overview can be found in [
2].
Since individual mobility has a high significance in today’s society, alternatives must be found. Based on the current market situation, the successor seems to be the electric car, which uses lithium-ion batteries to store the energy. While this technology is under constant development, it still has some issues; one of which is the use of cobalt in the cathode, which is mostly supplied by Democratic Republic of Congo. Investigations by Amnesty International have raised concerns about human rights violations as well as environmental concerns about mining activities by the mentioned country [
3]. Research for alternative elements has led to a reduction in cobalt by substituting it with nickel and manganese, but cobalt is still used in most electric vehicles today [
4]. Lithium, on the other hand, can mostly be found in Chile and Australia. While Australia has currently the highest production, Chile has four times the reserves [
5]. However, in the latter, the lithium cannot be mined but must be extracted from the ground by pumping water into the earth and extracting it from the mud that is washed up. While mining companies claim that this process has no negative impact on the environment, locals strongly disagree [
6]. Since the lifetime of the components, especially of the batteries, are limited, recycling is an important aspect. The current recycling processes of lithium batteries produce more emissions than the production of new ones. The reduction of the cobalt content makes is less viable for companies to invest in research for new recycling technologies [
7].
Another challenge that this technology faces is the integration of the charging stations into the existing grid. The most obvious problem is the load increase, which can lead to a system overload since the components like transformers and supply lines are not designed to handle the extra loads [
8]. While some people may be aware of these issues, a point that is often overlooked is the weight of the batteries. When, for example, comparing the Volkswagen electric golf with the petrol version, which have the same power and are almost identical in every aspect but the drive train, the electric version is more than 200 kg heavier [
9].
Many research projects are trying to address these issues. Nonetheless, there might be other technologies with fewer downsides. An alternative to storing the energy in lithium-ion batteries is storing the energy in the form of pure hydrogen. When fusing hydrogen with oxygen, energy is released and, theoretically, the only by-product is water.
The biggest point of criticism hydrogen currently faces is its manufacturing process. Most of it is obtained by steam reforming methane or gasification of coal [
10,
11]. Since most of the methane comes from natural gas or crude oil, the currently sold hydrogen originates in large parts from fossil fuels. This would not address the climate change concerns.
The other way in which hydrogen can be obtained is by splitting water into hydrogen and oxygen using electricity, a process called electrolysis. If renewable energy sources, like wind, water or solar are used, the produced hydrogen is actually “green”. Pricewise, this approach currently cannot compete with the fossil fuel-based methods, but [
12] predicts that this will change within the next decade. Since the main use of hydrogen is currently in industrial applications, it is in the EUs interest to shift towards the production of green hydrogen to meet the zero emission goals. Therefore, funding strategies are being developed by the EU to achieve the green production of hydrogen [
13].
All the current hydrogen fuelled vehicles store the hydrogen in pressure tanks and use fuel cells to convert the chemical energy into electrical energy. The aim of this paper is to provide an overview of the involved technologies and investigate alternatives like using hydrogen combustion engines instead of fuel cells. The technological advantages and disadvantages, as well as the efficiencies and costs of the individual technologies are then compared with each other. Furthermore, the local small-scale production of hydrogen is economically and technically analysed.
2. Hydrogen Storage
One aspect that is often under heavy discussion with alternatives to fossil fuels is the cars’ travel range. For hydrogen vehicles, an important factor for the range is the amount of hydrogen that can be stored inside the vehicle. In the following, different storage technologies will be discussed and compared.
2.1. Pressure Storage
All currently available hydrogen vehicles on the market use pressure tanks to store compressed hydrogen at either 350 or 700 bars. These tanks are categorized into four groups, usually referred to with roman numerals (I–IV). While types one to three are made completely or partially out of metal, type four is made completely from fibre reinforced plastics. This concept is more lightweight and, if operated at 700 bars, a 30-L tank weighing 26 kg and requiring 60 L of installation space can hold 1.21 kg of hydrogen. This results in an energy density of 1.59 kWh/kg and 0.67 kWh/dm
3. The energy densities improve with tank size, and a 120-L tank can achieve 1.84 kWh/kg and 0.77 kWh/dm
3. In the case of properly functioning equipment, the losses are negligible [
14]. A study by the U.S. department of energy predicts that, for a 700 bar type four tank storing 5.6 kg of hydrogen, the costs will drop down to USD 1100 per tank (33
$/kWh) at an annual production rate of 10,000 units per year or USD 550 per tank (16.7
$/kWh) with 100,000 units produced per year [
15].
2.2. Liquid Hydrogen
Early hydrogen cars, like the BMW “Hydrogen 7”, used liquid hydrogen. While the density of liquid hydrogen cooled to 20 K (70.8 kg/m
3) is far greater than that of hydrogen compressed to 700 bar (39.3 kg/m
3), which leads to energy densities of 2 kWh/kg or 1.2 kWh/dm
3, this approach faces several challenges. The main problem is isolating the cooled hydrogen and preventing it from heating up. Modern liquid hydrogen tanks use an inner and an outer layer separated by a high vacuum to avoid heat transfer by convection. Heat transfer by radiation is suppressed by placing aluminium and glass fibre mats inside the vacuum. Nonetheless, heat is transferred into the inner container via the filling nozzle as well as spacer sleeves, which causes the hydrogen to degas. Since the Cryotanks cannot withstand high pressures, the hydrogen must be released leading to losses varying between 0.3 to 3% per day [
14].
2.3. Metall Hydrides
Hydrogen can be diffused inside the lattice of different metals or their alloys. While the absorption is an exothermic process, the desorption requires a lot of heat energy to release the hydrogen. While this can be a safety feature in the event of an accident, it creates several obstacles for both the de- and refuelling process. Another problem is the anisotropic expansion when the hydrogen diffuses into the material, which causes the material to crack. Under laboratory conditions, metal alloys were able to absorb up to 14% of their own weight in hydrogen, but 3–8% is more common, which equals energy densities of 1–4.62 kWh/kg [
14]. In the common metal hydrides, it can be observed that higher storage capabilities require higher operating temperatures. LaNi
5, for example, can store 1.4 wt.% and operates at 298 K; whereas, Mg
2Ni can store 3.6 wt.% and operates at 555 K [
16]. Current research focuses on developing nanomaterials; for instance, using highly porous carbon materials as additives, with higher storage capabilities and decreasing the temperature that is required to extract the hydrogen. Review articles conclude that, despite much progress in recent years, this technology still needs much development effort before it can be used by the automotive industry [
17,
18].
2.4. Carbon Nanomaterials
Contrary to the metal hydrides, carbon nano materials do not absorb the hydrogen but instead store it in most parts on their surface. In theory, carbon nanomaterials have several advantages over the metal hydrides. De-/refuelling does not cause significant expansion, which leads to higher durability in terms of charging cycles. The material is also cheaper and hydrogen release is faster. One of the main problems is the fact that hydrogen only attaches to reactive carbon [
19]. This is why current research focuses on either creating more reactive carbon sites or coating carbon with materials that act as catalysts [
20,
21,
22,
23,
24]. One of the highest storage capacities currently reported for this technology is 10.94 wt.% (3.6 kWh/kg) at room temperature, which was achieved by coating carbon nanotubes with bimetallic iron silver and titanium oxide particles. The capacitor was able to sustain the storage capability for 20 cycles [
25]. Despite the recent advances, review articles conclude, that this technology is not yet market ready. However, the potential shown in recent research projects is huge. Recent reviews of hydrogen storage in carbon nanomaterials can be found in [
19,
26,
27,
28].
2.5. Summary
A summary of the different hydrogen storage technologies is listed in
Table 1. Due to the limitations of the other technologies, it becomes obvious why the pressure storage is currently favoured by the automotive industry. Liquid hydrogen achieves higher energy densities, but the constant degassing is a major drawback. While metal hydrides currently have the highest energy densities, their high operating temperatures make them impracticable for the use in automobiles. Currently, the most promising future hydrogen storage technology are carbon nanomaterials. Their energy density is more than twice that of the pressure storage. However, since the high energy density can only be maintained for a low number of charging cycles, they are not market-ready yet.
3. Hydrogen Energy Conversion
The chemical energy stored in the hydrogen must be converted into kinetic energy. The efficiency of that process has a huge impact on the range of the car as well as the fuel costs. In the following the hydrogen combustion engine as well as the hydrogen fuel cell will be discussed.
3.1. Hydrogen Combustion Engine
The hydrogen combustion engine converts the chemical energy of the hydrogen into mechanical energy and heat by fusing hydrogen with oxygen to form water. In theory, hydrogen can be used in both the Otto and the diesel engine because of its flammability limit reaching from 4 to 75% by volume of air [
29].
In practice, however, the high self-ignition temperature of hydrogen (858 K) prevents the use of hydrogen without the use of auxiliary fuels or heating measures in diesel engines. Due to the heat transfer resistance, the temperatures necessary for self-ignition would have to reach 1100 K. This would require extremely high compression ratios that are impossible to achieve [
30]. Therefore, researchers have taken a different approach and substituted some of the diesel in conventional engines with hydrogen. While the diesel fuel ignites the mixture at lower temperatures, the substituted hydrogen reduces the overall emissions. At high engine loads, this has no negative effects on the brake thermal efficiency (BTE), while at low- to midrange engine loads, the BTE decreases [
31,
32]. Exhaust gas recirculation was shown to greatly reduce the nitrogen oxide emissions of dual fuel hydrogen engines, which are a big problem for any engine operating at high temperatures [
32]. While it was shown that it is possible to run hydrogen in a diesel combustion process by itself using either air preheated to 200 °C or glow plugs resulting in thermal efficiencies varying between 32 and 49% depending on the engine load, this approach could not be found in recent publications [
33]. Consequently, the diesel cycle, where the fuel is required to ignite by itself when compressed, is not a suitable option for an engine intended to run solely on hydrogen.
Combustion engines, running solely on hydrogen, were used in pilot productions, like the “BMW Hydrogen 7”, which was based on the Otto engine. These types of engines can differ based on the carburation methods; internal or external. The former is cheap to realize because it does not require high operating pressures. This is a result of air fuel mixture being mixed outside the cylinder and then sucked in, but the presence of a flammable air hydrogen mixture outside of the cylinder involves the risk of flashbacks. The latter requires higher operating pressures varying from 10 to 50 bars, which enables power densities that even exceed those of petrol engines by 15% [
34]. For both concepts, the nitrogen oxide concentration can be reduced by either using high air fuel ratios or exhaust gas recirculation [
29]. Simulations have shown that efficiencies of up to 44.5% for a six-cylinder engine under partial load could be obtained [
35], while reports in literature from actual tests do not exceed 38% [
29,
36]. Of course, this does not mean that the simulated efficiencies cannot be achieved, just that no other information has been made public yet.
In recent years, there have been several review papers [
37,
38,
39] and books [
29,
36] published regarding hydrogen combustion engines. The conclusions only vary slightly between the different authors. In terms of economy, it can be said that the break thermal efficiency of a hydrogen combustion engine currently lies between that of the petrol and diesel engine or even achieves that of the latter in experimental setups. Since the hydrogen combustion engine underlies the same physical boundaries as the other combustion engines, it too is limited by the Carnot efficiency. Therefore, even with technological improvements, it is not likely that efficiency exceeds 50% under variable load conditions. In pure hydrogen mode, there are no CO
2 emissions and only traces of hydrocarbon emission caused by the burning of lubricating oil. A big problem is nitrogen oxides, but this issue can be addressed by exhaust gas recirculation, a process that is already applied to diesel engines that face the same problem. Current issues include backfire due to local hotspots in the fuel chamber that causes back fire and problems with the ignition timing. Research focuses on addressing these issues; for instance, by using laser ignition instead of regular spark plugs [
40].
Since there is currently no mass production of hydrogen engines, their costs can only be estimated. A company specializing in Hydrogen combustion engines states that the total costs and weight will roughly equal that of a diesel engine [
41]. Since the basic components are very similar to those of the diesel engine and even the exhaust gas recirculation is the same, this estimate seems reasonable. The costs for a mid-sized diesel combustion engine including the transmission are 30 €/kW, not including the exhaust treatment [
42]. Determining the power density is another problem, since there are not much data published regarding the weight of a modern diesel engine. Honda states that their 2014 model of 1.6 litre diesel engine weighs 160 kg and can output 88 kW, giving it a power-to-weight ratio of 0.55 kW/kg [
43]. The 2005 Mercedes OM642 is stated to weigh 208 kg at a power rating of 173 kW, resulting in a power-to-weight-ratio of 0.83 kW/kg [
44]. In 2011, the engine was improved to output 195 kW, but no weight is mentioned [
45]. Since the main components were stated to experience only slight changes, it can be assumed that the weight stayed the same, which results in a power-to-weight ratio of 0.94 kW/kg. Due to the development in manufacturing technologies, according to several engine experts that were questioned, this number has increased to 1.5 kW/kg.
The durability determination faces similar issues since there is very little data available. A test was conducted in 2010 with vehicles tested both on the road and engines tested on a dynamometer for 1000 h by the U.S. department of transportation [
46]. No significant amount of wear was found, except for the cylinder head valves. An analysis of the material showed hydrogen embrittlement, which is an issue that can be addressed by selecting the right materials. The company specializing in hydrogen engines, states a durability of more than 700,000 km [
41]. Depending on the driving profile, this would equal between 10,000 (v = 70 km/h) and 20,000 (35 km/h) operating hours in conventional vehicles. For the comparison in the following sections, the former will be assumed.
3.2. Hydrogen Fuel Cell
A hydrogen fuel cell converts the chemical energy stored in pure hydrogen into electrical energy by fusing the hydrogen with oxygen thereby forming water. There are different concepts, but the one used in mobility applications is the proton exchange membrane (PEM) fuel cell. Two electrodes, coated with noble metals like platin that act as catalysts, are separated by a membrane that is only permeable for hydrogen ions. At the anode, the hydrogen gives up one of its electrons in order to be able to pass through the membrane where it reunites with its electron and fuses with oxygen to form water. Their main advantage compared to other concepts are their high-power density as well as low reaction times when responding to load changes [
47].
Just like the hydrogen combustion process, thermodynamic principals limit the maximum efficiency. There has been a lot of discussion and different opinions in the scientific community. One recent approach by Haseli seems to be the most probable, which resulted in a theoretical maximum efficiency of 82.7% at 300 K, which decreases as the temperature increases. Between 1170 and 1300 K, the maximum efficiency is lowest, with a value of 75.7% [
48]. In practice, fuel cells achieve efficiencies between 50 and 70% [
47]. An analysis of the fuel cell used in the 2017 Toyota Mirai by the U.S. department of energy has shown a peak efficiency of 66% in the low power regions and 50% at a power output of 100 kW. The loss in efficiency comes from the compressor, which is required to provide enough air at high power outputs. It also revealed a 50% increase in fuel consumption in cold start situations (−7 °C), which was attributed to the heating of the fuel cell system. The power densities are 3.1 kW/L and 2.0 kW/kg [
49]. The degradation of the PEM fuel cell has been thoroughly investigated and the main mechanism was found to be a high voltage at the cathode during start up and shutdown, which leads to corrosion of the support material of the catalytic layer. This process is responsible for fuel cells in electric vehicles to only reach 3000 h, which is one tenth of the lifetime that can be achieved if run continuously. Counter measures have been proposed, but they need to be tested under practical conditions. An in-depth review of the degradation process can be found in [
50]. A simulation of the fuel economy found that the degradation causes an average increase of up to 23% in fuel consumption depending on the driving profile [
51]. A study has estimated that, in mass production, the price per kilowatt drops down to USD 50 (EUR 43) for an 80-kW fuel cell if 100,000 units per year are produced. Costs could also be reduced if the noble metals can be replaced with cheaper alternatives [
52].
3.3. Electric Motor
To convert the electric energy produced by the fuel cell into mechanical energy, an electric motor is required. Its efficiency is an important factor in determining the total efficiency of both the battery and fuel cell powered electric vehicles. Electric vehicles on the market today use either induction or permanent magnet motors. The former is very cheap to produce but has a low efficiency at low speeds and a low torque/power density. However, high efficiencies of over 93% have been reported in the constant power region [
53]. The latter has a high efficiency of 90 to 97% at low to medium speeds but is more costly, due to the expensive magnet materials [
54]. Due to the higher efficiency at a wider speed range, permanent magnet motors gain more popularity [
55]. Tesla, for instance, started using permanent magnet motors instead of induction ones in 2017 and even upgraded older models in 2019 [
56,
57]. Both concepts require alternating current, which is why an inverter is required if the power supply outputs direct current [
58]. Their efficiency is slightly load dependent but, for most parts, is greater than 97% [
59]. Modern synchronous motors, in the power-range of 100–200 kW, are reported to have a power-to-weight ratio of 5 kW/kg [
60]. It is likely that this value decreases for smaller motors, since not all components scale linearly with power (e.g., the housing).
4. Energy Recuperation
In conventional cars, the kinetic energy is fully converted into heat by friction brakes during braking. In order to achieve a high efficiency, that energy must be converted in a way that makes it reusable—a process referred to as recuperation. This section analyses the requirements of such a system, which is necessary to determine the total efficiency of each drive train system and to allow a fair comparison.
4.1. Energy Analysis
In order to evaluate different systems regarding their recuperation capabilities, the amount of energy that can be recuperated must be known. The available energy depends on the vehicle specifications as well as the breaking speeds and deceleration.
4.1.1. Worldwide Harmonized Light-Duty Vehicles Test Procedure
As a basis of calculation, a standardized driving profile will be used. Currently, these profiles serve as a basis for exhaust emission standards. Until 2017, the new European driving cycle (NEDC) was used, before being replaced by the Worldwide Harmonized Light-Duty Vehicles Test Procedure (WLTP) [
61,
62,
63]. The average speed increased from 33.6 km/h to 46.6 km/h and the test duration increased from 20 to 30 min (comp.
Figure 1). As a result, air and tire resistance have a greater influence compared to the NEDC, since these factors have a greater influence at higher speed. In the context of this work, the internationally recognized driving cycle provides a neutral basis for the calculation of the energy losses during driving and the amount of energy that can be recovered during breaking.
4.1.2. Friction Losses
Based on the WLP driving profile, the available kinetic energy before the breaking procedure can be calculated with
In ordinary cars, the deceleration is achieved, by converting the kinetic energy into heat via a friction break. Of course, if the energy shall be recuperated, instead of turning it into heat, a generator must convert it into electricity. However, there are other factors, namely the tire and air friction, that slow the car down. Since they cannot be turned off or neglected, they must be considered when calculating the available energy. For the following calculations it will be assumed that there is no braking effect caused by the power train and no rocking during braking.
Due to the fact that the available data for the driving profile is given in increments of one second, the equations are formulated accordingly. Deceleration is assumed to be linear within any timestep. Tire friction losses are calculated as
where
s is the distance covered during breaking and
cF is the rolling resistance coefficient. Subscript 1 will refer to the state of the system before breaking and subscript 2 after breaking. The losses caused by air resistance can be approximated as
were
cW is the drag coefficient and “
A” is the cars projected front surface. To summarize, the maximum amount of energy that can be recuperated is:
4.1.3. Total Energy Recovery
A car with a mass of 1.8 tons, a rolling resistance coefficient of 0.013, a drag coefficient of 0.32 and a projected front surface of 2.4 m
2 results in a maximum recoverable energy of 3185 kJ (1.13 kWh), calculated using Equations (1) to (4).
Figure 2 shows the distribution of the energy losses. The high ratio of losses is due to the slow deceleration of the WLPT drive profile, which does not exceed 1.5 m/s
2. Measurements in real-life situations have shown that the deceleration at signalized intersections are speed dependent and vary between 2.2 m/s
2 and 3.9 m/s
2, depending on when the driver notices the yellow light [
65]. Therefore, the WLPT profile seems to be a good basis for anticipatory driving.
4.2. Recovery Efficiencies
Determining the efficiency of the recovery is a difficult task and far beyond the scope of this paper. The first factor is the maximum power rating of the electric generator(s). If it cannot handle the maximum breaking power, which is calculated as
where
a is the declaration and
v the momentary speed, the friction brakes must assist during the braking procedure, which reduces the efficiency. For a car with 1.8 tons and a deceleration of 1.5 m/s
2 at 100 km/h the required maximum braking power is 75 kW. Therefore, to fully utilize the available recoverable energy for the WLTP driving cycle, a 75-kW generator is required.
However, there are certain requirements that create further restrictions. During breaking, the steering should remain neutral and tire abrasion should be equal on all four wheels. Furthermore, the dynamic axle load shift results in a deceleration dependent break force distribution between the front and rear axles, which is often referred to as the ideal break curve in the literature. A computer simulation has shown that a 1.6 t car equipped with electric motors, which can act as generators, at both axels can recover 80% (20% air and tire losses) of the kinetic energy when braking from 100 km/h at −3.5 m/s
2. If only the front axle is equipped with an electric motor, that efficiency drops down to 43%. The efficiency is reduced to 33% if only the rear axle is equipped with an electric motor [
66]. Therefore, the car’s configuration is an important factor for the total amount of energy that reaches the generator. Since it is unlikely that a car fitted with a combustion engine can also fit four 30-kW electric motors, the only option that would allow full recovery of the kinetic energy is an electric motor mounted to the crank shaft. Of course, it must be equipped with a four-wheel drive system, otherwise the full energy cannot be harvested.
4.3. Hydrogen vs. Battery Storage
The electric energy provided by the generator can be handled in two ways. Either it is used to produce hydrogen, or it is stored in batteries/super capacitors.
Figure 3 shows the two possible options in the form of a simplified block diagram. The hydrogen manufacturing process is discussed in detail in the section “Hydrogen production”. However, in short, water is split into hydrogen and oxygen by applying a voltage in a device called an electrolyser, which in small scale applications has an efficiency of 60%. A fuel cell that has basically the same components as an electrolyser in the power range of 100 kW as used in current hydrogen vehicles takes up all the space in the engine compartment. Furthermore, the start-up takes at least a second [
67]. Therefore, fitting an electrolyser that can handle the peak braking power is not an option. Instead, the energy must be stored temporarily in either a battery or a super capacitor and then be converted into hydrogen over a longer period. This means that the same losses would occur as if the energy were just stored in a battery and then used to power the electric motor. Once the efficiency of the electrolyser is considered, it becomes clear that the most efficient way is to store the electric energy and feed it back to the electric motor/generator. With supercapacitors being a subject of many research projects, they may be a viable option instead of the commonly used lithium ion batteries. Novel supercapacitors have reported energy densities of 0.21 kWh/kg or 0.06 kWh/dm
3, which means that storing the total energy of one drive cycle would take a 14-litre capacitor weighing 4.1 kilos [
68]. The actual size could be much smaller since, usually, breaking is followed by acceleration. Additionally, supercapacitors can handle much more power than batteries, which might lead to even higher recuperation efficiencies. Tesla’s battery-based recuperation system, for instance, can only handle 50 kW, even though the built-in electric motors have a much higher power rating.
5. Powertrain Comparison
In the present section, the previously discussed research will be summarised, and three drive systems will be compared: The battery powered electric vehicle, the hydrogen vehicle with a combustion engine as well as the hydrogen vehicle with a fuel cell.
Table 2 shows a summary of the previous sections. For the hydrogen technology costs, a yearly production rate of 100 k units per year is assumed. The costs and weight are calculated for a 130-kW drive train, with 75 kWh of energy stored and a 75-kW recuperation capability. Some numbers are derived by making some assumptions. It is important to note that the efficiencies of almost all the components are dependent of the rotational speed of the individual component and/or the load. Therefore, mean values are stated in the table. In order to compare the efficiency, the exact efficiencies at any operational point must be known and then the system must be simulated/tested based on a driving profile. A study by the U.S. department of energy found that the total efficiency of the Toyota Mirai was 61.8% when using a mild city driving cycle but dropped down to 48.1% for aggressive high-speed driving [
49]. The efficiencies in the summary are mean values. Losses that are drive train independent (e.g., wheel bearing losses) are not considered. The round-trip efficiency, which describes how much of the stored energy in batteries can be retrieved, is currently 85%. Since this includes conversion losses, it will be assumed that discharging the battery causes a 5% conversion loss [
69]. While the lifetime of both the fuel cell and the combustion engine are measured in hours, batteries are usually measured in charge/discharge cycles. The lifetime is often defined as 80% of the battery’s original capacity [
70]. What creates further problems in comparing the systems is the fact that the lifetime depends on the depth of discharge and a decrease in capacity is also a function of time. The former creates another problem for electric vehicles; since a complete discharge will decrease the batteries’ life, not all the stored energy can be used. An analysis of Tesla’s lithium-ion cells has shown that after 500 cycles at 40 °C, roughly 12% of the capacity faded, which increases even more at 60 °C to 22% [
71]. With a total of 1000 cycles and a range of 550 km per cycle, at an average speed of 70 km/h (same speed used for the combustion engine), this would result in roughly 7900 operating hours or 550,000 kilometres. The total weight of each system is calculated as
The cost of the supercapacitor was estimated to be EUR 300 based on the prices of currently sold units. The reason why the costs of the battery powered electric vehicle seem to match the current market situation, while the ones of the fuel cell cars do not, is the fact that battery powered electric vehicles are sold with much higher margins.
When comparing the three systems, it becomes obvious that each solution has its advantages and disadvantages. The battery powered vehicle has the highest efficiency but is also the heaviest and most expensive. Additionally, the vehicle does not lose any weight while driving, since a full battery weighs the same as an empty one.
When comparing the two hydrogen concepts, the efficiency of the fuel cell vehicle is higher (although no losses due to aging processes were considered), but the durability is a lot worse and it is more expensive. The biggest advantage of the hydrogen combustion engine is the continued use of currently used manufacturing facilities. This would allow for a large-scale manufacturing without having to build new facilities. Not only would this save carbon emissions, but it would also allow for a faster transitioning. Furthermore, recycling concepts for current automobiles can be easily transferred, since only the composite fuel tanks would be different. Since the main components of the engine, like the motor block, cylinder head and pistons are made from metal, they can be melted down and reused.
While, on a small scale, the battery powered car can use the existing grid infrastructure, on a larger scale the grid is not designed to handle the additional load. Another very important advantage of hydrogen is its possibility to transport energy over long distances via pipelines, maybe even by retrofitting existing natural gas pipelines [
75,
76]. Ideas have been proposed, to produce hydrogen in north African states and mix it with natural gas, which would require no modification of the pipeline if the amount of hydrogen does not exceed 10% of the weight of the natural gas [
77]. Since the sun is a lot more intense with much less fluctuations over the year in northern Africa, more solar power could be harnessed.
One of the main reasons for switching from fossil fuel cars to alternatives are the carbon dioxide emissions. Of course, not only the CO
2 emitted while driving matters, but also that in the manufacturing process of both the fuel and the car itself. A study from Volkswagen analysed the CO
2 emissions over the lifetime of both battery and diesel-powered car. The result was that only after driving 100,000 km does the battery powered car emit less CO
2 [
78]. Similar results were obtained by Kawamoto et al. [
79]. If these findings are applied to a comparison of the battery powered versus a hydrogen combustion powered car, the hydrogen most likely will produce less CO
2 over its lifetime if renewable energies are used.
6. Small-Scale Local Hydrogen Production
One of the appeals of a battery powered electric car is the possibility to charge it overnight without having to drive to a fuel station. To achieve the same level of comfort in the context of hydrogen vehicles, one possible option is to produce the hydrogen in the owner’s home. The working principal of such a small-scale hydrogen production plant is shown in
Figure 4. Electric power produced by roof-mounted solar cells could be used for the manufacturing of hydrogen which is then used to fuel the hydrogen vehicle. The economic and technical aspects of this approach are investigated in this section. In less densely populated areas with strong winds, small scale wind turbines could be an alternative to the photovoltaic system. Due to the fact that this approach faces many legal restrictions and often lacks societal acceptance it will not be further pursued in this paper.
6.1. Solar Cells
After the discovery of the photovoltaic effect by Alexandre Becquerel in 1839, research regarding solar cells has been greatly intensified in the last four decades. The development can be divided into three generations. First generation cells are silicon based and currently the most used technology with a market share of over 90% due to their high efficiency of up to 17% in real world applications [
80,
81]. Because the manufacturing process of these cells is expensive, alternatives have been and still are sought. Thin film solar cells are referred to as the second generation and currently make up the remaining 10% of the market share. They are made from alloys like copper, indium, gallium and selenium (CIGS), which form a semiconductor. Since silicon has a relatively poor light absorption, silicon-based solar cells require a high material thickness. Thin film solar cells, on the other hand, have a high absorption coefficient and, therefore, only require a thin layer. While they are cheaper to manufacture, their efficiency only reaches a maximum of 12% [
81,
82]. The third group contains many different concepts such as organic, polymer and nanomaterials. However, none currently exceed the efficiency of silicone cells except a concept called the “perovskite solar cell”. The name comes from the crystal structure that the materials form. While this concept works very well on a small scale and efficiencies of up to 25% were achieved in 2019, it still has not reached the maturity of mass production yet [
83].
For the purpose of hydrogen production, it is important to determine how much the electric power costs. This is done by dividing the acquisition costs by the energy produced over the cell’s life span. Silicone cells degrade between 0.1 and 0.3% p.a., which means that, after 20 years, the power output is 96% of what it was when the module was new. For liability reasons, many manufactures assume a higher degeneration rate and only give a 25-year warranty, which is the value that will be used in further calculations. The geographical location, time of day, time of year, size and orientation of the solar cells are all factors that determine how much energy can be produced by the solar cells. For consumers to be able to compare solar cells, the unit kilowatt peak was introduced. It describes the output power of solar cells under laboratory conditions and is often used as a reference. In Germany, for example, a solar cell with one kilowatt peak output power produces an average of 950 kilowatt hours of energy annually during its lifespan [
84]. The costs for rooftop systems in Germany are currently at EUR 1300 per kilowatt peak, 39% of which is for the solar cells and 61% for the balance of system (BOS), which includes all the components that are required for running the solar panels including the inverter for hooking the system up to the power grid [
85]. The annual running costs, including maintenance and insurance, roughly make up 1.5% of the initial investment [
84]. With these numbers, the following equation
results in a price per kWh of EUR 0.075. Of course, this price will drop, if the lifespan exceeds the 25 years guaranteed by the manufacturer. Depending on the country, taxes might apply even if the power is not sold but used for the own consumption. In Germany, for instance, this is the case [
86]. However, since the actual calculation is rather complicated, a 19% tax will be assumed, which results in a price of EUR 0.0896 per kilowatt hour. With 10 kWp output power, a realizable size for houses in villages in Germany, 9500 kWh of energy can be produced [
87]. With a heating value of 33.33 kWh/kg and an assumed conversion efficiency of 60% (for a preliminary assessment), this would allow for the manufacturing of 170 kg of hydrogen per year. For fuel cell vehicles with a consumption of roughly one kilogram of hydrogen per 100 km, it would be enough hydrogen for 17,000 km. Therefore, this approach is worth pursuing.
One of the main issues is the sun distribution over the year.
Figure 5 shows the yearly distribution of daily sunlight for each month and the distribution over the day is similar. Of course, if the hydrogen production unit were designed to work at full load if the solar panels produce their peak output power, it would only be working to capacity during noon in July. A small electric buffer battery might address this issue and allow for the use of a smaller and cheaper hydrogen production unit that can operate under more stable conditions since the battery would also smooth out smaller variations; for instance, if the sun gets temporarily blocked by clouds.
6.2. Hydrogen Production
While current research focuses on converting sun light into hydrogen directly and efficiencies of up to 19.3% have been achieved under laboratory conditions, the technology is not yet market ready [
88]. Therefore, the only way to convert the sun’s energy into hydrogen in a domestic environment is the use of electrolysis. There are different types of electrolysis, but the underlying principle is the same. Water is split into hydrogen and oxygen by applying a direct current. For this process to work, charge transport between the anode and cathode must be possible. This is either achieved with an alkaline or acidic electrolyte. To keep the hydrogen and oxygen separated, either polymer electrolyte membranes or diaphragms can be used. It can be differentiated between high temperature and low temperature electrolysis. The former operates at temperatures between 500 and 1000 °C and is, therefore, not suitable for the domestic production of hydrogen [
89].
Alkaline electrolysis uses a liquid alkaline solution to increase the conductivity of water. The electrodes are separated by a diaphragm that only lets OH- ions pass. This enables the use of cheap metals like nickel or steel for the electrodes. To maintain a constant level of alkaline within the device, the fluid must be circulated, otherwise the concentration at the electrodes would change too much, which would decrease the efficiency. The capital cost is low, but the system cannot be operated with fast changes in the supplied power. Compared to other processes a big installation space is required and small devices require roughly 62 kWh of energy for manufacturing one kilogram of hydrogen, while larger devices can achieve higher efficiencies [
67].
The polymer electrolyte membrane electrolysis uses a solid electrolyte instead of a liquid one. At the anode water is split in oxygen and H
+ Ions. The electrodes are separated by a membrane that lets only H
+ Ions pass, so they find their way to the cathode and become hydrogen by absorbing an electron. Noble metals are required as catalyst. Another downside is the fact that water must be free of ions and impurities. Typical operating pressures at the hydrogen outlet vary between 16 and 30 bars. Compared to the alkaline electrolysis, high energy densities can be achieved leading to a more compact design, which can be a relevant factor in domestic applications. Additionally, the response and start-up time are faster. Current systems require a total of 56 kWh for the manufacturing of one kilogram of hydrogen and the lifetime currently lies at 50,000 h. Wear is caused by metal ions that are dissolved in the water and deposit at the electrodes as well as the current electric current. The costs for a 200 kW PEM electrolyser including all associated costs depends on the number of units produced per year. At an annual production rate of 20 units, the costs per kW would be USD 500. At 1000 units/year, the cost per kW would drop down to USD 100 [
67,
90]. With a calorific value of 33 kWh/kg, the above stated 56 kWh/kg, which includes losses in the power electronics, equals a total efficiency of 59%. Even though PEM electrolysers have been developed that can achieve efficiencies of 80–90% they are not commercially ready, and their durability has not been proven yet [
11]. Therefore, for small scale applications, 59% efficiency (including power losses) is assumed to be a reasonable value. Current research focuses on replacing the noble metals with earth abundant materials and increase the efficiency of the electrolyser.
Based on these considerations, the PEM electrolysis seems to be the favourable technology for the small-scale domestic production of hydrogen. Research and studies regarding the operating costs has mainly focused on large scale applications with production rates of multiple tons of hydrogen per day. Since there are almost no publicly available information, the purpose of this short study will be to find out how much an electrolyser is allowed to cost for economical manufacturing. The power costs already include the costs of an inverter, which is not required since both the solar panels and the electrolysis operate with a direct current. As a result, the costs of a power supply, which is necessary to operate an electrolyser, will not be considered separately. Since the PEM electrolysis requires water that is free from ions and impurities, the tab water either needs to be purified or deionized. Another alternative is pure water delivery services. With the general reaction equation written as a mass budget
the masses of the individual reactants can be calculated as
Water has a molar mass of 18 g/mol, hydrogen has 1 g/mol and oxygen has 16 g/mol, which results in:
For manufacturing one kilogram of hydrogen, nine litres of water are required. To avoid any conflicts of interest, no sources will be stated, but publicly available offers have been found which provide 1000 L of purified water for EUR 250 including shipping. It is very likely that these costs go down with more purchasers; but, for the moment, it will be assumed that water costs EUR 2.25 per kilogram of hydrogen.
6.3. Hydrogen Refuelling
Since all current vehicles store hydrogen in pressurized tanks, only refuelling for this option shall be further explored. As already elaborated in the hydrogen storage section, the current operating pressure is 700 bars. To fill up such a tank, there are basically three options: A significantly larger tank with only slightly higher operating pressure, a tank with the same size but a significantly higher operating pressure or connecting the vehicle to a compressor and directly compressing the gas into the car’s tank over a longer period of time. For a 150-L tank, which is a common size for today’s cars, according to the van-der-Waals equation:
that unlike the ideal gas equation considers intermolecular effects, 5.2 kg of hydrogen can be stored. Intermolecular effects, which lead to a higher repulsion at higher pressures, are the reason why doubling the pressure does not equate to doubling of the stored hydrogen mass, whereas under the assumptions of an ideal gas, it would. The molar mass
M, as well as the variable
b and
a are matter constants [
91]. The parameters used for the calculation are listed in
Table 3.
Since nature always strives towards an equilibrium, if two containers with different pressures are connected, the pressure will equalize within the two containers. With the car’s tank almost empty, which is the case requiring the highest fuelling pressure or fuelling volume, the requirements for a fuelling station can be calculated.
Figure 6 shows the operating pressures required for different tank volumes to fill up the car’s 150-L tank up to a pressure of 700 bars under isothermal conditions. The solutions were obtained using the van-der-Waals equation and a solver algorithm. If, for instance, a 600-L tank is used, the operating pressure must be 1100 bar to fill up the tank, which means 26 kg will be stored.
Since the hydrogen is produced and, therefore, can be compressed over a period of multiple hours, the process is assumed to be isothermal. The energy required to compress a gas is calculated as
The compression efficiency ηcomp depends on the compression process. Currently, there are three types of compressors that are commonly used for compressing hydrogen: The diaphragm, ionic and electrochemical compressor. While the former two are currently only available for large scale applications, the later one is available even for small amounts of two kilograms of hydrogen per day.
Both the diaphragm and ionic compressor work in a similar way: Hydrogen is put into an enclosed volume that is being decreased. While the former uses a diaphragm to decrease the volume, the ionic compressor uses an ionic fluid that does not absorb hydrogen. This liquid is pumped into a hydrogen filled cylinder, compressing the hydrogen, which is the reason why it is also referred to as a liquid piston compressor. This technology is currently used by Linde in hydrogen fuelling stations all over the world. Liquid hydrogen is transported on site and then compressed in five stages up to a pressure of 100 MPa (1000 bars). It is being used, because the only moving parts are the pump for the ionic fluid and some valves. Additionally, the ionic fluid transports the heat away making the compression isothermal, which increases the efficiency of the process close to 100% [
92,
93]. The claimed energy consumption for compressing one kilogram of hydrogen from 0.5 MPa to 90 MPa is 2.7 kWh [
94]. This would equal an efficiency of 65%, which is a realistic value. Since Linde is currently the only company manufacturing these compressors, which are currently only designed for fuelling stations with a high throughput and the five-stage compression takes up a lot of space, this technology is currently not an option for domestic applications. It does require an in-depth analysis to see if this technology can even be downscaled.
The electrochemical compressor has a similar working principal to the PEM electrolyser. A membrane separates an anode and a cathode, and hydrogen is deprived of its electron on the one side. To get the electron back, it must travel through the membrane that is only permeable for hydrogen ions, not hydrogen. By accumulation of hydrogen, pressure builds up. The difficulty lies in designing a membrane that can both withstand the high pressures and prohibits back-diffusion of the hydrogen. Back diffusion is especially problematic under high operating pressures and can significantly reduce the efficiency. This makes them theoretically as efficient as mechanical compression at operating pressures of 100 MPa, below which they are significantly more efficient [
95]. In practice, however, the high output pressures still seem to provide significant challenges. Models with an output capacity of 10 kg per day and output pressures of up to 90 MPa (900 bars) are rated at a nominal compression energy consumption of 8.5–13.2 kWh/kg depending on the hydrogen flow rate [
96]. Other than that, the efficiency mainly depends on operating temperature, energy density, thickness of the membrane and cathode pressure [
97]. The main advantages are the lack of moving parts, purification of hydrogen during the compression, high efficiencies in small systems, low maintenance and silent operation [
98]. All these factors, especially the availability of small systems, make this technology the most suited for domestic applications. Since the basic components are very similar to those of the PEM electrolyser, it will be assumed that the costs are the same.
6.4. Facility Costs
While all major components have been analysed regarding their technology and costs, the costs for the “facility” itself are still missing. Since all the components are space consuming, it is most likely that the components will either be installed underground or at least adjacent to the house, so a slab will be required. Additionally, fuel dispensers, valves and transport costs must be added. These costs are very hard to determine in the context of an independent research project. Assumptions for the individual parts are listed in
Table 4. With 1600 h of sunlight annually in Germany, the electrolyser will fail after roughly 30 years (after 50,000 h of operating time), having produced roughly 5100 kg of hydrogen (if the efficiency is 60%, which equals 170 kg of hydrogen per year). This would result in facility costs of EUR 4.51 per kg. If these systems are produced on a larger scale in ready to install enclosures, these costs are likely to go down significantly.
6.5. Cost Analysis
A summary of all the costs and energy requirements are listed in
Table 5 and
Table 6. Two cases are calculated, one with solar power used for compression and one with grid power. For the former, the total costs sum up to EUR 12.96 and EUR 15.93 for the latter.
Figure 7 shows the composition of these total costs. This does not yet include the costs of the compressor and the electrolyser. It was originally assumed that the costs would be lower than that of currently sold hydrogen, which costs EUR 9.5 in Germany (including tax) at the fuel station. However, since it is already more expensive, such a calculation does not make sense.
6.6. Comparison to Battery Storage
An alternative to converting the electric power to hydrogen, is directly storing it in batteries. The average costs for the lithium-ion battery storage that lasts 15 years with one charge/discharge cycle a day are 400 €/kWh for the battery including all components. During June, almost twice the yearly average is produced due to the intense sunlight, resulting in a daily revenue of 50 kWh. This equals the storage capacity of current battery powered electric cars and would result in a total cost of EUR 20,000 if the battery is dimensioned accordingly [
69]. Adding an estimated EUR 3000 for the charging station, the total costs for the solar battery storage sum up to EUR 23,000. Compared to the current prices of electric cars, this seems like a realistic number. It is divided by the total amount of energy the batteries store during their lifetime, resulting in a cost of 0.2447 € per kWh. Adding the current costs of solar power energy, this results in 0.3019 €/kWh. This is slightly cheaper than the current price for one kWh of grid power which is EUR 0.3147 in Germany. If the lifetime of these batteries is increased, the gap will further increase.
The round-trip efficiency of such a battery system, which describes how much of the stored energy can be retrieved, is currently 85% [
69]. Additionally, the efficiency of the charging station must be considered. Currently the technology best suited for high power charging is the so-called Vienna rectifier. Its efficiency varies between 95.5 and 98.5% depending on the input voltage. Comparable technologies have similar efficiencies, but with several drawbacks [
99]. Since these chargers are designed to run with alternating current, they do not meet the specific needs of this application, where a DC–DC conversion is required. These are rated with efficiencies varying between 82 and 96% depending on the technology that is used [
100,
101]. Therefore, the two main energy losses occur when the power is cached (15% loss) and transferred to the car (10% loss) resulting in a total efficiency of 76.5%. Therefore, at the moment, storing the energy in batteries is more efficient, but hydrogen storage might catch up soon.
6.7. Conclusion for the Small-Scale Local Hydrogen Production
Economic effects, such as how much interest the initial investment would produce over the lifespan or the feed-in compensation of the solar power, were not considered for the present investigation. Without the costs of the electrolysis and compression unit, the price per kilogram is still higher than that at the filling station. The energy costs for electrolysis and compression make up EUR 6.20 alone when the already cheap solar power is used. This would leave only EUR 3.30 for all the material, maintenance and water costs in order to be cheaper than the publicly sold hydrogen. The two power consuming factors are the conversion of electricity into hydrogen (59% efficiency—including losses in power electronics) and the compression. The energy in the latter is completely wasted since the compression is only used to increase the energy density. In other words, fuel cells can produce the same amount of power from 1 kg of hydrogen whether it is stored at 900 bars or 90 bars. Therefore, for producing one kilogram of hydrogen and compressing it to 900 bars, a total of 69.2 kWh per kilogram is currently required for a small-scale production. The stored hydrogen has a usable energy of 33 kWh/kg, which results in a total conversion efficiency of 47.7%.
The reason why commercially available hydrogen is so cheap is that it is manufactured in large parts by steam reforming methane that was extracted from fossil fuels, which only costs EUR 1.93 (USD 2.27) per kilogram [
10,
11]. Once the costs for compression, storage and transportation are added, the total price increases to the 9.5€/kg that is being charged at the fuelling stations today. Therefore, currently, the small-scale domestic manufacturing of hydrogen for fuel is not an economically viable process.
6.8. Future Outlook for the Small-Scale Local Hydrogen Production
Certain research breakthroughs might change the economic viability. Solar panels have the potential to provide even cheaper energy if their efficiency is further increased and if silicone is replaced by cheaper, more durable materials. Of course, the same applies to the electrolyser. If cheap replacement materials for the noble metals can be found, the 500 $/kW that currently applies to large scale electrolysers produced in small volumes may become a realistic number for small scale ones. Additionally, if the electrolysers are designed to not only produce but also compress the hydrogen to the required levels (90–100 MPa), a separate compression stage would not be necessary. This would further decrease the costs. Alternatively, breakthroughs in the direct manufacturing of hydrogen via sun light may make the electrolyser redundant.
7. Conclusions
In the present study, the technologies involved in automotive hydrogen powertrains were investigated and compared to the battery powered electric car. One of the most important aspects of alternative fuels is their energy density, which does not only depend on the fuel itself but also the storage system. The higher it is, the greater is the cars’ range. Currently, all hydrogen vehicles on the market use compressed hydrogen. This is mainly because the drawbacks of the alternatives are too significant. Liquid hydrogen must be stored at very low temperatures and degasses due to heat input from the environment. Metal hydrides have very high energy densities when operating at higher temperatures. However, the release of hydrogen is an endothermic reaction, which requires a lot of heat energy. A potential successor to the pressurized hydrogen storage is carbon nanomaterials. They have over twice the energy density, but more fundamental research is required to sustain that energy density over at least hundreds of charging cycles.
To convert the chemical energy of the hydrogen into mechanical energy, either a hydrogen fuel cell in combination with an electric motor or a hydrogen combustion engine can be used. While the former powertrain has a higher efficiency (54 vs. 41%) and is lighter (152 vs. 193 kg) the hydrogen combustion engine can be manufactured using equipment from fossil fuel engines because the main components are very similar. Furthermore, the hydrogen combustion engine has a longer expected lifetime than the fuel cell, which leads to significantly lower operating costs (0.58 vs. 2.62 €/h). Although these numbers are just estimated by engine manufactures, independent tests of hydrogen combustion engines have revealed only very little wear. As a result of the expensive batteries currently in use, both hydrogen concepts are cheaper and lighter than the electric car (3.91 €/h and 326 kg), which in return has the highest efficiency (86%). Another big disadvantage of the batteries is the recycling aspect, which still faces major challenges.
The conclusion of the investigation of these powertrain technologies is that there is no clear solution for the future. However, based on the information that is available today, it is worth investing more research effort into hydrogen technologies. Especially, the hydrogen combustion engine could enable a transition from fossil fuel cars to renewable energy powered engines. The much higher energy density of compressed hydrogen compared with lithium-ion batteries also shows why companies like “Nikola” use hydrogen for their freight traffic trucks instead of batteries, because batteries would add too much weight, which would reduce the allowed payload. A detailed simulation of each individual drive train taking the variable efficiencies and weights into account to determine the overall efficiency would be a great benefit to the research community.
Another important aspect of alternative fuels are the refuelling options. While electric cars can be charged overnight at the owner’s home, this option does currently not exist for hydrogen vehicles. A possibility that was investigated is the use of solar power for the small-scale local production of hydrogen. While there are no major technical challenges and solar panels do provide cheap power, the electrolysis and compression of the hydrogen on a small scale are not efficient enough to be able to compete with hydrogen that is produced on a larger scale by steam reforming methane. Once the efficiency of the small-scale hydrogen manufacturing and compression process is increased, it may become an economical viable option.
Author Contributions
Conceptualization, M.H., J.W. and H.M.; methodology, M.H.; software, M.H.; validation, M.H., J.W. and H.M.; formal analysis, M.H.; investigation, M.H.; resources, M.H.; data curation, M.H.; writing—original draft preparation, M.H.; writing—review and editing, M.H., J.W. and H.M.; visualization, M.H.; supervision, J.W. and H.M.; project administration, M.H. and J.W.; funding acquisition, J.W. All authors have read and agreed to the published version of the manuscript.
Funding
This research was funded by the ELSTATIK-Stiftung, Günter und Sylvia Lüttgens.
Institutional Review Board Statement
Not applicable.
Informed Consent Statement
Not applicable.
Data Availability Statement
No new data were created or analyzed in this study. Data sharing is not applicable to this article.
Conflicts of Interest
The authors declare no conflict of interest. The funders had no role in the design of the study; in the collection, analyses, or interpretation of data; in the writing of the manuscript, or in the decision to publish the results.
References
- ZEV Alliance, Accelerating the Adoption of Zero-Emission Vehicles. Available online: http://www.zevalliance.org/ (accessed on 30 April 2020).
- Burch, I.; Gilchrist, J. Survey of Global Activity to Phase Out Internal Combustion Engine Vehicles. Available online: https://theclimatecenter.org/wp-content/uploads/2020/03/Survey-on-Global-Activities-to-Phase-Out-ICE-Vehicles-update-3.18.20-1.pdf (accessed on 30 April 2020).
- Gaughran, A. Inside the DRC’s Artisanal Mining Industry. Available online: https://www.amnestyusa.org/inside-the-drcs-artisinal-mining-industry/ (accessed on 30 April 2020).
- Li, M.; Lu, J. Cobalt in lithium-ion batteries. Science 2020, 367, 979–980. [Google Scholar] [CrossRef] [PubMed]
- United States Geological Survey, Lithium. Available online: https://pubs.usgs.gov/periodicals/mcs2020/mcs2020-lithium.pdf (accessed on 7 May 2020).
- Lombrana, L.M. Saving the Planet with Electric Cars Means Strangling This Desert. Available online: https://www.bloomberg.com/news/features/2019-06-11/saving-the-planet-with-electric-cars-means-strangling-this-desert (accessed on 7 May 2020).
- Harper, G.; Sommerville, R.; Kendrick, E.; Driscoll, L.; Slater, P.; Stolkin, R.; Walton, A.; Christensen, P.; Heidrich, O.; Lambert, S.; et al. Recycling lithium-ion batteries from electric vehicles. Nat. Cell Biol. 2019, 575, 75–86. [Google Scholar] [CrossRef] [PubMed] [Green Version]
- Yong, J.Y.; Ramachandaramurthy, V.K.; Tan, K.M.; Mithulananthan, N. A review on the state-of-the-art technologies of electric vehicle, its impacts and prospects. Renew. Sustain. Energy Rev. 2015, 49, 365–385. [Google Scholar] [CrossRef]
- May, A. Ist Strom Das Neue Super? Available online: https://www.autobild.de/artikel/vw-e-golf-gegen-golf-1.5-tsi-dsg-test-11760391.html (accessed on 30 July 2020).
- Borgschulte, A. The Hydrogen Grand Challenge. Front. Energy Res. 2016, 4. [Google Scholar] [CrossRef] [Green Version]
- Kumar, S.S.; Himabindu, V. Hydrogen production by PEM water electrolysis—A review. Mater. Sci. Energy Technol. 2019, 2, 442–454. [Google Scholar] [CrossRef]
- Glenk, G.; Reichelstein, S. Economics of converting renewable power to hydrogen. Nat. Energy 2019, 4, 216–222. [Google Scholar] [CrossRef]
- Strauss, M. EU to Boost Green Hydrogen Use for Decarbonisation, Focus on Energy efficiency, Reuters. Available online: https://www.reuters.com/article/us-climate-change-eu-hydrogen/eu-to-boost-green-hydrogen-use-for-decarbonisation-focus-on-energy-efficiency-idUSKBN2491JA (accessed on 1 September 2020).
- Klell, M.; Eichlseder, H.; Trattner, A. Speicherung und Transport. In Wasserstoff in der Fahrzeugtechnik; Springer Nature: Berlin/Heidelberg, Germany, 2018; pp. 109–139. [Google Scholar]
- Houchins, C.; James, B.D. 2019 DOE Hydrogen and Fuel Cells Program Review. Available online: https://www.hydrogen.energy.gov/pdfs/review19/st100_james_2019_o.pdf (accessed on 1 September 2020).
- Tarasov, B.P.; Arbuzov, A.A.; Mozhzhuhin, S.A.; Volodin, A.A.; Fursikov, P.V.; Lototskyy, M.V.; Yartys, V.A. Hydrogen storage behavior of magnesium catalyzed by nickel-graphene nanocomposites. Int. J. Hydrog. Energy 2019, 44, 29212–29223. [Google Scholar] [CrossRef]
- Schneemann, A.; White, J.L.; Kang, S.; Jeong, S.; Wan, L.; Cho, E.S.; Heo, T.W.; Prendergast, D.; Mattox, T.M.; Wood, B.C.; et al. Nanostructured Metal Hydrides for Hydrogen Storage. Chem. Rev. 2018, 118, 10775–10839. [Google Scholar] [CrossRef]
- Abe, J.; Popoola, A.P.I.; Ajenifuja, E.; Popoola, O. Hydrogen energy, economy and storage: Review. Hydrog. Energy 2019, 44, 15072–15086. [Google Scholar] [CrossRef]
- Eftekhari, A.; Fang, B. Electrochemical hydrogen storage: Opportunities for fuel storage, batteries, fuel cells, and supercapacitors. Int. J. Hydrog. Energy 2017, 42, 25143–25165. [Google Scholar] [CrossRef]
- Thongtan, P.; Dansirima, P.; Thiangviriya, S.; Thaweelap, N.; Suthummapiwat, A.; Plerdsranoy, P.; Utke, R. Reversible hydrogen sorption and kinetics of hydrogen storage tank based on MgH2 modified by TiF4 and activated carbon. Int. J. Hydrog. Energy 2018, 43, 12260–12270. [Google Scholar] [CrossRef]
- Boateng, E.; Dondapati, J.S.; Thiruppathi, A.R.; Chen, A. Significant enhancement of the electrochemical hydrogen uptake of reduced graphene oxide via boron-doping and decoration with Pd nanoparticles. Int. J. Hydrog. Energy 2020, 45, 28951–28963. [Google Scholar] [CrossRef]
- Ranjeh, M.; Ghiyasiyan-Arani, M.; Salavati-Niasari, M.; Moayedi, H. Li4Zn3B4O11/Li2B2O4 Nanocomposites as a Potential Electrode Material for Electrochemical Hydrogen Storage; Insight of Fabrication and Morphology Controlling. J. Mater. Res. Technol. 2020, 9, 2028–2036. [Google Scholar] [CrossRef]
- Lototskyy, M.V.; Goh, J.; Davids, M.W.; Linkov, V.; Khotseng, L.; Ntsendwana, B.; Denys, R.; Yartys, V.A. Nanostructured hydrogen storage materials prepared by high-energy reactive ball milling of magnesium and ferrovanadium. Int. J. Hydrog. Energy 2019, 44, 6687–6701. [Google Scholar] [CrossRef]
- Oberoi, A.S.; Nijhawan, P.; Singh, P. A Novel Electrochemical Hydrogen Storage-Based Proton Battery for Renewable Energy Storage. Energies 2018, 12, 82. [Google Scholar] [CrossRef] [Green Version]
- Akbarzadeh, R.; Ghaedi, M.; Kokhdan, S.N.; Vashaee, D. Remarkably improved electrochemical hydrogen storage by multi-walled carbon nanotubes decorated with nanoporous bimetallic Fe–Ag/TiO2 nanoparticles. Dalton Trans. 2019, 48, 898. [Google Scholar] [CrossRef]
- Mohan, M.; Sharma, V.K.; Kumar, E.A.; Gayathri, V. Hydrogen storage in carbon materials—A review. Energy Storage 2019, 1, 2. [Google Scholar] [CrossRef]
- Kaur, M.; Pal, K. Review on hydrogen storage materials and methods from an electrochemical viewpoint. J. Energy Storage 2019, 23, 234–249. [Google Scholar] [CrossRef]
- Rather, S.U. Preparation, characterization and hydrogen storage studies of carbon nanotubes and their composites: A review. Int. J. Hydrog. Energy 2020, 45, 4653–4672. [Google Scholar] [CrossRef]
- Klell, M.; Eichlseder, H.; Trattner, A. Verbrennungsmotoren Combustion Engines. In Wasserstoff in der Fahrzeugtechnik; Hydrogen in Automotive Applications; Springer Fachmedien GmbH: Wiesbaden, Germany, 2018; pp. 199–258. [Google Scholar]
- Prechtl, P.; Dorer, F. Wasserstoff-Dieselmotor mit Direkteinspritzung, hoher Leistungsdichte und geringer Abgasemission Hydrogen Diesel Engine fitted with direct injection. Motorentech. Z. 1999, 60, 830–837. [Google Scholar] [CrossRef]
- Sharma, P.; Dhar, A. Effect of hydrogen supplementation on engine performance and emissions. Int. J. Hydrog. Energy 2018, 43, 7570–7580. [Google Scholar] [CrossRef]
- Nag, S.; Sharma, P.; Gupta, A.; Dhar, A. Experimental study of engine performance and emissions for hydrogen diesel dual fuel engine with exhaust gas recirculation. Int. J. Hydrog. Energy 2019, 44, 12163–12175. [Google Scholar] [CrossRef]
- Eichlseder, H.; Spuller, C.; Heindl, R.; Gerbig, F.; Heller, K. Konzepte für die Dieselähnliche Wasserstoffverbrennung Concepts for hydrogen combustion using the Diesel cycle. MTZ Motorentech. Z. 2010, 71, 60–66. [Google Scholar] [CrossRef]
- Eichlseder, H.; Wallner, T.; Freymann, R.; Ringler, J. The Potential of Hydrogen Internal Combustion Engines in a Future Mobility Scenario; SAE Technical Paper Series; SAE: Warrendale, PA, USA, 2003. [Google Scholar] [CrossRef]
- Klepatz, K.; Rottengruber, H.; Zeilinga, S.; Koch, D.; Prümm, W. Loss Analysis of a Direct-Injection Hydrogen Combustion Engine; SAE Technical Paper Series; SAE: Warrendale, PA, USA, 2018. [Google Scholar] [CrossRef]
- Priybrat, S.; Dhar, A. Advances in Hydrogen-Fuelled Combustion Engines. In Prospects of Alternative Transportation Fuels; Springer Nature: Singapore, 2017; pp. 55–78. [Google Scholar]
- Kumar, V.; Gupta, D.; Kumar, N. Hydrogen Use in Internal Combustion Engine: A Review. Int. J. Adv. Cult. Technol. 2015, 3, 87–99. [Google Scholar] [CrossRef]
- Yip, H.L.; Srna, A.; Yuen, A.; Kook, S.; Taylor, R.A.; Yeoh, G.H.; Medwell, P.R.; Xing, S. A Review of Hydrogen Direct Injection for Internal Combustion Engines: Towards Carbon-Free Combustion. Appl. Sci. 2019, 9, 4842. [Google Scholar] [CrossRef] [Green Version]
- Akal, D.; Öztuna, S.; Büyükakın, M.K. A review of hydrogen usage in internal combustion engines (gasoline-Lpg-diesel) from combustion performance aspect. Int. J. Hydrog. Energy 2020, 45, 35257–35268. [Google Scholar] [CrossRef]
- Pal, A.; Agarwal, A.K. Hydrogen for Internal Combustion Engines. In Prospects of Alternative Transportation Fuels; Springer Nature: Singapore, 2018; pp. 39–54. [Google Scholar]
- Keyou, Technology. Available online: https://www.keyou.de/technology/?lang=en (accessed on 27 August 2020).
- Beziat, C.; Edwards, R.; Larivé, J. Appendix 1. In Well-to-Wheels Analysis of Future Automotive Fuels and Power Trains in the European Context; Joint Research Centre of the European Commission: Ispra, Italy, 2011; pp. 1–16. [Google Scholar]
- Ikegami, N.; Mori, S.; Yano, T.; Miyake, T. Der neue 1,6-l-Dieselmotor von Honda. MTZ Motorentech. Z. 2014, 75, 14–21. [Google Scholar] [CrossRef]
- Döll, G.; Fausten, H.; Noell, R.; Schommers, J.; Spengel, C.; Werner, P. Der neue V6-Dieselmotor von Mercedes-Benz. MTZ Mot. Z. 2005, 66, 624–634. [Google Scholar] [CrossRef]
- Werner, P.; Schommers, J.; Breitbach, H.; Spengel, C. Der neue V6-Dieselmotor von Mercedes-Benz. MTZ Mot. Z. 2011, 72, 366–373. [Google Scholar] [CrossRef]
- Beauregard, G.P. Findings of Hydrogen Internal Combustion Engine Durability. Available online: https://www.osti.gov/servlets/purl/1031548 (accessed on 27 August 2020).
- Sørensen, B.; Spazzafumo, G. Hydrogen and Fuel Cells; Academic Press: London, UK, 2018. [Google Scholar]
- Haseli, Y. Maximum conversion efficiency of hydrogen fuel cells. Int. J. Hydrog. Energy 2018, 43, 9015–9021. [Google Scholar] [CrossRef]
- Stutenberg, K. Toyota Mirai Testing. Available online: https://www.hydrogen.energy.gov/pdfs/progress18/tahi_lohse-busch_2018.pdf (accessed on 8 September 2020).
- Zhang, T.; Wang, P.; Chen, H.; Pei, P. A review of automotive proton exchange membrane fuel cell degradation under start-stop operating condition. Appl. Energy 2018, 223, 249–262. [Google Scholar] [CrossRef]
- Ahmadi, P.; Torabi, S.H.; Afsaneh, H.; Sadegheih, Y.; Ganjehsarabi, H.; Ashjaee, M. The effects of driving patterns and PEM fuel cell degradation on the lifecycle assessment of hydrogen fuel cell vehicles. Int. J. Hydrog. Energy 2020, 45, 3595–3608. [Google Scholar] [CrossRef]
- Thompson, S.T.; James, B.D.; Huya-Kouadio, J.M.; Houchins, C.; DeSantis, D.A.; Ahluwalia, R.; Wilson, A.R.; Kleen, G.; Papageorgopoulos, D. Direct hydrogen fuel cell electric vehicle cost analysis: System and high-volume manufacturing description, validation, and outlook. J. Power Sources 2018, 399, 304–313. [Google Scholar] [CrossRef]
- Liang, D.; Zhou, V. Recent Market and Technical Trends in Copper Rotors for High-Efficiency Induction Motors. In Proceedings of the International Power Electronics Conference (IPEC-Niigata 2018-ECCE Asia), Niigata, Japan, 20–24 May 2018. [Google Scholar]
- Huynh, T.A.; Hsieh, M.-F. Performance Analysis of Permanent Magnet Motors for Electric Vehicles (EV) Traction ConsideringDriving Cycles. Energies 2018, 11, 1385. [Google Scholar] [CrossRef] [Green Version]
- Bilgin, B.; Jiang, J.W.; Emadi, A. Electric Motor Industry and Switched Reluctance Machines, in Switched Reluctance Motor Drives. In Fundamentals to Applications; CRC Press: Boca Raton, FL, USA, 2018; pp. 1–34. [Google Scholar]
- Harrison, J. Tesla Switching to PMAC Synchronous Drive Motor for Model 3. Available online: https://www.maximintegrated.com/en/design/blog/tesla-switching-pmac.html (accessed on 27 August 2020).
- Lambert, F. Tesla is Upgrading Model S/X with New, More Efficient Electric Motors. Available online: https://electrek.co/2019/04/05/tesla-model-s-new-electric-motors/ (accessed on 27 August 2020).
- Alamoudi, Y.A.; Ferrah, A.; Panduranga, R.; Althobaiti, A.; Mulolani, F. State-of-the Art Electrical Machines for Modern Electric Vehicles. In Proceedings of the Advances in Science and Engineering Technology International Conferences (ASET), Dubai, United Arab Emirates, 26–28 March 2019. [Google Scholar]
- Kersten, A.; Kuder, M.; Grunditz, E.; Geng, Z.; Wikner, E.; Thiringer, T.; Weyh, T.; Eckerle, R. Inverter and Battery Drive Cycle Efficiency Comparisons of CHB and MMSP Traction Inverters for Electric Vehicles. In Proceedings of the 21st European Conference on Power Electronics and Applications (EPE’19 ECCE Europe), Genova, Italy, 2–5 September 2019. [Google Scholar]
- Agamloh, E.; Von Jouanne, A.; Yokochi, A. An Overview of Electric Machine Trends in Modern Electric Vehicles. Machines 2020, 8, 20. [Google Scholar] [CrossRef] [Green Version]
- European Parliament. Directive 2007/46/EC of the European Parliament and of the Council of 5 September 2007 Establishing a Framework for the Approval of Motor Vehicles and Their Trailers, and of Systems, Components and Separate Technical Units Intended for Such Vehicles (Framework Directive); Office for Official Publications of the European Communities: Luxembourg, 2007. [Google Scholar]
- European Comission. Commission Regulation (EC) No 692/2008 of 18 July 2008 Implementing and Amending Regulation (EC) No 715/2007 of the European Parliament and of the Council on Type-Approval of Motor Vehicles with Respect to Emissions from Light Passenger and Commercial Vehicles (Euro 5 and Euro 6) and on Access to Vehicle Repair and Maintenance Information; Office for Official Publications of the European Communities: Luxembourg, 2008. [Google Scholar]
- European Comission. Commission Regulation (EU) 2017/1151 of 1 June 2017 Supplementing Regulation (EC) No 715/2007 of the European Parliament and of the Council on Type-Approval of Motor Vehicles with Respect to Emissions from Light Passenger and Commercial Vehicles (Euro 5 and Euro 6) and on Access to Vehicle Repair and Maintenance Information, Amending Directive 2007/46/EC of the European Parliament and of the Council, Commission Regulation (EC) No 692/2008 and Commission Regulation (EU) No 1230/2012 and Repealing Commission Regulation (EC) No 692/2008; Office for Official Publications of the European Communities: Luxembourg, 2008. [Google Scholar]
- United Nations Economic Commission. Available online: http://www.unece.org/fileadmin/DAM/trans/doc/2012/wp29grpe/WLTP-DHC-12-07e.xls (accessed on 16 March 2020).
- Gates, T.J.; Noyce, D.A.; Laracuente, L.; Nordheim, E.V. Analysis of Driver Behavior in Dilemma Zones at Signalized Intersections. Transp. Res. Rec. J. Transp. Res. Board 2007, 2030, 29–39. [Google Scholar] [CrossRef]
- Spichartz, P.; Bokker, T.; Sourkounis, C. Comparison of Electric Vehicles with Single Drive. In Proceedings of the Twelfth International Conference on Ecological Vehicles and Renewable Energies (EVER), Monte Carlo, Monaco, 11–13 April 2017. [Google Scholar]
- Godula-Jopek, A. Hydrogen Production: Electrolysis; Wiley-VCH Verlag GmbH & Co. KGaA: Hoboken, NJ, USA, 2015. [Google Scholar]
- Rani, J.R.; Thangavel, R.; Oh, S.-I.; Lee, Y.S.; Jang, J.-H. An Ultra-High-Energy Density Supercapacitor; Fabrication Based on Thiol-functionalized Graphene Oxide Scrolls. Nanomaterials 2019, 9, 148. [Google Scholar] [CrossRef] [Green Version]
- Cole, W.; Frazier, A.W. Cost Projections for Utility-Scale Battery Storage. Available online: https://www.nrel.gov/docs/fy19osti/73222.pdf (accessed on 19 August 2020).
- Abdelmonem, M.; Hegazy, O.; van Mierlo, J. Lithium-ion Batteries: Comprehensive Technical Analysis of Second-Life Batteries for Smart Grid Applications. In Proceedings of the 19th European Conference on Power Electronics and Applications, Warsaw, Poland, 11–14 September 2017. [Google Scholar]
- Uitz, M.; Sternad, M.; Breuer, S.; Täubert, C.; Trußnig, T.; Hennige, V.; Hanzu, I.; Wilkening, M. Aging of Tesla’s 18650 Lithium-Ion Cells: Correlating Solid-Electrolyte-Interphase Evolution with Fading in Capacity and Power. J. Electrochem. Soc. 2017, 164, 14. [Google Scholar] [CrossRef] [Green Version]
- Irimescu, A.; Mihon, L.; Pãdure, G. Automotive transmission efficiency measurement using a chassis dynamometer. Int. J. Automot. Technol. 2011, 12, 555–559. [Google Scholar] [CrossRef]
- Widmer, J.D.; Martin, R.W.; Kimiabeigi, M. Electric vehicle traction motors without rare earth magnets. Sustain. Mater. Technol. 2015, 3, 7–13. [Google Scholar] [CrossRef] [Green Version]
- Placke, T.; Kloepsch, R.; Dühnen, S.; Winter, M. Lithium ion, lithium metal, and alternative rechargeable battery technologies: The odyssey for high energy density. J. Solid State Electrochem. 2017, 21, 1939–1964. [Google Scholar] [CrossRef]
- Baufumé, S.; Grüger, F.; Grube, T.; Krieg, D.; Linssen, J.; Weber, M.F.; Hake, J.-F.; Stolten, D. GIS-based scenario calculations for a nationwide German hydrogen pipeline infrastructure. Int. J. Hydrog. Energy 2013, 38, 3813–3829. [Google Scholar] [CrossRef]
- Gillette, J.; Kolpa, R. Overview of Interstate Hydrogen Pipeline Systems. Available online: https://publications.anl.gov/anlpubs/2008/02/61012.pdf (accessed on 10 September 2020).
- Timmerberg, S.; Kaltschmitt, M. Hydrogen from renewables: Supply from North Africa to Central Europe as blend in existing pipelines—Potentials and costs. Appl. Energy 2019, 237, 795–809. [Google Scholar] [CrossRef]
- Vetter, P. Erst Nach 100.000 Kilometern Ist der E-Golf Wirklich Grün, Welt. Available online: https://www.welt.de/wirtschaft/article192405223/Klimabilanz-Erst-nach-100-000-Kilometern-ist-der-E-Golf-wirklich-gruen.html (accessed on 10 September 2020).
- Kawamoto, R.; Mochizuki, H.; Moriguchi, Y.; Nakano, T.; Motohashi, M.; Sakai, Y.; Inaba, A. Estimation of CO2 Emissions of Internal Combustion Engine Vehicle and Battery Electric Vehicle Using LCA. Sustainability 2019, 11, 2690. [Google Scholar] [CrossRef] [Green Version]
- Płaczek-Popko, E. Top PV market solar cells 2016. Opto Electron. Rev. 2017, 25, 55–64. [Google Scholar] [CrossRef]
- Sharma, S.; Jain, K.K.; Sharma, A. Solar Cells: In Research and Applications—A Review. Mater. Sci. Appl. 2015, 6, 1145–1155. [Google Scholar] [CrossRef] [Green Version]
- Mansfield, L.; Garris, R.L.; Counts, K.D.; Sites, J.R.; Thompson, C.P.; Shafarman, W.N.; Ramanathan, K. Comparison of CIGS Solar Cells Made With Different Structures and Fabrication Techniques. IEEE J. Photovolt. 2017, 7, 286–293. [Google Scholar] [CrossRef]
- Park, N.-G. Research Direction toward Scalable, Stable, and High Efficiency Perovskite Solar Cells. Adv. Energy Mater. 2019, 10, 1903106. [Google Scholar] [CrossRef]
- Wesselak, V.; Voswinckel, S. Photovoltaik—Wie Sonne zu Strom wird. In Photovoltaik—How Sunlight is Converted into Electric Power; Springer: Berlin/Heidelberg, Germany, 2016. [Google Scholar]
- Frauenhofer Institute for Solar Energy Systems, Photovoltaics Report. Available online: https://www.ise.fraunhofer.de/content/dam/ise/de/documents/publications/studies/Photovoltaics-Report.pdf (accessed on 28 June 2020).
- German Government: Einkommensteuergesetz [Income Tax Act], § 6 Abs. 1 Nr. 4 EStG. Available online: https://www.baumann-baumann.de/neuigkeiten/steuerliche-foerderungen-von-dienstlichen-elektro-und-hybridfahrzeugen-6-abs-1-nr-4-estg-bzw-elektro-fahrraedern-3-nr-37-estg.htm (accessed on 28 June 2020).
- Lödl, M.; Kerber, G.; Witzmann, R.; Hoffmann, C.; Metzger, M. Abschätzung des Photovoltaik-Potentials auf Dachflächen in Deutschland. In Proceedings of the 11 Symposium Energieinnovation, Graz, Austria, 10–12 February 2010. [Google Scholar]
- Cheng, W.-H.; Richter, M.H.; May, M.M.; Ohlmann, J.; Lackner, D.; Dimroth, F.; Hannappel, T.; Atwater, H.A.; Lewerenz, H.-J. Monolithic Photoelectrochemical Device for Direct Water Splitting with 19% Efficiency. ACS Energy Lett. 2018, 3, 1795–1800. [Google Scholar] [CrossRef]
- Sapountzi, F.M.; Gracia, J.M.; Weststrate, C.; Kees, J.; Fredriksson, H.O.; Niemantsverdriet, J. Electrocatalysts for the generation of hydrogen, oxygen and synthesis gas. Prog. Energy Combust. Sci. 2017, 58, 1–35. [Google Scholar] [CrossRef] [Green Version]
- Mayyas, A.; Ruth, M.; Pivovar, B.; Bender, G.; Wipke, K. Manufacturing Cost Analysis for Proton Exchange Membrane Water Electrolyzers. Available online: https://www.nrel.gov/docs/fy19osti/72740.pdf (accessed on 20 August 2020).
- Eichlseder, H.; Klell, M. Thermodynamischer Zustand. In Wasserstoff in der Fahrzeugtechnik; Vieweg+Teubner Verlag: Wiesbaden, Germany, 2012; pp. 46–53. [Google Scholar]
- Metz, S. Linde pioneers hydrogen compression techniques for fuel cell electric vehicles. Fuel Cells Bull. 2014, 2014, 12–15. [Google Scholar] [CrossRef]
- Linde, A.G. Linde Hydrogen FuelTech—Driving the Future of Mobility. Available online: https://www.linde-engineering.com/en/plant-components/hydrogen-fueling-technologies/index.html (accessed on 19 August 2020).
- Mayer, M. From Prototype to Serial Production—Manufacturing Hydrogen Fuelling Stations; A3PS: Wien, Austria, 2014. [Google Scholar]
- Suermann, M.; Kiupel, T.; Schmidt, T.J.; Büchi, F.N. Electrochemical Hydrogen Compression: Efficient Pressurization Concept Derived from an Energetic Evaluation. J. Electrochem. Soc. 2017, 164, F1187–F1195. [Google Scholar] [CrossRef]
- HyET Hydrogen, Electrochemical Hydrogen Purification and Compression. Available online: https://hyethydrogen.com/upload_directory/files/BI1207-hydrogen-flyer-2020.001.04.pdf (accessed on 19 August 2020).
- Toghyani, S.; Baniasadi, E.; Afshari, E.; Javani, N. Performance analysis and exergoeconomic assessment of a proton exchange membrane compressor for electrochemical hydrogen storage. Int. J. Hydrog. Energy 2020, 45, 34993–35005. [Google Scholar] [CrossRef]
- Rhandi, M.; Tregaro, M.; Druart, F.; Deseure, J.; Chatenet, M. Electrochemical hydrogen compression and purification versus competing technologies: Part I. Pros and cons. Chin. J. Catal. 2020, 41, 756–769. [Google Scholar] [CrossRef]
- Rajendran, G.; Vaithilingam, C.A.; Naidu, K.; Oruganti, K.S.P. Energy-efficient converters for electric vehicle charging stations. SN Appl. Sci. 2020, 2, 1–15. [Google Scholar] [CrossRef] [Green Version]
- Sakka, M.A.; Mierlo, J.V.; Gualous, H. DC/DC Converters for Electric Vehicles, Electric Vehicles—Modelling and Simulations; IntechOpen: London, UK, 2011. [Google Scholar] [CrossRef] [Green Version]
- Chakraborty, S.; Vu, H.-N.; Hasan, M.M.; Tran, D.-D.; Baghdadi, M.; Hegazy, O. DC-DC Converter Topologies for Electric Vehicles, Plug-in Hybrid Electric Vehicles and Fast ChargingStations: State of the Art and Future Trends. Energies 2019, 12, 1569. [Google Scholar] [CrossRef] [Green Version]
| Publisher’s Note: MDPI stays neutral with regard to jurisdictional claims in published maps and institutional affiliations. |
© 2021 by the authors. Licensee MDPI, Basel, Switzerland. This article is an open access article distributed under the terms and conditions of the Creative Commons Attribution (CC BY) license (http://creativecommons.org/licenses/by/4.0/).


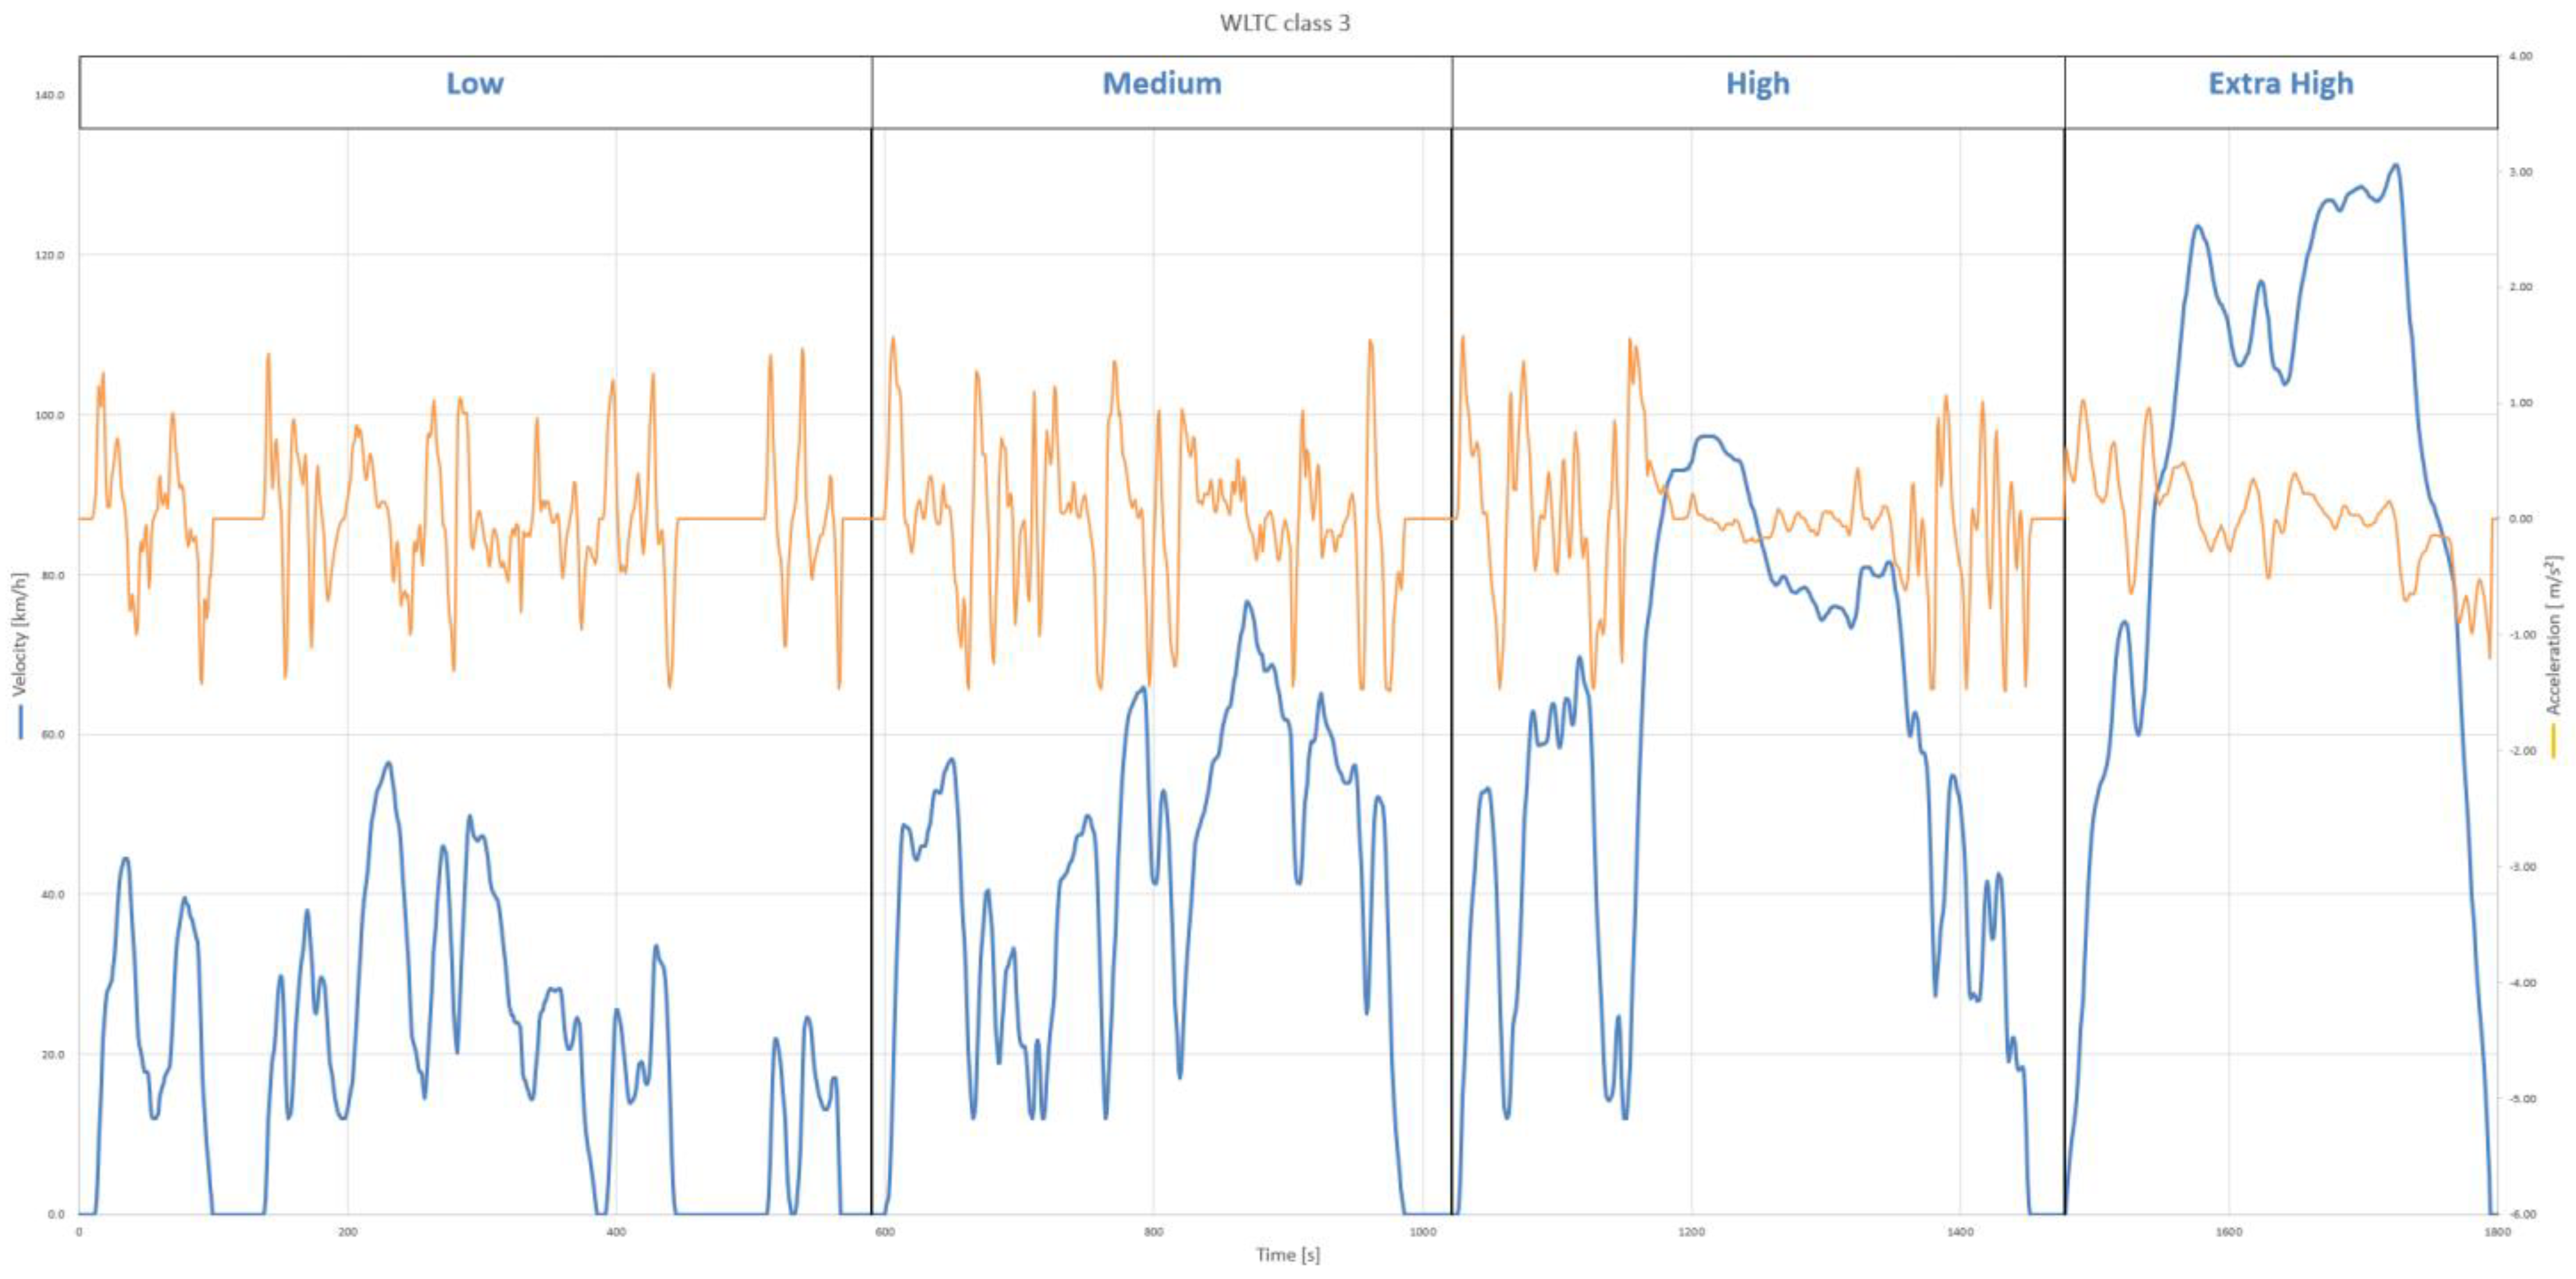
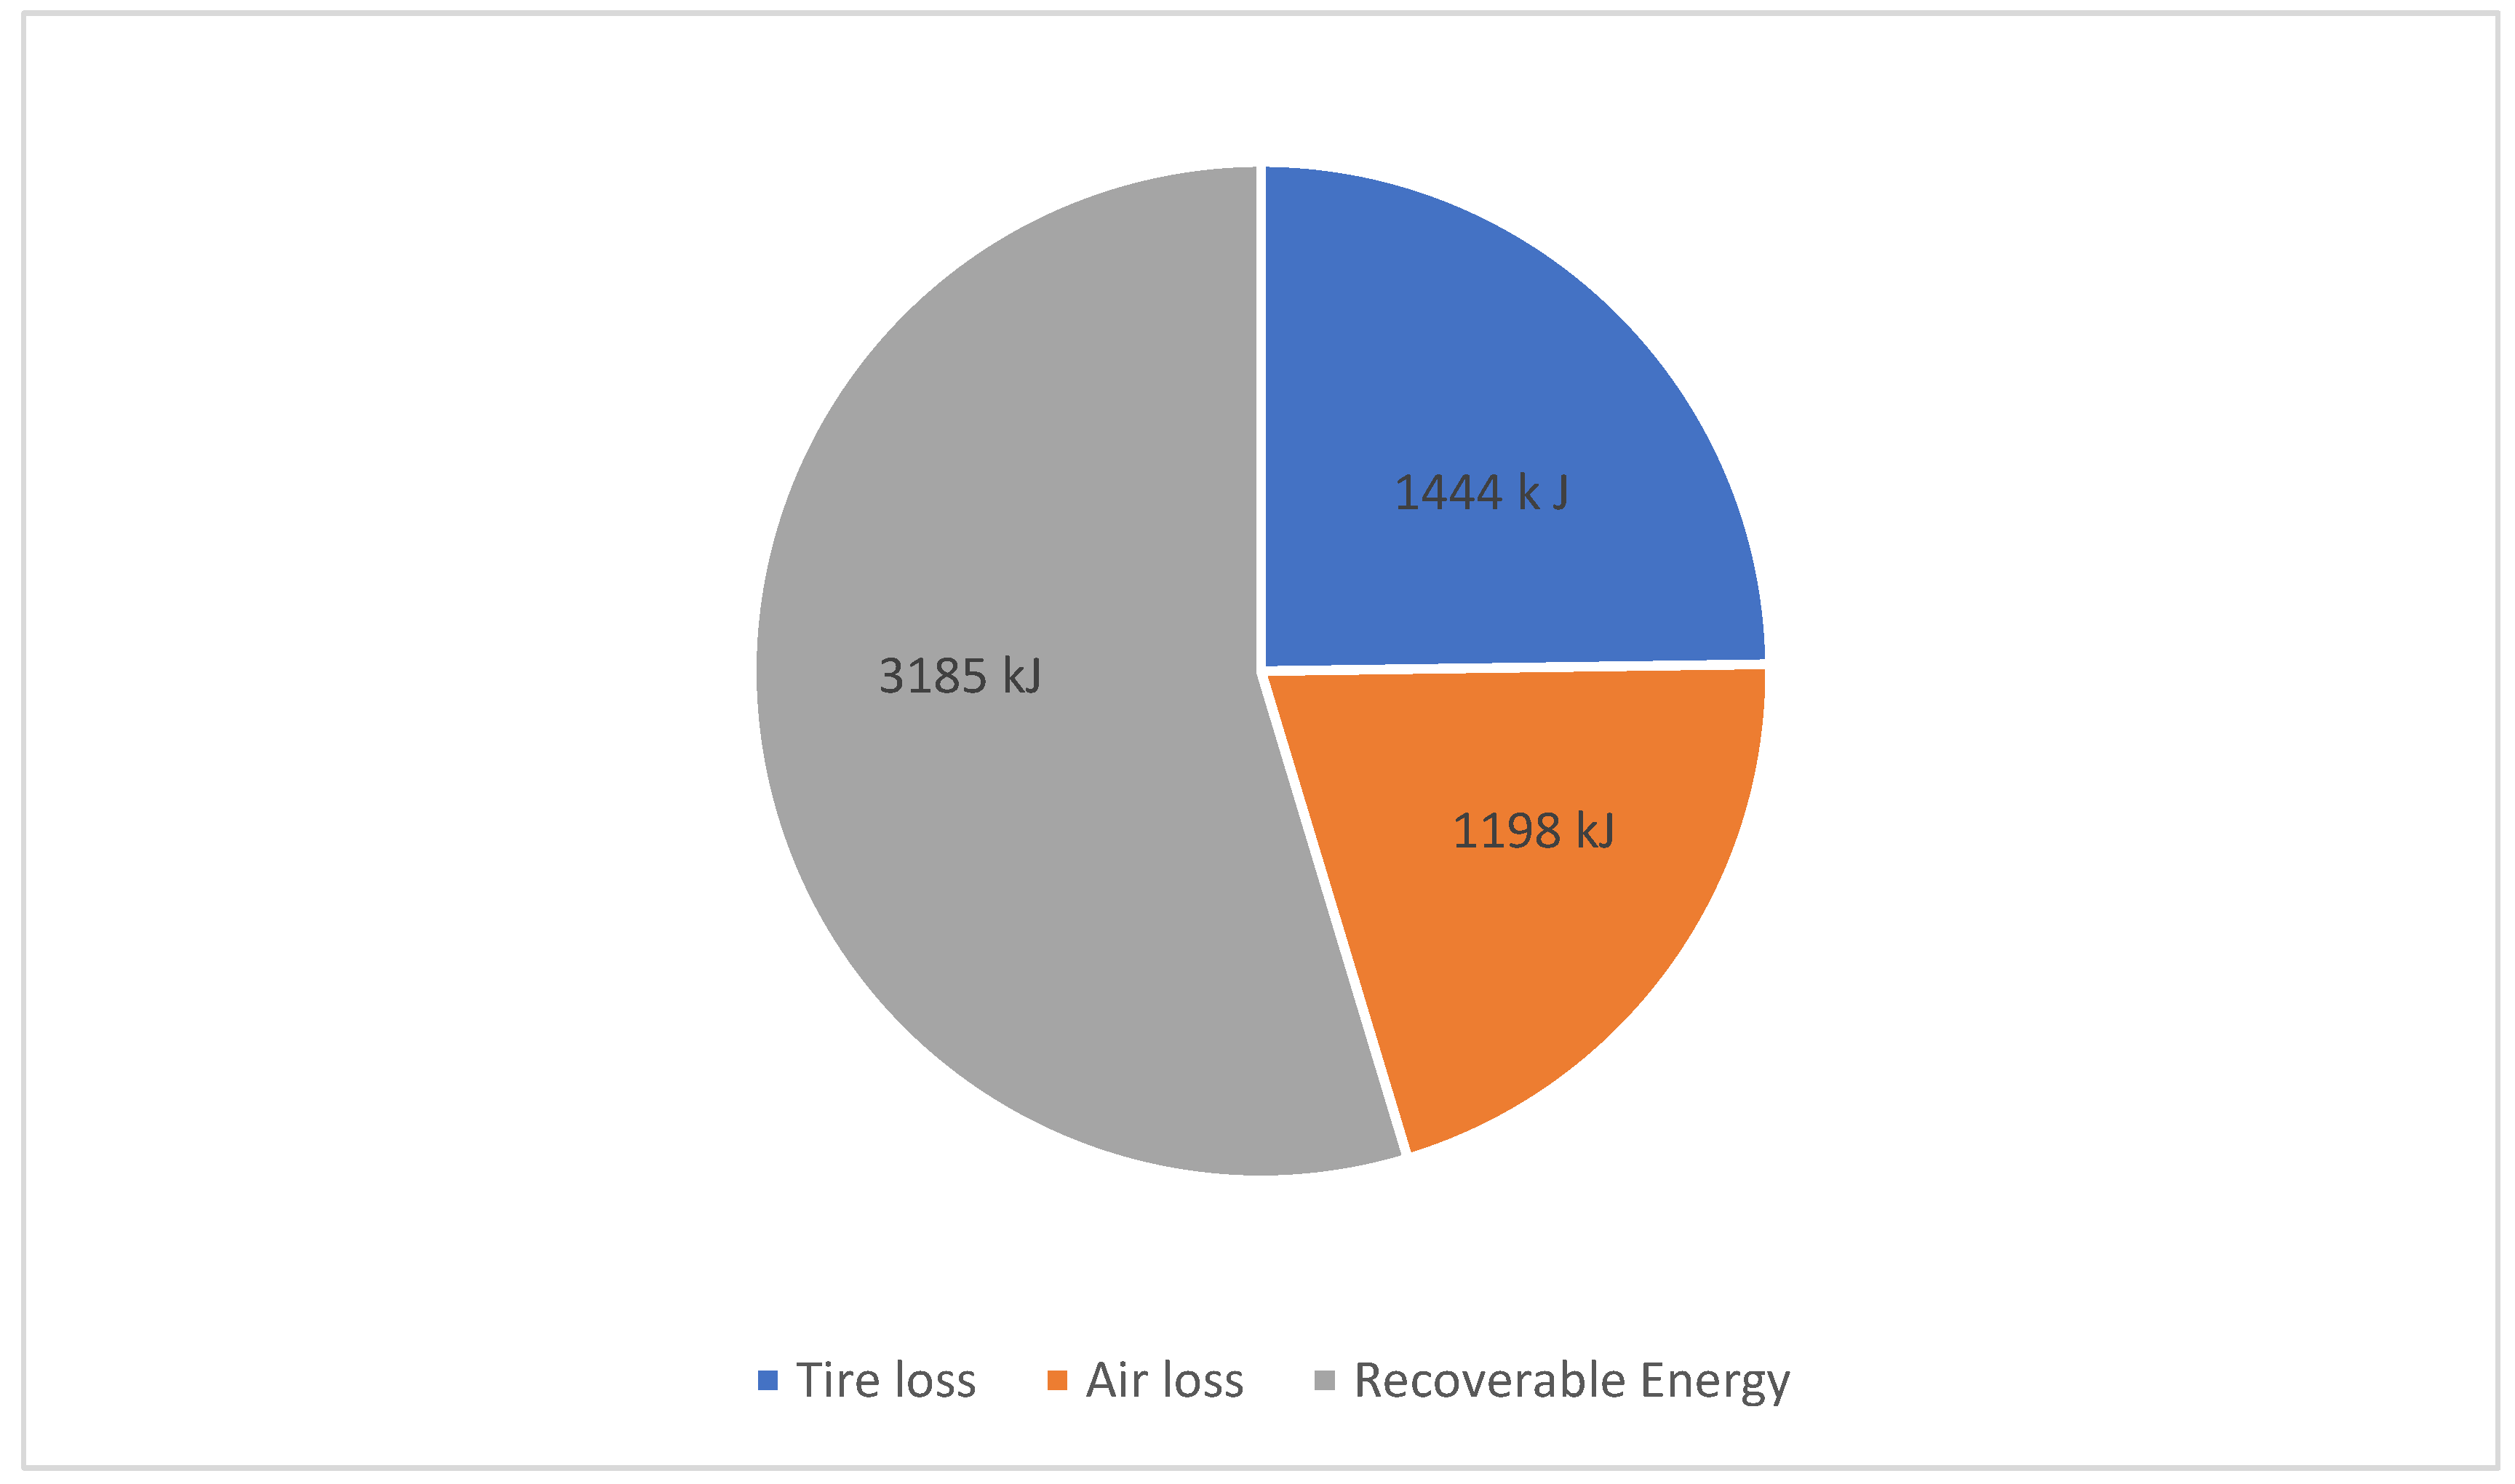
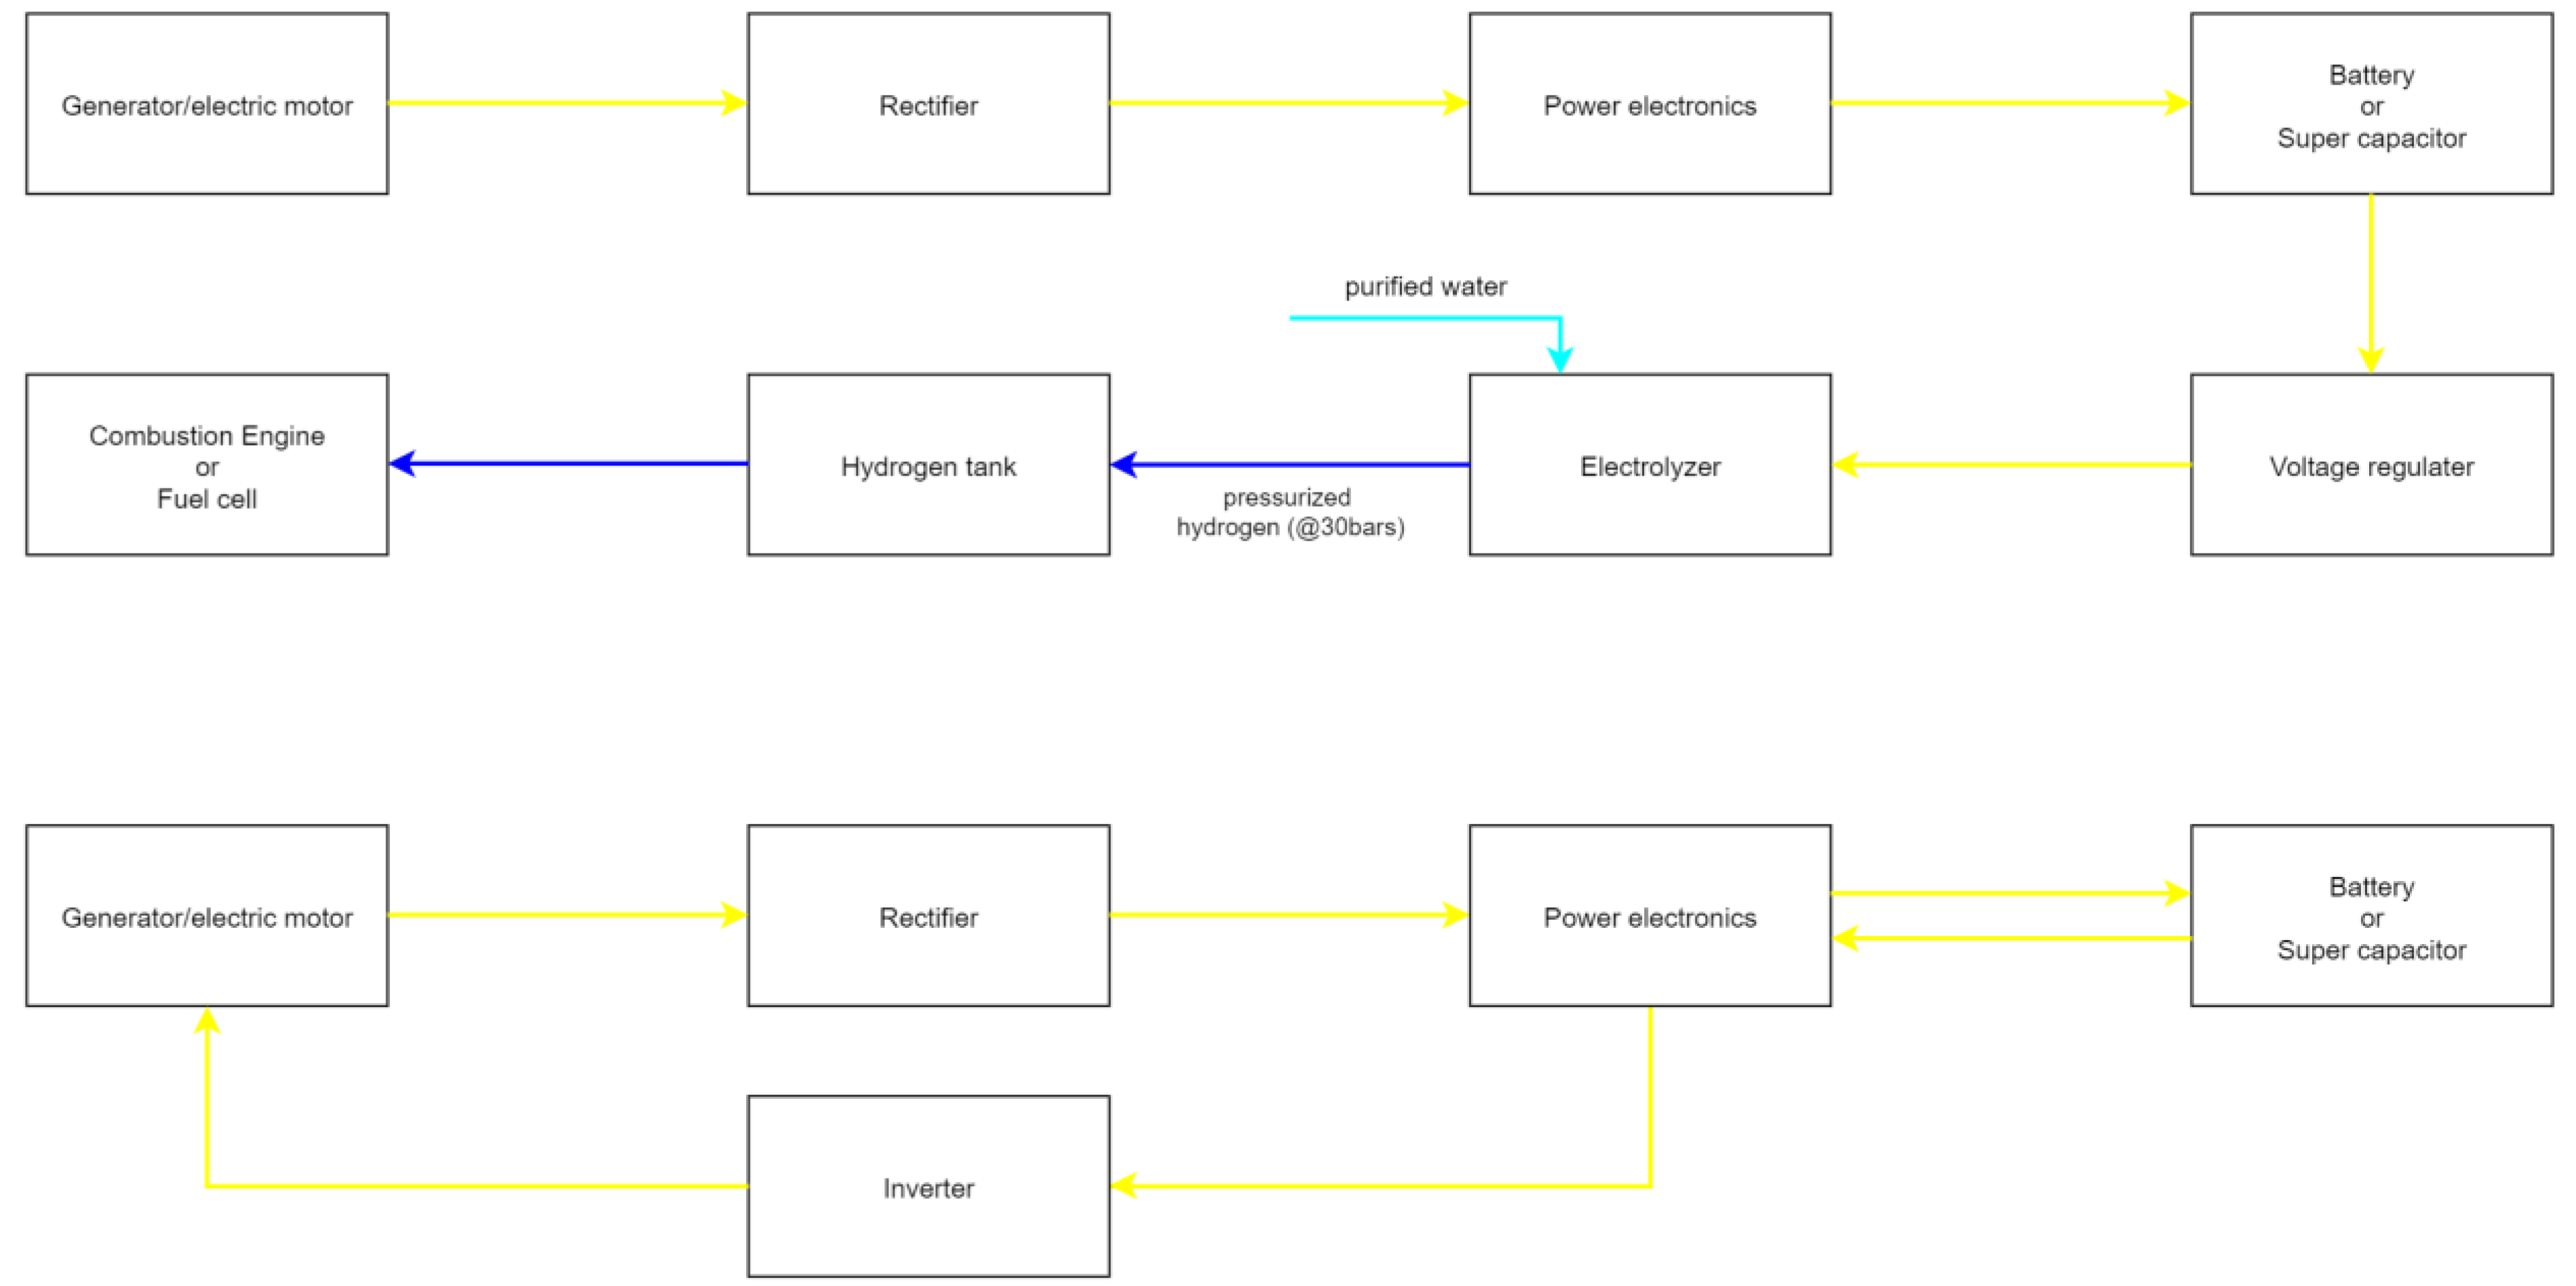
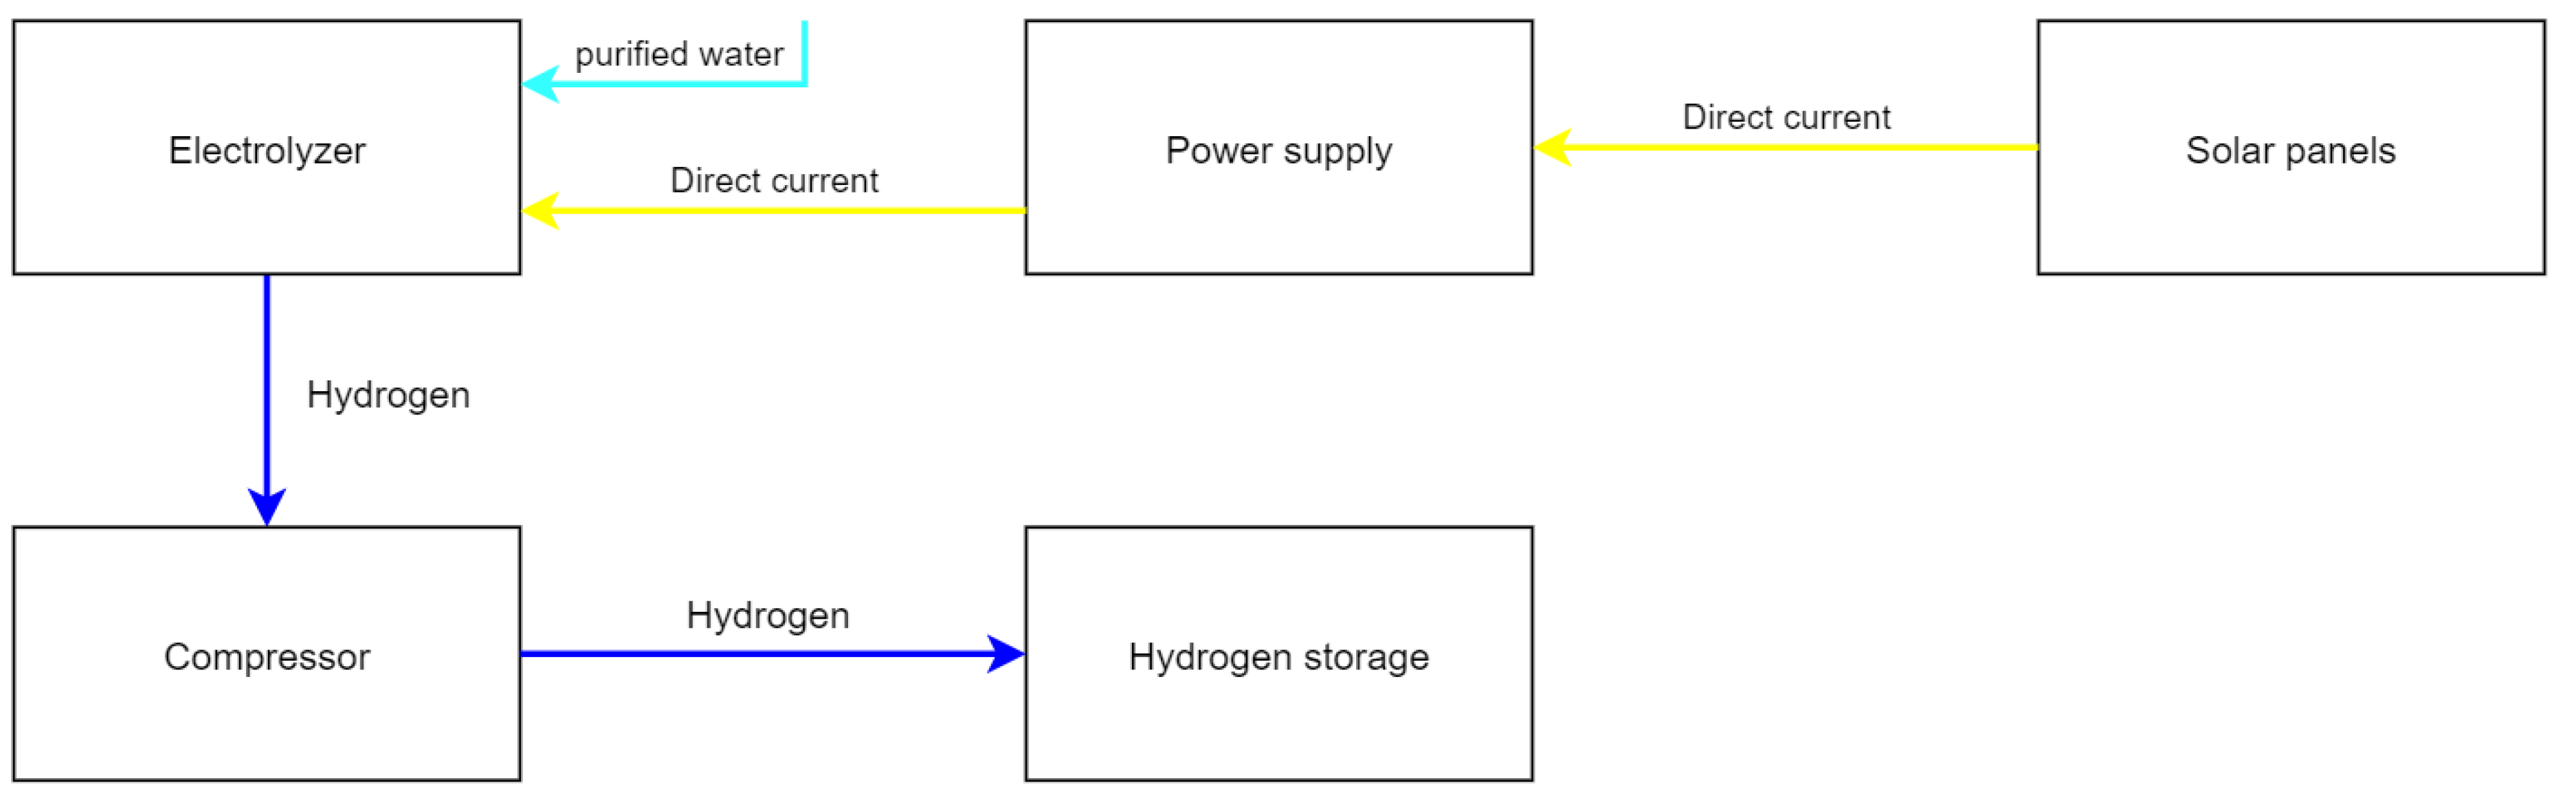
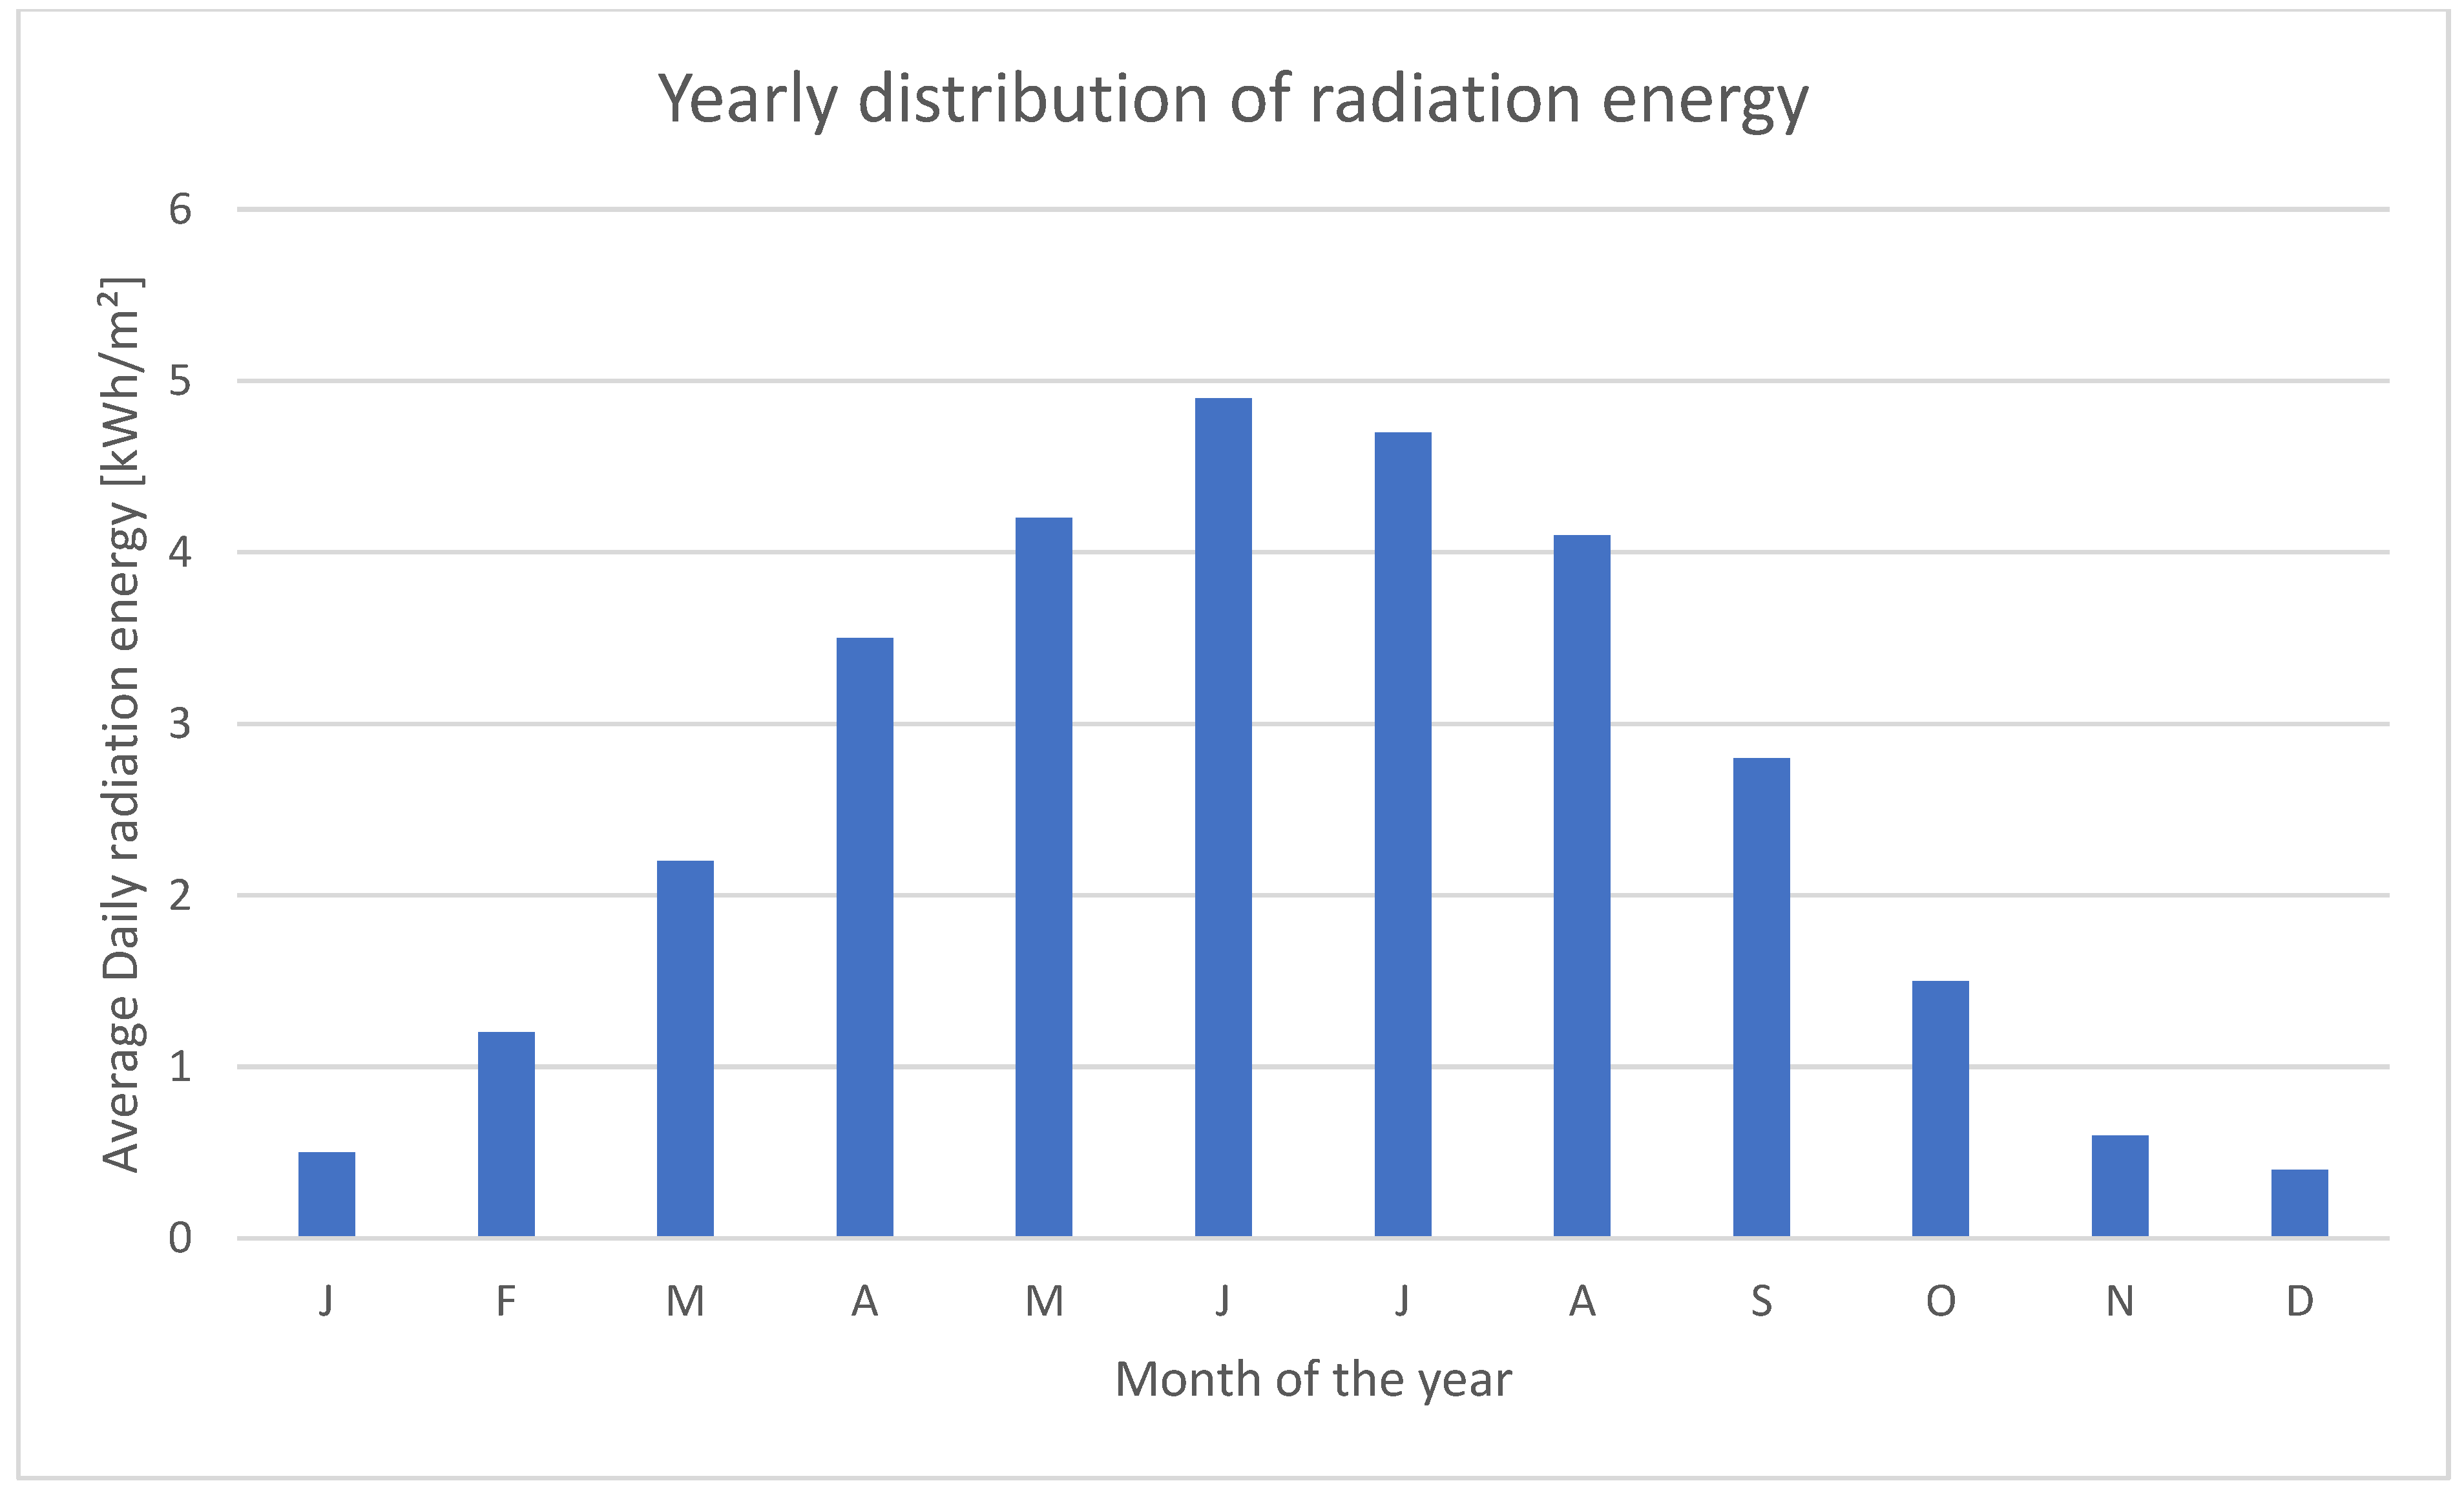
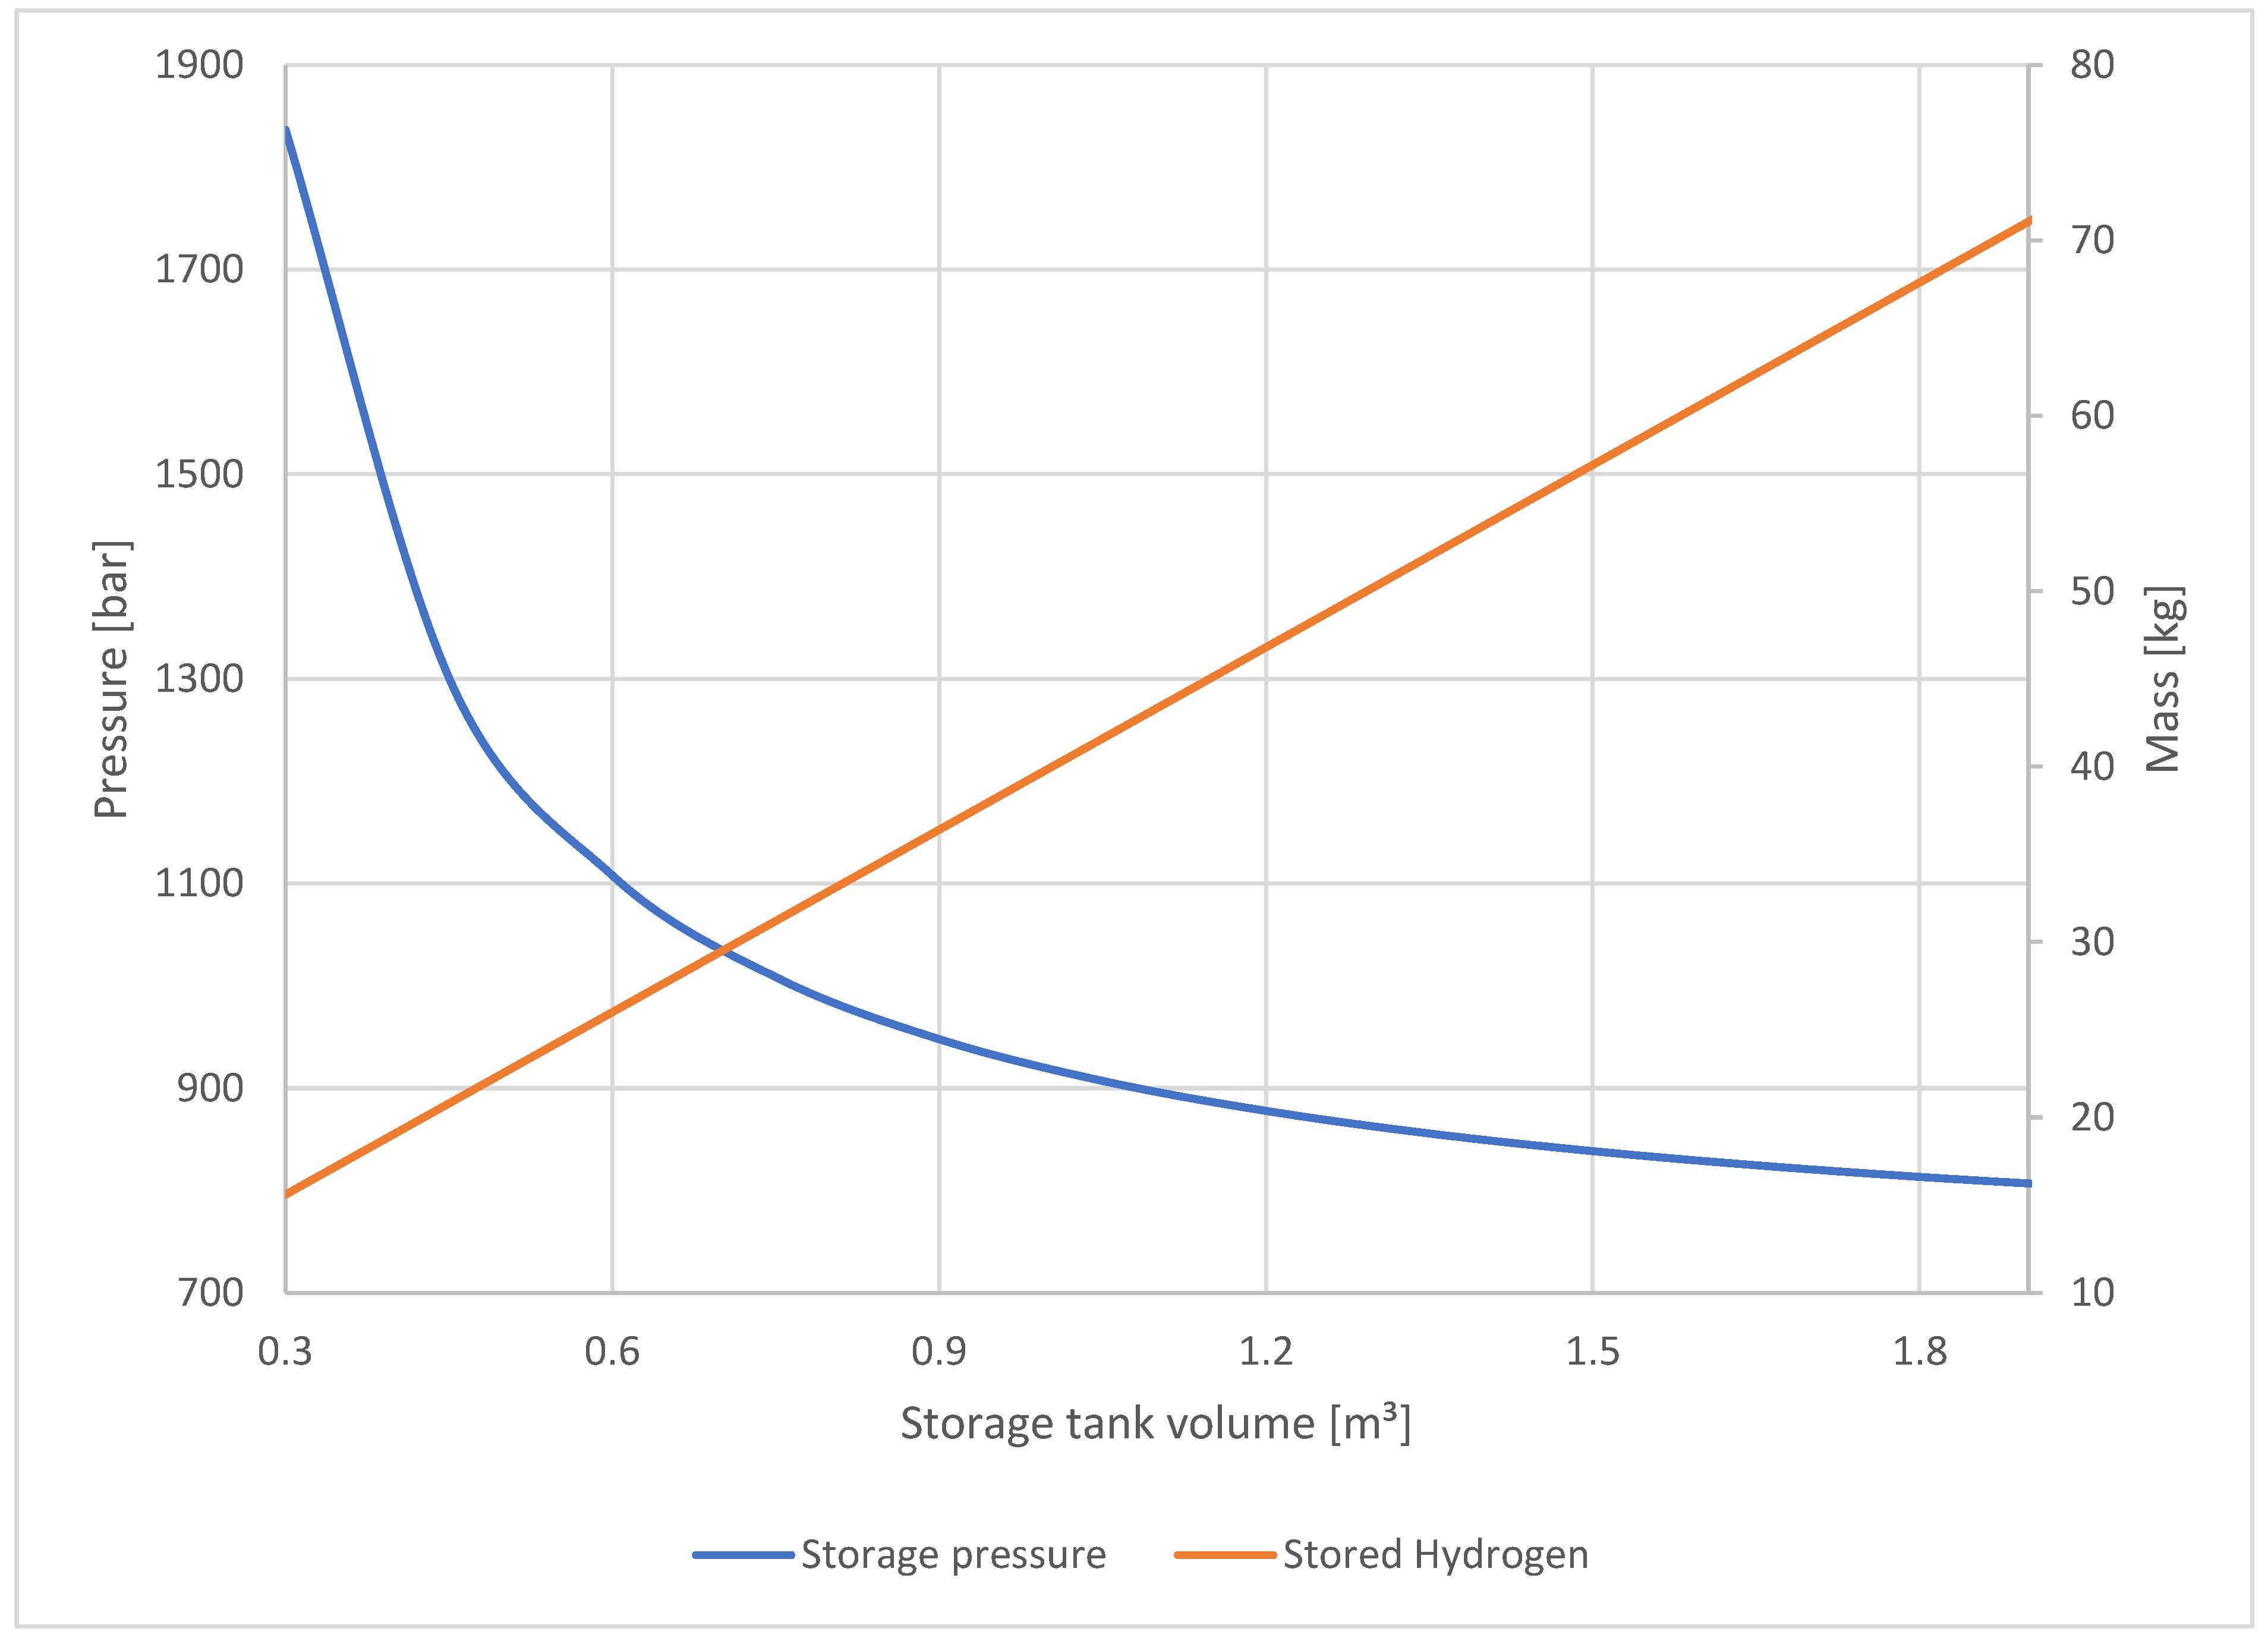
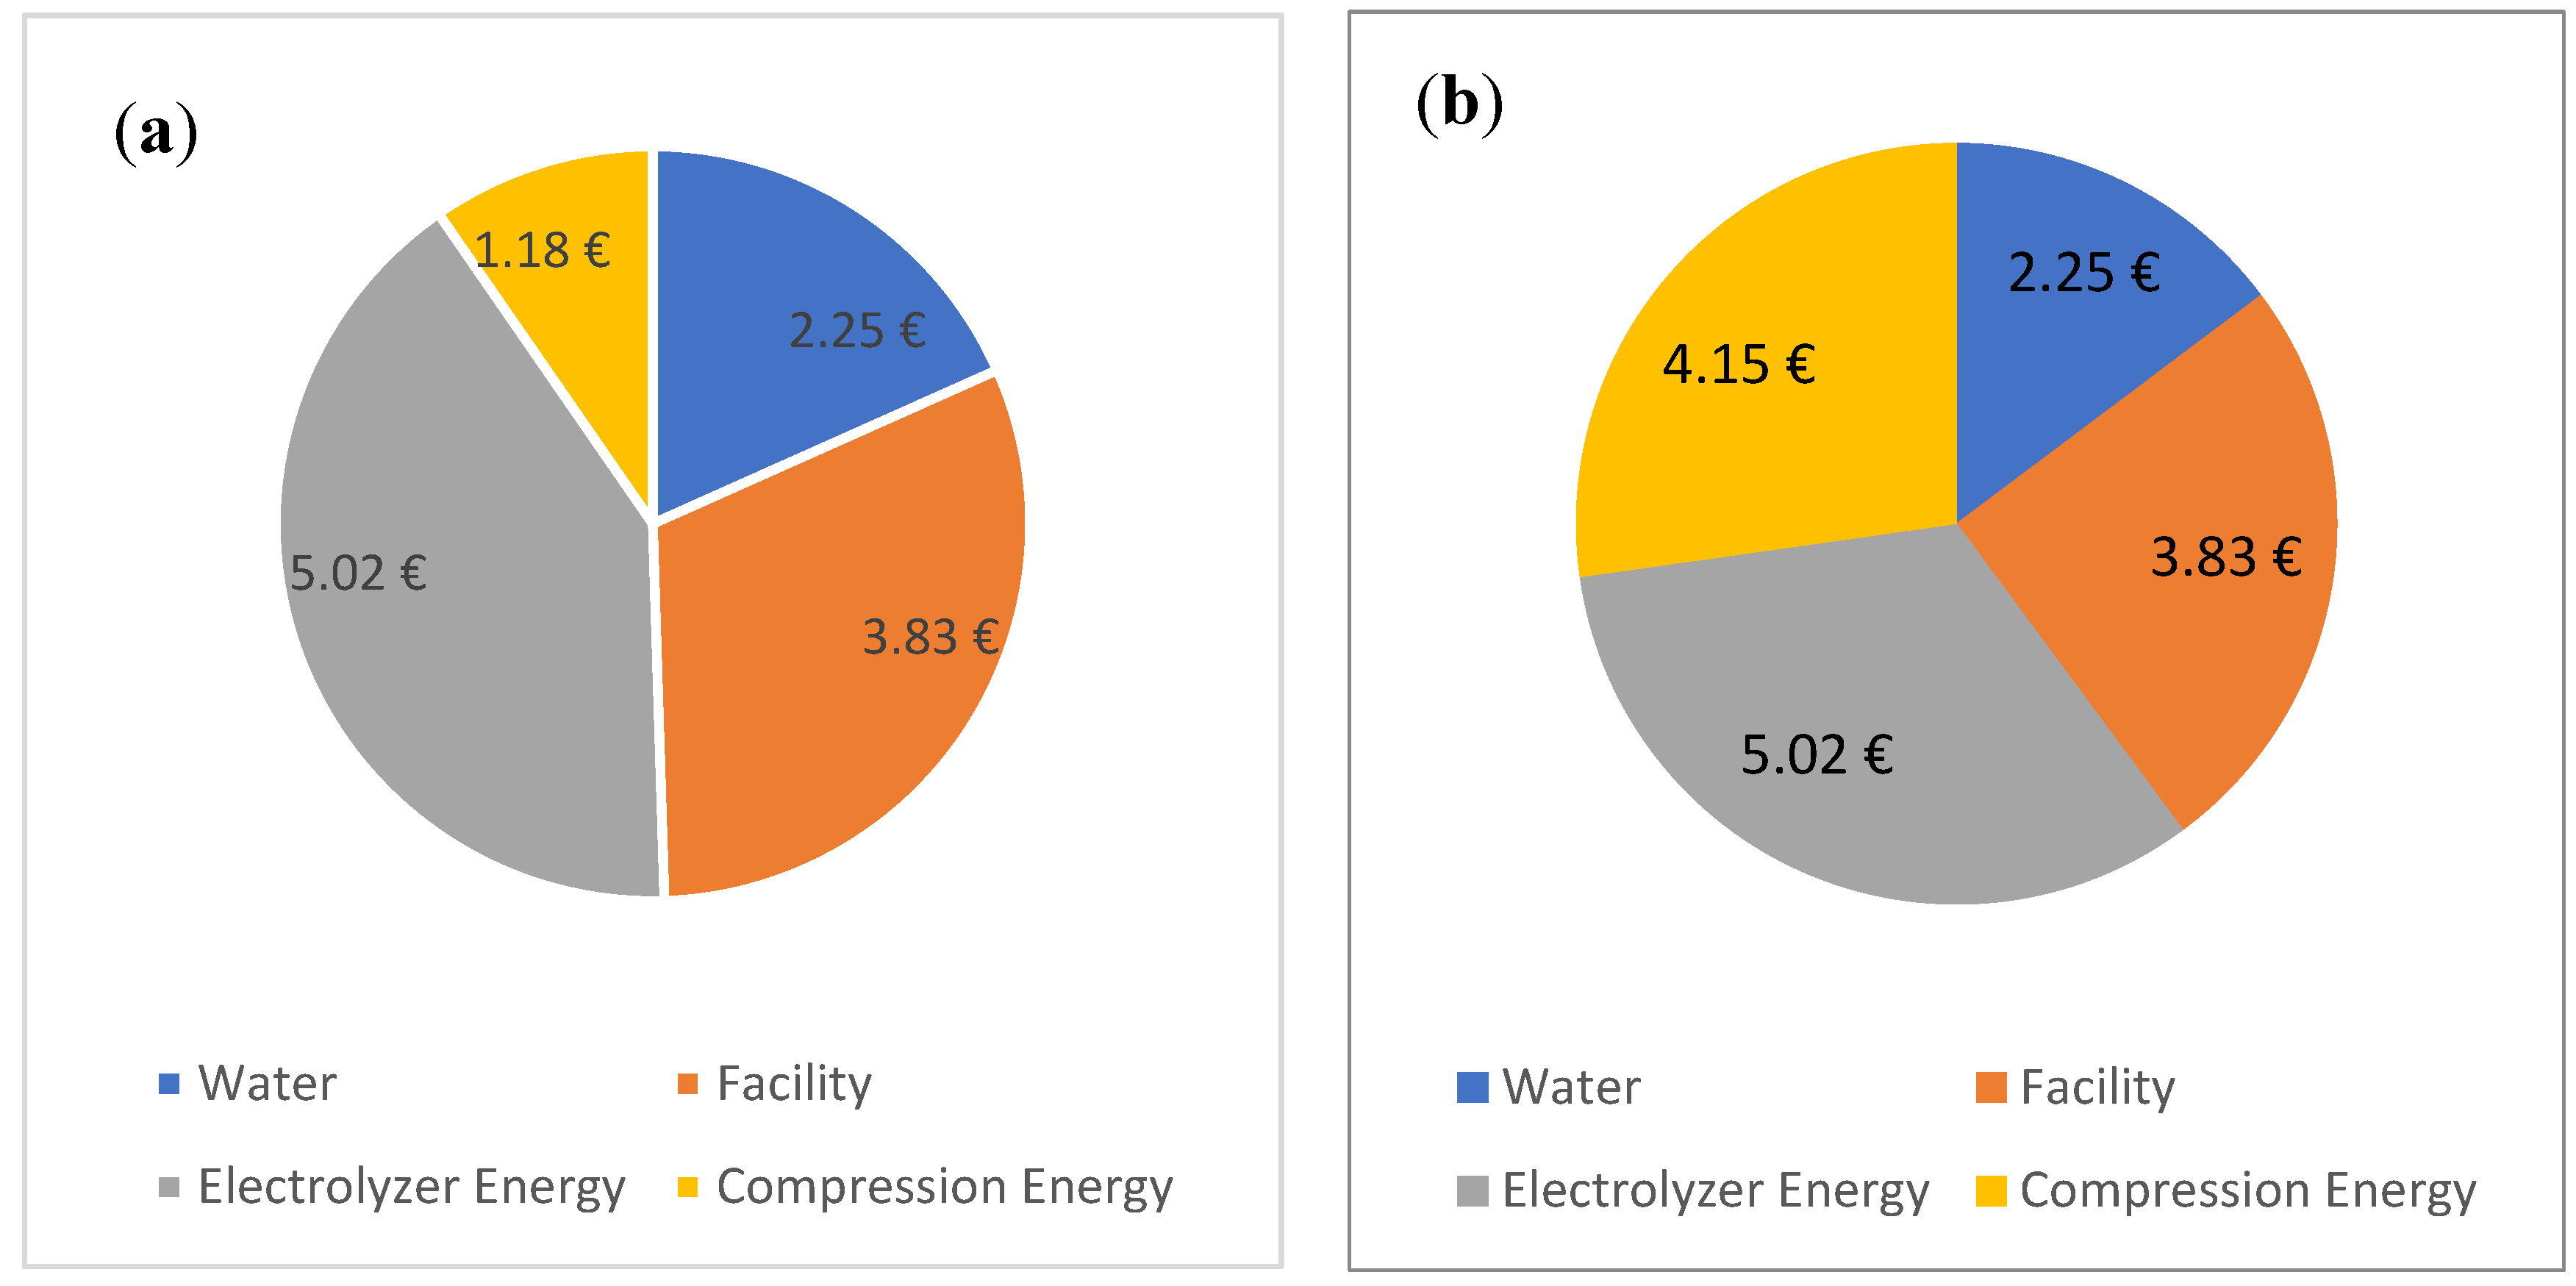