
The Key Techno-Economic and Manufacturing Drivers for Reducing the Cost of Power-to-Gas and a Hydrogen-Enabled Energy System


Department of Engineering, Durham University, Durham DH1 3LE, UK
*
Author to whom correspondence should be addressed.
†
These authors contributed equally to this work.
Hydrogen 2021, 2(3), 273-300; https://0-doi-org.brum.beds.ac.uk/10.3390/hydrogen2030015
Submission received: 8 June 2021
/
Revised: 6 July 2021
/
Accepted: 13 July 2021
/
Published: 27 July 2021
(This article belongs to the Special Issue Feature Papers in Hydrogen)
Abstract
:Water electrolysis is a process which converts electricity into hydrogen and is seen as a key technology in enabling a net-zero compatible energy system. It will enable the scale-up of renewable electricity as a primary energy source for heating, transport, and industry. However, displacing the role currently met by fossil fuels might require a price of hydrogen as low as 1 $/kg, whereas renewable hydrogen produced using electrolysis is currently 10 $/kg. This article explores how mass manufacturing of proton exchange membrane (PEM) electrolysers can reduce the capital cost and, thus, make the production of renewable power to hydrogen gas (PtG) more economically viable. A bottom up direct manufacturing model was developed to determine how economies of scale can reduce the capital cost of electrolysis. The results demonstrated that (assuming an annual production rate of 5000 units of 200 kW PEM electrolysis systems) the capital cost of a PEM electrolysis system can reduce from 1990 $/kW to 590 $/kW based on current technology and then on to 431 $/kW and 300 $/kW based on the an installed capacity scale-up of ten- and one-hundred-fold, respectively. A life-cycle costing analysis was then completed to determine the importance of the capital cost of an electrolysis system to the price of hydrogen. It was observed that, based on current technology, mass manufacturing has a large impact on the price of hydrogen, reducing it from 6.40 $/kg (at 10 units units per year) to 4.16 $/kg (at 5000 units per year). Further analysis was undertaken to determine the cost at different installed capacities and found that the cost could reduce further to 2.63 $/kg and 1.37 $/kg, based on technology scale-up by ten- and one hundred-fold, respectively. Based on the 2030 (and beyond) baseline assumptions, it is expected that hydrogen production from PEM electrolysis could be used as an industrial process feed stock, provide power and heat to buildings and as a fuel for heavy good vehicles (HGVs). In the cases of retrofitted gas networks for residential or industrial heating solutions, or for long distance transport, it represents a more economically attractive and mass-scale compatible solution when compared to electrified heating or transport solutions.
1. Introduction
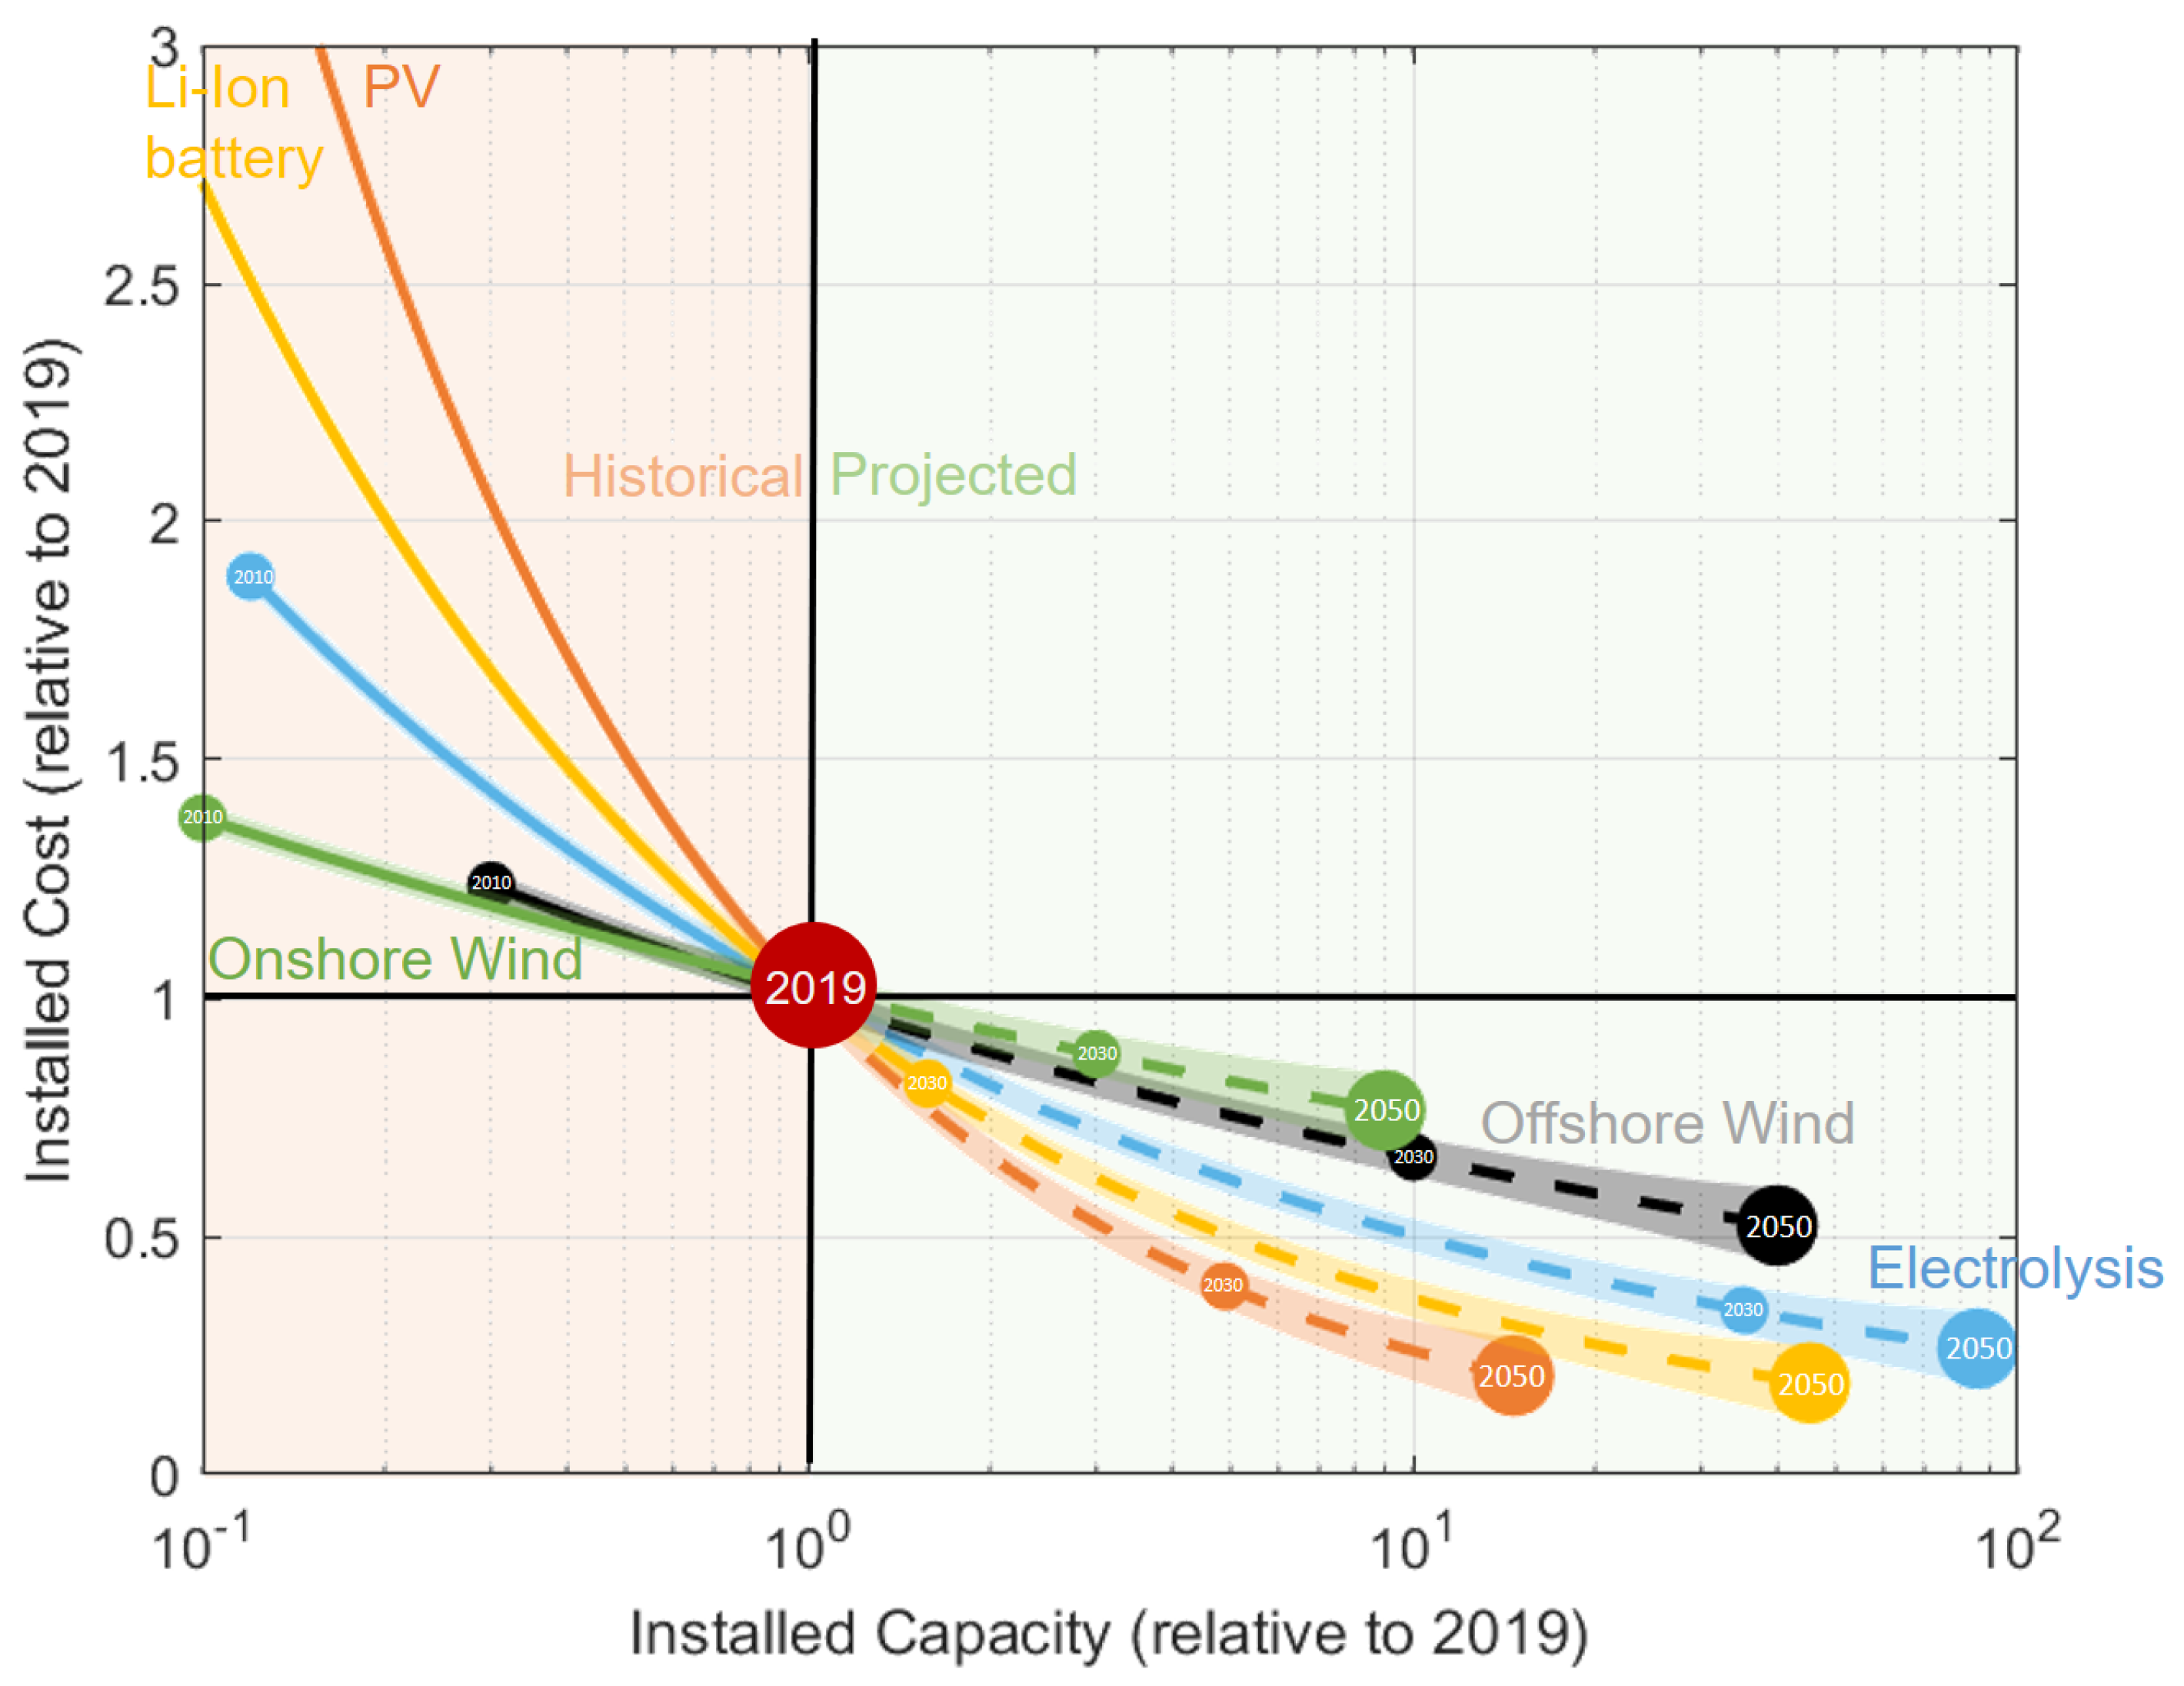
National governments are now beginning to follow the well established scientific consensus on climate change and are establishing net-zero greenhouse gas emissions targets [1]. One of the solutions is to increase the production of renewable energy sources (RES) and displacing the use of fossil fuels. This has been one of the most positive developments in the past few years and has been made possible by the rapidly installed cost reductions of RES, as presented in Figure 1, and in more detail for electrolysis in Figure 2. The observed trend is that, as more renewable technologies are deployed, the installed capacity has increased and, in almost all cases, there has been a corresponding reduction in the installed cost of the technology.
As a result of mandated targets, the benefits of mass manufacture, and their corresponding cost reductions, it is expected that global renewable energy production will continue to increase 2.3% year on year, from 2100 GW in 2016 to 3700 GW in 2040 [10]. These high rates of deployment have begun to be realised and exceeded in 2020, with 3% recorded and a further 5% expected by the International Energy Agency [11].
However, overcoming (or taking advantage of) the intermittent nature of renewable energy supply is now an increasing challenge, for example in 2017, GBP 67 million worth of electrical energy was lost in the UK energy system as a result of curtailed wind energy in times of excess supply [12]. A lost opportunity which is likely to increase in frequency and scale as more renewable energy supply technologies are deployed.
One promising prospect for storing and utilising the excess energy produced by renewable energy supply is power-to-gas (PtG), a technology which directly converts electrical power to hydrogen via electrolysis and utilises it at scale. Hydrogen is a clean and sustainable energy carrier which emits only water as a by-product with zero exhaust carbon dioxide emissions. In an era of increasing de-fossilisation, it is seen by many as a solution which brings some of the energy system flexibility and resilience delivered presently by fossil fuels whilst taking advantage of the cost benefits of utilising existing fossil-based energy infrastructure.
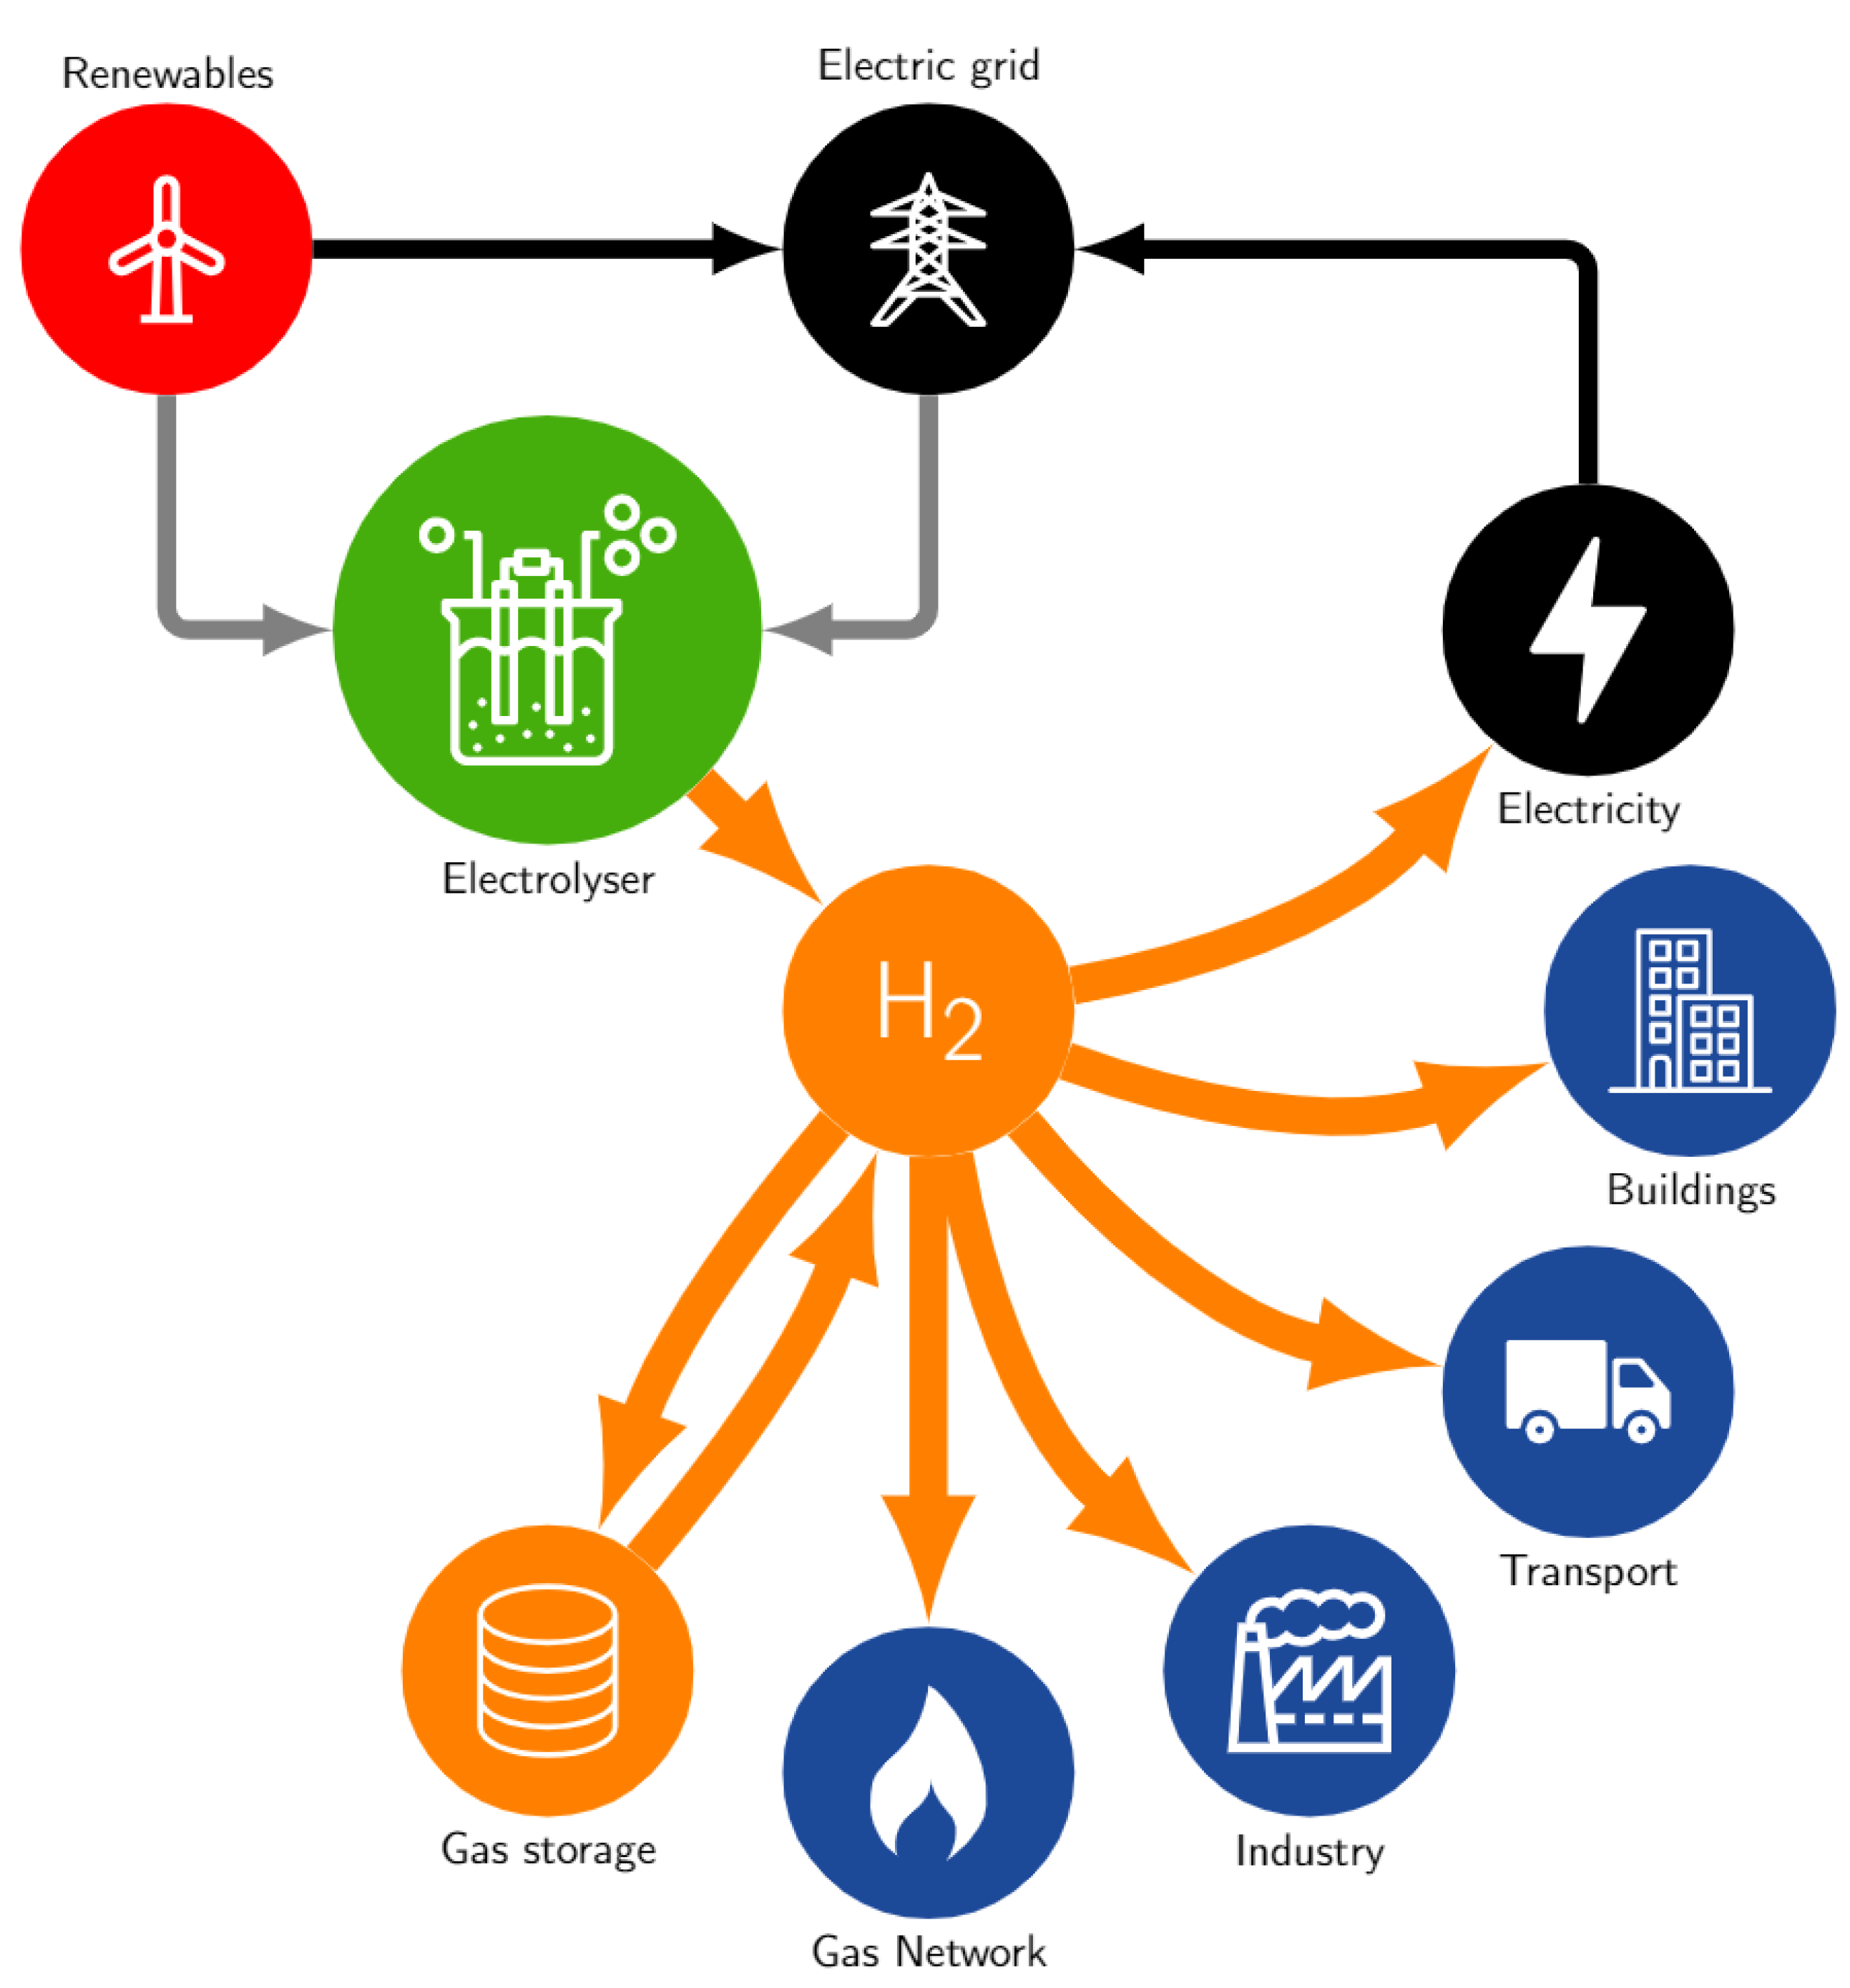
As presented in Figure 3, hydrogen has the potential for large scale deployment and use across the transport, heat, industry and electricity sectors [13,14]. As we progress toward a scaled-up net-zero energy system, the opportunity for hydrogen-based solutions is expected to open up significantly [14] with opportunities across various areas:
- Storage: Hydrogen can be stored readily as compressed gas, as a liquid, or absorbed into materials. The former has the most potential to bring resilience and scale to energy networks. At scale, geological hydrogen storage could potentially be deployed by utilising depleted gas fields [15];
- Gas network: There is an opportunity for hydrogen to be used for heating and power in buildings. Using the existing (and future) gas network infrastructure including blending with natural gas. This is a potential pathway to bringing forward a means for distribution;
- Industry—feedstocks: Hydrogen is a key feed stock for steel, ammonia, and methanol production, as well as for refineries offering a competitive alternative to natural gas and coal as the primary energy source. It can also offer mid- to high-grade thermal energy for industry, in competition with electrical heating and heat pumps;
- Transportation: There is scope for hydrogen to fuel trains, heavy and medium-duty trucks, vans for urban delivery, coaches, long and short distance urban buses, small and large ferries, taxis, large passenger vehicles, sports utility vehicles (SUVs), mid-size short and long range vehicles, small urban cars, syn-fuelled aviation and forklifts. All applications would be expected to have competition from battery vehicles, bio-fuels, and electric catenary systems. Nevertheless, some studies point to the fact that, on-balance, a typical driver would prefer hydrogen [14];
- Buildings: Buildings would benefit from using gas in boilers or in hydrogen fuelled combined heat and power systems. Renewable hydrogen potentially represents a cost competitive alternative to the use of biogas and in the long term natural gas with carbon capture;
- Electric power: Hydrogen offers the potential for utility scale electricity production via fuel cells, simple cycle and combined cycle turbines, as well as for back-up and remote generation;
Figure 3.
The opportunity for producing hydrogen from renewable electricity and its potential applications across a net-zero energy system.
Figure 3.
The opportunity for producing hydrogen from renewable electricity and its potential applications across a net-zero energy system.

1.1. A Growing Opportunity for Renewable Hydrogen
Whilst not widely abundant on earth in high concentrations, there are multiple different processes to produce high purity hydrogen. Currently, 96% of the global hydrogen production comes from non-renewable fossil fuels, predominantly via steam reforming of natural gas [16]. It is widely [6] recognised that, at least in the short term, hydrogen produced from natural gas will be the most cost effective mode of production and can rapidly be decarbonised at scale through the integration of carbon capture and storage technology.
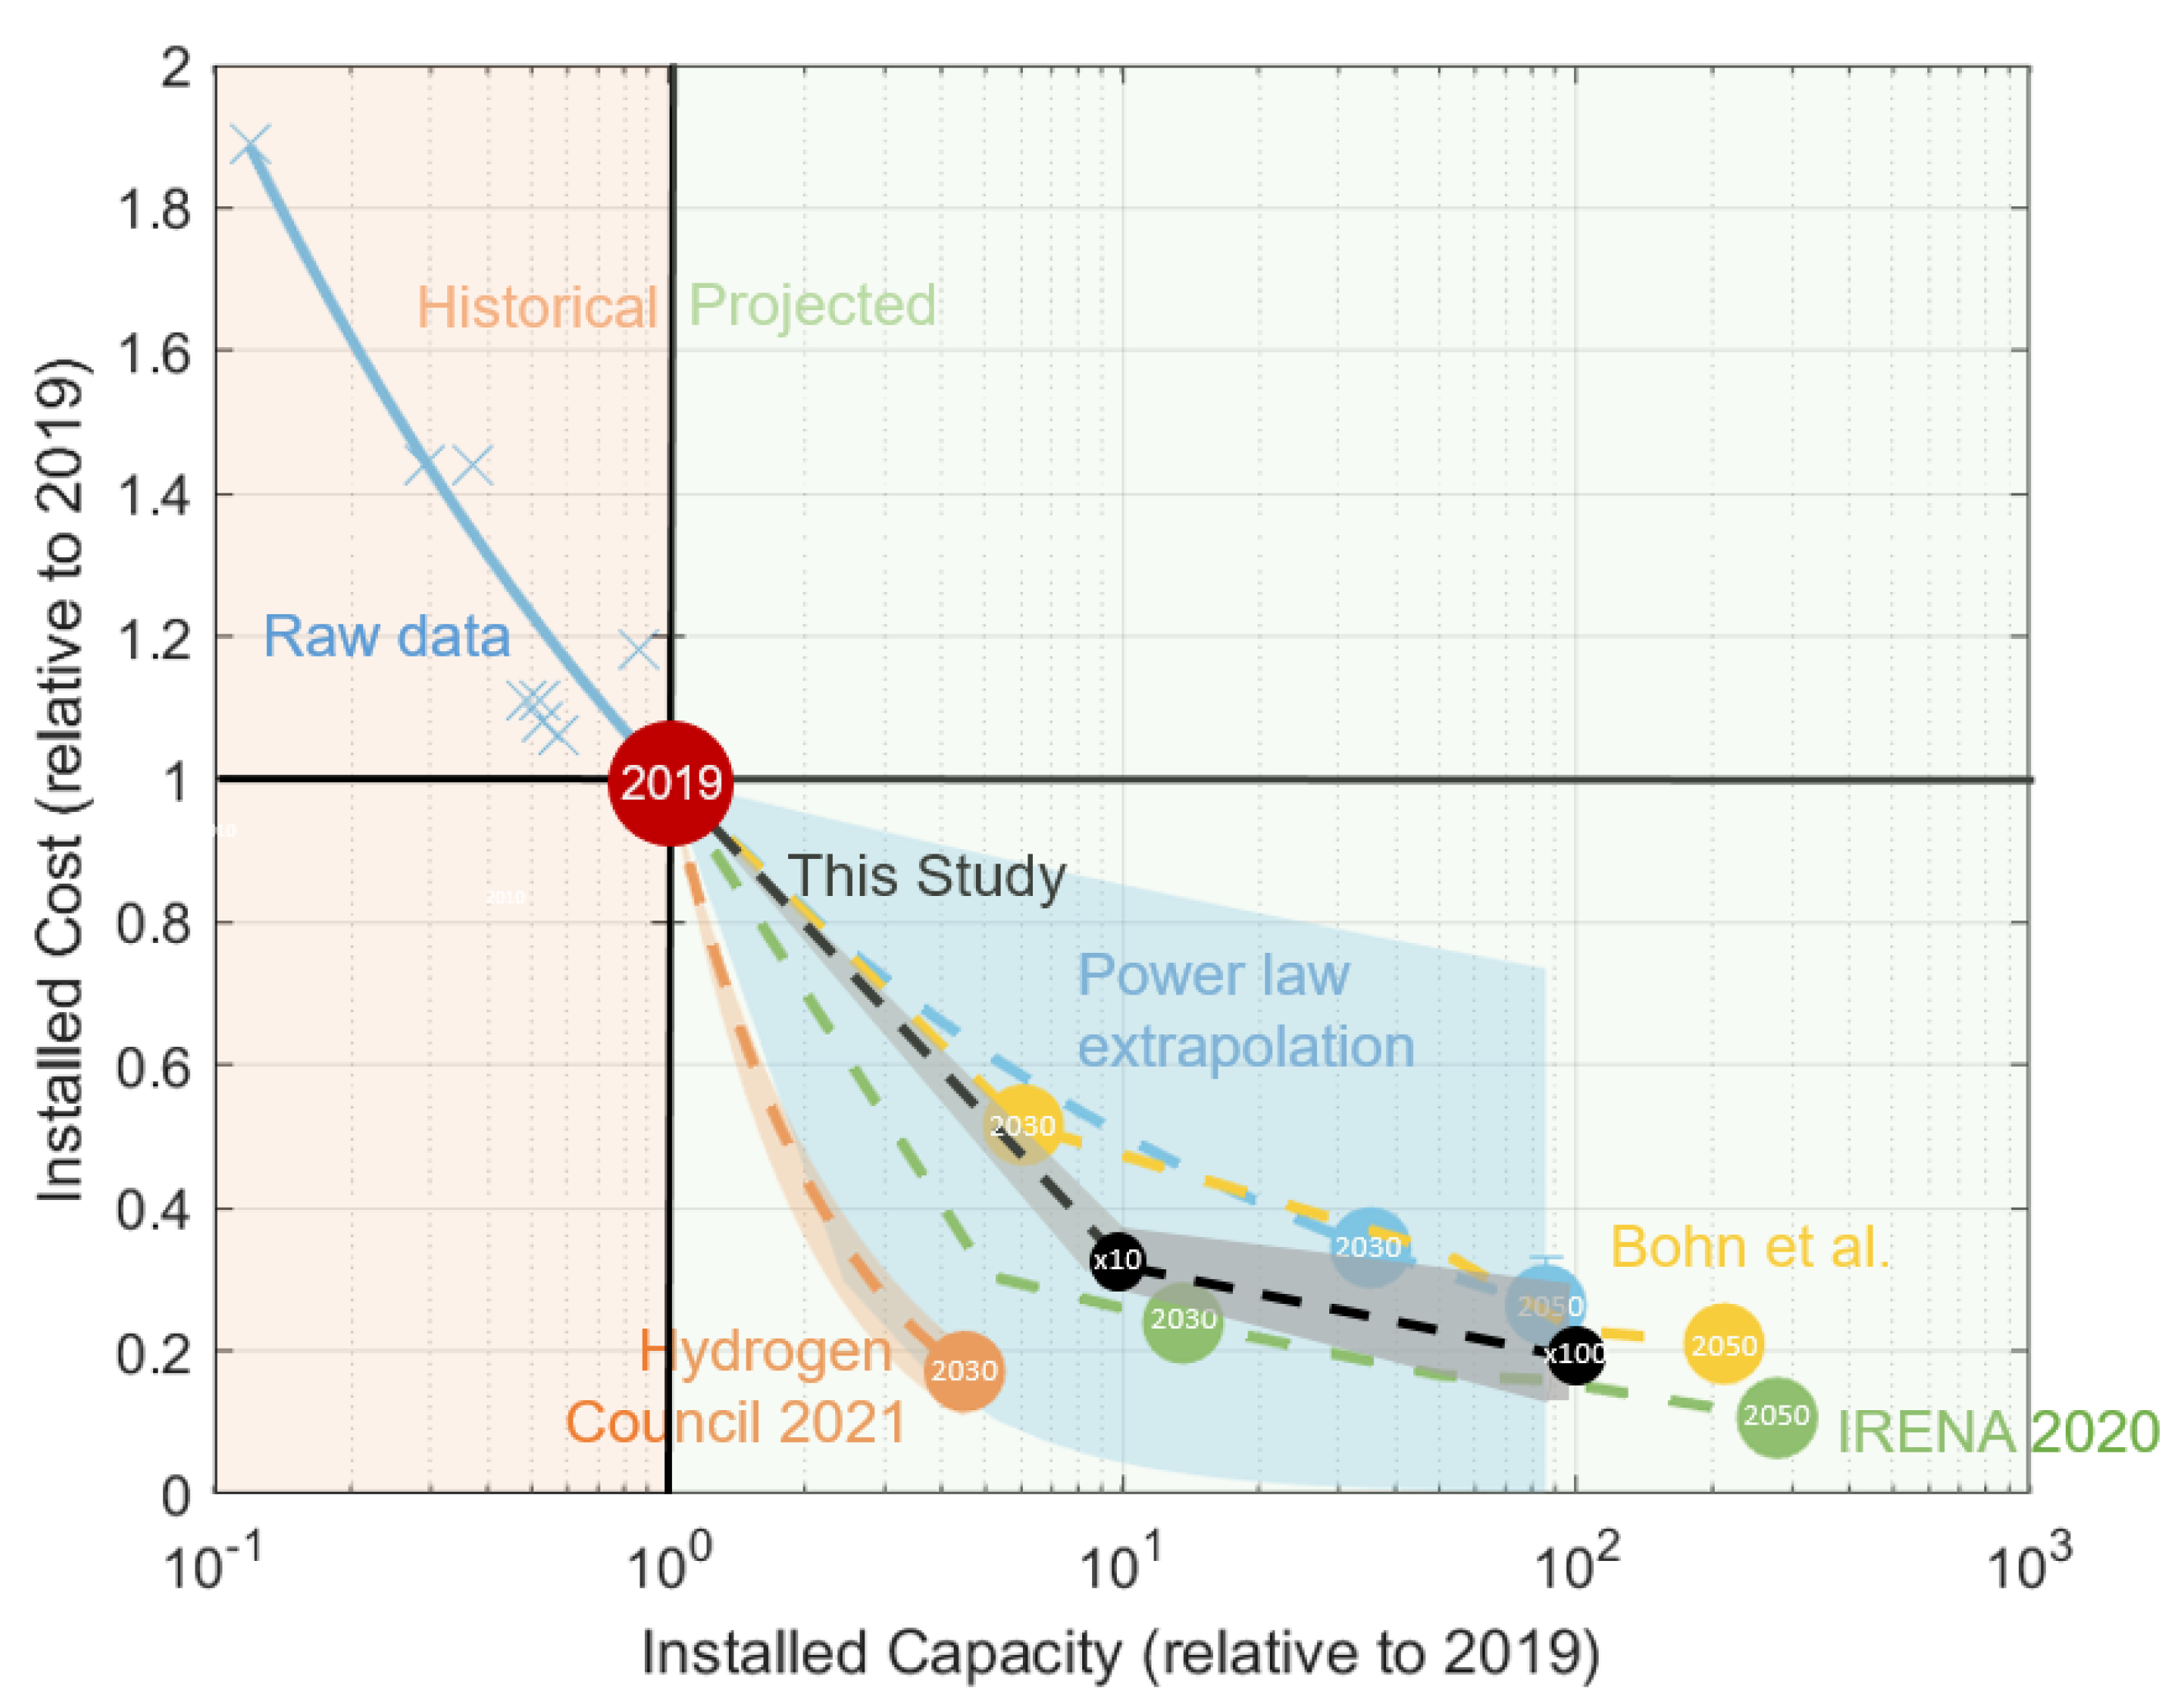
However, in the longer term, water electrolysis is widely expected to become a cheaper option for producing decarbonised or so-called ‘green hydrogen’ [6]. Currently, electrolysis only makes up 4% of the global hydrogen production at around 19.8 GW [5], however as presented in Figure 2, compared to a 2019 baseline, various estimates, such as those by Bohn, et al. [8], Hydrogen Council (2021) [9], and IRENA 2020 [6], generally consider that this figure could increase ×5–50-fold by 2030 and by 2050 more than ×100-fold. This would represent an unprecedented rate of growth relative to 2019, even compared to those expected by other renewable-related technologies, such as those presented in Figure 1, such as Li-Ion batteries, photovoltaics (PV) and wind power.
As might be expected, most publications [6,7,8,9], etc., point out that, whilst there is a growing demand for hydrogen, the growth of this opportunity will ultimately be driven by its cost and the demands of our transition to a net-zero energy system. The cost of hydrogen from electrolysis is mainly driven by the use and price of electricity, as well as the capital cost of an electrolyser system itself. The raw data presented in Figure 2 obtained from Most, et al. [7] set out how the installed cost (i.e., the price of the electrolyser per kW) has reduced for alkaline electrolysis systems as a function of the total installed capacity.
It is quite common practice to present these data in the form of learning and experience curves. A learning curve typically relates to labour saving activities brought forward through doing repetitive operations, whereas an experience curve relates to the cost savings brought forward from increasing production volumes. These have been considered by researchers such as Bohn et al. [8]. Based on historical trends from across the renewable energy sector (Figure 1) and beyond [17], it would be expected that a similar trend would also be expected to continue for electrolysis systems. Indeed with the current price of hydrogen not competitive with fossil fuel equivalents, and with at least 228 large-scale hydrogen projects worth $70 billion across 30 countries now underway [9], a significant bet has been placed by national governments that this and other renewable energy trends will continue over the next 30 years. By following its extrapolation, the analysis demonstrates that hydrogen electrolysis systems could be expected to reach 60%–80% of their current prices as the installed capacity increases toward a hundred-fold scale-up.
Whilst there are different methodologies for developing experience and learning curves [8], they do represent a useful (albeit simplified) model for estimating a future installed price. For example, as in the case of those presented in Figure 1, Figure 2 is used to present a power law that has been fitted through historical data of electrolysis systems. This law is then used to extrapolate forward and out to the projected market sizes expected in 2030 and 2050.
When taking a more specific look at electrolysis, Figure 1 sets out different projections for the scale of the sector in 2030 and 2050 and the likely corresponding costs. The power law extrapolation shown is the same as that presented in Figure 1, albeit with a wider range of uncertainty shown with shading. The blue uncertainty band presented in Figure 2 has been added to demonstrate how sensitive the power law fit is to smaller and more recent datasets. For example, the upper bound is a fit only to the most recent five years and the lower bound only to the most recent three years. The fact this results in such a significant variance, with such significant implications to cost illustrates how sensitive these evaluations are to a narrow dataset followed by extrapolation.
The analysis by Bohn, et al. [8] (carried out for a PEM based system) typically follows a similar tend to the simple power law. Others, such as those by the Hydrogen Council (2021) [9] and IRENA 2020 [6], put forward alternative analysis which indicate a more aggressive reduction in price. In both cases, the authors suggest that a more optimistic learning rate should be put forward especially in the short term. This was justified on the basis that historically other renewable energy technologies have gone though a period of more rapid leaning at a similar development time to that currently observed across the electrolysis market.
1.2. The Electrolysis of Water to Produce Hydrogen
Water electrolysis has been around for about 200 years [18]. However, only in recent decades has it received significant interest for use in the energy sector.
Water electrolysis is a fundamental process relevant to all PtG concepts. When a direct current is applied to water, it is spilt into hydrogen and oxygen gasses. The theoretical minimum energy required to split a water molecule is equal to the Gibbs free energy of formation of water (G = 237.2 kJmol at room temperature) [13], also known as the lower heating value. The reversible voltage is calculated using Equation (1) [13].
where n is the number of electrons required, each mol of water requires two moles of electrons, hence n = 2. F is Faraday’s constant which equals 96,500 C/mol [13]. An electrolytic cell operates at a negative potential because the reactions require the addition of energy, hence [19]. Entropy is also generated when the water is split, hence the potential necessary for water electrolysis without withdrawing heat from the surroundings should be calculated using the change in enthalpy, ( kJmol) [13] rather than just . Using as opposed to from Equation (1). This gives the heat of water’s formation (also known as the higher heating value) and, hence, the practical water voltage required by electrolysis to be −1.48 V [19]. The voltage required from the term (−0.253 V) occurs on the hydrogen evolution reaction at high pH and on the oxygen side at low pH [19]. The ideal electromechanical efficiency for water electrolysis is 39.39 kWh/kgH, a number corresponding to the higher heating value [19]. PEM electrolysis systems operating at a low current density have a higher efficiency, however this results in less hydrogen being produced.
1.2.1. Electrolysis Types
There are three common types of electrolysis: proton exchange membrane electrolysis (PEM), alkaline water electrolysis (AEL), and solid oxide electrolysis (SOEC).
AEL was first introduced in 1789 [13] and is a well-established method of producing hydrogen with non-noble and low-cost materials [20]. However, AEL has a slow loading response and, therefore, takes a long time to start up (60 min [13]). This is not ideal in use alongside RES, as the electrolyser needs to be turned on as fast as possible to take advantage of periods where RES are producing an excess of power.
SOEC was first introduced in the 1980s by Donitz and Erdle [21]. It offers the potential for high efficiency and many other advantages. However, it is yet to reach the scales of PEM systems and only limited data are available to complete a techno-economic analysis [22].
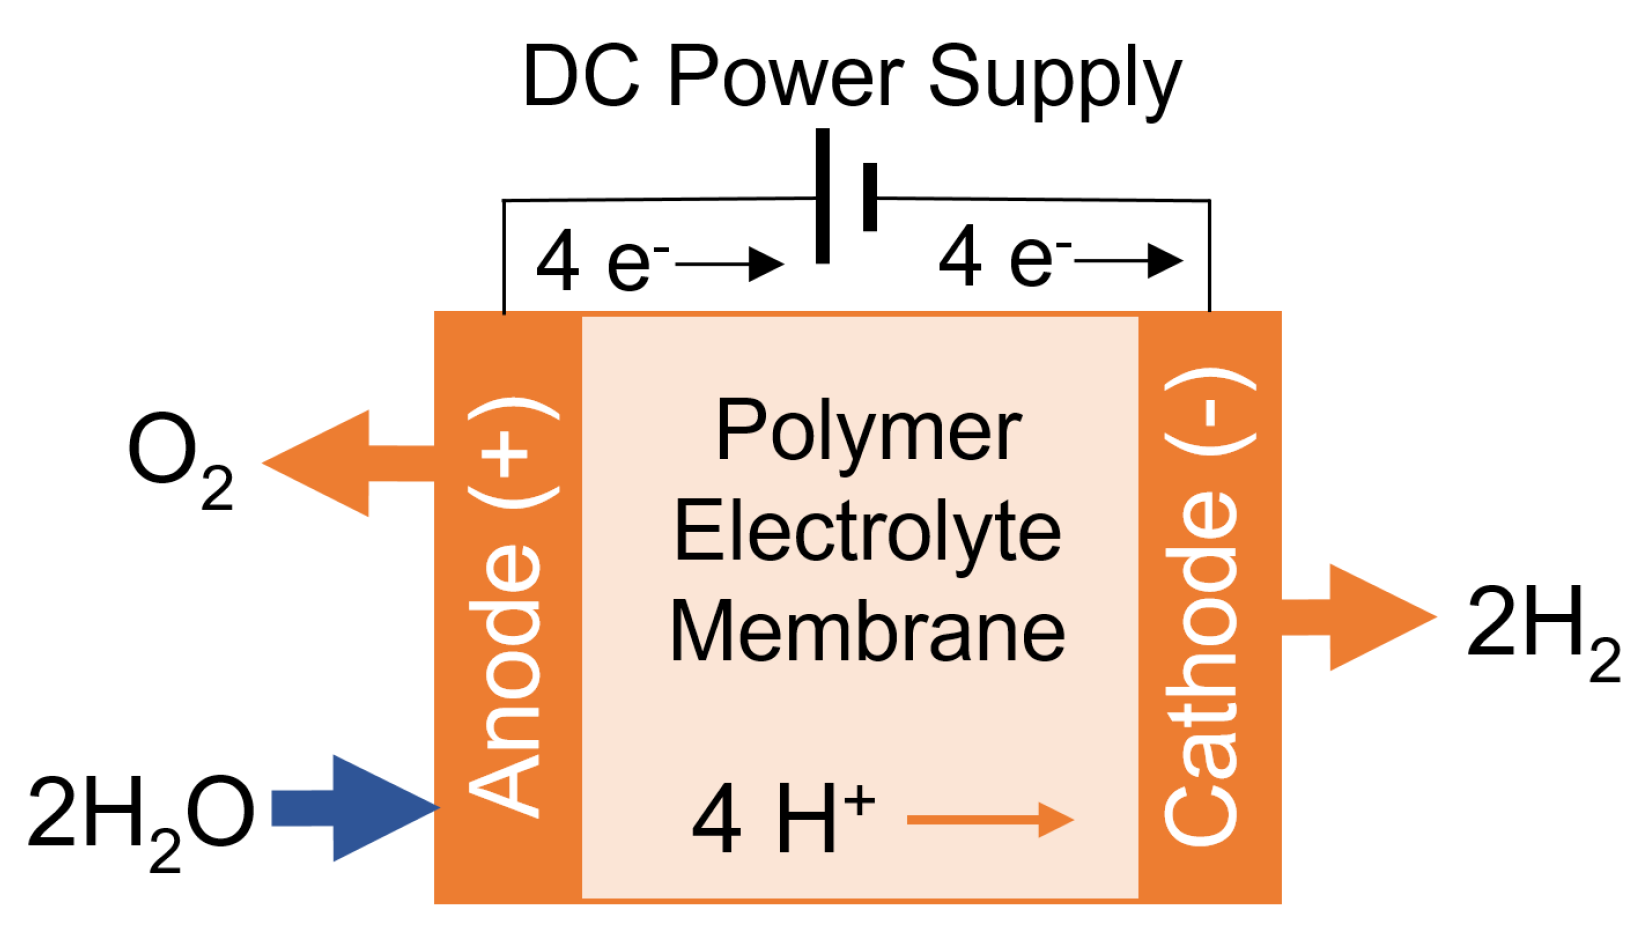
In a PEM, water is pumped to the anode and splits into oxygen, hydrogen ions (protons), and electrons. The hydrogen ions selectively move via a proton conducting membrane to the cathode. The electrons flow through an external circuit and provide the cell voltage for the reaction. The electrons and protons then combine at the cathode to form hydrogen gas. A schematic containing a PEM cell can be seen below in Figure 4. The half-reactions can be seen in Equation (2) [23].
A big challenge that PtG technology faces is the cost of the electrolysis process. Despite uncertainties regarding the cost of hydrogen production via electrolysis, it currently costs approximately $10/kgH compared to steam reforming, which costs $2.27/kgH [13].
One of the reasons for this high cost is the high capital cost associated with PEM electrolysis systems. However, it is expected that the capital cost of a PEM electrolysis system can be significantly reduced by achieving economies of scale via mass manufacturing. Currently the largest global PEM electrolysis factory can produce only 30 MW of capacity output per year [24] (equivalent to 150 units of 200 kW PEM systems). However, ITM Power have recently announced a project to develop a manufacturing factory to produce 1 GW of PEM electrolysis systems annually [24] (equivalent to 5000 units of 200 kW PEM electrolysis systems).
1.2.2. The Contribution of This Research
The challenge remains that whilst much of the analysis summarised in Figure 2 indicates that costs will reduce, it offers no direct physical basis or implementation plan for how many of these cost savings might be achieved in practice—it is generally assumed that they just happen regardless of the laws of physics or practical considerations. Furthermore, they also assume that there is no specific reason why the price of a system cannot continually become cheaper for example they may be limited by increasing scarcity of commodities, raw material, manufacturing or other design-related factors.
This article sets out to understand how hydrogen electrolysis and renewable hydrogen might achieve the benefits of reduced cost on a practical basis. This article presents a technical and economic model of a proton exchange membrane (PEM) electrolyser system. The model links the fundamental commodities required to build the sub-components, components, and system as a whole. It can be used to compute energy demand and expected performance. Each component has been costed and its future price estimated to quantify what cost savings might be achieved on a practical basis.
Ultimately, the outcome is novel as it represents a more “physics-based” evaluation of what a PEM electrolyser system cost might be feasible in the near to medium term at a ×10 and ×100 scale-up compared to a 2019 baseline. The analysis sets out the key sensitivities and demonstrates them in terms of their impact on the likely installed costs, as well as the future price of renewable hydrogen and its implications for the wider energy system.
The article then combines the results from the capital cost financial model with operating costs to provide a levelised cost of hydrogen (LCOH) from a life-cycle costing analysis. These results are then analysed to determine the importance hydrogen could play in the energy sector.
2. Methodology
The techno-economic model developed in this research was initially based on a similar methodology developed and then published by the National Renewable Energy Laboratory [25]. This work was carried out in 2015 and, as described in the introduction and visualised in Figure 2, a significant amount has now been learned and the scale and viability of the opportunity has grown notably in that time.
The model outlined below combines the results from a techno-economic model of a 200 kW PEM electrolyser manufacturing process, a 200 kW PEM electrolyser produced during that process, together with operating costs to provide a LCOH from a life-cycle cost basis. The technical details of the 200 kW PEM electrolyser being manufactured are set out in Table A7. The specific size of the system considered was identified on the basis that it was large enough to benefit from the economies of mass scale manufacturing whilst representing a single module in a larger system.
2.1. Capital Cost of an Electrolyser System
The capital costs (CAPEX) of an electrolyser system comes from the sum of the installation, balance of plant (BOP), and stack and indirect costs.
The indirect costs (such as research and development, administration, sales and marketing) were added to the total stack cost with a 50% mark-up [26]. Installation costs were also added to the system cost with a 33% mark-up [25].
2.1.1. Stack Cost
An activity-based bottom-up direct manufacturing costing model was used to calculate the cost of manufacturing the key components in the stack [25,27]. The cost of the stack ($/kW) is dependent on the power density of the cell, the material cost per cell area and the assembly cost. Activity based costing assigns overhead and indirect costs related to each component manufacturing process [28]. The key manufacturing components required to build the stack are: catalyst coated membrane (CCM), porous transport layer (PTL), seal/frame, bipolar plates (BP), and stack assembly (SA).
The key manufacturing cost parameters used were based on those of a U.S.-located manufacturing system [25] and are summarised and justified in Table A1 (Appendix A). The manufacturing model structured around the production of multiple 200 kW PEM electrolysis systems, these units are assembled using 102 individual electrolysis cells. The direct costs included in the model were associated with the materials, capital (manufacturing equipment), labour, energy, and scrap [25].
It was assumed that there was a separate assembly or manufacturing plant for each component of the stack, and that all plants were constructed from an empty building, i.e., equipment had to be bought and installed, etc.
The fixed cost components associated with the manufacturing process, including the capital cost of the plant (manufacturing equipment) and the building cost, were annualised, , using the capital recovery factor (CRF) [29]. Where i is the interest rate and n is the number of accounting periods.
The variable stack costs include material and labour costs. The labour costs [25] were estimated based on the hours of labour required to make a certain number of units. However, it seems unlikely to be able to employ a skilled worker in such a niche area on a temporary contract. Therefore, in this model the labour cost was estimated based on the minimum number of full-time workers (paid an annual wage) required to complete a certain number of units. The minimum number of workers required to run each factory line is shown in Appendix B.
Material costs were based on the average spot prices of commodities in 2019 and the total amount of material used.
All of the assumptions for each manufacturing process in the stack can be seen in Appendix B. Where there was limited information on the future parameters of each manufacturing process, a 20% improvement was assumed where reasonable. It was also assumed that the power density of a PEM electrolysis cell would increase by 2030 from 2.89 W/cm to 4.4 W/cm without hindering efficiency [30].
As a result, fewer cells would be required to make a 200 kW system, as shown in Equation (4), where N is the number of cells in the stack, S is the system size (W), is the power density (W/cm) and A is the cell active area (cm)
Therefore, the number of cells required to make a 200 kW system were estimated to be 67 cells in 2030 compared to 102 in the current case. The total annualised cost of each manufacturing process in the stack was then calculated by summing the fixed and variable costs associated with each process.
2.1.2. Balance of Plant Cost
The BOP is made up of the equipment and auxiliary systems that allow the stack to function [31] ranging from the water supply at one end to the hydrogen storage at the other. The cost of the BOP was based on relevant data published elsewhere [25]. In turn, these costs were based on quotes from parts suppliers and from experts in the industry (see Appendix E). It was assumed that for every ten times more units purchased there would be a 20% reduction in the cost of the BOP parts, similar to the average learning rate applied to PEM fuel cells [25].
2.2. Total System Costs
The BOP and stack costs were then combined along with the markup and installation cost to give the total capital cost of a 200 kW PEM system.
2.3. Life-Cycle Costing Analysis
Next, this research builds on this analysis by combining the CAPEX of the PEM electrolysis system with a life-cycle costing analysis (LCC) to provide a levelised cost of hydrogen (LCOH). An LCC involves the analysis of the costs of a system over its entire life span, including capital, operational, and management costs [32].
The operational costs (OPEX) of a PEM system consists of the feedstock costs and the operational and management costs. The feedstock cost is made up of the cost of water (which was found to be negligible) and the cost of electricity ($/kWh). The operational and management costs comprise general maintenance and the labour required to run the system and was assumed to be 5% of the total capital cost of the system each year [33].
When it came to calculating the annual cost of electricity, C Equation (7) was used.
where is the cost of electricity ($/kWh), is the amount of hydrogen (kg) produced annually, refers to the ideal efficiency of the PEM system (39.39 kWh/kgH) and refers to the efficiency of the electrolyser (%).
The cost of electricity was based on producing electricity from offshore wind since it is the UK’s most abundant and scaleable renewable energy source [34]. The levelised cost of electricity and capacity factor from offshore wind targets were published recently be IRENA [35] and were used directly in the analysis. These are presented in Table 1 alongside key electrolysis operating assumptions used for 2020 and various ×10 and ×100 scale-up assumptions [13,36].
The total capital cost of the PEM system (calculated from the CAPEX financial model) was annualised based on the total lifetime of the system to get the annual investment cost of the electrolyser, , the annualised total cost of the PEM electrolysis system was then calculated using Equation (8).
The LCOH was then calculated below using Equation (9).
The life-cycle costing methodology was chosen as it is a holistic universal method to evaluate investment opportunities.
However, critics say that it can lead to uncertain results due to the fact it includes future estimation [38]. However, this is necessary in this situation as hydrogen production from electrolysis is still in the development stage and as a result many of the fundamental costing data are based on uncertain assumptions.
3. Results
3.1. Capital Cost of PEM System
3.1.1. Individual Stack Process Costs
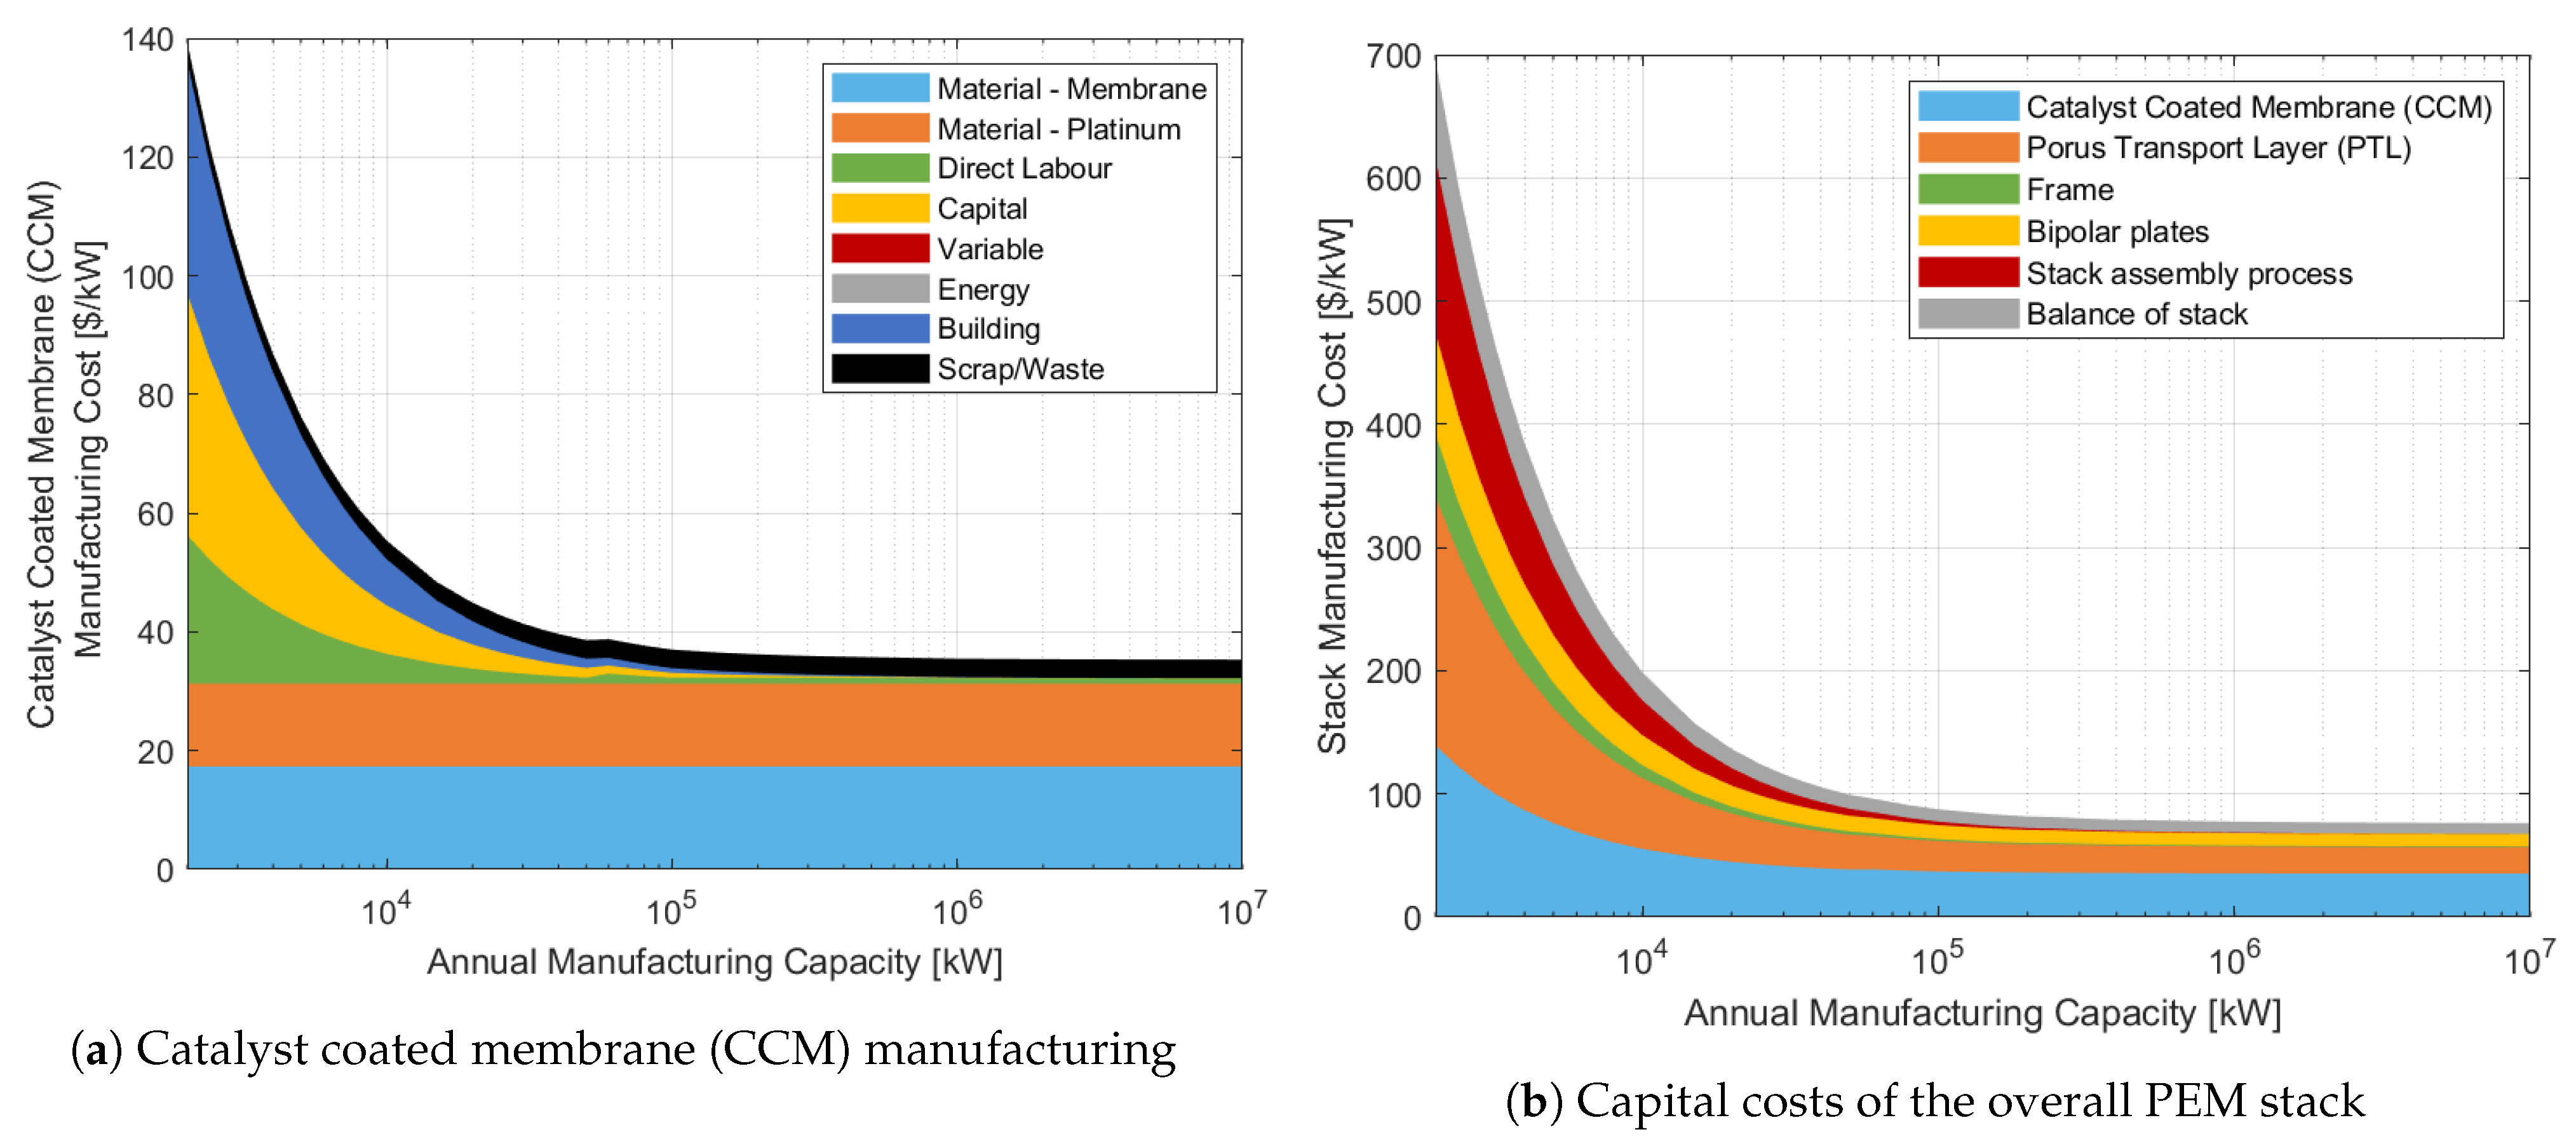
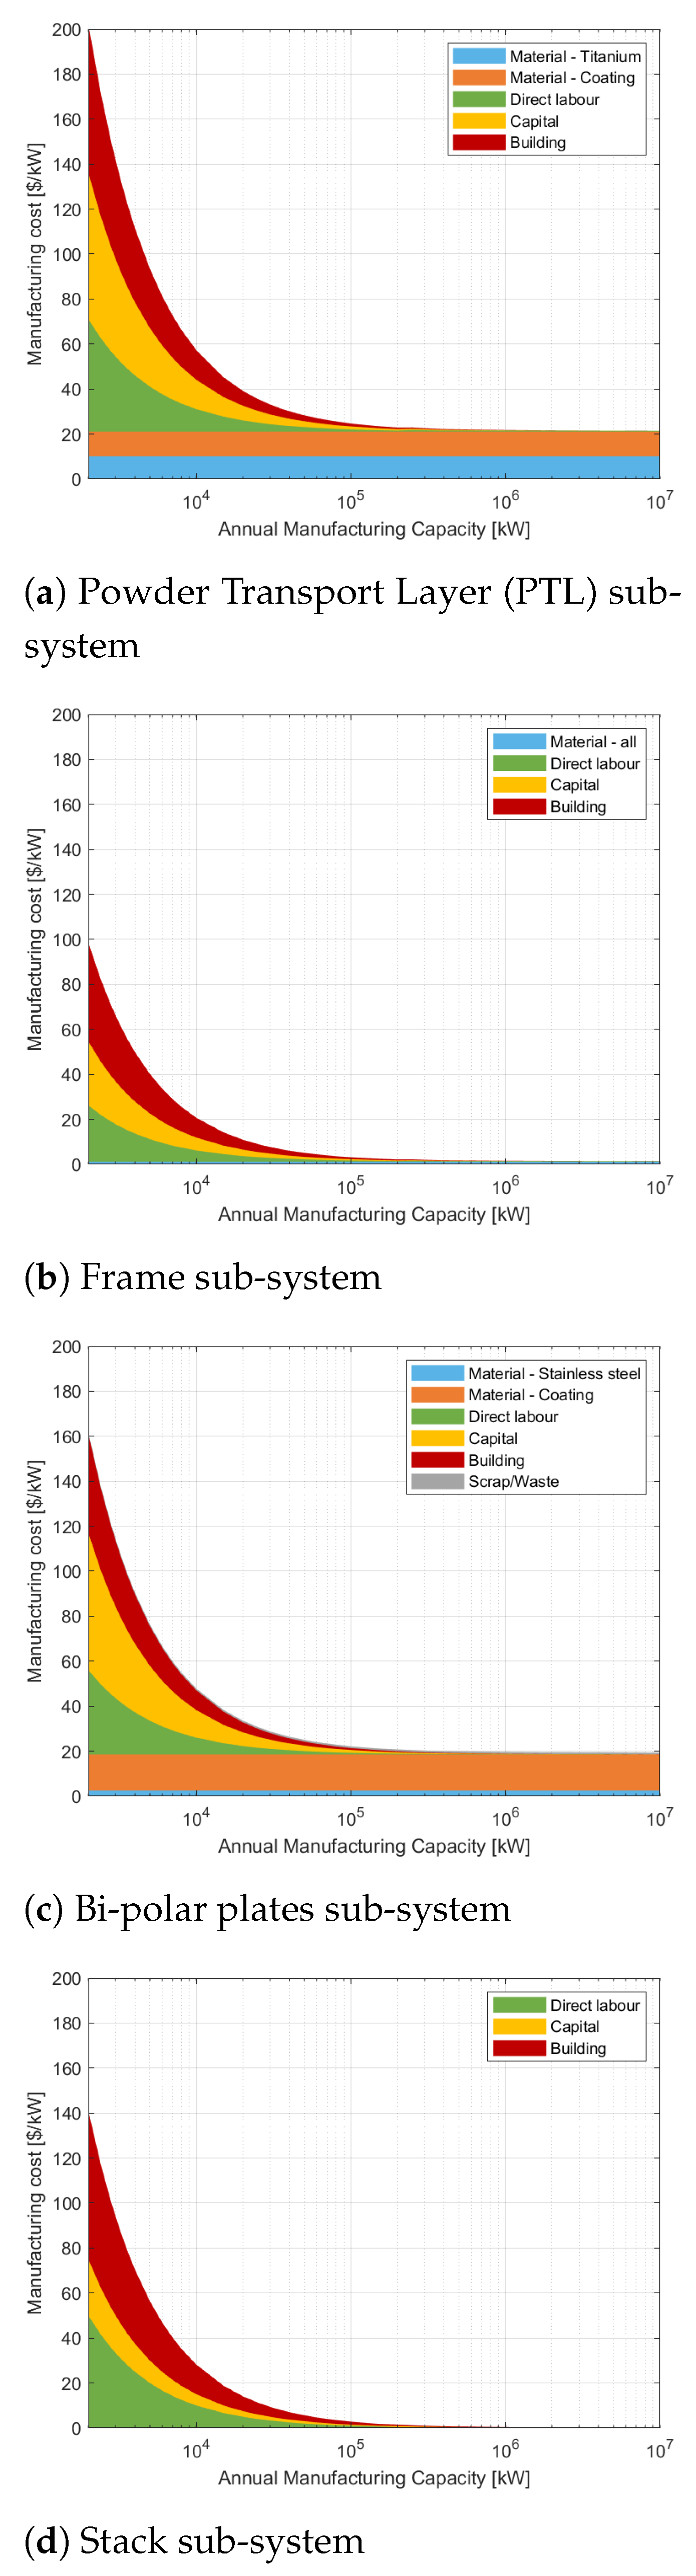
It was found for each stack manufacturing process that cost reductions were substantial with economies of scale. The results from the CCM manufacturing model in the 2020 case are shown below as an example. The results from the other manufacturing processes can be seen in Appendix C and follow very similar outcomes.
It can be seen from Figure 5a that fixed costs (building and capital) dominate the cost of the CCM process (and all the other stack processes) at a low number of units. For example, at a production rate of 10 units per year, the fixed costs account for approximately 75% of the total process cost. However, economies of scale can significantly drive down the manufacturing cost of the CCM and other stack processes by splitting the fixed cost over a larger number of units. It can be seen from Figure 5a, that at a production rate above 300 units per year, the material costs (platinum group metals, ionomer and Nafion membrane) completely dominate the CCM manufacturing cost and there are no longer any cost reductions to be made from economies of scale beyond this manufacturing rate.
3.1.2. Overall Stack Process Costs
The overall stack cost (sum of each manufacturing process) for the current case can be seen in Figure 5b.
The life-cycle costing methodology was chosen as it is a holistic universal method to evaluate investment opportunities.
It can be seen from Figure 5b that economies of scale can reduce the total capital cost of the stack by 90% from an annual production rate of 10 units (695 $/kW) to 5000 units (80 $/kW). Once economies of scale have been achieved (>300 units) the total cost of the stack is dominated by the materials required, all variable costs, in the CCM, PTL, and bipolar plates manufacturing processes.
The stack assembly process has minimal variable costs and, therefore, benefits most from economies of scale. The stack assembly process reduces from 140 $/kW based on 10 units per year to 0.10 $/kW based on manufacturing 5000 units per year.
3.1.3. Overall System Cost
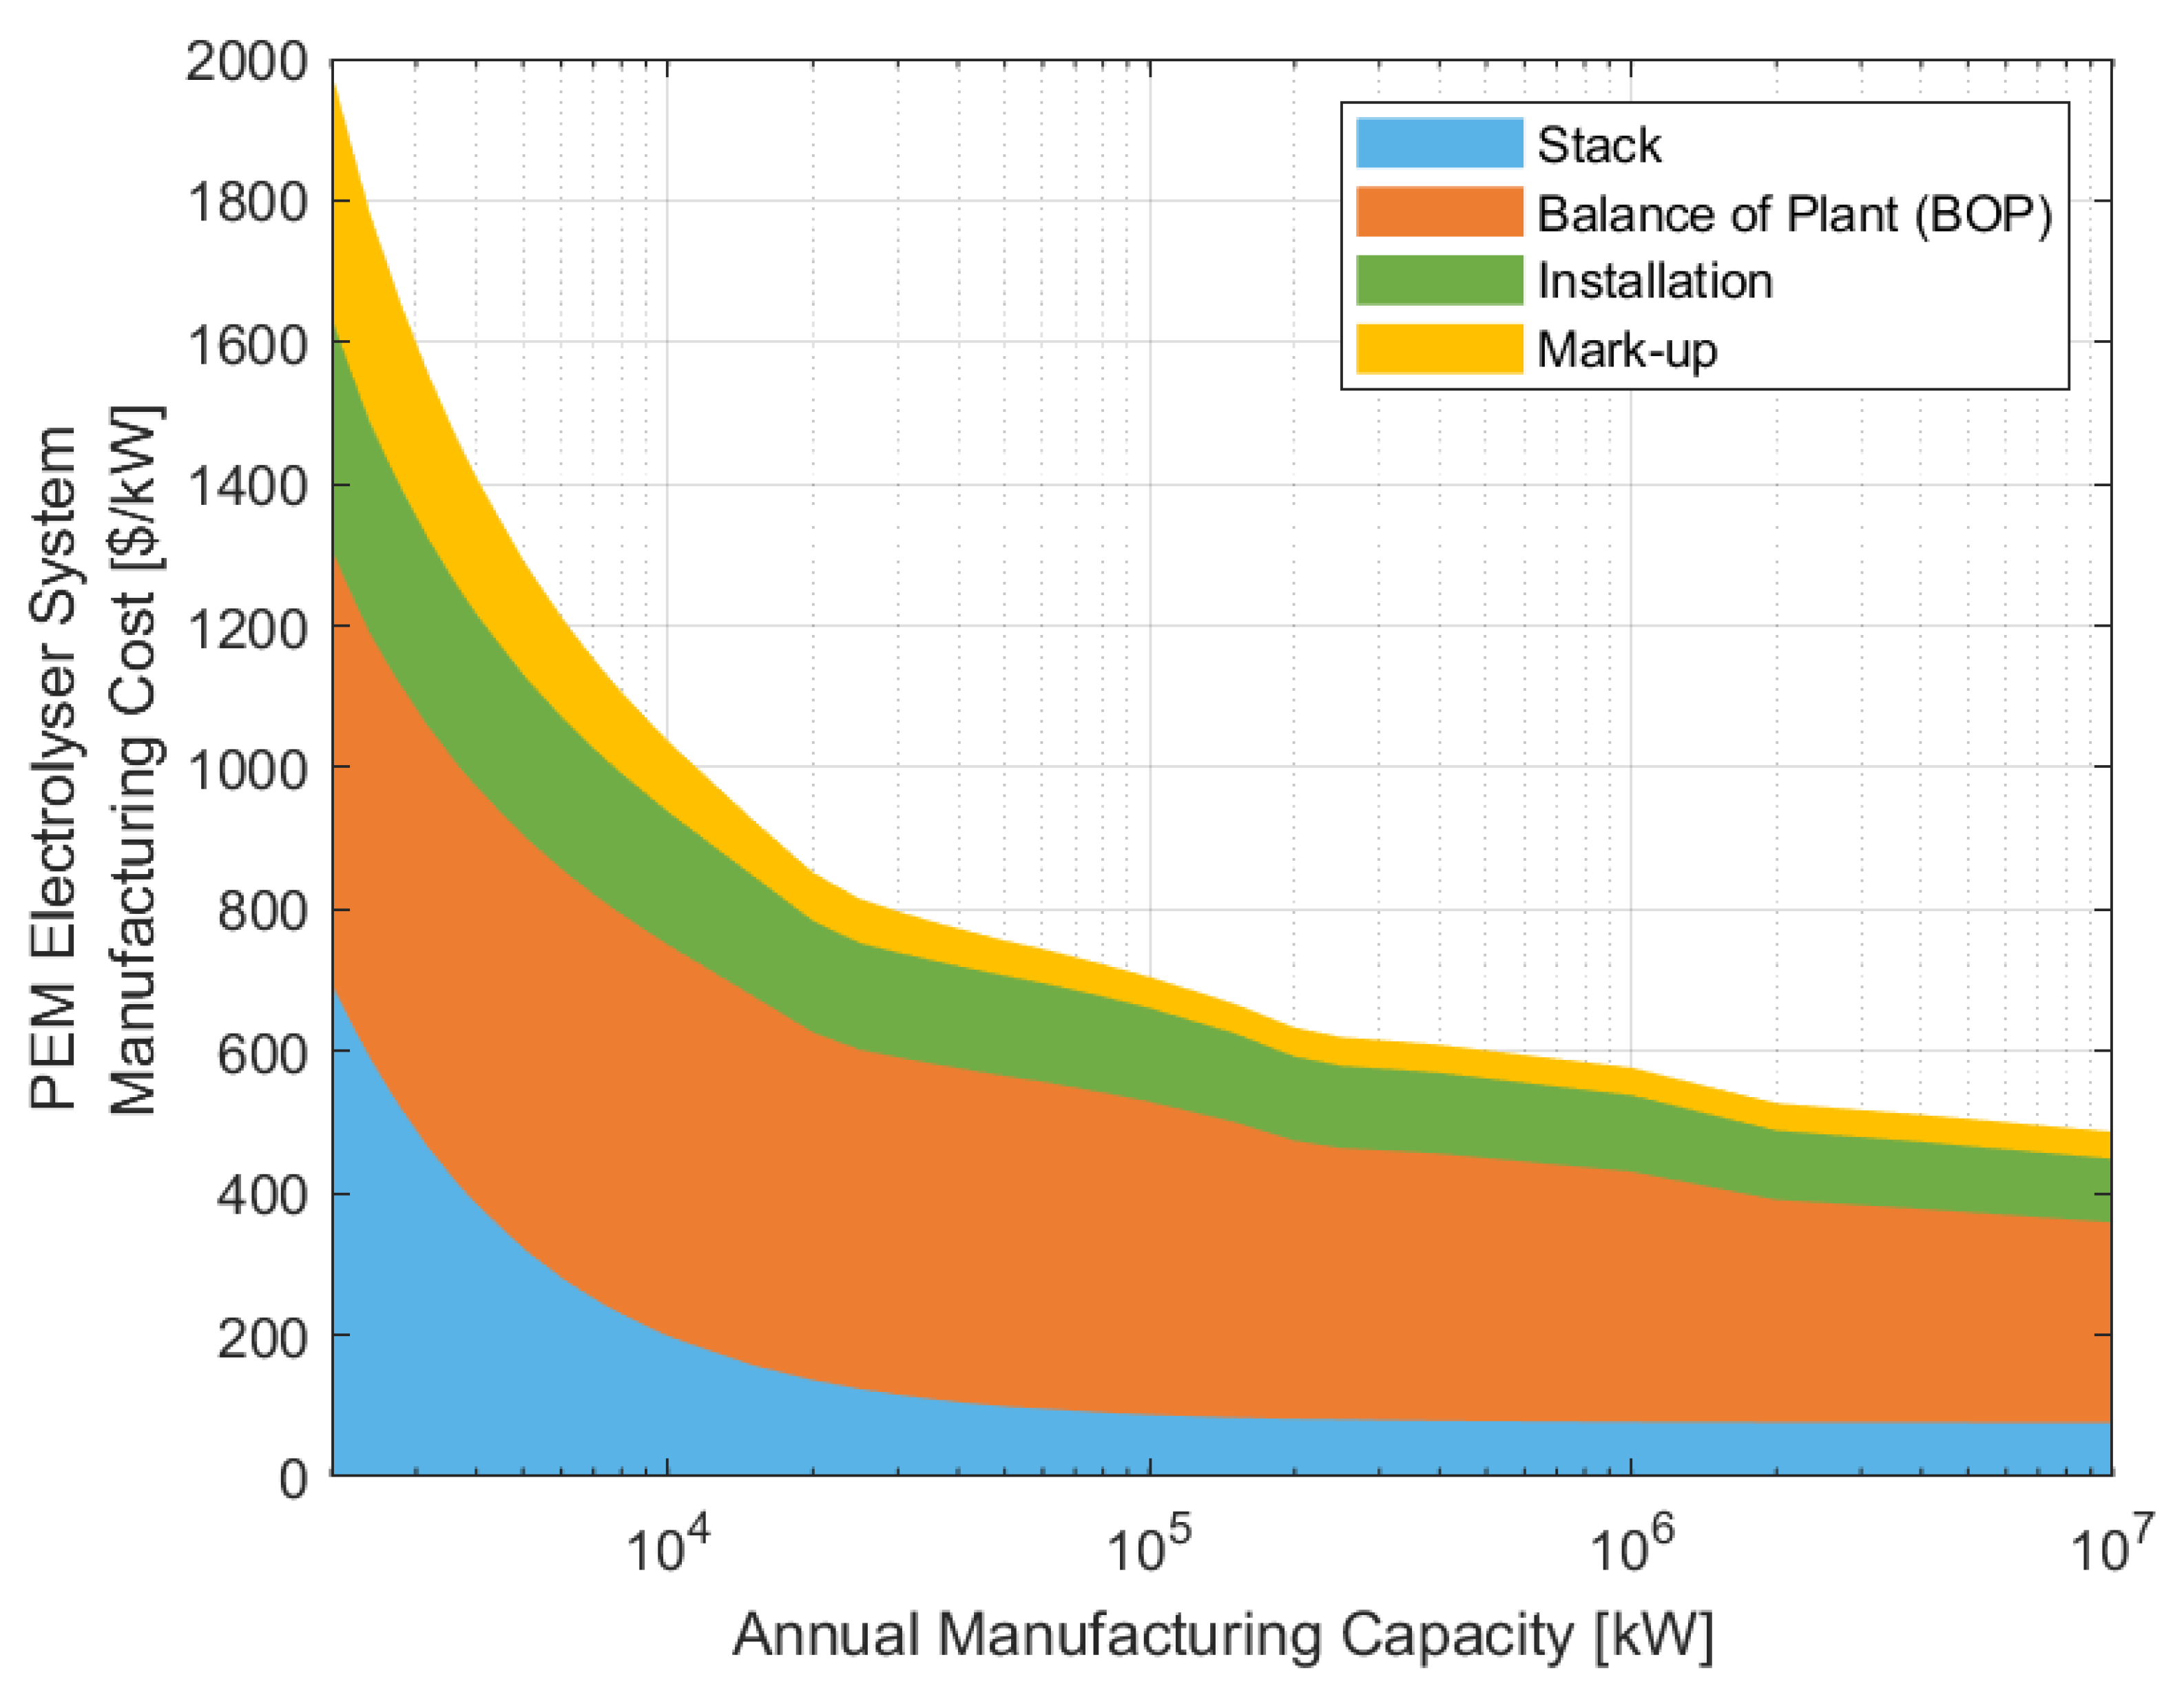
The stack cost was then combined with the BOP cost, the installation factor and markup factor to produce a total system cost ($/kW) for a PEM electrolyser system, as shown in Figure 6.
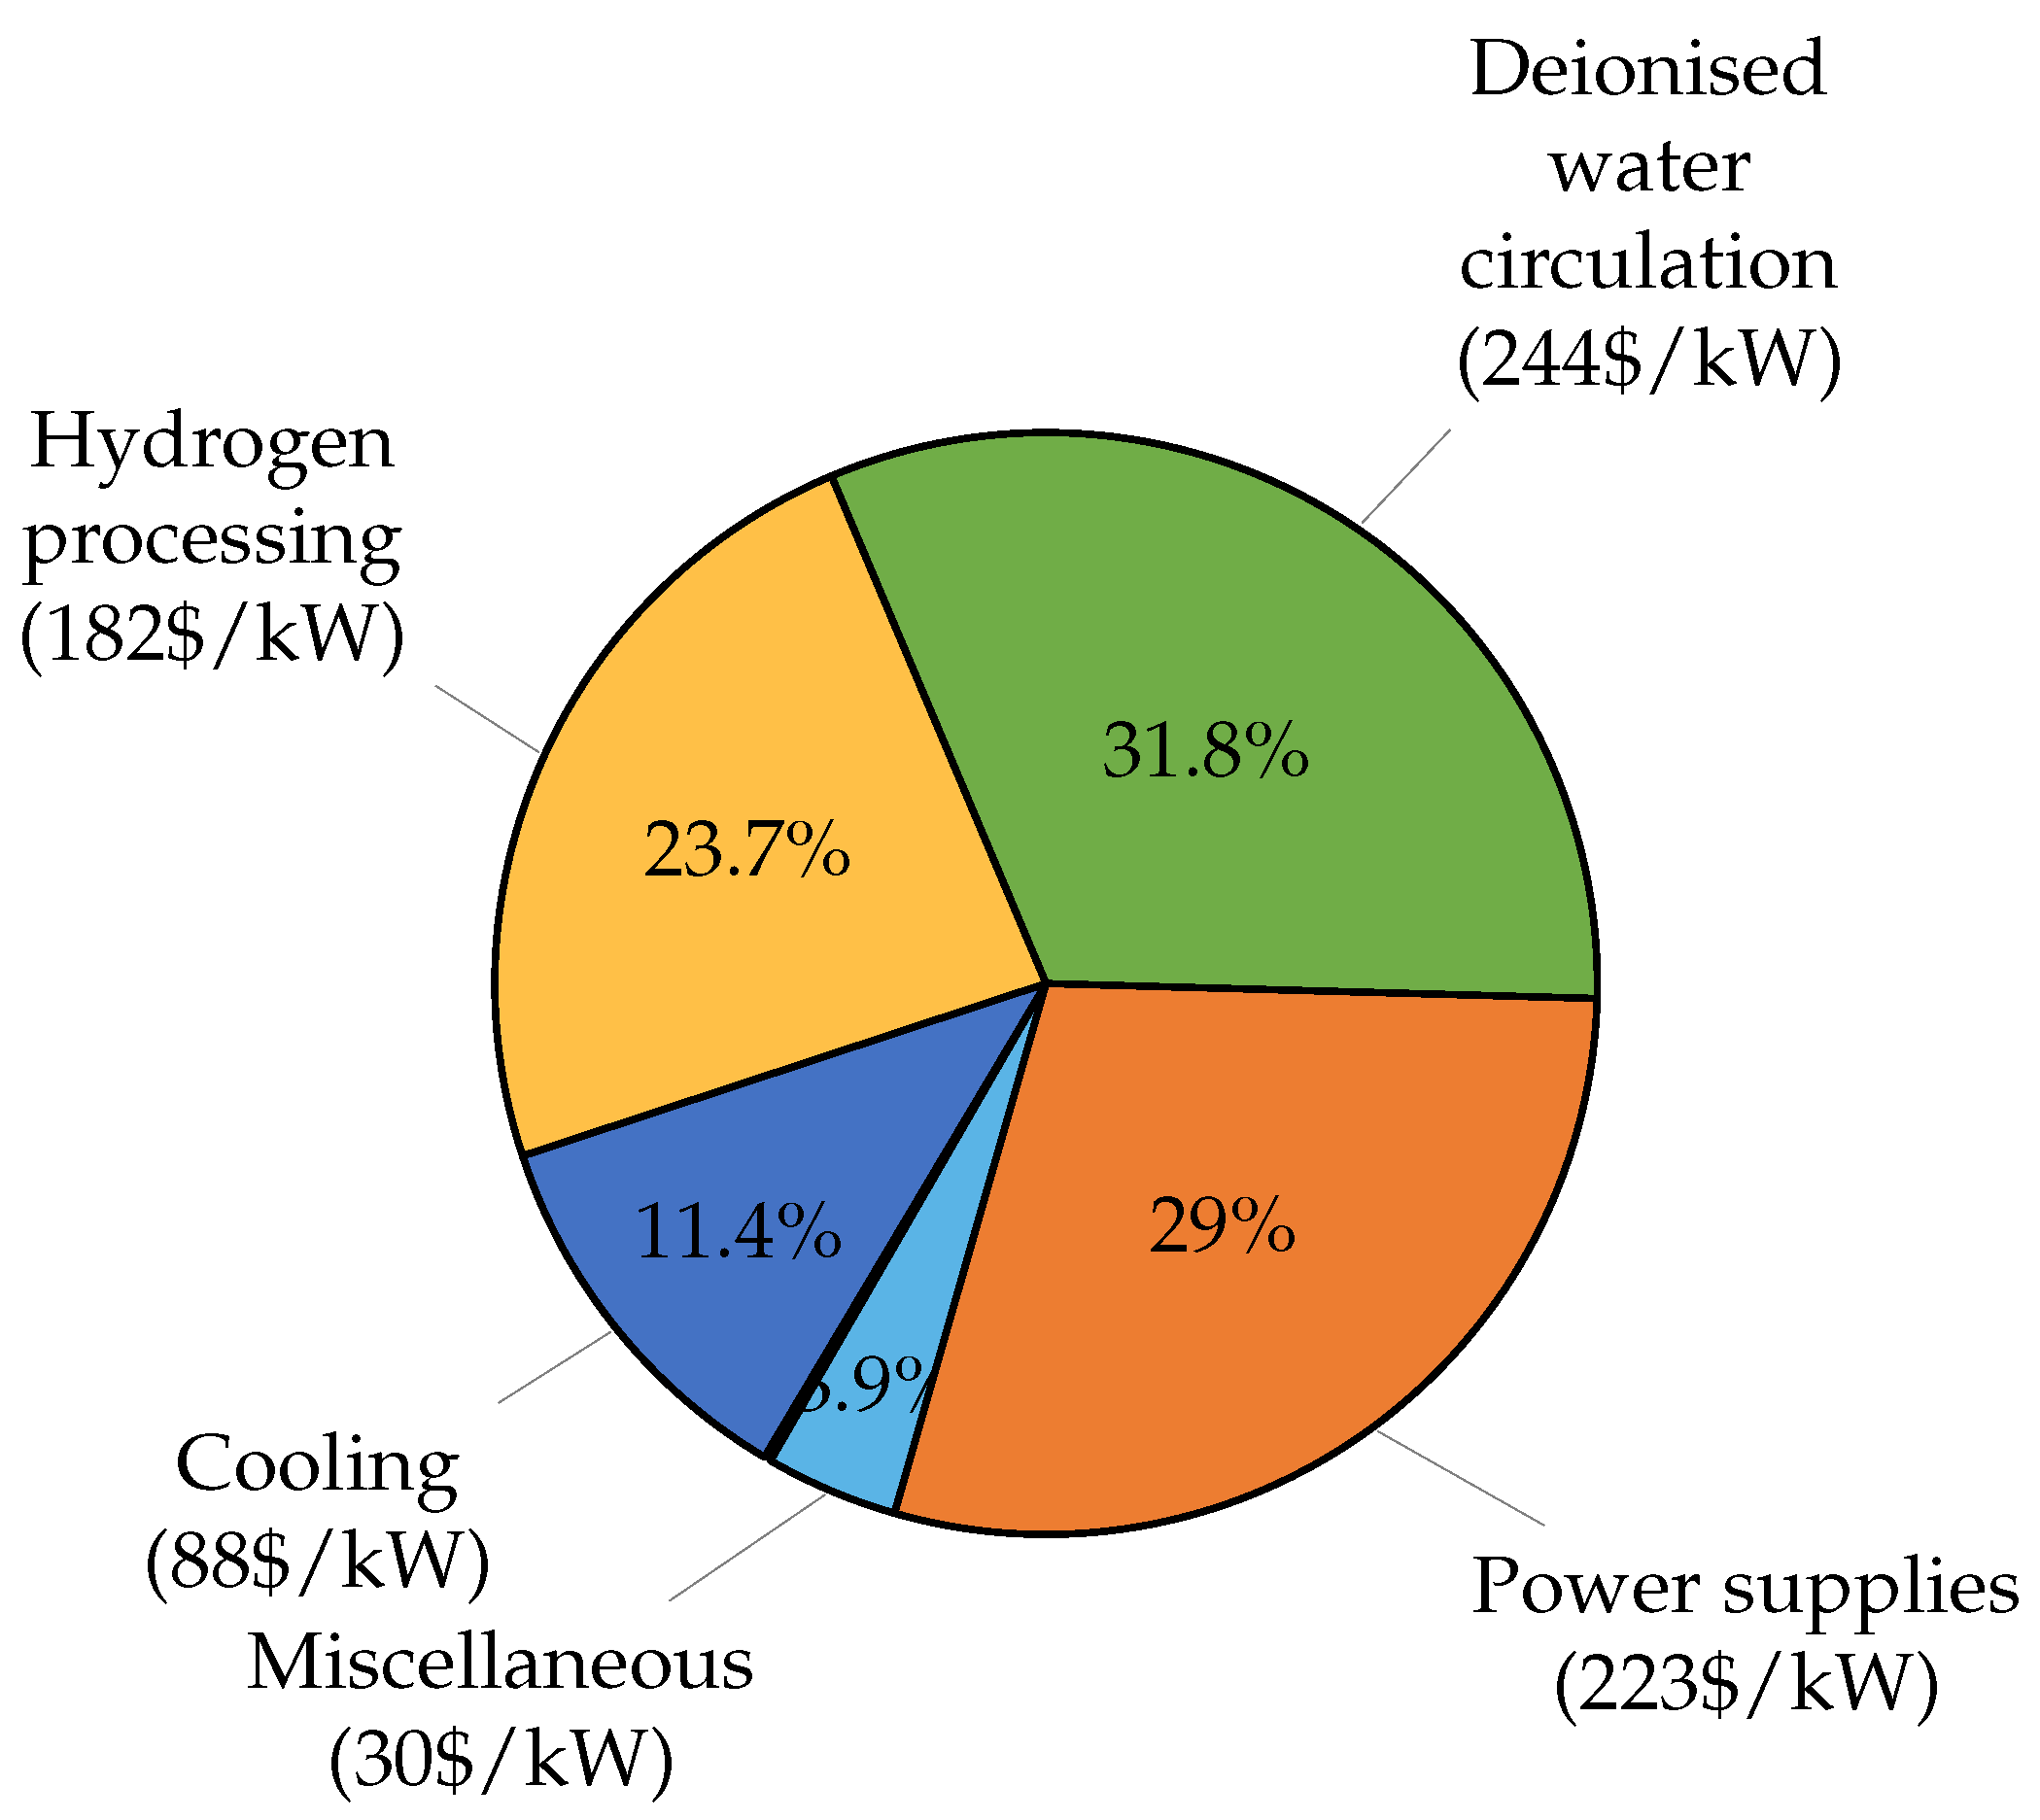
It can be seen from Figure 6 that the total capital cost of the system can reduce by 70% from 1990 $/kW (10 units per year) to 590 $/kW (5000) units per year. This is equivalent to a learning curve of 13%, the same value as published in a McKinsey report commissioned by the Hydrogen Council [14]. It can also be seen that the BOP cost accounts for approximately 80% of the total system cost beyond 200 electrolysis system units per year once economies of scale have been realised in the stack. Figure 7 shows the breakdown of the BOP cost ($/kW) based on the production of one unit per year, i.e., no price scaling has been performed.
Figure 7 shows that the deionised water circulation accounts for 32% of the total BOP cost. This is because an oxygen separator tank was chosen (see Appendix D). An alternative cheaper tank that simply releases oxygen to the atmosphere is about 25% the cost of the separator tank [25]. Based on a production rate of 10 units per year, using the alternative tank would reduce the capital cost of the system by 4 $/kW. However, whilst capital savings are made the oxygen can no longer be sold as a by-product.
This is an example of how various options exist for BOP parts and how they have a large influence on the total PEM electrolyser system cost.
3.1.4. Comparison of Current and Future System Capital Costs
A comparison of the future and current system costs can be seen in Figure 2.
The capital cost is 590 $/kW for the 2020 current case. Two further scenarios were a CAPEX of 431 (±50) $/kW for the ×10 scale-up in installed capacity case and a CAPEX of 300 (±50) $/kW for the ×100 scale-up in installed capacity case.
The most credible estimates for this scale-up are detailed in Table 1 alongside the explanations and justifications as follows:
- Improved balance of plant (BOP) cost and efficiency: These benefits will come through a BOP capital and operational cost reduction. As presented in the breakdown presented in Figure 7, gas processing, cooling, power supplies, and water processing would all be considered to be well established in conventional industrial or power generation sectors and typically become more cost effective as they are scaled up. The ×10 scale-up in installed capacity case assumes that the BOP costs can be improved by 60 $/kW;
- Symbiosis and heat recovery: Additionally, as low-grade heat is the principle waste product, opportunities for heat recovery and utilisation can also be exploited [39]. Hydrogen compression via sorption technology also represents an opportunity for direct recovery and utilisation of heat from the PEM system [40]. The ×100 scale-up in installed capacity case assumes that the installation of symbiotic technology costs can be improved by 20 $/kW. The ×100 scale-up in installed capacity case assumes that further savings can be achieved through larger systems increasing by 30 $/kW;
- Advanced electrolysis system operational pressures: It is likely that improved PEM electrolysis systems could deliver a higher pressure hydrogen gas as an output, as such there is the potential to reduce the need to perform mechanical compression (in total or in stages) to achieve practical storage pressures (current included in BOP costs). This would improve the overall system energy consumption and reduced CAPEX for the hydrogen compressor. The ×10 scale-up in installed capacity case assumes that the BOP costs can be improved by 79 $/kW and a further 79 $/kW at ×100 installed capacity scale-up;
- Novel electrolysis system designs: Electrolysis systems based on the PEM stack arrangement presented in Figure 4 has been the focus of this article. Fundamentally, a stack arrangement for PEM stack systems have reached a sufficient level of maturity such that it can be scaled-up. However, the layout and its design is material intensive and it has the limitation that it typically scales-up in a modular and linear way;In the long term, there is the possibility that other electrolysis technologies and arrangements, such as those presented by Grader et al., [37] may well offer more potential for deployment at the 1MW+ scale. These designs perform water electrolysis process in two stages. By decoupling the two reactions, this could potentially offer a greater efficiency (95%), with the co-benefits of being more scaleable and operating at higher hydrogen production pressures (up to 100 bar). The ×100 scale-up in installed capacity case assumes that the stack and wider BOP costs can be improved by 80 $/kW.
3.2. A Levelised Cost of Hydrogen Analysis
3.2.1. The Value of Increasing to Mass Manufacturing Scale
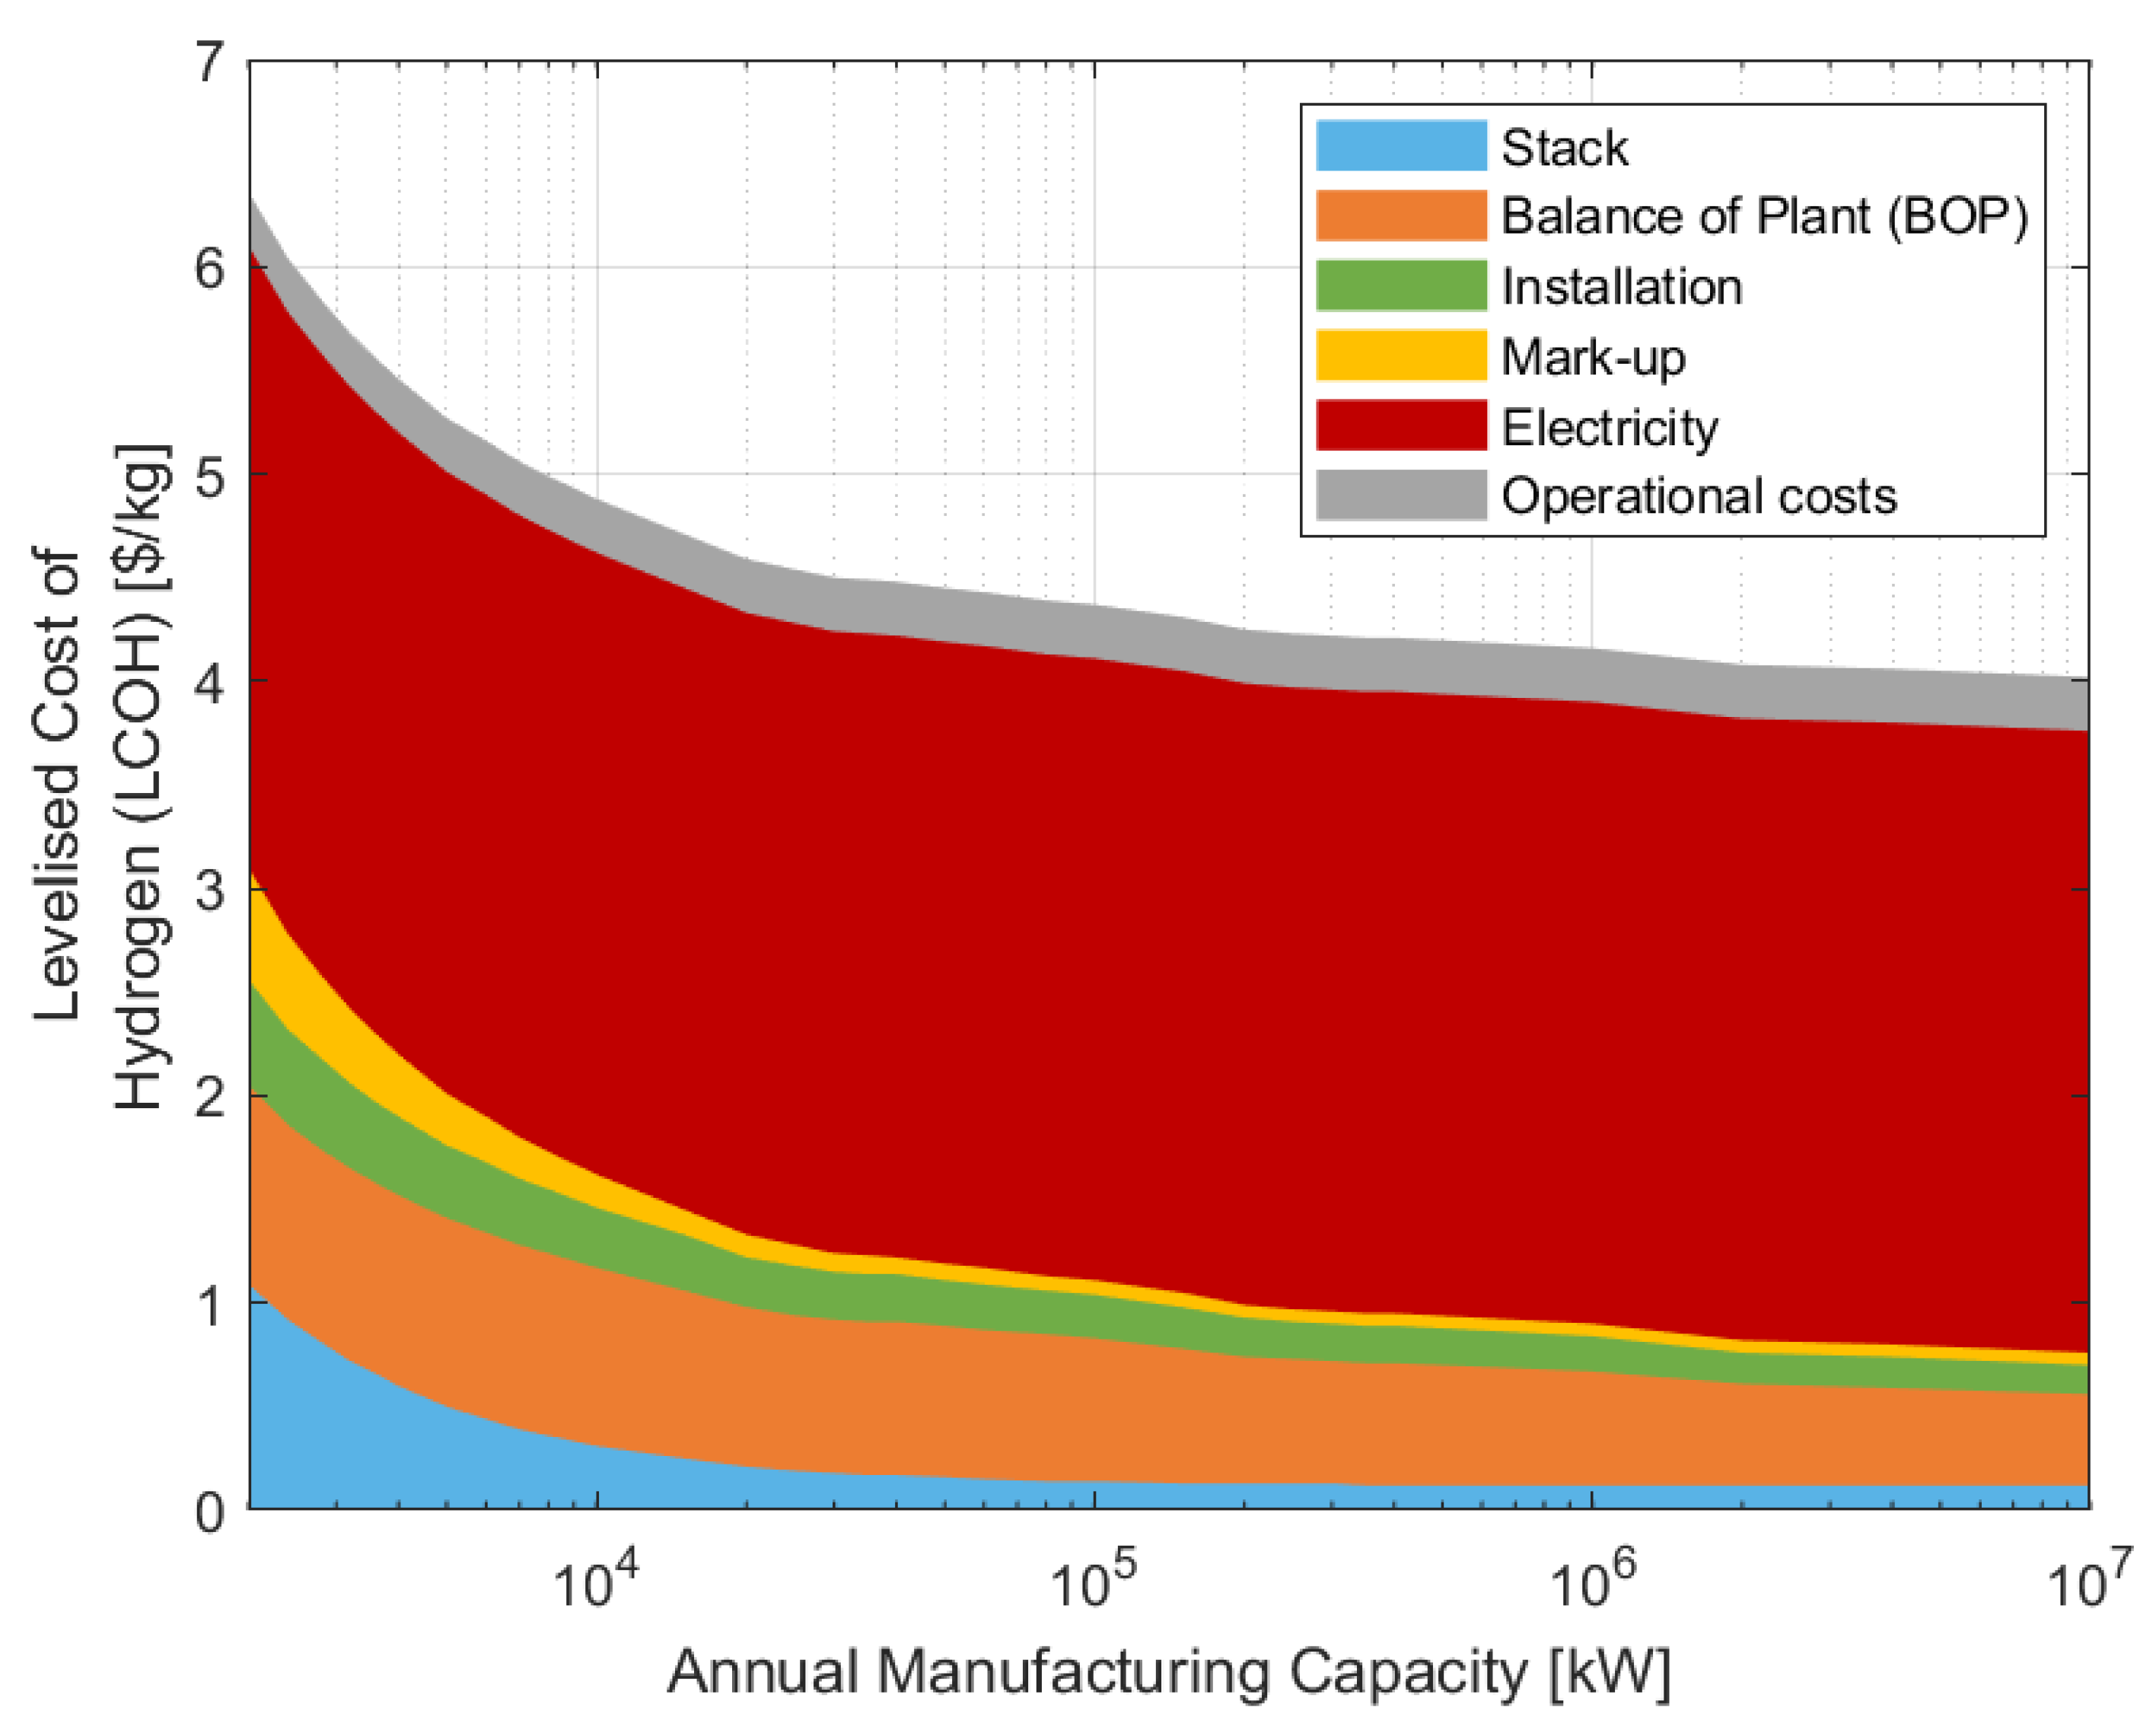
The results from the life-cycle costing analysis were used to plot the LCOH versus the number of units to determine the impact that mass manufacturing has on the cost of producing renewable hydrogen from PEM electrolysis.
The key operating assumptions associated with the PEM electrolysis system and the operation it uses are shown in Table 1.
The data presented in Figure 8 set out the LCOH as a function of manufacturing, installation, mark-up, operational, and electricity costs as a function of manufacturing capacity (kW). At smaller manufacturing capacity, the overall proportion of the cost associated with the PEM electrolysis system itself has a larger contribution and this diminishes as capacities grow. Indeed, once capacities have exceeded kW per year, the contribution associated with electricity cost is the most dominant factor for hydrogen production.
In the analysis, there is an assumed fixed price of 3.00 $/kg, based on a LCOE of 0.06 $/kW and an efficiency of 50 kWh/kg (see Table 1). This is an external cost and, thus, is irrespective of the number of units produced.
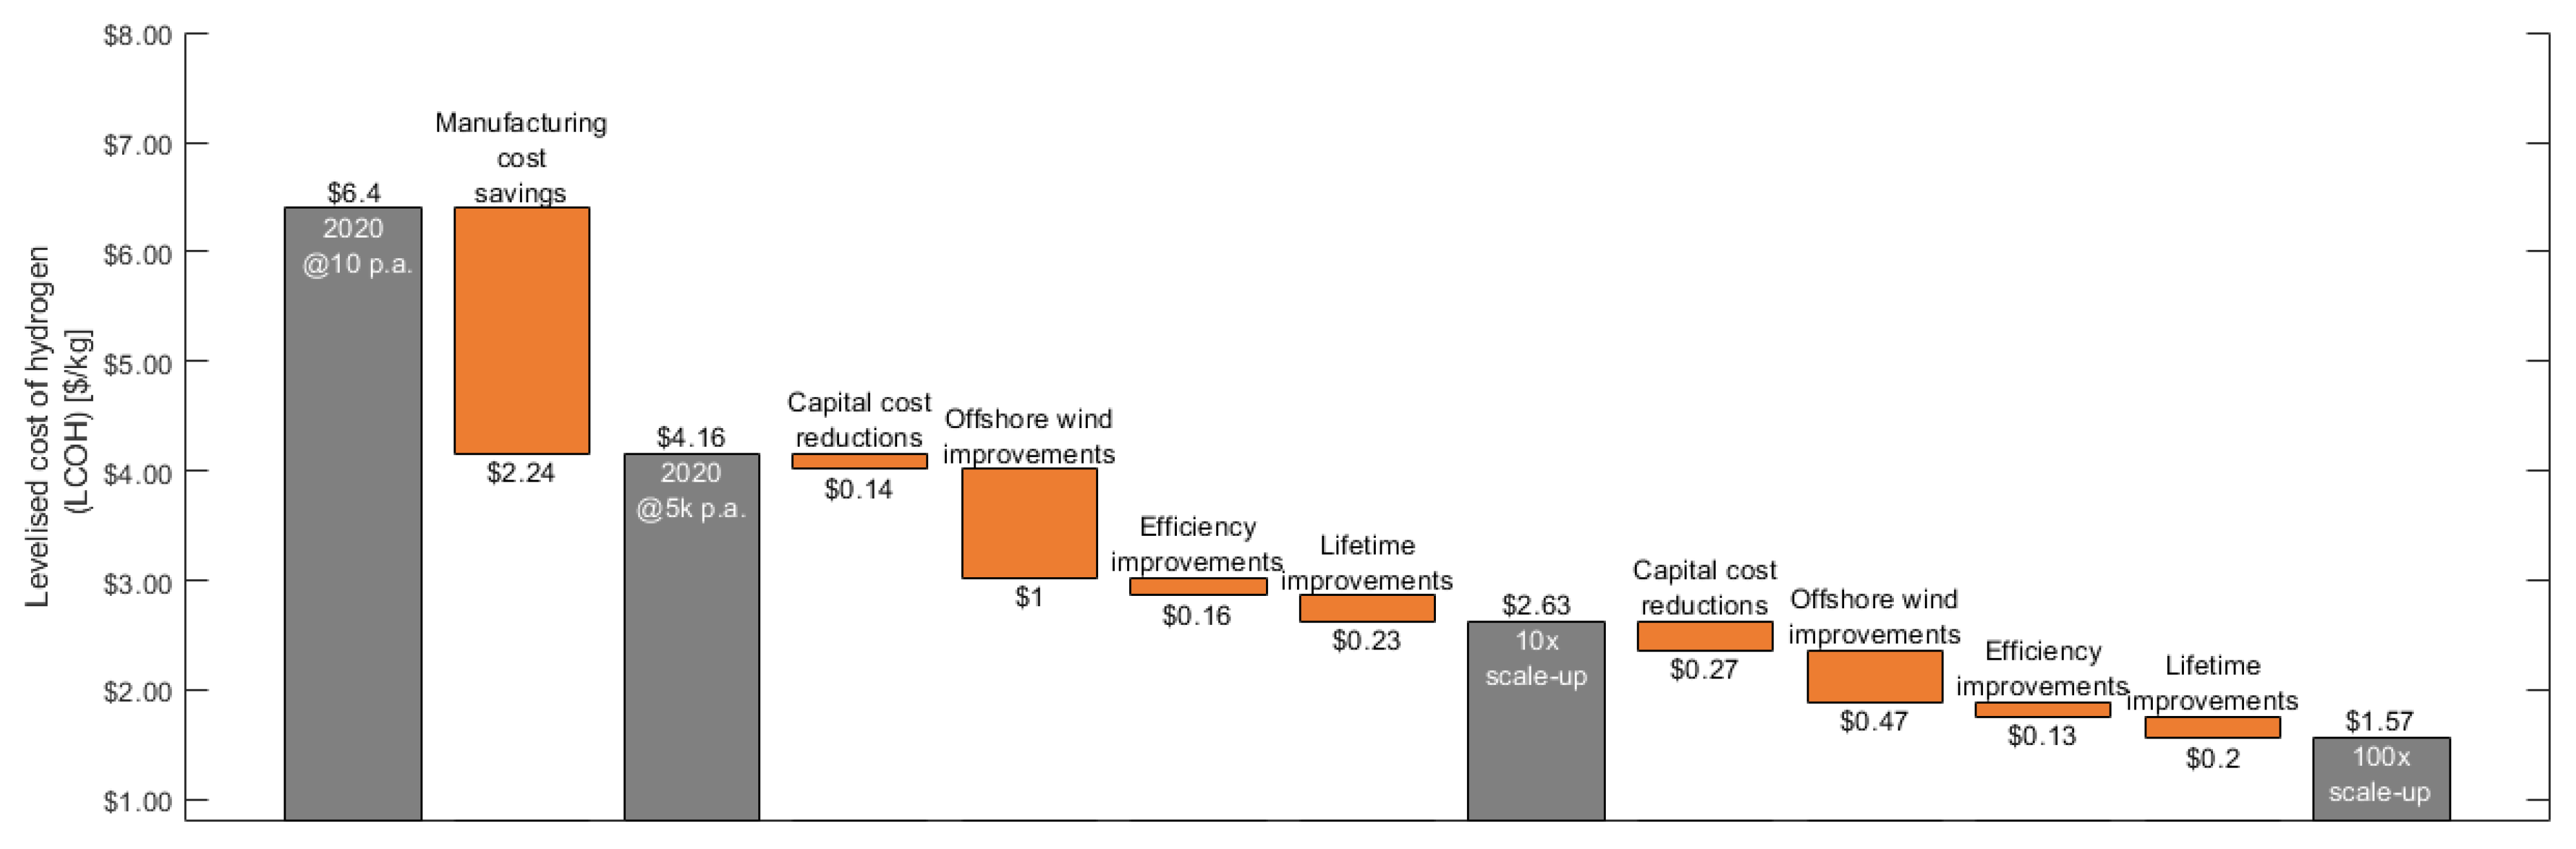
The overall cost reduction due to the savings met by mass-manufacture is summarised in Figure 8 and Figure 9. The LCOH can come down from 6.40 $/kg, based on an annual production rate of 10 units, to 4.16 $/kg, based on 5000 units, which is a 37.5% reduction in cost. The results for the LCOH in this report are similar when compared to the results of other techno-economic analyses performed for PEM electrolysis systems and the prospects for scale-up [25,35,41].
As presented in Figure 6, the opportunities for improved savings as a function of manufacturing scale-up in terms of the stack, mark-up, and installation costs appear to be limited. Most notably the costs associated with the stack remains generally flat beyond the kW annual capacity scale—indeed much of this cost is associated with the cost of raw materials.
It then follows that the most promising candidates for achieving further cost savings are primarily associated with improving lifetimes, reducing energy cost (or use) and the balance of plant (BOP).
3.2.2. The Impact of a Ten-Fold Scale-Up of Installed Capacity
To explore the possibilities associated with what are largely technical advancements into PEM electrolysis technology and its wider system, the 2020 scenario was then compared with two further scenarios based on a 2030 (and beyond) timescale and a ten-fold and one-hundred-fold installed capacity scale-up.
The assumptions are detailed in Table 1. Any assumption estimating the potential future performance of an engineering systems is subject to uncertainty. As such, an upper and lower bound have been included to demonstrate the sensitivity of the estimates to their assumptions. These assumptions have been applied on the basis of expected system technical advancements, operational parameters, and any perceived variances in these figures. The figures are loosely based on similar parameters put forward by other authors [25,35,41].
The result of the baseline scenario is summarised in Figure 9. The analysis shows that the LCOH will reduce significantly as installed capacity increases. During this time, it is assumed that manufacturing plants would typically continue to have an annual production of 5000 units. However, whilst the production line would remain largely unmodified (and its value), the technology would benefit from some further savings to capital costs, a reduced offshore wind cost, improved overall efficiency and an extended lifetime.
As presented, the largest factor responsible for the drop in the LCOH from a current scenario compared to the ten-fold scale-up is the improved costs and capacity factor associated with parallel developments in offshore wind turbine technology (see Table 1) based around a 2030 timeline. Improvements in wind turbine technology are responsible for reducing the cost of hydrogen by 1.00 $/kg which makes up 65% of the reduction in the LCOH.
The increase in the lifetime of the PEM stack (from 60,000 to 80,000 h) reduces the LCOH by 0.23 $/kg. In other terms, this means that the installed system produces 33% more hydrogen over its lifetime, spread across the same capital investment.
The next largest factor in the reduction of the LCOH is the improvement in the efficiency of a PEM system, reducing the LCOH by 0.16 $/kg. Improvements in the efficiency of an electrolyser reduces the amount of electricity required to produce a kg of hydrogen (46 kWh/kg for an 86% efficiency compared to 50 kWh/kg for an 80% efficiency).
The reduction in the capital costs of a PEM system were taken from the installed costs mainly associated with the BOP and this was responsible for a 0.14 $/kg reduction in the LCOH.
3.2.3. The Impact of a Hundred-Fold Scale-Up of Installed Capacity
The current timescale set-out by those nations leading the transition to net-zero is the middle of the 21st century. As such, the opportunity associated with a 2050 scenario has also been explored. Nominally, as presented in Figure 2, the installed capacity for hydrogen electrolysis in 2050 would represent more than a hundred-fold scale-up.
As would be expected, the assumptions associated with a hundred-fold scale-up scenario carry an even greater degree of uncertainty than those of a ten-fold scale. Nevertheless, beyond the the design of the electrolysis stack itself, utility scale renewable hydrogen production shares a significant number of key sub-systems which are common within conventional thermal engineering industrial or power generation plants.
As with the scale-up by ten-fold, electrolysis cost savings will come from an improved electrolysis efficiency, improved system lifetimes, and a reducing cost of renewable electricity. Nevertheless, there are further opportunities which can be advanced in terms of the scale-up of the electrolysis plants themselves from the 1 MW to 100 s MW scale.
The results of the baseline hundred-fold scale-up scenario are presented in Figure 9. Again, the contribution associated with CAPEX savings, renewable energy cost reductions, efficiency improvements, and system lifetime improvements are presented.
The baseline scenario indicates a LCOH of 1.57 $/kg with a range between 0.95 $/kg and 2.22 $/kg.
4. Discussion
4.1. Implications on the Wider Energy System and Reaching Net-Zero
The implications of the techno-economic analysis presented above on future energy systems is discussed in this section. Developing pathways to achieving net-zero is commonplace and often there are multiple competing technical solutions which can deliver this as part of a decarbonised national energy system [1]. In general terms, it is generally considered that the lower the price of ’green’ hydrogen that can be achieved, the easier our transition to net-zero is as some of flexibility and resilience currently offered by fossil fuels can be retained.
Nevertheless, comparisons between fossil fuel, hydrogen, or electric (usually Li-ion battery)-based solutions require a notable number of additional assumptions about local infrastructure, energy prices, and policy. This is often because these competing solutions are not likely to deliver quite the same value or benefits as each other and a unique choice may need to be made.
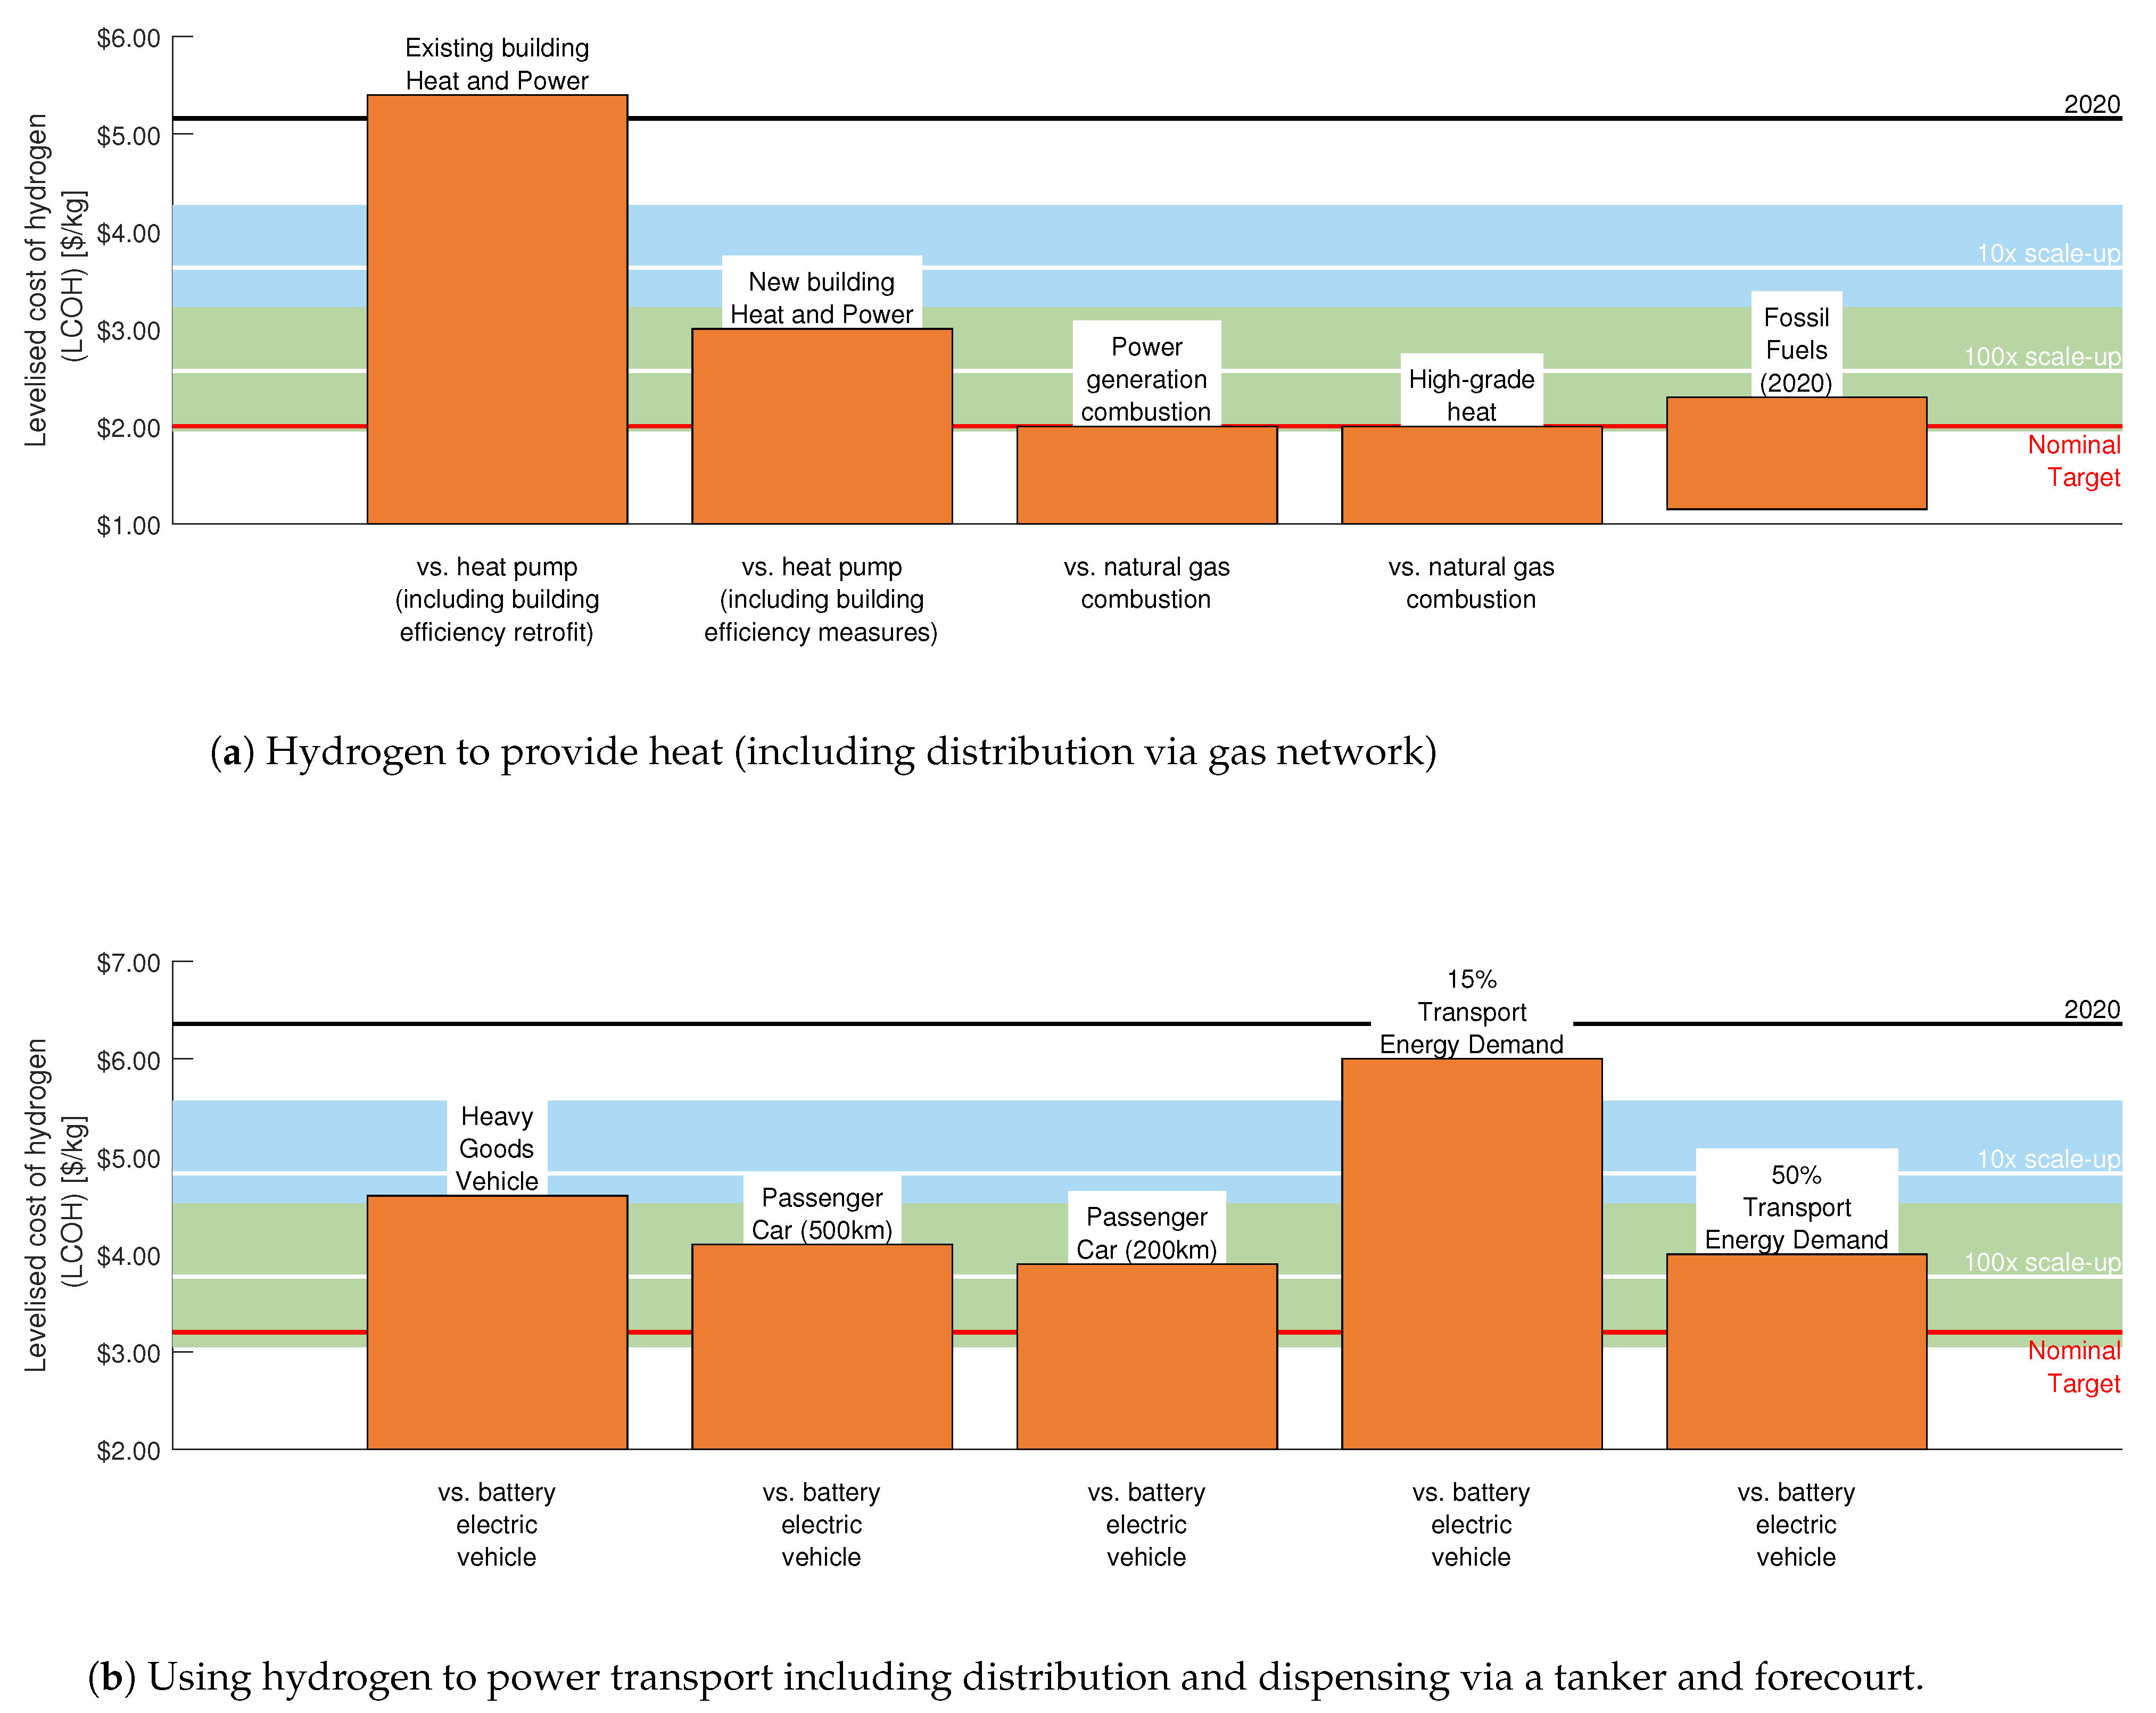
Additionally, much like that presented in this article, many of these technologies are competitive for the same renewable electricity and are also on a rapidly advancing learning curve, such as those in Figure 1 which make any comparison challenging. Nevertheless, simplified life-cycle costing analysis-based comparisons are presented in Figure 10b. The figure presents the levelised cost of hydrogen (LCOH) at production for both the ten- and hundred-fold scale-up in the baseline (represented by a line) and then the most promising and pessimistic views as shaded regions.
The nominal target of 1 $/kg for hydrogen is also commonly considered by investors and policymakers as it represents a cost of energy lower than conventional fossil fuels and serves as a benchmark scenario for energy services at zero emissions with no additional cost.
Additional sector-by-sector data are also presented mainly from two sources. The first is a report recently published by the Hydrogen Council [14] which has considered the the LCOH required for the solution to become economically competitive against low-carbon alternatives in various sectors. The second is analysis published by the Australian Hydrogen Roadmap [42].
4.1.1. Residential Heating
Analysis presented by the Hydrogen Council [14] explored a life-cycle costing analysis for various residential heating technologies based on a 2030 timescale. Various key uncertainties were considered indicating that based on a 10 MWh/year thermal energy demand for a single residence in Northern Europe, an annual cost of $600 for a conventional natural gas system, $1100–1800 for a bio-methane system, $1100–1300 for a heat pump (new house well insulated) and $1900–2600 for a heat pump (old apartment conventionally insulated) were estimated.
The cost of hydrogen boilers could fall to about $900–1600 per household per year by 2030. Three hydrogen boiler scenarios were explored which including using a boiler with a high-utilisation hydrogen network (costing $900–1600 a year), a low utilisation hydrogen network ($1300–2000) and a hydrogen boiler plus small heat pump system ($1300–2000).
The results demonstrated the need to consider more than the price of the primary fuel, energy conversion, and efficiency of the heating system alone. Whilst operating costs were lower for heat pump technology, wider system costs proved a critical barrier, as there are further implications upon the energy distribution networks, the amount of existing insulation the building may have and any additional insulation measures that may need to be installed. To the same degree, if natural gas pipelines can be reused then the cost benefits push hydrogen forward as the most practical and cost-effective solution for mass scale adoption. They offered a very favourable distribution cost at about 1 $/kg. In Figure 10a, the production costs presented in Figure 9 have been added to this distribution cost to enable the comparison between end-user break even costs and the levelised cost of hydrogen for heat.
When compared to heat pumps at a hydrogen price of 5.40 $/kg and below, the role for hydrogen appears strongest for retrofitting existing residences. Given that this price is quite viable for renewable hydrogen (and other hydrogen sources) and the alternative is a mass insulation retrofit of almost all properties, if there is already natural gas infrastructure ready for re-purposing, renewable hydrogen via a re-purposed gas distribution network does appear to be a promising route.
However for new builds which meet higher energy efficiency standards, the Hydrogen Council/McKinsey [14] and Bloomberg [43] analysis have indicated there is still a more promising role for heat pump technology. Similarly the International Council on Clean Transportation [44] presented a 2050 comparison which concluded a lower cost for heat pumps over hydrogen boilers albeit with a hydrogen price of 7.00 $/kg.
However, again driven by a high capital cost of a heat pump, hydrogen would again offer a more cost competitive solution on a total cost of ownership with a hydrogen price of 3.00 $/kg or lower. With all this in mind, it must be mentioned that when compared directly with the price of natural gas, only a hydrogen price of 1.00 $/kg or less would represent a cost effective alternative to what society currently pays for heating. All of the above indicate higher heating bills for all and this will have huge implications on dealing with fuel poverty and its wider associated impacts on health.
4.1.2. Industrial Heating and Power Generation
Presented in Figure 10a, are nominal figures for the beak even price for hydrogen when compared to natural gas in power generation and industrial heating applications. The analysis only compares hydrogen as a direct alternative to natural gas, alternative decarbonisation options based on increased electrification, such as resistive heating and heat pumps have not been compared.
Estimates have been made on the basis that the distribution of hydrogen is via a re-purposed gas network. However, it must also be noted that electrolysis could also be directly carried out on-site. The required break-even price is close to the nominal target for hydrogen. It would not be expected that renewable hydrogen will achieve cost parity with natural gas at the ×10 scale-up installed capacity. Only the most optimistic scenarios would be close to price parity at the ×100 scale-up installed capacity.
4.1.3. Transport
The transport sector is diverse and a collective powertrain/fuelling solution for decarbonisation is unlikely. Typically, transport is almost exclusively fuelled by diesel and gasoline with some electrification of railways and, to date, a very limited number of on-road applications.
A decarbonised transportation sector means the increased use of the direct combustion of bio-fuels, synthetic fuels, and, also, electric vehicles (EVs). EVs have two major types both with more electrified powertrains powered by renewable electricity carried in a battery (battery electric vehicles, BEVs) or with energy carried as hydrogen and converted to power via a hydrogen fuel cell (fuel cell electric vehicles, FCEVs). Factors such as the vehicle’s peak power, fuelling times, size, weight, expected range, and its duty cycle all contribute to the decision of what the most appropriate solution might be [45].
Nevertheless, the potential for hydrogen is most significant particularly outside the urban car (and smaller) sector which may well be dominated by the use of BEVs. Hydrogen can be used in existing internal combustion engines [45], potentially even as a retrofit solution, internal combustion engines have already reached a high level of maturity and have already benefited from mass-scale manufacturing and have extensive well established supply chains.
Over the last fifteen years, the costs associated with EVs have benefited from mass-scale manufacturing and extensive supply chain development. A new generation of FCEVs will benefit from sharing the same core technology (batteries, power electronics, motors, etc.) but with the addition of a fuel cell and hydrogen storage.
Similarly (and directly complementing) the scale-up in manufacturing of electrolysis (due to their similarity), expected cost reductions to fuel cell design, performance, and on-board storage technologies are also expected [45,46].
Hydrogen distribution from production to nozzle would be expected to be via a tanker and dispensed in a forecourt, this would increase the cost of hydrogen by 2.1–2.3 $/kg.
In Figure 10, the production costs from Figure 9 have been added to this distribution cost to enable the comparison between end-user break even costs and the levelised cost of hydrogen for transport.
As noted above, there are multiple ways that the cost of a FCEV system can be compared with respect to an BEV based system. The results of a total cost of ownership evaluation carried out by Hydrogen Council/McKinsey [14], who compare hydrogen-fuel cell powertrain solutions directly with BEVs. They indicate that, in 2030, hydrogen at 6 $/kg at the nozzle, i.e., including distribution, would be cost effective for 15% of transport energy demand, at 4 $/kg it would be the most cost effective solution for 50% of transport energy demand. This corresponded to trains, heavy duty and medium duty trucks, long-distance buses, taxis, and large passenger vehicles. Similar figures and conclusions have been put forward by other researchers [42].
These results show that once renewable hydrogen deployment reaches a ×10 scale-up, it is likely to offer a cost effective alternative to a BEV system, especially for heavier duty applications. As scale-up continues up to the ×100 scale, there is a greater opportunity for mass market transport applications, including longer range passenger cars.
Nevertheless, achieving cost parity with conventional fossil fuels or using hydrogen to produce synthetic fuels would remain challenging even beyond the hundred-fold-scale up. This would have significant implications on the likely costs for long distance travel for people and goods.
5. Conclusions
The results show that the total capital cost of a PEM electrolysis system can be reduced by 70% as a result of mass manufacturing. By increasing production from 10 units to 5000 units a year, the capital cost of manufacturing a PEM electrolysis system will be reduced from 1990 $/kW to 590 $/kg. These substantial savings can be achieved as a result of the large capital cost of the plant and labour cost being spread across a greater number of units. Once economies of scale have been achieved (>300 units), the capital cost of the overall system is dominated by the BOP. It was then found that, due to mass manufacturing, the levelised cost of hydrogen produced by a PEM system, connected to electricity produced by offshore wind, would reduce by 37.5%. Based on a manufacturing rate of 5000 units per annum, the cost per kg of hydrogen would fall from 6.40 $/kg to 4.16 $/kg, after which point the LCOH is dominated by the fixed feedstock cost of electricity.
In addition, the results show that further cost reductions were considered on the basis of predicted technological improvements associated with an installed capacity scale-up of ten- and one-hundred-fold. Based upon a production rate of 5000 units per year, and on the baseline assumptions based around a 2030 timeline (and beyond), the LCOH is predicted to reduce to 2.63 $/kg at a ten-fold scale-up in installed capacity. The largest factor responsible for this would be improvements in wind turbine technology. Similar observations were made on the basis of a ×100-fold-scale up yielding a hydrogen price of 1.57 $/kg.
These figures were then taken forward to evaluate their contributions and impact on the wider energy system, and to understanding the implications on the decarbonisation of heating and transport. The corresponding cost of hydrogen was added to the cost of distribution, and break-even costs were determined for comparison with alternative decarbonisation options, i.e., heat pumps, electric vehicles, etc. Results demonstrated that renewable hydrogen represents a scaleable and cost effective solution (compared to fully electrified energy systems) but not compared to existing fossil-based solutions.
The opportunity for hydrogen is significant but it is also changing rapidly. It is recommended that the research and analysis carried out and presented in this article is repeated frequently to refresh any assumptions and conclusions.
Author Contributions
Conceptualisation, A.S. and G.B.; methodology, A.S. and G.B.; software, G.B.; validation, A.S. and G.B.; formal analysis, A.S. and G.B.; writing—original draft preparation, A.S. and G.B.; writing—review and editing, A.S. and G.B.; visualisation, A.S. and G.B. All authors have read and agreed to the published version of the manuscript.
Funding
This project was funded through the Engineering and Physical Science Research Council (EPSRC) of the United Kingdom (EP/S032134/1, EP/T022906/1, and EP/T022949/1). Data supporting this publication are openly available under an ‘Open Data Commons Open Database License’. Data underpinning this article can be found at doi:10.15128/r2rb68xb88r.
Conflicts of Interest
The authors declare no conflict of interest. The funders had no role in the design of the study; in the collection, analyses, or interpretation of data; in the writing of the manuscript, or in the decision to publish the results.
Abbreviations
The following abbreviations are used in this manuscript:
| A | PEM electrolysis cell active area |
| AEL | Alkaline water electrolysis |
| C | Cost |
| CAPEX | Capital expenditure |
| CCM | Catalyst coated membrane |
| CRF | Capital recovery factor |
| BEV | Battery electric vehicle |
| BOP | Balance of plant |
| BP | Bipolar plates |
| EV | Electric vehicle |
| F | Faraday’s constant |
| FCEV | Fuel cell electric vehicle |
| G | Gibbs free energy |
| H | Entropy |
| HGV | Heavy good vehicle |
| LCC | Life-cycle costing analysis |
| LCOH | Levelised cost of hydrogen |
| N | Number of cell in a PEM stack |
| OPEX | Operating expenditure |
| PEM | Proton exchange membrane |
| PtG | Power to gas |
| PTL | Porous transport layer |
| PV | Photovoltaic |
| RES | Renewable energy sources |
| S | Enthalpy |
| S | PEM electrolysis system size |
| SA | Stack assembly |
| SOEC | solid oxide electrolysis |
| SUV | Sports utility vehicle |
| T | Temperature |
| V | Voltage |
Appendix A. Manufacturing Cost Parameters

Table A1.
Manufacturing cost parameters.
| Parameter | Value | Unit | Comment |
|---|---|---|---|
| Operating hours | Variable | hours | 8-h shifts, 2 per day |
| Annual operating days | 250 | days | 5 working days per week and 10 public holidays |
| Inflation rate | 2.6 | % | Data from world bank |
| Discount rate | 10 | % | Similar to other literature [25] |
| Tool lifetime | 15 | Years | [25] |
| Floor space cost | 880 | $/m | [25] |
| Building recovery | 31 | years | U.S. bureau of Economic Analysis rates [25] |
| Building footprint | Variable | m | See Appendix B |
| Hourly labour cost | 23.63 | $/h | [25] |
Appendix B. Manufacturing Model Assumptions
Table A2.
Manufacturing parameters for spray coating of catalyst coated membrane.
| Parameter | Current | ×10 | Unit | Comment |
|---|---|---|---|---|
| System | Scale-Up | |||
| Nafion membrane cost | 500 | 50 | $/m | [47] |
| Coating line cost | 1,000,000 | 800,000 | $ | Similar spray coatings are used in the PV sector [25] |
| (Ultrasonic spray) | ||||
| Coating manufacturing | 90 | 95 | % | [25] |
| line footprint | ||||
| Manufacturing line speed | 0.5 | 1.0 | m/min | [48] |
| Web width | 1.09 | 1.09 | m | [25] |
| Platinum group metal | 7 | 0.4 | g/m | [47] |
| loading Pt only | ||||
| Platinum group metal | 4 | 0.3 | g/m | [47] |
| loading Pt and Ir (1:1) ratio | ||||
| Platinum price | 30.7 | 30.7 | $/g | 2019 Spot price [49] |
| Iridium price | 47.0 | 47.0 | $/g | 2019 Spot price [49] |
| Nafion ionomer | 1.53 | 1.0 | $/g | [25] |
| Solvents | 10 | 10 | $/gallon | [25] |
| Workers/line | 2 | 2 | workers | [25] |
| CCM area | 0.068 | 0.068 | m | [25] |
Table A3.
Manufacturing parameters for porous transport layer via powder metallurgy process.
| Parameter | Current | ×10 | Unit | Comment |
|---|---|---|---|---|
| System | Scale-Up | |||
| Titanium powder cost | 35 | 35 | $/g | Average price of high purity titanium [25] |
| Powder metallurgy | 1,500,000 | 1,200,000 | $ | [25] |
| production line | ||||
| Gold coating layer | 100 | 50 | nm | 50% reduction in thickness of layer [50] |
| Gold price | 45 | 45 | $/g | 2019 spot price [51] |
| Carbon cloth cost | 400 | 50 | $/m | [52] |
| Physical Vapour | 400,000 | 320,000 | $ | A 20% learning rate curve applied [25] |
| deposition machine | ||||
| Production line | 150 | 150 | m | [25] |
| footprint | ||||
| Powder metallurgy | 99 | 99 | % | [25] |
| process yield | ||||
| Coating process | 99.9 | 99.9 | % | [25] |
| yield | ||||
| Line throughput | 2.0 | 2.0 | units/min | [25] |
| Workers/line | 4 | 4 | workers | [25] |
| Useful area | 0.068 | 0.068 | m | [25] |
| Mass of Titanium/unit | 29 | 23.2 | kg | A 20% reduction in material use via improved design [25] |
Table A4.
Manufacturing parameters for the frame via injection moulding process.
| Parameter | Current | Future | Unit | Comment |
|---|---|---|---|---|
| Value | Value | |||
| Distance of frame from | 0.625 | 0.625 | cm | Used for MEA frame bonding (injection moulding) [25] |
| edges of MEA | ||||
| Total frame width | 2.445 | 2.445 | cm | [25] |
| Polyphenylene mixed with | 5.95 | 5.95 | $/kg | [25] |
| 40% glass fibre resin | ||||
| Injection moulding | 700,000 | 560,000 | $ | [25] |
| production line | ||||
| Production line | 100 | 100 | /m | [25] |
| footprint | ||||
| Process yield | 99 | 99 | % | [25] |
| Production line | 2 | 3 | units/min | [25] |
| throughput | ||||
| Workers/line | 2 | 2 | workers | [25] |
Table A5.
Manufacturing parameters for bipolar plates.
| Parameter | Current | ×10 | Unit | Comment |
|---|---|---|---|---|
| System | Scale-Up | |||
| Stainless steel (316L) | 5.0 | 5.0 | $/unit | Based on plate area of 957.44 cm [25] |
| Gold coating layer size | 100 | 50 | nm | 50% reduction [50] |
| Gold coating layer cost | 41 | 41 | $/g | 2019 average price [51] |
| Consumables | 0.6 | 0.6 | $/unit | [25] |
| Production line | 1,500,000 | 1,200,000 | $ | [25] with 20% technological improvement |
| Footprint | 100 | 100 | m | [25] |
| Stamping process | 95 | 96 | % | [25] with 20% technological improvement |
| yield | ||||
| PVD coating process | 99.9 | 99.9 | % | [25] |
| yield | ||||
| Stamping line | 11 | 13 | % | [25] with 20% technological improvement |
| throughput | ||||
| Workers/line | 3 | 3 | workers | [25] |
| Plate area | 957.44 | 947.44 | cm | [25] |
Table A6.
Manufacturing parameters for stack assembly process.
| Parameter | Current | ×10 | Unit | Comment |
|---|---|---|---|---|
| System | Scale-Up | |||
| Assembly line type | ||||
| Manual | 500,000 | 400,000 | $ | [25] |
| Semi-automatic | 1,000,000 | 800,000 | $ | [25] |
| Automatic | 2,000,000 | 1,600,000 | $ | [25] |
| Production line | 150 | 150 | m | [25] |
| footprint | ||||
| Assembly yield | 99.5 | 99.5 | % | [25] |
| Line throughput | 11 | 11 | % | [25] |
| Assembly line staff | ||||
| Manual | 4 | 4 | workers | [25] |
| Semi-automatic | 3 | 3 | workers | [25] |
| Automatic | 2 | 2 | workers | [25] |
| Maximum throughput | ||||
| Manual | 100,000 | 100,000 | units | [25] |
| Semi-automatic | <700,000 | <700,000 | units | [25] |
| Automatic | >700,000 | >700,000 | units | [25] |
Appendix C. Manufacturing Model Results
The results of the manufacturing model are presented in Figure A1.
Figure A1.
Manufacturing model results for stack components in 2020.

Appendix D. Operating Parameters of PEM System
| Parameter | Current | ×10 | Unit |
|---|---|---|---|
| System | Scale-Up | ||
| Power | 200 | 200 | kW |
| Gross system power | 220 | 220 | kW |
| H production rate | 30 | 30 | Nm/h |
| H production rate | 80 | 80 | kg/day |
| Turndown ratio | 0–100 | 0–100 | % |
| Operating pressure | 0–30 | 0–30 | bar |
| Total plate area | 957 | 957 | cm |
| CCM coated area | 748 | 748 | cm |
| Single cell active area | 680 | 680 | cm |
| Gross cell inactive area | 9 | 9 | % |
| Single cell current | 1156 | 1156 | A |
| Current density | 1.7 | 2.1 | A/m |
| Reference voltage | V | ||
| Power density | 2.89 | 4.4 | W/m |
| Single cell power | 1956 | 1956 | W |
| Cells per system | 102 | 102 | - |
| Stacks per system | 1 | 1 | - |
| Water pump power | 5 | 5 | kW |
| Other parasitic power | 15 | 15 | kW |
Appendix E. Balance of Plant Capital Costs
Table A8.
Balance of plant capital costs.
| System | Sub-System | Cost |
|---|---|---|
| $ | ||
| Power supply | Power supply | 44,000 |
| DC voltage transducer | 225 | |
| DC current transducer | 340 | |
| Deionised water circulation | Oxygen separator tank | 20,000 |
| Circulation pump | 7053 | |
| Polishing pump | 2289 | |
| Piping | 10,000 | |
| Valves and instrumentation | 7500 | |
| Controls | 2000 | |
| $ | ||
| Hydrogen processing | Dryer bed | 13,860 |
| Water/hydrogen separator | 10,000 | |
| Piping | 5000 | |
| Valves and instrumentation | 5000 | |
| Controls | 2500 | |
| Cooling | Plate heat exchanger | 9000 |
| Cooling pump | 1500 | |
| Piping | 1000 | |
| Valves and instrumentation | 2000 | |
| Dry cooler | 4000 | |
| Miscellaneous | Valve air supply-nitrogen | 2000 |
| Ventilation and safety | 2000 | |
| Gas detectors | 2000 | |
| Exhaust ventilation | 2000 | |
| Total costs | BOP total capital cost for 200 kW system | 153,267 |
| BOP capital cost per kW | 766.34 |
References
- Committee on Climate Change. Net Zero—The UK’s Contribution to Stopping Global Warming. 2019. Available online: https://www.theccc.org.uk/publication/net-zero-the-uks-contribution-to-stopping-global-warming (accessed on 1 June 2021).
- International Renewable Energy Agency (IRENA). Future of Wind: Deployment, Investment, Technology, Grid Integration and Socio-Economic Aspects. 2019. Available online: https://www.irena.org/-/media/Files/IRENA/Agency/Publication/2019/Oct/IRENA_Future_of_wind_2019.pdf (accessed on 1 June 2021).
- International Renewable Energy Agency (IRENA). Future of Solar Photovoltaic: Deployment, Investment, Technology, Grid Integration and Socio-Economic Aspects. 2019. Available online: https://irena.org/-/media/Files/IRENA/Agency/Publication/2019/Nov/IRENA_Future_of_Solar_PV_2019.pdf (accessed on 1 June 2021).
- Tsiropoulos, I.; Tarvydas, D.; Lebedeva, N. Li-Ion Batteries for Mobility and Stationary Storage Applications: Scenarios for Costs and Market Growth. 2018. Available online: https://publications.jrc.ec.europa.eu/repository/bitstream/JRC113360/kjna29440enn.pdf (accessed on 1 June 2021).
- International Renewable Energy Agency (IRENA). Renewable Power Generation Costs in 2019. 2020. Available online: https://www.irena.org/publications/2020/Jun/Renewable-Power-Costs-in-2019 (accessed on 1 June 2021).
- International Renewable Energy Agency (IRENA). Green Hydrogen Cost Reduction: Scaling up Electrolysers to Meet the 1.5 °C Climate Goal. 2020. Available online: https://irena.org/-/media/Files/IRENA/Agency/Publication/2020/Dec/IRENA_Green_hydrogen_cost_2020.pdf (accessed on 1 June 2021).
- Möst, D. Will the Experience Curve of PV Repeat for Batteries and Electrolysis? 2019. Available online: https://www.storeandgo.info/fileadmin/downloads/deliverables_2019/20190801-STOREandGO-D7.5-EIL-Report_on_experience_curves_and_economies_of_scale.pdf (accessed on 1 June 2021).
- Böhm, H.; Zauner, A.; Goers, S.; Tichler, R.; Kroon, P. Innovative Large-Scale Energy Storage Technologies and Power-to-Gas Concepts after Optimization. 2018. Available online: https://ec.europa.eu/research/participants/documents/downloadPublic?documentIds=080166e5beb60938&appId=PPGMS (accessed on 1 June 2021).
- Hydrogen Council in Collaboration with McKinsey & Company. Hydrogen Insights: A Perspective on Hydrogen Investment, Market Development and Cost Competitiveness. 2021. Available online: https://hydrogencouncil.com/wp-content/uploads/2021/02/Hydrogen-Insights-2021.pdf (accessed on 1 June 2021).
- International Energy Agency. World Energy Outlook; OECD Publishing: Paris, France, 2017. [Google Scholar] [CrossRef]
- International Energy Agency. World Energy Outlook; OECD Publishing: Paris, France, 2020. [Google Scholar] [CrossRef]
- EnAppSys. GB Electricity Market Summary. 2019. Available online: https://www.enappsys.com/wp-content/uploads/2020/12/gb-market-summary-2019.pdf (accessed on 1 June 2021).
- Shiva Kumar, S.; Himabindu, V. Hydrogen production by PEM water electrolysis—A review. Mater. Sci. Energy Technol. 2019, 2, 442–454. [Google Scholar] [CrossRef]
- Hydrogen Council. Path to Hydrogen Competitiveness: A Cost Perspective. 2020. Available online: https://hydrogencouncil.com/en/path-to-hydrogen-competitiveness-a-cost-perspective/ (accessed on 1 June 2021).
- Hassanpouryouzband, A.; Joonaki, E.; Edlmann, K.; Haszeldine, R.S. Offshore Geological Storage of Hydrogen: Is This Our Best Option to Achieve Net-Zero? ACS Energy Lett. 2021, 6, 2181–2186. [Google Scholar] [CrossRef]
- Lee, B.; Heo, J.; Kim, S.; Sung, C.; Moon, C.; Moon, S.; Lim, H. Economic feasibility studies of high pressure PEM water electrolysis for distributed H2 refueling stations. Energy Convers. Manag. 2018, 162, 139–144. [Google Scholar] [CrossRef]
- McDonald, A.; Schrattenholzer, L. Learning rates for energy technologies. Energy Policy 2001, 29, 255–261. [Google Scholar] [CrossRef] [Green Version]
- Colli, A.N.; Girault, H.H.; Battistel, A. Non-Precious Electrodes for Practical Alkaline Water Electrolysis. Materials 2019, 12, 1336. [Google Scholar] [CrossRef] [PubMed] [Green Version]
- LeRoy, R.L.; Bowen, C.T.; LeRoy, D.J. The Thermodynamics of Aqueous Water Electrolysis. J. Electrochem. Soc. 1980, 127, 1954–1962. [Google Scholar] [CrossRef]
- Climate Change Committee. The Fifth Carbon Budget: The Next Step towards a Low- Carbon Economy. 2015. Available online: https://www.theccc.org.uk/publication/the-fifth-carbon-budget-the-next-step-towards-a-low-carbon-economy/ (accessed on 1 June 2021).
- Dönitz, W.; Erdle, E. High-temperature electrolysis of water vapor—status of development and perspectives for application. Int. J. Hydrog. Energy 1985, 10, 291–295. [Google Scholar] [CrossRef]
- Holladay, J.; Hu, J.; King, D.; Wang, Y. An overview of hydrogen production technologies. Catal. Today 2009, 139, 244–260, Hydrogen Production—Selected papers from the Hydrogen Production Symposium at the American Chemical Society 234th National Meeting & Exposition, Boston, MA, USA, 19–23 August 2007. [Google Scholar] [CrossRef]
- US Department of EnergyHydrogen and Fuel Cell Technologies Office. Hydrogen Production. 2020. Available online: https://www.energy.gov/eere/fuelcells/hydrogen-productionf (accessed on 1 June 2021).
- greencarcongress.com. UK Supports Gigastack Feasibility Study with ITM Power, Ørsted, Element Energy- Gigawatt-Scale PEM Electrolysis. 2020. Available online: https://www.greencarcongress.com/2019/08/20190830gstack.html (accessed on 1 June 2021).
- Colella, W.; James, B.; Moton, J.; Saur, G.; Ramsden, T. Techno-Economic Analysis of PEM Electrolysis for Hydrogen Production. Strategic Analysis Inc. Electrolytic Hydrogen Production Workshop. NREL, Golden, Colorado. February 2014. Available online: https://www.energy.gov/sites/prod/files/2014/08/f18/fcto_2014_electrolytic_h2_wkshp_colella1.pdf (accessed on 1 June 2021).
- Saggiorato, N.; Wei, M.; Lipman, T.; Chan, A.M.S.H.; Breunig, H.; McKone, T.; Beattie, P.; Chong, P.; Colella, W.G.; James, B.D. A Total Cost of Ownership Model for Low Temperature PEM Fuel Cells in Combined Heat and Power and Backup Power Applications. 2016. Available online: https://www.energy.gov/sites/prod/files/2017/02/f34/fcto_2016_tco_model_low_temp_pem_fc.pdf (accessed on 1 June 2021).
- Wei, M.; Lipman, T.E.; Mayyas, A.; Chien, J.; Chan, S.H.; Gosselin, D.; Breunig, H.; Stadler, M.; McKone, T.E.; Beattie, P.; et al. A Total Cost of Ownership Model for Low Temperature PEM Fuel Cells in Combined Heat and Power and Backup Power Applications; Technical report; Lawrence Berkeley National Laboratory: Berkeley, CA, USA, 2014. [Google Scholar]
- Öker, F.; Adigüzel, H. Time-driven activity-based costing: An implementation in a manufacturing company. J. Corp. Account. Financ. 2010, 22, 75–92. [Google Scholar] [CrossRef]
- Prince-Richard, S.; Whale, M.; Djilali, N. A techno-economic analysis of decentralized electrolytic hydrogen production for fuel cell vehicles. Int. J. Hydrog. Energy 2005, 30, 1159–1179. [Google Scholar] [CrossRef]
- Mergel, J.; Carmo, M.; Stolten, D.; Fritz, D.L. A comprehensive review on PEM water electrolysis, International Journal of Hydrogen Energy. Int. J. Hydrog. Energy 2013, 38, 4901–4934. [Google Scholar] [CrossRef]
- H2B2.es. Hydrogen. 2020. Available online: http://h2b2.es/hydrogen/ (accessed on 1 June 2021).
- Daylan, B.; Ciliz, N. Life cycle assessment and environmental life cycle costing analysis of lignocellulosic bioethanol as an alternative transportation fuel. Renew. Energy 2016, 89, 578–587. [Google Scholar] [CrossRef]
- Bertuccioli, L.; Chan, A.; Hart, D.; Lehner, F.; Madden, B.; Standen, E. Development of water electrolysis in the European union. Final report, fuel cells and hydrogen joint undertaking (FCH-JU). 2014. Available online: http://www.fch.europa.eu/sites/default/files/study%20electrolyser_0-Logos_0.pdf (accessed on 1 June 2021).
- UK Government. Energy Trends: UK Electricity. 2020. Available online: https://www.gov.uk/government/statistics/electricity-section-5-energy-trends (accessed on 1 June 2021).
- International Renewable Energy Agency. Hydrogen from Renewable Power: Technology Outlook for the Energy Transition; International Renewable Energy Agency: Abu Dhabi, United Arab Emirates, 2018. [Google Scholar]
- Schmidt, O.; Gambhir, A.; Staffell, I.; Hawkes, A.; Nelson, J.; Few, S. Future cost and performance of water electrolysis: An expert elicitation study. Int. J. Hydrog. Energy 2017, 42, 30470–30492. [Google Scholar] [CrossRef]
- Dotan, H.; Landman, A.; Sheehan, S.W.; Malviya, K.D.; Shter, G.; Grave, D.A.; Arzi, Z.; Yehudai, N.; Halabi, M.; Gal, N.; et al. Decoupled hydrogen and oxygen evolution by a two-step electrochemical–chemical cycle for efficient overall water splitting. Nat. Energy 2019, 4, 786–795. [Google Scholar] [CrossRef]
- Viktorsson, L.; Heinonen, J.T.; Skulason, J.B.; Unnthorsson, R. A Step towards the Hydrogen Economy—A Life Cycle Cost Analysis of A Hydrogen Refueling Station. Energies 2017, 10, 763. [Google Scholar] [CrossRef]
- Lümmen, N.; Karouach, A.; Tveitan, S. Thermo-economic study of waste heat recovery from condensing steam for hydrogen production by PEM electrolysis. Energy Convers. Manag. 2019, 185, 21–34. [Google Scholar] [CrossRef]
- Sdanghi, G.; Maranzana, G.; Celzard, A.; Fierro, V. Towards Non-Mechanical Hybrid Hydrogen Compression for Decentralized Hydrogen Facilities. Energies 2020, 13, 3145. [Google Scholar] [CrossRef]
- Greiner, C.J.; KorpÅs, M.; Holen, A.T. A Norwegian case study on the production of hydrogen from wind power. Int. J. Hydrog. Energy 2007, 32, 1500–1507. [Google Scholar] [CrossRef]
- Bruce, S.; Temminghoff, M.; Hayward, J.; Schmidt, E.; Munnings, C.; Palfreyman, D.; Hartley, P. National Hydrogen Roadmap. 2018. Available online: https://www.csiro.au/en/work-with-us/services/consultancy-strategic-advice-services/CSIRO-futures/Futures-reports/Hydrogen-Roadmap (accessed on 1 June 2021).
- BloombergNEF. Hydrogen Economy Outlook. 2020. Available online: https://about.bnef.com/new-energy-outlook/ (accessed on 1 June 2021).
- Baldino, C.; O’Malley, J.; Searle, S.; Zhou, Y.; Christensen, A. Hydrogen for Heating? Decarbonization Options for Households in the United Kingdom in 2050. 2020. Available online: https://theicct.org/sites/default/files/publications/Hydrogen-heating-UK-dec2020.pdf (accessed on 1 June 2021).
- Smallbone, A.; Jia, B.; Atkins, P.; Roskilly, A.P. The impact of disruptive powertrain technologies on energy consumption and carbon dioxide emissions from heavy-duty vehicles. Energy Convers. Manag. X 2020, 6, 100030. [Google Scholar] [CrossRef]
- Staffell, I.; Scamman, D.; Velazquez Abad, A.; Balcombe, P.; Dodds, P.E.; Ekins, P.; Shah, N.; Ward, K.R. The role of hydrogen and fuel cells in the global energy system. Energy Environ. Sci. 2019, 12, 463–491. [Google Scholar] [CrossRef] [Green Version]
- Tsuchiya, H.; Kobayashi, O. Fuel Cell Cost Study by Learning Curve. In Proceedings of the Annual Meeting of the International Energy Group Organised by EMF/IIASA, Stanford, CA, USA, 18–20 June 2002; pp. 18–20. [Google Scholar]
- Sono-Tek. Products. 2020. Available online: https://www.sono-tek.com/products/ (accessed on 1 June 2021).
- JM Bullion. Platinum Spot Prices & Charts. 2020. Available online: https://www.jmbullion.com/charts/platinum-price/ (accessed on 1 June 2021).
- Chi, J.; Yu, H. Water electrolysis based on renewable energy for hydrogen production. Chin. J. Catal. 2018, 39, 390–394. [Google Scholar] [CrossRef]
- Bullionbypost.co.uk. Gold Price In USD Per Gram For Last Year. 2020. Available online: https://www.bullionbypost.co.uk/gold-price/year/grams/USD/ (accessed on 1 June 2021).
- Fraser, J. Carbon Gas Diffusion Layers for Fuel Cell Membrane Electrode Assemblies. 2012. Available online: https://nuvant.com/pdfs/Foresight%20Niche%20Analysis.pdf (accessed on 1 June 2021).
Figure 1.
Historical and projected cost reductions across a range of net-zero transition technologies as a function of installed capacity relative to a 2019 baseline. Key technology market size and cost—offshore wind, onshore wind, Li-ion batteries, photovoltaics (PV), and electrolysis out to 2030 and 2050. Cost reduction made on the basis of a simple power law extrapolation through historical data and estimates of market sizes [2,3,4,5,6].

Figure 2.
Historical and projected cost reductions across a range of net-zero energy technologies as a function of installed capacity relative to a 2019 baseline. A more detailed view of the cost reductions expected for a scaled-up electrolysis market. Raw data from large scale electrolysis systems [7], as well as projections of future costs and scale from Bohn, et al. [8], Hydrogen Council (2021) [9], and IRENA 2020 [6].

Figure 4.
Schematic of a polymer electrolyte membrane (PEM) electrolyser cell.

Figure 5.
Capital cost breakdown for the CCM and stack based on the manufacturing scale-up of a 2020 system.
Figure 5.
Capital cost breakdown for the CCM and stack based on the manufacturing scale-up of a 2020 system.

Figure 6.
Capital cost of PEM electrolyser system (2020).

Figure 7.
Breakdown of the balance of plant (BOP) costs (2020).

Figure 8.
Breakdown of LCOH (2020) versus manufacturing rate.

Figure 9.
Waterfall chart illustrating the various contributions to reducing the levelised cost of hydrogen (LCOH) in 2020, ×10 scale-up and ×100 scale-up.
Figure 9.
Waterfall chart illustrating the various contributions to reducing the levelised cost of hydrogen (LCOH) in 2020, ×10 scale-up and ×100 scale-up.

Figure 10.
Break even levelised cost of hydrogen (LCOH) to the consumer for various end users. Sources: [14,42].

Table 1.
Operating parameters of current and future electrolysis systems.
| Parameter | Scenario | Year | Scale-Up | Scale-Up |
|---|---|---|---|---|
| 2020 | ×10 | ×100 | ||
| upper | 0.03 | 0.02 | ||
| Electricity cost [$/kWh] [35] | baseline | 0.06 | 0.04 | 0.03 |
| lower | 0.05 | 0.04 | ||
| upper | 55.0 | 55.0 | ||
| Capacity factor [%] | baseline | 34.0 | 44.5 | 44.5 |
| lower | 34.5 | 34.5 | ||
| upper | 90,000 | 150,000 | ||
| Operating lifetime [hours] | baseline | 60,000 | 80,000 | 125,000 |
| low | 70,000 | 100,000 | ||
| upper | 90 | 95 [37] | ||
| Efficiency [% of HHV] | baseline | 80 | 86 | 92.5 |
| low | 82 | 90 |
Publisher’s Note: MDPI stays neutral with regard to jurisdictional claims in published maps and institutional affiliations. |
© 2021 by the authors. Licensee MDPI, Basel, Switzerland. This article is an open access article distributed under the terms and conditions of the Creative Commons Attribution (CC BY) license (https://creativecommons.org/licenses/by/4.0/).
Share and Cite
MDPI and ACS Style
Bristowe, G.; Smallbone, A. The Key Techno-Economic and Manufacturing Drivers for Reducing the Cost of Power-to-Gas and a Hydrogen-Enabled Energy System. Hydrogen 2021, 2, 273-300. https://0-doi-org.brum.beds.ac.uk/10.3390/hydrogen2030015
AMA Style
Bristowe G, Smallbone A. The Key Techno-Economic and Manufacturing Drivers for Reducing the Cost of Power-to-Gas and a Hydrogen-Enabled Energy System. Hydrogen. 2021; 2(3):273-300. https://0-doi-org.brum.beds.ac.uk/10.3390/hydrogen2030015
Chicago/Turabian StyleBristowe, George, and Andrew Smallbone. 2021. "The Key Techno-Economic and Manufacturing Drivers for Reducing the Cost of Power-to-Gas and a Hydrogen-Enabled Energy System" Hydrogen 2, no. 3: 273-300. https://0-doi-org.brum.beds.ac.uk/10.3390/hydrogen2030015