
The Evaluation of the Detection of Cr(VI) in Leather
by
 , , , and
Stefan John Davis
1,* ,
,
William Robert Wise
1,
Sandro Recchia
2,
Andrea Spinazzè
2 and
Maurizio Masi
3 1
Institute for Creative Leather Technologies, University of Northampton, University Drive, Northampton NN1 5PH, UK
2
Dipartimento di Scienza e Alta Tecnologia, Università degli Studi dell’Insubria, Via Valleggio, 11, 22100 Como, Italy
3
Dipartimento di Chimica, Materiali e Ingegneria Chimica Giulio Natta, Politecnico di Milano, Piazza Leonardo da Vinci, 32, 20133 Milano, Italy
*
Author to whom correspondence should be addressed.
Analytica 2022, 3(1), 1-13; https://0-doi-org.brum.beds.ac.uk/10.3390/analytica3010001
Submission received: 12 November 2021
/
Revised: 9 December 2021
/
Accepted: 14 December 2021
/
Published: 29 December 2021
(This article belongs to the Section Spectroscopy)
Abstract
:The topic of hexavalent chromium (Cr(VI)) in leather has been debated throughout the whole supply chain for years. However, its significance has recently increased due to proposed changes in European legislation concerned with skin-sensitising substances suggesting that acceptable Cr(VI) concentrations in leather goods should be lowered from 3 mg kg−1 to 1 mg kg−1. The proposition of a stricter limit and current analytical difficulties created the need for a review of current standard test methods. The research presented in this paper investigates both the colorimetric (Part 1) and chromatographic (Part 2) methods under BS EN ISO 17075. The focus of the study was to identify possible sources of interference leading to large statistical variance in results and to define the limit of quantification with respect to the proposed new compliance limit. This study into the colorimetric method has shown that the presence of Cr(III), dyes, and proteins can be significant interferences, becoming critical at low Cr(VI) concentrations. Dilution factors worsen the problem of detecting low concentrations: a reliable quantitative detection of 0.01 mg kg−1 and 0.003 mg kg−1 Cr(VI) in solution are required at the 3 mg kg−1 and 1 mg kg−1 compliance limits in leather, respectively. BS EN ISO 17075 part 1 was shown to be incapable of reliably resolving to 3 mg kg−1 or below in leather. Part 2 shows a marked improvement in detection limits and reliability; however, data suggest that 1 mg kg−1 Cr(VI) is not reliably detectable in leather. Suggested improvements to the established test methods and a possible alternative are discussed.
1. Introduction
Tanning is a process in which a hide or skin is made resistant to biological attack by the reaction of collagen with stabilising (tanning) agents [1]. A range of tanning agents are commercially available, including synthetic materials and plant extracts. Chromium(III) salts have been used in the production of leather as tanning agents since the early twentieth century [2]. Trivalent Chromium (Cr(III)) tanning rose to prominence due to a comparatively quick reaction and relative ease of manufacture compared to plant-based tanning agents [2]. The denaturation temperature of chromium tanned leather is greater than 100 °C and cannot be reached by plant tannins, which allows for superior material properties [1]. Currently 33% basic chromium(III) sulphate (Cr(OH)SO4) accounts for approximately 80% of the global leather production [3].
Modern chromium tanning utilises chromium(III) salts; however, procedures in leather production have the potential to oxidise Cr(III) to Cr(VI). Industry research has shown this occurrence is related to post-tanning treatment with polyunsaturated oils and high final leather pH [4]. Secondary tanning (retanning) with polyphenolic plant extracts and mildly acidic final leather pH can prevent or reverse the oxidation of Cr(III) during production and ageing [5].
Cr (VI) is a carcinogen, mutagen, allergen, skin irritant, and sensitiser [6]. Leather goods come into repeated contact with the skin, and the sensitising effects are of current concern [7]. Cr(VI) has been shown to easily penetrate the skin, which is then reduced to Cr(III) by intracellular anti-oxidants or proteins [7]. The in-situ Cr(III) then inserts into DNA or proteins, causing damage [8]. Although Cr(III) is the agent for sensitisation, the transport mechanism through the skin requires Cr(VI), which is considered to be an agent of concern [7]. Due to the impermeability of Cr(III), it is considered to be significantly less hazardous than Cr(VI) [9]. Because of the possibility of Cr(III) oxidising Cr(VI) in leather articles, an international standard test to quantify Cr(VI) in leather is required and is currently provided by BS EN ISO 17075-1&2:2017.
Analysis of Cr(VI) in leather presents challenges not encountered by other industries, such as complete extraction from a porous matrix and reliable differentiation and detection in the presence of ca. 10,000 mg kg−1 of Cr(III) [10]. In situ analysis would limit issues with complete extraction and limit changes in species concentration, but commercially accessible techniques are not available. Currently, Cr(VI) ions must be removed from the substrate, which is achieved physically by leaching into a pH 8 phosphate buffer [11].
There are currently two separate official methods for the analysis of Cr(VI) content within leather: BS EN ISO:17075-1:2017 and BS EN ISO:17075-2:2017. BS EN ISO 17075-1:2017 is a colorimetric method, where extracted Cr(VI) is reacted with 1,5-diphenylcarbazide (DPC) to produce a Cr(III)-1,5-diphenylcarbazone complex, which can be analysed photometrically at 540 nm [11]. BS EN ISO 17075-2:2017 is a chromatographic method where the Cr(VI) is extracted from a leather sample in a technique identical to colorimetric method [12]. The extraction solution undergoes ion chromatography with an anion exchange column followed by UV-visible spectrophotometric detection [12]. The eluted Cr(VI) can be detected by two separate techniques: direct photometric analysis of the chromate ion at 372 nm (annex B) or a post-column reaction with DPC, and the Cr(III)-1,5-diphenylcarbazone complex can be analysed at 540 nm [12].
The European Chemicals Agency (ECHA) has proposed, under the April 2019 Annex XV restriction report proposal for skin-sensitising substances, that the compliance limit for Cr(VI) in dry leather should be lowered from 3 mg kg−1 limit to 1 mg kg−1 in line with the textile industry [13,14]. In addition to ECHA’s proposed restrictions, increasingly stringent exposure limit values for Cr(VI) have been defined by different authorities [6]. The proposition of a stricter limit and industry concerns regarding analytical inaccuracies of the existing international standards at the current 3 mg kg−1 limit have created a need for a review of current standards [15]. This work reviews the 2017 iteration of BS EN ISO 17075-1 and 2 with regard to the existing and proposed Cr(VI) limits through a careful analysis of some critical factors, which strongly influences the reproducibility of such analytical protocols. Modifications to maximise the sensitivity of the current standard format are consequently suggested.
2. Materials and Methods
The colorimetric method was conducted in accordance with BS EN ISO 17075-1:2017. Test solutions contained variations of 280 mg L−1 Cr(III) (Chromasol B, 26% Cr2O3, Lanxess GmbH, Germany), 10 mg L−1 Cr(VI) (KCr2O7, 99%, British Drug House, UK), and 0.5% (w/v) gelatine (Bovine Gelatine, British Drug House). All UV spectra were recorded using a Shimadzu UV-2501 equipped with either 10 mm or 40 mm QX rated quartz cells with UV-Prove (version 2.43) software. Spectra were recorded within the 200–800 nm range with a 2 nm slit width and a 1 nm measurement step. The reaction speed between Cr(VI) and 1,5-diphenylcarbazide (99%, Fisher Scientific, Cumbria, UK) was monitored with the above apparatus at 540 nm at a 1 count/second data collection rate.
The chromatographic method was conducted in accordance with BS EN ISO 17075-2:2017. All test solutions contained a variation on 280 mg L−1 Cr(III), 0.05–1 mg L−1 Cr(VI) and 0.5% (w/v) gelatine. All chromatograms and UV spectra were collected using Thermo Fisher Scientific Ultimate 3000 equipped with LPG-3400SD gradient pump, WPS-3000SL autosampler, TCC-3000SD column compartment. and DAD-3000 UV-visible detector array. The buffer loop, needle seat capillary, and needle were constructed from biocompatible materials. 0.005” ID PEEK tubing was used pre-column, whereas 0.010” ID PEEK tubing was used post-column. The column compartment contained a Thermo Fisher Scientific AS11 (4 mm × 250 mm) anion exchange column (quaternary ammonium functionality, 13 um particle size) coupled with a 50 mm AG11 guard column. A PEEK zero-dead-volume tee was connected to a syringe pump (KdS Scientific, Model 200, Holliston, MA, USA), and a 750 µL reaction coil. The wash solvent was 10% methanol ((HPLC grade, Fisher Scientific, Cumbria, UK) in ultrapure water.
Direct Cr(VI) detection (BS EN ISO 17075-2:2017 annex B) method conditions:
- Eluent system: 25 mmol (NH4)2SO4 (99%, Fisher Scientific, Cumbria, UK), 1 mmol NaOH (99%, Sigma Aldrich, Cumbria, UK);
- Column temperature: 30 °C;
- UV spectrum range: 200–500 nm;
- Extracted chromatogram wavelength: 372 nm;
- Flow rate: 1 mL min−1;
- Injection volume: 50 µL;
- Run time: 15 min.
Chromatographic condition with post-column DPC reaction (BS EN ISO 17075-2:2017 annex C):
- Eluent system: 125 mmol (NH4)2SO4, 5 mmol NaOH;
- Post-column reagent: 2 mmol 1,5-diphenylcarbazide in acidified 10% methanol solution;
- Column temperature: 30 °C;
- UV spectrum range: 200–700 nm;
- Extracted chromatogram wavelength: 540 nm;
- Flow rate: 1 mL min−1;
- Post-column reagent flow rate: 0.33 mL min−1;
- Injection volume: 50 or 100 µL;
- Run time: 7 min.
3. Results
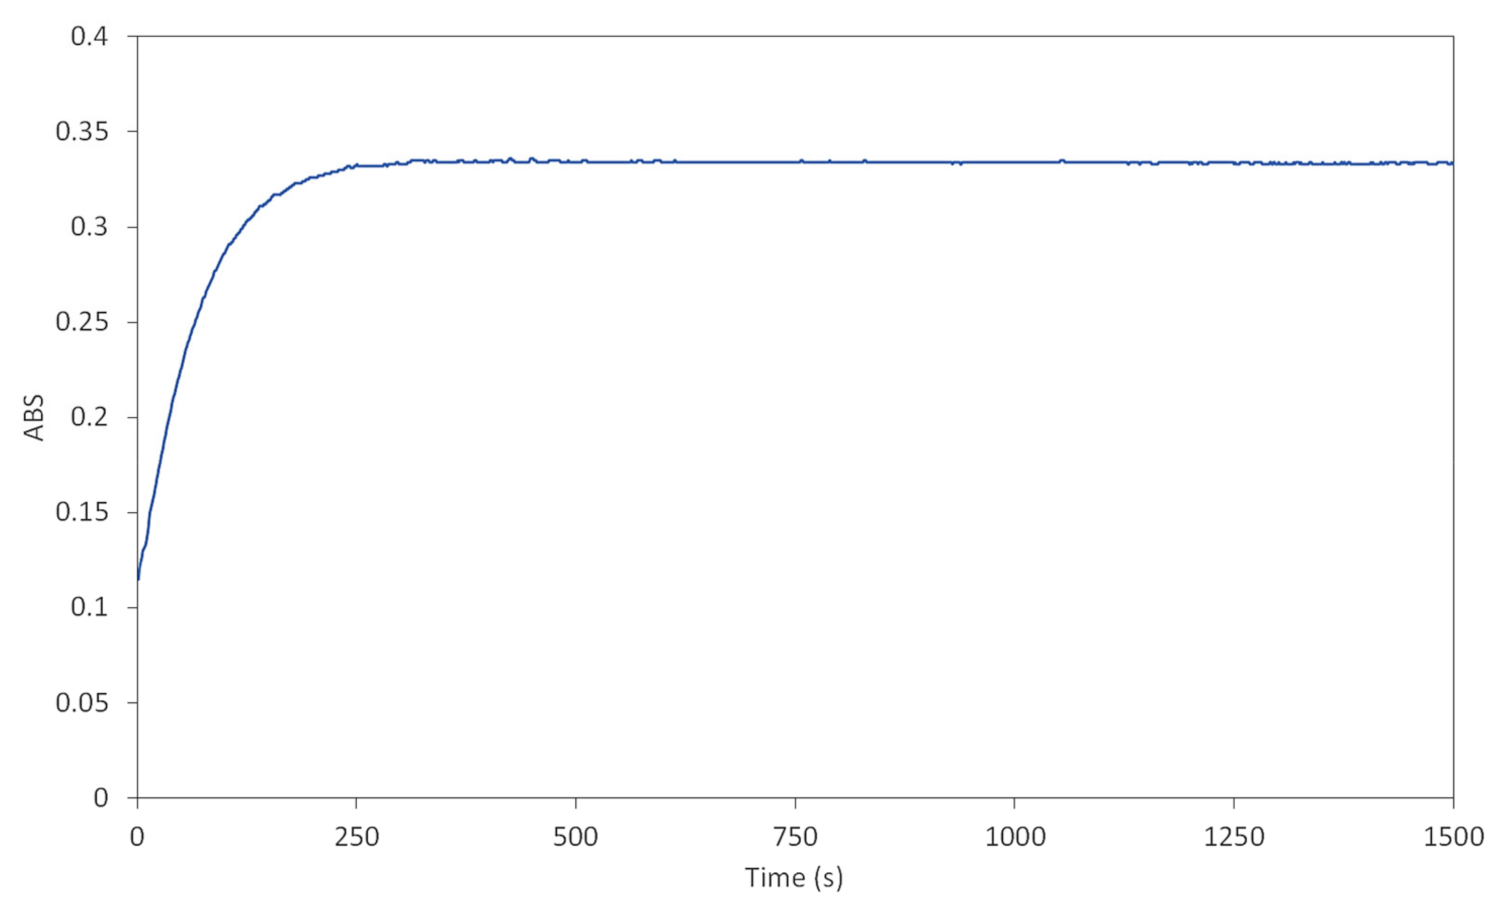
The colorimetric method recognises that the reaction between Cr(VI) and DPC is not instantaneous, and a reaction time of 900 ± 300 s (15 ± 5 min) is stipulated to ensure the reaction is sufficiently complete during quantitative analysis [11]. Figure 1 shows how absorbance (ABS) (540 nm) of a carbazone complex solution varies as a function of time and confirms that a minimum of 300 s is needed for the reaction to stabilise.
However, there is no suggested guideline in annex C for the chromatographic method [12]. The recommended procedure in annex C results in a retention time of approximately 275 s, of which this work has found that the eluted Cr(VI) was in contact with DPC for only approximately 60–120 s [12]. To ensure accuracy at all concentrations, it is recommended that a retention time of at least 15 min is designed into a chromatographic method involving a post-column reaction with DPC.
Concerns of statistical variance in responses from the colorimetric (part 1) methodology have been previously reported [16].
These are thought to be caused by:
- Oxidation of Cr(III) during extraction at pH 8.
- Reduction of Cr(VI) during extraction in the presence of a protein material.
- Dyes contributing to the absorbance at 540 nm.
- Interference from overlapping Cr(III) absorbances [17].
Model extraction trials involving known amounts of Cr(VI), Cr(III), and bovine gelatine were used to examine the extraction process, removing possible variance caused by chromium extraction from a leather matrix. Using the peak for carbazone at 540 nm, the concentration of Cr(VI) was determined by measuring the absorbance difference between two samples of a solution where one contains acidified DPC, as outlined in BS EN ISO 17075-1:2017.
The model solutions containing only Cr(III) (with or without gelatine) were found to give false positive results for Cr(VI) during the extraction period (Figure 2A). This can be cross-referenced with Figure 2B, which provides evidence that this apparent positive result for Cr(VI) is because of the coalescence of the two Cr(III) peaks at 410 and 630 nm. If Cr(VI) were to be formed during extraction, a peak at 540 nm as seen in Figure 3B would be resolvable.
The reason for the apparent value of Cr(VI) to continually increase as a function of extract time is likely because of a general increase in the base line absorbance due to olation of Cr(III) [18]. Olation causes turbidity, resulting in irregularity between the DPC-sample and the control, thus producing a false positive. Filtering the extraction solution can help this issue, but olation continues over time [18]. The presence of protein can cause the same effect due to turbidity; however, this can be resolved with cellulose nitrate (CN, 0.45 µm pore size) membrane filtration.
The concentration of Cr(VI) in a solution containing only Cr(VI) (with or without gelatine) remains consistent during the extraction process as highlighted in Figure 3A, which suggests that Cr(VI) does not decrease during the extraction process. This observation is not surprising considering the extraction process is at pH 8.0 ± 0.1, and the oxidative properties of Cr(VI) require acidic conditions [19]. Figure 3B shows the Cr(III)-carbazone peak is clearly resolvable versus the control. This statistical reliability could also be due to Cr(VI) not undergoing olation and thus avoids the issues caused by turbid solutions.
Model extraction solutions with known concentrations of Cr(III), Cr(VI), and gelatine (see Appendix A Figure A1) also showed increases in concentration of Cr(VI) as a function of extraction time. The apparent increase in Cr(VI) concentration correlated with the increases seen in Figure 2A. This supports the argument that variance in results is not because of Cr(VI) formation during the process but a consequence of the turbidity of Cr(III) olation products.
The issues of turbidity caused by Cr(III) olation and protein interferences are significantly reduced with the chromatographic method. The method uses a cationic medium that is retentive of anions and therefore can differentiate between Cr(III), which exists in solution as the Cr3+ cation, and Cr(VI), which exists as the CrO42− anion [19]. Cr(VI) has two UV-visible absorbances: 290 and 372 nm. The absorbance at 290 nm is a consequence of a charge transfer between oxygen and Cr(VI) of the CrO42− ion and is unaffected by pH; however, this absorption band has weaker absorptivity compared to the absorbance at 372 nm [20]. The maximum absorbance wavelength of Cr(VI) is pH dependent and shifts from 350 nm under acidic condition to 374 nm at pH 10 [21]. The absorbance is also an O-Cr(VI) charge transfer, but the absorbance affected by protonation and deprotonation of an O ligand [21]. Despite the pH dependence, the absorbance at 374 nm is used for the quantification of Cr(VI) in aqueous solution [21].
Figure 4 is a direct CrO42− detection chromatogram, (arbitrary intensity, 372 nm) of a CN membrane-filtered solution containing Cr(III) and Cr(VI). Cr(VI) is hindered by the column medium and elutes at 8.61 min, whereas the Cr(III) is unhindered by the column medium and is eluted at the same time the sample injection front reaches the detector.
Although Cr(III) and protein interferences can be mitigated with the chromatographic method, dyes can still be a significant interference. Figure 5 is a chromatogram overlay (normalised arbitrary intensity) comparing a model Cr(VI) solution (blue), the extract from a Cr(VI)-free leather containing yellow dye (green) and the extract from a Cr(VI)-free leather containing red dye. Both dyed leathers showed significant dye leaching, which was present after a solid phase extraction step with a C18 silica medium (ACROS Chemicals, Cumbria, UK). The colourants used were examples of acid (anionic) dyes, which are impeded by the cationic exchange medium. Comparing peak 1 (Cr(VI), no dye) with peak 2 (no Cr(VI), yellow dye) shows how persistent dyes can be removed as an interference as the retention times are clearly different. However, comparing peak 1 and peak 3 (no Cr(VI), red dye) demonstrates there are situations, whereby a dye that can absorb at 372 nm and have a retention time matching Cr(VI), thus giving a false positive result.
Figure 6 compares the visible spectra, represented in normalised absorbance, of the peaks designated in Figure 5: Cr(VI) (peak 1) (blue, absorbances at 272 and 372 nm), extracted yellow dye (peak 2) (green, absorbances at 232, 273 nm), and extracted red dye (peak 3) (red, absorbances at 236, 278 and 328 nm). The UV-visible spectra in Figure 6 provide a clear distinction between the red dye and Cr(VI) peaks, thus confirming that differentiation is possible. Given that false positives from dyes are a possibility, the UV-visible spectra of peaks suspected to be Cr(VI) should be interpreted to confirm species identity. The current edition of BS EN ISO 17075-2 does recommend scanning the 200–500 nm range to aid species identification; however, it is not a compulsory aspect of the methodology [12]. In addition, Annex C does not include a similar recommendation, nor is it a methodological requirement to use a diode array detector (DAD) [12].
The use of a guard column packed with polystyrene-divinylbenzene (PS-DVB) and variation of the ionic strength of the eluent can further improve identification of false positives due to colourants [12]. This methodology is currently optional in BS EN ISO 17075-2:2017, and it is recommended that this approach becomes a fixed feature of the method [22]. Dyes are a significant interference in colorimetry and the use of a C18 separation medium (SPE) is recommended by ISO 17075-1:2017 to mitigate against this [11]. However, previous studies have shown SPE media can be retentive of Cr(VI) and the SPE may not be 100% efficient at removing the coloured interference [23].
From the above analyses, the chromatographic methods efficiently mitigate against interferences occurring in the colorimetric method and are an advancement in the detection of Cr(VI) in leather goods. However, none of the established methods detail the concentration of Cr(VI) in solution at the current 3 mg kg−1 limit in dry leather. In all established methods, several dilution factors must be considered, and the concentrations in solution are significantly smaller than the value quoted in leather [11,12]. Table 1 lists the concentrations of Cr(VI) at the current and proposed compliance limits and shows the chromatographic method has a fundamental advantage versus the colorimetric method with a 6-fold concentration increase.
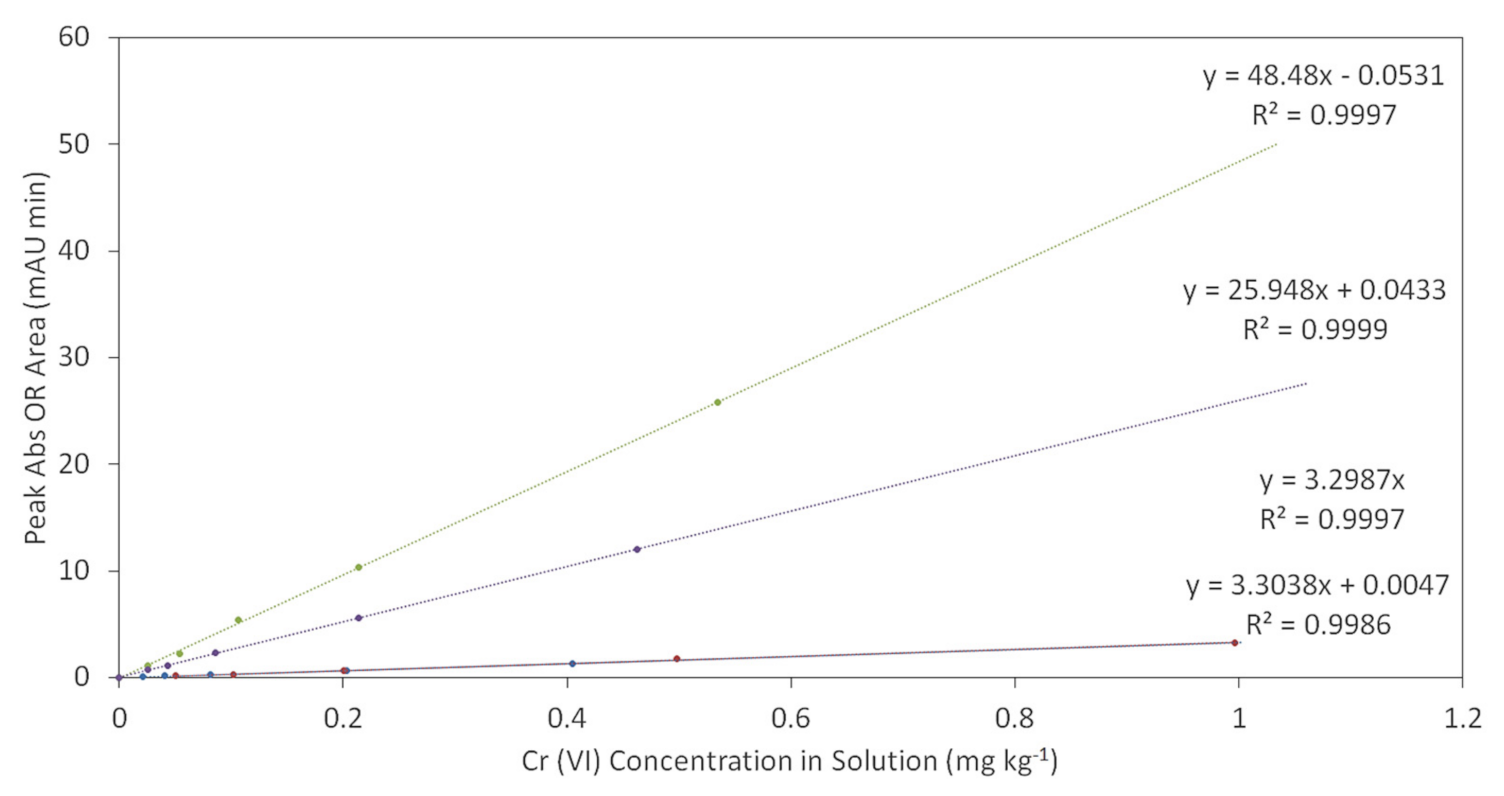
The values in solution relating to the colorimetric method are significantly below 1 µM for both compliance limits. Conventional spectrophotometry becomes unreliable at analyte concentrations below 1 µM, and specialist forms of spectrophotometry are recommended to achieve a quantification limit on the 0.1 µM scale [24]. The values in solution relating to the chromatographic methods are approximately 1 µM for the current compliance limit; however, the proposed compliance limit equates to 0.4 µM, a concentration at which conventional spectrophotometry would be unreliable to quantify [24]. Although larger quantities of Cr(VI) in solution lead to greater signal intensity, the absorptivity coefficient of each method must also be considered when detecting significantly small quantities of analyte. Figure 7 compares the calibration gradient (peak absorbance or chromatogram peak area versus Cr(VI) concentration) for the established methods, which illustrates that the absorptivity coefficient of the Cr(III)-carbazone complex (Part 2 Annex C) is 14 times larger compared to the Cr2O42− detection (Part 2, Annex B) and the colorimetric method (Part 1).
The absorptivity of the CrO42− ion at 372 nm was calculated to be 9.25 × 10⁻² mL µg−1 cm−1, whereas the Cr(III)-carbazone complex at 540 nm had an absorptivity of 8.25 × 10⁻¹ mL µg−1 cm−1. Despite the advantages of the larger detection quantities for the chromatographic method, the lower absorptivity coefficient of the CrO42− ion results in the calibration gradient of the direct detection method being comparable to the colorimetric method. This comparison suggests that there is no advantage in the detection limit between the colorimetric (Part 1) and Direct Cr2O42− detection (Part 2, Annex B) methodologies; however, there is a significant advantage in detecting the Cr(III)-carbazone complex via the chromatographic method (Part 2 Annex C).
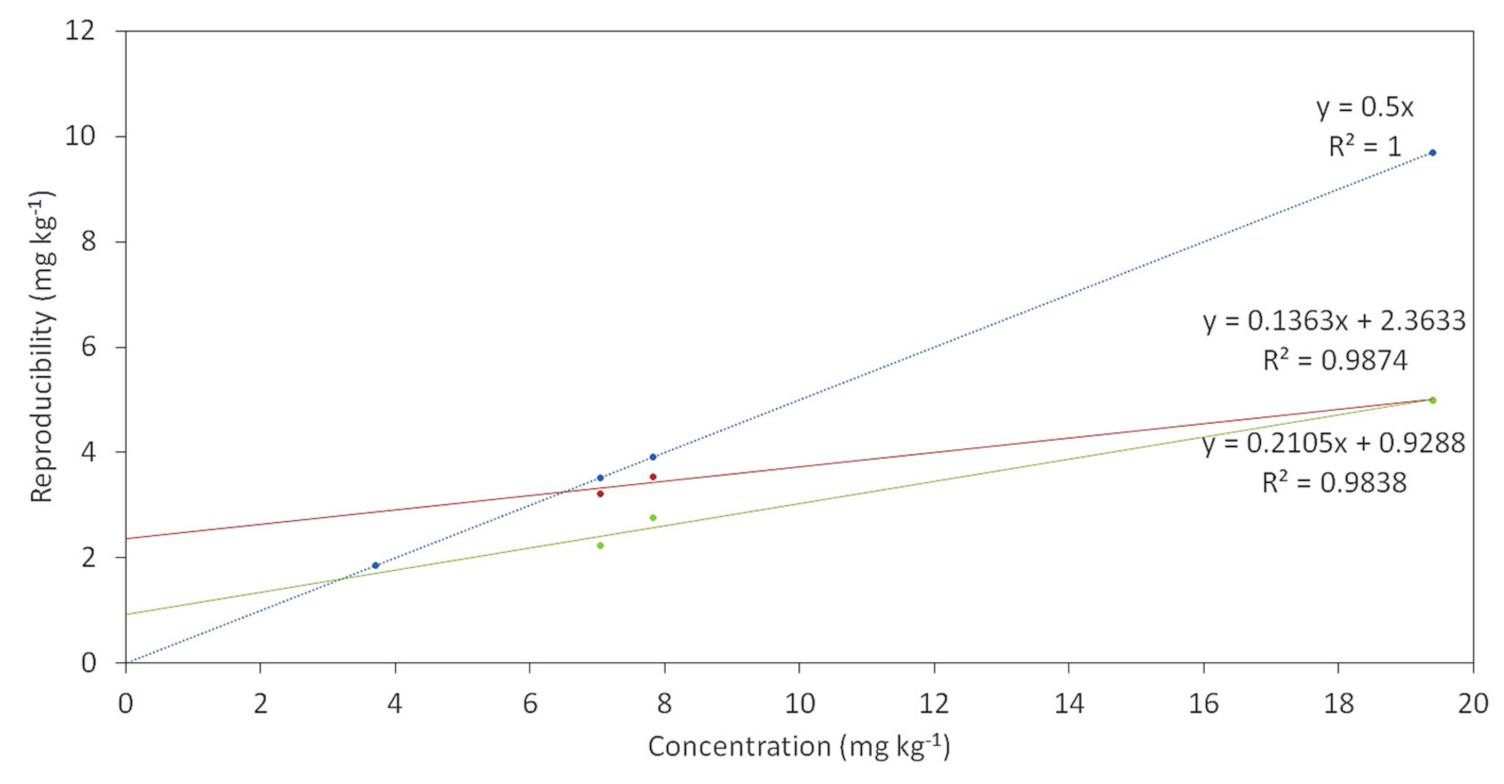
The interlaboratory reproducibility data found as part of BS EN ISO 17075 part 1 (annex B) and 2 (annex A and D) were plotted as a linear function of mean Cr(VI) concentrations and compared to a benchmark trendline of 50% error, as shown in Figure 8 [11,12]. Where the reproducibility and benchmark trendlines intersect is regarded as the limit of quantification (LOQ) for the analytical technique, which is recognised by the leather industry as a suitable means of determining (LOQ). The chart found in annex B of BS EN ISO 17075-1:2017 (see Appendix A Figure A2, Figure A3 and Table A1) could not be reproduced from the data provided [11].
4. Discussion
4.1. Implications
Considering the errors generated from the linear regression fit (Table 2), it is appropriate to suggest that the current 3 mg kg−1, or proposed 1 mg kg−1, compliance limit in dry leather is not suitable for the colorimetric method. It is therefore recommended BS EN ISO 17075-1:2017 should be withdrawn and only be used for indicative testing. The error generated by the linear regression fit relating to the chromatographic method is concerning as it suggests the LOQ is between 0.93–7.37 mg kg−1 in leather. Although the repeatability observed with BS EN ISO 17075-2:2017 is an improvement compared to the colorimetric method, interlaboratory reproducibility still shows significant variance. Given the information presented in Figure 8 and Table 2, there is insufficient evidence to regard BS EN ISO 17075-2:2017 as suitable for the proposed 1 mg kg−1 compliance limit and raises concerns at the current 3 mg kg−1 limit. Further interlaboratory trials relating to specimens at ~3 mg kg−1 and ~1 mg kg−1 are needed to confirm method suitability.
4.2. Recommendations
- The addition of an inconclusive boundary as used in BS EN ISO 62321-7-1:2015 for mean values close to the compliance limit, where error measurements straddle the pass–fail boundary, is recommended. This could work by stipulating results are inconclusive, where errors in mean Cr(VI) values overlap with the compliance limit. Samples that fall under this category could be then tested further until a definitive pass or fail can be established.
- As Cr(III) is a significant interference for quantifying Cr(VI) and needs to be separated, it is recommended the colorimetric method is phased out as a suitable procedure for quantifying Cr(VI) in leather at 3 or 1 mg kg−1.
- To minimise the risk of false positives results due to colourants, reporting the UV-visible spectrum of the analyte and confirmation of the presence of Cr(VI) should be made mandatory.
- It is recommended that the quantity of detectable Cr(VI) in solution be maximised by using the largest injection volumes possible ideally greater than 100 µL, using larger leather sample weights, and minimising dilution factors.
- It is recommended that the absorptivity coefficient be maximised by reacting eluted Cr(VI) with DPC as a follow-up reaction during IC rather than by directly detecting the CrO42− ion. In this case, a reaction time of greater than 300 s is recommended to maximise and stabilise the colour intensity. A quoted molar absorptivity coefficient is recommended to confirm that all calibrations are correct; however, there is currently no agreed value [25]. The speciation of the of the Cr(III)-carbazone complex is currently unconfirmed; therefore, an accurate molar value cannot be derived until speciation is established [26].
- The use of a DAD and reporting the UV-visible spectrum of the analytes should be made compulsory to avoid false positives from interfering colourants.
- The LOQ for the chromatographic method should be investigated further with substantial interlaboratory trials to objectively confirm the quantification limit, as demonstrated in BS EN ISO 17075-1:2017 annex B.
Although recommendations for the established chromatographic methodology have been made, to futureproof Cr(VI) analysis in leather goods, an alternative to spectrophotometric detection should be developed. One option is to consider inductively coupled plasma mass spectrometry (ICP-MS). This technique differentiates the elemental composition by atomic mass rather than photometric response. The ICP ionisation technique destroys interfering organics, whereas interfering inorganic species can be mitigated with the use of a collision cell. Cr(III)–Cr(VI) differentiation can be achieved by using an in-line chromatographic separation prior to ionisation, as described as part of ASTM UOP 1031-19 [27].
5. Conclusions
It has been demonstrated that amendment of the current version of BS EN ISO 17075 is required to address concerns regarding the LOQ with respect to the changes proposed by the 2019 ECHA Annex XV Skin Sensitiser revision. The requirement of reducing the Cr(VI) limit in chromium tanned leather to 1 mg kg−1 confirms further work, and investments are needed to ensure analytical techniques are suitably accurate and precise. Although iterative improvements can be made through the recommendations mentioned in this work, alternative methodologies that are non-reliant on photometry are required to significantly improve the analysis of Cr(VI) in leather for the future.
Author Contributions
Conceptualization, W.R.W.; methodology, S.J.D., W.R.W.; validation, S.R., A.S. and M.M.; formal analysis, S.J.D.; investigation, S.J.D., W.R.W.; resources, W.R.W.; data curation, S.J.D.; writing—original draft preparation, S.J.D., W.R.W.; writing—review and editing, S.J.D., W.R.W.; visualization, S.R., A.S., M.M.; supervision, W.R.W.; project administration, W.R.W.; funding acquisition, W.R.W. All authors have read and agreed to the published version of the manuscript.
Funding
This research was funded by charitable donations from The Leathersellers’ Company and LeatherUK.
Institutional Review Board Statement
Not applicable.
Informed Consent Statement
Not applicable.
Data Availability Statement
All data underpinning this publication are openly available from the University of Northampton Research Explorer at http://0-doi-org.brum.beds.ac.uk/10.24339/f7686d5d-0ac6-4957-9f70-c6adf4841e27.
Conflicts of Interest
The authors declare no conflict of interest. The funders had no role in the design of the study; in the collection, analyses, or interpretation of data; in the writing of the manuscript; or in the decision to publish the results.
Appendix A
Figure A1.
Detected Cr(VI) concentration (mg kg−1) of a Cr(III), Cr(VI) and gelatine solution vs. extraction time (minutes) (a), UV spectra of the same solution after 300 min: with DPC (Blue), without DPC (Red) (b).
Figure A1.
Detected Cr(VI) concentration (mg kg−1) of a Cr(III), Cr(VI) and gelatine solution vs. extraction time (minutes) (a), UV spectra of the same solution after 300 min: with DPC (Blue), without DPC (Red) (b).

Figure A2.
Reproducibility vs. mean Cr(VI) concentration plots from the data presented in annex B of BS EN ISO 17075:1-2017 [11]. Raw data are as presented in Tables B.1 and B.2 (red), and chart points are as shown in Figure B.1 (green), with 50% error calibration (blue). Trendlines are linear regressions of the data points shown.

Figure A3.
Reproducibility vs. mean Cr(VI) concentration plots from the data presented in annex B (Figure B.1) of BS EN ISO 17075:1-2017 [11]. Author derived linear regression of the figure points (red) are compared to the linear regression shown in Figure B.1 (green).
Figure A3.
Reproducibility vs. mean Cr(VI) concentration plots from the data presented in annex B (Figure B.1) of BS EN ISO 17075:1-2017 [11]. Author derived linear regression of the figure points (red) are compared to the linear regression shown in Figure B.1 (green).


References
- Covington, A.D.; Wise, W.R. Tanning Chemistry: The Science of Leather, 2nd ed.; RSC: London, UK, 2019; Chapter 10; pp. 224–242. [Google Scholar]
- Thomson, R.S. Chrome tanning in the nineteenth century. J. Soc. Leather Technol. Chem. 1985, 69, 93–98. [Google Scholar]
- Hedberg, Y.S.; Lidén, C.; Wallinder, I.O. Correlation between bulk-and surface chemistry of Cr-tanned leather and the release of Cr(III) and Cr(VI). J. Hazard. Mater. 2014, 280, 654–661. [Google Scholar] [CrossRef] [Green Version]
- Jing, C.; Nan, Z.; Wuyong, C.; Shiyu, S. Controlling Cr(VI) in leather: A review from passive prevention to stabilization of chromium complexes. J. Am. Leather Chem. Assoc. 2017, 112, 250–257. [Google Scholar]
- Ozkan, C.K.; Ozgunay, H.; Kalender, D. Determination of Antioxidant Properties of Commonly Used Vegetable Tannins and Their Effects on Prevention of Cr(VI) Formation. J. Soc. Leather Technol. Chem. 2015, 99, 245–249. [Google Scholar]
- Alvarez, C.C.; Bravo Gómez, M.E.; Hernández Zavala, A. Hexavalent chromium: Regulation and health effects. J. Trace Elem. Med. Biol. 2021, 65, 126729–126737. [Google Scholar] [CrossRef]
- Buters, J.; Biedermann, T. Chromium(VI) contact dermatitis: Getting closer to understanding the underlying mechanisms of toxicity and sensitization! J. Investig. Dermatol. 2017, 137, 274–277. [Google Scholar] [CrossRef] [Green Version]
- Bregnbak, D.; Johansen, J.D.; Jellesen, M.S.; Zachariae, C.; Menne, T.; Thyssen, J.P. Chromium allergy and dermatitis: Prevalence and main findings. Contact Dermat. 2015, 73, 261–280. [Google Scholar] [CrossRef] [PubMed]
- Moretto, A. Hexavalent and trivalent chromium in leather: What should be done? Regul. Toxicol. Pharmacol. 2015, 73, 681–686. [Google Scholar] [CrossRef] [PubMed]
- Ludvik, J. Chrome Balance in Leather Processing; UNIDO: Vienna, Austria, 2000. [Google Scholar]
- BS EN ISO 17075-1:2017, British Standards Institute. Available online: https://0-shop-bsigroup-com.brum.beds.ac.uk/products/leather-chemical-determination-of-chromiumvi-content-in-leather-colorimetric-method/standard (accessed on 10 December 2021).
- BS EN ISO 17075-2:2017, British Standards Institute. Available online: https://www.mystandards.biz/standard/bseniso-17075-2-2017-28.2.2017.html (accessed on 10 December 2021).
- The European Chemicals Agency (ECHA). Available online: https://echa.europa.eu/documents/10162/1f775bd4-b1b0-4847-937f-d6a37e2c0c98 (accessed on 10 October 2021).
- The European Chemicals Agency (ECHA). Available online: https://echa.europa.eu/documents/10162/fc80f2eb-1d47-f82a-2be5-b90cdcdb5db5 (accessed on 10 October 2021).
- Ogata, K.; Kumazawa, Y.; Koyama, Y.; Yoshimura, K.; Takahashi, K. Measurement of hexavalent chromium in chrome-tanned leather: Comparative study of acidic extraction with alkaline extraction. J. Soc. Leather Technol. Chem. 2015, 99, 293–296. [Google Scholar]
- Long, A.J.; Cory, N.J.; Wood, C.B. Potential chemical mechanisms causing false positive results in hexavalent chromium determination. J. Soc. Leather Technol. Chem. 2000, 84, 74–78. [Google Scholar]
- Soares, R.; Carneiro, M.C.; Monteiro, M.I.C.; de Souza Henrique, S.; Pontes, F.V.M.; da Silva, L.I.D.; Neto, A.A.; Santelli, R.E. Simultaneous speciation of chromium by spectrophotometry and multicomponent analysis. Chem. Speciat. Bioavailab. 2009, 21, 153–160. [Google Scholar] [CrossRef]
- Rotzinger, F.P.; Stünzi, H.; Marty, W. Early stages of the hydrolysis of chromium(III) in aqueous solution. 3. Kinetics of dimerization of the deprotonated aqua ion. Inorg. Chem. 1986, 25, 489–495. [Google Scholar] [CrossRef]
- Beverskog, B.; Puigdomenech, I. Revised pourbaix diagrams for chromium at 25–300 °C. Corros. Sci. 1997, 39, 43–57. [Google Scholar] [CrossRef]
- Bensalem, A.; Weckhuysen, B.M.; Schoonheydt, R.A. In Situ Diffuse Reflectance Spectroscopy of Supported Chromium Oxide Catalysts: Kinetics of the Reduction Process with Carbon Monoxide. J. Phys. Chem. B 1997, 101, 2824–2829. [Google Scholar] [CrossRef] [Green Version]
- Sanchez-Hachair, A.; Hofmann, A. Hexavalent chromium quantification in solution: Comparing direct UV–visible spectrometry with 1, 5-diphenylcarbazide colorimetry. Comptes Rendus Chim. 2018, 21, 890–896. [Google Scholar] [CrossRef]
- Fontaine, M.; Blanc, N.; Cannot, J.-C.; Demesmay, C. Ion Chromatography with Post Column Derivatization for the Determination of Hexavalent Chromium in Dyed Leather. Influence of the Preparation Method and of the Sampling Location. J. Am. Leather Chem. Assoc. 2017, 112, 319–326. [Google Scholar]
- Kral, I.; Buljan, J. The Framework for Sustainable Leather Manufacture, 2nd ed.; UNIDO: Vienna, Austria, 2019. [Google Scholar]
- Demertzis, M.A. Low detection limit spectrophotometry. Anal. Chim. Acta 2004, 505, 73–76. [Google Scholar] [CrossRef]
- Pflaum, R.T.; Howick, L.C. The Chromium-Diphenylcarbazide Reaction1. J. Am. Chem. Soc. 1956, 78, 4862–4866. [Google Scholar] [CrossRef]
- Jeffery, P.G.; Hutchison, D. Chemical Methods of Rock Analysis, 3rd ed.; Butterworth-Heinemann: Oxford, UK, 1981; Chapter 17; pp. 159–166. [Google Scholar]
- UOP 1031-19, ASTM International. Available online: https://www.mystandards.biz/standard/uop-1031-19-1.5.2019.html (accessed on 10 December 2021).
Figure 1.
Absorbance vs. time of a solution of DPC and Cr(VI) at 540 nm.

Figure 2.
(a) Apparent Cr(VI) concentration (mg kg−1) of a Cr(III) and gelatine solution vs. extraction time (minutes), (b) UV spectra of the same solution after 115 min: with DPC (Blue), without DPC (Red).
Figure 2.
(a) Apparent Cr(VI) concentration (mg kg−1) of a Cr(III) and gelatine solution vs. extraction time (minutes), (b) UV spectra of the same solution after 115 min: with DPC (Blue), without DPC (Red).

Figure 3.
(a) Apparent Cr(VI) concentration (mg kg−1) of a Cr(VI) and gelatine solution vs. extraction time (minutes), (b) UV spectra of the same solution after 115 min: with DPC (Blue), without DPC (Red).
Figure 3.
(a) Apparent Cr(VI) concentration (mg kg−1) of a Cr(VI) and gelatine solution vs. extraction time (minutes), (b) UV spectra of the same solution after 115 min: with DPC (Blue), without DPC (Red).

Figure 4.
Chromatogram of a solution containing Cr(VI) (60 µg dm−3 and Cr(III) (280 mg dm−3).

Figure 5.
Normalised intensity vs. retention time (minutes) of solutions containing: Cr(VI) (blue), extract from leather containing a red dye (red), extract from leather containing a yellow dye (green).
Figure 5.
Normalised intensity vs. retention time (minutes) of solutions containing: Cr(VI) (blue), extract from leather containing a red dye (red), extract from leather containing a yellow dye (green).

Figure 6.
Normalised absorbance vs. wavelength of the selected peaks from Figure 5: solution containing Cr(VI) (peak 1) (blue), extract from leather containing a yellow dye (peak 2) (green), extract from leather containing a red dye (peak 3) (red).
Figure 6.
Normalised absorbance vs. wavelength of the selected peaks from Figure 5: solution containing Cr(VI) (peak 1) (blue), extract from leather containing a yellow dye (peak 2) (green), extract from leather containing a red dye (peak 3) (red).

Figure 7.
Absorbance vs. concentration calibrations for all BS EN ISO 17075 methods: colorimetric at 40 mm path length (Blue), direct chromatographic at 50 uL injection (red), Cr (III)-Carbazone chromatographic 50 µL injection (purple) and 100 µL injection (green).
Figure 7.
Absorbance vs. concentration calibrations for all BS EN ISO 17075 methods: colorimetric at 40 mm path length (Blue), direct chromatographic at 50 uL injection (red), Cr (III)-Carbazone chromatographic 50 µL injection (purple) and 100 µL injection (green).

Figure 8.
Reproducibility vs. mean Cr (VI) concentration plots: colorimetric method (red), chromatographic method (green), 50% error calibration (blue).
Figure 8.
Reproducibility vs. mean Cr (VI) concentration plots: colorimetric method (red), chromatographic method (green), 50% error calibration (blue).

Table 1.
Theoretical concentrations of Cr(VI) in solution for the current and proposed compliance limits in leather.
Table 1.
Theoretical concentrations of Cr(VI) in solution for the current and proposed compliance limits in leather.
| Detection Method | 3 mg kg−1 Cr(VI) in Leather | 1 mg kg−1 Cr(VI) in Leather | ||
|---|---|---|---|---|
| Cr(VI) in Solution (mg L−1) | Cr(VI) in Solution (µM) | Cr(VI) in Solution (mg L−1) | Cr(VI) in Solution (µM) | |
| Colorimetric Method | 0.010 | 0.18 | 0.003 | 0.06 |
| Direct Chromatographic Method | 0.061 | 1.18 | 0.021 | 0.41 |
| DPC Chromatographic Method (100 µL) | 0.059 | 1.13 | 0.019 | 0.36 |
| DPC Chromatographic Method (50 µL) | 0.062 | 1.19 | 0.022 | 0.42 |
Table 2.
Limits of quantification for the colorimetric and chromatographic methods of BS EN ISO 17075.
Table 2.
Limits of quantification for the colorimetric and chromatographic methods of BS EN ISO 17075.
| Analytical Method | Average LOQ (mg kg−1) | Error LOQ (mg kg−1) |
|---|---|---|
| Colorimetric | 6.50 | 0.81 |
| Chromatographic | 4.15 | 3.22 |
Publisher’s Note: MDPI stays neutral with regard to jurisdictional claims in published maps and institutional affiliations. |
© 2021 by the authors. Licensee MDPI, Basel, Switzerland. This article is an open access article distributed under the terms and conditions of the Creative Commons Attribution (CC BY) license (https://creativecommons.org/licenses/by/4.0/).
Share and Cite
MDPI and ACS Style
Davis, S.J.; Wise, W.R.; Recchia, S.; Spinazzè, A.; Masi, M. The Evaluation of the Detection of Cr(VI) in Leather. Analytica 2022, 3, 1-13. https://0-doi-org.brum.beds.ac.uk/10.3390/analytica3010001
AMA Style
Davis SJ, Wise WR, Recchia S, Spinazzè A, Masi M. The Evaluation of the Detection of Cr(VI) in Leather. Analytica. 2022; 3(1):1-13. https://0-doi-org.brum.beds.ac.uk/10.3390/analytica3010001
Chicago/Turabian StyleDavis, Stefan John, William Robert Wise, Sandro Recchia, Andrea Spinazzè, and Maurizio Masi. 2022. "The Evaluation of the Detection of Cr(VI) in Leather" Analytica 3, no. 1: 1-13. https://0-doi-org.brum.beds.ac.uk/10.3390/analytica3010001