
Recent Progress and Perspectives on Non-Invasive Glucose Sensors
by
 , , and
Nicholas B. Davison
1,2,3 ,
,
Christopher J. Gaffney
1,3,
Jemma G. Kerns
1,3 and
Qiandong D. Zhuang
2,3,* 1
Lancaster Medical School, Faculty of Health and Medicine, Lancaster University, Lancaster LA1 4AT, UK
2
Department of Physics, Faculty of Science and Technology, Lancaster University, Lancaster LA1 4YB, UK
3
Materials Science Institute, Lancaster University, Lancaster LA1 4YB, UK
*
Author to whom correspondence should be addressed.
Diabetology 2022, 3(1), 56-71; https://0-doi-org.brum.beds.ac.uk/10.3390/diabetology3010005
Submission received: 31 October 2021
/
Revised: 7 January 2022
/
Accepted: 9 January 2022
/
Published: 12 January 2022
Abstract
:Self-monitoring of blood glucose forms an important part of the management of diabetes and the prevention of hyperglycaemia and hypoglycaemia. Current glucose monitoring methods either use needle-prick enzymatic glucose-meters or subcutaneous continuous glucose sensors (CGM) and thus, non-invasive glucose measurements could greatly improve the self-management of diabetes. A wide range of non-invasive sensing techniques have been reported, though achieving a level of precision comparable to invasive meters remains a challenge. Optical sensors, which utilise the interactions between glucose and light, offer the potential for non-invasive continuous sensing, allowing real-time monitoring of glucose levels, and a range of different optical sensing technologies have been proposed. These are primarily based upon optical absorption and scattering effects and include infrared spectroscopy, Raman spectroscopy and optical coherence tomography (OCT), with other optical techniques such as photoacoustic spectroscopy (PAS) and polarimetry also reported. This review aims to discuss the current progress behind the most reported optical glucose sensing methods, theory and current limitations of optical sensing methods and the future technology development required to achieve an accurate optical-based glucose monitoring device.
1. Introduction
Accurate glucose monitoring forms an essential part of the management of diabetes. Glucose is one of the most important sources of energy in living organisms, being used in respiration to produce oxygen, water and, critically, energy in the form of Adenosine triphosphate (ATP) [1]. The concentration of glucose in the blood is regulated by the hormone insulin, which is produced by β-cells in the pancreas and promotes glucose uptake into the muscle as well as increasing the amount of glucose that is converted to glycogen [2]. Maintaining the blood glucose concentration between 4–6mmol/L is vital as both hypoglycaemia and hyperglycaemia can have a detrimental effect on the body [3,4]. Diabetes mellitus is a condition associated with poor glucose regulation and insulin resistance, broadly distinguished into two categories: type 1 is where β-cells do not produce insulin, and type 2 where the β-cells produce sufficient insulin but the skeletal muscle and other tissues become resistant to insulin [5]. There are several acute complications associated with diabetes, including Hyperosmolar Hyperglycaemic Syndrome (HHS), Diabetic Ketoacidosis (DKA) and severe long-term effects caused by inflammation of tissues due to high glucose concentrations [6]. Damage to large blood vessels can lead to heart attack and stroke, whilst damage to the smaller blood vessels can cause damage to the eye (retinopathy) [7], nerves (neuropathy) [8] and kidney (nephropathy) [9], leading to a range of complications.
The global prevalence of diabetes appears to be rising at an alarming rate. Estimates suggest that prevalence of the disease rose from 108 million in 1980 [10] to 451 million by 2017 [11]. It is clear that diabetes is becoming a serious concern, and successfully caring for the ever-increasing number of diabetes patients is a significant challenge for healthcare systems worldwide [12].
Accurate tests for glucose can be carried out in hospitals using a blood test, where HbA1c is the main diagnostic measure for diabetes (>6.5% [13]) [14]. However, many patients (especially with type 1 diabetes) must monitor their blood sugar levels several times a day [6] and so a user-friendly glucose meter that can be operated by the patient and give near-instantaneous results is vital. The International Organisation for Standards (ISO) 15,197 [15] states that results from blood glucose meters should differ by no more than 15% from laboratory values, with the additional constraint that they should be no more than 0.8 mmol/L different for concentrations below 5.6 mmol/L. Most glucose monitoring is commonly done using needle-based glucose-meters or subcutaneous implantable sensors [16,17]. The significant disadvantage of these technologies is that they are invasive and can be painful and inconvenient for the patient, hence the considerable research interest in non-invasive blood glucose sensing technologies.
Most non-invasive sensors use electrochemical, transdermal or optical approaches, though a recent review of current non-invasive technologies [18] showed optical approaches to be the most common. Electrochemical methods, which can be enzymatic or use metallic or carbon-based materials, use similar detection principles as blood glucose meters, and often use tears or saliva instead of blood [19]. Although such sensors show high accuracy in invasive devices, they are affected by pH changes, and non-invasive electrochemical devices cannot provide continuous measurements, which gives them less advantage over subcutaneous CGM monitors. Transdermal sensors usually involve passing a current through the skin and therefore probing the electrical properties of the interstitial fluid, normally using impedance [20,21] or electrolysis-based methods such as iontophoresis [22,23]. These sensors offer the major advantage of being wearable, and have reported very strong correlations with glucose concentration; however, the use of electric currents can cause skin irritation [23,24]. GlucoWatch [25], one of the earliest commercially available non-invasive glucose sensing devices, used reverse iontophoresis. However, it was not sensitive enough to detect rapid changes [26] in glucose concentration and has since been discontinued. Optical techniques utilise the numerous interactions between glucose and light, and can provide continuous monitoring which is non-invasive and painless. This review aims to discuss the most reported optical sensing techniques, addressing the theory behind each technique and the current progress in each area. Section 2 discusses the attenuation of light by glucose according to the Beer-Lambert Law and including the effects of absorption and scattering. Optical sensing technologies which result from this theory are discussed in Section 3, and particular emphasis is given to near infrared (NIR) spectroscopy, given the large variety of NIR sensing studies reported. Given the strong penetration of NIR light, the high performance of NIR optoelectronic devices (e.g., highly sensitive detection and efficient light emission), and the simplicity of NIR optics, NIR appears to be one of the most promising technologies for glucose sensing, whilst optical coherence tomography, Raman spectroscopy, polarimetry and photoacoustic spectroscopy are also discussed.
2. Interactions of Glucose with Light
2.1. The Beer-Lambert Law
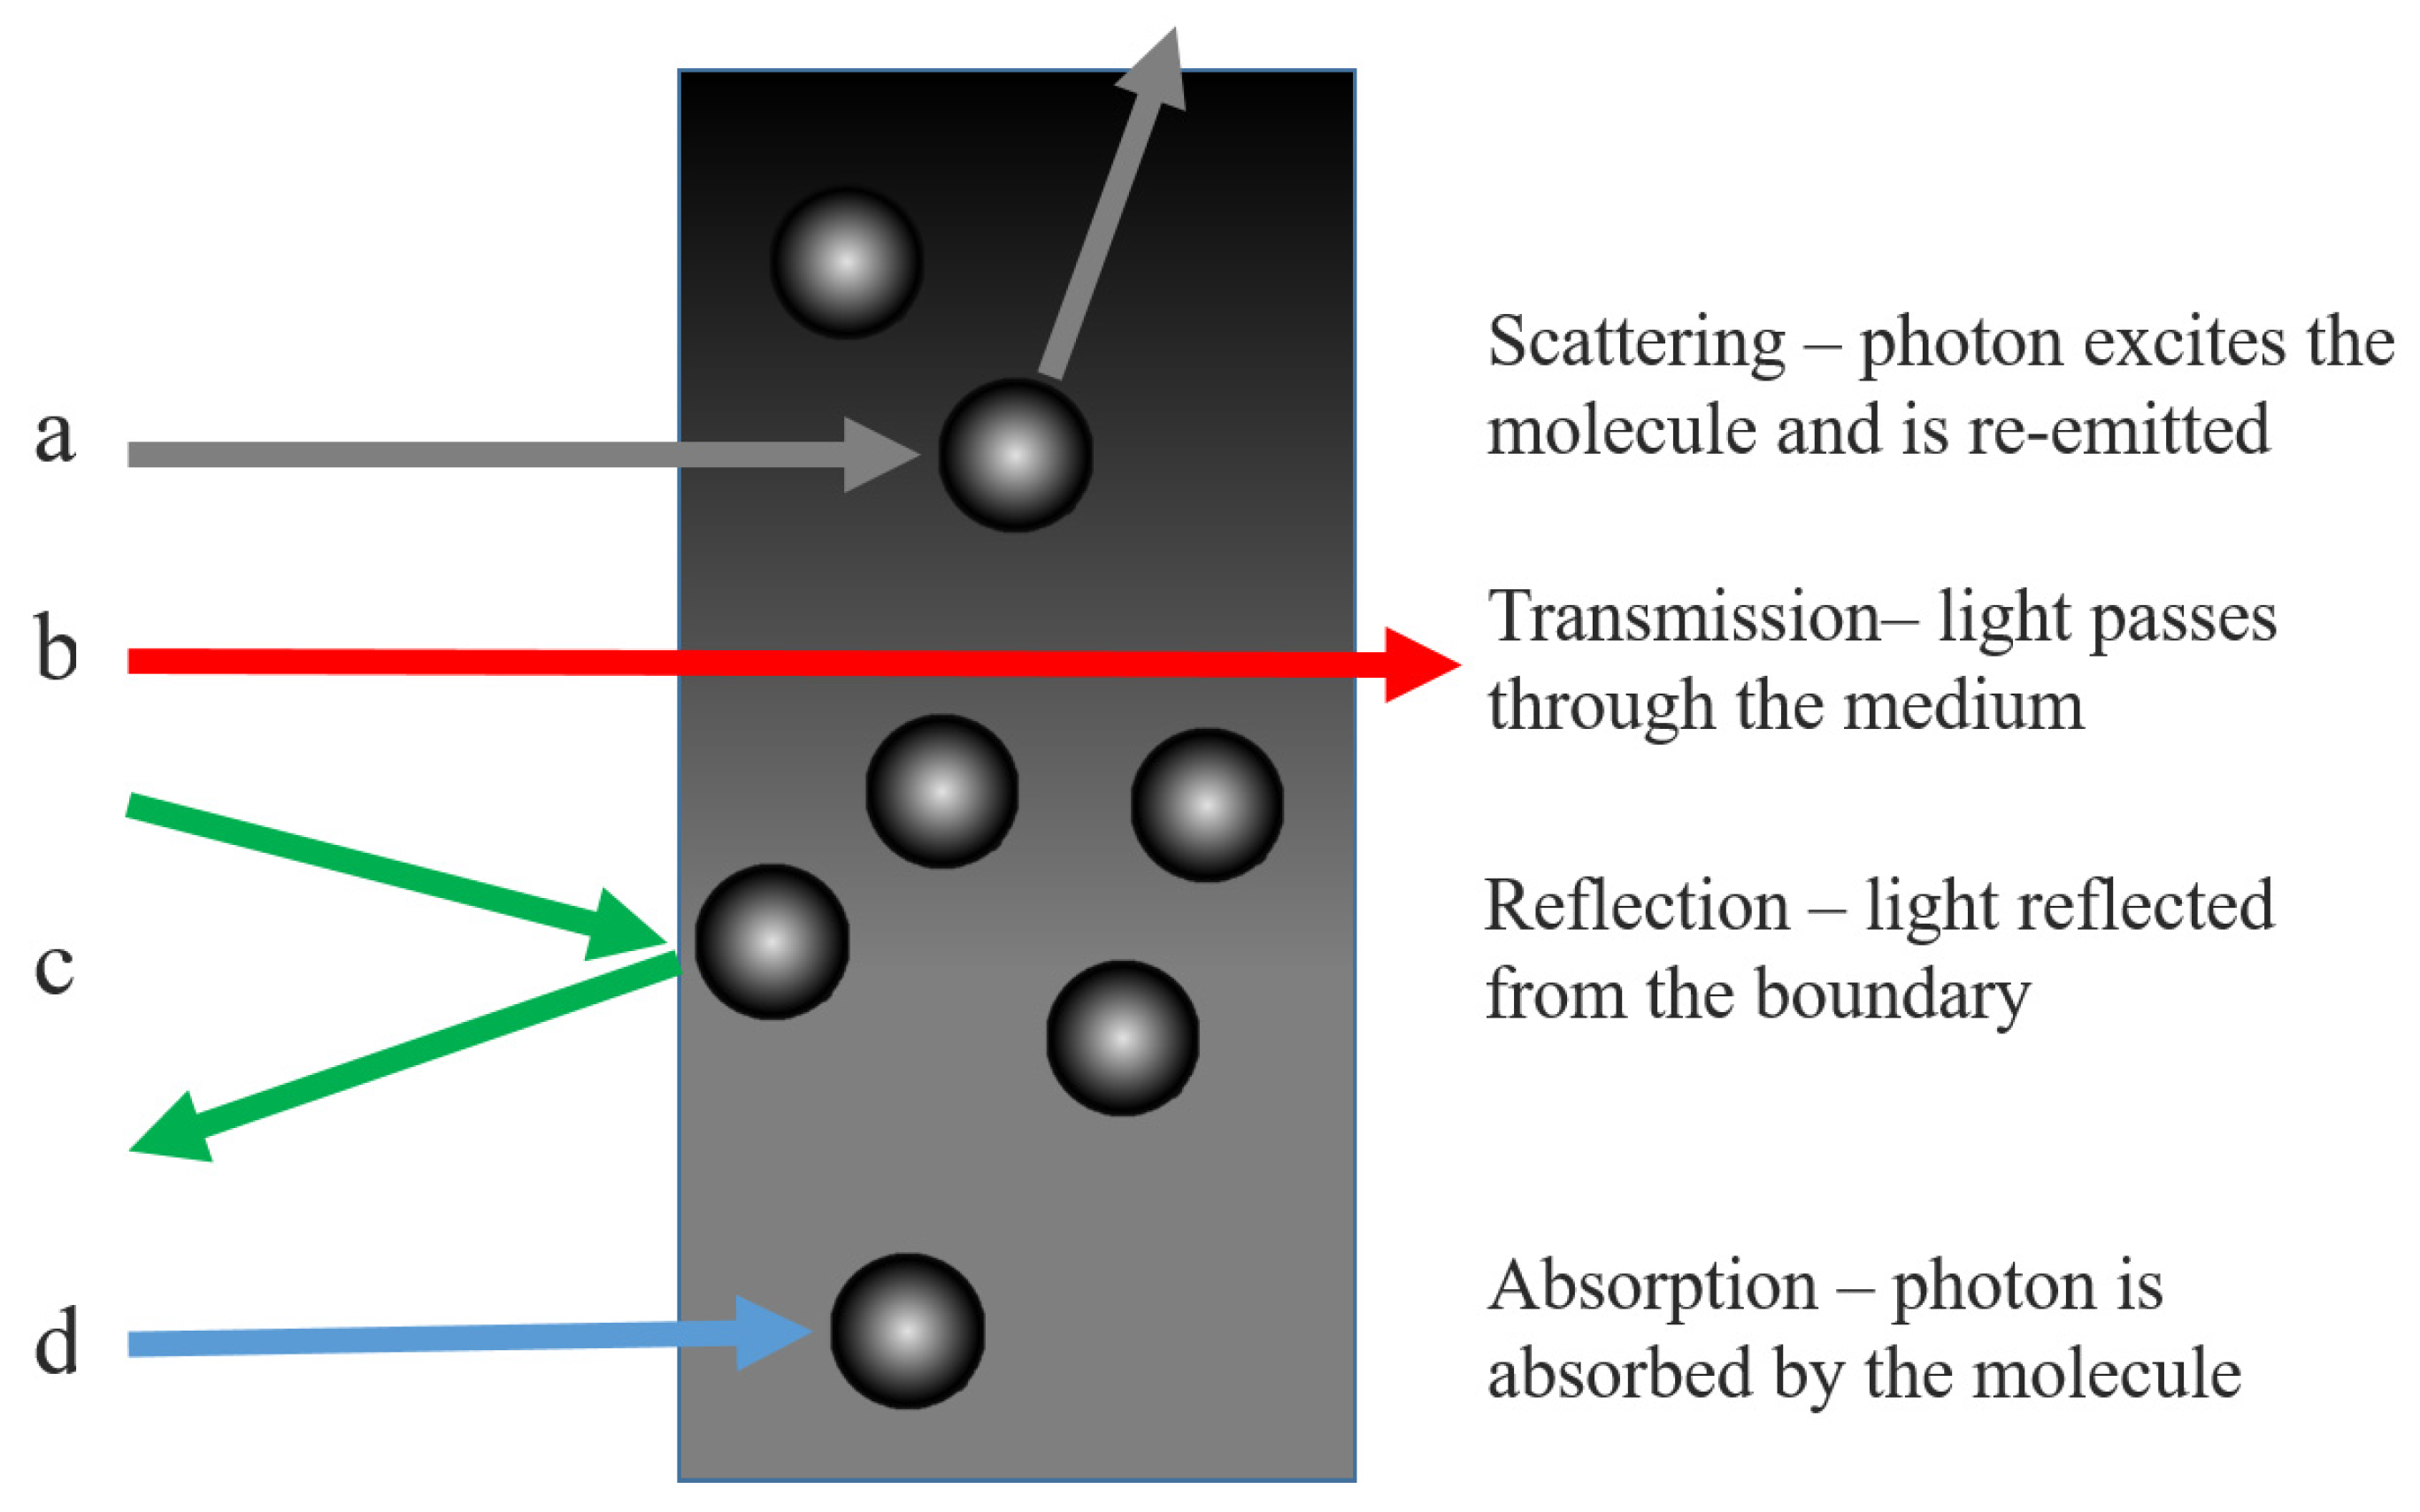
The attenuation of light by a material is approximately described by the Beer-Lambert Law. The law arises from a consideration of light passing through a medium, shown in Figure 1, which shows the processes light can undergo within the medium. Light with initial intensity I0 passing through a homogeneous medium will have intensity I(z) at a given depth z into the medium. Losses are due to absorption, scattering and reflection from the boundary, though in the case of solutions, reflection can be considered negligible.
The absorbance, A, the decadic logarithm of transmittance, T (defined as the ratio of output to input light), can be expressed in Equation (1).
Absorbance, A, is dependent on the path depth and is the sum of the individual absorbances of all components of the sample. Each is described by a molar attenuation, ϵ(λ), which describes how strongly it attenuates light and is wavelength (λ) dependent, and the concentration, c, integrated over the optical path, l [27]. The attenuation coefficient µ is the sum over all concentrations and molar attenuations, as given in Equation (2), and is related to the absorbance as such. Assuming a homogeneous, isotropic solution, the final statement of the Beer-Lambert Law is obtained in Equation (3).
Absorption occurs when a molecule absorbs a photon, resulting in an excitation of one of the energy states of that molecule, usually corresponding to a rotational or vibrational degree of freedom related to molecular bond structure. The electron may subsequently return to the ground state during relaxation. In contrast, scattering is the process whereby a molecule absorbs a photon, raising the electrons to a ‘virtual’ excited state, and immediately re-emits a photon. This should not be confused with fluorescence, where the electron is excited to a real excited state and then a photon is emitted after a short time during relaxation. The attenuation coefficient µ can be treated as the sum of an absorption coefficient, µa and a scattering coefficient µ′s [28]. The absorption coefficient is wavelength and concentration dependent, thus the outgoing light intensity can be used to determine the concentration of the analyte. However, tissue contains multiple analytes such as lipids, proteins and large particles, leading to a highly complicated system. This makes a precise determination of glucose concentration challenging and it is also necessary to consider scattering, adding further complexity.
2.2. Scattering by Large Particles in Solution
During optical scattering, an incoming photon is absorbed by the molecule and re-emitted with a different momenta and direction. Thus, the photon is said to have been scattered and if the emitted photon has the same energy as the incoming photon then the scattering is elastic, whilst the converse is inelastic scattering. Scattering is categorised by the size ratio, x, given in Equation (4) where r is the radius of the scattering centre and λ is the wavelength of the light.
If x is much greater than 1 then the particle is so large that the system is described by Gaussian optics and light does not scatter. If x is much less than 1 then the particle is small enough to be treated as a point particle and light can scatter in all directions, called Rayleigh Scattering. The cross-section σRayleigh for Rayleigh scattering is given in Equation (5), [29], where n is the refractive index.
Mie Scattering, when x is on the order of 1, is where the size of the particle affects the solution and is the case for particles like red blood cells (x ≈ 10). When the particle is of similar size to the wavelength, it forms a boundary which the electromagnetic wave can travel through. Some incident light will be reflected at the boundary and some transmitted. The reflected light will be scattered in different directions from the curved surface whilst within the particle the light will be refracted as it enters and exits the particle [30]. Since the particle is small in size, the wave solution inside the sphere will not be plane waves as the waves from every point on the boundary will be continually interfering with each other. The result [31] is described by Spherical Bessel functions, jn(x), hn(x) (where n is an integer and x is a spatial coordinate).
Mie scattering, which increasingly asymmetric as the size of the particle increases, leads to far more light scattered in the direction of incidence and much less back-scattering. Equation (6) gives the expression for the cross-section of Mie Scattering, where x is the ratio defined in Equation (4) and a is the radius of the particle [30,32].
Mie Scattering does not refer to the scattering of light by the glucose itself, that effect is negligible. However, it does occur in glucose solutions containing large particles, which act as Mie scattering centres. Experimentally, the scattering coefficient appears to decrease roughly linearly with increased glucose concentration, with values from Kohl et al. [33] (using polystyrene nanoparticles as scatterers) suggesting a change of −0.012% mmol−1 at λ = 700 nm, in good agreement with the theoretical predictions from the Mie theory. The same study also found that the anisotropy changed by 8.45 × 10⁻⁶ mmol−1 meaning that at higher glucose concentrations there is more forward scattering. Graaf et al. [34] modelled the Mie Scattering from a dielectric sphere to obtain Equation (7) for the reduced scattering coefficient, where ρ is the volume density of the particle, a is the particle radius and mmedium is the refractive index of the medium.
Equation (7) can be modified [35] to include the glucose-induced change of the refractive index, δng, given in Equation (8).
It is clear that as the glucose concentration increases the mismatch between the refractive index of the particles and that of the medium decreases. The change in scattering coefficient (per mmol of glucose) has been measured in vivo in human tissue, ranging from 0.6% mmol−1 in muscle tissue [36] to 0.1% mmol−1 in adipose tissue [37]. This is, of course, because the refractive indices of these different tissues vary, however glucose has a more dominant optical effect than many other analytes.
Mie Scattering is significantly more complicated than Rayleigh scattering, introducing asymmetry and requiring a reduced coefficient. However, the Beer-Lambert Law can still be used, provided that care is taken when defining the attenuation coefficient µ. These parameters can be intrinsically linked to the glucose concentration, providing the basis for an accurate determination of the concentration from the optical properties of the solution.
3. Optical Sensing of Glucose
3.1. Overview of Infrared Spectroscopy
Light passed through a sample will produce absorption bands corresponding to the regions in which light has been absorbed. The frequencies at which the light is absorbed in this region correspond to the vibrational energy modes of the molecule, associated with the vibration of molecular bonds, such as stretching and bending. Each mode can be modelled as a Morse potential, a modified quantum harmonic oscillator (QHO) which takes account of the difference between the bond length and the actual distance between the atomic centres [38]. Figure 2 shows the energy levels of the QHO and also of the Morse potential, showing the dissociation potential, De (the energy needed to fully break the bond from the ground state). The solution takes a similar form to the QHO (1st term), producing a series of energy states (m = 0, 1, 2…), but with an additional term and is given by Equation (9), where ω is the angular frequency of the oscillation.
A notable feature of the Morse potential model is that dipole transition rules [39] allow transitions between states when ∆m is any integer (restricted in the QHO to ∆m = ±1 [40]). The Morse model therefore explains the existence of overtones—excitations to higher states (m = 2 and above). Fundamental modes are often at mid infrared wavelengths, though many molecules, including glucose, exhibit overtone bands in the near infrared. Combination bands, which occur when more than one separate modes are simultaneously excited by the same photon, are also present in this region.
The absorption peaks of glucose mainly lie in the mid infrared (2.5–50 µm) to near infrared (0.7–5 µm). The mid infrared (MIR) region contains the fundamental absorption bands with the strongest intensity, however the penetration of MIR light in tissue is low and limits the optical path length to around 100 µm [41]. The near infrared (NIR) region contains overtone bands which are less clearly-defined than the mid infrared. NIR spectroscopy is one of the most popular approaches due to the high penetration of the near infrared into the tissue, allowing light to access the subcutaneous layer. The strongest penetration is from 900–1600 nm (the so-called ‘biological window’), where strong optical contrast has been shown to be maintained at depths of up to 3 mm in thigh tissue [42]. Furthermore, there are well-established NIR photodetectors and light emitters which can be easily incorporated into NIR optical assemblies [43].
3.1.1. Mid Infrared Spectroscopy
Glucose has a strong mid infrared (MIR) fundamental vibrational absorption band in the 8–10 µm region, with distinctive peaks at 9260 and 9660 nm (1080 and 1035 cm−1). This is distinct from other analytes except water, which has a broad absorption throughout the MIR [44], and the specificity of this band is the principal advantage of using the MIR. Glucose sensing in the MIR has been demonstrated in aqueous solution, serum and human subjects [44,45] using MIR quantum cascade lasers, and it was found that 84% of results were within the clinically acceptable region of the Clarke analysis grid [46]. Attenuated total reflection (ATR) MIR was used with a three-wavelength model to obtain high accuracy results in the Clarke grid [47], however, another study found that ATR was unlikely to be effective due to the poor penetration of MIR light (up to 10 µm) and further confounding factors [48]. The penetration depth of MIR and the consequently short path length is the primary limitation of this wavelength range compared to the near infrared region.
3.1.2. Near Infrared Spectroscopy
The near infrared (NIR) spectrum of glucose consists of several regions. The combination band region contains three absorption peaks at 2120 nm, 2270 nm and 2320 nm, decreasing successively in intensity and caused by stretches in the C-H bonds and the bending of O-H and CH bonds in combination [49]. Other biological molecules including urea, lactate and alanine have similar patterns of combination bands in this region [50], meaning that identifying individual analytes can be complex. The first overtone band lies at 1400–2000 nm, with a peak around 1688 nm caused by a second-level excitation of the -CH group bond [51]. Further overtones exist around 1210 nm and 1290 nm and are due to CH and OH bond stretching [41], though it is difficult from the literature to identify exactly which bonds these are caused by. The third overtones of the CH bond stretching and the CH2 stretching are at 910 nm and 930 nm, [52] respectively; however, the intensity of the overtones decreases steadily, and above the third overtones the peaks are usually concealed by stronger absorptions from other species, including fat, which has a broad absorption at 910–930 nm [53]. It is also worth noting that glucose shows a steep dip in absorption around 1900 nm, since water has a strong absorption band around 1900 nm. Lipids have strong absorption around 1720 nm (first C-H overtone), coinciding with the strong glucose -CH overtone band, which is a very broad band. As the two bands overlap, separating the two components could prove challenging, though the lipid peak is very sharp whilst the glucose band is much broader.
There has been a large number of preliminary studies of NIR glucose sensing in aqueous glucose solutions [54,55,56,57]; however, real tissue scattering has a significant effect on the transmission and absorption properties. Phantoms containing intralipid scatterers have often been used to test optical glucose sensing techniques. Intralipid solutions (1% to 10%) have been used to investigate the accuracy of transmission and reflectance spectroscopy in the 1100–2500 nm region [58], where it was found that the reflected light did not contain as much information about glucose absorption as transmission due to its short (0.25 mm) path length. Reflectance was also more affected by scattering in the medium and the Standard Error of Prediction (SEP) was 24.3 mmol/L compared to 2.1 mmol/L for transmission—a 12-fold greater error. Phantoms have also been used to investigate how the source-detector separation can be optimised to separate diffuse reflectance (reflectance from the boundary) from absorption [59].
A number of NIR optical assemblies have been tested with human subjects and compared to blood glucose meter readings (finger-prick devices). Preliminary work on this using various lab-based optical apparatus, including a Fourier transform infrared spectrometer (FTIR) and a grating spectrometer (with InSb photodiode) studied transmission through the finger [60]. The smallest error of prediction was with the FTIR spectrometer, which established the potential of NIR for glucose sensing, although FTIR would be challenging to downscale into a portable device. NIR reflectance from the human forearm has been studied using InGaAs scanning diodes arrays and found that the regression vector had a peak around 1600 nm, corresponding to the strong overtone from glucose [61,62]. Using that wavelength to quantify the glucose concentration, a correlation coefficient (R2) value of 0.934 and a standard error of prediction (SEP) of 13.0 mmol/L were obtained. The same study also found that the path length of 1600 nm light in the epidermis was 1.3–2.0 mm. Optical path length increases as wavelength decreases, and 650 nm has been shown as 30 times more transmissible than 950 nm in human tissue [63]. However, of the NIR wavelengths, 1550 nm showed the strongest correlation (corresponding to the overtone band) to glucose concentration, with an R2 of 0.734 [64]. This wavelength, used in an LED-based sensor on the earlobe of test subjects, showed a 28% error when compared to glucose meter values, highlighting the difference between measuring glucose in simple solution and in real tissue. The palm of the hand has been investigated as a measurement site and results varied between probe setups [65].
The accuracy of different measurement sites on the body depends a lot upon the optical path length, which is influenced by subcutaneous fat content. An evaluation of different measurement sites concluded that, of the tongue, cheek, lip and webbing between the fingers, the fat absorption obscured the glucose overtone band at 1680 nm most strongly in the webbing and reduced the optical path length [66]. The highest optical path length was in the tongue, over 5 mm in water, meaning that from a purely optical standpoint the tongue was the optimal site for measuring blood glucose. However, the tongue is unlikely to be the most practical site for measurement, and much of the current research focuses on the arm or finger.
In recent years, there has been increasing interest in using NIR photoplethysmography (PPG), the oscillating optical signal due to changes in blood volume [67]. The reflectance PPG peak in human subjects can produce an R2 value of 0.8 for postprandial glucose levels [68] with glucose concentration most strongly correlated to peak PPG wave height compared to other PPG variables, demonstrating an R2 value of 93% with an SEP of 0.23 mmol/L in one study [69]. In the 530–950 nm region, the PPG wave peak has been used to measure blood glucose concentration and applying Partial Least Squares (PLS) analysis obtained an R2 value of 0.86 and SEPs of 0.3 mmol/L or less [70]. It was noted that the height of the PPG wave is correlated to the blood viscosity, which itself increases with increased glucose.
There are a plethora of different approaches to NIR spectroscopy-based glucose sensing. Studies have used different wavelengths, with some prioritising the penetration and others the strength of the absorption peaks. There are also numerous different measurement sites proposed, and different measurement schemes such as transmission, reflection or PPG. While no NIR setup has yet achieved suitable accuracy, it is clear that this technology offers potential for non-invasive glucose sensing.
3.2. Raman Spectroscopy
3.2.1. The Raman Effect
The Raman Effect describes light scattering during which the wavelength shifts, resulting in an energy exchange between the photon and the molecule. During scattering, the molecule is excited to a virtual state which corresponds to the energy of the photon, then de-excites and a photon is re-emitted. Figure 3 illustrates the transitions associated with scattering. In most cases, the photon de-excites to the original ground state (Rayleigh scattering); however, if the molecule de-excites to one of the vibrational states, the re-emitted photon will have a different energy, an effect known as Stokes-Raman Scattering.
The Raman shift is visible in the peak located at µ−∆µ, where ∆µ describes the difference between the vibrational state and the ground state. Since this is inherently linked to the structure and polarisability of the molecule, Raman spectra can be used for identification. Often molecules with strong NIR spectra have weak Raman spectra, which is true for water. Whilst the NIR absorption from water is strong and can significantly complicate the spectra of other analytes such as glucose, the Raman response for water is weak, with a single broad band at 3000–3700 cm−1 [71]—a major advantage of Raman over NIR spectroscopy and which also means that measurements can be taken in vivo and do not require dehydration. However, the signal produced by Raman scattering can be as much as 10−6 times weaker than the source intensity, which can make Raman scattering difficult to detect. Hence, the sample must be excited by a high-power monochromatic light source such as a laser, generally with a short wavelength as the cross-section for Raman scattering increases by a λ−4 dependence. Commonly the back-scattered light is measured, although perpendicularly scattered light has also been used [72].
3.2.2. Glucose Sensing with Raman Spectroscopy
Raman spectroscopy offers the potential for non-invasive glucose sensing, and various studies have reported progress towards this. Raman spectra were acquired from glucose and galactose in the 800–1200 cm−1 region (caused by the stretching of C-C and C-O bands and wagging mode of the CH2 bond at 1333 cm−1) and the distinctive fingerprint for glucose are the peaks at 911, 1060 and 1125 cm−1, with 1125 cm−1 having the highest intensity [73]. Peaks with even larger shifts, 1265 cm−1 and 1367 cm−1, which are characteristic to glucose, have been used to measure the concentrations of aqueous glucose solutions in the 2–14 mmol/L range, reporting an R2 value of 0.9952 after PLS analysis [74].
Most studies involve lasers at either 830 nm or 785 nm (NIR region) due to the optimal skin penetration of the 600–1400 nm region. Raman spectroscopy with an 830 nm laser for glucose sensing has been demonstrated in porcine ears, using the distinctive glucose peaks at 911, 1060, and 1125 cm−1 and the strong peak from skin protein at 1450 cm−1 [75]. Using the 1450 cm−1 as a reference peak, measuring the band-area ratio with 1125 cm−1 and comparing with direct glucose measurements, an R2 value of 0.85–0.91 was obtained. Raman spectroscopy for analysis of glucose was first demonstrated in human subjects, using an 830 nm laser and measuring the back-scattered Raman signal from the forearm [76]. It was possible to separate the peak of glucose from the skin and, when compared to glucometer data, the technique had an average R2 of 0.83. A similar approach, also using the forearm but with a 785 nm laser and a larger sampling size of 111 subjects has achieved an R2 value of 0.83 also [77]. To highlight the difficulty in obtaining strong correlations with non-invasive sensing, R2 values of 0.91 have been obtained using invasive transcutaneous Raman-based sensors in mice [78]. The scattering from the skin can complicate non-invasive Raman measurements. More recently, glucose sensing in the palm of the hand with a confocal Raman probe, comprising an 830 nm laser, has been shown to give 93.6% of the results within the acceptable region in the Clarke comparison grid [79]. Development of Raman-based glucose sensors continues, though technologies have not yet been widely adopted clinically.
3.3. Optical Coherence Tomography
3.3.1. The OCT Interferometer
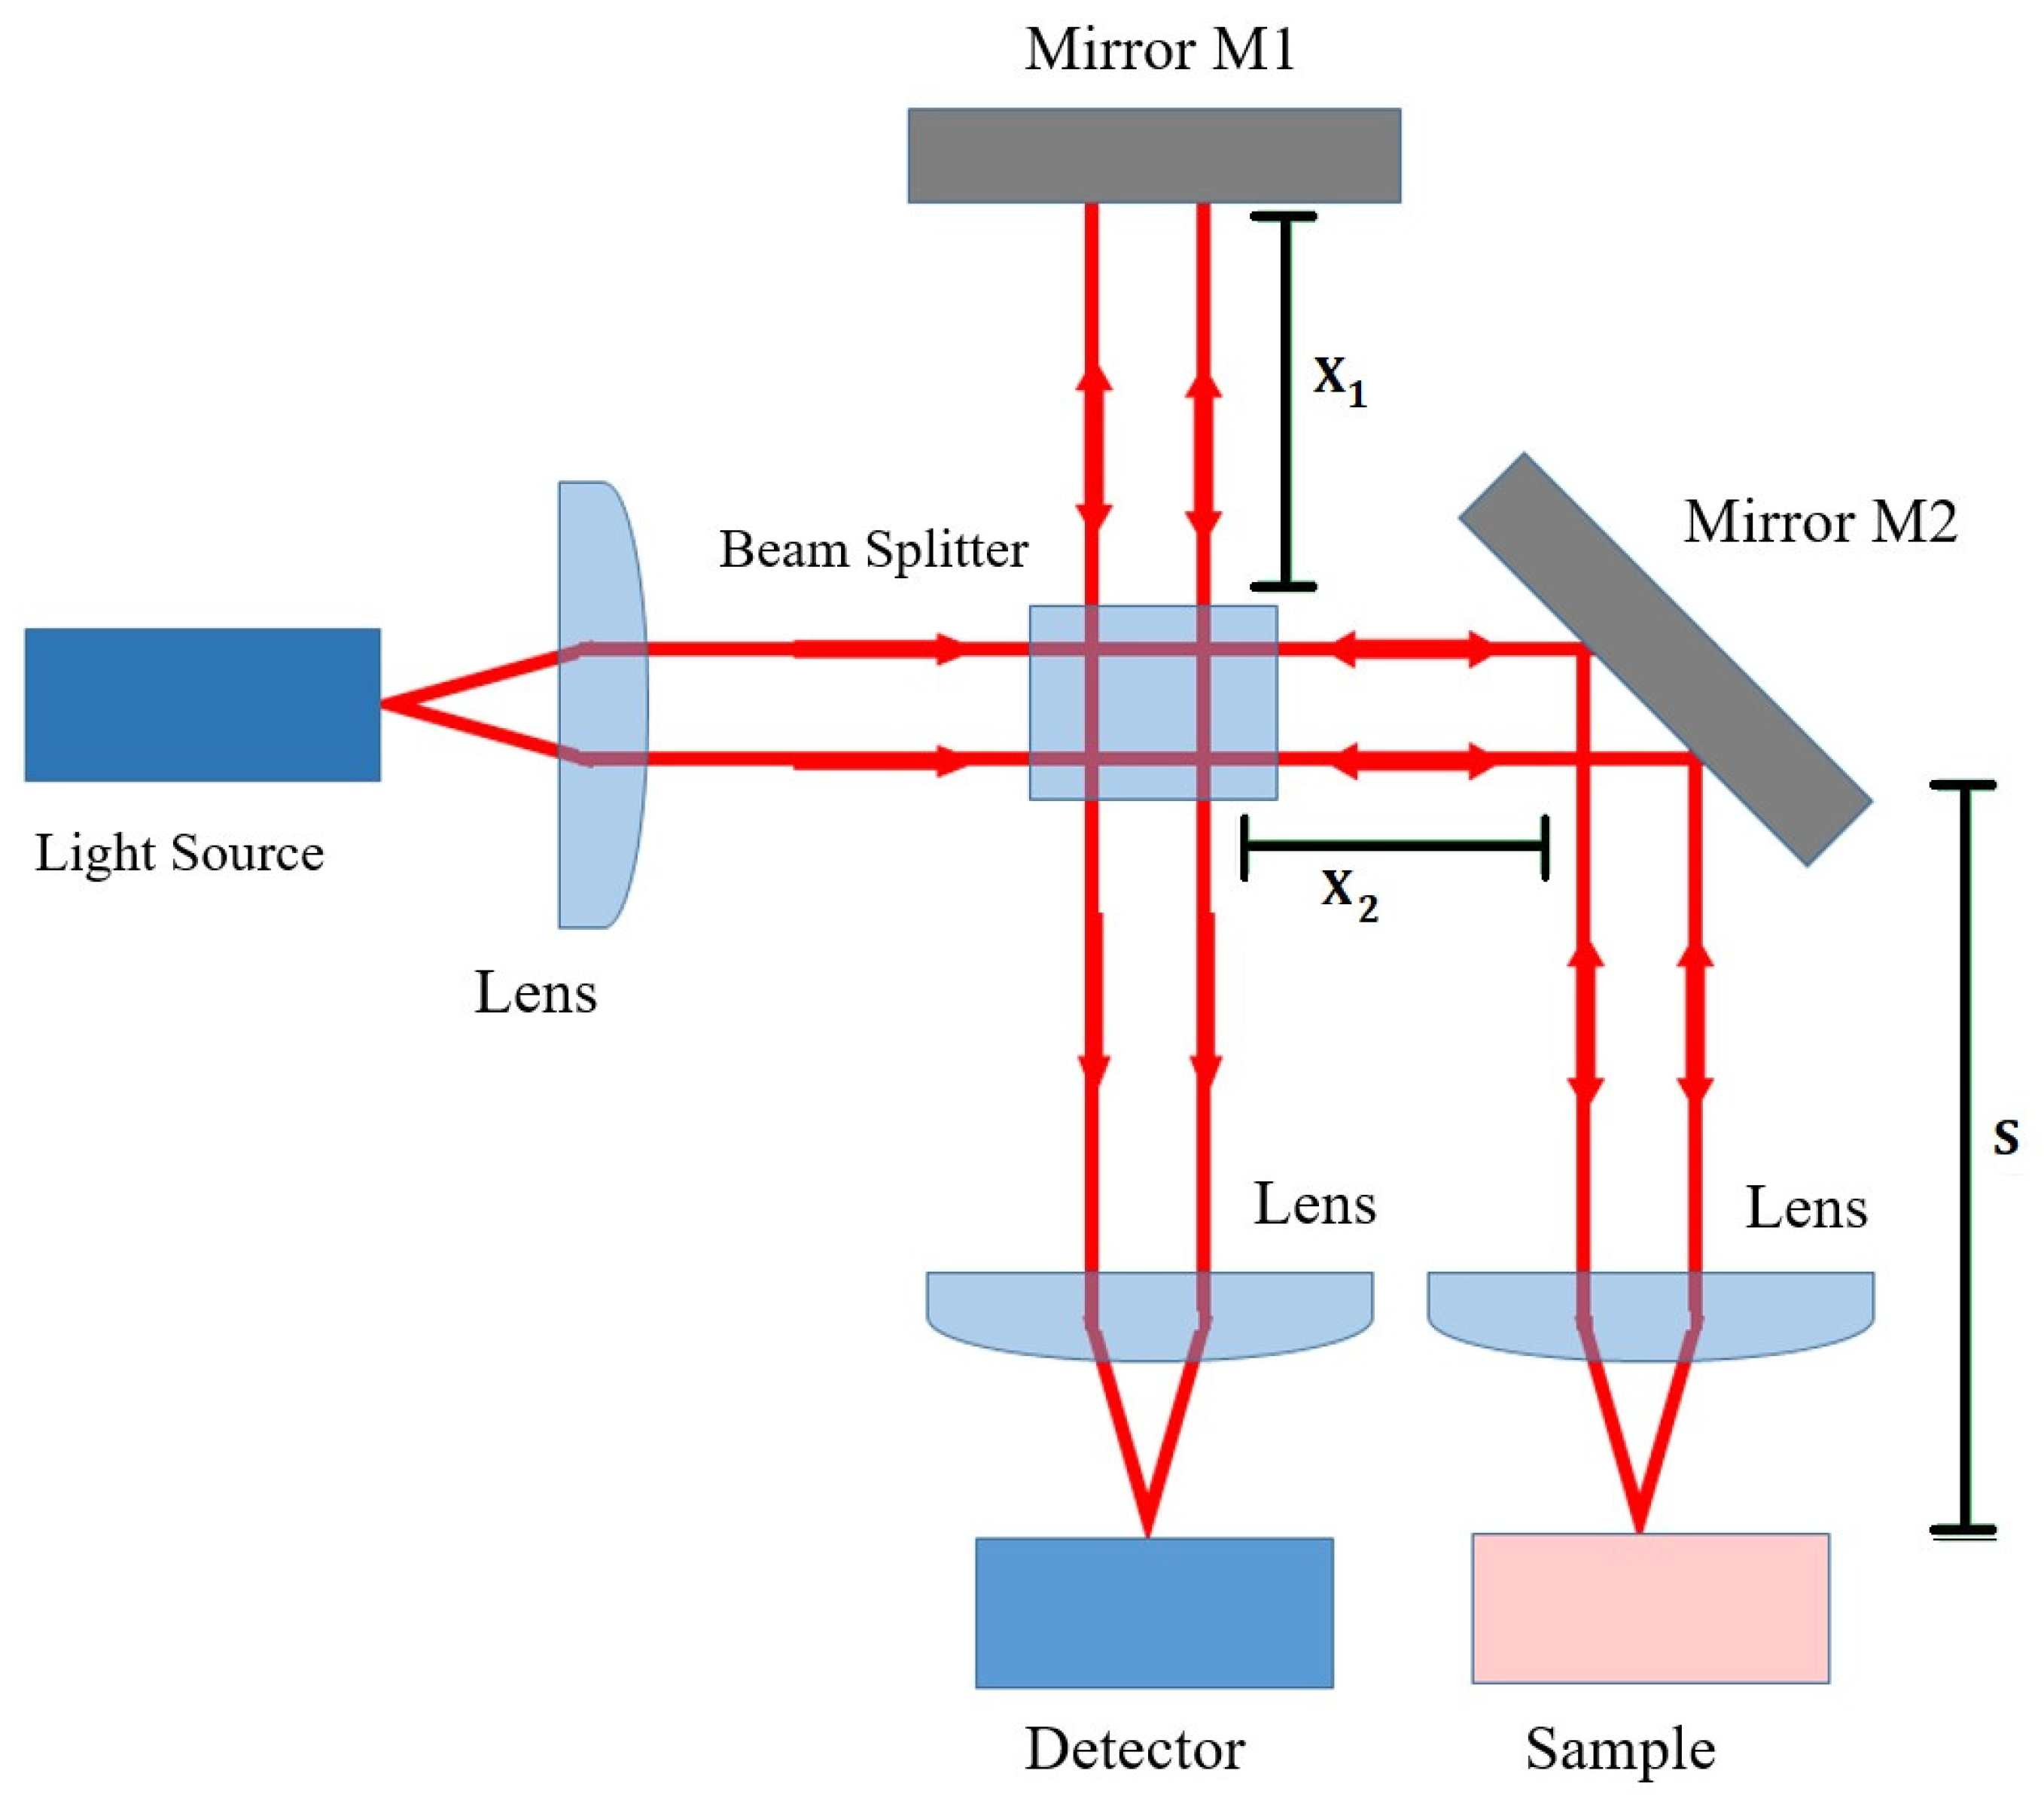
Optical Coherence Tomography (OCT) is an optical interferometry imaging technique which is widely used in ophthalmology, but which could be adapted for non-invasive glucose sensing. OCT is based on a simple interferometer, an optical assembly where incoming light is split into two beams which are then re-converged, as shown in Figure 4. Light is collimated, split by the beam-splitter, and then travels down either the reference or sample arm. Upon re-convergence at the detector, the two beams will interfere and produce fringes if the beams are in phase [80], that is, if Equation (10) is satisfied (refer to Figure 4 for the notation).
By varying the reference length, x1, and recording at what positions fringes are observed, it is possible to determine at what distance s the sample is most reflective and the reflectivity profile as a function of depth can be studied. The strength of the OCT interference signal is proportional to the sample reflectivity and by changing the mirror orientation a full three-dimensional image of the sample reflectance can be obtained [81]. However, multiple reflections are a problem with this approach, since light will be reflected by multiple layers, from near the surface to deeper reflectors. Hence, low-coherence light is used, meaning the coherence length [82] over which the light de-phases is comparatively short, usually 10–15 µm for OCT. Incoherent light cannot form fringes and therefore fringes are only formed from the very thin (up to 2 mm) layer slice near the surface of the sample.
3.3.2. Determining Glucose Concentration with OCT
The intensity of the OCT signal is a function of the scan depth l, backscattering coefficient µb and the scattering coefficient of the medium—the dependence is given in Equation (11) [83] where I0 is the initial intensity, r is the reflection coefficient of M1, L is temporal coherence length, mm is the refractive index of the tissue.
The scattering coefficient µs varies with glucose concentration according to the Equation (8), hence the OCT signal strength can be linked to glucose concentration. In practice, the OCT signal takes a recognisable form, with a very strong and sharp peak from the stratum corneum, followed by a dip in signal from prickle cells and then a broad peak at the start of the dermis after which the signal gradually falls with increasing depth. The slope of this section (‘OCT signal slope’) is related to the concentrations of the different analytes that cause scattering, such as glucose. OCT signal slope measurements in Yucatan micropigs and New Zealand rabbits established that the refractive index change due to glucose was two orders of magnitude larger than other analytes such as urea or lactate, meaning that glucose had the dominant effect on the OCT slope [35]. In the 3–30 mmol/L range, the scattering coefficient could change by 0.22% per mmol of glucose, but the OCT signal slope was also affected heterogeneity in the tissue and by motion of the sample. In a further study in human subjects [84] (using a 1300 nm OCT system) the OCT signal slope against blood glucose concentration achieved R2 values in the range of 0.80–0.95 across 15 subjects. The uncertainty in the data points was attributed to motion-based artefacts and heterogeneity, as OCT is highly sensitive to any motion in the sample. Using OCT at 1300 nm to study the glucose-induced changes in tissue scattering in pigs, the correlation coefficient (R2) was found to vary periodically with depth, with a period of 100–150 µm, which correlates to the distance between collagen bundles, which are major scattering centres [85]. This effect could vary R2 between 0.9 and −0.9, and is something that would need to be taken into account in an OCT-based sensor.
Not all approaches to glucose sensing take the attenuation coefficient approach (where OCT slope is correlated to scattering and therefore to glucose attenuation using Equations (8) and (11)) A decorrelation-based approach, which links the speckle pattern in the OCT scan (speckle is caused by waves with random phases producing interference in the scan) with the blood viscosity has also been shown [86]. Speckle decorrelation is due to Brownian motion, and there should be a correlation between glucose concentration and decorrelation time. This method obtained an R2 value of 0.85 when tested with mouse blood samples, whilst the standard attenuation coefficient approach had an R2 of 0.99 [86]. Using OCT to measure how glucose concentration changes the optical rotation or depolarization index has also been investigated [87].
The OCT sensing technique is less accurate in tissue than in simple phantoms. OCT slope sensitivity for a given change in glucose concentration was measured to be 0.0070% in blood samples but 0.0060% in tissue-like intralipid phantoms, though time-of-flight measurements with NIR had a higher sensitivity still [88]. More recently, OCT at 830 nm has been tested in human subjects, where the OCT slope was compared to the blood glucose concentration [89]. The technique was found to be more accurate in the diabetic group than the healthy group (R2 of 0.91 and 0.78 respectively), demonstrating that OCT has significant potential for glucose monitoring in people with diabetes.
3.4. Polarimetry
Polarimetry is an optical characterisation technique which measures the optical rotary dispersion due to an optically active molecule. Glucose demonstrates various forms of isomerism, but notably it forms two optical chiral isomers (enantiomers). Enantiomers are mirror-reflections of each other and dextrorotatory (D) glucose will rotate the plane of polarised light clockwise while levorotatory (L) glucose will rotate the plane anticlockwise [90]. D-glucose is naturally occurring whilst L-glucose has only been produced synthetically. The principle of polarimetry is to determine the glucose concentration, c, from the angle at which polarised light is rotated θ, using Equation (12) [91] (where l is the optical path length and α the specific rotation).
Light is plane-polarised and passed through the sample, which will rotate the plane of polarisation in order for it to be detected with a detector fitted with a polarisation analyser. This is a transmission measurement, however, skin is not well suited for polarimetry due to the high levels of scattering [73] causing depolarisation. For this reason, nearly all research into polarimetry has focused on the aqueous humour in the eye. Light can be passed almost tangentially through the aqueous humour, or reflected off the retina, and most research has taken one of these approaches. However, complications arise from the fact that glucose levels in the aqueous humour are not that same as that of the blood, with studies [92] reporting that glucose levels are 70% of that in the blood. There is also a time lag, which has been measured to be around 5 min in rabbits [93,94], and modelling suggests it could be up to 7 min in humans [95]. Most studies have tested the polarimetry technique in rabbits. Additional issues arise from changes in corneal birefringence and other components such as albumin also have a polarising effect in the eye. From a practical point of view, there are safety issues with using strong light sources in the eye and also practicality issues from end-users reluctant to use eye-based sensing devices.
3.5. Photoacoustic Spectroscopy
The photoacoustic effect is the production of ultrasound pulses due to light excitation. When radiation is absorbed by tissue, the photon energy is converted to heat, causing localised temperature rises. However, glucose, like all sugars, has a low specific heat capacity (218 J K−1 mol−1 [96]) and this means that as glucose concentration increases the speed at which the heating takes place reduces. The resultant thermal expansion causes an ultrasound acoustic pulse, and the speed of the pulse can be related to the glucose concentration. Photoacoustic spectroscopy (PAS) has been tested in human subjects in a small number of studies, achieving 66.5% of results in the A region of the Clarke Error grid [97] and R2 values of 0.71 [98]. Although photoacoustic spectroscopy has potential for glucose sensing, it is vulnerable to interference from other components beside glucose, which also change the specific heat capacity and the speed of the ultrasound pulses.
4. Conclusions
There are a wide range of non-invasive glucose sensing techniques currently under development, of which a substantial number use optical techniques. Significant challenges to optical sensors still remain, in particular obtaining good measurement precision, low signal-to-noise ratios and the management of motion artefacts. This review has summarised the main optical techniques reported in the literature on non-invasive glucose sensing, most of which (with the exception of polarimetry) utilise optical absorption or scattering. Optical sensing techniques have produced results with high R2 values, often greater than 0.9, and can be highly accurate in phantoms or solution, yet obtaining comparable accuracy in humans to glucose-meters or CGM remains a challenge. The specificity of glucose measurement remains a challenge due to optical effects from other analytes such as proteins, lipids and components in tissue. Furthermore, motion-induced artefacts present a challenge to optical techniques, especially in scattering-based approaches such as OCT. The near infrared region is the most optimal wavelength range for sensing, and future research should focus on Near Infrared Spectroscopy for a number of reasons. Firstly, the NIR region shows the longest path length in tissue, allowing for glucose sensing in the subcutaneous layer, whilst longer wavelengths are restricted by limited penetration and absorption of water. Secondly, NIR glucose sensing has been demonstrated with simple light sources such as LEDs, which are cheap to manufacture and emit light at low intensity, reducing any optical safety risks. Furthermore, NIR spectroscopy uses absorption, a direct measurement of an intrinsic property of glucose, rather than an indirect glucose-induced optical change which can be influenced by other analytes. NIR photodetection technology is currently well-developed, with a range of semiconductor photodetectors and emitters in the NIR band, and can be implemented with simple optical components with high potential for incorporation into a sensor device. Further NIR techniques should be developed, such as the use of single photon detectors, photoplethysmography (PPG) and referenced absorption by other analytes. Such techniques will likely improve upon the current challenges and further progress towards an ideal non-invasive optical glucose sensor which can provide real-time continuous monitoring for people with diabetes.
Author Contributions
Conceptualization, N.B.D., C.J.G., J.G.K. and Q.D.Z.; writing—original draft preparation, N.B.D.; writing—review and editing, N.B.D., C.J.G., J.G.K. and Q.D.Z.; visualization, N.B.D.; supervision, C.J.G., J.G.K. and Q.D.Z.; funding acquisition, C.J.G., J.G.K. and Q.D.Z. All authors have read and agreed to the published version of the manuscript.
Funding
This work was funded by the EPSRC grant ref: EP/T518037/1 and the Materials Science Institute of Lancaster University.
Institutional Review Board Statement
Not applicable.
Informed Consent Statement
Not applicable.
Conflicts of Interest
The authors declare no conflict of interest.
References
- Berg, J.M. Biochemistry; WH Freeman: New York, NY, USA, 2019. [Google Scholar]
- Szablewski, L. Glucose Homeostasis and Insulin Resistance; Bentham Science Publishers Ltd.: Sharjah, United Arab Emirates, 2011. [Google Scholar]
- Alberti, K.G.M.M.; Zimmet, P.; Shaw, J. Metabolic syndrome—A new world-wide definition. A Consensus Statement from the International Diabetes Federation. Diabet. Med. 2006, 23, 469–480. [Google Scholar] [CrossRef]
- American Diabetes Association. 2. Classification and Diagnosis of Diabetes. Diabetes Care 2015, 38, S8–S16. [Google Scholar] [CrossRef] [Green Version]
- Yates, A.; Laing, I. Diabetes Mellitus and Hypoglycaemia. In Clinical Biochemistry; Ahmed, N., Ed.; Oxford University Press: Oxford, UK; New York, NY, USA, 2011. [Google Scholar]
- Ghosh, S. Diabetes, 2nd ed.; Churchill’s pocketbooks; Churchill Livingston Elsevier: Edinburgh, UK, 2012. [Google Scholar]
- Cheung, N.; Mitchell, P.; Wong, T.Y. Diabetic retinopathy. Lancet 2010, 376, 124–136. [Google Scholar] [CrossRef]
- Callaghan, B.C.; Cheng, H.T.; Stables, C.L.; Smith, A.L.; Feldman, E.L. Diabetic neuropathy: Clinical manifestations and current treatments. Lancet Neurol. 2012, 11, 521–534. [Google Scholar] [CrossRef] [Green Version]
- Ayodele, O.E.; Alebiosu, C.O.; Salako, B.L. Diabetic nephropathy—A review of the natural history, burden, risk factors and treatment. J. Natl. Med. Assoc. 2004, 96, 1445–1454. [Google Scholar]
- Roglic, G. WHO Global report on diabetes: A summary. Int. J. Noncommun. Dis. 2016, 1, 3–8. [Google Scholar] [CrossRef]
- Cho, N.; Shaw, J.; Karuranga, S.; Huang, Y.; da Rocha Fernandes, J.; Ohlrogge, A.; Malanda, B. IDF Diabetes Atlas: Global estimates of diabetes prevalence for 2017 and projections for 2045. Diabetes Res. Clin. Pract. 2018, 138, 271–281. [Google Scholar] [CrossRef]
- Seuring, T.; Archangelidi, O.; Suhrcke, M. The Economic Costs of Type 2 Diabetes: A Global Systematic Review. PharmacoEconomics 2015, 33, 811–831. [Google Scholar] [CrossRef] [Green Version]
- Executive Summary: Standards of Medical Care in Diabetes—2010. Diabetes Care 2010, 33, S4–S10. [CrossRef] [Green Version]
- Gallagher, E.J.; Le Roith, D.; Bloomgarden, Z. Review of hemoglobin A1c in the management of diabetes. J. Diabetes 2009, 1, 9–17. [Google Scholar] [CrossRef]
- Freckmann, G.; Schmid, C.; Baumstark, A.; Rutschmann, M.; Haug, C.; Heinemann, L. Analytical Performance Requirements for Systems for Self-Monitoring of Blood Glucose With Focus on System Accuracy: Relevant Differences Among ISO 15197:2003, ISO 15197:2013, and Current FDA Recommendations. J. Diabetes Sci. Technol. 2015, 9, 885–894. [Google Scholar] [CrossRef]
- Vashist, S.K. Continuous Glucose Monitoring Systems: A Review. Diagnostics 2013, 3, 385–412. [Google Scholar] [CrossRef] [Green Version]
- Koschinsky, T.; Heinemann, L. Sensors for glucose monitoring: Technical and clinical aspects. Diabetes/Metab. Res. Rev. 2001, 17, 113–123. [Google Scholar] [CrossRef]
- Slade, A.; Simpson, S.; Wood, A. New and Emerging Non-Invasive Glucose Monitoring Technologies; The NIHR Horizon Scanning Research & Intelligence Centre, University of Birmingham: Birmingham, UK, 2016. [Google Scholar]
- Wei, M.; Qiao, Y.; Zhao, H.; Liang, J.; Li, T.; Luo, Y.; Lu, S.; Shi, X.; Lu, W.; Sun, X. Electrochemical non-enzymatic glucose sensors: Recent progress and perspectives. Chem. Commun. 2020, 56, 14553–14569. [Google Scholar] [CrossRef]
- Caduff, A.; Hirt, E.; Feldman, Y.; Ali, Z.; Heinemann, L. First human experiments with a novel non-invasive, non-optical continuous glucose monitoring system. Biosens. Bioelectron. 2003, 19, 209–217. [Google Scholar] [CrossRef]
- Kamat, D.K.; Bagul, D.; Patil, P.M. Blood Glucose Measurement Using Bioimpedance Technique. Adv. Electron. (Hindawi) 2014, 2014, 406257. [Google Scholar] [CrossRef]
- Rao, G.; Glikfeld, P.; Guy, R.H. Reverse iontophoresis: Development of a noninvasive approach for glucose monitoring. Pharm. Res. 1993, 10, 1751–1755. [Google Scholar] [CrossRef]
- Kim, J.; Campbell, A.S.; Wang, J. Wearable non-invasive epidermal glucose sensors: A review. Talanta 2018, 177, 163–170. [Google Scholar] [CrossRef]
- Oliver, N.S.; Toumazou, C.; Cass, A.E.G.; Johnston, D.G. Glucose sensors: A review of current and emerging technology. Diabet. Med. 2009, 26, 197–210. [Google Scholar] [CrossRef]
- Tierney, M.; Tamada, J.; Potts, R.; Jovanovic, L.; Garg, S. Clinical evaluation of the GlucoWatch biographer: A continual, non-invasive glucose monitor for patients with diabetes. Biosens. Bioelectron. 2001, 16, 621–629. [Google Scholar] [CrossRef]
- The Diabetes Research in Children Network Study Group. Accuracy of the GlucoWatch G2 Biographer and the Continuous Glucose Monitoring System During Hypoglycemia. Diabetes Care 2004, 27, 722–726. [Google Scholar] [CrossRef] [Green Version]
- Mayerhöfer, T.G.; Pahlow, S.; Popp, J. The Bouguer-Beer-Lambert Law: Shining Light on the Obscure. Chemphyschem 2020, 21, 2029–2046. [Google Scholar] [CrossRef]
- Jacques, S.L. Optical properties of biological tissues: A review. Phys. Med. Biol. 2013, 58, R37–R61. [Google Scholar] [CrossRef] [PubMed]
- Andrews, D.G. An Introduction to Atmospheric Physics, 2nd ed.; Cambridge University Press: Cambridge, UK, 2010. [Google Scholar]
- Deirmendjian, D. Electromagnetic Scattering on Spherical Polydispersions; RAND Corporation: Santa Monica, CA, USA, 1969. [Google Scholar]
- Van de Hulst, H.C. Light Scattering by Small Particles; Structure of matter series; Dover Publications: New York, NY, USA, 1981. [Google Scholar]
- Van Gemert, M.; Jacques, S.; Sterenborg, H.; Star, W. Skin optics. IEEE Trans. Biomed. Eng. 1989, 36, 1146–1154. [Google Scholar] [CrossRef]
- Kohl, M.; Essenpreis, M.; Cope, M. The influence of glucose concentration upon the transport of light in tissue-simulating phantoms. Phys. Med. Biol. 1995, 40, 1267–1287. [Google Scholar] [CrossRef] [PubMed]
- Graaff, R.; Aarnoudse, J.G.; Zijp, J.R.; Sloot, P.M.A.; de Mul, F.F.M.; Greve, J.; Koelink, M.H. Reduced light-scattering properties for mixtures of spherical particles: A simple approximation derived from Mie calculations. Appl. Opt. 1992, 31, 1370–1376. [Google Scholar] [CrossRef] [PubMed] [Green Version]
- Larin, K.V.; Motamedi, M.; Ashitkov, T.V.; Esenaliev, R.O. Specificity of noninvasive blood glucose sensing using optical coherence tomography technique: A pilot study. Phys. Med. Biol. 2003, 48, 1371–1390. [Google Scholar] [CrossRef] [PubMed]
- Maier, J.S.; Walker, S.A.; Fantini, S.; Franceschini, M.A.; Gratton, E. Possible correlation between blood glucose concentration and the reduced scattering coefficient of tissues in the near infrared. Opt. Lett. 1994, 19, 2062–2064. [Google Scholar] [CrossRef] [Green Version]
- Bruulsema, J.T.; Hayward, J.E.; Farrell, T.J.; Patterson, M.S.; Heinemann, L.; Berger, M.; Koschinsky, T.; Sandahl-Christiansen, J.; Orskov, H.; Essenpreis, M.; et al. Correlation between blood glucose concentration in diabetics and noninvasively measured tissue optical scattering coefficient. Opt. Lett. 1997, 22, 190–192. [Google Scholar] [CrossRef] [PubMed]
- McCoy, A.B. Curious properties of the Morse oscillator. Chem. Phys. Lett. 2011, 501, 603–607. [Google Scholar] [CrossRef]
- Pasquini, C. Near Infrared Spectroscopy: Fundamentals, practical aspects and analytical applications. J. Braz. Chem. Soc. 2003, 14, 198–219. [Google Scholar] [CrossRef] [Green Version]
- Rae, A.I.M. Quantum Mechanics, 5th ed.; Taylor & Francis Group: New York, NY, USA; London, UK, 2007. [Google Scholar]
- McNichols, R.J.; Coté, G.L. Optical glucose sensing in biological fluids: An overview. J. Biomed. Opt. 2000, 5, 5–16. [Google Scholar] [CrossRef] [PubMed]
- Zhang, H.; Salo, D.; Kim, D.M.; Komarov, S.; Tai, Y.C.; Berezin, M.Y. Penetration depth of photons in biological tissues from hyperspectral imaging in shortwave infrared in transmission and reflection geometries. J. Biomed. Opt. 2016, 21, 126006. [Google Scholar] [CrossRef]
- Liang, F.X.; Wang, J.Z.; Li, Z.P.; Luo, L.B. Near-Infrared-Light Photodetectors Based on One-Dimensional Inorganic Semiconductor Nanostructures. Adv. Opt. Mater. 2017, 5, 1700081. [Google Scholar] [CrossRef] [Green Version]
- Liakat, S.; Bors, K.A.; Huang, T.Y.; Michel, A.P.M.; Zanghi, E.; Gmachl, C.F. In Vitro Measurements of Physiological Glucose Concentrations in Biological Fluids Using Mid-Infrared Spectroscopy. In Proceedings of the CLEO: 2013, San Jose, CA, USA, 9–14 June 2013; Optical Society of America. pp. 1–2. [Google Scholar]
- Liakat, S.; Bors, K.A.; Xu, L.; Woods, C.M.; Doyle, J.; Gmachl, C.F. Noninvasive in vivo glucose sensing on human subjects using mid-infrared light. Biomed. Opt. Express 2014, 5, 2397–2404. [Google Scholar] [CrossRef]
- Clarke, W.; Cox, D.; Gonder-Frederick, L.; Carter, W.; Pohl, S. Evaluating clinical accuracy of systems for self-monitoring of blood glucose. Diabetes Care 1987, 10, 622–628. [Google Scholar] [CrossRef] [PubMed]
- Kasahara, R.; Kino, S.; Soyama, S.; Matsuura, Y. Noninvasive glucose monitoring using mid-infrared absorption spectroscopy based on a few wavenumbers. Biomed. Opt. Express 2018, 9, 289–302. [Google Scholar] [CrossRef] [Green Version]
- Delbeck, S.; Heise, H.M. Evaluation of Opportunities and Limitations of Mid-Infrared Skin Spectroscopy for Noninvasive Blood Glucose Monitoring. J. Diabetes Sci. Technol. 2021, 15, 19–27. [Google Scholar] [CrossRef]
- Awichi, A.; Tee, E.M.; Srikanthan, G.; Zhao, W. Identification of Overlapped Near-Infrared Bands of Glucose Anomers Using Two-Dimensional Near-Infrared and Middle-Infrared Correlation Spectroscopy. Appl. Spectrosc. 2002, 56, 897–901. [Google Scholar] [CrossRef]
- Amerov, A.K.; Chen, J.; Arnold, M.A. Molar Absorptivities of Glucose and Other Biological Molecules in Aqueous Solutions over the First Overtone and Combination Regions of the Near-Infrared Spectrum. Appl. Spectrosc. 2004, 58, 1195–1204. [Google Scholar] [CrossRef]
- Beć, K.B.; Grabska, J.; Huck, C.W. Near-Infrared Spectroscopy in Bio-Applications. Molecules 2020, 25, 2948. [Google Scholar] [CrossRef]
- Golic, M.; Walsh, K.; Lawson, P. Short-Wavelength Near-Infrared Spectra of Sucrose, Glucose, and Fructose with Respect to Sugar Concentration and Temperature. Appl. Spectrosc. 2003, 57, 139–145. [Google Scholar] [CrossRef]
- Uwadaira, Y.; Ikehata, A.; Momose, A.; Miura, M. Identification of informative bands in the shortwavelength NIR region for non-invasive blood glucose measurement. Biomed. Opt. Express 2016, 7, 2729–2737. [Google Scholar] [CrossRef] [PubMed] [Green Version]
- Saleh, G.; Alkaabi, F.; Al-Hajhouj, N.; Al-Towailib, F.; Al-Hamza, S. Design of non-invasive glucose meter using near-infrared technique. J. Med. Eng. Technol. 2018, 42, 140–147. [Google Scholar] [CrossRef]
- Lee, S.H.; Kim, M.S.; Kim, O.K.; Baik, H.H.; Kim, J.H. Near-Infrared Light Emitting Diode Based Non-Invasive Glucose Detection System. J. Nanosci. Nanotechnol. 2019, 19, 6187–6191. [Google Scholar] [CrossRef] [PubMed]
- Ryckeboer, E.; Bockstaele, R.; Vanslembrouck, M.; Baets, R. Glucose sensing by waveguide-based absorption spectroscopy on a silicon chip. Biomed. Opt. Express 2014, 5, 1636–1648. [Google Scholar] [CrossRef] [Green Version]
- Olesberg, J.T.; Arnold, M.A.; Mermelstein, C.; Schmitz, J.; Wagner, J. Tunable Laser Diode System for Noninvasive Blood Glucose Measurements. Appl. Spectrosc. 2005, 59, 1480–1484. [Google Scholar] [CrossRef] [PubMed]
- Jeon, K.J.; Hwang, I.D.; Hahn, S.; Yoon, G. Comparison between transmittance and reflectance measurements in glucose determination using near infrared spectroscopy. J. Biomed. Opt. 2006, 11, 014022–014027. [Google Scholar] [CrossRef] [PubMed] [Green Version]
- Liu, J.; Han, T.; Jiang, J.; Xu, K. Specialized source-detector separations in near-infrared reflectance spectroscopy platform enable effective separation of diffusion and absorption for glucose sensing. Biomed. Opt. Express 2019, 10, 4839–4858. [Google Scholar] [CrossRef]
- Robinson, R.; Eaton, R.; Haaland, D.; Koepp, G.; Thomas, E.; Stallard, B.; Robinson, P. Noninvasive Glucose Monitoring in Diabetic Patients: A Preliminary Evaluation. Clin. Chem. 1992, 38, 1618–1622. [Google Scholar] [CrossRef]
- Maruo, K.; Tsurugi, M.; Tamura, M.; Ozaki, Y. In Vivo Noninvasive Measurement of Blood Glucose by Near-Infrared DiffuseReflectance Spectroscopy. Appl. Spectrosc. 2003, 57, 1236–1244. [Google Scholar] [CrossRef]
- Maruo, K.; Tsurugi, M.; Chin, J.; Ota, T.; Arimoto, H.; Yamada, Y.; Tamura, M.; Ishii, M.; Ozaki, Y. Noninvasive blood glucose assay using a newly developed near-infrared system. IEEE J. Sel. Top. Quantum Electron. 2003, 9, 322–330. [Google Scholar] [CrossRef]
- Ali, H.; Bensaali, F.; Jaber, F. Novel Approach to Non-Invasive Blood Glucose Monitoring Based on Transmittance and Refraction of Visible Laser Light. IEEE Access 2017, 5, 9163–9174. [Google Scholar] [CrossRef]
- Hotmartua, R.; Pangestu, P.W.; Zakaria, H.; Irawan, Y.S. Noninvasive blood glucose detection using near infrared sensor. In Proceedings of the 2015 International Conference on Electrical Engineering and Informatics (ICEEI), Denpasar, Indonesia, 10–11 August 2015; pp. 687–692. [Google Scholar]
- Uwadaira, Y.; Adachi, N.; Ikehata, A.; Kawano, S. Factors Affecting the Accuracy of Non-Invasive Blood Glucose Measurement by Short-Wavelength near Infrared Spectroscopy in the Determination of the Glycaemic Index of Foods. J. Near Infrared Spectrosc. 2010, 18, 291–300. [Google Scholar] [CrossRef]
- Burmeister, J.J.; Arnold, M.A. Evaluation of Measurement Sites for Noninvasive Blood Glucose Sensing with Near-Infrared Transmission Spectroscopy. Clin. Chem. 1999, 45, 1621–1627. [Google Scholar] [CrossRef] [PubMed]
- Heise, H.; Bittner, A.; Marbach, R. Clinical Chemistry and near Infrared Spectroscopy: Technology for Non-Invasive Glucose Monitoring. J. Near Infrared Spectrosc. 1998, 6, 349–359. [Google Scholar] [CrossRef]
- Gayathri, B.; Sruthi, K.; Menon, K.A.U. Non-invasive blood glucose monitoring using near infrared spectroscopy. In Proceedings of the 2017 International Conference on Communication and Signal Processing (ICCSP), IEEE, Melmaruvathur, India, 6–8 April 2017; Volume 2018, pp. 1139–1142. [Google Scholar]
- Shulei, W.; Xueguang, Y.; Yangan, Z. Non-invasive blood glucose measurement scheme based on near-infrared spectroscopy. In Proceedings of the 2017 Conference on Lasers and Electro-Optics Pacific Rim (CLEO-PR), IEEE, Singapore, 31 July–4 August 2017; Volume 2017, pp. 1–4. [Google Scholar]
- Rachim, V.P.; Chung, W.Y. Wearable-band type visible-near infrared optical biosensor for non-invasive blood glucose monitoring. Sens. Actuators. B Chem. 2019, 286, 173–180. [Google Scholar] [CrossRef]
- Auer, B.M.; Skinner, J.L. IR and Raman spectra of liquid water: Theory and interpretation. J. Chem. Phys. 2008, 128, 224511. [Google Scholar] [CrossRef]
- Somerville, W.R.C.; Le Ru, E.C.; Northcote, P.T.; Etchegoin, P.G. High performance Raman spectroscopy with simple optical components. Am. J. Phys. 2010, 78, 671–677. [Google Scholar] [CrossRef] [Green Version]
- Shokrekhodaei, M.; Quinones, S. Review of Non-Invasive Glucose Sensing Techniques: Optical, Electrical and Breath Acetone. Sensors 2020, 20, 1251. [Google Scholar] [CrossRef] [Green Version]
- Goetz, M.; Cote, G.; Erckens, R.; March, W.; Motamedi, M. Application of a multivariate technique to Raman spectra for quantification of body chemicals. IEEE Trans. Biomed. Eng. 1995, 42, 728–731. [Google Scholar] [CrossRef]
- Kang, J.W.; Park, Y.S.; Chang, H.; Lee, W.; Singh, S.P.; Choi, W.; Galindo, L.H.; Dasari, R.R.; Nam, S.H.; Park, J.; et al. Direct observation of glucose fingerprint using in vivo Raman spectroscopy. Sci. Adv. 2020, 6, eaay5206. [Google Scholar] [CrossRef] [Green Version]
- Dieringer, J.A.; McFarland, A.D.; Shah, N.C.; Stuart, D.A.; Whitney, A.V.; Yonzon, C.R.; Young, M.A.; Zhang, X.; Van Duyne, R.P. Introductory Lecture: Surface enhanced Raman spectroscopy: New materials, concepts, characterization tools, and applications. Faraday Discuss. 2006, 132, 9–26. [Google Scholar] [CrossRef] [PubMed]
- Scholtes-Timmerman, M.J.; Bijlsma, S.; Fokkert, M.J.; Slingerland, R.; van Veen, S.J.F. Raman Spectroscopy as a Promising Tool for Noninvasive Point-of-Care Glucose Monitoring. J. Diabetes Sci. Technol. 2014, 8, 974–979. [Google Scholar] [CrossRef] [PubMed] [Green Version]
- Shao, J.; Lin, M.; Li, Y.; Li, X.; Liu, J.; Liang, J.; Yao, H. In Vivo Blood Glucose Quantification Using Raman Spectroscopy. PLoS ONE 2012, 7, e48127. [Google Scholar] [CrossRef] [PubMed] [Green Version]
- Pleus, S.; Schauer, S.; Jendrike, N.; Zschornack, E.; Link, M.; Hepp, K.D.; Haug, C.; Freckmann, G. Proof of Concept for a New Raman-Based Prototype for Noninvasive Glucose Monitoring. J. Diabetes Sci. Technol. 2021, 15, 11–18. [Google Scholar] [CrossRef] [PubMed]
- Podoleanu, A.G. Optical coherence tomography. J. Microsc. 2012, 247, 209–219. [Google Scholar] [CrossRef] [Green Version]
- Fercher, A.F.; Drexler, W.; Hitzenberger, C.K.; Lasser, T. Optical coherence tomography—Principles and applications. Rep. Prog. Phys. 2003, 66, 239–303. [Google Scholar] [CrossRef]
- Akcay, C.; Parrein, P.; Rolland, J.P. Estimation of longitudinal resolution in optical coherence imaging. Appl. Opt. 2002, 41, 5256–5262. [Google Scholar] [CrossRef]
- Yi, J.; Backman, V. Imaging a full set of optical scattering properties of biological tissue by inverse spectroscopic optical coherence tomography. Opt. Lett. 2012, 37, 4443–4445. [Google Scholar] [CrossRef] [Green Version]
- Larin, K.V.; Eledrisi, M.S.; Motamedi, M.; Esenaliev, R.O. Noninvasive blood glucose monitoring with optical coherence tomography: A pilot study in human subjects. Diabetes Care 2002, 25, 2263–2267. [Google Scholar] [CrossRef] [PubMed] [Green Version]
- Kuranov, R.V.; Sapozhnikova, V.V.; Prough, D.S.; Cicenaite, I.; Esenaliev, R.O. In vivo study of glucose-induced changes in skin properties assessed with optical coherence tomography. Phys. Med. Biol. 2006, 51, 3885–3900. [Google Scholar] [CrossRef] [PubMed]
- De Pretto, L.R.; Yoshimura, T.M.; Ribeiro, M.S.; Zanardi de Freitas, A. Optical coherence tomography for blood glucose monitoring in vitro through spatial and temporal approaches. J. Biomed. Opt. 2016, 21, 086007. [Google Scholar] [CrossRef] [PubMed]
- Chen, T.L.; Lo, Y.L.; Liao, C.C.; Phan, Q.H. Noninvasive measurement of glucose concentration on human fingertip by optical coherence tomography. J. Biomed. Opt. 2018, 23, 047001. [Google Scholar] [CrossRef] [PubMed] [Green Version]
- Popov, A.P.; Bykov, A.V.; Toppari, S.; Kinnunen, M.; Priezzhev, A.V.; Myllylä, R. Glucose Sensing in Flowing Blood and Intralipid by Laser Pulse Time-of-Flight and Optical Coherence Tomography Techniques. IEEE J. Sel. Top. Quantum Electron. 2012, 18, 1335–1342. [Google Scholar] [CrossRef]
- Lan, Y.T.; Kuang, Y.P.; Zhou, L.P.; Wu, G.Y.; Gu, P.C.; Wei, H.J.; Chen, K. Noninvasive monitoring of blood glucose concentration in diabetic patients with optical coherence tomography. Laser Phys. Lett. 2017, 14, 35603. [Google Scholar] [CrossRef]
- Ferrante do Amaral, C.E.; Wolf, B. Current development in non-invasive glucose monitoring. Med. Eng. Phys. 2008, 30, 541–549. [Google Scholar] [CrossRef]
- Cameron, B.D.; Cote, G. Noninvasive glucose sensing utilizing a digital closed-loop polarimetric approach. IEEE Trans. Biomed. Eng. 1997, 44, 1221–1227. [Google Scholar] [CrossRef]
- Winkler, A.M.; Bonnema, G.T.; Barton, J.K. Optical polarimetry for noninvasive glucose sensing enabled by Sagnac interferometry. Appl. Opt. 2011, 50, 2719–2731. [Google Scholar] [CrossRef]
- Purvinis, G.; Cameron, B.D.; Altrogge, D.M. Noninvasive Polarimetric-Based Glucose Monitoring: An in Vivo Study. J. Diabetes Sci. Technol. 2011, 5, 380–387. [Google Scholar] [CrossRef] [Green Version]
- Cameron, B.D.; Baba, J.S.; Coté, G.L. Measurement of the Glucose Transport Time Delay Between the Blood and Aqueous Humor of the Eye for the Eventual Development of a Noninvasive Glucose Sensor. Diabetes Technol. Ther. 2001, 3, 201–207. [Google Scholar] [CrossRef] [PubMed]
- Westphal, P.; Kaltenbach, J.M.; Wicker, K. Corneal birefringence measured by spectrally resolved mueller matrix ellipsometry and implications for non-invasive glucose monitoring. Biomed. Opt. Express 2016, 7, 1160–1174. [Google Scholar] [CrossRef] [Green Version]
- Boerio-Goates, J. Heat-capacity measurements and thermodynamic functions of crystalline α-D-glucose at temperatures from 10 K to 340 K. J. Chem. Thermodyn. 1991, 23, 403–409. [Google Scholar] [CrossRef]
- Weiss, R.; Yegorchikov, Y.; Shusterman, A.; Raz, I. Noninvasive Continuous Glucose Monitoring Using Photoacoustic Technology—Results from the First 62 Subjects. Diabetes Technol. Ther. 2007, 9, 68–74. [Google Scholar] [CrossRef] [PubMed]
- Ghazaryan, A.; Ovsepian, S.V.; Ntziachristos, V. Extended Near-Infrared Optoacoustic Spectrometry for Sensing Physiological Concentrations of Glucose. Front. Endocrinol. 2018, 9, 112. [Google Scholar] [CrossRef]
Figure 1.
Basic summary of the differences between scattering (a), transmission (b), reflection (c) and absorption (d) of light incident upon a medium [own work].
Figure 1.
Basic summary of the differences between scattering (a), transmission (b), reflection (c) and absorption (d) of light incident upon a medium [own work].

Figure 2.
Energy states (m = 0…4) in the quantum harmonic oscillator and the Morse model, showing the dissociation potential De [own work].
Figure 2.
Energy states (m = 0…4) in the quantum harmonic oscillator and the Morse model, showing the dissociation potential De [own work].

Figure 3.
Energy transitions associated with absorption, Rayleigh scattering, Stokes-Raman and anti-Stokes-Raman scattering [own work].
Figure 3.
Energy transitions associated with absorption, Rayleigh scattering, Stokes-Raman and anti-Stokes-Raman scattering [own work].

Figure 4.
Simplified diagram of the OCT interferometer configuration [own work].

Publisher’s Note: MDPI stays neutral with regard to jurisdictional claims in published maps and institutional affiliations. |
© 2022 by the authors. Licensee MDPI, Basel, Switzerland. This article is an open access article distributed under the terms and conditions of the Creative Commons Attribution (CC BY) license (https://creativecommons.org/licenses/by/4.0/).
Share and Cite
MDPI and ACS Style
Davison, N.B.; Gaffney, C.J.; Kerns, J.G.; Zhuang, Q.D. Recent Progress and Perspectives on Non-Invasive Glucose Sensors. Diabetology 2022, 3, 56-71. https://0-doi-org.brum.beds.ac.uk/10.3390/diabetology3010005
AMA Style
Davison NB, Gaffney CJ, Kerns JG, Zhuang QD. Recent Progress and Perspectives on Non-Invasive Glucose Sensors. Diabetology. 2022; 3(1):56-71. https://0-doi-org.brum.beds.ac.uk/10.3390/diabetology3010005
Chicago/Turabian StyleDavison, Nicholas B., Christopher J. Gaffney, Jemma G. Kerns, and Qiandong D. Zhuang. 2022. "Recent Progress and Perspectives on Non-Invasive Glucose Sensors" Diabetology 3, no. 1: 56-71. https://0-doi-org.brum.beds.ac.uk/10.3390/diabetology3010005