

A Comparative Analysis of Machine Learning Models for the Detection of Undiagnosed Diabetes Patients

Department of Health Science and Technology, Aalborg University, 9000 Aalborg, Denmark
*
Author to whom correspondence should be addressed.
Diabetology 2024, 5(1), 1-11; https://0-doi-org.brum.beds.ac.uk/10.3390/diabetology5010001
Submission received: 20 November 2023
/
Revised: 21 December 2023
/
Accepted: 21 December 2023
/
Published: 3 January 2024
(This article belongs to the Special Issue Management of Type 2 Diabetes: Current Insights and Future Directions)
Abstract
:Introduction: Early detection of type 2 diabetes is essential for preventing long-term complications. However, screening the entire population for diabetes is not cost-effective, so identifying individuals at high risk for this disease is crucial. The aim of this study was to compare the performance of five diverse machine learning (ML) models in classifying undiagnosed diabetes using large heterogeneous datasets. Methods: We used machine learning data from several years of the National Health and Nutrition Examination Survey (NHANES) from 2005 to 2018 to identify people with undiagnosed diabetes. The dataset included 45,431 participants, and biochemical confirmation of glucose control (HbA1c) were used to identify undiagnosed diabetes. The predictors were based on simple and clinically obtainable variables, which could be feasible for prescreening for diabetes. We included five ML models for comparison: random forest, AdaBoost, RUSBoost, LogitBoost, and a neural network. Results: The prevalence of undiagnosed diabetes was 4%. For the classification of undiagnosed diabetes, the area under the ROC curve (AUC) values were between 0.776 and 0.806. The positive predictive values (PPVs) were between 0.083 and 0.091, the negative predictive values (NPVs) were between 0.984 and 0.99, and the sensitivities were between 0.742 and 0.871. Conclusion: We have demonstrated that several types of classification models can accurately classify undiagnosed diabetes from simple and clinically obtainable variables. These results suggest that the use of machine learning for prescreening for undiagnosed diabetes could be a useful tool in clinical practice.
1. Introduction
The prevalence of type 2 diabetes is on the rise, leading to increased occurrences of illness and mortality and escalated healthcare expenditures. The incidence of type 2 diabetes varies across regions such as the UK, the U.S., China, and the United Arab Emirates, encompassing a range of 7% to 34% of the respective population [1,2]. Of individuals in the United States, 9.7% have received a formal diagnosis of diabetes, while an additional 4.3% are living with diabetes but remain undiagnosed. Notably, approximately 30% of those who eventually receive a diabetes diagnosis exhibit associated complications [3].
The timely identification of type 2 diabetes holds significance due to its potential to significantly mitigate long-term complications through rigorous diabetes management. Nevertheless, conducting diabetes screening across the entire population lacks cost-effectiveness, thus emphasizing the need to prioritize the recognition of individuals with a heightened susceptibility to the condition [4,5]. Numerous investigations regarding diabetes screening have been conducted within the previous ten years. Risk prediction or stratification models can serve the purpose of identifying individuals at an elevated risk level for diabetes, allowing for subsequent targeted testing. Typically, these models incorporate a blend of variables, encompassing weight, lifestyle, familial background, and clinical measurements, and are formulated through the utilization of multivariable statistical techniques [6,7,8].
Nevertheless, numerous of these models are not extensively employed within clinical practice, primarily owing to their foundation on data gathered for alternate objectives. This circumstance can decrease the relevance of these findings when applied to a broader population [9]. Additionally, attempts are often made to create models that are easy to use in clinical practice. This is often accomplished by condensing continuous variables into distinct categories or opting for predictors in a subjective manner. However, such approaches can result in excessive simplification and a consequent decrease in the models’ overall efficacy [10,11].
Analyzing data on diabetes can be difficult because medical data often exhibit nonlinear, nonnormal, correlated, and complex characteristics [12]. Machine learning (ML) methods have the potential to structure and utilize these complex patterns to classify diseases. It has previously been reported that ML could be utilized in diabetes for different purposes [13,14,15,16,17,18,19].
Others have reported ML approaches for the detection of diabetes and prediabetes [20,21,22,23,24,25]. However, it is still unclear which ML methods are best at capturing the complexity of the data to aid in selecting people at high risk of undiagnosed diabetes.
The objective of this study was to compare the performance of five diverse ML models for classifying undiagnosed diabetes using a large heterogeneous dataset.
2. Methods
2.1. Data Source
To identify individuals with undiagnosed diabetes using machine learning, we used data from multiple years of the National Health and Nutrition Examination Survey (NHANES) from 2005 to 2018 [26], which included HbA1c (glycated hemoglobin) data. HbA1c is recommended for the diagnosis of diabetes in most patient groups by the American Diabetes Association [27]. The NHANES study was executed by the National Center for Health Statistics, a division of the Centers for Disease Control and Prevention. This research employs intricate sampling techniques to determine the demographic composition of the U.S. populace. This inclusivity extends to the overrepresentation of subpopulations, such as elderly individuals and various racial and ethnic minorities. Over the period spanning 2005 to 2018, a comprehensive total of 70,190 participants were enrolled in the NHANES.
The present investigation involved individuals aged >20 years, excluding pregnant individuals and those with a documented diabetes diagnosis. A participant’s diabetes diagnosis was ascertained by their affirmative response to the survey. Have you ever been informed by a medical professional that you have diabetes?
Using these data, we developed and compared ML models for diabetes prescreening in patients with undiagnosed diabetes.
2.2. End Points
Our objective was to compare five machine learning models for the detection of undiagnosed diabetes (prevalence) in the NHANES cohort.
We included two binary end points for classification:
The primary endpoint (ap1) for the classification of undiagnosed diabetes was defined as an HbA1c ≥ 6.5% (48 mmol/mol) without a previous diagnosis of diabetes.
The secondary endpoint (ap2) was for the classification of undiagnosed diabetes (defined by an HbA1c ≥ 6.5% (48 mmol/mol) without a previous diagnosis of diabetes) or known diabetes.
2.3. Variables and Selection
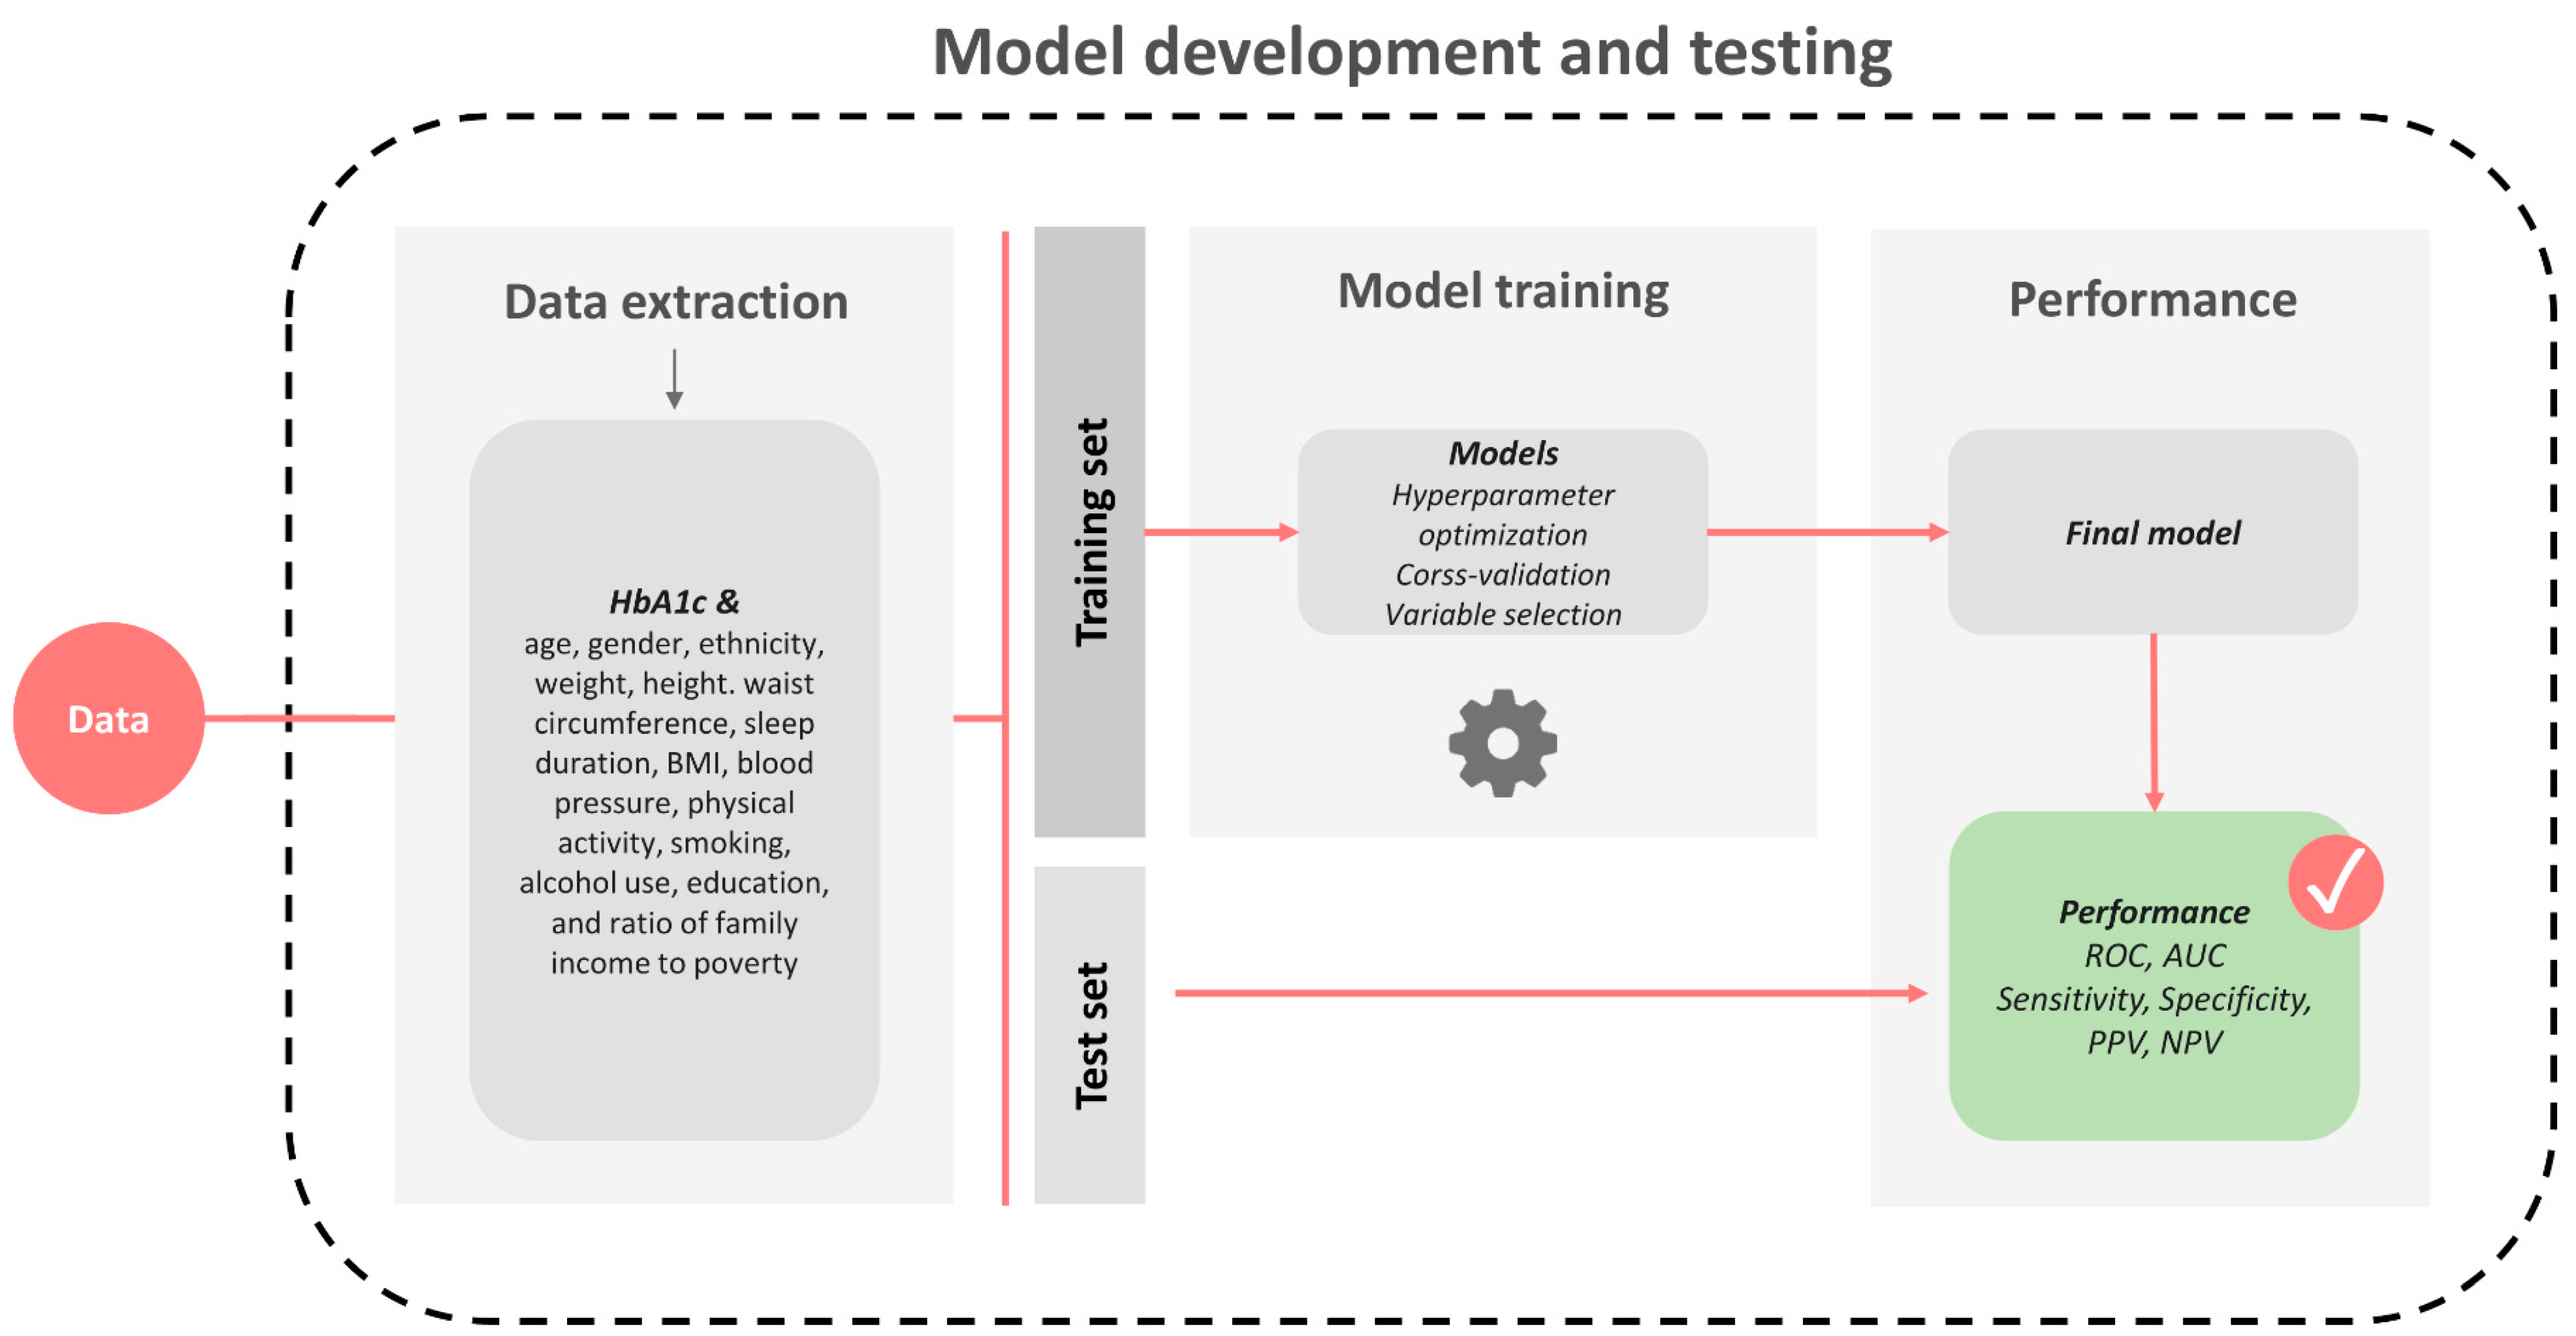
We included simple variables commonly associated with the risk of diabetes that could be used in a practical prescreening procedure. The variables included age, sex, ethnicity, weight, height, waist circumference, sleep duration, BMI, blood pressure (BP), physical activity, smoking, alcohol use, education, and the ratio of family income to poverty. Variable selection were performed according to an automatic approach using the training data, 3-fold cross-validation, and receiver operating characteristic (ROC) area under the curve (AUC) improvements as criteria for the inclusion of variables. Missing data among variables used for classification and prediction are common both in studies and during clinical usage. However, the chosen ML methods implemented in this study can incorporate missing values into the modeling approach without the need for imputation or case deletion [28].
2.4. Model Development
We included five ML models for comparison: random forest, AdaBoost, RUSBoost, LogitBoost, and a neural network. These specific models were compared because previous studies have shown high performance with ensemble and neural network models in general disease classification [29,30]. The rationale behind selecting these models is rooted in the collective strengths they bring to the task of disease classification, which aims to provide a comprehensive comparison across diverse approaches. By including models with different underlying mechanisms (boosting, bagging, or neural networks), we aim to identify the most suitable model for our specific dataset and research objectives.
The models were trained/developed using a sample of 80% (training data) of the individuals in each group and tested on the remaining 20% (test data). This process was conducted in such a manner that 20% of the data were saved for testing the final models; hence, the test data were not used to optimize the models further. The training data were used to select variables through forward selection and to optimize and train the models; cross-validation was used to minimize overfitting of the models. Due to a class imbalance in the dataset, the optimization was conducted with an evaluation criterion based on the precision-recall curve area under the curve (PR-AUC):
A schematic of the procedure is illustrated in Figure 1.
All the models were developed and implemented using MATLAB R2021b (MathWorks, Natick, MA, USA).
2.4.1. Random Forest Model
The random forest algorithm is a machine learning method [31] that uses a group of decision trees to make predictions. During the training process, many decision trees are constructed, and the output of the random forest is determined by the majority vote of the trees. Each tree in the forest are based on a random sample of data. The final prediction is made by combining the predictions of all the individual trees. As the number of trees in the forest increases, the accuracy of the predictions tends to improve. Hyperparameter estimation was performed using a grid search strategy. We optimized the number of trees, depth of trees, and minimum number of samples to perform splitting.
2.4.2. AdaBoost
Adaptive boosting (AdaBoost) [32] is an ensemble learning algorithm that is used to improve the accuracy of a weak learner (such as a decision tree). This process involves iteratively training the weak learner and adjusting the weights of the training data at each iteration so that the misclassified examples are given higher weights. The final model is a combination of all the weak learners, with each weak learner contributing a weight to the final prediction. One of the main benefits of AdaBoost is that it is simple to implement and relatively resistant to overfitting problems, making it a good choice for situations where the training data are limited. Hyperparameter estimation was performed using a grid search strategy. We optimized the number of weak learners and the learning rate.
2.4.3. RUSBoost
Random undersampling boosting (RUSBoost) [33] is a variant of the AdaBoost algorithm that are designed to handle imbalanced datasets. The imbalanced datasets are datasets in which one class (the minority class; in our case, individuals with undiagnosed diabetes) has significantly fewer examples than the other class (the majority class; in our cases, individuals without undiagnosed diabetes). In such cases of imbalance, AdaBoost can be prone to bias toward the majority class, leading to poor performance for the minority class. RUSBoost addresses this issue by randomly undersampling the majority class at each iteration. By undersampling the majority class, RUSBoost ensures that each weak learner are trained on a balanced dataset. Hyperparameter estimation was performed using a grid search strategy. We optimized the number of weak learners and the learning rate.
2.4.4. LogitBoost
LogitBoost [34] is a popular boosting modification that can be applied to binary classification problems. From a statistical standpoint, LogitBoost can be seen as an additive tree regression by minimizing the logistic loss. One of the benefits of LogitBoost is that it is relatively easy to implement, and it can often achieve good performance with relatively little hyperparameter tuning. It is also resistant to overfitting, which makes it a good fit for use on noisy or high-dimensional data. Hyperparameter estimation was performed using a grid search strategy. We optimized the number of weak learners and the learning rate.
2.4.5. Neural Network
A neural network is a machine learning model inspired by the structure and function of the human brain. It is composed of layers of interconnected nodes, or neurons, that process and transmit information. We implemented a feedforward neural network with the following architecture: an input layer, three fully connected hidden layers [3, 2, 4 neurons], a softmax layer, and a classification layer. In the training process, 30% of the training dataset were used as the validation dataset to minimize overfitting of the model. Hyperparameter estimation was performed using a grid search strategy. We optimized the number of neurons in the hidden layers.
2.5. Model Assessment
Test datasets were used to assess the performance of the five models. Receiver operating characteristic (ROC) curves and receiver operating characteristic (ROC) curves were used to compare the performance of the models for classifying undiagnosed diabetes (ap1) from that of undiagnosed diabetes and known diabetes (ap2). Ninety-five percent confidence intervals (CIs) for the receiver operating characteristic (ROC) curve were estimated using bootstrap replicates (n = 1000). Furthermore, a specific threshold (based on the maximized Youden index) was used to compare the sensitivity, specificity, positive predictive value (PPV), and negative predictive value (NPV) to better understand the capabilities of the models for usage in clinical practice during a prescreening procedure.
3. Results
A total of 45,431 participants were included in the analysis, and 36,162 participants were excluded from the analysis due to missing HbA1c measurements, age criteria, or pregnancy. Among the included participants, 1297 had undiagnosed diabetes (the prevalence of undiagnosed diabetes was 3.2%), 4772 had known diabetes, and 9556 had prediabetes. The characteristics of the included participants are presented in Table 1.
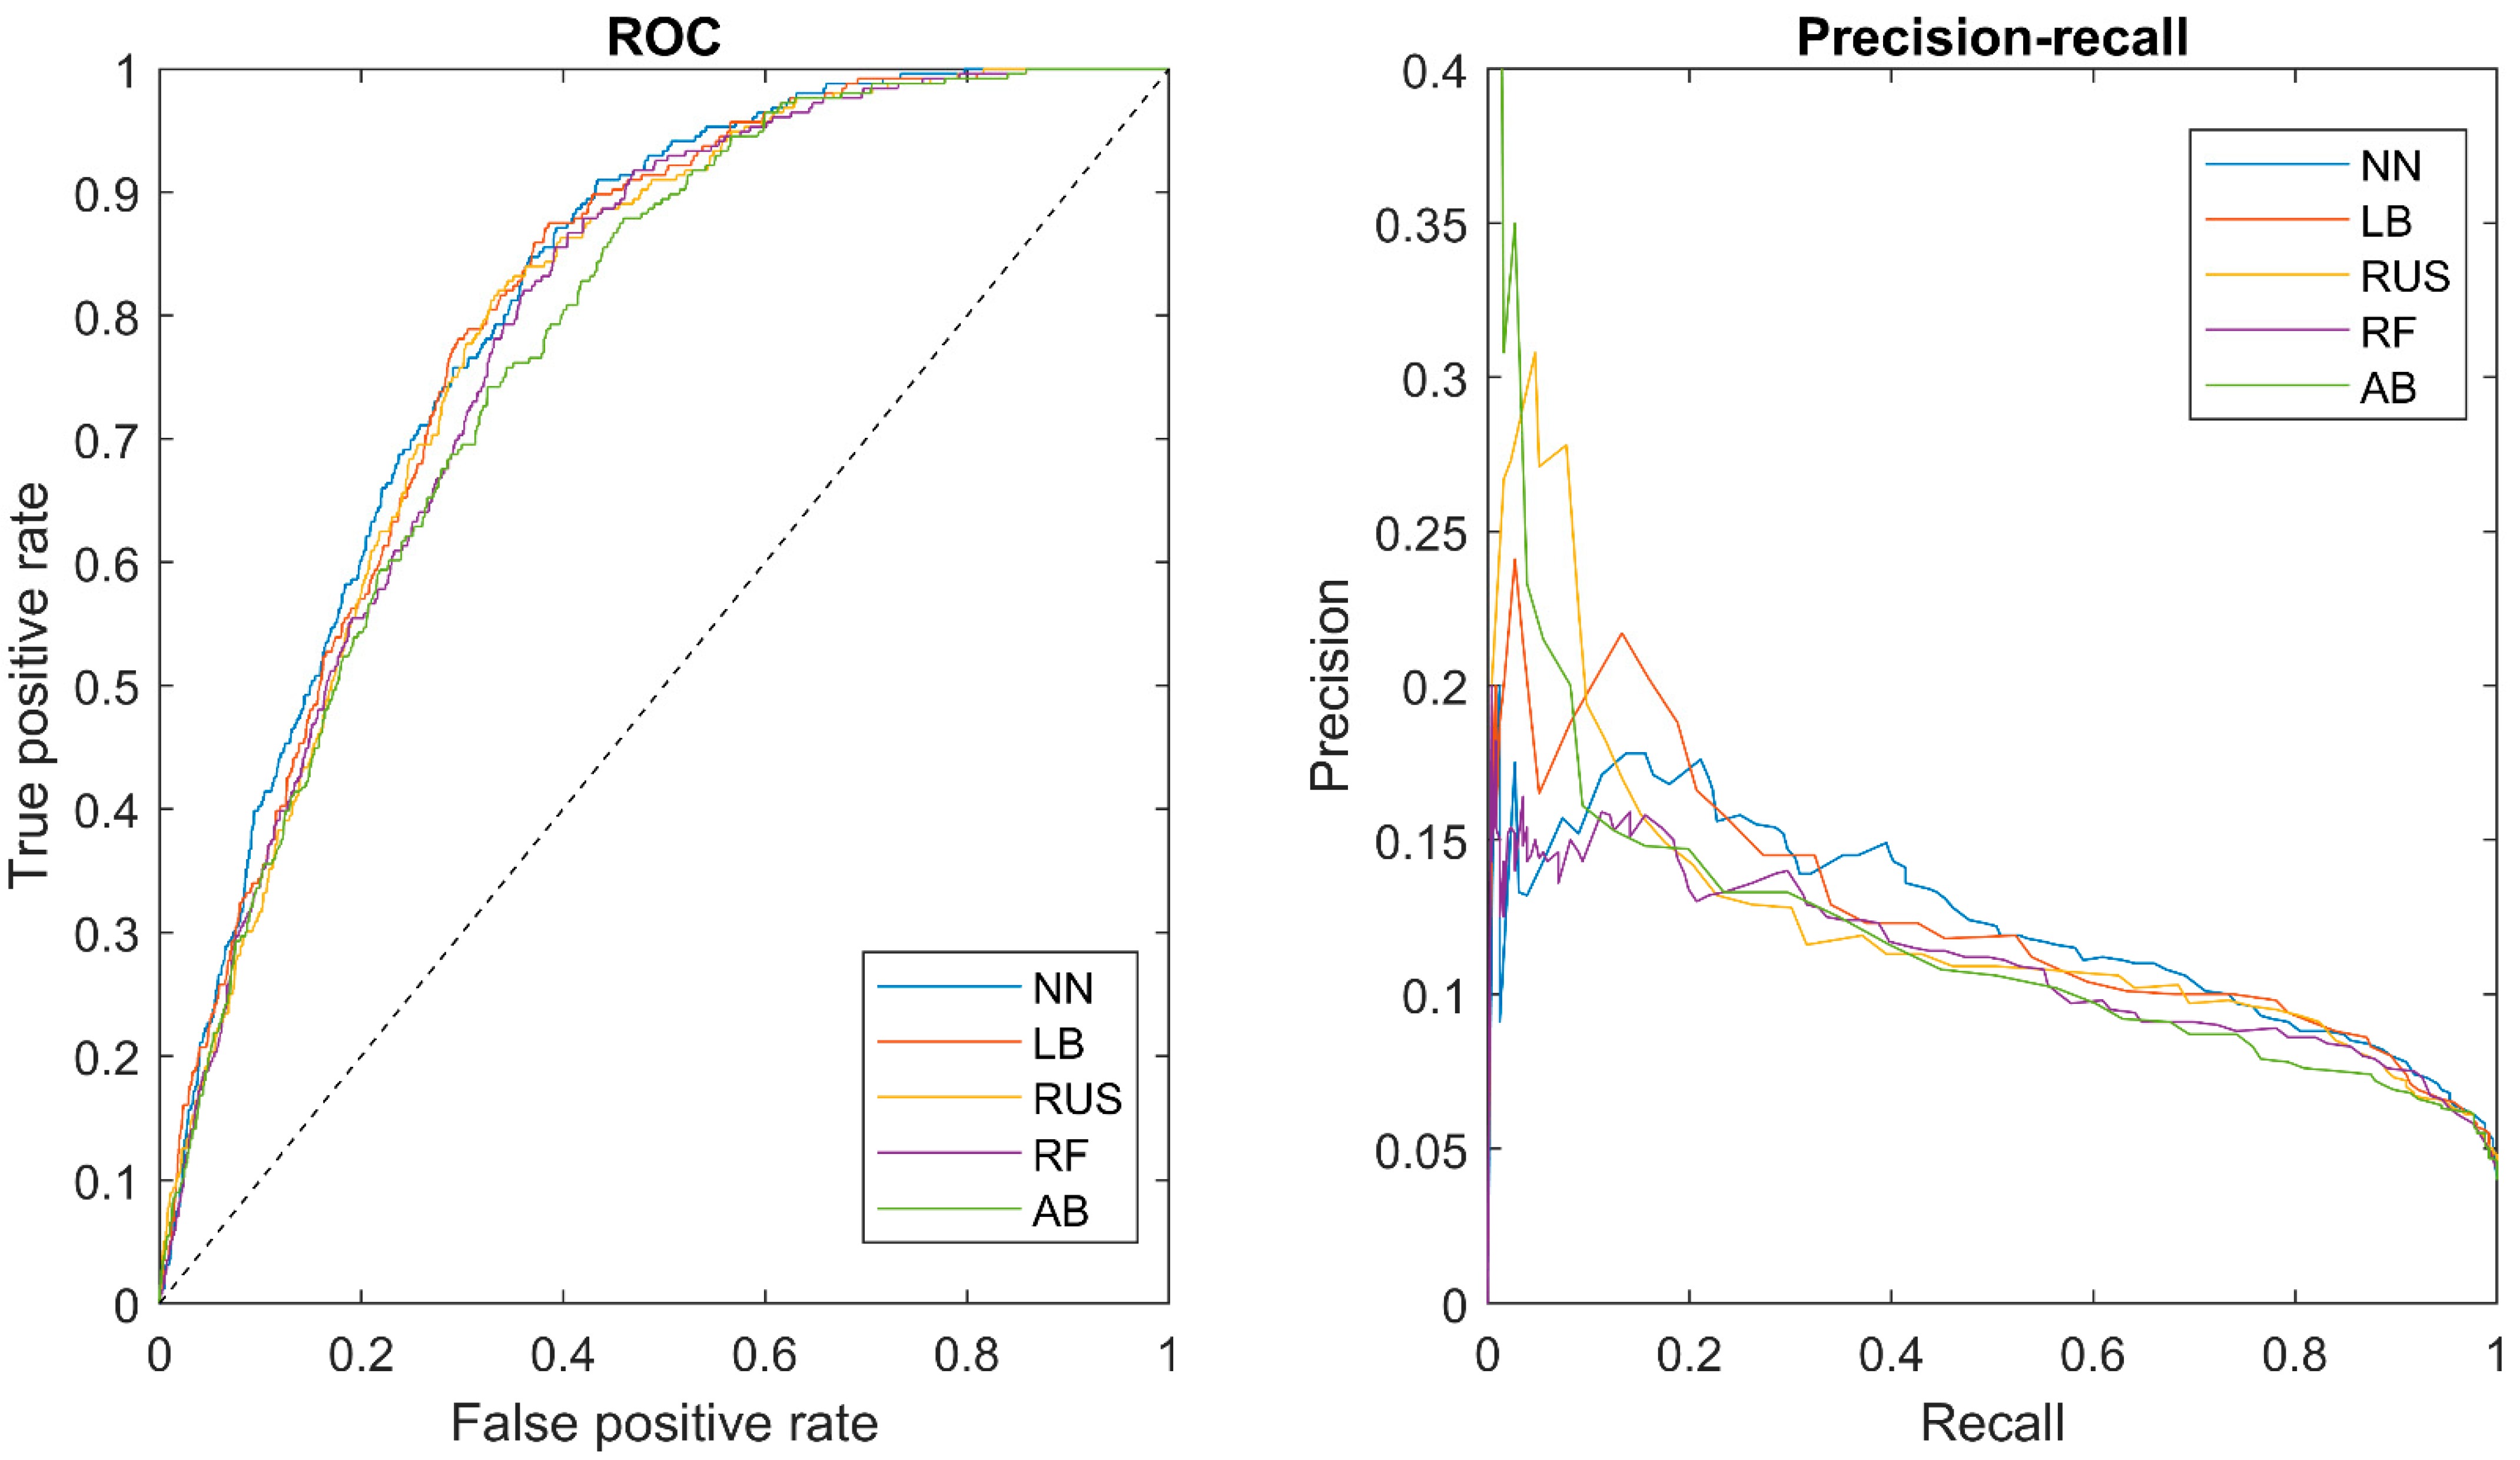
Table 2 shows the ROC AUCs for the classifiers along with a selected cutoff, which included sensitivity, specificity, positive predictive value (PPV), and negative predictive value (NPV). Figure 2 shows the ROC curves (left) and the precision-recall curves (right) for the five classifiers.
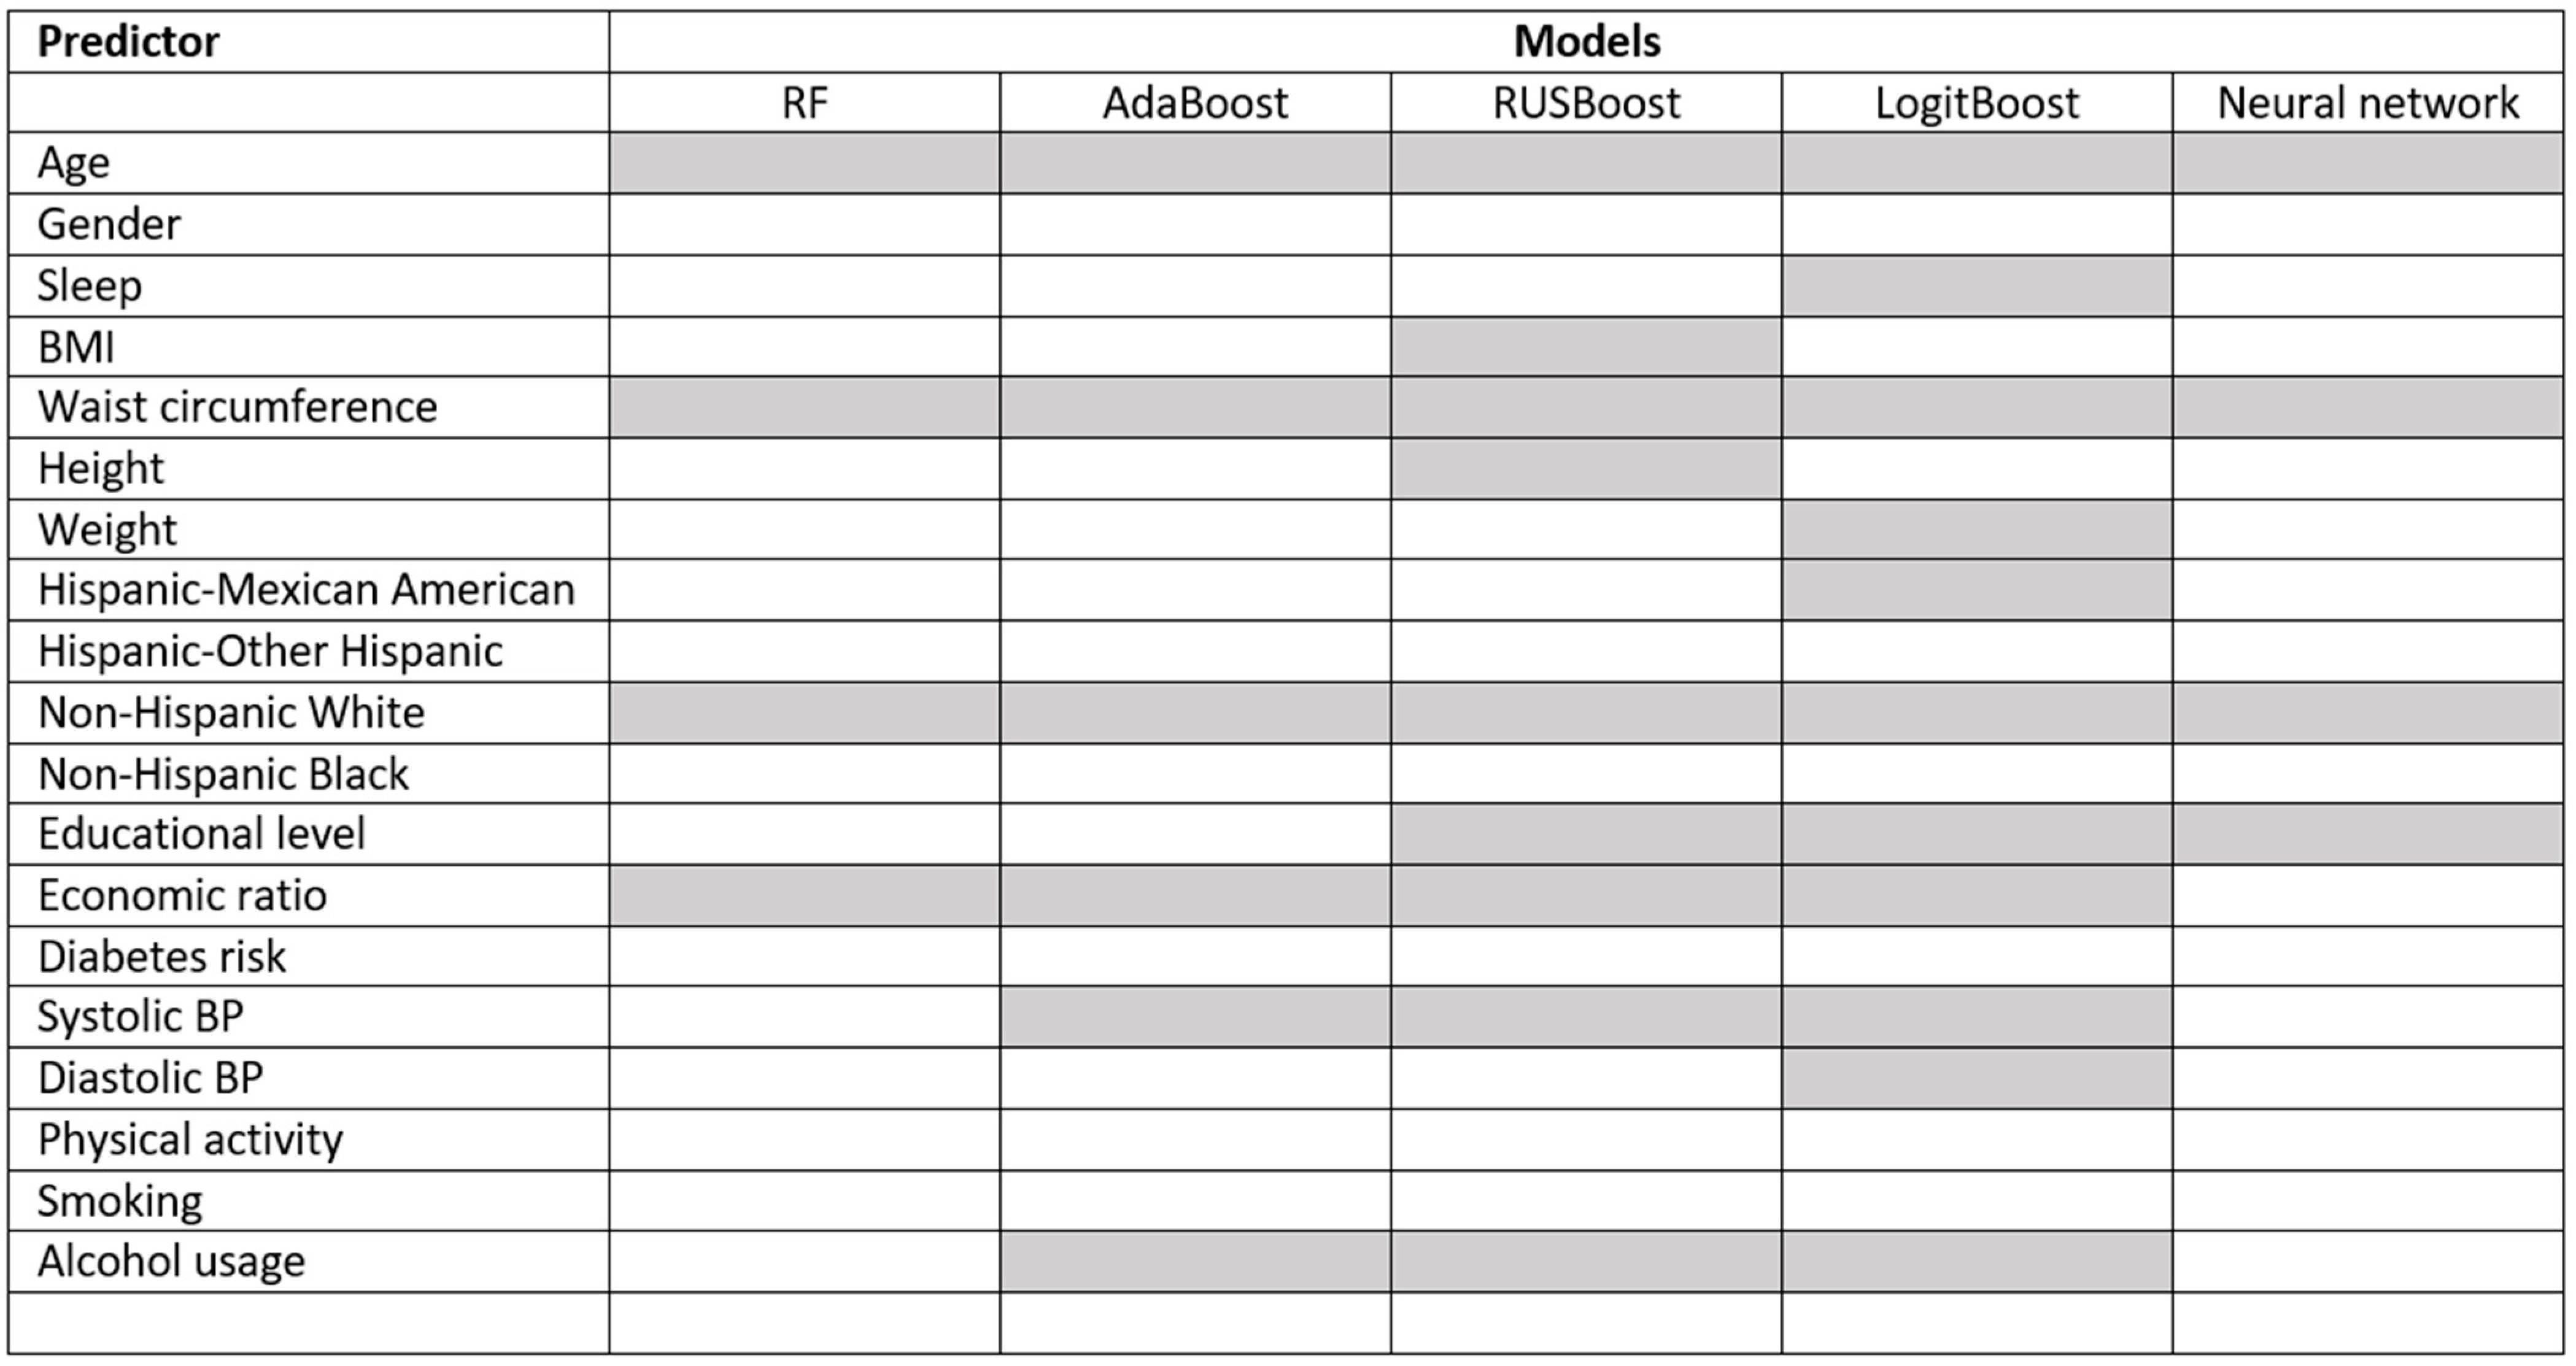
Primary endpoint (ap1): For the classification of undiagnosed diabetes (no diabetes or prediabetes vs. undiagnosed diabetes), the area under the ROC curve (AUC) was between 0.776 and 0.806. The PPV was between 0.083 and 0.091, the NPV was between 0.984 and 0.99, and the sensitivity was between 0.742 and 0.871. Figure 3 shows the selected predictors for each model using forward selection and cross-validation. Age and ethnicity (non-Hispanic white) were selected for all models, and the economic ratio was selected for four out of five models.
Secondary endpoint (ap2): For the classification of undiagnosed diabetes + known diabetes (no diabetes or prediabetes vs. undiagnosed diabetes or known diabetes), the receiver operating characteristic (ROC) curves were between 0.787 and 0.802. The PPV was between 0.287 and 295; the NPV was between 0.949 and 952; and the sensitivity was between 0.787 and 802.
4. Discussion
This study aimed to compare the performance of an ML model in classifying undiagnosed diabetes from known diabetes using a large heterogeneous dataset utilizing simple and obtainable clinical information. For the classification of undiagnosed diabetes, the comparison did not reveal large differences in model performance among the five models. All the included models performed well and could be utilized in a clinical prescreening program to identify people for subsequent diabetes testing. The PPV was approximately 8–9%, which is low but is expected for this type of prescreening. Other risk score studies have reported PPVs between 4 and 8% [6,35]. This means that for each of the 1000 people we screened, if a sensitivity of 80% was selected, ~392 people would be eligible for subsequent testing, and out of those people, ~32 would have undiagnosed diabetes. Furthermore, ~8 people will not be diagnosed with diabetes. A substantial portion of the people selected for subsequent testing who did not have undiagnosed diabetes (false positives) were diagnosed with prediabetes. Identifying people with prediabetes could lead to health-promoting initiatives for the group to slow or stop the progression from prediabetes to diabetes.
The exact cutoff for such a prescreening procedure also needs to be considered in a cost-benefit analysis, which is beyond the scope of this paper.
For the classification of undiagnosed diabetes + known diabetes, similar trends were observed—the choice of model did not significantly change the performance. However, the PPV was much greater than that of undiagnosed diabetes alone. This is also expected, as the prevalence of prediabetes at the population level is much greater.
The predictors included in this study can be categorized into three groups: demographic, clinical, and lifestyle predictors. These predictors were used to develop machine learning models to prescreen undiagnosed diabetes patients.
Demographic predictors have been shown to be associated with diabetes incidence [36]. In our study, age and ethnicity were included as predictors in all the proposed models. Clinical variables have been consistently associated with diabetes risk. For example, higher BMI and waist circumference have been shown to be strongly associated with diabetes risk, with individuals with a BMI of 30 or higher being at a greater risk of developing diabetes. Waist circumference and systolic blood pressure were also included as predictors in most of the models. BMI was only selected for one of the compared models; however, studies have shown that waist circumference may be a more specific predictor of dangerous overweight [37]. Lifestyle predictors have also been shown to be associated with diabetes risk [36]. For example, physical activity has been shown to lower diabetes risk, while smoking and alcohol usage have been shown to increase diabetes risk [38]. In our study, alcohol usage and indirect measures of lifestyle, such as education level and economic status, were included as predictors. Surprisingly, physical activity and smoking were not included as predictors. The explanation could be that it might be difficult to capture the discriminative information in these predictors using a questionnaire-based approach or that the information is captured indirectly by other predictors.
4.1. Comparison to Other Related Work
Over the past few decades, several machine learning approaches and classic statistical predictive models have been published on the topic of screening for undiagnosed diabetes. Baan et al. [35] developed three predictive models (logistics regression) based on a sample of participants from the Rotterdam Study (n = 1016) aged 55 to 75 years who were not known to have diabetes. The authors reported ROC AUCs of up to 0.74. Bang et al. [36] developed a simple scoring system (based on logistic regression) based on the Korea National Health and Nutrition Examination Survey (KNHANES) and compared it with previous scoring systems. Bang et al. reported ROC AUCs of up to 0.73. Moreover, Cichosz et al. [23] suggested an extended predictive feature search strategy to model a logistic regression for the prediction of undiagnosed diabetes. They reported an ROC AUC of 0.78.
Yu et al. [24] used a support vector machine (SVM) approach to identify undiagnosed and known diabetes in the 1999–2004 sample of the NHANES with successful performance (AUC = 0.83). However, Yu et al. did not predict undiagnosed diabetes separately, which makes comparison difficult.
4.2. Strengths and Limitations
An important advantage of this research lies in our utilization of a substantial and diverse dataset from the NHANES. This dataset are distinctive because it comprises nationally representative survey data that have been weighted, accurately reflecting the composition of the entire U.S. populace. As a result, the findings are likely to have a reasonable degree of applicability to the broader U.S. population when used in a screening process. Nevertheless, the application of these models in different global regions necessitates careful consideration, and it is imperative to validate their effectiveness in these populations before embracing them on a larger scale.
The approach introduced in this research were rooted in data-driven analysis. We carefully chose variables and refined our models to achieve optimal performance. Although the chosen variables were all characterized as readily available or easily obtainable clinical data, certain pieces of information hold greater clinical practicality, particularly in the context of conducting large-scale population screenings. Should these models be considered for practical clinical use, it becomes important to assess the significance of each variable, with an emphasis on selecting those that offer the most effortlessly attainable information.
A limitation of this study is the definition of undiagnosed diabetes, as it was based on a single lab value of HbA1c above 6.5%. The American Diabetes Association (ADA) recommends that at least two HbA1c levels be measured to fully establish a diabetes diagnosis. Furthermore, known diabetes diagnoses rely on participant self-reports, which are subject to misclassification bias.
Additionally, we explored five distinct, robust machine learning algorithms known for their effective predictive capabilities in healthcare settings for comparative analysis. Numerous alternative methods and implementations, including support vector machines, XGBoost, and K-nearest neighbor methods, are also available. We believe that further exploration and comparison of additional methods could be pertinent, particularly when dealing with more intricate datasets containing extensive additional and complex information for the identification of undiagnosed diabetes.
4.3. Future Directions
In a recent study, Katsimpris et al. [39] demonstrated the potential of leveraging nutritional data for predicting type 2 diabetes mellitus through a logistic regression approach. An avenue for future exploration in the development of a classification model for identifying individuals with undiagnosed diabetes involves integrating dietary information with other pertinent factors. This strategic combination of variables aims to enhance the predictive capabilities of the model, potentially yielding more accurate and comprehensive insights into the identification of undiagnosed diabetes patients.
5. Conclusions
We have demonstrated that several types of classification models can accurately classify undiagnosed diabetes from simple and clinically obtainable variables. Small differences in performance were observed among the compared models, but no one model outperformed the others in terms of classifying undiagnosed diabetes or prediabetes. These results suggest that the use of machine learning for prescreening for undiagnosed diabetes could be a useful tool in clinical practice.
Author Contributions
S.L.C. analyzed the data. S.L.C. and C.B. wrote the main manuscript text and prepared the figures. O.H. assisted in coordinating the various stages of the project and provided critical feedback on the analysis and manuscript. All the authors reviewed this manuscript. All authors have read and agreed to the published version of the manuscript.
Funding
This research received no external funding.
Institutional Review Board Statement
The presented study is a reanalysis of existing, publicly available, and anonymized data NHANES. The presented study in this paper did not need any approval form institutional and/or licensing committee, cf. Danish law on “Bekendtgørelse af lov om videnskabsetisk behandling af sundhedsvidenskabelige forskningsprojekter og sundhedsdatavidenskabelige forskningsprojekter” (Komitéloven, kap. 4, § 14, stk. 3).
Informed Consent Statement
The data were collected with informed consent from participants, and the data were deidentified to protect the privacy of the participants. The NHANES protocol was approved by the NCHS Ethics Review Board (ERB).
Data Availability Statement
All the data are publicly available at: https://www.cdc.gov/nchs/nhanes/index.htm. Accessed on 1 January 2023.
Conflicts of Interest
The authors declare no conflicts of interest.
Abbreviations
National Health and Nutrition Examination Survey (NHANES); positive predictive values (PPVs); negative predictive values (NPVs); machine learning (ML); receiver operating characteristic (ROC); area under the curve (AUC); Korea National Health and Nutrition Examination Survey (KNHANES)
References
- Shah, A.; Afzal, M. Prevalence of diabetes and hypertension and association with various risk factors among different Muslim populations of Manipur, India. J. Diabetes Metab. Disord. 2013, 12, 52. [Google Scholar] [CrossRef] [PubMed]
- Noble, D.; Mathur, R.; Dent, T.; Meads, C.; Greenhalgh, T. Risk models and scores for type 2 diabetes: Systematic review. BMJ 2011, 343, 1243. [Google Scholar] [CrossRef] [PubMed]
- Mendola, N.D.; Chen, T.-C.; Gu, Q.; Eberhardt, M.S.; Saydah, S. Prevalence of Total, Diagnosed, and Undiagnosed Diabetes Among Adults: United States, 2013–2016. Key findings Data from the National Health and Nutrition Examination Survey (NHANES). NCHS Data Brief 2013, 319, 1–8. [Google Scholar]
- Gillies, C.L.; Lambert, P.C.; Abrams, K.R.; Sutton, A.J.; Cooper, N.J.; Hsu, R.T.; Davies, M.J.; Khunti, K. Different strategies for screening and prevention of type 2 diabetes in adults: Cost effectiveness analysis. BMJ 2008, 336, 1180–1184. [Google Scholar] [CrossRef]
- Simmons, R.K.; Echouffo-Tcheugui, J.B.; Griffin, S.J. Screening for type 2 diabetes: An update of the evidence. Diabetes Obes Metab. 2010, 12, 838–844. [Google Scholar] [CrossRef]
- Lee, Y.H.; Bang, H.; Kim, H.C.; Kim, H.M.; Park, S.W.; Kim, D.J. A simple screening score for diabetes for the Korean population: Development, validation, and comparison with other scores. Diabetes Care 2012, 35, 1723–1730. [Google Scholar] [CrossRef] [PubMed]
- Liu, M.; Pan, C.; Jin, M. A Chinese diabetes risk score for screening of undiagnosed diabetes and abnormal glucose tolerance. Diabetes Technol. Ther. 2011, 13, 501–507. [Google Scholar] [CrossRef]
- Collins, G.S.; Mallett, S.; Omar, O.; Yu, L.-M. Developing risk prediction models for type 2 diabetes: A systematic review of methodology and reporting. BMC Med. 2011, 9, 103. [Google Scholar] [CrossRef]
- Firdous, S.; Wagai, G.; Sharma, K. A survey on diabetes risk prediction using machine learning approaches. J. Fam. Med. Prim. Care 2022, 11, 6929. [Google Scholar]
- Sun, G.W.; Shook, T.L.; Kay, G.L. Inappropriate use of bivariable analysis to screen risk factors for use in multivariable analysis. J. Clin. Epidemiol. 1996, 49, 907–916. [Google Scholar] [CrossRef]
- Royston, P.; Altman, D.G.; Sauerbrei, W. Dichotomizing continuous predictors in multiple regression: A bad idea. Stat. Med. 2006, 25, 127–141. [Google Scholar] [CrossRef]
- Maniruzzaman, M.; Kumar, N.; Menhazul Abedin, M.; Islam, S.; Suri, H.S.; El-Baz, A.S.; Suri, J.S. Comparative approaches for classification of diabetes mellitus data: Machine learning paradigm. Comput. Methods Programs Biomed. 2017, 152, 23–34. [Google Scholar] [CrossRef]
- Cichosz, S.L.; Xylander, A.A.P. A Conditional Generative Adversarial Network for Synthesis of Continuous Glucose Monitoring Signals. J. Diabetes Sci. Technol. 2021, 16, 1220–1223. [Google Scholar] [CrossRef] [PubMed]
- Cichosz, S.L.; Jensen, M.H.; Hejlesen, O. Short-term prediction of future continuous glucose monitoring readings in type 1 diabetes: Development and validation of a neural network regression model. Int. J. Med. Inform. 2021, 151, 104472. [Google Scholar] [CrossRef] [PubMed]
- Cichosz, S.L.; Johansen, M.D.; Hejlesen, O. Toward Big Data Analytics: Review of Predictive Models in Management of Diabetes and Its Complications. J. Diabetes Sci. Technol. 2016, 10, 27–34. [Google Scholar] [CrossRef] [PubMed]
- Cichosz, S.L.; Frystyk, J.; Tarnow, L.; Fleischer, J. Combining Information of Autonomic Modulation and CGM Measurements Enables Prediction and Improves Detection of Spontaneous Hypoglycemic Events. J. Diabetes Sci. Technol. 2014, 9, 132–137. [Google Scholar] [CrossRef]
- Cichosz, S.L.; Kronborg, T.; Jensen, M.H.; Hejlesen, O. Penalty weighted glucose prediction models could lead to better clinically usage. Comput. Biol. Med. 2021, 138, 104865. [Google Scholar] [CrossRef]
- Cichosz, S.L.; Rasmussen, N.H.; Vestergaard, P.; Hejlesen, O. Precise Prediction of Total Body Lean and Fat Mass from Anthropometric and Demographic Data: Development and Validation of Neural Network Models. J. Diabetes Sci. Technol. 2020, 15, 1337–1343. [Google Scholar] [CrossRef]
- Huang, J.; Yeung, A.M.; Armstrong, D.G.; Battarbee, A.N.; Cuadros, J.; Espinoza, J.C.; Kleinberg, S.; Mathioudakis, N.; Swerdlow, M.A.; Klonoff, D.C. Artificial Intelligence for Predicting and Diagnosing Complications of Diabetes. J. Diabetes Sci. Technol. 2023, 17, 224–238. [Google Scholar] [CrossRef]
- Joshi, R.D.; Dhakal, C.K. Predicting Type 2 Diabetes Using Logistic Regression and Machine Learning Approaches. Int. J. Environ. Res. Public Health 2021, 18, 7346. [Google Scholar] [CrossRef]
- Chen, W.; Chen, S.; Zhang, H.; Wu, T. A hybrid prediction model for type 2 diabetes using K-means and decision tree. In Proceedings of the IEEE International Conference on Software Engineering and Service Sciences, ICSESS, Beijing, China, 24–26 November 2017; pp. 386–390. [Google Scholar]
- Sisodia, D.; Sisodia, D.S. Prediction of Diabetes using Classification Algorithms. Procedia Comput. Sci. 2018, 132, 1578–1585. [Google Scholar] [CrossRef]
- Cichosz, S.L.; Johansen, M.D.; Ejskjaer, N.; Hansen, T.K.; Hejlesen, O.K. Improved diabetes screening using an extended predictive feature search. Diabetes Technol. Ther. 2014, 16, 166–171. [Google Scholar] [CrossRef]
- Yu, W.; Liu, T.; Valdez, R.; Gwinn, M.; Khoury, M.J. Application of support vector machine modeling for prediction of common diseases: The case of diabetes and prediabetes. BMC Med. Inform. Decis. Mak. 2010, 10, 16. [Google Scholar] [CrossRef]
- Maniruzzaman, M.; Rahman, M.J.; Ahammed, B.; Abedin, M. Classification and prediction of diabetes disease using machine learning paradigm. Health Inf. Sci. Syst. 2020, 8, 1–14. [Google Scholar] [CrossRef]
- Centers for Disease Control and Prevention (CDC); National Center for Health Statistics (NCHS). National Health and Nutrition Examination Survey Data. Hyattsville MUSD of H and HSC for DC and P. National Health and Nutrition Examination Survey (NHANES) 2005–2018. Available online: https://www.cdc.gov/nchs/nhanes/index.htm (accessed on 19 November 2023).
- Association, A.D. Standards of Medical Care in Diabetes—2022 Abridged for Primary Care Providers. Clin. Diabetes 2022, 40, 10–38. [Google Scholar] [CrossRef]
- García-Laencina, P.J.; Sancho-Gómez, J.L.; Figueiras-Vidal, A.R. Pattern classification with missing data: A review. Neural Comput. Appl. 2010, 19, 263–282. [Google Scholar] [CrossRef]
- Park, D.J.; Park, M.W.; Lee, H.; Kim, Y.-J.; Kim, Y.; Park, Y.H. Development of machine learning model for diagnostic disease prediction based on laboratory tests. Sci. Rep. 2021, 11, 7567. [Google Scholar] [CrossRef]
- Uddin, S.; Khan, A.; Hossain, M.E.; Moni, M.A. Comparing different supervised machine learning algorithms for disease prediction. BMC Med Inform. Decis. Mak. 2019, 19, 281. [Google Scholar] [CrossRef]
- Breiman, L. Random forests. Mach. Learn. 2001, 45, 5–32. [Google Scholar] [CrossRef]
- Freund, Y.; Schapire, R.E. A Decision-Theoretic Generalization of On-Line Learning and an Application to Boosting. J. Comput. Syst. Sci. 1997, 55, 119–139. [Google Scholar] [CrossRef]
- Seiffert, C.; Khoshgoftaar, T.M.; van Hulse, J.; Napolitano, A. RUSBoost: A hybrid approach to alleviating class imbalance. IEEE Trans. Syst. Man Cybern. Part A Syst. Hum. 2010, 40, 185–197. [Google Scholar] [CrossRef]
- Friedman, J.; Hastie, T.; Tibshirani, R. Additive logistic regression: A statistical view of boosting (with discussion and a rejoinder by the authors). Ann. Statist. 2000, 28, 337–407. [Google Scholar] [CrossRef]
- Baan, C.A.; Ruige, J.B.; Stolk, R.P.; Witteman, J.C.; Dekker, J.M.; Heine, R.J.; Feskens, E.J. Performance of a predictive model to identify undiagnosed diabetes in a health care setting. Diabetes Care 1999, 22, 213–219. [Google Scholar] [CrossRef]
- Fletcher, B.; Gulanick, M.; Lamendola, C. Risk factors for type 2 diabetes mellitus. J. Cardiovasc. Nurs. 2002, 16, 486. [Google Scholar] [CrossRef]
- Yang, H.; Xin, Z.; Feng, J.P.; Yang, J.-K. Waist-to-height ratio is better than body mass index and waist circumference as a screening criterion for metabolic syndrome in Han Chinese adults. Medicine 2017, 96, e8192. [Google Scholar] [CrossRef]
- Diabetes Prevention Program Research Group. Reduction in the incidence of type 2 diabetes with lifestyle intervention or metformin. N. Engl. J. Med. 2002, 346, 393–403. [Google Scholar] [CrossRef]
- Katsimpris, A.; Brahim, A.; Rathmann, W.; Peters, A.; Strauch, K.; Flaquer, A. Prediction of type 2 diabetes mellitus based on nutrition data. J. Nutr. Sci. 2021, 10, 1139. [Google Scholar] [CrossRef] [PubMed]
Figure 1.
Illustrates model development and performance testing.

Figure 2.
The left figure shows the receiver operating characteristic (ROC) curves for the classifiers: neural network (NN), LogitBoost (LB), RUSBoost (RUS), random forest (RF), and AdaBoost (AB) classifiers. The right figure shows the precision-recall for the classifiers: neural network (NN), LogitBoost (LB), RUSBoost (RUS), random forest (RF), and AdaBoost (AB).

Figure 3.
The selected predictors/features for the model(s). Gray indicates that the selected predictor was selected in the forward feature selection using 3-fold cross-validation.
Figure 3.
The selected predictors/features for the model(s). Gray indicates that the selected predictor was selected in the forward feature selection using 3-fold cross-validation.


Table 1.
The baseline characteristics of people with prediabetes, undiagnosed diabetes, or diabetes. Significance (p < 0.05) is indicated between undiagnosed diabetes and no diabetes (N), prediabetes (P), and diabetes (D).
Table 1.
The baseline characteristics of people with prediabetes, undiagnosed diabetes, or diabetes. Significance (p < 0.05) is indicated between undiagnosed diabetes and no diabetes (N), prediabetes (P), and diabetes (D).
| No Diabetes | Prediabetes | Undiagnosed Diabetes | Diabetes | Significance p < 0.05 | |
|---|---|---|---|---|---|
| n | 29,806 | 9556 | 1297 | 4772 | |
| Age, years | 36 (19.3) | 54.2 (18.4) | 57.7 (15) | 61.9 (13.9) | NPD |
| Male, % | 48.1 | 50 | 52.5 | 50.5 | N |
| BMI, kg/m2 | 26.8 (6.5) | 30.1 (7.2) | 33.1 (7.8) | 32.4 (7.7) | NPD |
| Height, cm | 166.9 (10.1) | 166.1 (10.2) | 166.1 (9.9) | 165.6 (10.7) | N |
| Weight, kg | 75.1 (20.6) | 83.5 (22.5) | 91.8 (24.2) | 89.5 (24.5) | NPD |
| Systolic BP, mmHg | 117.3 (16.5) | 127.5 (19) | 134.1 (20.9) | 131.6 (20.5) | NPD |
| Diastolic BP, mmHg | 67 (13.5) | 70.4 (14.4) | 72.3 (15.3) | 67.7 (14.6) | NPD |
| Smoking, % | 12.6 | 16.5 | 17.3 | 11.7 | ND |
| Physically active, % | 36.1 | 18.7 | 10.7 | 8.5 | NPD |
| Drinking alcohol, days/yrs | 12.6 (53.2) | 10.9 (51.9) | 9 (53.8) | 10 (54) | N |
| Family income to poverty ratio | 2.5 (1.6) | 2.4 (1.6) | 2.2 (1.5) | 2.3 (1.5) | NP |
| Sleep, h | 7.2 (3.1) | 7 (1.6) | 7 (3.1) | 7.4 (4.8) | ND |
| Hispanic-Mexican American, % | 18.3 | 15.3 | 21.6 | 17.2 | NPD |
| Hispanic-Other Hispanic, % | 9.4 | 9.9 | 10.4 | 9.9 | |
| Non-Hispanic White, % | 41.9 | 35.5 | 27.4 | 34.3 | NPD |
| Non-Hispanic Black, % | 19 | 28.2 | 28.5 | 27.6 | N |
Table 2.
The ROC AUC (95% confidence interval) for the classifiers, along with a selected cutoff based on the maximized Youden index, which includes sensitivity, specificity, positive predictive value (PPV), and negative predictive value (NPV).
Table 2.
The ROC AUC (95% confidence interval) for the classifiers, along with a selected cutoff based on the maximized Youden index, which includes sensitivity, specificity, positive predictive value (PPV), and negative predictive value (NPV).
| ROC AUC | Sensitivity | Specificity | PPV | NPV | |
|---|---|---|---|---|---|
| Undiagnosed diabetes | |||||
| RF | 0.786 (0.765; 0.810) | 0.855 | 0.603 | 0.083 | 0.99 |
| AdaBoost | 0.776 (0.750; 0.797) | 0.742 | 0.674 | 0.087 | 0.984 |
| RUSBoost | 0.792 (0.767; 0.812) | 0.824 | 0.657 | 0.091 | 0.989 |
| LogitBoost | 0.799 (0.775; 0.823) | 0.871 | 0.615 | 0.086 | 0.991 |
| Neural network | 0.806 (0.782; 0.827) | 0.848 | 0.628 | 0.087 | 0.99 |
| Diabetes + Undiagnosed diabetes | |||||
| RF | 0.800 (0.788; 0.815) | 0.814 | 0.637 | 0.290 | 0.949 |
| AdaBoost | 0.787 (0.775; 0.799) | 0.819 | 0.628 | 0.287 | 0.95 |
| RUSBoost | 0.796 (0.782; 0.809) | 0.818 | 0.631 | 0.288 | 0.95 |
| LogitBoost | 0.802 (0.789; 0.814) | 0.816 | 0.645 | 0.295 | 0.95 |
| Neural network | 0.800 (0.787; 0.810) | 0.821 | 0.64 | 0.294 | 0.952 |
Disclaimer/Publisher’s Note: The statements, opinions and data contained in all publications are solely those of the individual author(s) and contributor(s) and not of MDPI and/or the editor(s). MDPI and/or the editor(s) disclaim responsibility for any injury to people or property resulting from any ideas, methods, instructions or products referred to in the content. |
© 2024 by the authors. Licensee MDPI, Basel, Switzerland. This article is an open access article distributed under the terms and conditions of the Creative Commons Attribution (CC BY) license (https://creativecommons.org/licenses/by/4.0/).
Share and Cite
MDPI and ACS Style
Cichosz, S.L.; Bender, C.; Hejlesen, O. A Comparative Analysis of Machine Learning Models for the Detection of Undiagnosed Diabetes Patients. Diabetology 2024, 5, 1-11. https://0-doi-org.brum.beds.ac.uk/10.3390/diabetology5010001
AMA Style
Cichosz SL, Bender C, Hejlesen O. A Comparative Analysis of Machine Learning Models for the Detection of Undiagnosed Diabetes Patients. Diabetology. 2024; 5(1):1-11. https://0-doi-org.brum.beds.ac.uk/10.3390/diabetology5010001
Chicago/Turabian StyleCichosz, Simon Lebech, Clara Bender, and Ole Hejlesen. 2024. "A Comparative Analysis of Machine Learning Models for the Detection of Undiagnosed Diabetes Patients" Diabetology 5, no. 1: 1-11. https://0-doi-org.brum.beds.ac.uk/10.3390/diabetology5010001