
Utility of Flash Glucose Monitoring to Determine Glucose Variation Induced by Different Doughs in Persons with Type 2 Diabetes

 , , and
Abstract
:1. Introduction
- (1)
- To compare the GL of the dough prepared with functional alkaline (biocrystal) water (X) against one prepared with “mother” yeast, sourdough-leavened bread (Y), and one prepared with a commercial rapid leavening dough, bakery yeast bread (W), in persons with type 2 diabetes (T2DM);
- (2)
- To investigate the utility of FGM to measure rapid glucose changes after a GL in T2DM.
2. Patients and Methods
2.1. Patients
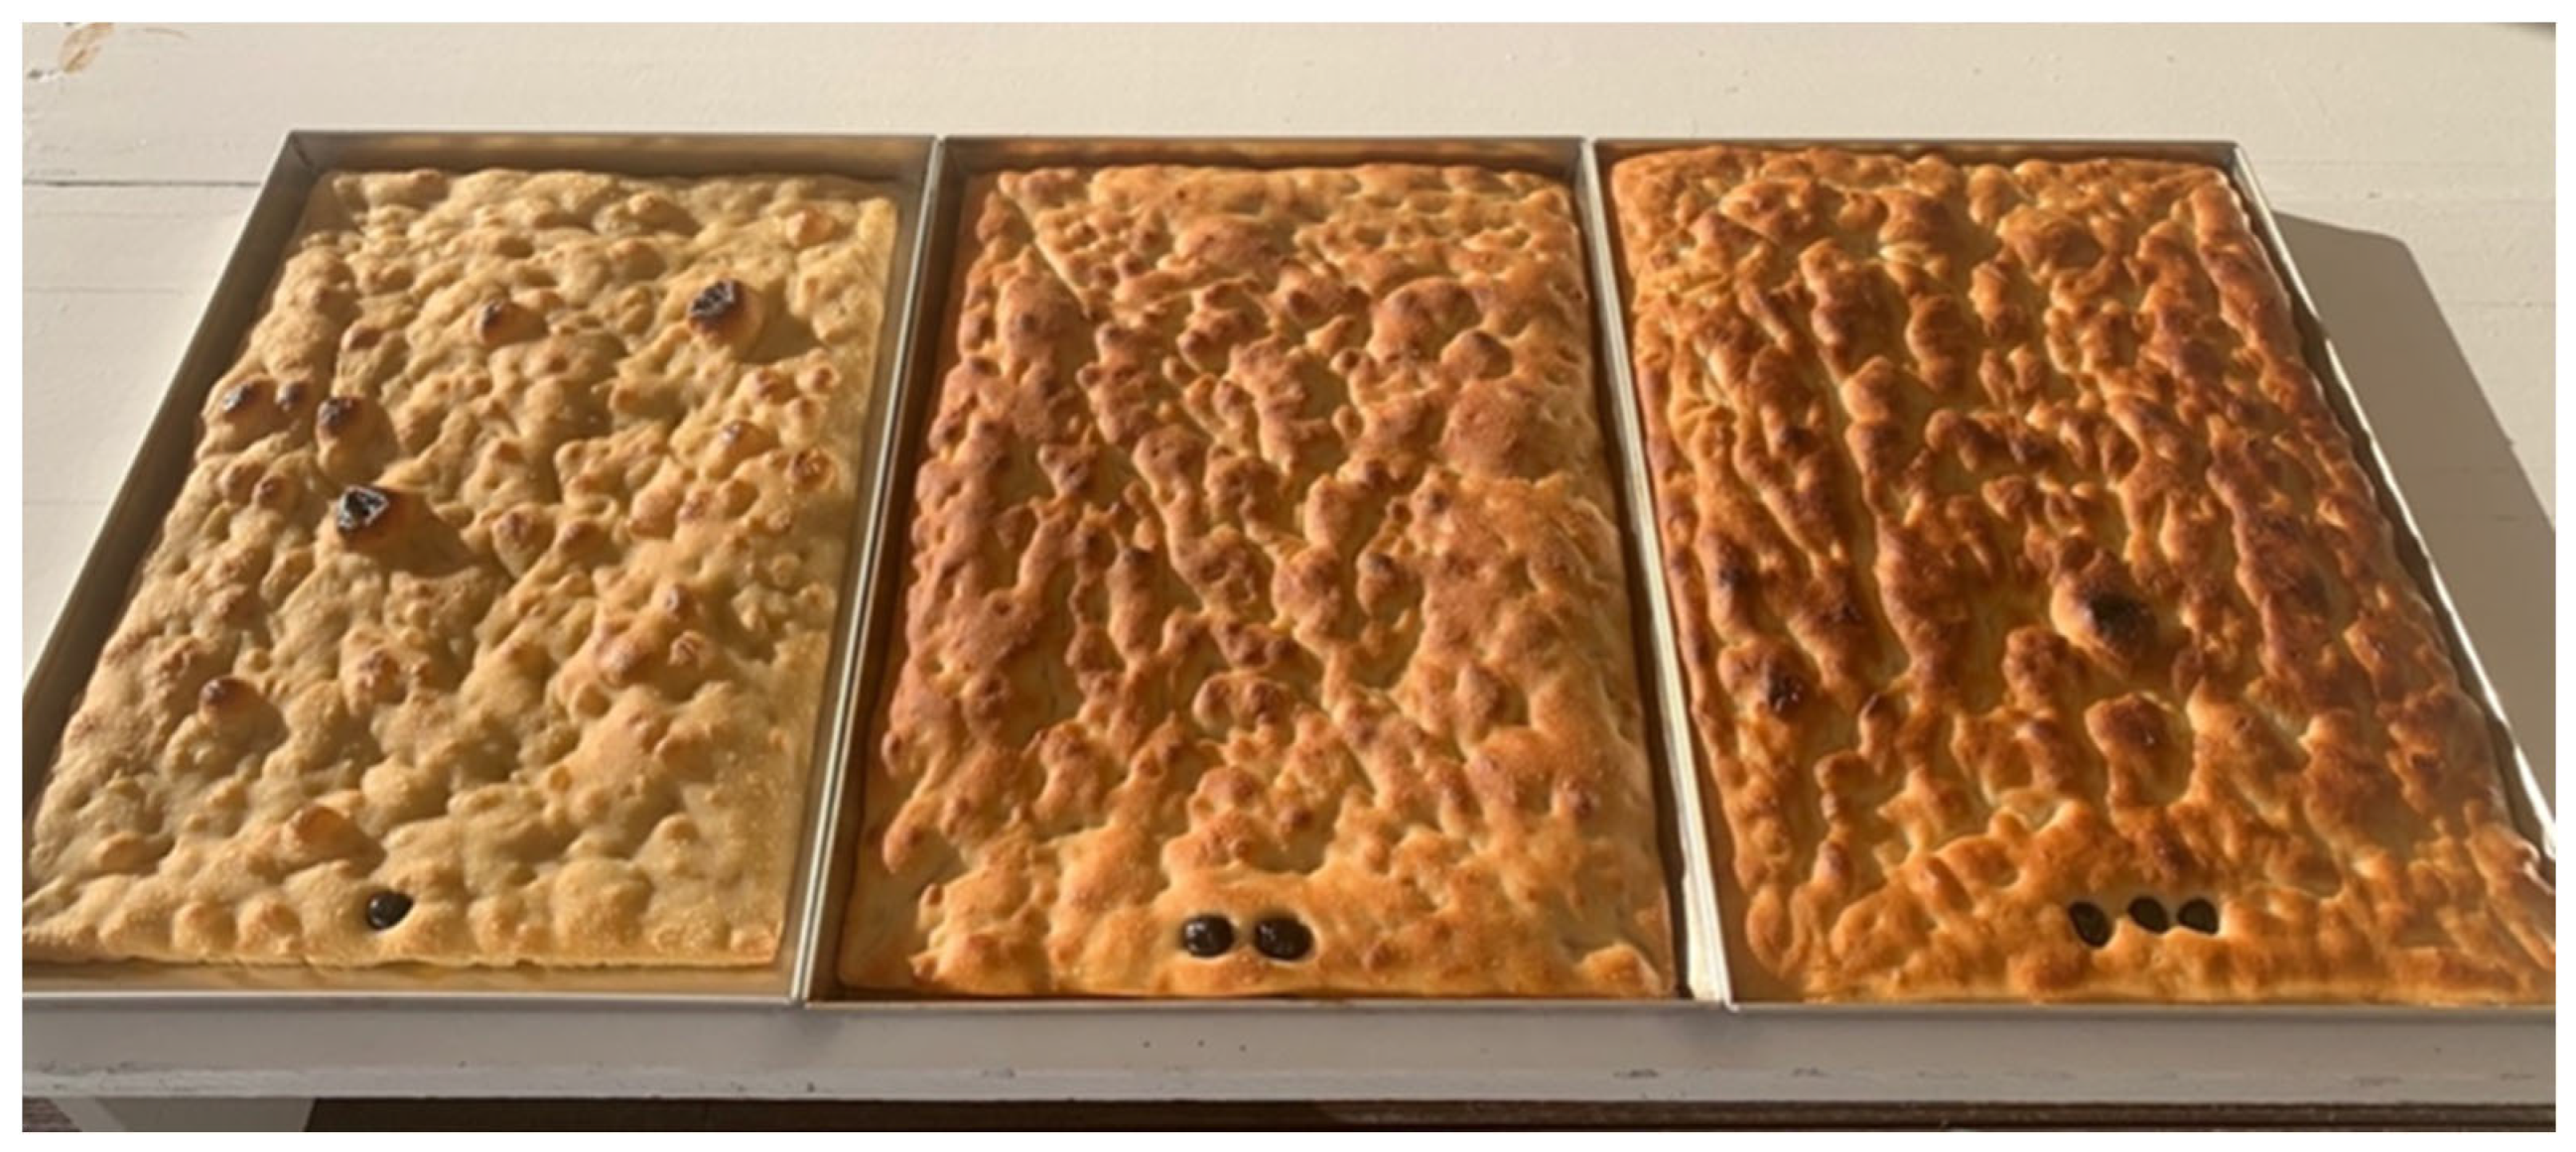
2.2. Study Breads
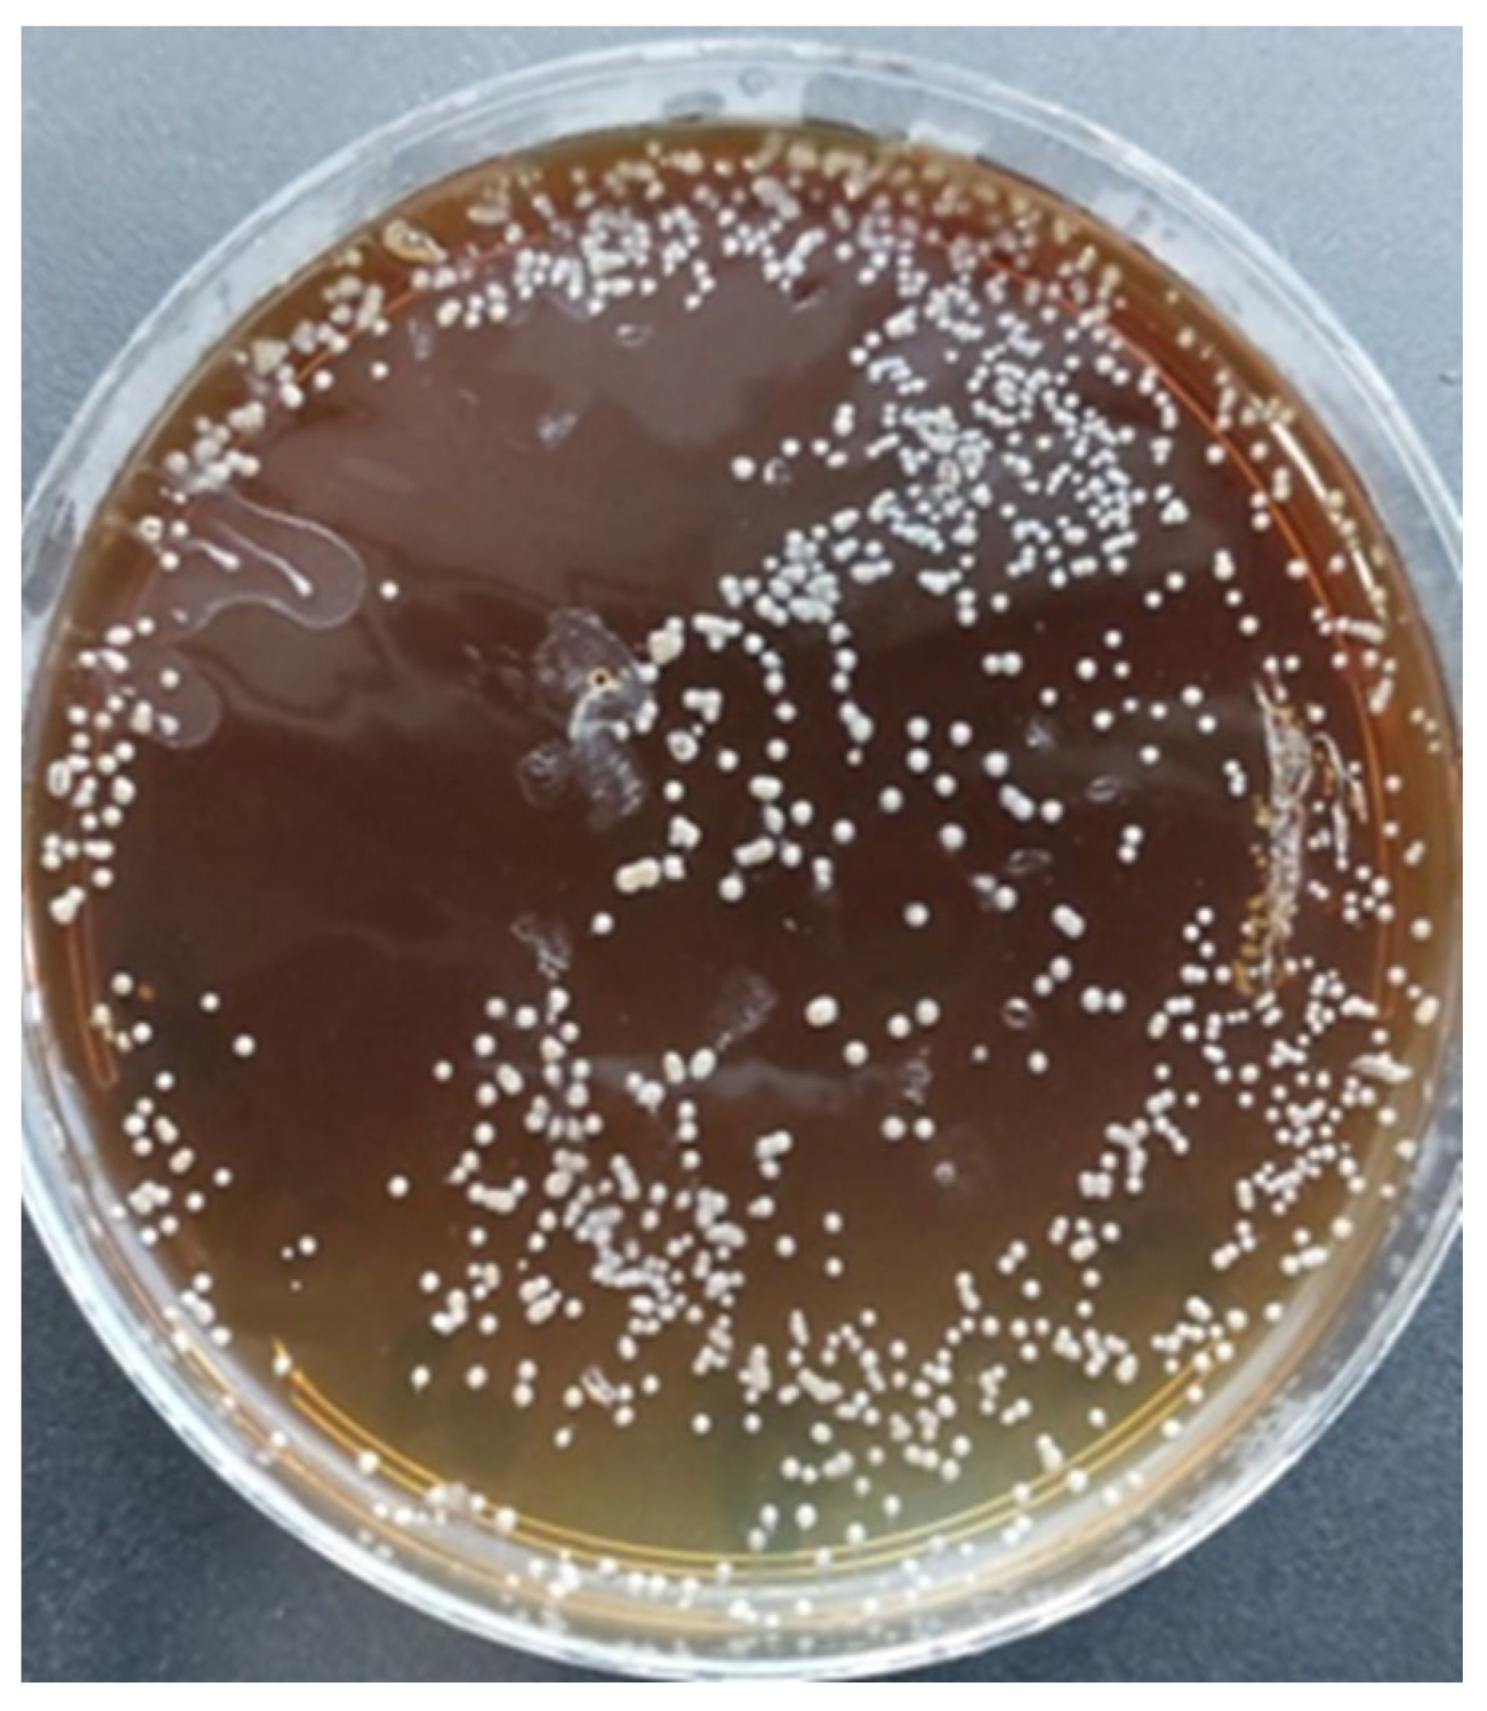
2.3. Isolation of Microbial Flora by Culture-Dependent Microbiological Analysis
2.4. Bacterial Identification by MALDI-TOF Mass Spectrometry
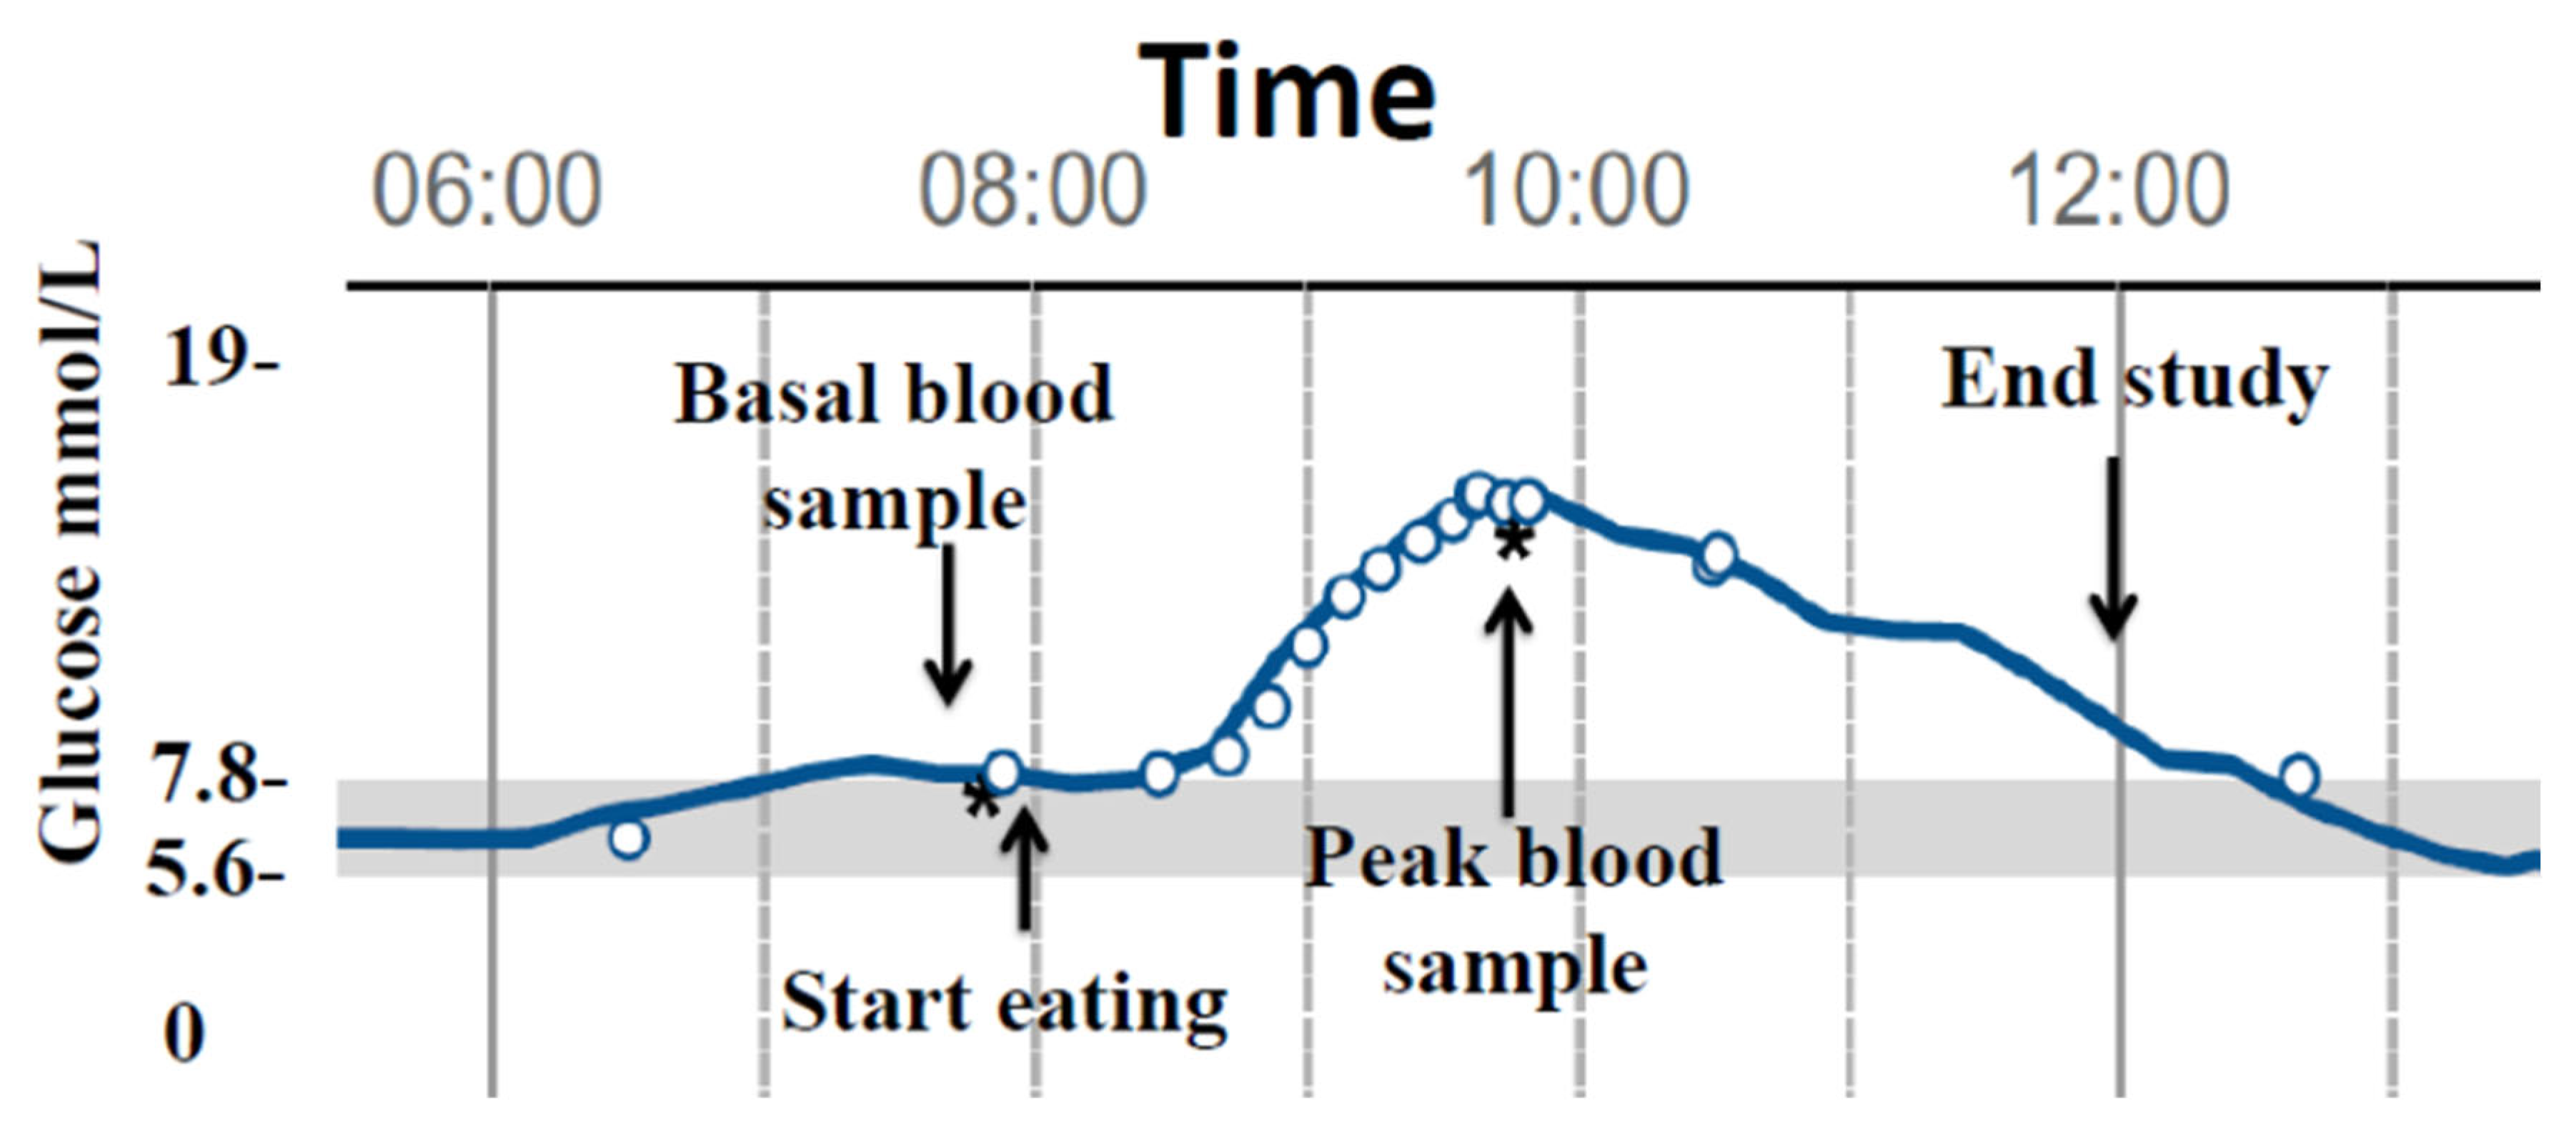
2.5. Glucose and Insulin Determinations during the Study
2.6. Statistical Analysis
3. Results
3.1. Bread Characterisation
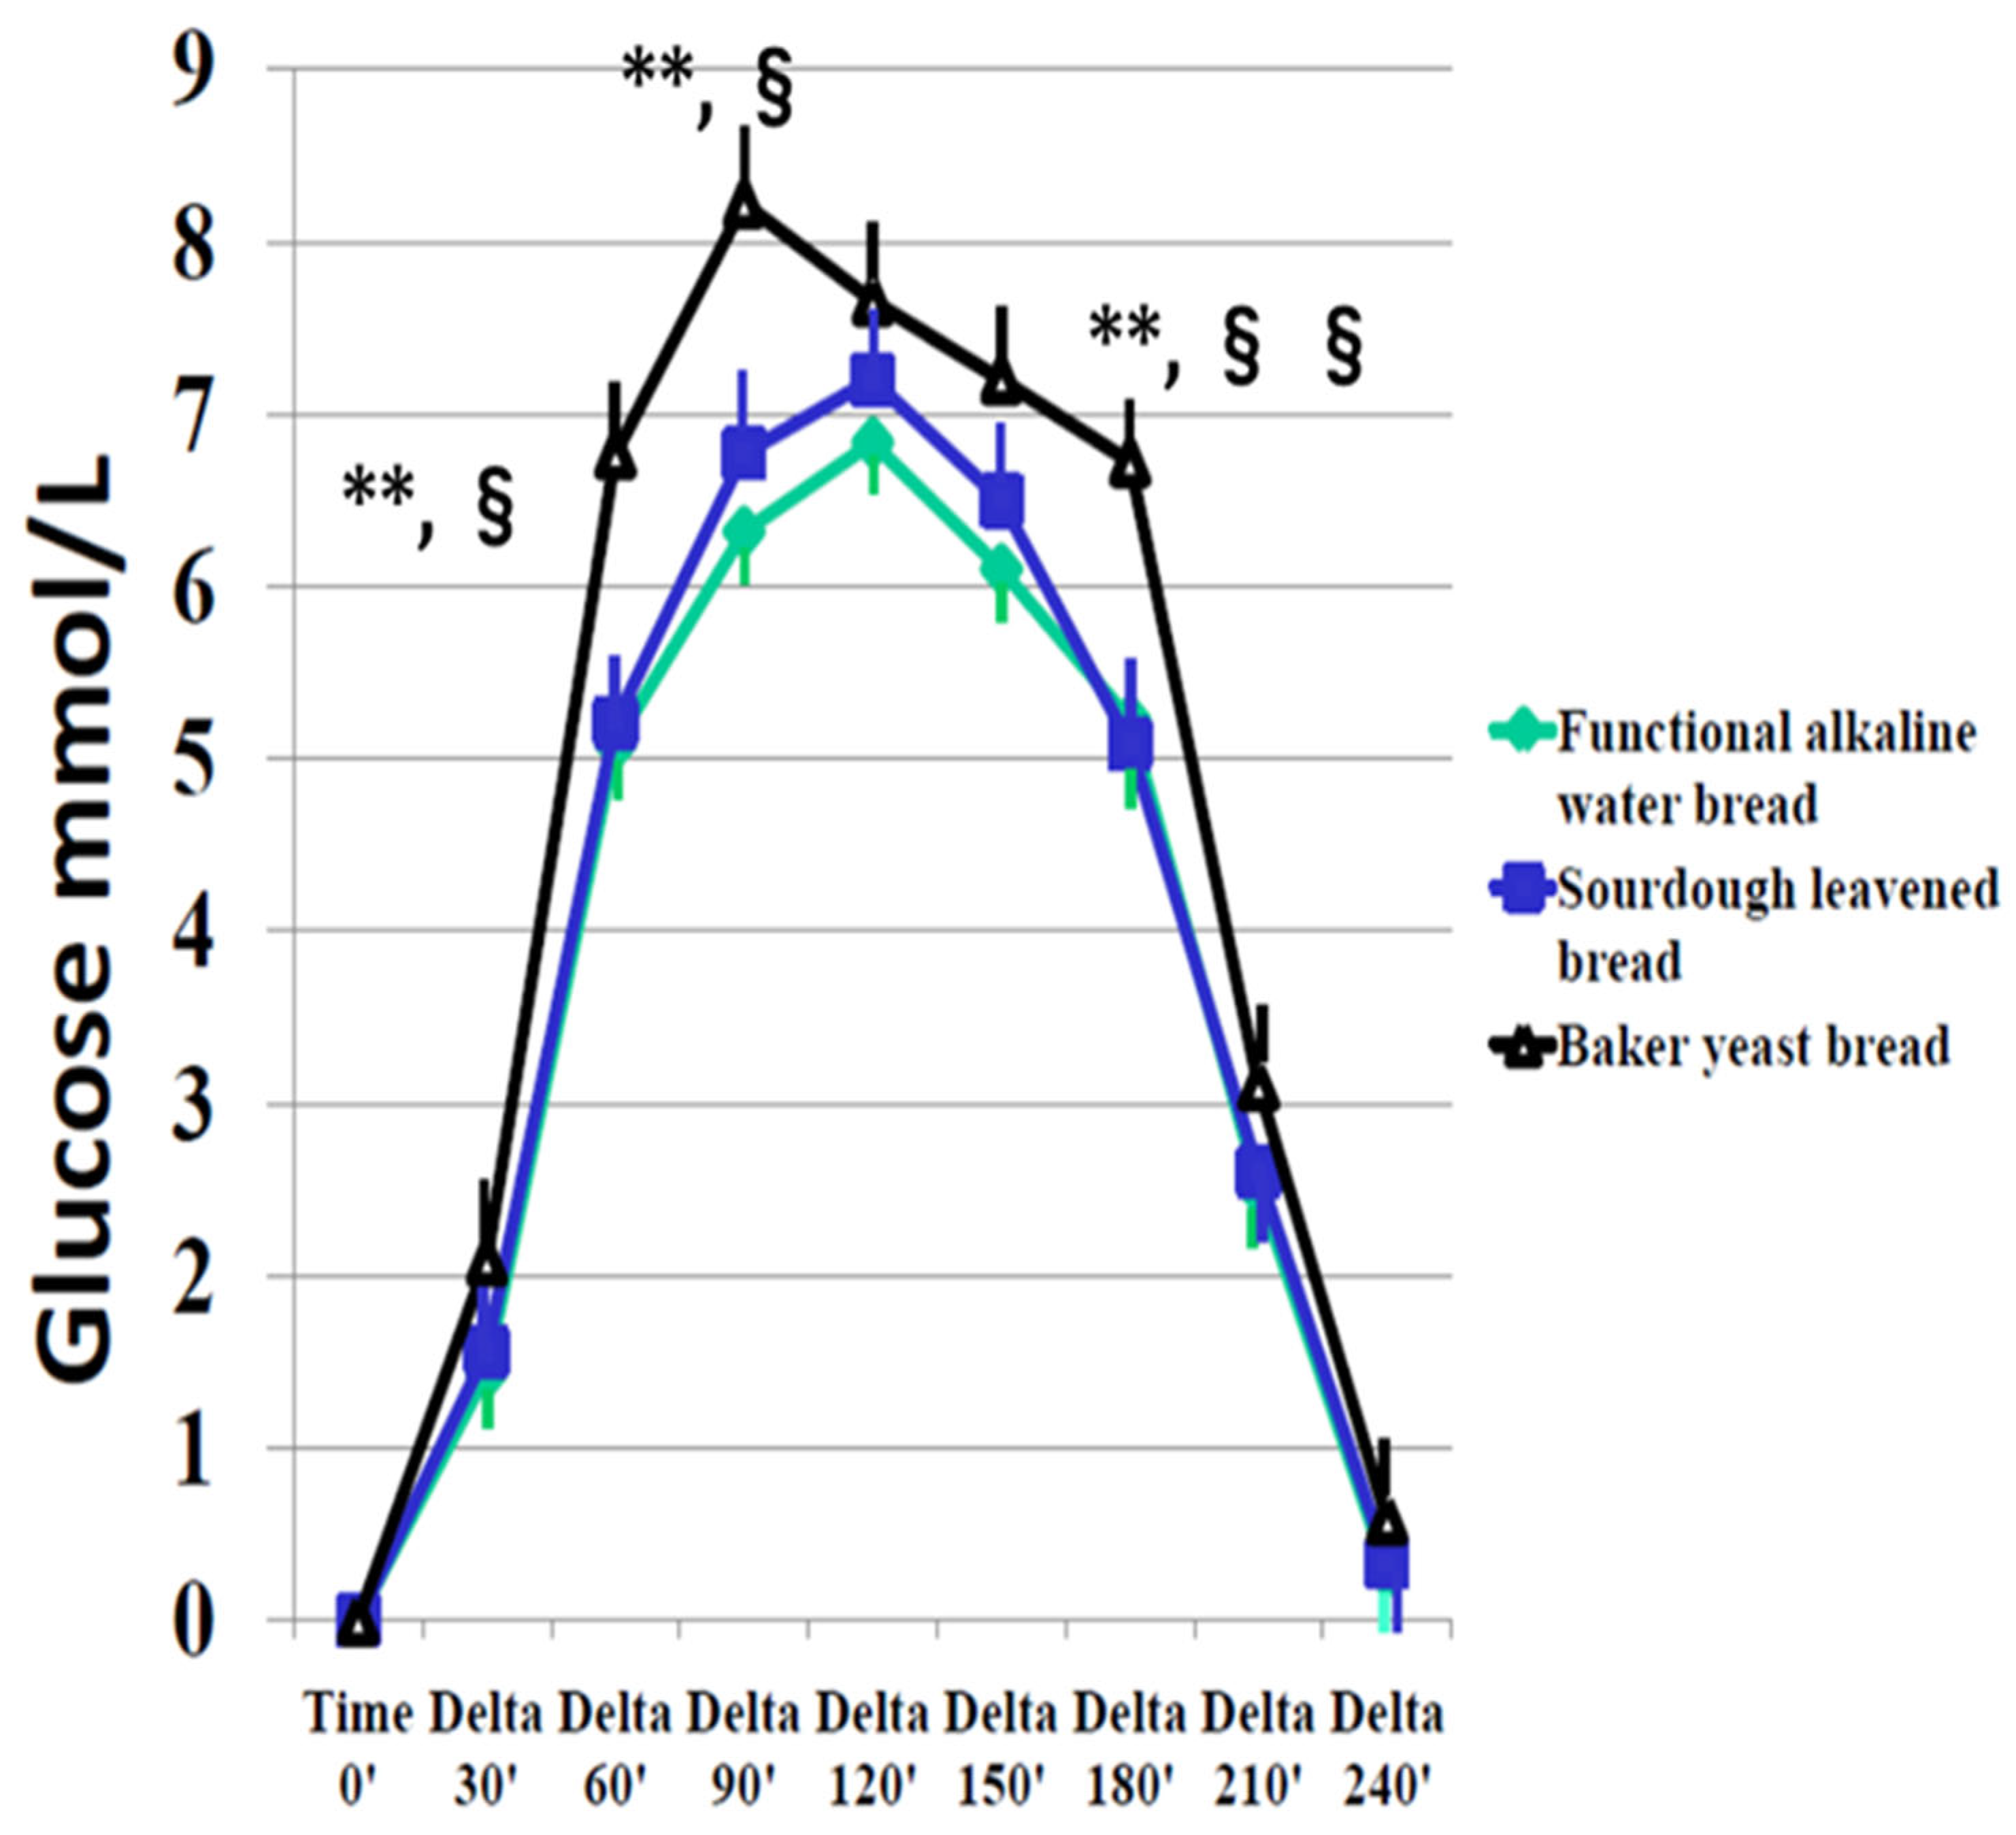
3.2. Effect of the Different Bread Doughs on Interstitial Glucose, Capillary Blood Glucose, and Serum Insulin
4. Discussion
5. Conclusions
- (1)
- Bread prepared with biocrystal water has the same low glycemic load of sourdough bread compared to traditional bread, and it enables the easier management of the leavening/maturation period.
- (2)
- FGM is a reliable method to determine the area under the curve during glycemic changes in response to a carbohydrate meal in persons with type 2 diabetes.
Author Contributions
Funding
Institutional Review Board Statement
Informed Consent Statement
Data Availability Statement
Acknowledgments
Conflicts of Interest
Appendix A

| Patient | SEX | Test Day 1 | Test Day 2 | Test Day 3 |
|---|---|---|---|---|
| 1 | M | X | Y | W |
| 2 | F | X | Y | W |
| 3 | M | X | Y | W |
| 4 | F | W | X | Y |
| 5 | M | W | X | Y |
| 6 | M | W | X | Y |
| 7 | F | Y | W | X |
| 8 | M | Y | W | X |
| 9 | M | Y | W | X |
| 10 | F | W | Y | X |
| 11 | F | Y | X | Y |
| 12 | F | X | W | W |


| Bread | Smell | Taste | Consistency | Acceptance |
|---|---|---|---|---|
| Functional alkaline water bread | 3.9 ± 1.1 | 4.1 ± 1.1 | 4.4 ± 0.9 | 4.6 ± 0.5 |
| Sourdough-leavened bread | 4.7 ± 0.4 * | 4.7 ± 0.4 | 4.7 ± 0.7 | 4.8 ± 0.3 |
| Bakery yeast bread | 4.2 ± 1.2 | 4.3 ± 1.0 | 4.6 ± 0.7 | 4.7 ± 0.5 |
References
- Jenkins, D.J.; Wolever, T.M.; Taylor, R.H.; Barker, H.; Fielden, H.; Baldwin, J.M.; Bowling, A.C.; Newman, H.C.; Jenkins, A.L.; Goff, D.V. Glycemic index of foods: A physiological basis for carbohydrate exchange. Am. J. Clin. Nutr. 1981, 34, 362–366. [Google Scholar] [CrossRef] [PubMed]
- Wolever, T.M.S.; Jenkins, D. The use of the glycemic index in predicting the blood glucose response to mixed meals. Am. J. Clin. Nutr. 1986, 43, 167–172. [Google Scholar] [CrossRef] [PubMed]
- Coutinho, M.; Gerstein, H.C.; Wang, Y.; Yusuf, S. Relationship between glucose and incident cardiovascular events. A metaregression analysis of published data from 20 studies of 95,783 individuals followed for 12.4 years. Diabetes Care 1999, 22, 233–240. [Google Scholar] [CrossRef] [PubMed]
- Levitan, E.B.; Song, Y.; Ford, E.S.; Liu, S. Is non diabetic hyperglycemia a risk factor for cardiovascular disease? A meta-analysis of prospective studies. Arch. Intern. Med. 2004, 164, 2147–2155. [Google Scholar] [CrossRef] [PubMed]
- Glucose tolerance and mortality: Comparison of WHO and American Diabetes Association diagnostic criteria. The DECODE study group.European Diabetes Epidemiology Group, Glucose tolerance and mortality: Comparison of WHO and American Diabetes Association diagnostic criteria. Diabetes Epidemiology: Collaborative analysis of Diagnostic criteria in Europe. Lancet 1999, 354, 617–621. [Google Scholar] [CrossRef]
- Vega-López, S.; Mayol-Kreiser, S.N. Use of the glycemic index for weight loss and glycemic control: A review of recent evidence. Curr. Diabetes Rep. 2009, 9, 379–388. [Google Scholar] [CrossRef]
- Zelenskiy, S.; Thompson, C.L.; Tucker, T.C.; Li, L. High dietary glycemic load is associated with increased risk of colon cancer. Nutr. Cancer 2014, 66, 362–368. [Google Scholar] [CrossRef]
- Parker, A.; Kim, Y. The Effect of Low Glycemic Index and Glycemic Load Diets on Hepatic Fat Mass, Insulin Resistance, and Blood Lipid Panels in Individuals with Nonalcoholic Fatty Liver Disease. Metab. Syndr. Relat. Disord. 2019, 17, 389–396. [Google Scholar] [CrossRef]
- Schwingshackl, L.; Hoffmann, G. Long-term effects of low glycemic index/load vs. high glycemic index/load diets on parameters of obesity and obesity-associated risks: A systematic review and meta-analysis. Nutr. Metab. Cardiovasc. Dis. 2013, 23, 699–706. [Google Scholar] [CrossRef]
- Capurso, A.; Capurso, C. The Mediterranean way: Why elderly people should eat wholewheat sourdough bread—A little known component of the Mediterranean diet and healthy food for elderly adults. Aging Clin. Exp. Res. 2020, 32, 1–5. [Google Scholar] [CrossRef]
- Sterr, Y.; Weiss, A.; Schmidt, H. Evaluation of lactic acid bacteria for sourdough fermentation of amaranth. Int. J. Food Microbiol. 2009, 136, 75–82. [Google Scholar] [CrossRef] [PubMed]
- Montemurro, M.; Coda, R.; Rizzello, C.G. Recent Advances in the Use of Sourdough Biotechnology in Pasta Making. Foods 2019, 8, 129. [Google Scholar] [CrossRef] [PubMed]
- Daugirdas, J.T. Potential importance of low-sodium bread and breakfast cereal to a reduced sodium diet. J. Ren. Nutr. 2013, 23, 1–3. [Google Scholar] [CrossRef] [PubMed]
- Cappon, G.; Vettoretti, M.; Sparacino, G.; Facchinetti, A. Continuous Glucose Monitoring Sensors for Diabetes Management: A Review of Technologies and Applications. Diabetes Metab. J. 2019, 43, 383–397. [Google Scholar] [CrossRef] [PubMed]
- Bailey, T.; Bode, B.W.; Christiansen, M.P.; Klaff, L.J.; Alva, S. The performance and usability of a factory-calibrated flash glucose monitoring system. Diabetes Technol. Ther. 2015, 17, 787–794. [Google Scholar] [CrossRef] [PubMed]
- Giani, E.; Macedoni, M.; Barilli, A.; Petitti, A.; Mameli, C.; Bosetti, A.; Cristiano, A.; Radovanovic, D.; Santus, P.; Zuccotti, G.V. Performance of the flash glucose monitoring system during exercise in youth with type 1 diabetes. Diabetes Res. Clin. Pract. 2018, 146, 321–329. [Google Scholar] [CrossRef] [PubMed]
- Blum, A. Freestyle Libre glucose monitoring system. Clin. Diabetes 2018, 36, 203–204. [Google Scholar] [CrossRef]
- Hayek, A.A.; Al Dawish, M.A. The Potential Impact of the FreeStyle Libre Flash Glucose Monitoring System on Mental Well-Being and Treatment satisfaction in patients with type 1 diabetes: A prospective study. Diabetes Ther. 2019, 10, 1239–1248. [Google Scholar] [CrossRef]
- Ji, L.; Guo, X.; Guo, L.; Ren, Q.; Yu, N.; Zhang, J. A multicenter evaluation of the performance and usability of a novel glucose monitoring system in Chinese adults with diabetes. J. Diabetes Sci. Technol. 2017, 11, 290–295. [Google Scholar] [CrossRef]
- Ang, E.; Lee, Z.X.; Moore, S.; Nana, M. Flash glucose monitoring [FGM]: A clinical review on glycaemic outcomes and impact on quality of life. J. Diabetes Its Complicat. 2020, 34, 107559. [Google Scholar] [CrossRef]
- Lévesque, S.; Dufresne, P.J.; Soualhine, H.; Domingo, M.-C.; Bekal, S.; Lefebvre, B.; Tremblay, C. A side by side comparison of Bruker Biotyper and VITEK MS: Utility of MALDI-TOF MS technology for microorganism identification in a public health reference laboratory. PLoS ONE 2015, 10, e0144878. [Google Scholar] [CrossRef] [PubMed]
- Westblade, L.F.; Jennemann, R.; Branda, J.A.; Bythrow, M.; Ferraro, M.J.; Garner, O.B.; Ginocchio, C.C.; Lewinski, M.A.; Manji, R.; Mochon, A.B.; et al. Multicenter study evaluating the Vitek MS system for identification of medically important yeasts. J. Clin. Microbiol. 2013, 51, 2267–2272. [Google Scholar] [CrossRef] [PubMed]
- Ghaith, D.; Zafer, M.M.; Hosny, T.; AbdElfattah, M. MALDI-TOF MS Overcomes Misidentification of the Uncommon Human Pathogen Candida famata by Routine Phenotypic Identification Methods. Curr. Microbiol. 2021, 78, 1636–1642. [Google Scholar] [CrossRef] [PubMed]
- Yari, Z.; Behrouz, V.; Zand, H.; Pourvali, K. New Insight into Diabetes Management: From Glycemic Index to Dietary Insulin Index. Curr. Diabetes Rev. 2020, 16, 293–300. [Google Scholar] [CrossRef]
- Matthews, D.R.; Hosker, J.P.; Rudenski, A.S.; Naylor, B.A.; Treacher, D.F.; Turner, R.C. Homeostasis model assessment: Insulin resistance and beta-cell function from fasting plasma glucose and insulin concentrations in man. Diabetologia 1985, 28, 412–419. [Google Scholar] [CrossRef] [PubMed]
- Liu, S.; Willett, W.C.; Stampfer, M.J.; Hu, F.B.; Franz, M.; Sampson, L.; Hennekens, C.H.; Manson, J.E. A prospective study of dietary glycemic load, carbohydrate intake and risk of coronary heart disease in US women. Am. J. Clin. Nutr. 2000, 71, 1455–1461. [Google Scholar] [CrossRef] [PubMed]
- Frost, G.; Leeds, A.A.; Dore, C.J.; Madeiros, S.; Brading, S.; Dornhorst, A. Glycaemic index as a determinant of serum HDL-cholesterol concentration. Lancet 1999, 353, 1045–1048. [Google Scholar] [CrossRef]
- Salmerón, J.; Ascherio, A.; Rimm, E.B.; A Colditz, G.; Spiegelman, D.; Jenkins, D.J.; Stampfer, M.J.; Wing, A.L.; Willett, W.C. Dietary fiber, glycemic load, and risk of NIDDM in men. Diabetes Care 1997, 20, 545–550. [Google Scholar] [CrossRef]
- Salmerón, J.; Manson, J.E.; Stampfer, M.J.; Colditz, G.A.; Wing, A.L.; Willett, W.C. Dietary fiber, glycemic load and risk of non-insulin dependent diabetes mellitus in women. JAMA 1997, 277, 472–477. [Google Scholar] [CrossRef]
- Augustin, L.S.A.; Dal Maso, L.; La Vecchia, C.; Parpinel, M.; Negri, E.; Vaccarella, S.; Kendall, C.W.C.; Jenkins, D.J.A.; Franceschi, S. Dietary glycemic index and glycemic load, and breast cancer risk: A case-control study. Ann. Oncol. 2001, 12, 1533–1538. [Google Scholar] [CrossRef]
- Higginbotham, S.; Zhang, Z.-F.; Lee, I.-M.; Cook, N.R.; Giovannucci, E.; Buring, J.E.; Liu, S. Women’s Health Study Dietary glycemic load and risk of colorectal cancer in the Women’s Health Study. J. Natl. Cancer Inst. 2004, 96, 229–233. [Google Scholar] [CrossRef] [PubMed]
- Foster, G.D.; Wyatt, H.R.; Hill, J.O.; McGuckin, B.G.; Brill, C.; Mohammed, B.S.; Szapary, P.O.; Rader, D.J.; Edman, J.S.; Klein, S. A randomized trial of a low-carbohydrate diet for obesity. N. Engl. J. Med. 2003, 348, 2082–2090. [Google Scholar] [CrossRef] [PubMed]
- Westman, E.C.; Yancy, W.S.; Edman, J.S.; Tomlin, K.F.; E Perkins, C. Effect of 6-Month Adherence to a Very Low Carbohydrate Diet Program. Am. J. Med. 2002, 113, 30–36. [Google Scholar] [CrossRef] [PubMed]
- Samaha, F.F.; Iqbal, N.; Seshadri, P.; Chicano, K.L.; Daily, D.A.; McGrory, J.; Williams, T.; Williams, M.; Gracely, E.J.; Stern, L. A low-carbohydrate as compared with a low-fat diet in severe obesity. N. Engl. J. Med. 2003, 348, 2074–2081. [Google Scholar] [CrossRef]
- Ebbeling, C.B.; Leidig, M.M.; Sinclair, K.B.; Hangen, J.P.; Ludwig, D.S. A reduced-glycemic load diet in the treatment of adolescent obesity. Arch. Pediatr. Adolesc. Med. 2003, 157, 773–779. [Google Scholar] [CrossRef] [PubMed]
- McMillan-Price, J.; Petocz, P.; Atkinson, F.; O’neill, K.; Samman, S.; Steinbeck, K.; Caterson, I.; Brand-Miller, J. Comparison of 4 diets of varying glycemic load on weight loss and cardiovascular risk reduction in overweight and obese young adults: A randomized controlled trial. Arch. Intern. Med. 2006, 166, 1466–1475. [Google Scholar] [CrossRef] [PubMed]
- Stern, L.; Iqbal, N.; Seshadri, P.; Chicano, K.L.; Daily, D.A.; McGrory, J.; Williams, M.; Gracely, E.J.; Samaha, F.F. The Effects of Low-Carbohydrate versus Conventional Weight Loss Diets in Severely Obese Adults: One-Year Follow-up of a Randomized Trial. Ann. Intern. Med. 2004, 140, 778–785. [Google Scholar] [CrossRef]
- Wolever, T.M.; Jenkins, D.J.; Jenkins, A.L.; Josse, R.G. The glycemic index: Methodology and clinical implications. Am. J. Clin. Nutr. 1991, 54, 846–854. [Google Scholar] [CrossRef]
- Scazzina, F.; Siebenhandl-Ehn, S.; Pellegrini, N. The effect of dietary fibre on reducing the glycaemic index of bread. Br. J. Nutr. 2013, 109, 1163–1174. [Google Scholar] [CrossRef]
- Korem, T.; Zeevi, D.; Zmora, N.; Weissbrod, O.; Bar, N.; Lotan-Pompan, M.; Avnit-Sagi, T.; Kosower, N.; Malka, G.; Rein, M.; et al. Bread Affects Clinical Parameters and Induces Gut Microbiome-Associated Personal Glycemic Responses. Cell Metab. 2017, 25, 1243–1253.e5. [Google Scholar] [CrossRef]
- Tessari, P.; Lante, A. A Multifunctional Bread Rich in Beta Glucans and Low in Starch Improves Metabolic Control in Type 2 Diabetes: A Controlled Trial. Nutrients 2017, 9, 297. [Google Scholar] [CrossRef]
- Augustin, L.S.A.; Chiavaroli, L.; Campbell, J.; Ezatagha, A.; Jenkins, A.L.; Esfahani, A.; Kendall, C.W.C. Post-prandial glucose and insulin responses of hummus alone or combined with a carbohydrate food: A dose—Response study. Nutr. J. 2016, 15, 13. [Google Scholar] [CrossRef]
- Ostman, E.M.; Elmståhl, H.G.M.L.; Björck, I.M.E. Barley Bread containing lactid acid improves glucose tolerance at a subsequent meal in healthy men and women. J. Nutr. 2002, 132, 1173–1175. [Google Scholar] [CrossRef]
- Maioli, M.; Pes, G.M.; Sanna, M.; Cherchi, S.; Dettori, M.; Manca, E.; Farris, G.A. Sourdough-leavened Bread Improves Postprandial Glucose and Insulin Plasma Levels in Subjects with Impaired Glucose Tolerance. Acta Diabetol. 2008, 45, 91–96. [Google Scholar] [CrossRef]
- Comasio, A.; Verce, M.; Van Kerrebroeck, S.; De Vuyst, L. Diverse Microbial Composition of Sourdoughs from Different Origins. Front. Microbiol. 2020, 11, 1212. [Google Scholar] [CrossRef] [PubMed]


| Age [years] | 69.9 ± 1.3 | LDL Cholesterol [mmol/L] | 2.91 ± 0.5 |
| HbA1c [mol/L %] | 49.8 ± 1.8 6.7 ± 0.25 | Total Cholesterol [mmol/L] | 4.92 ± 0.6 |
| BMI | 27.9 ± 1.2 | Triglycerides [mmol/L] | 1.42 ± 0.3 |
| Diabetes duration [years] | 10.9 ± 1.3 | HDL Cholesterol [mmol/L] | 1.44 ± 0.1 |
| Systolic blood pressure [mmHg] | 119 ± 3.1 | SGOT [nkat/L] | 415 ± 39 |
| Diastolic blood pressure [mmHg] | 75 ± 1.2 | SGPT [nkat/L] | 421 ± 49 |
| Creatinine [μmol/L] | 75.4 ± 4.1 | γGT [nkat/L] | 445 ± 69 |
| Flour [g] | Yeast [g] | Biocrystal Water [g] | Salt [g] | Extra Virgin Olive Oil [g] | Homemade Mother Yeast [g] | Tap Water [g] | Fermentation/Maturation [h] | |
|---|---|---|---|---|---|---|---|---|
| X | 1000 | 2 | 700 | 25 | 30 | 0 | 0 | 48 |
| Y | 1000 | 2 | 0 | 25 | 30 | 250 | 600 | 8 |
| W | 1000 | 2 | 0 | 25 | 30 | 0 | 700 | 4 |
| Moisture [g] | Glucose g/100 g | Fructose g/100 g | Lactic Acid g/100 g | |
|---|---|---|---|---|
| Functional alkaline water bread | 32 | 0.062 | 0.1 | <0.001 |
| Sourdough-leavened bread | 30 | 0.05 | 0.22 | 0.381 |
| Bakery yeast bread | 27 | 1.5 | 1.3 | <0.001 |
| X | Y | W | p | |
|---|---|---|---|---|
| Interstitial Glucose mmol/L | ||||
| AUC 0–240 min | 819.6 ± 72.1 | 926.0 ± 73.4 | 1016.4 ± 84.4 | **,§ |
| Time −10′ | 7.4 ± 0.5 | 7.3 ± 0.3 | 7.4 ± 0.5 | ns |
| Delta peak/basal | 7.7 ± 0.3 | 8.0 ± 0.9 | 9.4 ± 0.5 | ns |
| Capillary blood glucose mmol/L | ||||
| Time −10′ | 7.3 ± 0.4 | 7.2 ± 0.3 | 7.3 ± 0.3 | ns |
| Delta peak/basal | 7.7 ± 0.4 | 8.1 ± 0.7 | 9.3 ± 0.6 | *,^ |
| Serum insulin [μU/mL] | ||||
| Basal insulin | 9.5 ± 2.1 | 9.3 ±1.9 | 9.7 ± 1.7 | ns |
| Peak insulin | 63.5 ± 10.8 | 62.2 ± 10.5 | 85.7 ± 14.2 | *,§ |
Disclaimer/Publisher’s Note: The statements, opinions and data contained in all publications are solely those of the individual author(s) and contributor(s) and not of MDPI and/or the editor(s). MDPI and/or the editor(s) disclaim responsibility for any injury to people or property resulting from any ideas, methods, instructions or products referred to in the content. |
© 2024 by the authors. Licensee MDPI, Basel, Switzerland. This article is an open access article distributed under the terms and conditions of the Creative Commons Attribution (CC BY) license (https://creativecommons.org/licenses/by/4.0/).
Share and Cite
Taras, M.A.; Cherchi, S.; Campesi, I.; Margarita, V.; Carboni, G.; Rappelli, P.; Tonolo, G. Utility of Flash Glucose Monitoring to Determine Glucose Variation Induced by Different Doughs in Persons with Type 2 Diabetes. Diabetology 2024, 5, 129-140. https://0-doi-org.brum.beds.ac.uk/10.3390/diabetology5010010
Taras MA, Cherchi S, Campesi I, Margarita V, Carboni G, Rappelli P, Tonolo G. Utility of Flash Glucose Monitoring to Determine Glucose Variation Induced by Different Doughs in Persons with Type 2 Diabetes. Diabetology. 2024; 5(1):129-140. https://0-doi-org.brum.beds.ac.uk/10.3390/diabetology5010010
Chicago/Turabian StyleTaras, Maria Antonietta, Sara Cherchi, Ilaria Campesi, Valentina Margarita, Gavino Carboni, Paola Rappelli, and Giancarlo Tonolo. 2024. "Utility of Flash Glucose Monitoring to Determine Glucose Variation Induced by Different Doughs in Persons with Type 2 Diabetes" Diabetology 5, no. 1: 129-140. https://0-doi-org.brum.beds.ac.uk/10.3390/diabetology5010010