A NIR-Spectroscopy-Based Approach for Detection of Fluids in Rectangular Glass Micro-Capillaries †


Department of Electrical, Computer and Biomedical Engineering, University of Pavia, 27100 Pavia, Italy
*
Author to whom correspondence should be addressed.
†
Presented at the 7th Electronic Conference on Sensors and Applications, 15–30 November 2020; Available online: https://ecsa-7.sciforum.net/.
Eng. Proc. 2020, 2(1), 43; https://0-doi-org.brum.beds.ac.uk/10.3390/ecsa-7-08250
Published: 14 November 2020
(This article belongs to the Proceedings of 7th International Electronic Conference on Sensors and Applications)
Abstract
:In this work, we present a micro-opto-fluidic platform to distinguish water and alcohol samples flowing in rectangular glass micro-capillaries laid onto a bulk Aluminum mirror illuminated by the broadband radiation emitted by a Tungsten lamp. The fluid detection is based on the spectral analysis of the light reflected by the micro-structure in the near-infrared region from 1.0 μm to 1.7 μm. A theoretical model was implemented to study light propagation in the channel, taking into account absorption effects, and the results of the simulation are in good agreement with the experimental spectra obtained by testing water, ethanol, isopropanol and ethylene glycol.
1. Introduction
Capillary-based optical sensors are very diffused and exploited for a great variety of applications [1,2,3,4,5,6]. They are based on the analysis of the variations in the characteristics of light that interacts with an analyte under investigation. Among all the optical techniques, absorption spectroscopy is a very well-known method used to identify the chemical composition of a sample. Many works presented in the literature are based on complex waveguide or optrode structures that need to be custom-fabricated and usually make use of laser diodes or LEDs for single- or double-wavelength measurements [7,8,9]. Other solutions feature round-section glass capillaries [10,11,12,13]. For example, in [10,11] a photometric flow cell realized with circular glass capillaries and a reflective coating layer was exploited for absorption analyses of polluted waters. In [12], a round-section capillary with a six-port valve was exploited to measure the percentage of ethanol in a liquor by measuring absorbance at 2305 and 2636 nm. Another work [13] exploits a circular capillary as a waveguide in combination with optical fibers and an LED for fluoride detection in water samples.
Rectangular glass micro-capillaries are an interesting alternative to custom-designed microfluidic chips since they are low-cost devices, available in several formats, that do not require any complex and expensive micromachining facility. They are transparent and they can be easily inserted into micro-fluidic circuits. Furthermore, they strongly reduce the light scattering that arises when using round-section capillaries. In previous works, we exploited rectangular glass micro-capillaries with channel depths of the order of few tenths of a nanometer to measure the real part of the refractive index (RI) of liquids and its variations with respect to a reference sample, either by exploiting the detection of the spectral resonances of these devices, which can be seen as optical resonators [14,15,16], or by inserting them into a Michelson scheme and performing interferometric measurements [17,18]. However, these kinds of analyses are non-specific since the same RI change can be produced by different substances present in the solution. Hence, in this work, we propose a simple optical setup for the identification of liquids based on their spectroscopic properties in the near-infrared (NIR) region. The fluids flow through a rectangular glass micro-capillary laid on an Aluminum mirror. Infrared broadband light in the range 1.0–1.7 µm is shone onto the structure and crosses the micro-channel twice; transmitted radiation is collected and analyzed by an optical spectrum analyzer. All the measurements are label-free, remote, non-contact and non-invasive. A detailed theoretical model was implemented to analyze light propagation through the structure and to study the absorption effects due to the presence of liquid samples. In this work, we exploited the micro-opto-fluidic platform to distinguish water and different types of alcohol. In a previous work [19], water–ethanol mixtures were analyzed using photonic crystals. Here, experimental testing was carried out by flowing deionized water, ethanol, isopropanol and ethylene glycol in the micro-capillary. The experimental results are in good agreement with the theoretical ones. Finally, the spectral power obtained for ethylene glycol using the proposed setup is compared with a preliminary result obtained by testing the same substance with an optical setup, including a micro-capillary that has been modified to get a longer light path inside the channel.
2. Optical Setup
Rectangular glass micro-capillaries in borosilicate glass (Vitrotubes™, Part#2540, Vitrocom, NJ, USA) are inserted in the optical setup used to test liquid samples, as shown in Figure 1. They have nominal wall thicknesses tf = tb = 280 μm, as well as nominal channel depth d = 400 μm, width w = 4 mm and length L = 5 mm. The capillary is laid horizontally on its flat side on a 3.2-mm-thick Al-coated mirror (ME1S-G01 Thorlabs, NJ, USA) and its extremities are inserted in heat-shrink tubes with Luer connections to fill and drain the channel with a syringe. The volume of sample required in the measurement area is of the order of 18 µL. Light from a tungsten lamp is coupled with a multimode fiber (Thorlabs, NJ, USA) and shone on the devices under investigation using an FC/PC lens (F230FC-C, Thorlabs, NJ, USA) located at an angle of approximately 14° with respect to the normal angle of the flat capillary surface. After bouncing once on the mirror and crossing the channel containing the sample twice, the output light is collected by another lens identical to the input one. Light is finally directed towards an optical spectrum analyzer (OSA Agilent 86142B, CA, USA) connected to a computer for data acquisition. The acquired spectral data are processed in a MATLAB® environment.
3. Theoretical Model
A detailed theoretical model was developed to study light propagation in the micro-capillary, considering its layered structure constituted by the two glass walls and the inner channel inserted between two infinite media (air and the Aluminum mirror) (Figure 2). RIs of air and glass are considered to be purely real, while, for the fluid sample, the imaginary part of the RI is also considered in order to take into account absorption effects. A light beam is shone on to the surface capillary at an angle of 14°. Every time it reaches an interface between different media, light is deflected according to the Snell law and it is partially transmitted. The transmission coefficients for the field at each interface tij (the subscripts i and j indicate the origin and destination layer, respectively) can be calculated by applying the Fresnel formula and the transmission coefficient for the power is retrieved as:
where ni and nj are the RIs of the origin and destination medium, respectively, and θi and θj are the incidence and transmission angle, respectively. When the light reaches the mirror, it undergoes a specular reflection with a power coefficient Rmirror ≈ 0.99. The attenuation due to the sample absorption is calculated by applying the Beer–Lambert law:
Tij = (nj∙cosθj)/(ni∙cosθi)∙|tij|2,
Tabs = e–α(λ)∙x
x is the total light path in the channel and α(λ) is the attenuation coefficient as a function of the wavelength λ given by
where k is the imaginary part of the fluid RI and its profile as a function of the wavelength is a characteristic “fingerprint” of each molecule. Values of k as a function of the wavelength for the fluids under investigation are reported in the literature [20,21]. Eventually, the spectral light transmission Tsample(λ) through the capillary filled with the sample is obtained as
α(λ) = 4∙π∙k(λ)/λ,
Tsample(λ) = T12∙T23∙T34∙Rmirror∙T43∙T32∙T21∙Tabs,
The same calculation also has to be computed when the micro-channel is empty, that is, filled with air. In this case, the transmission through the empty capillary is
Tair(λ) = T12∙T23∙T34∙Rmirror∙T43∙T32∙T21
Then, we identified the spectral response SR(λ) as an interesting parameter to compare the analytical results with the experimental ones:
SR(λ) = Tsample(λ)/Tair(λ).
4. Results and Discussion
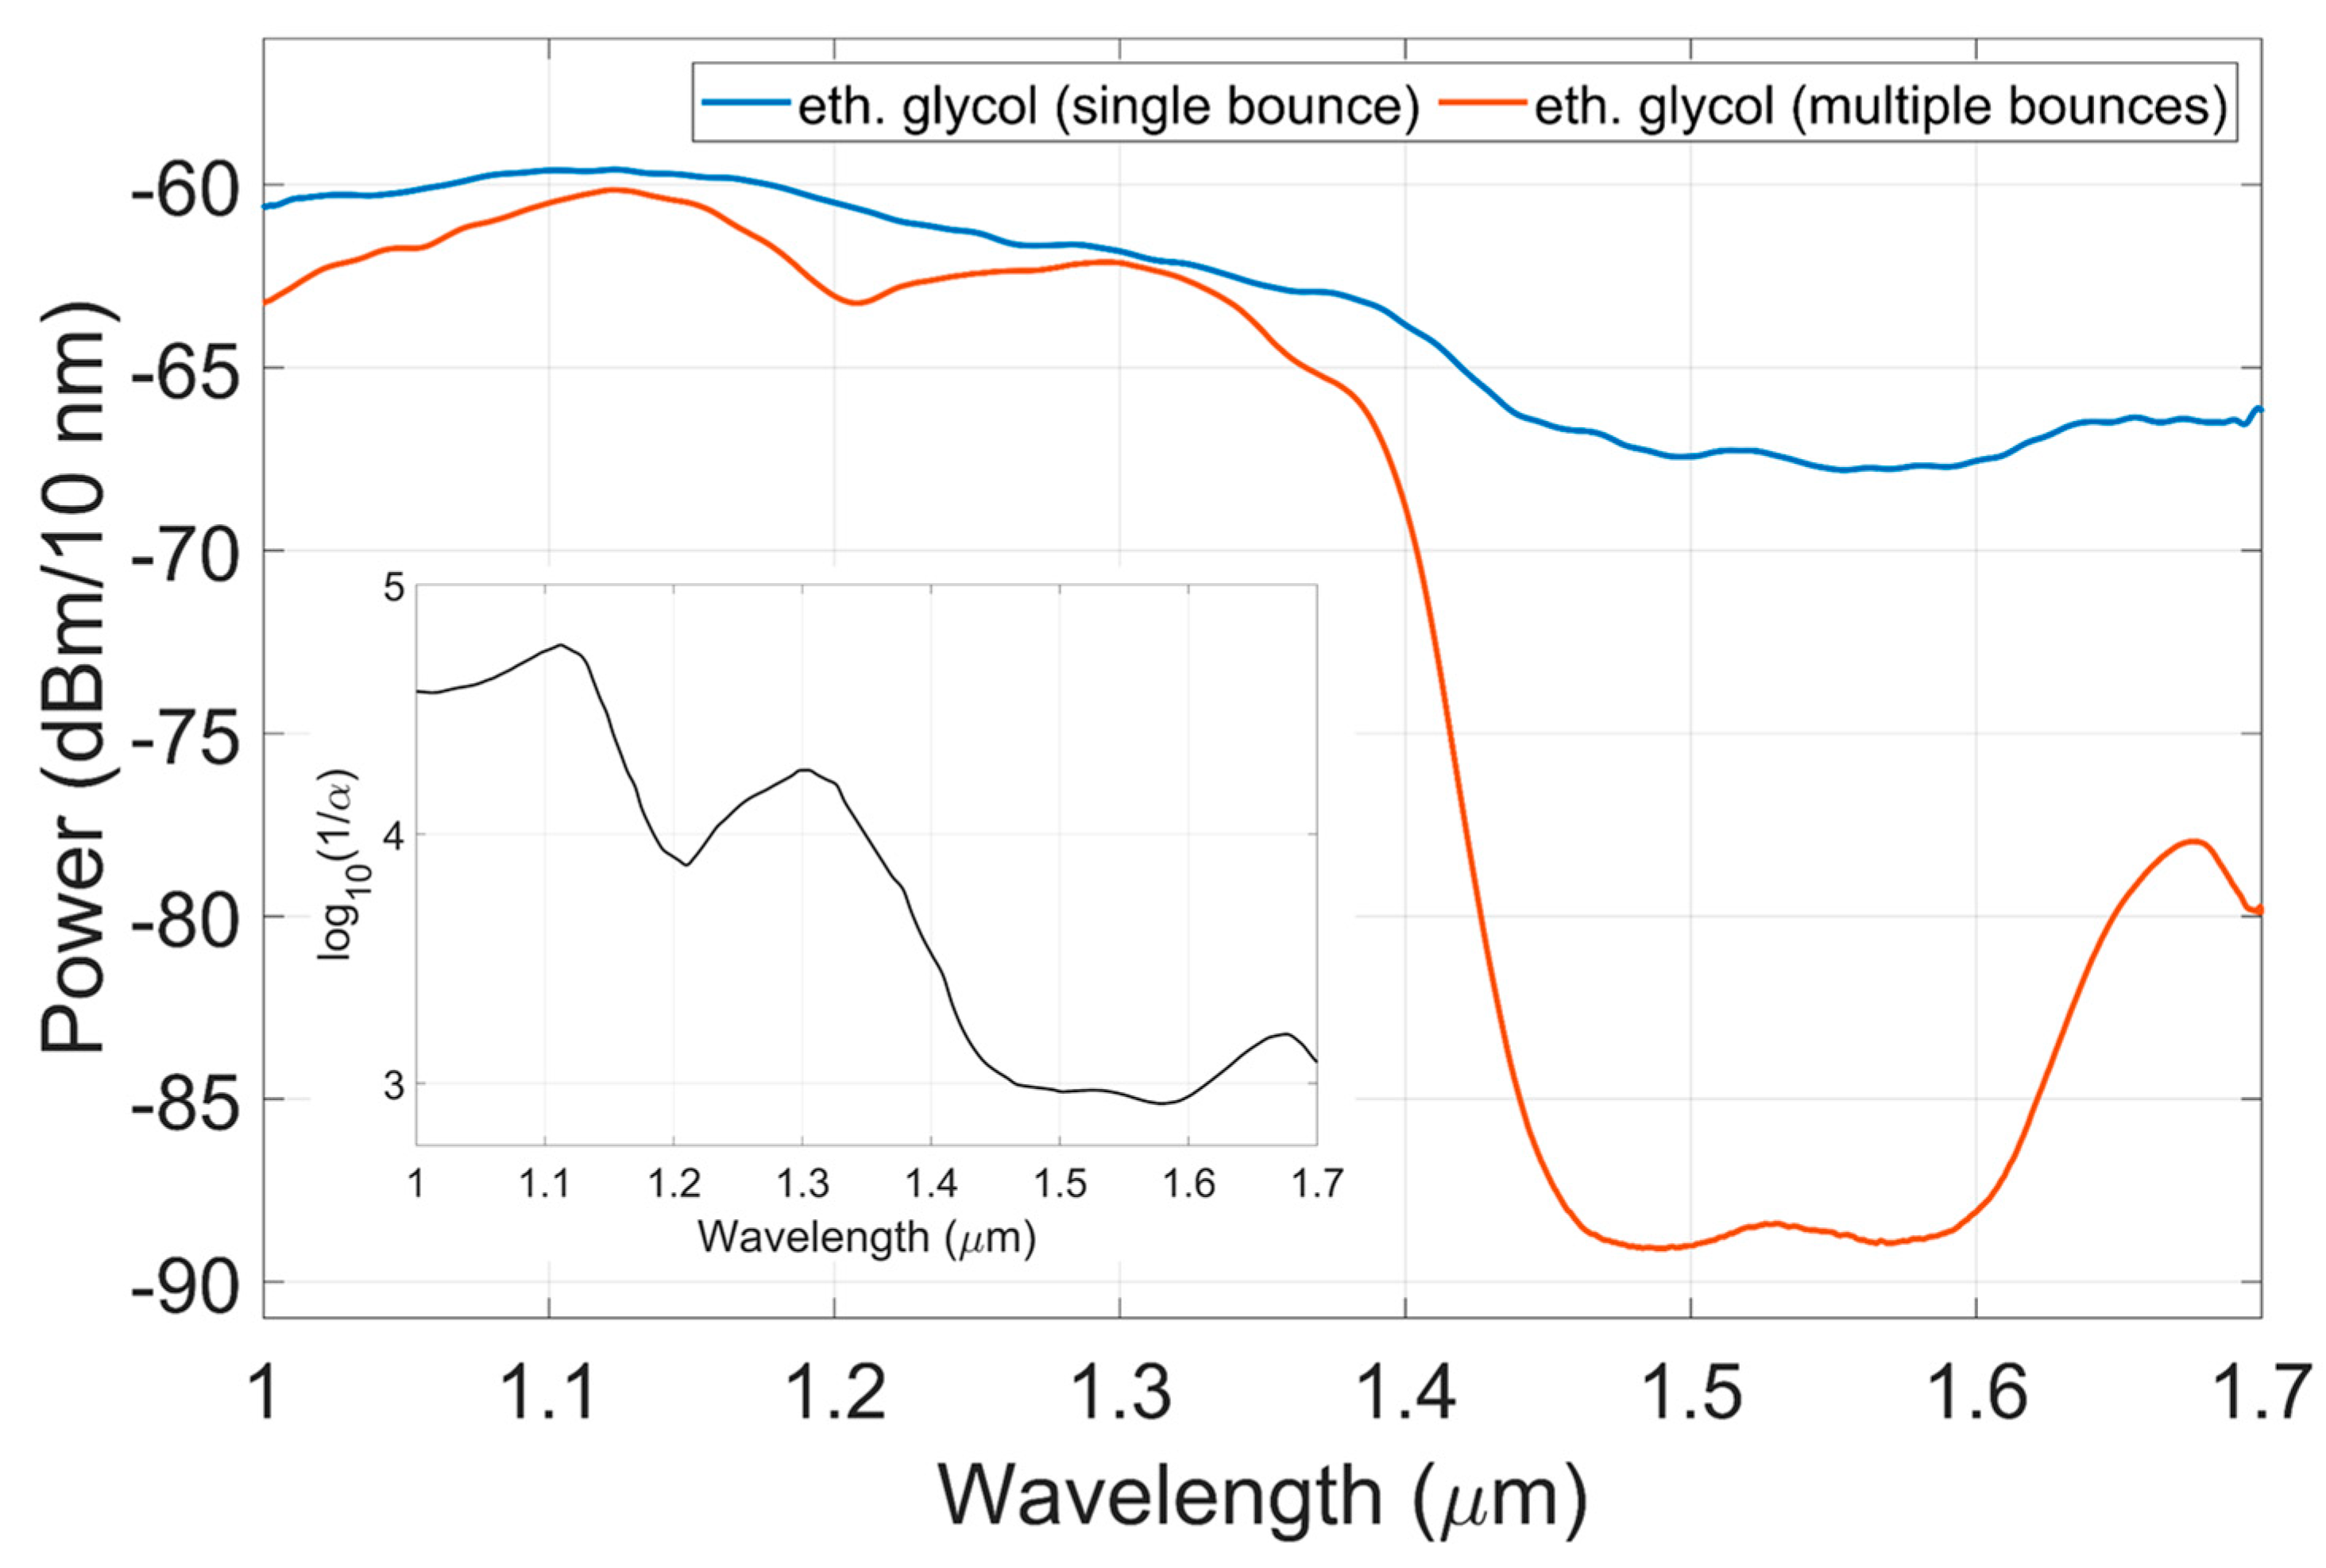
Experiments were carried out by flowing water, ethanol, isopropanol and ethylene glycol into the capillary channel. Experimental results were compared with the theoretical predictions obtained by the implementation of the model in a MATLAB® environment. Figure 3 shows the theoretical spectral responses for water (black dotted trace), ethanol (red dotted trace), isopropanol (blue dotted trace) and ethylene glycol (blue dotted trace) in comparison with the experimental ones (black solid trace: water; red solid trace: ethanol; blue solid trace: isopropanol; green solid trace: ethylene glycol). The different absorption profiles allow to clearly distinguish the four substances. The level of agreement between experimental spectra and predictions is very good: residual discrepancies are due to wavelength-dependent losses that change when the capillary is empty or filled with the sample and are not taken into account in the simulations. Moreover, the theoretical responses are computed considering the nominal values for the capillary channel and walls, while actual dimensions could be different due to manufacturing tolerances. Ethylene glycol was first tested with the micro-capillary configuration presented in Section 2; then, the measurement was repeated using a capillary modified in order to extend the path length travelled by the light in the channel. The comparison between the power spectra obtained in the two configurations is reported in Figure 4. The spectrum obtained with a longer path (orange trace) allows us to reconstruct the absorption profile of the ethylene glycol with a greater level of detail with respect to the spectrum obtained in the single-bounce scheme (blue trace). Indeed, observing the orange trace, the spectral minima located at 1.2 μm, 1.48 μm and 1.57 μm that correspond to the absorption peaks of ethylene glycol (inset of Figure 4) are clearly detectable.
In conclusion, we presented a micro-opto-fluidic platform for the identification of fluids, exploiting their spectroscopic properties in the NIR region, and we successfully exploited it to distinguish water from alcohols. The experimental results are in agreement with our theoretical predictions. Moreover, we demonstrated that, by extending the length of the path that light travels in the channel, it is possible to reconstruct absorption features with a higher level of detail. Future work will be devoted to the realization of a more compact setup including a metallization coating, a laser diode and a photodetector instead of the bulky mirror, lamp and spectrum analyzer, respectively.
Author Contributions
Conceptualization, V.B.; methodology, V.B.; software, V.B. and E.B.; validation, V.B.; formal analysis, V.B.; investigation, V.B.; data curation, V.B. and E.B.; writing—original draft preparation, V.B.; writing—review and editing, V.B. and E.B.; visualization, V.B. and E.B.; supervision, V.B. All authors have read and agreed to the published version of the manuscript.
Acknowledgments
The authors express their gratitude to Sabina Merlo of the Department of Electrical, Computer and Biomedical Engineering of the University of Pavia for her guidance and fruitful suggestions.
Conflicts of Interest
The authors declare no conflict of interest.
References
- Weigl, B.H.; Wolfbeis, O. Capillary Optical Sensors. Anal. Chem. 1994, 66, 3323–3327. [Google Scholar] [CrossRef]
- Weigl, B.H.; Draxler, S.; Kieslinger, D.; Lehmann, H.; Trettnak, W.; Wolfbeis, O.S.; Lippitsch, M.E. Optical sensor instrumentation using absorption- and fluorescence-based capillary waveguide optrodes. Proc. SPIE 1995, 2508, 199–209. [Google Scholar]
- Lippitsch, M.E.; Draxler, S.; Kieslinger, D.; Lehmann, H.; Weigl, B.H. Capillary waveguide optrodes: An approach to optical sensing in medical diagnostics. Appl. Opt. 1996, 35, 3426. [Google Scholar] [CrossRef] [PubMed]
- Wolfbeis, O.S. Capillary waveguide sensors. TrAC Trends Anal. Chem. 1996, 15, 225–232. [Google Scholar] [CrossRef]
- Borecki, M.; Korwin-Pawlowski, M.L.; Beblowska, M.; Szmidt, J.; Jakubowski, A. Optoelectronic Capillary Sensors in Microfluidic and Point-of-Care Instrumentation. Sensors 2010, 10, 3771–3797. [Google Scholar] [CrossRef] [PubMed]
- Páscoa, R.N.M.J.; Tóth, I.V.; Rangel, A.O.S.S. Review on recent applications of the liquid waveguide capillary cell in flow based analysis techniques to enhance the sensitivity of spectroscopic detection methods. Anal. Chim. Acta 2012, 739, 1–13. [Google Scholar] [CrossRef] [PubMed]
- Puyol, M.; Del Valle, M.; Garcés, I.; Villuendas, F.; Domínguez, C.; Alonso, J. Integrated waveguide absorbance optode for chemical sensing. Anal. Chem. 1999, 71, 5037–5044. [Google Scholar] [CrossRef]
- Jiang, L.; Pau, S. Integrated waveguide with a microfluidic channel in spiral geometry for spectroscopic applications. Appl. Phys. Lett. 2007, 90, 111108. [Google Scholar] [CrossRef]
- Kakuta, N.; Yamashita, H.; Kawashima, D.; Kondo, K.; Arimoto, H.; Yamada, Y. Simultaneous imaging of temperature and concentration of ethanol-water mixtures in microchannel using near-infrared dual-wavelength absorption technique. Meas. Sci. Technol. 2016, 27, 115401. [Google Scholar] [CrossRef]
- Ellis, P.S.; Lyddy-Meaney, A.J.; Worsfold, P.J.; McKelvie, I.D. Multi-reflection photometric flow cell for use in flow injection analysis of estuarine waters. Anal. Chim. Acta 2003, 499, 81–89. [Google Scholar] [CrossRef]
- Ellis, P.S.; Gentle, B.S.; Grace, M.R.; McKelvie, I.D. A versatile total internal reflection photometric detection cell for flow analysis. Talanta 2009, 79, 830–835. [Google Scholar] [CrossRef] [PubMed]
- Tipparat, P.; Lapanantnoppakhun, S.; Jakmunee, J.; Grudpan, K. Determination of ethanol in liquor by near-infrared spectrophotometry with flow injection. Talanta 2001, 53, 1199–1204. [Google Scholar] [CrossRef]
- Xiong, Y.; Wang, C.; Tao, T.; Duan, M.; Tan, J.; Wu, J.; Wang, D. Fabrication of a miniaturized capillary waveguide integrated fiber-optic sensor for fluoride determination. Analyst 2016, 141, 3041–3049. [Google Scholar] [CrossRef] [PubMed]
- Carpignano, F.; Rigamonti, G.; Migliazza, T.; Merlo, S. Refractive Index Sensing in Rectangular Glass Micro-Capillaries by Spectral Reflectivity Measurements. IEEE J. Sel. Top. Quantum Electron. 2016, 22, 383–391. [Google Scholar] [CrossRef]
- Rigamonti, G.; Guardamagna, M.; Bello, V.; Marconi, S.; Auricchio, F.; Merlo, S. Flow-through micro-capillary refractive index sensor based on T/R spectral shift monitoring. Biomed. Opt. Express 2017, 8, 4438. [Google Scholar] [CrossRef] [PubMed]
- Rigamonti, G.; Bello, V.; Merlo, S. Spectral Optical Readout of Rectangular–Miniature Hollow Glass Tubing for Refractive Index Sensing. Sensors 2018, 18, 603. [Google Scholar] [CrossRef] [PubMed]
- Bello, V.; Merlo, S. Phase detection of the NIR optical resonances of rectangular glass micro-capillaries. In Proceedings of the 2020 IEEE International Instrumentation & Measurement Technology Conference, Dubrovnik, Croatia, May 25–28 May 2020; pp. 1–5. [Google Scholar]
- Bello, V.; Simoni, A.; Merlo, S. Spectral Phase Shift Interferometry for Refractive Index Monitoring in Micro-Capillaries. Sensors 2020, 20, 1043. [Google Scholar] [CrossRef] [PubMed]
- Surdo, S.; Carpignano, F.; Merlo, S.; Barillaro, G. Near-Infrared Silicon Photonic Crystals with High-Order Photonic Bandgaps for High-Sensitivity Chemical Analysis of Water-Ethanol Mixtures. ACS Sens. 2018, 3, 2223–2231. [Google Scholar] [CrossRef] [PubMed]
- Sani, E.; Dell’Oro, A. Spectral optical constants of ethanol and isopropanol from ultraviolet to far infrared. Opt. Mater. 2016, 60, 137–141. [Google Scholar] [CrossRef]
- Born, M.; Wolf, E. Principles of Optics, 6th ed.; Pergamon Press: NY, USA, 1980. [Google Scholar]
Figure 1.
Opto-fluidic setup for experimental measurements. OSA: Optical Spectrum Analyzer; PC: Personal Computer.
Figure 1.
Opto-fluidic setup for experimental measurements. OSA: Optical Spectrum Analyzer; PC: Personal Computer.

Figure 2.
Schematic representation of light propagation through the micro-capillary layered structure based on ray optics.
Figure 2.
Schematic representation of light propagation through the micro-capillary layered structure based on ray optics.

Figure 3.
Comparison between theoretical (dotted traces) and experimental (solid traces) spectral responses for water, ethanol, isopropanol and ethylene glycol.
Figure 3.
Comparison between theoretical (dotted traces) and experimental (solid traces) spectral responses for water, ethanol, isopropanol and ethylene glycol.

Figure 4.
Comparison between the experimental power spectra obtained by flowing ethylene glycol in a single-bounce configuration capillary (blue trace) and in a capillary with longer light path across the channel (orange trace). Inset: base-10 logarithm of 1/α, where α is the absorption coefficient of the ethylene glycol (expressed in cm-1) as a function of the wavelength.

Publisher’s Note: MDPI stays neutral with regard to jurisdictional claims in published maps and institutional affiliations. |
© 2020 by the authors. Licensee MDPI, Basel, Switzerland. This article is an open access article distributed under the terms and conditions of the Creative Commons Attribution (CC BY) license (https://creativecommons.org/licenses/by/4.0/).
Share and Cite
MDPI and ACS Style
Bello, V.; Bodo, E. A NIR-Spectroscopy-Based Approach for Detection of Fluids in Rectangular Glass Micro-Capillaries. Eng. Proc. 2020, 2, 43. https://0-doi-org.brum.beds.ac.uk/10.3390/ecsa-7-08250
AMA Style
Bello V, Bodo E. A NIR-Spectroscopy-Based Approach for Detection of Fluids in Rectangular Glass Micro-Capillaries. Engineering Proceedings. 2020; 2(1):43. https://0-doi-org.brum.beds.ac.uk/10.3390/ecsa-7-08250
Chicago/Turabian StyleBello, Valentina, and Elisabetta Bodo. 2020. "A NIR-Spectroscopy-Based Approach for Detection of Fluids in Rectangular Glass Micro-Capillaries" Engineering Proceedings 2, no. 1: 43. https://0-doi-org.brum.beds.ac.uk/10.3390/ecsa-7-08250