
Usage of Geometric Altitude for Radar Plot Position Improvements †


OpenATS GmbH, 8010 Graz, Austria
†
Presented at the 10th OpenSky Symposium, Delft, The Netherlands, 10–11 November 2022.
Eng. Proc. 2022, 28(1), 8; https://0-doi-org.brum.beds.ac.uk/10.3390/engproc2022028008
Published: 15 December 2022
(This article belongs to the Proceedings of The 10th OpenSky Symposium)
Abstract
:In ATC Tracking applications, the barometric altitude of measured aircraft is predominantly used as a substitute for the geometric altitude in slant range correction of Radar target reports, introducing position errors. With ADS-B being frequently available and of increasing quality, a reliable source for geometric altitude information has become available, allowing for improvements in Radar plot position accuracy. In the presented work, the availability, quality, modeling and reconstruction of such geometric altitude information are reviewed and discussed in relation to current solutions based on barometric altitude. For a single Radar, options for accuracy improvement are described and assessed in comparison to reference data, i.e., ATC Tracker output and real-live meteorological measurements. The application of the discussed ADS-B-based methods can be used to improve Radar plot position accuracy, contributing to aircraft surveillance cost-efficiency and safety.
1. Introduction
1.1. Barometric Altitude
In ATC applications, in general, barometric altitude is widely used and of high operational importance. The barometric altitude is derived from an air-pressure difference at the altitude of the aircraft compared to a standard pressure at mean sea level (MSL). Using a defined standard pressure and standard temperature, based on a specified ISA atmosphere, the barometric altitude is calculated and used for vertical separation. The barometric altitude is (commonly) available from all secondary sensors and transmitted as a Mode C code or Flight Level (1 FL being 100 ft), at a quantization of either 100 or 25 ft.
1.2. Geometric Altitude in ADS-B
Geometric altitude from ADS-B is based on global navigation satellite systems (and sometimes inertial navigation systems). Such data are delivered comparatively frequently and are of high accuracy, and they are given as altitude over the WGS84 reference ellipsoid. In recent years, with continually improving ADS-B accuracy and availability, the geometric altitude transmitted by ADS-B-capable transponders is becoming an increasingly available and dependable source of data.
While the accuracy of the downlinked geometric altitude is not easy to quantify, it has been assessed as to be around three times the horizontal accuracy due to satellite positioning above the globe. More accurately, a study has shown the vertical error is smaller than 4.6m in 95% of measured data [1].
1.3. Three-Dimensional Height in Radars
More common in military than in civilian solutions, certain Radars measure the 3D height of targets in reference to the mean sea level.
1.4. Radar Plot Positioning
To calculate the Radar plot position of a measured aircraft, the measured slant range has to be corrected to the ground range [2]. In many existing civilian Radars and surveillance data processing systems, the barometric altitude is used to estimate the elevation angle, introducing a position offset. In the past, this has been the only source for altitude information; in this work, other sources of altitude information are evaluated.
1.5. Geometric Altitude for Non-ADSB Aircraft
Not all aircraft are equipped with ADS-B capable transponders or are high-quality sources of geometric altitude information but deliver barometric altitude information. In order to apply the additional geometric altitude information to all aircraft, methods for reconstructing geometric altitudes are required for those aircraft where geometric altitude is not available.
1.6. Scope
Using a 24 h recording of Austrian air-traffic surveillance data, the following topics are addressed:
- Analysis of geometric/barometric altitude offsets to estimate possible Radar plot position offsets.
- Evaluation of reconstruction of geometric altitudes for all aircraft (also without ADS-B capabilities).
- Comparison of a pressure/temperature-based reconstruction model to real-life meteorological data.
- Assessment of potential benefits by calculating the change in radar position accuracy comparing usage of barometric, reconstructed geometric, and 3D height information (as measured by the used Radar).
2. Results
2.1. Geometric/Barometric Altitude Offsets
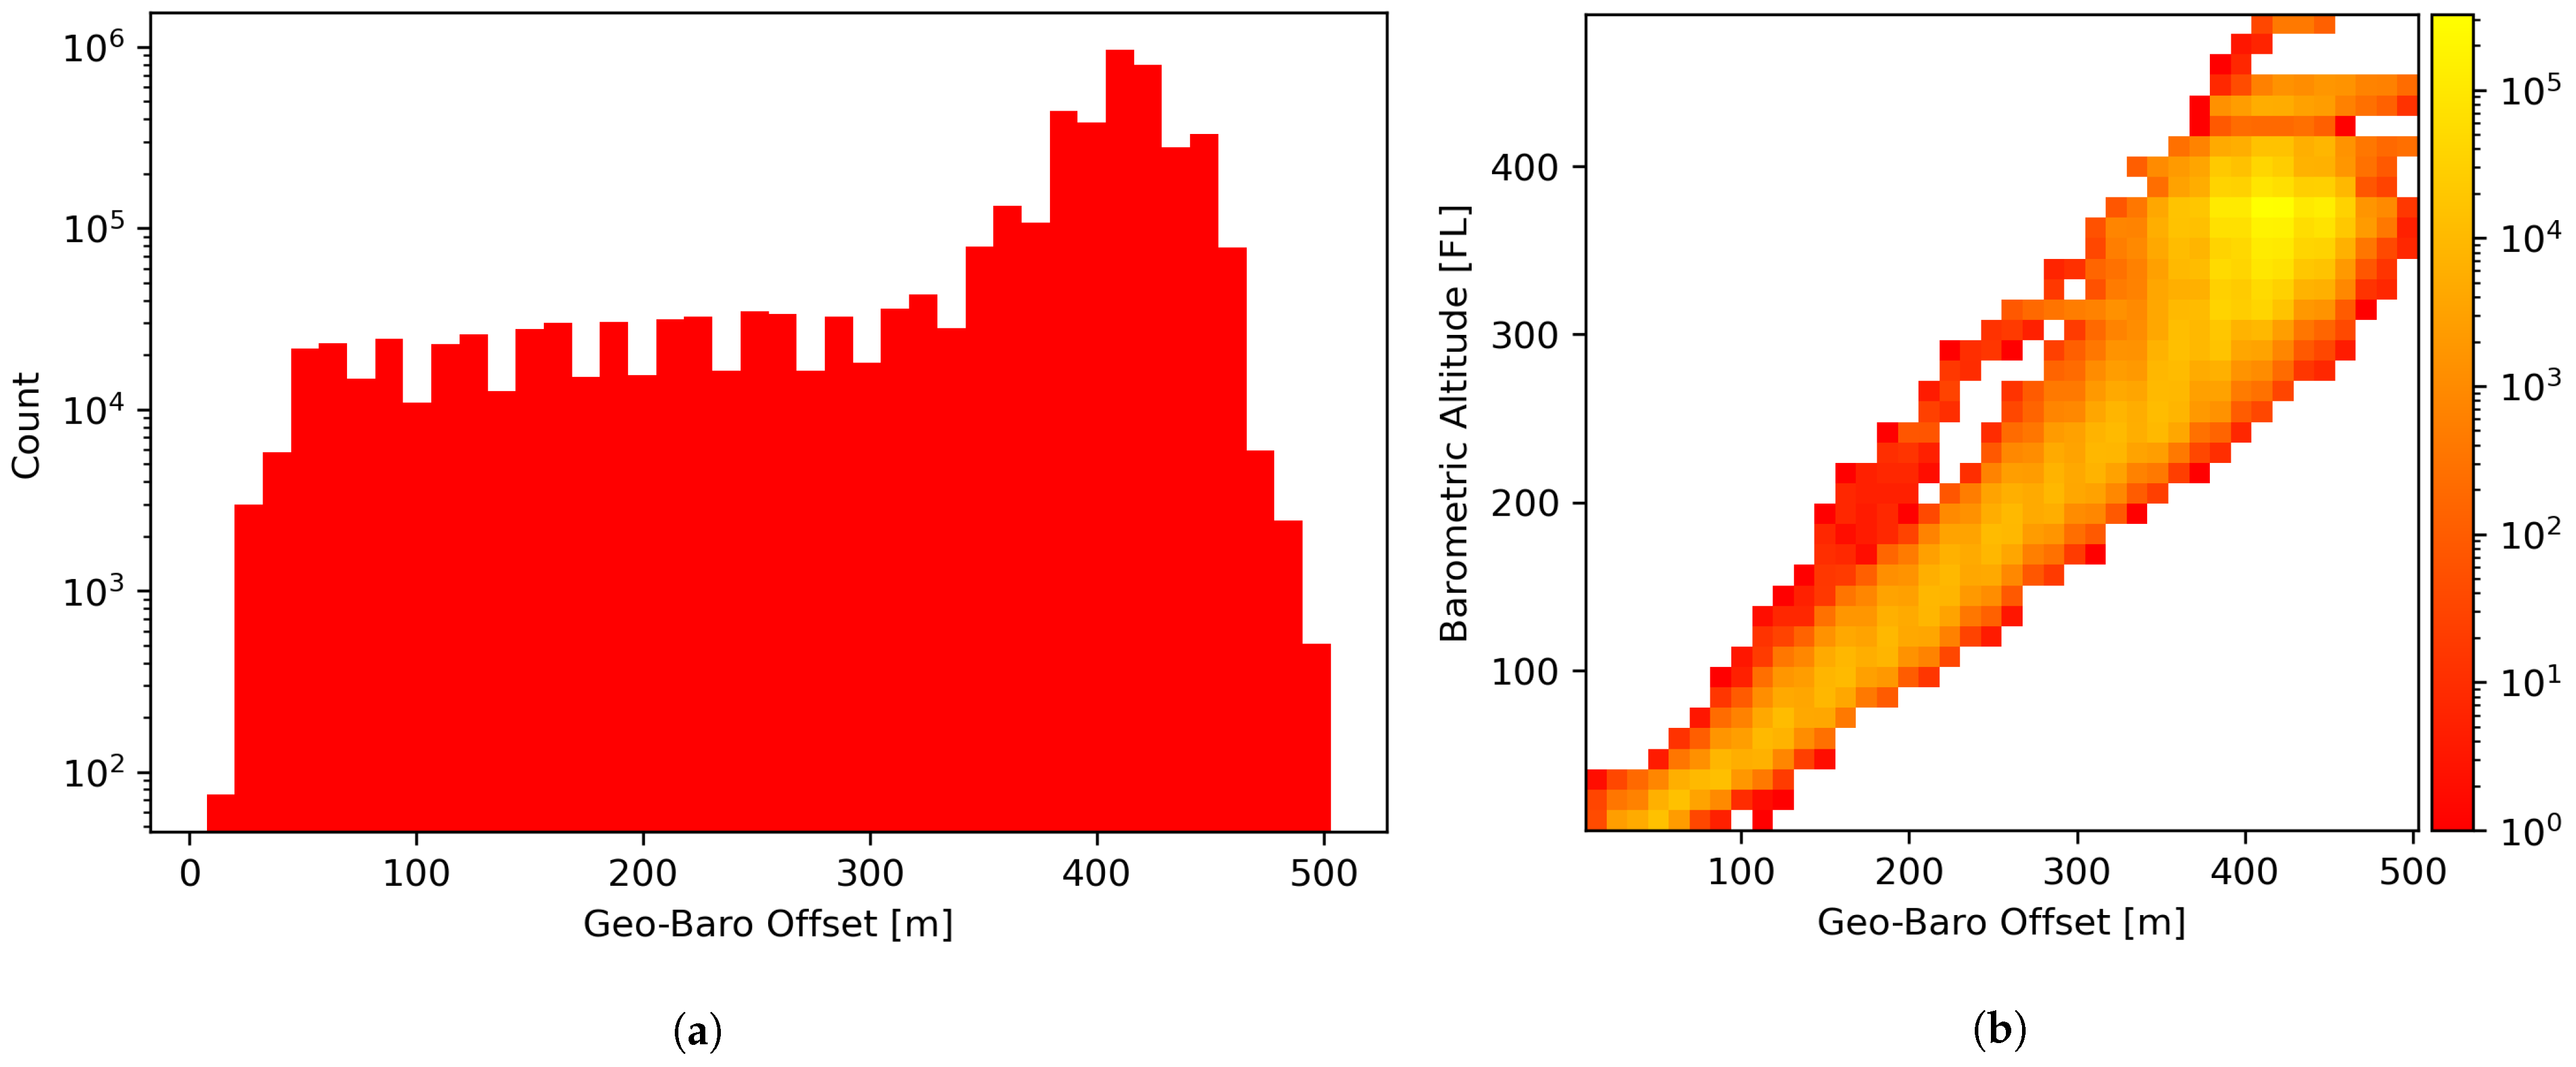
To estimate the introduced error, the offsets between barometric and geometric altitude were calculated and shown in Figure 1a, with the same offsets being shown in Figure 1b over the barometric altitude. As depicted, the higher altitude offsets occur at higher (barometric) altitudes, with a significant part of the distribution having an offset in the 300–500 m range.
2.2. Geometric Altitude Reconstruction
The standard formulas to derive barometric altitude based on pressure differences are (based on [3,4,5], terms described in Table 1):
The stated standard formulas are defined for the ISA standard atmosphere, and the parameters , are adapted in the QNH/QFE correction to convert a barometric pressure (offset) to a geometric altitude.
Several options were investigated to model the data depicted in Figure 2a.
The chosen method was to approximate the parameters using barometric/ geometric altitude pairs based on (reliable) ADS-B data (see Section 4.2.1). This approach allows the usage of standard formulas, physical interpretations of the model parameters, and comparisons to real-life meteorological data.
The approach was to create space-time grid cells (see Section 4.3) for all data points and reconstruct the chosen parameters within each cell. Since the used formulas are non-linear, an MSE approximation of the parameters using the Levenberg–Marquardt algorithm [6] was used.
In Figure 3a, the inherent reconstruction error is depicted in comparison to the previous barometric/geometric altitude offset (as in Figure 1a). Figure 3b shows the approximation of barometric/geometric altitude pairs using the estimated parameters, in cyan to purple coloring depicting a value range (when calculated without temperature correction). Please refer to Section 4.5 for further details.
2.3. Pressure/Temperature Reconstruction Assessment
The reconstructed pressure and temperature coefficients were compared to real-life meteorological measurements. Meteorological (MET) data were obtained for Vienna airport (LOWW) and compared to the reconstructed parameters of the respective grid cells, as depicted in Figure 4.
2.4. Comparison of Radar Plot Position Accuracy
Using data from one Radar, the barometric altitude information and the obtained parameter estimates allow calculation of the reconstructed geometric altitude using Formula (2). Using said altitude in Radar slant range correction, the adjusted radar plot positions can be calculated. In addition to the reconstructed altitude, 3D height measurements from one Radar (as depicted in Figure 2b) were used for comparison.
The change in Radar plot position accuracy was measured by comparing the adjusted Radar plot positions to real-life data from the operational ATC Tracker in Austria, as depicted in Figure 5. The Radar plot data were filtered to be in the area of highest accuracy (see Section 4.2.2).
3. Discussion
As described in Section 2.1, the offsets between barometric and geometric altitude are substantial. Based on the given data, it can be argued that ATC Surveillance Data Processing Systems and Trackers using barometric altitudes for slant range correction are generating position information with significant offsets.
3.1. Reconstruction Model
In Section 2.2, a reconstruction model is described that allows the reconstruction of geometric altitude from barometric altitude values. Said reconstruction model uses physics-based parameters (temperature, pressure), incorporates standard formulas and allows position-adjustments (also for non-ADS-B aircraft) while showing significant internal consistency (see Table 2).
The results described in Section 2.3 show that the estimated model parameters, while not providing a close fit, exhibit a correlation to real-life MET data. It should be noted that the optimization method did not take physical constraints, parameter-bounds or previous values into consideration and only provided the best-estimate solution for the modeled data.
Another aspect should be taken into account: The used MET pressure and temperature values are used to fit data at lower flight levels, below the so-called transition altitude (commonly between FL 180 and FL 30). On the contrary, the reconstructed parameters were used to fit data up any flight level, which was at altitudes higher than FL 300 (see Figure 2a) (for the most part) in the used dataset.
For the discussed reasons, the author would argue that the estimated model is of reasonable accuracy and credibility, especially if the reconstructed geometric altitude values should allow for a significant increase in Radar plot accuracy.
3.2. Comparison of Radar Plot Position Accuracy
Such an increase is described in Section 2.4: Compared to barometric Radar plot positions, the reconstructed geometric altitude provides for a reduction in the Cartesian error of ~40 m while also lowering the error standard deviation by ~8 m (on average). In the (ground) range accuracy, an even larger improvement is measured: ~60 m offset reduction and ~13 m standard deviation reduction.
The accuracy of the used Tracker reference data is also of significance since a measurement against a noisy reference would degrade the validity of the estimated position errors. Since an assessment of the reference position quality is out of the scope of the presented work, the author would argue that the relative improvement between the presented position calculation methods is significant, while their absolute error values are less so.
Based on the given measurements, the listed position accuracy improvement is significant. Most ATC Trackers, of course, use intricate outlier detection, bias estimation and error correction methods—making the discussed improvement dependent on the suitability of the used tracking algorithms and the available sensor infrastructure. Since in the presented work no common Radar error correction mechanisms (azimuth bias, range bias and gain correction) were used, it can be argued that the reconstruction results listed in Table 3 could be further improved when investigating a specific bias estimation solution.
Additionally, the calculated improvement is strongly influenced by weather conditions, which result in differences in actual pressure and temperature (at MSL) to the standard constants. Depending on the magnitude of such differences, in certain weather conditions, a larger increase in accuracy will be possible.
The author would therefore argue that the presented work allows for a significant enhancement in some ATC Tracking applications and environments.
3.3. Radar 3D Height
Based on Figure 2b, it can be argued that the 3D height information measured by the used Radar is comparatively noisy (with respect to the ADS-B geometric altitude). When comparing the Cartesian and range offsets using such information for slant range correction (see Table 3), it is evident that, at least without filtering and further processing, the 3D height generated by the Radar is sub-optimal for the described application.
3.4. Future Work
The presented approach can, in its current form, only be used in offline applications. For online applications (i.e., ATC Tracking), the MSE optimization would have to be changed to online estimation of the selected parameters. Another option would be to switch the model parameters since the current (non-linear) approach requires a significant number of samples to result in high accuracy. Based on Figure 2a and previous trials, the author suggests that a simple linear modeling could also be used with promising accuracy, for which a Kalman-filter variant would be a viable candidate.
While the main focus of this work is on cooperative surveillance, the results could be extended to (additionally) incorporate non-cooperative (primary) surveillance. With enhanced accuracy in aircraft positioning, as well as the estimated geometric altitude, the association and correction of primary-only plot information could improve applications in non-cooperative aircraft tracking.
Another option would be to integrate an external data source for large-scale MET data, which could be used to further increase the accuracy of the estimated model parameters, as well as provide data for areas with little or no ADS-B surveillance data. This approach would be limited to certain applications, e.g., offline or non-operational systems, unless a MET source fulfilling appropriate safety requirements (accuracy, availability, etc.) could be used.
4. Methods
4.1. Dataset
A 24 h dataset (content description in Table 4) of Austrian airspace was used, as kindly provided by AUSTROCONTROL. The dataset was imported into a database using the open-source tool OpenATS COMPASS (https://github.com/hpuhr/COMPASS, accessed on 21 Septemeber 2022).
4.2. Data Filtering
Only Mode S target reports were loaded, within a bounding rectangle in latitude/ longitude (fully encompassing the Radar coverage), to only process data of interest for efficiency purposes. Additionally used filter conditions are listed in the following sections (all conditions must be fulfilled).
4.2.1. ADS-B Filtering
To restrict the processed target reports to be of appropriate quality (MOPS version, NACp, type of aircraft) and have all required data sets, the following filters were used:
- MOPS version of 2, NACp ≥ 4,
- Mode C code present, geometric altitude present and valid value (not 204793.75),
- Emitter category 3 or 5 (medium or heavy aircraft).
Please note that the geometric altitude accuracy (GVA) data field was not available in the used dataset, which would be useful for later implementations. Please refer to [7] for further information about the data items used.
4.2.2. Radar Filtering
To ensure the processed target reports are of the highest accuracy and have all required data sets, the following filters were used:
- Data source is the analyzed Radar,
- Mode C code present, Mode C code not garbled, Mode C code valid,
- Three-dimensional height present,
- Mode C code > 100 (FL), range < 62.5 (nm).
In the last two filter conditions, a selection is made to only use target reports at higher altitudes (where the Tracker horizontal position quality is most accurate due to multiple coverage of other sensors) and of lower Radar range (where the Radar has the highest horizontal position accuracy).
4.2.3. Loaded Data Counts
Please note that the differences in data sizes are strongly influenced by the difference in update intervals of the data sources (Table 5).
4.3. ADS-B Binning
To be able to create the reconstruction model, the loaded ADS-B data were binned into space-time cells. Using a grid-size of 0.25° latitude/longitude and 1 h time, the 4,217,366 target reports were binned into 15,225 cells, with an average target report count of 277 target reports each.
4.4. Reconstruction Model
To estimate the parameters, all target reports in each cell are used in a least-squares estimation. A number of methods were evaluated (Trust Region Reflective algorithm, Powell’s dogleg algorithm, Levenberg–Marquardt), with the latter giving the best results without the need for bounded constraints on parameter values.
For each ADS-B target report, Formula (1) is used to reconstruct the original pressure at altitude p. Then, the geometric altitude (referenced to the WGS84 ellipsoid) is corrected by the Geoid altitude (using an interpolated EGM96 geoid) to be in reference to MSL.
Then, the pressure p and the model parameters , as well as the reconstructed altitude are calculated. This altitude is calculated using the standard Formula (2) (as with calculating the barometric altitude used for the Mode C code) but with non-standard values for the estimated variables. The MSE estimation iterates over these steps, changing the model parameter values while minimizing the distances between to find optimal values for the model parameters.
For a number of cells, not enough target reports existed (<200) to accurately model the respective parameters and were thus tagged as unusable.
4.5. Reconstruction Model Consistency
To test the reconstruction model consistency, 5% of the data used to train the model were randomly selected to calculate the reconstruction offsets. For each test ADS-B target report, the geometric altitude was calculated using the barometric altitude and the respective grid cell parameters. First, Formula (1) is used to reconstruct the pressure at altitude p. Using p and the estimated parameters in the cell, the geometric altitude over MSL is calculated using Formula (2).
Finally, the reconstructed geometric altitude over WGS84 ellipsoid is calculated using:
The offset is then calculated based on the reconstructed and the original altitudes. In the presented data, 210,868 test target reports were selected, of which 26,650 (12.6%) could not be used since the respective grid cell was unusable.
4.6. Reference Data
For reference data, corresponding aircraft are found using the Mode S address. For a given time, the position information is calculated using 3rd-order spline interpolation of the reference position information.
4.7. Position Accuracy Measurement
For each Radar plot, three different positions are calculated based on barometric altitude, geometric altitude and 3D height information. For each altitude type, the elevation angle (in the Radar plane) is calculated using the measured slant range , the target altitude over the radar plane and the earth radius at the target latitude :
Using the three elevation angles, the respective slant range corrected positions are calculated, from which the respective offsets to the reference track positions are calculated. Please note that for the given 392,040 Radar plots, 9 target reports were not assessed since no corresponding Tracker data could be found, while for 27,793, no usable reconstruction grid cell existed (7.08%).
4.8. Source Code
Please note that while the used dataset could not be shared, the Python 3 source code used to generate the presented results is available on GitHub (https://github.com/hpuhr/geo_rec_alt_paper, accessed on 22 October 2022).
Funding
This research received no external funding.
Institutional Review Board Statement
Not applicable.
Informed Consent Statement
Not applicable.
Data Availability Statement
Used data could not be shared due to non-disclosure agreement.
Acknowledgments
The author would like to thank AUSTROCONTROL for making the used dataset available, including Robert Guttman and the MET department staff for their cooperation.
Conflicts of Interest
The authors declare no conflict of interest.
References
- GPS Product Team. Global Positioning System (GPS) Standard Positioning Service (SPS) Performance Analysis Report; GPS Product Team: Washington, DC, USA, 2014. [Google Scholar]
- Barton, D.K.; Leonov, S.A. Radar Technology Encyclopedia; Artech House: Norwood, MA, USA, 1998. [Google Scholar]
- International Civil Aviation Organization. Manual on Automatic Meteorological Observing Systems at Aerodromes, 2nd ed.; International Civil Aviation Organization: Montreal, QC, Canada, 2011; Volume 9837. [Google Scholar]
- International Civil Aviation Organization. Manual of the ICAO Standard Atmosphere: Extended to 80 kilometres (262,500 feet); International Civil Aviation Organization: Montreal, QC, Canada, 1993; Volume 7488. [Google Scholar]
- Cavcar, M. The international standard atmosphere (ISA). Anadolu Univ. Turk. 2000, 30, 1–6. [Google Scholar]
- Moré, J.J. The Levenberg-Marquardt algorithm: Implementation and theory. In Numerical Analysis; Springer: Berlin/Heidelberg, Germany, 1978; pp. 105–116. [Google Scholar]
- Specification for Surveillance Data Exchange ASTERIX, Part 12 Category 021, ADS-B Target Reports, 2.6 ed.; EUROCONTROL: Brussels, Belgium, 2021.
Figure 1.
Geometric/Barometric Altitude Offsets. (a) Altitude Error Distribution. (b) Altitude Error Distribution over Barometric Flight Level.
Figure 1.
Geometric/Barometric Altitude Offsets. (a) Altitude Error Distribution. (b) Altitude Error Distribution over Barometric Flight Level.

Figure 2.
Barometric/Geometric Altitudes. (a) From ADS-B. (b) From Radar.

Figure 3.
Altitude Error Distributions and Vienna Airport Model Cell. (a) Error Distributions. (b) Vienna Airport Altitude Data and Reconstructed Model .
Figure 3.
Altitude Error Distributions and Vienna Airport Model Cell. (a) Error Distributions. (b) Vienna Airport Altitude Data and Reconstructed Model .

Figure 4.
Vienna Airport Reconstructed Parameters Comparison. (a) Pressure Comparison. (b) Temperature Comparison.
Figure 4.
Vienna Airport Reconstructed Parameters Comparison. (a) Pressure Comparison. (b) Temperature Comparison.

Figure 5.
Offset (connected points) and Standard Deviation (dashed lines) Comparison (in 30 min Intervals). (a) Cartesian Offsets. (b) Ground Range Offsets.
Figure 5.
Offset (connected points) and Standard Deviation (dashed lines) Comparison (in 30 min Intervals). (a) Cartesian Offsets. (b) Ground Range Offsets.


Table 1.
Formula Terms.
| Term | Description | Comment |
|---|---|---|
| p | Pressure at altitude | hPa |
| Standard pressure at MSL | 1013.25 hPa | |
| Temperature gradient over altitude | 0.0065 K/m | |
| Standard temperature at MSL | 273.15 + 15 °K | |
| h | Altitude | m |
| Acceleration of gravity | 9.81 m/s2 | |
| R | Gas constant | 287 J/(kg K) |
Table 2.
Gaussian Parameters of Error Distributions in Figure 3a.
Table 2.
Gaussian Parameters of Error Distributions in Figure 3a.
| Parameter | Mean (m) | Std.Dev. (m) |
|---|---|---|
| Geo-Baro | 379.24 | 85.20 |
| Geo-Reconst | 7.95 | 6.82 |
Table 3.
Gaussian Parameters of Full Series in Figure 5.
Table 3.
Gaussian Parameters of Full Series in Figure 5.
| Offset Type | Altitude Source | Mean | Std.Dev. |
|---|---|---|---|
| Cartesian (m) | Barometric | 90.97 | 40.75 |
| Geometric | 49.30 | 32.77 | |
| 3D Height | 147.30 | 440.20 | |
| Azimuth (deg) | (same for all) | 0.0122 | 0.0382 |
| Ground Range (m) | Barometric | −75.60 | 42.96 |
| Geometric | −15.81 | 29.68 | |
| 3D Height | −83.43 | 454.02 |
Table 4.
ASTERIX Data Content and Usage in Dataset.
| Data Source | ASTERIX | Usage |
|---|---|---|
| ADS-B | CAT021 | Generate reconstruction model |
| Analyzed Radar | CAT048 | Accuracy improvement assessment test data |
| Tracker | CAT062 | Accuracy improvement assessment reference |
Table 5.
Data source usage in dataset.
| Data Source | ASTERIX | Count |
|---|---|---|
| Analyzed Radar | CAT048 | 392,040 |
| ADS-B | CAT021 | 4,217,366 |
| Tracker | CAT062 | 3,057,776 |
Publisher’s Note: MDPI stays neutral with regard to jurisdictional claims in published maps and institutional affiliations. |
© 2022 by the author. Licensee MDPI, Basel, Switzerland. This article is an open access article distributed under the terms and conditions of the Creative Commons Attribution (CC BY) license (https://creativecommons.org/licenses/by/4.0/).
Share and Cite
MDPI and ACS Style
Puhr, H. Usage of Geometric Altitude for Radar Plot Position Improvements. Eng. Proc. 2022, 28, 8. https://0-doi-org.brum.beds.ac.uk/10.3390/engproc2022028008
AMA Style
Puhr H. Usage of Geometric Altitude for Radar Plot Position Improvements. Engineering Proceedings. 2022; 28(1):8. https://0-doi-org.brum.beds.ac.uk/10.3390/engproc2022028008
Chicago/Turabian StylePuhr, Helmut. 2022. "Usage of Geometric Altitude for Radar Plot Position Improvements" Engineering Proceedings 28, no. 1: 8. https://0-doi-org.brum.beds.ac.uk/10.3390/engproc2022028008