1. Introduction
One of the most important parts of well analysis is determining which wells might be able to produce at a better rate than the current one. The well modeling software PROSPER is designed to assist in making sure that well models are accurate and consistent. It also allows the handling of every aspect of well modeling, PVT (fluid description), VLP correlations (for calculating flow-line and conduit pressure loss) and IPR (reservoir inflow) [
1]. PROSPER has different ways of matching PVT, point flow correlations and IPR to field data, so that the well model can be built before it is used in prediction sensitivity or artificial lift design. PROSPER allows the consideration of detailed surface pipeline performance and design in the following areas: flow regimes, pipeline stability, slug size and frequency. It works as follows. The options, PVT data, equipment data, IPR data and calculation outline are all on the main PROSPER screen, which is divided into five parts. When PROSPER is used to make well models, the concept of integrated production modeling IPM is used [
1]. PROSPER is the link between the reservoir model and the surface model in well modeling. It connects the two. Among other things, it shows how the well works and how the reservoir and vertical rise work. Before using the well matching method, we will create a well model by putting incorrect information into the well check. The well analysis is then performed in each part of the assembly system to determine whether it is producing less than it should be. An important part of well analysis is the ability to show how well flow and performance are linked currently (IPR). It is important to use the right well check information and the right IPR model for the analysis in order to be successful. Well performance modeling is an important part of research in the field of crude oil engineering. In this model, the PVT model for the produced fluids, the reservoir IPR model and the VLP model are all combined to create one model that is a mix of them all [
2,
3].
Hydrocarbon deposits have been found thousands of feet below the surface of the earth. A link must be created between the surface and subsurface reservoirs in order for the hydrocarbons to be combined, which is a well group. It cannot be overstated how important it is to conduct research and determine how wells will perform. The period of the well’s ability to supply the reservoir fluid is called the well performance. This is because the well’s expected productive capacity, pressure drop or flow rate are all factors that affect how well it can do this for a certain amount of time [
4]. As a result, well performance analysis is concerned with discovering how tubular size, wellhead and bottom-hole pressure, fluid properties, fluid production rate and reservoir deliverability all work together. An important part of fossil fuel engineering is the consideration of the pressure visit of oil and gas wells. This helps with the design of wells, the completion of wells and the production of more oil and gas. Fluid moves from the all-time bottom hole into the tubing or casing, from where it moves to the surface. The friction between the fluids and the tube walls, as well as the restrictions inside the tube, gravity and viscosity forces, all play a role in fluid movement. To perform a good well performance analysis, the well and its fluid model should be included, as well as the model of the fluid produced, the influx performance relationship model and the model of how well the fluid moves up and down. The PVT model is important because the produced fluid can have different properties at different pressures and temperatures. This is why it is important to have this model. Pressure and temperature changes cannot be avoided when fluid moves vertically upwards in a tube. This method is used to accurately predict what is occurring inside. The flow up the tube can be mixed at times [
5]. Gas and liquid tend to separate and cannot usually move at the same speed. Calculating the pressure drop is very complicated and difficult. To determine how wells will deliver and how they will deplete, accurate pressure visit predictions for oil and gas wells are required. As a result, even though many people have proposed completely different multiphase flow correlations, none of them have tried to produce reasonable results for all the different situations that could occur when producing hydrocarbons. The tuned correlations are then used to predict how a well would perform in the future. This is carried out by simulating a well and then considering the results.
2. Literature Survey
Production modeling includes activities such as measuring, analyzing, modeling, prioritizing and implementing actions to improve the productivity of a reservoir, well or surface [
6,
7]. These activities are called “production modeling”. Production optimization is an important step in making sure that the developed reserves can be recovered and that profits can be maximized. The PROSPER integrated oil reference states that PROSPER is a well performance, style and optimization program that is part of the integrated production modeling toolkit, which is used to figure out how wells work and how to improve them (IPM). According to Shoaib et al. [
8], IPM is a way to model the quality of a product from the time it is extracted from the ground to when it is delivered. At first, each fluid model will not behave the way it is supposed to, and it will need to be matched with information from research labs. This is often performed to make sure that the model does not change and behaves like a real reservoir fluid. After creating the PVT model, the wellbore model is created with the PROSPER software package. An important tool helps one figure out how to increase the output of a well when the pressure in the well drops. The flow performance curve (IPR) and the vertical raise performance curve can be used to conduct many different kinds of tests (VLP). Reservoir modeling can be used to see how current reservoirs are behaving by working with MBAL, a company that works with fossil fuels. This model can also be used to predict the reservoir’s long-term future, except for figuring out how much it will run out of. The built model’s reliability and accuracy depend on the pressure and production points that have been put into it over the years. In their opinion, Tejaswi et al. [
9] say that integrated production modeling is very important for well performance analysis and for the growth of the production system. It is a way to figure out how changes will affect processes, such as field performance, by looking at individual elements in a structured way and then looking at how their interactions will affect field performance. This paper discusses a workflow that is used in integrated production modeling. When creating a surface network model, there are steps one can take to make it faster. They also show how to make sure the models are accurate. The main goals of this work were to speed up model development, review well flow performance in advanced stacked watercourse sand systems and look for ways to improve production by looking for ways to remove bottlenecks and drilling more wellbore. This is how the model is created and tested against real-world data. Then, the best fluid and well production correlations are chosen. Umut and other researchers came up with a five-step process for creating an integrated production model. Among them:
Step 1: Outline the problem and state the main technical assumptions that will affect the choice you make. This is called framing, and the whole project group is involved in it.
Step 2: Modeling is the next step. All of the technical information from the framing step is put into the different models and packages during this step.
Step 3: It is called the “Static Quality Check (Reservoir to Separator)”. This is when an engineer looks at the rock and fluid and mechanically inputs their attributes into every model (subsurface well, surface network, and so on, if there are any) and compares them to standard information (well log, core, flow back check, fluid samples, unstable and others).
Step 4: “Link the Surface Network to the subsurface Model". The wells in the subsurface model are linked to their corresponding pairs in the surface model.
Step 5: “Dynamic Quality Check”. The whole system is put through the full amount of prediction. If there are problems with convergence, they are fixed. If an associated anomaly is found, the same modeling step may be performed again.
The sixth step is forecasting. If one makes a big economic decision, one can use IPM in two ways. One way is where the whole IPM is forecasted for full-field predictions. A call on a smaller scale will not work because the bound module of IPM is removed in this case [
10]. A study by Kerunwa et al. [
11] stated that modeling well performance is an important part of crude engineering research. There are three models in this model: the fluid PVT model, the reservoir IPR model and the VLP model. They all work together. The objective is to figure out how much pressure is lost as the reservoir fluid moves from the bottom hole to the surface. Researchers have come up with many different ways to figure out how much pressure is lost, but none of them have been found to be the most accurate because the fluid flow inside the conduit can be complicated and polyphase. Polyphase flow correlations were changed by standardization in this work to fit the downhole pressure and rate from the assembly check, which was used to model the performance of the well under study. This was performed to make the correlations more accurate. Production tests are needed to make sure the correlation is correct for the behavior that is found. For example, the pressure in the well is affected by how much water is cut off. At pressures less than 2900 psig, the well would not work at all if it were left in its original state (250 psig THP, 30% water cut and 2.875” conduit size).
3. Methodology
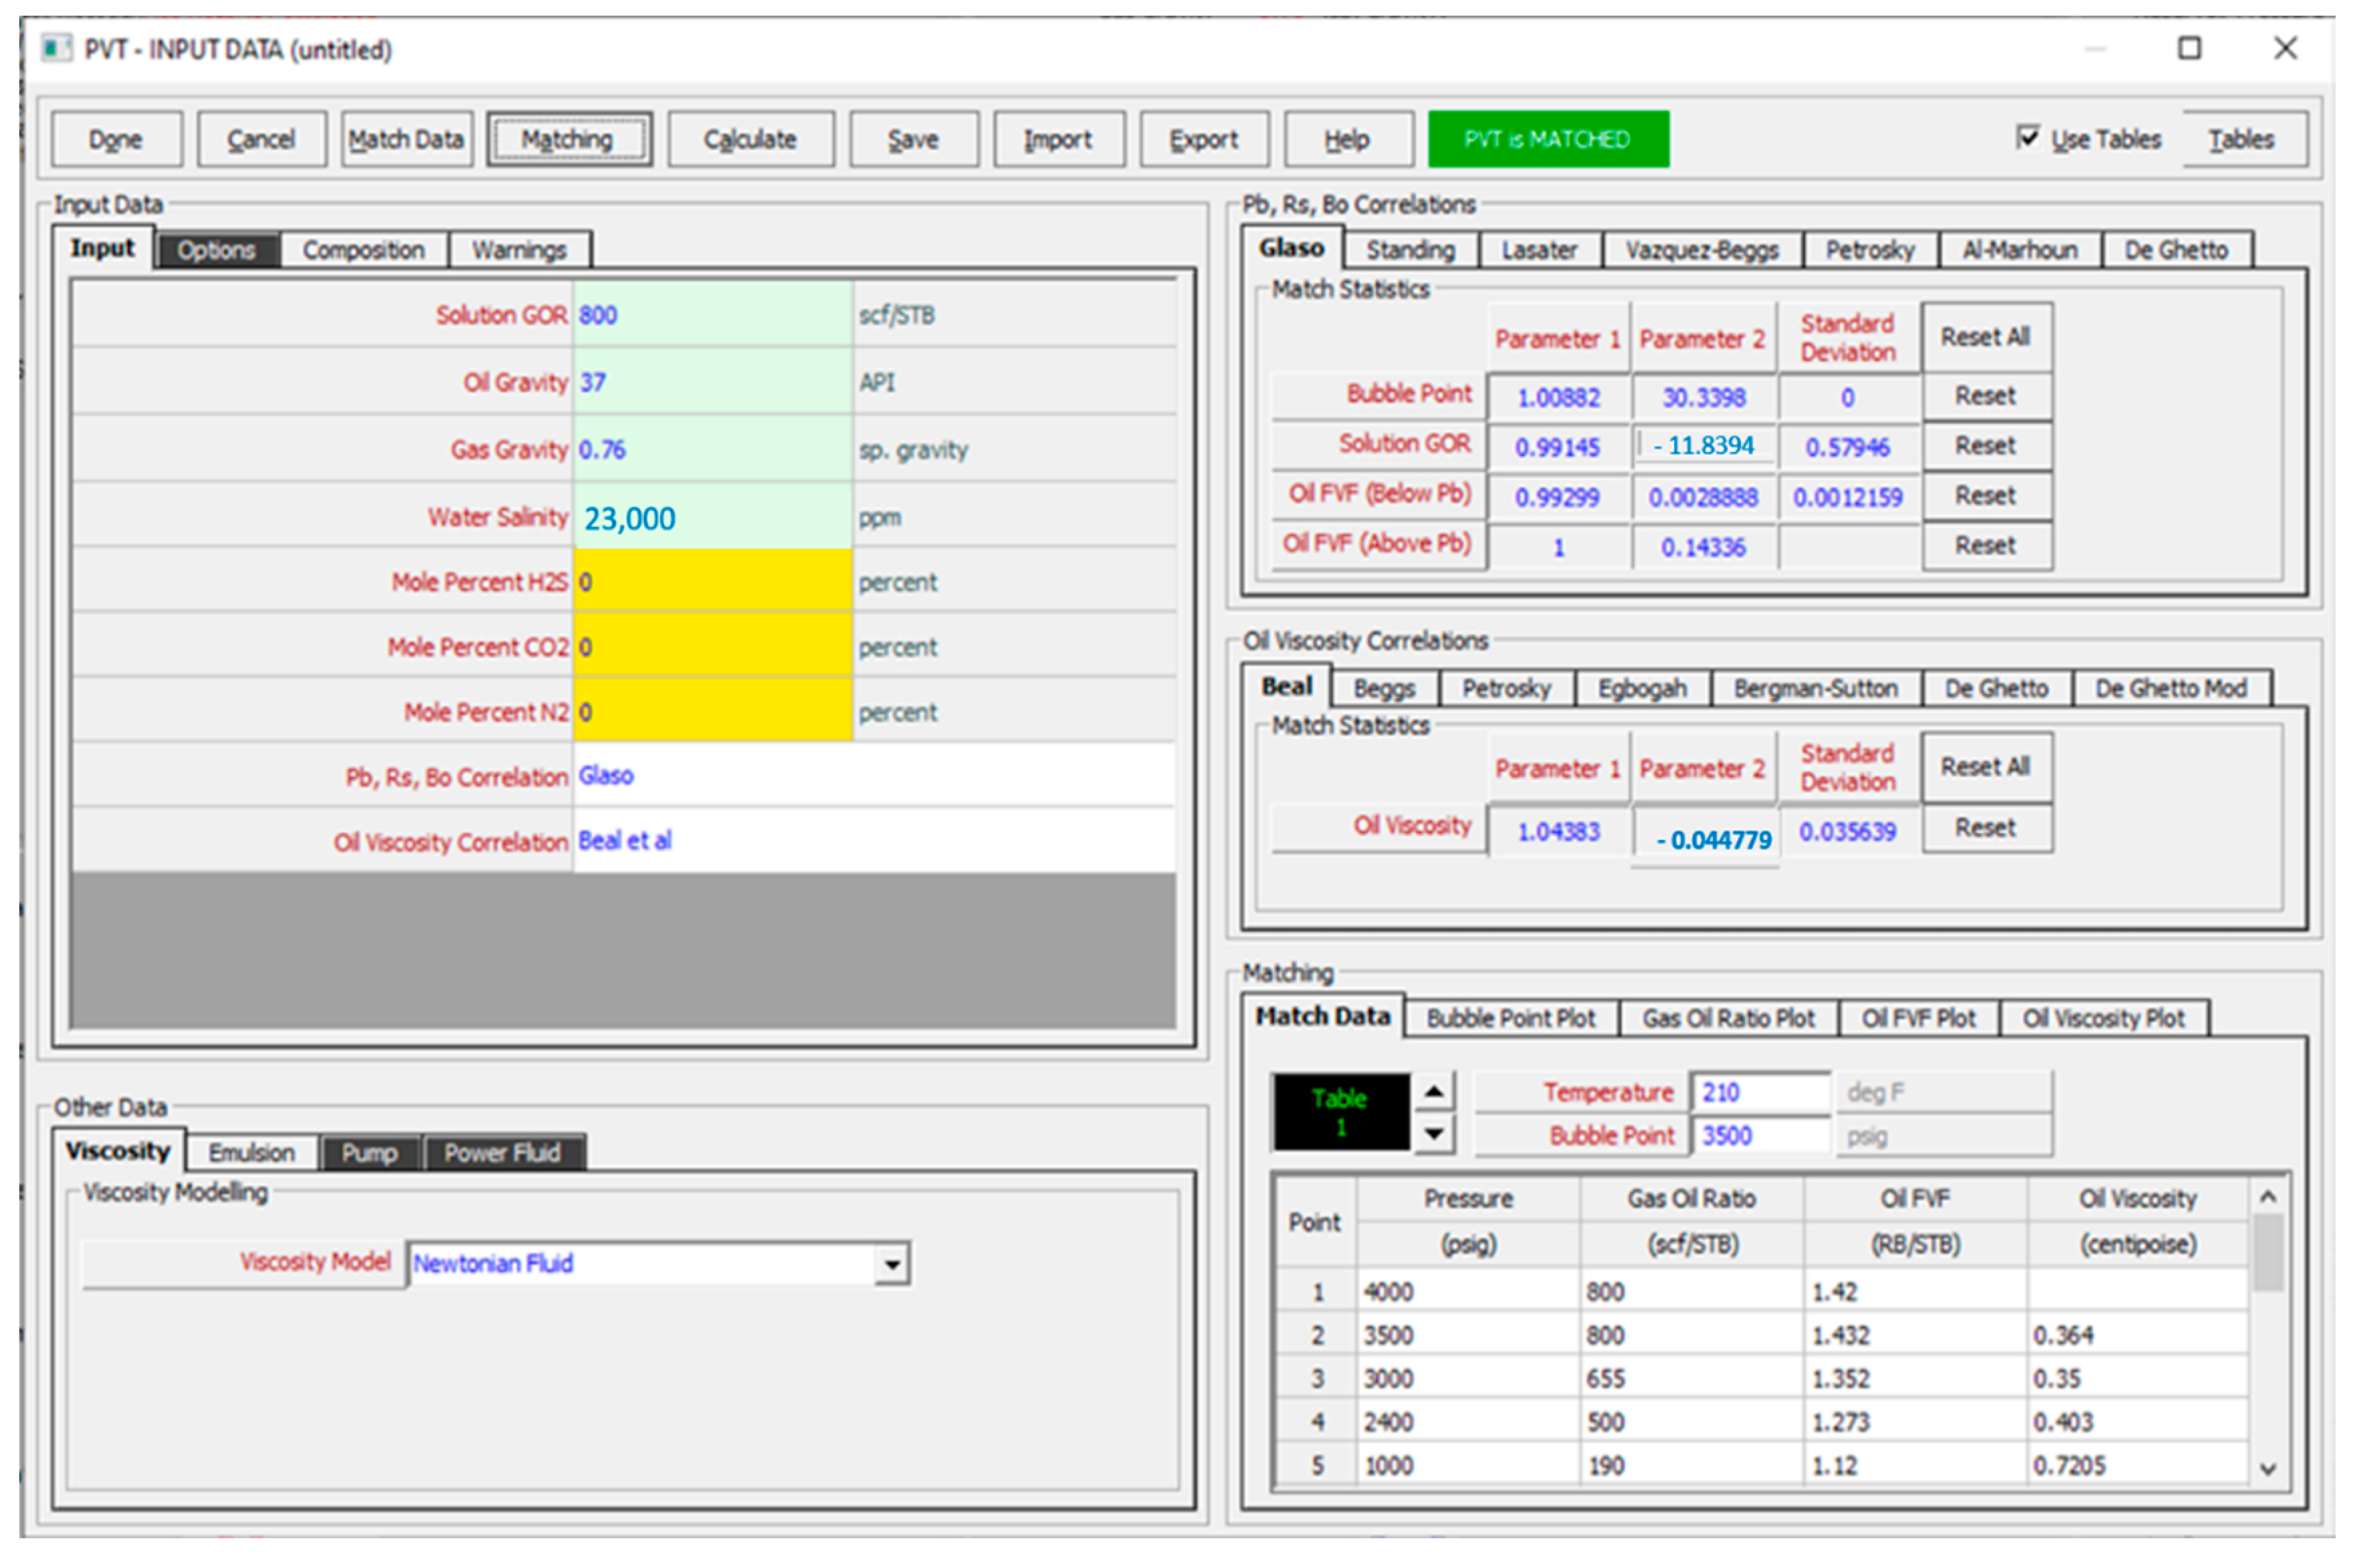
In order to make sure that well models are reliable and consistent, PROSPER is meant to be used for everything from fluid characterization to flow line and tubing pressure loss to IPR (reservoir inflow). It is possible for the user to test each model subsystem by adjusting the well system model to real-world data (PROSPER User Manual, 2008). When creating a well model, it is best to match well IPR and VLP knowledge when there is information from the investigation. Matching was performed for a period of time, which was the same length of time as the investigation. The well downhole diagrams were used to make sure that the instrument configuration was correct. To be able to copy any workovers, well models had to be changed. In this study, petrophysics and perforation summaries were used to compare the reservoir’s permeability and formation thickness to their findings (from the production database). A lot of your time was spent “setting up” the well model. If one has already done some preparation, this time will be cut down. For example, if one has already done some preparation, this could speed up IPR/VLP matching. Following the development of the well model, the PVT modeling is performed by matching the PVT information from the lab tests to the available correlations. Nonlinear regression is used to change the correlations, so that they work best with lab-measured PVT data. When two factors are linked together, they each have their own value (parameter 1) and their own shift (parameter 2). In this example, the correlation that best matched the fluid was correct the least amount of time (
Figure 1). The level of quality deviation shows how close are the results.
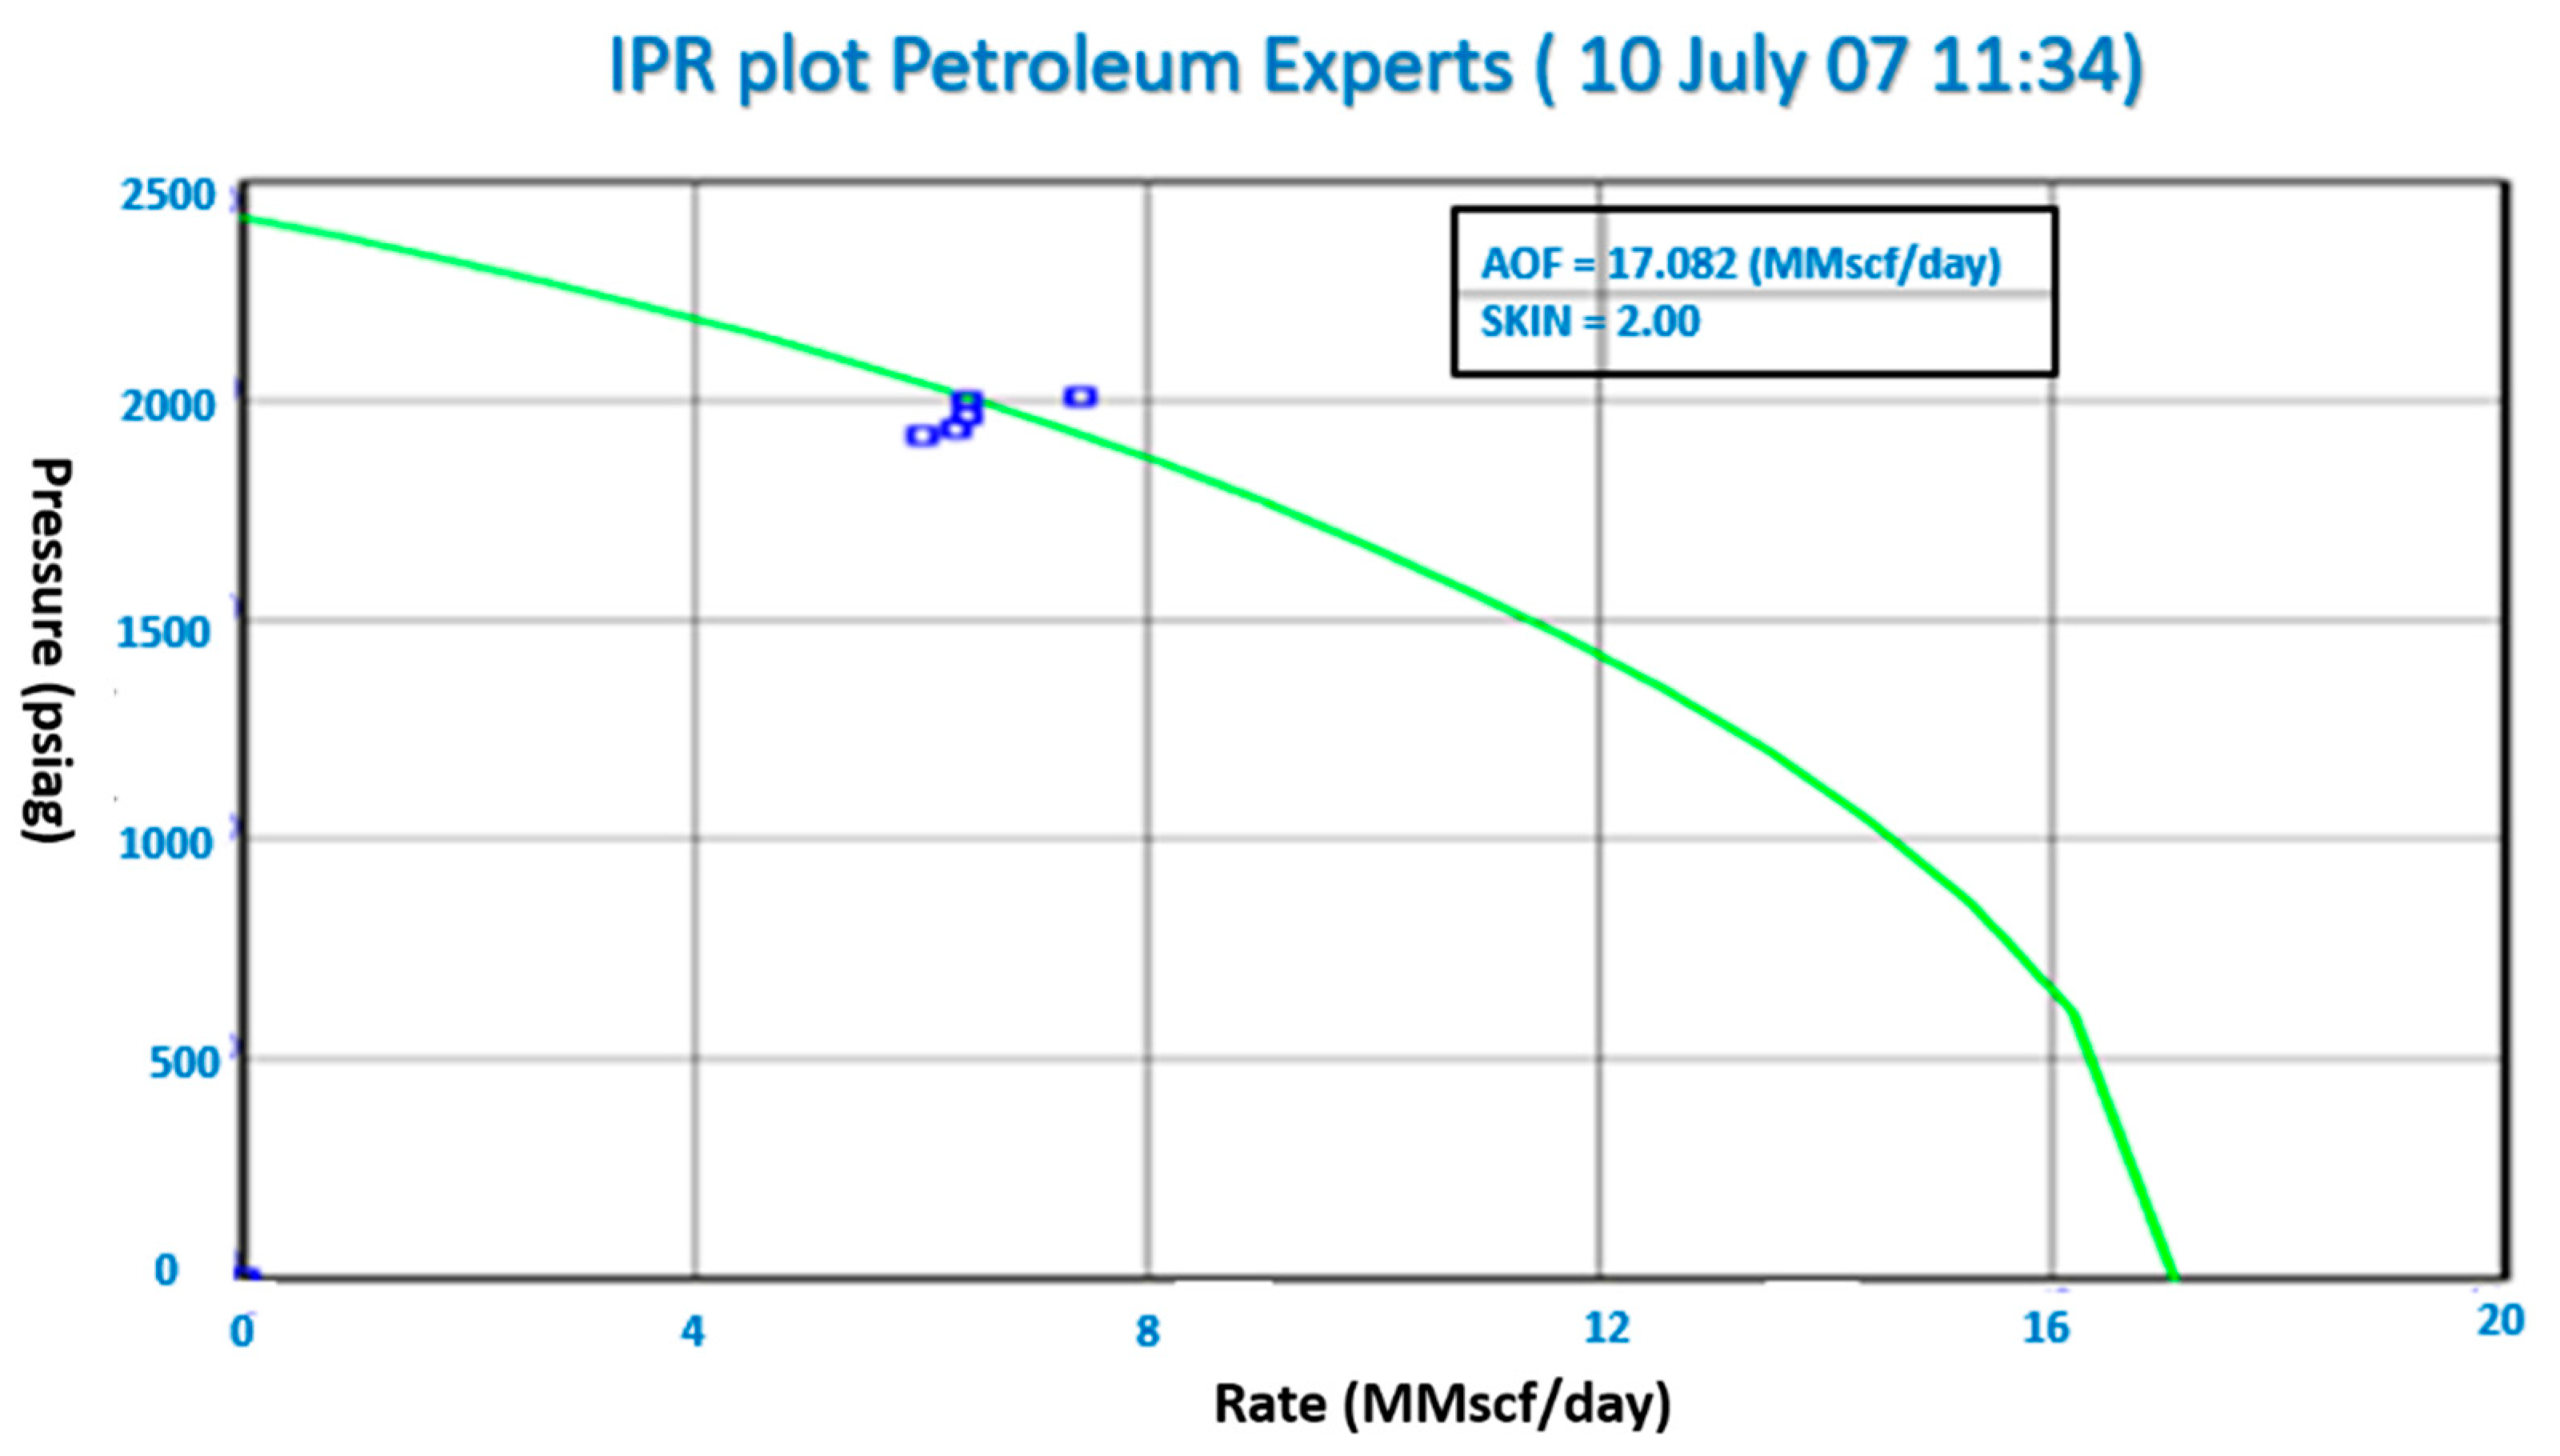
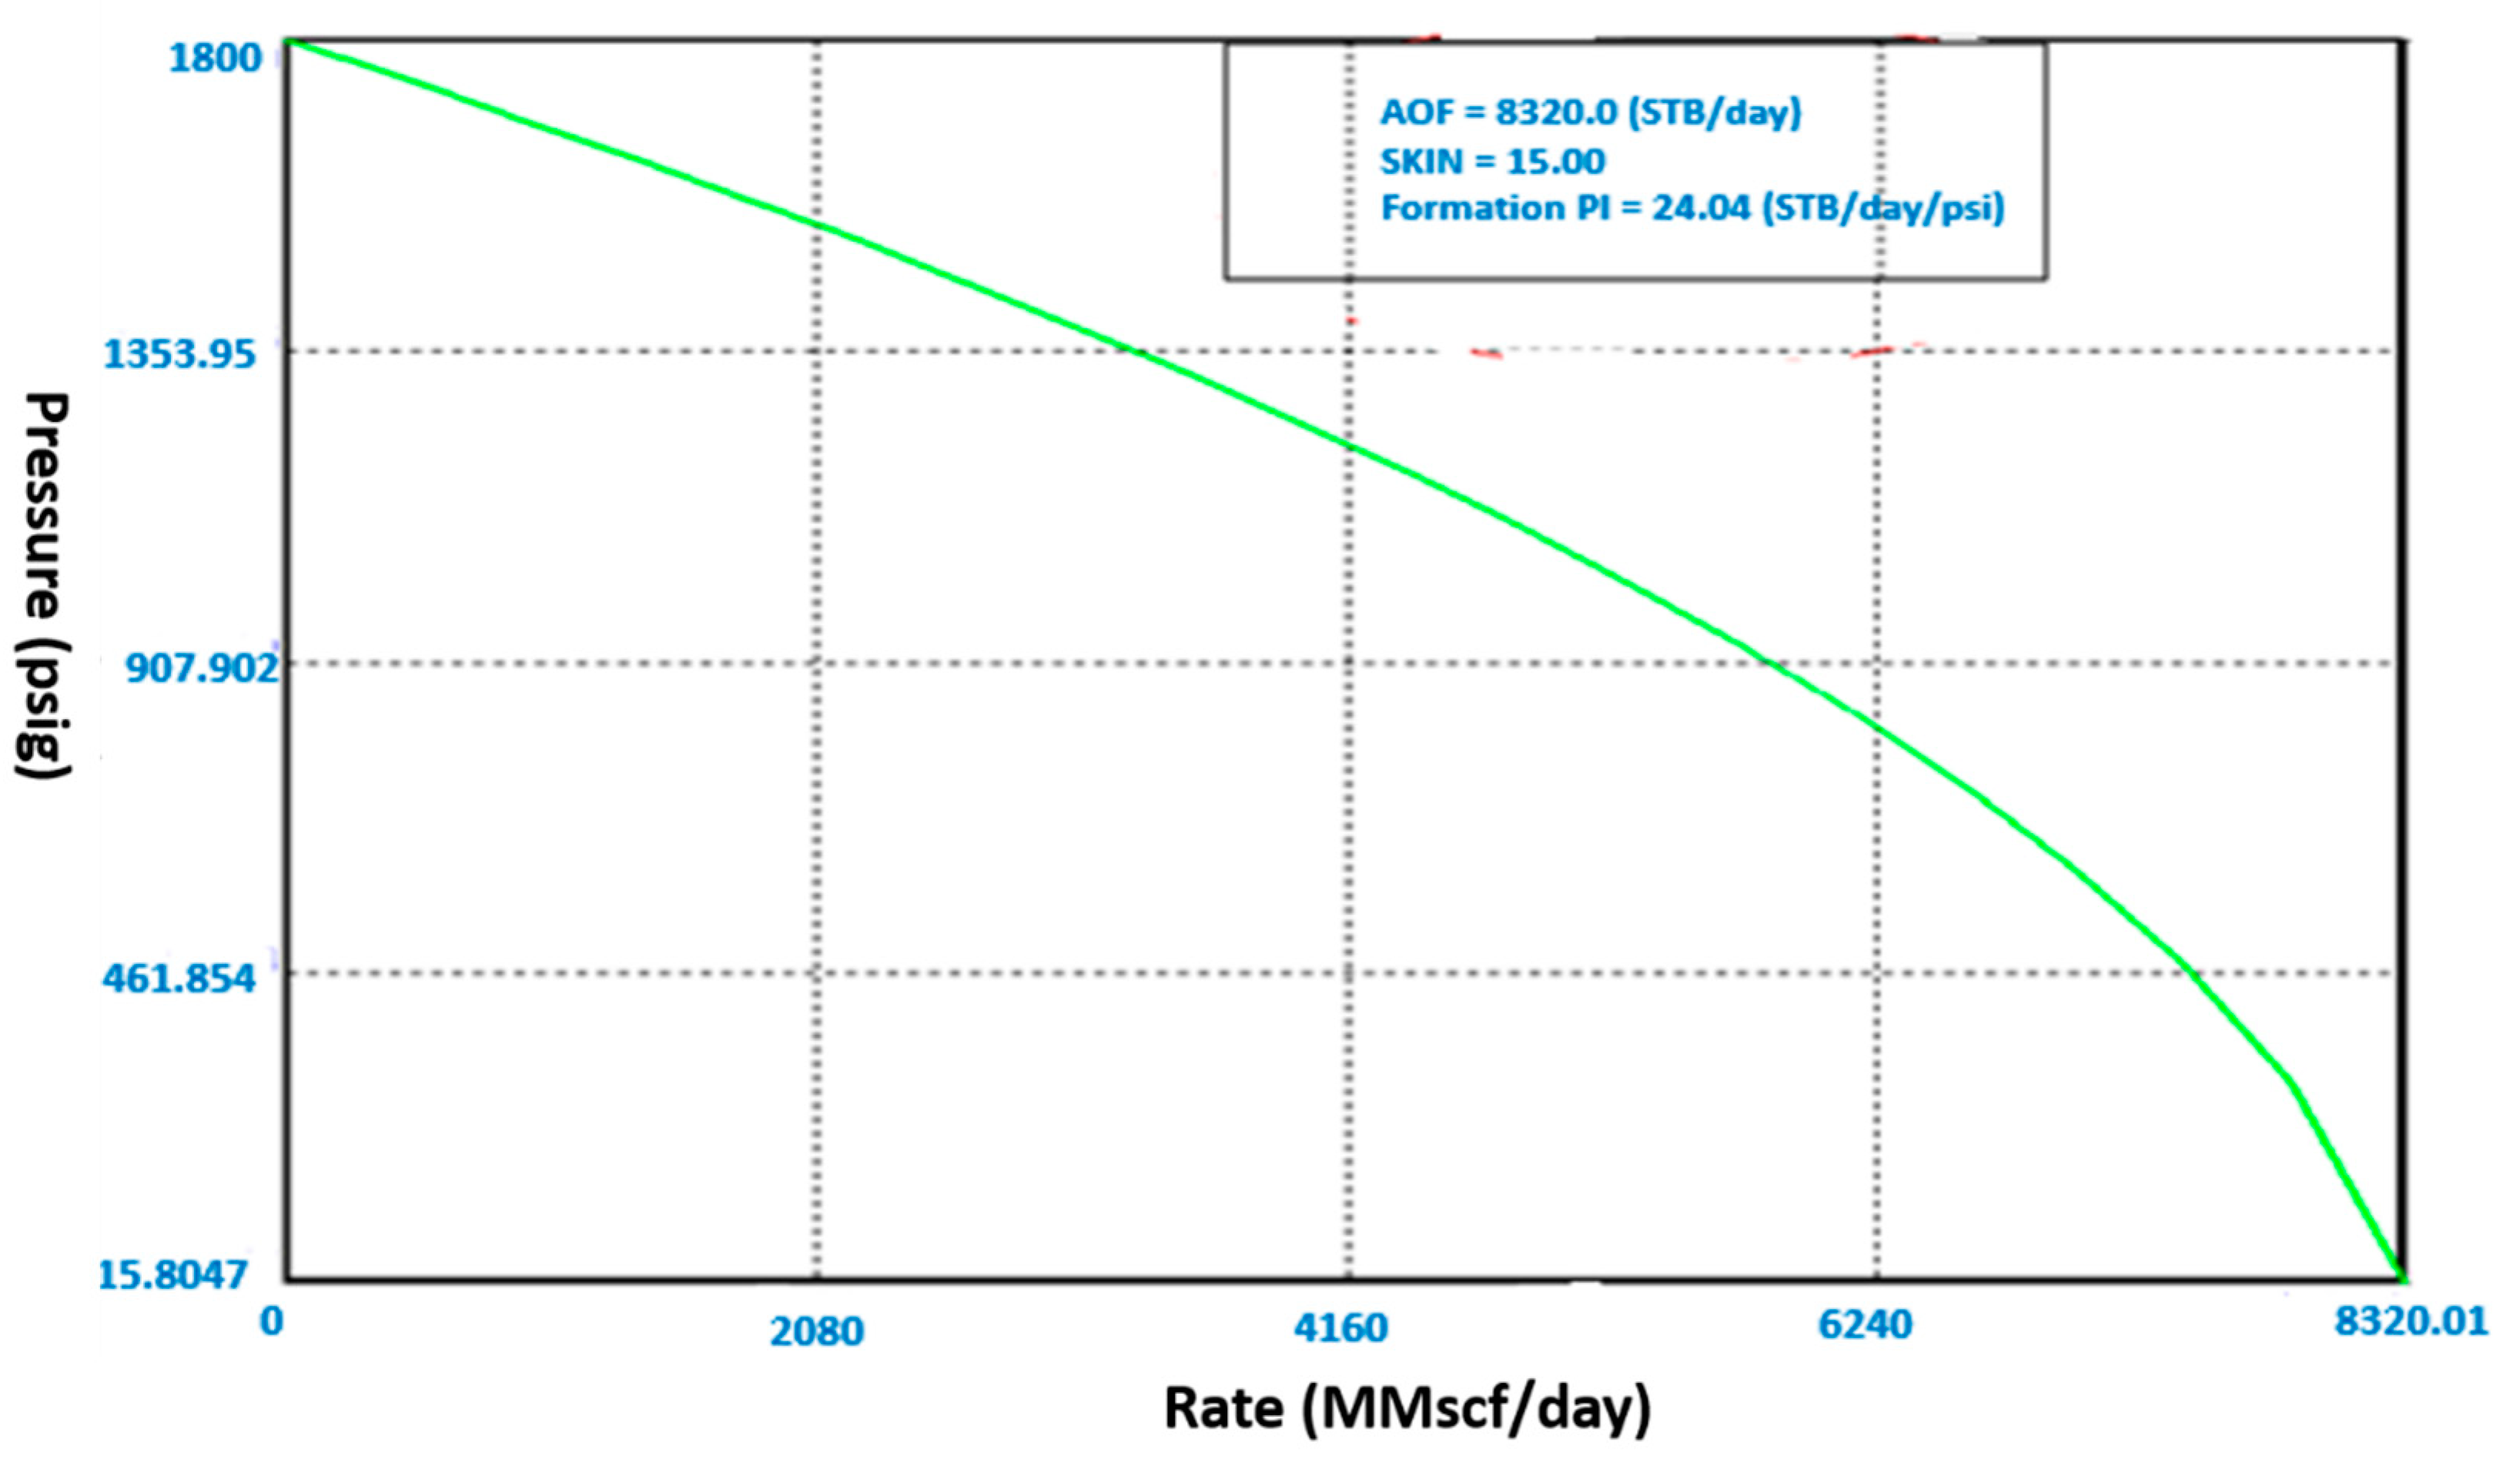
PROSPER creates a well inflow performance relationship (IPR) curve after one builds the model one wants and enters the input parameters one wants. Darcy’s model was used in this case because the reservoir was not full enough to hold all the water. As shown in
Figure 2, PROSPER was also used to create the vertical raise performance (VLP) curves, and the intersection of these curves was used to report the production rates. Correlations were changed to match the measured pressures in the reservoir. There were some adjustments made in this case to make sure that the point flow correlations matched the downhole pressure and flow rate from the assembly check. When the correlations were a little off, PROSPER was used to improve them (VLP matching). If one has a matched VLP, one can match the IPR to the downhole pressure and rate measurements.
Nonlinear regression is used to match the built and real IPRs in PROSPER. The error between the measured and calculated pressures is found through a correlation. In this way, the gravity and friction terms of the pressure loss equation are changed until the calculated and measured pressures match up at 1 psi or unit area intervals, at which point the iteration process is over after 50 rounds of changes. First, two parameters are changed. Then, the gravity and friction terms are calculated until they come up with a value that is 10% more than unity. This is what we found out when we looked at the VLP match. It was between 0.9 and 1.1, which means that the Duns and Ross correlation had changed. This makes the match even better.
5. Sensitivity Analysis
A sensitivity analysis over the selected reservoir model is performed over the selected parameters. The ranges of those selected parameters are mentioned in
Table 3.
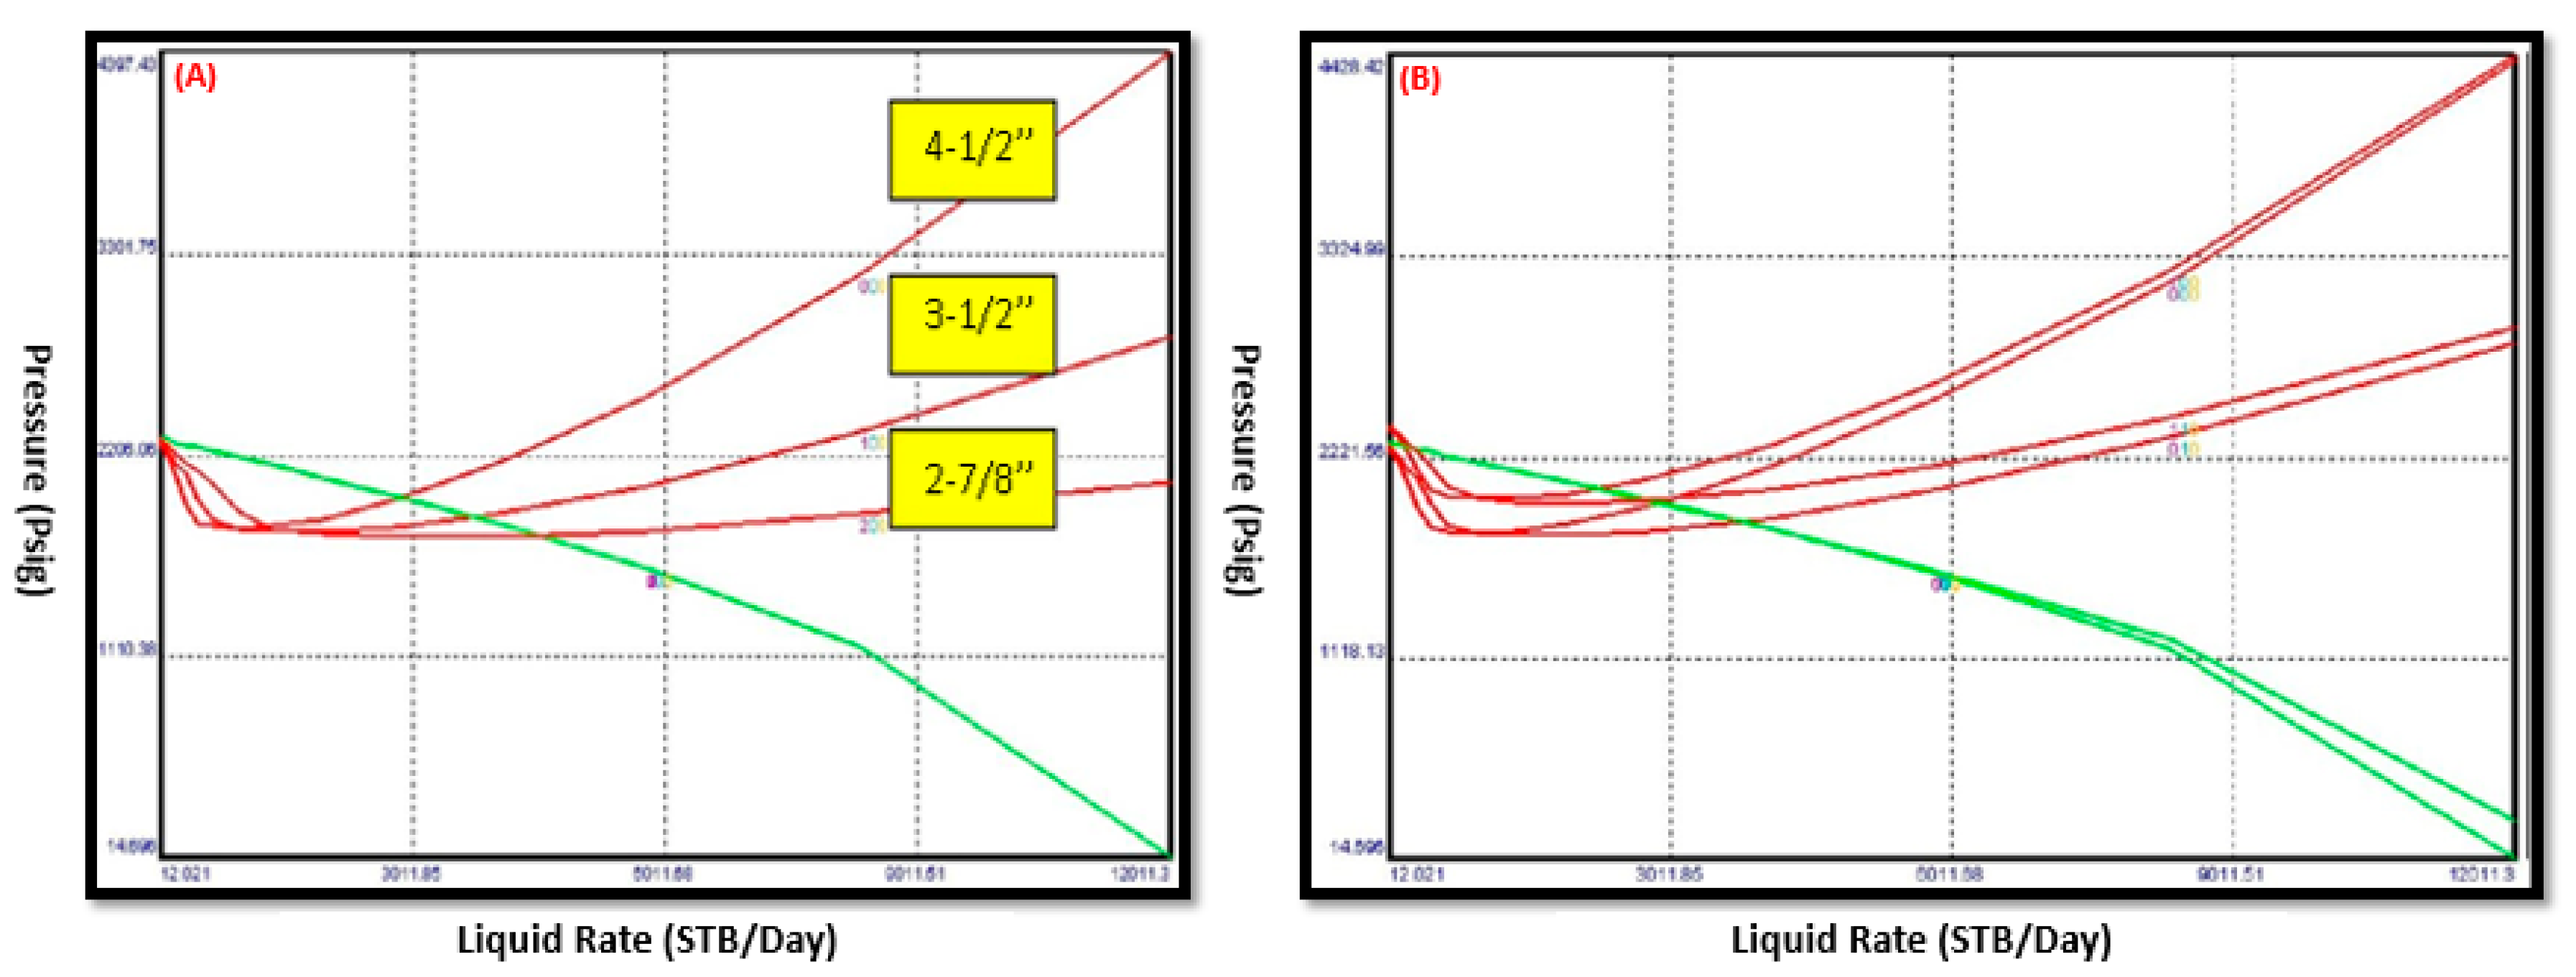
The first sensitivity analysis was performed based on tubing size, so that the best tubing size could be chosen for the project.
Figure 5A shows that with bigger tubing, the rate of production also goes up. This is because more fluid is flowing through the tube.
Figure 5B shows how well the tubing works with more water cut. In
Figure 5A, red lined indicates the increase in productivity with increase in tubing size and green line indicates the decrease trend of GOR value. Flowing gradient survey (FGS) and GRE correlation were used to study the impact of tubing performance with increase in water cut (
Figure 5B). Redlines in Figue 5B, indicates the increase in tubing performance with respect to FGS and GRE correlation. It was observed that the GRE correlation gives a better fit than FGS correlation. The green lines indicate the reduction in GOR for the above said two correlations.


 ,
, 


