
Ultraviolet (UV) Spectrophotometric Analysis of Ketoprofen in Tablets–Statistical Validation of Proposed Method †


Biomedical Sciences Department, Faculty of Medical Bioengineering, University of Medicine and Pharmacy “Grigore T. Popa”, 16 Universitatii Street, 700115 Iasi, Romania
†
Presented at the 4th International Online Conference on Nanomaterials, 5–19 May 2023; Available online: https://iocn2023.sciforum.net.
Mater. Proc. 2023, 14(1), 60; https://0-doi-org.brum.beds.ac.uk/10.3390/IOCN2023-14442
Published: 5 May 2023
(This article belongs to the Proceedings of The 4th International Online Conference on Nanomaterials)
Abstract
:The aim of this paper was to exactly quantify the amount of pure ketoprofen within a pharmaceutical by a newly developed ultraviolet (UV) spectrophotometric method. The maximum absorption wavelength was determined to be λ = 254 nm for a ketoprofen alcoholic standard solution of 1.4 µg/mL. The applied method was statistically validated. The amount of pure ketoprofen assigned on the pharmaceutical tablet was found to be 146.326 mg ketoprofen/tablet. This obtained value was very close to the official declared content of active substance (150 mg pure ketoprofen/tablet), with an average percentage deviation of 2.45%—below the maximum value (±5%).
1. Introduction
Ketoprofen is an effective anti-inflammatory agent within the non-steroidal anti-inflammatory drugs (NSAIDs) category. From a structural point of view, it is included in the carboxylic and heterocyclic acetic acids class. It is a derivative of propionic acid (an aryl propionic acid), closely related to ibuprofen and flurbiprofen [1,2]. Ketoprofen has strong anti-inflammatory action, comparable to indomethacin, as well as important antipyretic and analgesic effects. It equally inhibits both cyclooxygenase isoforms (COX-1 and COX-2) as well as lipoxygenase. By inhibiting both cyclooxygenase COX-1 and COX-2, there is a considerable decrease in the synthesis of precursors of prostaglandins and thromboxane [1,2,3,4,5,6,7,8,9]. The pronounced decrease in prostaglandin synthesis, by effectively blocking prostaglandin-synthase activity, is directly responsible for the therapeutic effects of another anti-inflammatory drug—ibuprofen. In addition to this therapeutic effect, manifested by ibuprofen, ketoprofen also causes an important decrease in thromboxane—A2 synthesis by blocking the thromboxane-synthase enzyme, thereby effectively inhibiting platelet aggregation [1,2,3,4,5,6,7,8,9]. A 2013 systematic review indicated that “The efficacy of orally administered Ketoprofen in relieving moderate-severe pain and improving functional status and general conditions was significantly better than that of Ibuprofen and/or Diclofenac” [4].The anti-inflammatory effects of ketoprofen are believed to be due to the effective inhibition of cyclooxygenase (COX-2), which is an enzyme involved in prostaglandin synthesis via the arachidonic acid pathway. This results in a pronounced decrease in levels of prostaglandins that mediate pain, fever and inflammation. Ketoprofen, as a non-specific cyclooxygenase inhibitor and inhibitor of COX-1, is thought to confer some of its side effects such as gastro intestinal (G.I.) upset (dyspepsia, diarrhea, abdominal pain, constipation, flatulence) and ulceration. Ketoprofen it is thought to have anti-bradykinin activity as well as lysosomal membrane-stabilizing action. Antipyretic effects may be due to direct action on the hypothalamus, resulting in an increased peripheral blood flow, vasodilatation and subsequent heat dissipation [1,2,3,4,5,6,7,8,9]. It is highly recommended in the treatment of mild to moderate pain caused by inflammation. Ketoprofen is one of the most important drugs successfully administered for the treatment of rheumatoid polyarthritis, spondylitis, arthrosis, disc diseases, acute arthritis, gut attacks [3,4,5,6,7]. It is very effective for the symptomatic treatment of acute and chronic rheumatoid arthritis, osteoarthritis, ankylosing spondylitis, primary dysmenorrhea and mild to moderate pain associated with musculotendinous trauma (sprains and strains), postoperative pain (including dental surgery) and postpartum pain [3,4,5,6,7,8]. A very important aspect of pharmaceutical chemistry, as well as chemical and biochemical laboratory work, has always been the quantitative spectrophotometric analysis of ketoprofen from various studied samples, such as the various brands of pharmaceuticals, as well as from biological fluids in chronic and acute intoxications [5,10]. The aim of this research was to exactly quantify the amount of pure ketoprofen within a pharmaceutical via the use of a newly developed ultraviolet (UV) spectrophotometric method. This experimental procedure has been designed, created, developed and proposed to be statistically validated [11,12,13,14] and subsequently applied successfully to the quantitative analysis of ketoprofen from various samples.
2. Materials and Methods
2.1. Method Description
Pure ketoprofen from the tablets of a chosen pharmaceutical was quantitatively analyzed by UV spectrophotometry to the maximum absorption wavelength of λ max. = 254 nm, in relation to absolute methanol as a reagent blank.
2.2. Chemical Reagents and Equipment
Ketoprofen stock solution 1000 µg/mL (0.1%) was prepared from ketoprofen crystalline pure standard powder (Merck®), dissolved in absolute methanol as solvent. Ketoprofen working solution 200 µg/mL was directly obtained by dilution (1:5) with absolute methanol from the stock solution 1000 µg/mL. A series of nine pure standard ketoprofen solutions with concentrations that ranged between 2.0 µg/mL–80 µg/mL were obtained from the working 200 µg/mL ketoprofen solution. Analyzed sample solution was obtained in absolute methanol from the tablets of a pharmaceutical. CECIL CE 3200 UV-VIS Spectrophotometer was provided with four quartz tubs.
2.3. The Design of UV Absorption Spectrum and Determination of the Maximum Absorption Wavelength of a Pure Ketoprofen Standard Solution Plotting: The Calibration Graph and Quantitative Sample Analysis
The absorption spectrum was plotted and maximum absorbance wavelength was determined to be λ = 254 nm, for a ketoprofen pure standard solution of Ce = 1.4 µg/mL = 0.00014% = 1.4 × 10 −4%. Maximum absorbance value corresponding to the wavelength λ = 254 nm was A = 0.1266. Specific absorbance (specific absorptivity coefficient) was calculated to be a = A/Ce = 0.1266/0.00014 = 904.2857. Specific absorbance was a = 904.2857.
- (a)
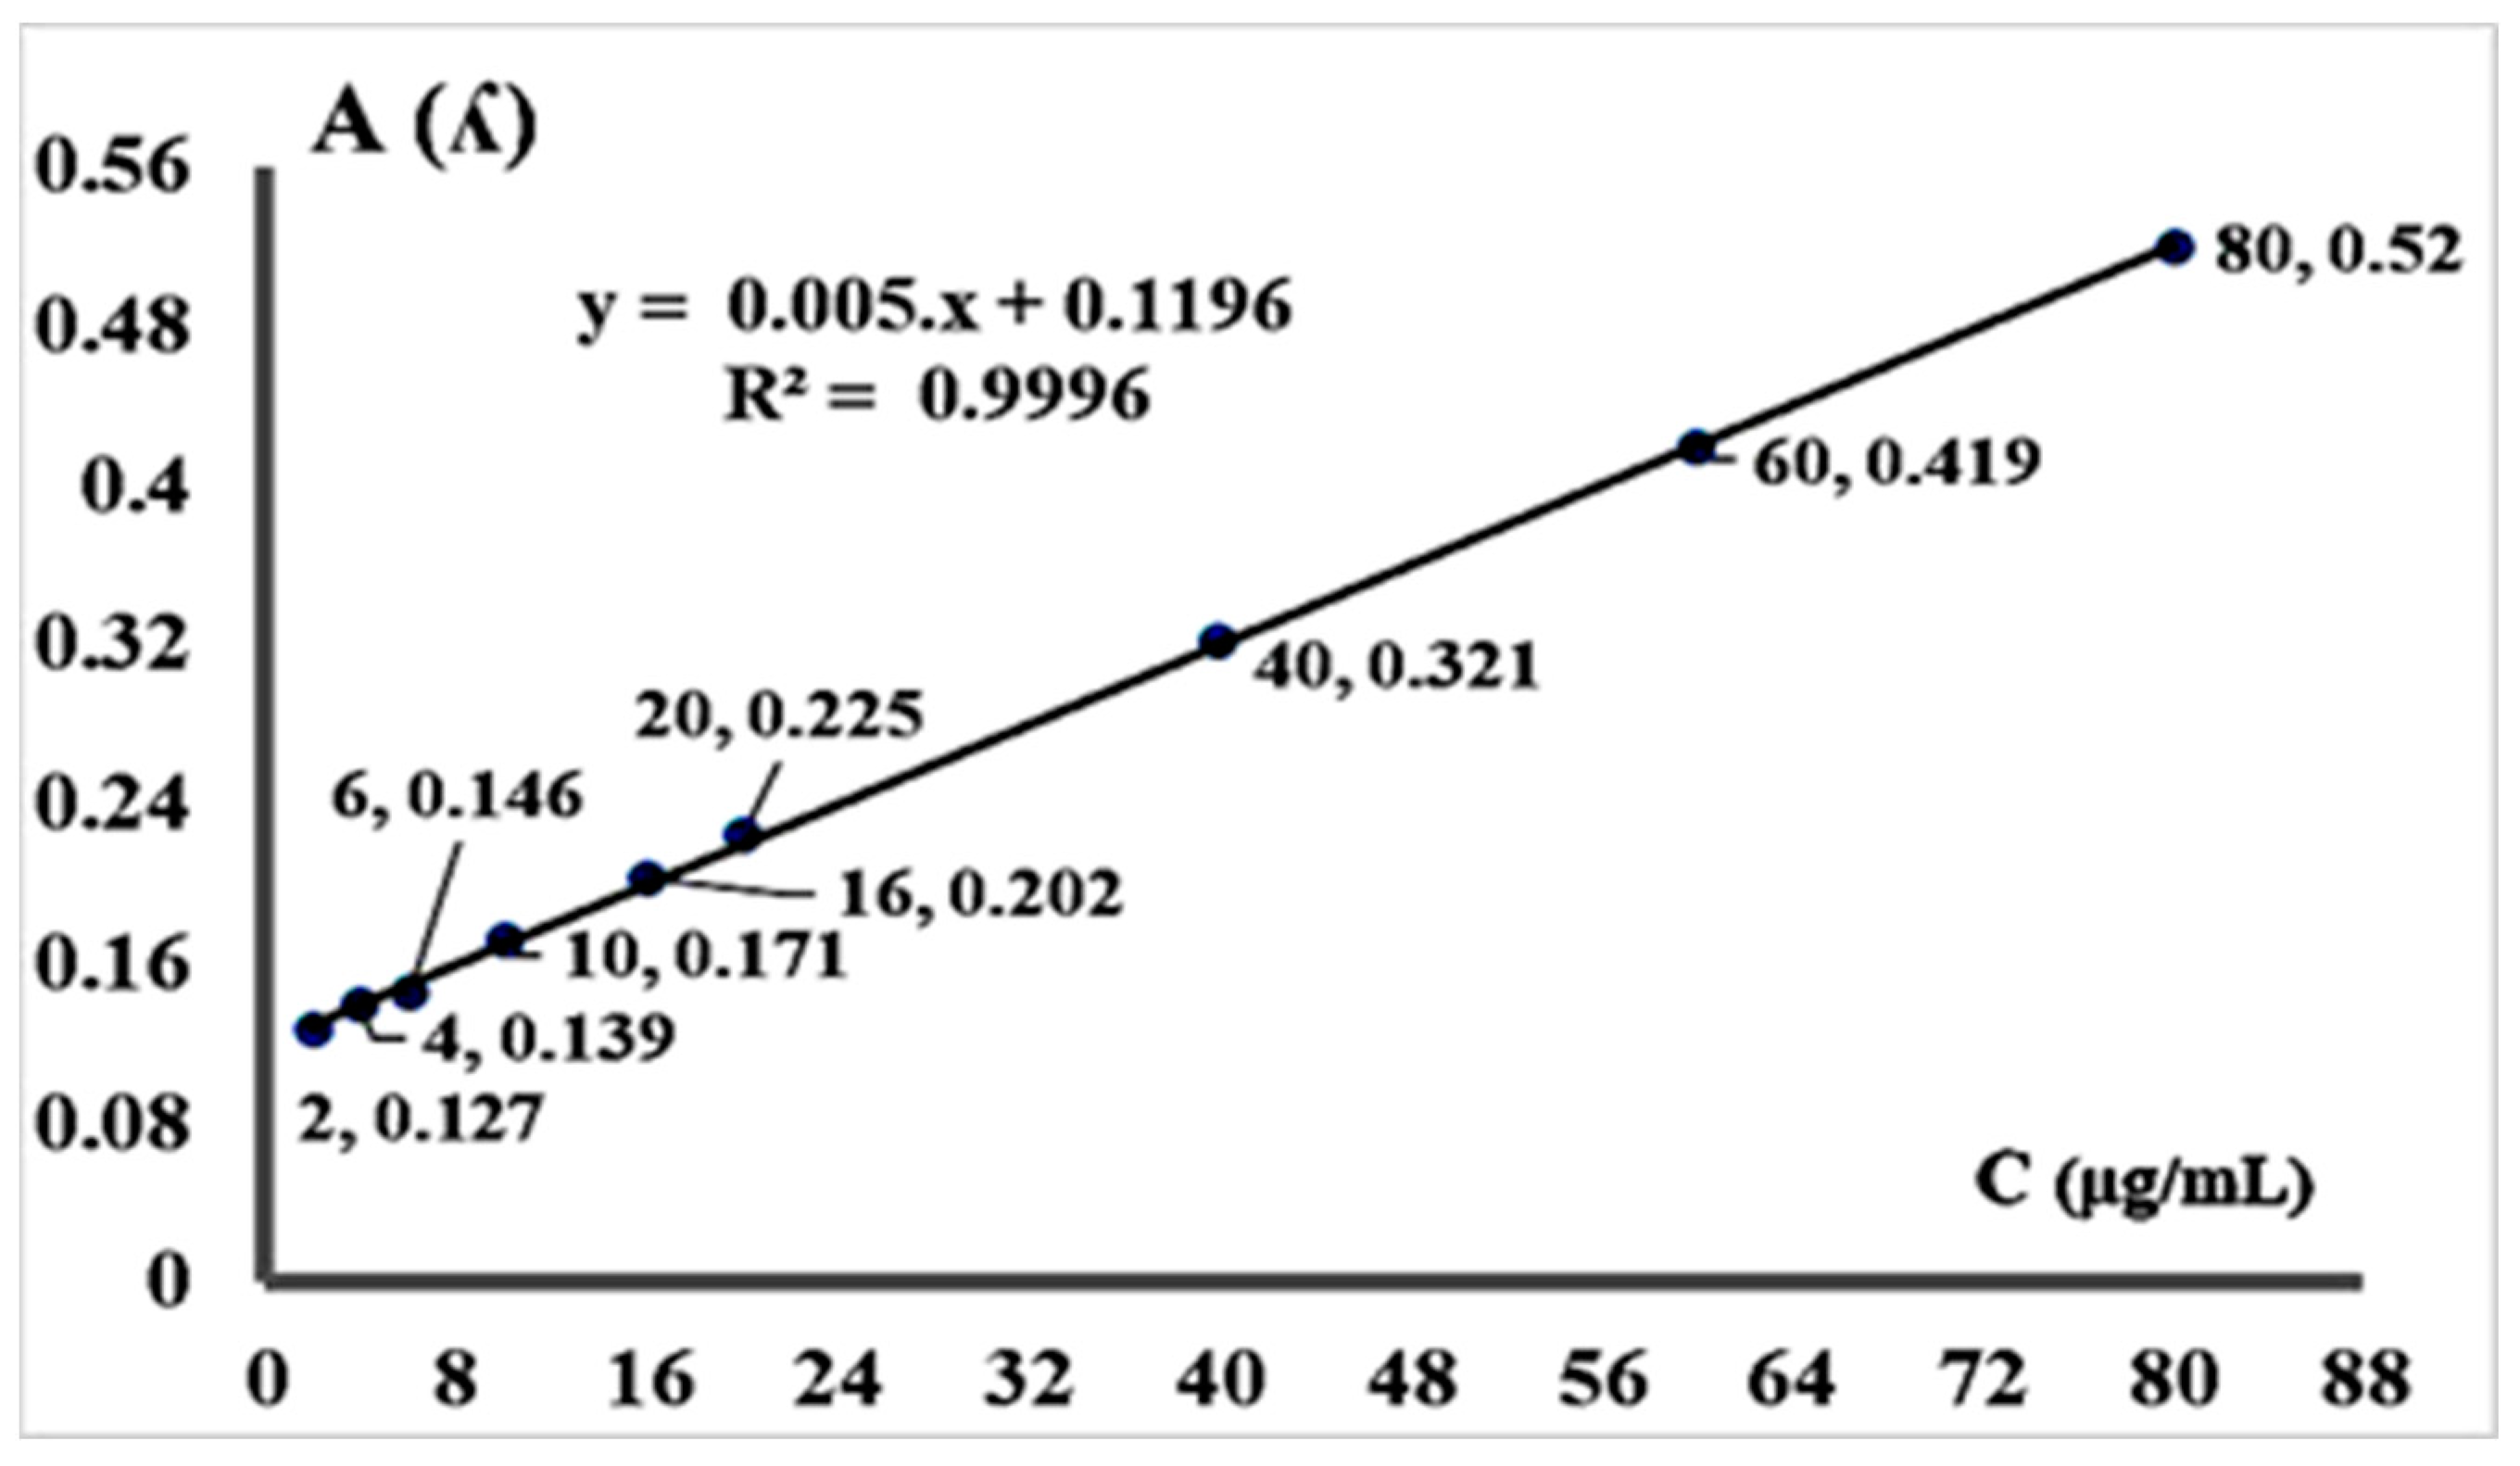
- Working procedure: preparation of ketoprofen standard solutions (2 µg/mL–80 µg/mL) and spectrophotometer calibration to λ = 254 nm, against absolute methyl alcohol as a blank. An amount of 0.05 g of ketoprofen pure crystalline standard powder, supplied by Merck®, was exactly weighed and combined with a necessary volume of absolute methyl alcohol in a Berzelius beaker, under vigorous stirring until complete dissolution was achieved. The obtained alcoholic obtained was transferred to a V = 50 mL volumetric flask under stirring conditions and then made up to the mark with absolute methanol. Thus, a stock ketoprofen solution 1000 µg/mL (0.1%) was synthetized. A working solution of 200 µg/mL was prepared directly from this stock solution by accurately measuring 10 mL solution at 1000 µg/mL, and transferring this into another V1 = 50 mL volumetric flask, which was made up to the mark with absolute methyl alcohol. A series of nine volumes, taken from this working obtained solution of 200 µg/mL, were accurately measured and quantitatively added into v = 10 mL different graduated glass tubes under stirring. Each of the nine volumes was brought to 10 mL with absolute methyl alcohol. The mean absorbances of nine prepared ketoprofen standard solutions were exactly measured, according to their concentrations, in relation to absolute methanol as a blank, at λ = 254 nm. These values are described in Figure 1 and Table 1.
- (b)
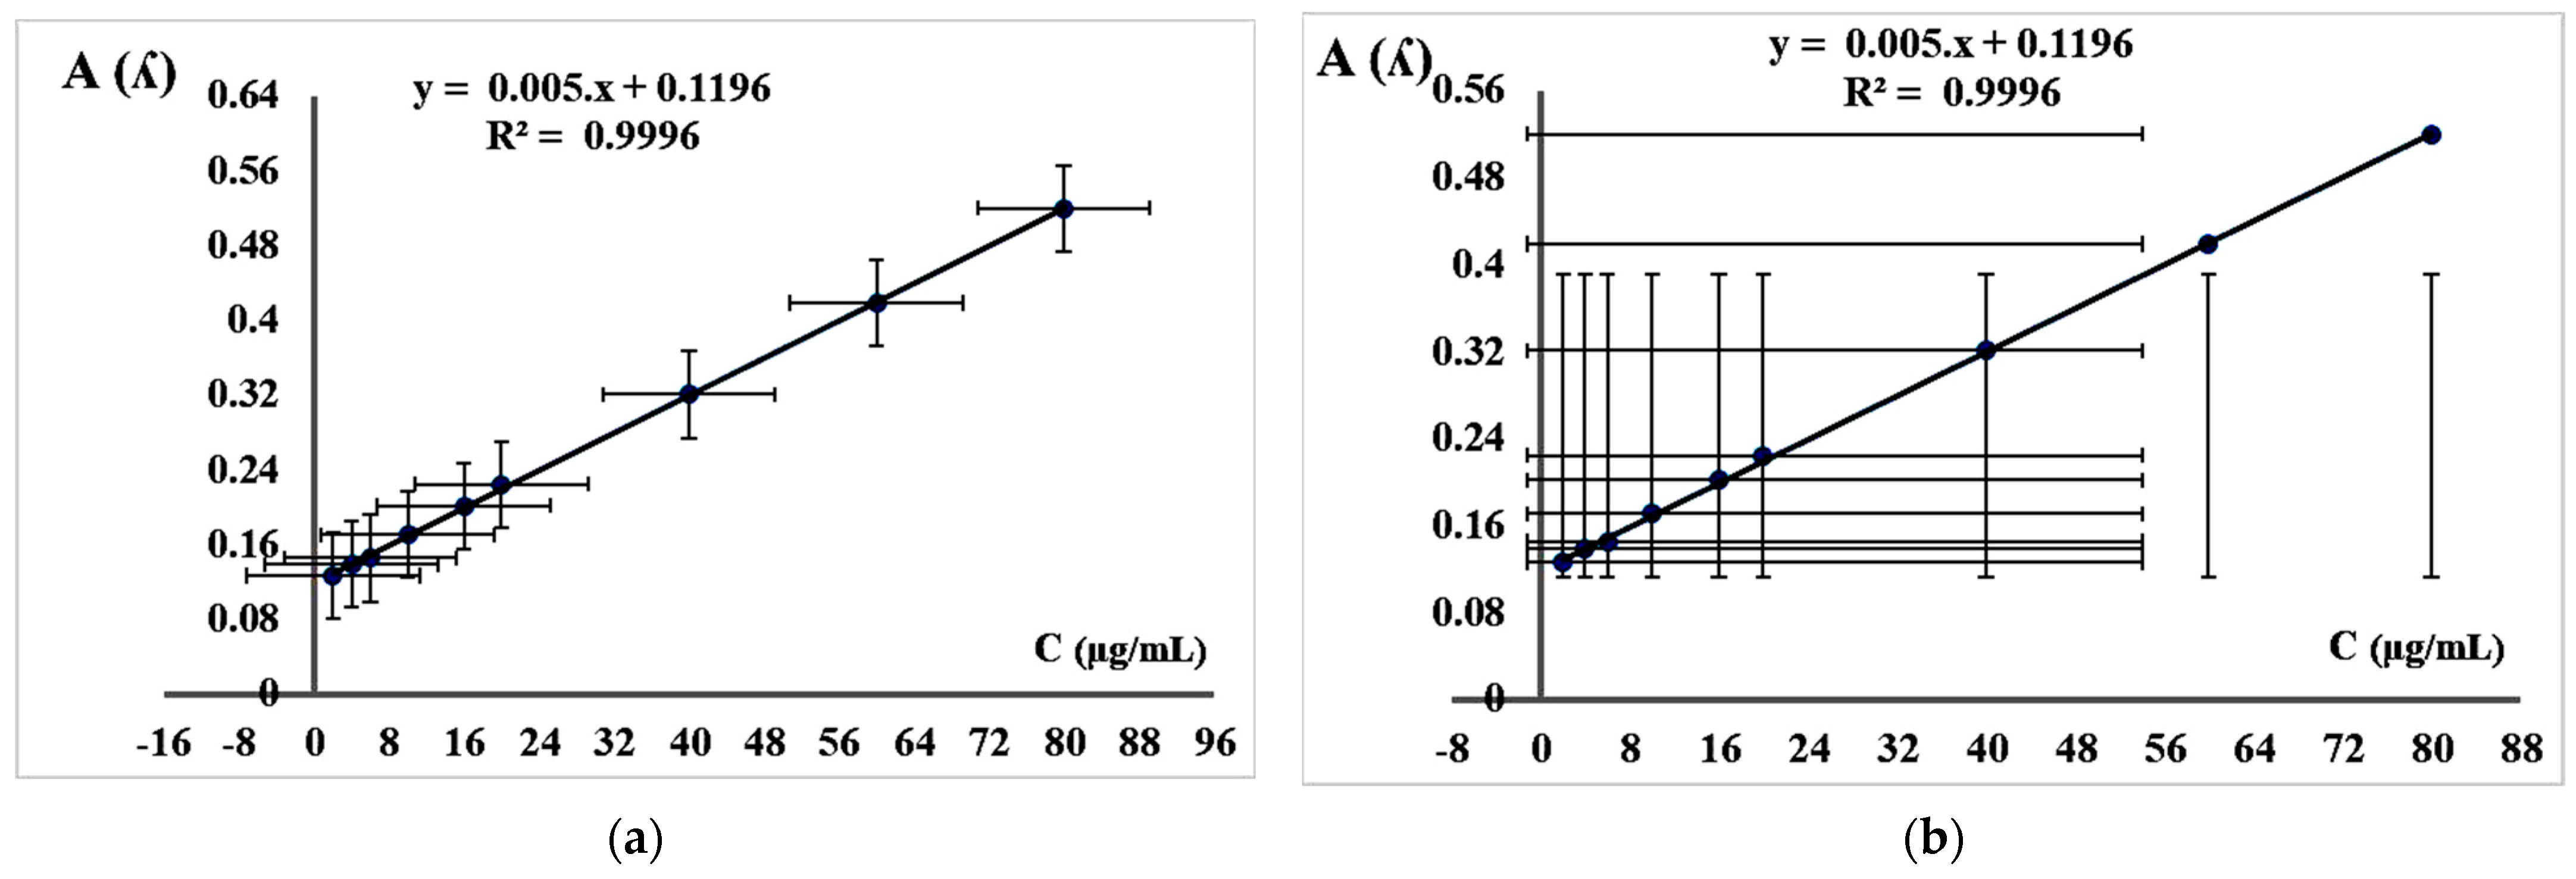
- Statistical study of the method linearity–calculation methods of detection limit (LD) and quantitation limit (LQ), and statistical analysis of some important parameters of the linear regression. According to the mean absorbance values of nine standard ketoprofen solutions obtained and rendered in Figure 1 and Table 1, the calibration graph was plotted and is detailed in (Figure 1). A statistical study was undertaken from the point of view of the standard error analysis of the regression line (SE) and the standard deviations (SD). The suggestive graphics and statistical obtained values are detailed in Figure 2 and Table 1. The detection Limit (LD), as the smallest amount of analyte that could be detected in a known sample, compared to a blank under established experimental conditions, was evaluated using equation:Quantitation limit (LQ), which was described by the lowest analyte concentration in a sample that could be quantified with a statistically acceptable precision and accuracy under the same experimental conditions, was calculated as follows [11,12,14]:LD = 3 × standard error (SE)/slopeLQ = 10 × standard error (SE)/slopeThe standard deviation (SD) [11,12,13,14] is a measure of how widely the values of a known sample are dispersed from the average value (the mean). Standard deviation was calculated using “STDEV“ in Microsoft Excel (Table 1). Standard error of the regression line (SE) is the average distance that the observed values fall from the regression line. The standard error of the linear regression (SE) provides the absolute measure of the typical distance that the data points fall from the regression line [11,12,13]. The population covariance, analyzed with “COVARIANCE P” function in Microsoft Excel, represents the average of the products of deviations for each data point pair in two data sets. Covariance is always used to determine the direct relationship between two data sets. The sample variance was calculated with “VAR” function in Microsoft Office Excel [11,12,13,14].
- (c)
- Working procedure. Obtaining the sample ketoprofen alcoholic solution: sample ketoprofen solution was prepared by exactly weighing a = 0.0512 g of pharmaceutical triturated powder which was completely dissolved and transferred to a separate volumetric flask with a volume of VS = 50 mL with absolute methyl alcohol, diluted to the mark. From the resulting ketoprofen sample solution, a volume vS = 1.9 mL was accurately measured and transferred to a clean graduated glass tube of volume VT = 10 mL, which was made up to the mark with absolute methanol. The average mass of a pharmaceutical tablet containing ketoprofen as active substance was mT = 0.5113 g = 511.3 milligrams. According to the producing company, each pharmaceutical tablet contained 150 milligrams (mg) of pure ketoprofen as active substance. Thus, the sample ketoprofen solution was prepared and the mean absorbance AS = 0.398 was determined to be λ = 254 nm against absolute methyl alcohol as a reagent blank in the same conditions as for prepared standard solutions. Measured mean absorbance of the sample and related ketoprofen sample solution calculation values are shown in Table 2. Depending on the AS sample absorbance, pure ketoprofen concentration from the sample solution was determined to be λ = 254 nm.
3. Results and Discussion
3.1. Experimental Data Analysis
The calculation procedure of the studied sample of ketoprofen consisted of the following two stages mentioned below according to the ketoprofen sample preparation stages, described in the Section 2.3.
3.1.1. Quantitative Analysis of Sample Concentration CS (µg/mL) from the Regression Line
Calculation of sample solution concentration CS (µg/mL) from the regression line described in Figure 1 from the calibration graph y = + 0.005 x + 0.1196, where y = AS = 0.398 = sample solution absorbance has resulted in x = sample solution concentration CS (µg/mL) = (0.398–0.1196)/0.005 = 55.68 (µg/mL). Thus, CS (µg/mL) = 55.68 (µg/mL) (Table 2).
3.1.2. Analysis of the Amount of Pure Ketoprofen (Mg) on Pharmaceutical Tablet
Quantitative analysis of pure ketoprofen from the pharmaceutical tablets, as a final stage, was as follows: the amount of pure ketoprofen from the volume VT = 10 mL graduated glass test tube containing the sample solution was found to be x = CS (µg/mL). VT = 55.68 × 10 = 556.8 µg. Therefore, x = 556.8 µg of pure ketoprofen from the VT = 10 mL graduated glass test tube. The amount of pure ketoprofen in the initial volume VS = 50 mL of sample solution was X1 = (VS × x)/vS = (50 × 556.8)/1.9 = 14,652.63 µg. So X1 = 14,652.63 µg has represented pure ketoprofen from Vs = 50 mL sample solution. The amount of pure ketoprofen in the pharmaceutical tablet was found to be Y = (mT × X1)/a = (0.5113 × 146,523.63)/0.0512 = 146,325.97 µg pure ketoprofen/pharmaceutical = 146.326 mg pure ketoprofen/pharmaceutical tablet. Thus, Y = 146.326 mg pure ketoprofen/pharmaceutical tablet was the final result (Table 2). The amount of pure ketoprofen within each pharmaceutical tablet was declared by the manufacturing company to be 150 mg. The calculated value of 146.326 mg pure ketoprofen/pharmaceutical tablet was 97.55% of the content of pure ketoprofen (Table 2) declared by the manufacturer. The mean percentage deviation was only 2.45% (Table 2) from the official declared amount (150 mg) of active substance. All the statistical parameters of the regression line were calculated in Microsoft Excel 2019 and described in Table 1 (Data → Data Analysis → Regression → Regression Statistics).
3.2. Statistical Study of the Method Linearity
Calculation Methods of Detection Limit LD and Quantitation Limit LQ: Statistical Analysis of Some Important Parameters of The Regression Line
According to the Equations (1) and (2) above, the detection limit was LD = 1.7082 µg/mL and the quantitation limit was LQ = 5.694 µg/mL; both parameters fit within the normal range of values. The linear regression coefficient was R2 = 0.999631 and standard error of the regression line (SE) was 0.002847 (Table 1). The covariance coefficient Covariance P was 3.408790 and the sample variance was 0.019237, calculated with Microsoft Office Excel (Table 2).
4. Conclusions
The method utilized for ultraviolet (UV) spectrophotometric analysis of pure ketoprofen in the pharmaceutical tablets presented a very good linearity over the entire chosen concentration range (2.00 µg/mL–80.0 µg/mL). The regression coefficient was R2 = 0.999631, R2 ≥ 0.9990 and the correlation coefficient, R = 0.999816, R > 0.9990, fit perfectly within the normal range of values. Standard error of the regression line (SE = 0.002847) and the detection limit (LD) and quantitation limits (LQ) were found to be within the normal values (LD = 1.7082 µg/mL and LQ = 5.694 µg/mL). The covariance coefficient was 3.408790 and the sample variance was 0.019237. Both parameters had very small values, below the maximum allowed limit (≤5%). The amount of pure ketoprofen in the pharmaceutical tablet was found to be 146.326 mg/tablet, which is very close to the declared content of active substance (150 mg), with a mean percentage deviation of only 2.45% compared to the official declared value. This percentage was far below the maximum percentage of deviation from the declared active substance content (±5%) allowed by the Romanian Pharmacopeia and by the European and International Pharmacopoeias. Therefore, the studied pharmaceutical product falls perfectly within the limits of normal values provided by these pharmacopoeias.
Supplementary Materials
The following supporting information can be downloaded at: https://0-www-mdpi-com.brum.beds.ac.uk/article/10.3390/IOCN2023-14442/s1, Conference Poster: Ultraviolet (UV) Spectrophotometric Analysis of Ketoprofen in Tablets. Statistical Validation of Proposed Method.
Funding
This research received no external funding.
Institutional Review Board Statement
Not applicable.
Informed Consent Statement
Not applicable.
Data Availability Statement
Not applicable.
Acknowledgments
I want to express all my gratitude and special thanks to Vasile Dorneanu and Ursula Stanescu and to entire team of the Analytical Chemistry discipline, Faculty of Pharmacy of the University of Medicine and Pharmacy “Grigore T. Popa” Iasi, for all the years spent and the patience they had in teaching me and helping me to deepen all the fundamental notions and basis experimental principles of analytical chemistry.
Conflicts of Interest
The author declares no conflict of interest.
References
- Haţieganu, E.; Dumitrescu, D.; Stecoza, C. Pharmaceutical Chemistry, 2nd ed.; Medical Publishing House: Bucharest, Romania, 2010; Volume 1, pp. 592–594. [Google Scholar]
- Xu, J.; Chen, W.; Wu, L.; Chang, A.C. Adsorption and Degradation of Ketoprofen in Soils. J. Environ. Qual. 2009, 38, 1177–1182. [Google Scholar] [CrossRef] [PubMed]
- Ketoprofen. Available online: https://pubchem.ncbi.nlm.nih.gov/compound/ketoprofen#section=top (accessed on 10 March 2023).
- Sarzi-Puttini, P.; Atzeni, F.; Lanata, F.; Bagnasco, M. Efficacy of ketoprofen vs. ibuprofen and diclofenac: A systematic review of the literature and meta-analysis. Clin. Exp. Rheumatol. 2013, 31, 731–738. [Google Scholar] [PubMed]
- DRUGBANK Online. Available online: https://go.drugbank.com/drugs/DB01009 (accessed on 11 March 2023).
- Kantor, T.G. Ketoprofen: A review of its pharmacologic and clinical properties. Pharmacotherapy 1986, 6, 93–103. [Google Scholar] [CrossRef] [PubMed]
- Fokunang, C.N.; Fokunang, E.T.; Frederick, K.; Ngameni, B.; Ngadjui, B. Overview of non-steroidal anti-inflammatory drugs (nsaids) in resource limited countries. MOJ Toxicol. 2018, 4, 5–13. [Google Scholar] [CrossRef]
- Fischer, J.; Ganellin, C.R. Analogue-Based Drug Discovery; Wiley-VCH Verlag GmbH & Co. KGaA: Weinheim, Germany, 2006; p. 520. [Google Scholar]
- Mazières, B.; Rouanet, S.; Guillon, Y.; Scarsi, C.; Reiner, V. Topical ketoprofen patch in the treatment of tendinitis: A randomized, double blind, placebo controlled study. J. Rheumatol. 2005, 32, 1563–1570. [Google Scholar] [PubMed]
- Hunter, L.J.; Wood, D.M.; Dargan, P.I. The patterns of toxicity and management of acute nonsteroidal anti-inflammatory drug (NSAID) overdose. Open Access Emerg. Med. 2011, 3, 39–48. [Google Scholar] [CrossRef] [PubMed]
- Romanian Pharmacopoeia Commission National Medicines Agency. Romanian Pharmacopoeia, 10th ed.; Medical Publishing House: Bucharest, Romania, 1993; pp. 977–1293. [Google Scholar]
- Donici, E. Development and validation of spectrophotometric method in ultraviolet and visible of assay of fluocinolone acetonide from a combined ointment: Experimental study. MJHS 2017, 13, 53–58. [Google Scholar]
- Miller, J.H. Validation of Pharmacopoeial Methods. In Methods Validation in Pharmaceutical Analysis. A Guide to Best Practice; Ermer, J., Nethercote, P.W., Eds.; Wiley-VCH Verlag GmbH & Co. KGaA: Weinheim, Germany, 2005; pp. 301–335. [Google Scholar]
- European Pharmacopoeia, 10th ed.; European Directorate for the Quality of Medicine & Healthcare (edQm), Council of Europe: Strasbourg, France, 2019; Volume I, pp. 11–46.
Figure 1.
Calibration graph designed for ketoprofen standard solutions (2.0 µg/mL–80.0 µg/mL) at λ = 254 nm, against absolute methanol as a blank. The coordinates of each of the nine points located on the regression line were highlighted.
Figure 1.
Calibration graph designed for ketoprofen standard solutions (2.0 µg/mL–80.0 µg/mL) at λ = 254 nm, against absolute methanol as a blank. The coordinates of each of the nine points located on the regression line were highlighted.

Figure 2.
(a) Graphical error amount: Standard error (SE) disclosure for the calibration graph of pure ketoprofen standard solutions (2.0 µg/mL–80.0 µg/mL); (b) description of standard deviation (s) (SD) of the regression line for pure ketoprofen standard solutions (2.0 µg/mL–80.0 µg/mL) statistically meaning that both standard errors (SE) and standard deviations (SD) were found to be within the normal range of required values, as shown in Table 1.


Table 1.
Statistical values of linear regression parameters and descriptive statistics.
| Regression Statistics | Statistical Values | Ae (λ) | Ce (µg/mL) |
|---|---|---|---|
| Multiple R (correlation coefficient) | 0.999816 | 0.127 | 2.0 |
| Mean | 0.252222 | 0.139 | 4.0 |
| Median | 0.202 | 0.146 | 6.0 |
| Confidence Level (95.0%) of Absorbances | 0.106611 | 0.171 | 10.0 |
| R square, R2 (linear regression coefficient) | 0.999631 | 0.202 | 16.0 |
| Sample variance | 0.019237 | 0.225 | 20.0 |
| Adjusted R, Square R2 | 0.999579 | 0.321 | 40.0 |
| Standard Deviation (SD) | 0.138696 | 0.419 | 60.0 |
| Standard Error (SE) of the Regression Line | 0.002847 | 0.520 | 80.0 |
| Standard Error of Measured Absorbances | 0.046232 | Count: | 9.0 |
Table 2.
Concentration of the sample and the amounts of pure ketoprofen calculated/pharmaceutical tablet.
Table 2.
Concentration of the sample and the amounts of pure ketoprofen calculated/pharmaceutical tablet.
| Sample Absorbance (AS) | Sample CS (µg/mL) | mg Pure Ketoprofen/Tablet |
|---|---|---|
| 0.398 | 55.68 | 146.326 |
| Covariance P = 3.408790 | Percentage Content: 97.55% | Mean Percentage Deviation: 2.45% |
Disclaimer/Publisher’s Note: The statements, opinions and data contained in all publications are solely those of the individual author(s) and contributor(s) and not of MDPI and/or the editor(s). MDPI and/or the editor(s) disclaim responsibility for any injury to people or property resulting from any ideas, methods, instructions or products referred to in the content. |
© 2023 by the author. Licensee MDPI, Basel, Switzerland. This article is an open access article distributed under the terms and conditions of the Creative Commons Attribution (CC BY) license (https://creativecommons.org/licenses/by/4.0/).
Share and Cite
MDPI and ACS Style
Gavat, C.-C. Ultraviolet (UV) Spectrophotometric Analysis of Ketoprofen in Tablets–Statistical Validation of Proposed Method. Mater. Proc. 2023, 14, 60. https://0-doi-org.brum.beds.ac.uk/10.3390/IOCN2023-14442
AMA Style
Gavat C-C. Ultraviolet (UV) Spectrophotometric Analysis of Ketoprofen in Tablets–Statistical Validation of Proposed Method. Materials Proceedings. 2023; 14(1):60. https://0-doi-org.brum.beds.ac.uk/10.3390/IOCN2023-14442
Chicago/Turabian StyleGavat, Cristian-Catalin. 2023. "Ultraviolet (UV) Spectrophotometric Analysis of Ketoprofen in Tablets–Statistical Validation of Proposed Method" Materials Proceedings 14, no. 1: 60. https://0-doi-org.brum.beds.ac.uk/10.3390/IOCN2023-14442