
Mapping Bauxite Mining Residues Using Remote Sensing Techniques †


1
Department of Civil, Chemical, Environmental and Materials Engineering, University of Bologna, Via Terracini 28, 40131 Bologna, Italy
2
Department of Biological, Geological and Environmental Sciences, University of Bologna, Via Zamboni 67, 40126 Bologna, Italy
*
Author to whom correspondence should be addressed.
†
Presented at International Conference on Raw Materials and Circular Economy, Athens, Greece, 5–9 September 2021.
Mater. Proc. 2021, 5(1), 91; https://0-doi-org.brum.beds.ac.uk/10.3390/materproc2021005091
Published: 11 January 2022
(This article belongs to the Proceedings of International Conference on Raw Materials and Circular Economy)
Abstract
:Bauxite residuals from abandoned mining sites are both an environmental challenge and a possible source of secondary raw materials. Processing of multispectral and hyperspectral images with the best available techniques can help to produce multiscale spatial maps of elements inside and around the mining sites. The authors propose a procedure for mapping elements concentration using multiple data sets at different scales and resolutions. A comparison between multispectral Sentinel-2 images and hyperspectral PRISMA processing is performed over some case studies of bauxite residues in the Mediterranean area. Specifically, a case study from Italy is composed regarding artificial canyons created by past artisanal mining activities and by stockpiles of extracted bauxite. Hyperspectral punctual measurements (spectroradiometer surveys) were taken in various zones of the bauxite site, where infield topsoil samples were also taken for X-ray fluorescence chemical analysis. Final concentration maps were estimated by performing geostatistical techniques.
1. Introduction
Bauxite residuals from abandoned mining sites are both an environmental challenge and a possible secondary raw material resource [1]. The characterization and monitoring of these sites are often expensive and cumbersome activities, mainly based on repeated field surveys and sampling campaigns. The present work proposes a cost-effective alternative based on remote sensing. Processing of multispectral and hyperspectral images with the best available techniques can produce multiscale maps useful to investigate and monitor the spatial extent of contamination patterns around mining sites. They can also produce information about stockpiles and the presence of critical raw materials. A limited amount of field sampling and measurements is needed in order to properly calibrate and validate the remote sensing methods [2]. In the present work, the comparison between multispectral Sentinel-2 images [3] and hyperspectral PRISMA [4] processing is presented. The experimentations concentrated on a test site located in southern Italy: the abandoned bauxite mine site of Spinazzola in Alta Murgia National Park (Apulia Region), full of mining residues [5].
2. Materials and Methods
Earth observation data (EO) was selected as an appropriate data source for the raw materials and environmental analysis of bauxite residuals in the chosen area. Multispectral images provided by Copernicus with 10-m spatial resolution (Sensing: 14-09-2020) were used and compared with hyperspectral images of PRISMA satellite (Sensing: 20-09-2020) with 30-m spatial resolution.
Regarding the field data, three types of field surveys were performed:
- Grab sampling, collected during the field visit to the bauxite mine in July 2020 and used as concentration samples to map metals variability in the selected area by X-ray fluorescence (XRF) chemical analysis at Bologna University.
- The spectroradiometer surveys at two time periods: the first was performed in July 2020 to create a spectral library, after data extraction and preparation; the second was accomplished in June 2021 to validate the results and to check the spectral signature of ground control points (GCP).
- GCP measured by GPS during both the field visits, firstly for images geometry corrections and secondly to validate and check the detected features from the results.
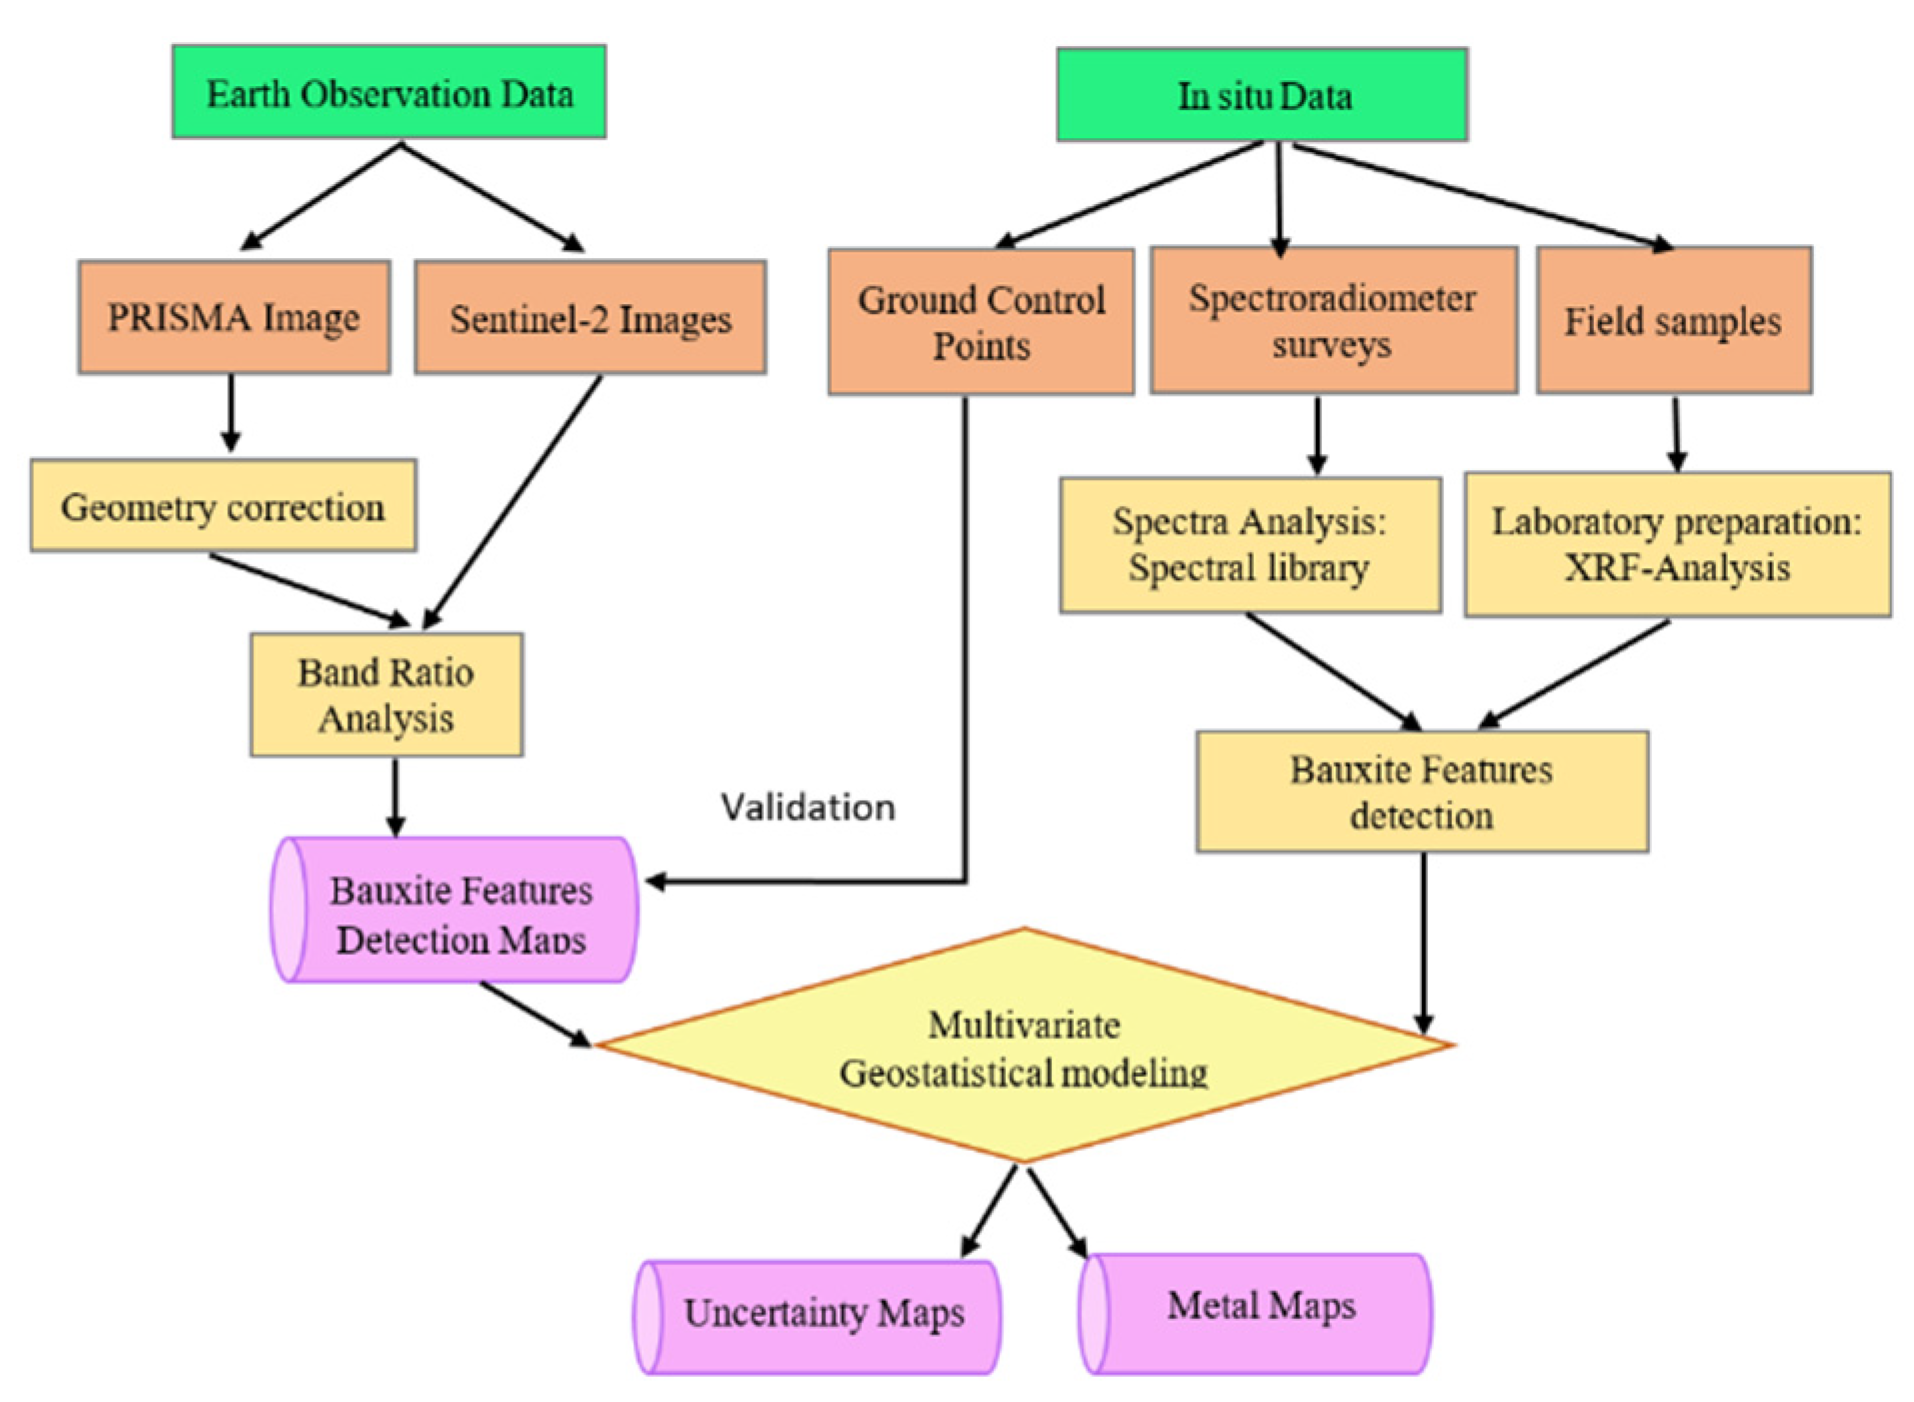
To perform the integration between EO data and in situ measurements (spectroradiometer surveys and field samples), multivariate geostatistical methods were used. The flowchart of the project methods is schematically presented in Figure 1.
2.1. Band Ratio Analysis
One of the most common methods in remote sensing studies to recognize different materials in a target area is through the analysis of band ratio images. This procedure is based on the ratio between two or more bands. These ratios can be applied for the “land” areas of interest only, excluding the vegetated, water and cloud areas. Some studies have been done on analysis of band ratio images to distinguish different geological structures and ore deposits [6,7]. This procedure involves the division (or other mathematical formulas) of two or more bands, where the band with high reflectance features of the given material is assigned to the numerator while the other band with high absorption features for the same material is assigned to the denominator [8]. As an example, Table 1 shows band combinations that fall in the wavelength range of Sentinel-2A MSI [7] and the coherent band ratios in PRISMA images tested in the present work.
2.2. Multivariate Geostatistics
Multivariate geostatistical approaches can be used to predict complex variables and to quantify uncertainty in a spatial context and in different fields, such as mineral resources evaluation, reservoir characterization, hydrology, soil and environmental sciences [9,10,11]. To evaluate the spatial variability of one or more variables (e.g., concentration of elements), the conditional geostatistical simulation can be considered as an appropriate qualitative approach leading to many features, such as the numerical modeling of a dynamic system or the economic optimization of a natural resource [12]. The advantage of the multivariate geostatistical estimation is the possibility of using the spatial correlation between remote sensing data (e.g., band ratios) and in situ samples (metals concentrations) within the coregionalization modeling [13,14]. The results will be metals variability maps, joined with uncertainty maps, showing the dispersion of extracted metals in the selected area (fulfilling the environmental objectives as well). In addition, the range of metals variability can highlight the possible new raw materials sources in the area for future exploration aims.
2.3. The Case Study
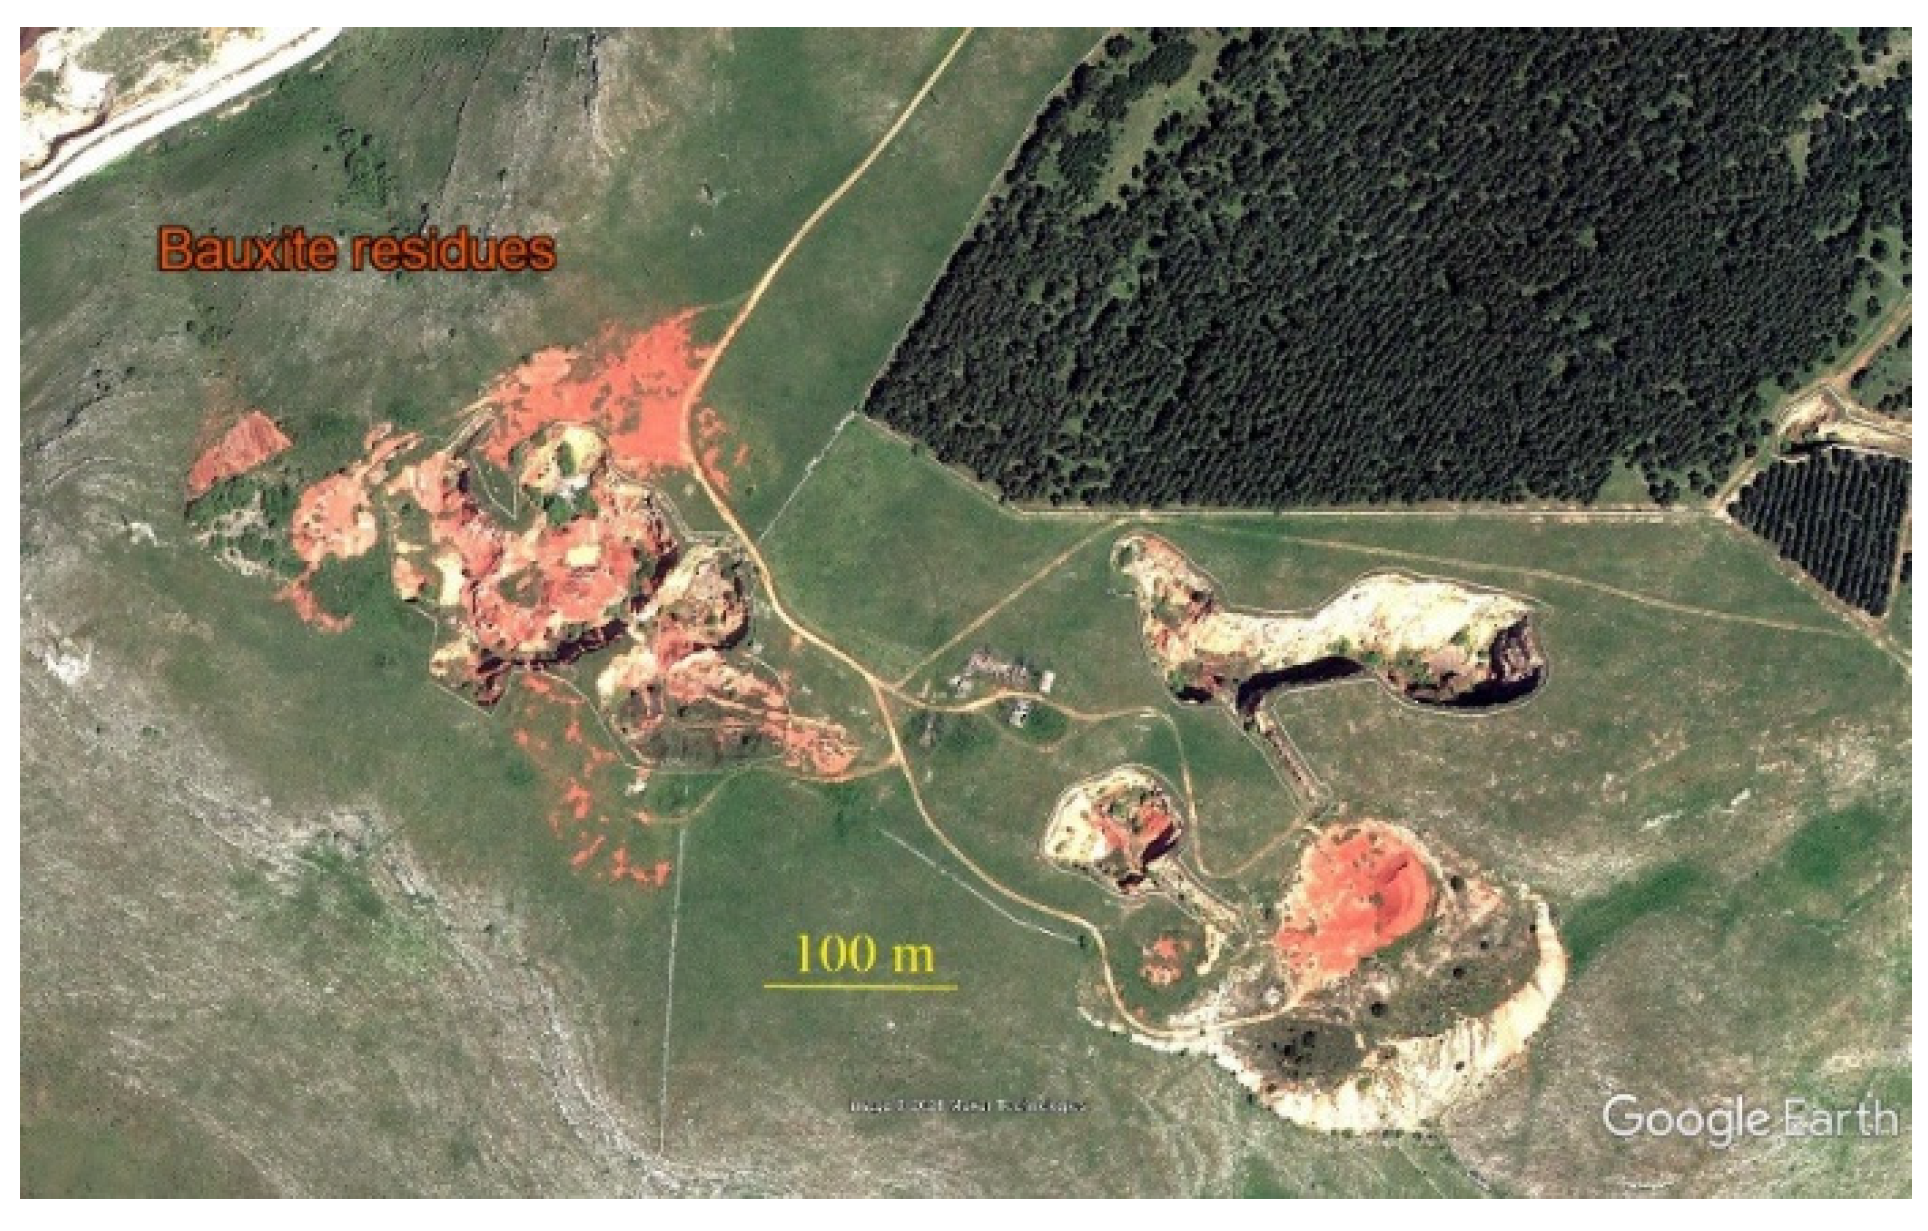
In southern Italy, late Cretaceous (late Aptian to early Coniacian) karst bauxite deposits occur in the Abruzzi Mountains in Apulia (Gargano Peninsula and the area around Murge) and Campania (Matese and Caserta Mountains) [15]. The bauxite at Spinazzola is located at latitude 40.986619 and longitude 16.181794 in Apulia (See Figure 2).
In the Spinazzola mining site, the bauxite deposit is 20 m thick and preserves both the Valanginian–Cenomanian carbonate footwall and the transgressive, shallow-water Coniacian–Campanian limestones (Calcare di Altamura Formation) at the hanging wall [16]. The only silica-bearing mineral identified within the Spinazzola karst bauxites is kaolinite, while ferruginous nodules are present in soils and residual weathered material as a result of iron migration and accumulation as Al-hematite in kaolinite-rich zones during the ferrolysis stage of oxidation–hydrolysis [17]. The bauxite at Spinazzola is texturally and mineralogically homogeneous and is dominated by boehmite, with lower amounts of hematite and kaolinite and with minor anatase. This means that the major element composition of the bauxite is dominated by SiO2, TiO2, Al2O3, and Fe2O3.
The red bauxites in the Spinazzola area are formed by a fine-grained kaolinite-rich matrix which embeds iron-rich spheroidal concretions. The genetic model of formation involves the accumulation of clay material in the karst, in situ bauxitization at the expense of the clay and late formation of the concretions in a pedogenic environment [18]. The concretions have a well-developed core formed of Al-hematite and a banded cortex of alternating Al-hematite and boehmite. The mining activity lasted for 28 years, from 1950 to 1978 [5].
3. Field Activities
3.1. Spectroradiometer Survey
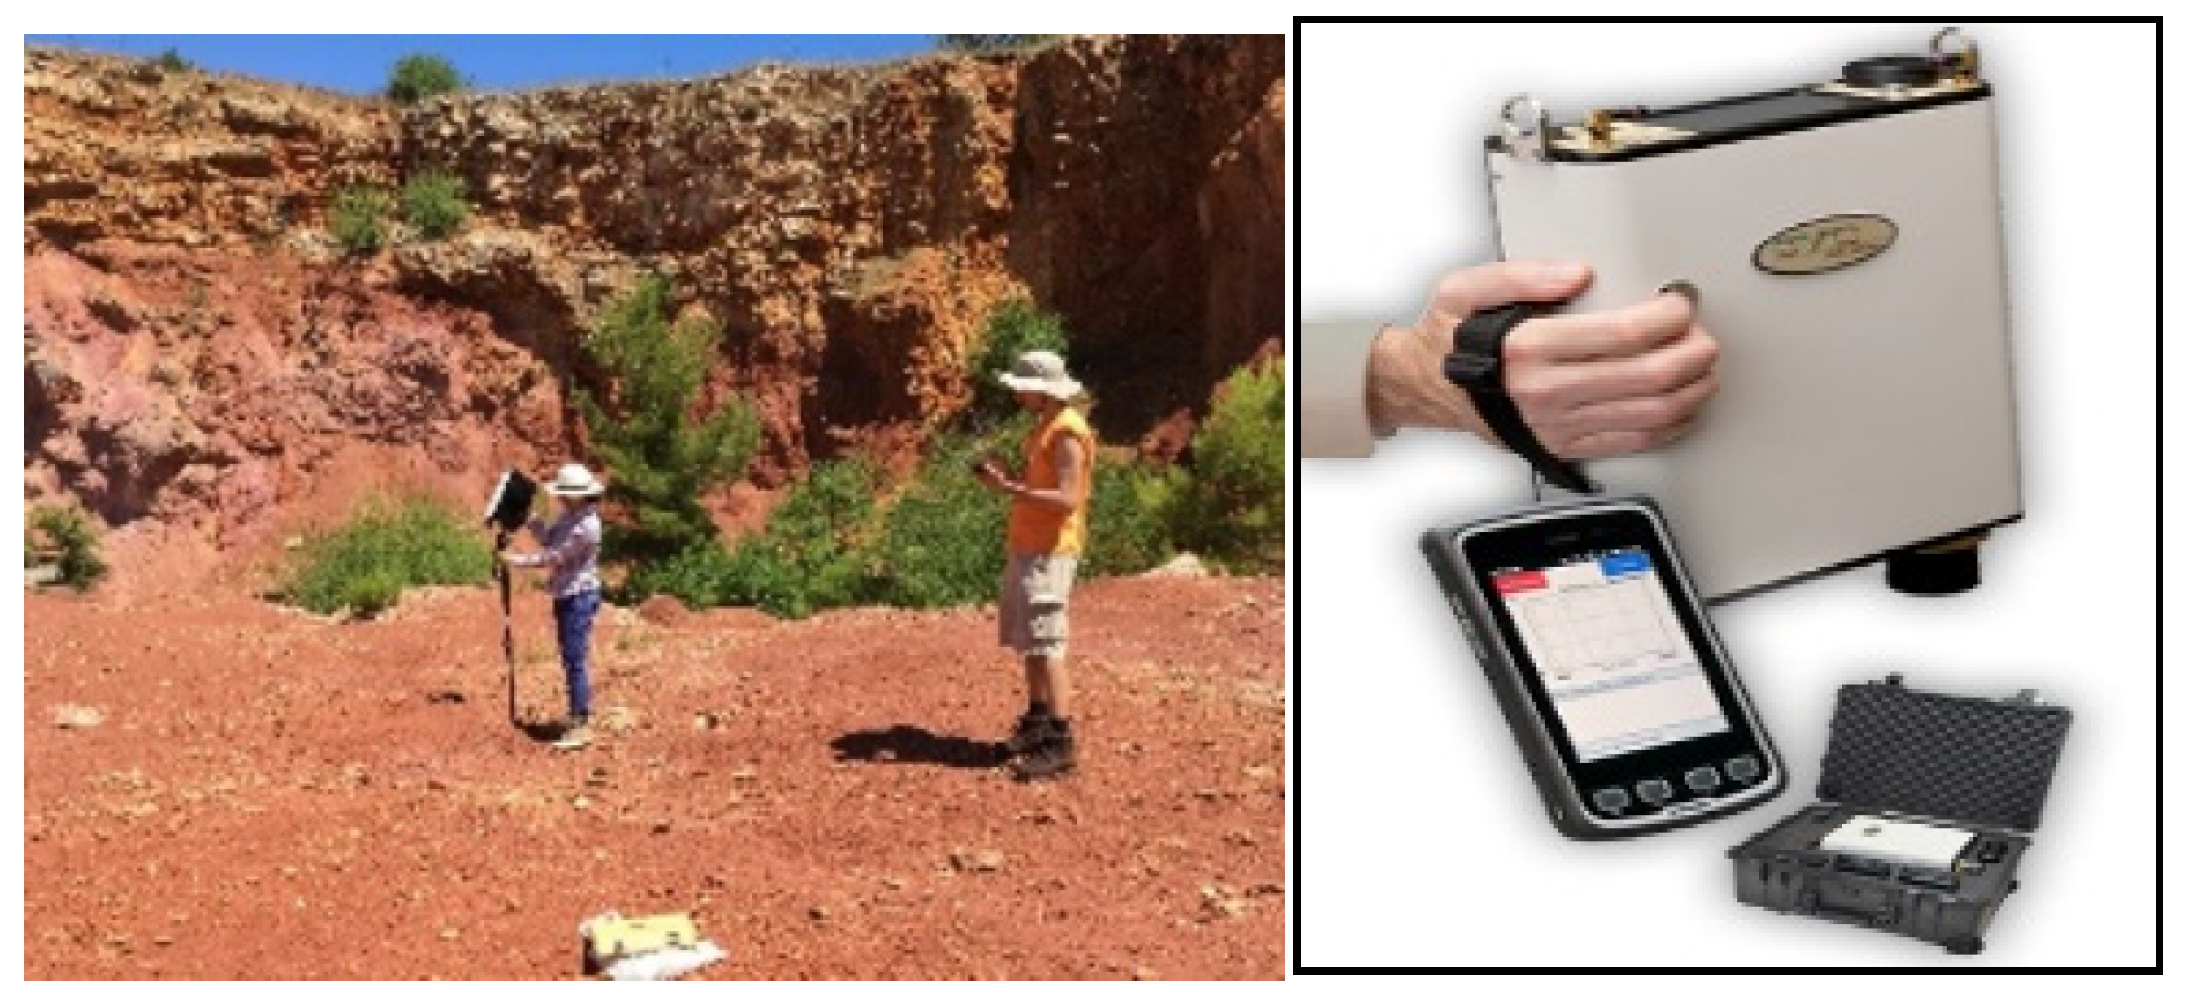
The spectral measurements were performed by field spectroradiometer during the field visit of Apulia in nine sampling points (Figure 3). The spectroradiometer used was the SVC HR-768i; it records spectra in the wavelength range between 350 and 2500 nm and is designed for field measurements. Using this instrument allowed us to have high spectral resolution reflectance curves of the investigated materials (specific points of samples) and low noise from the collected data. Besides, a GPS was used to get coordinates, and at the same time, a photo was taken for each sample point. The spectrometry measurements were done to gain the spectrum signature of the materials present in the selected area. This information is useful for the calibration and validation of remote sensing data.
3.2. Field Sampling
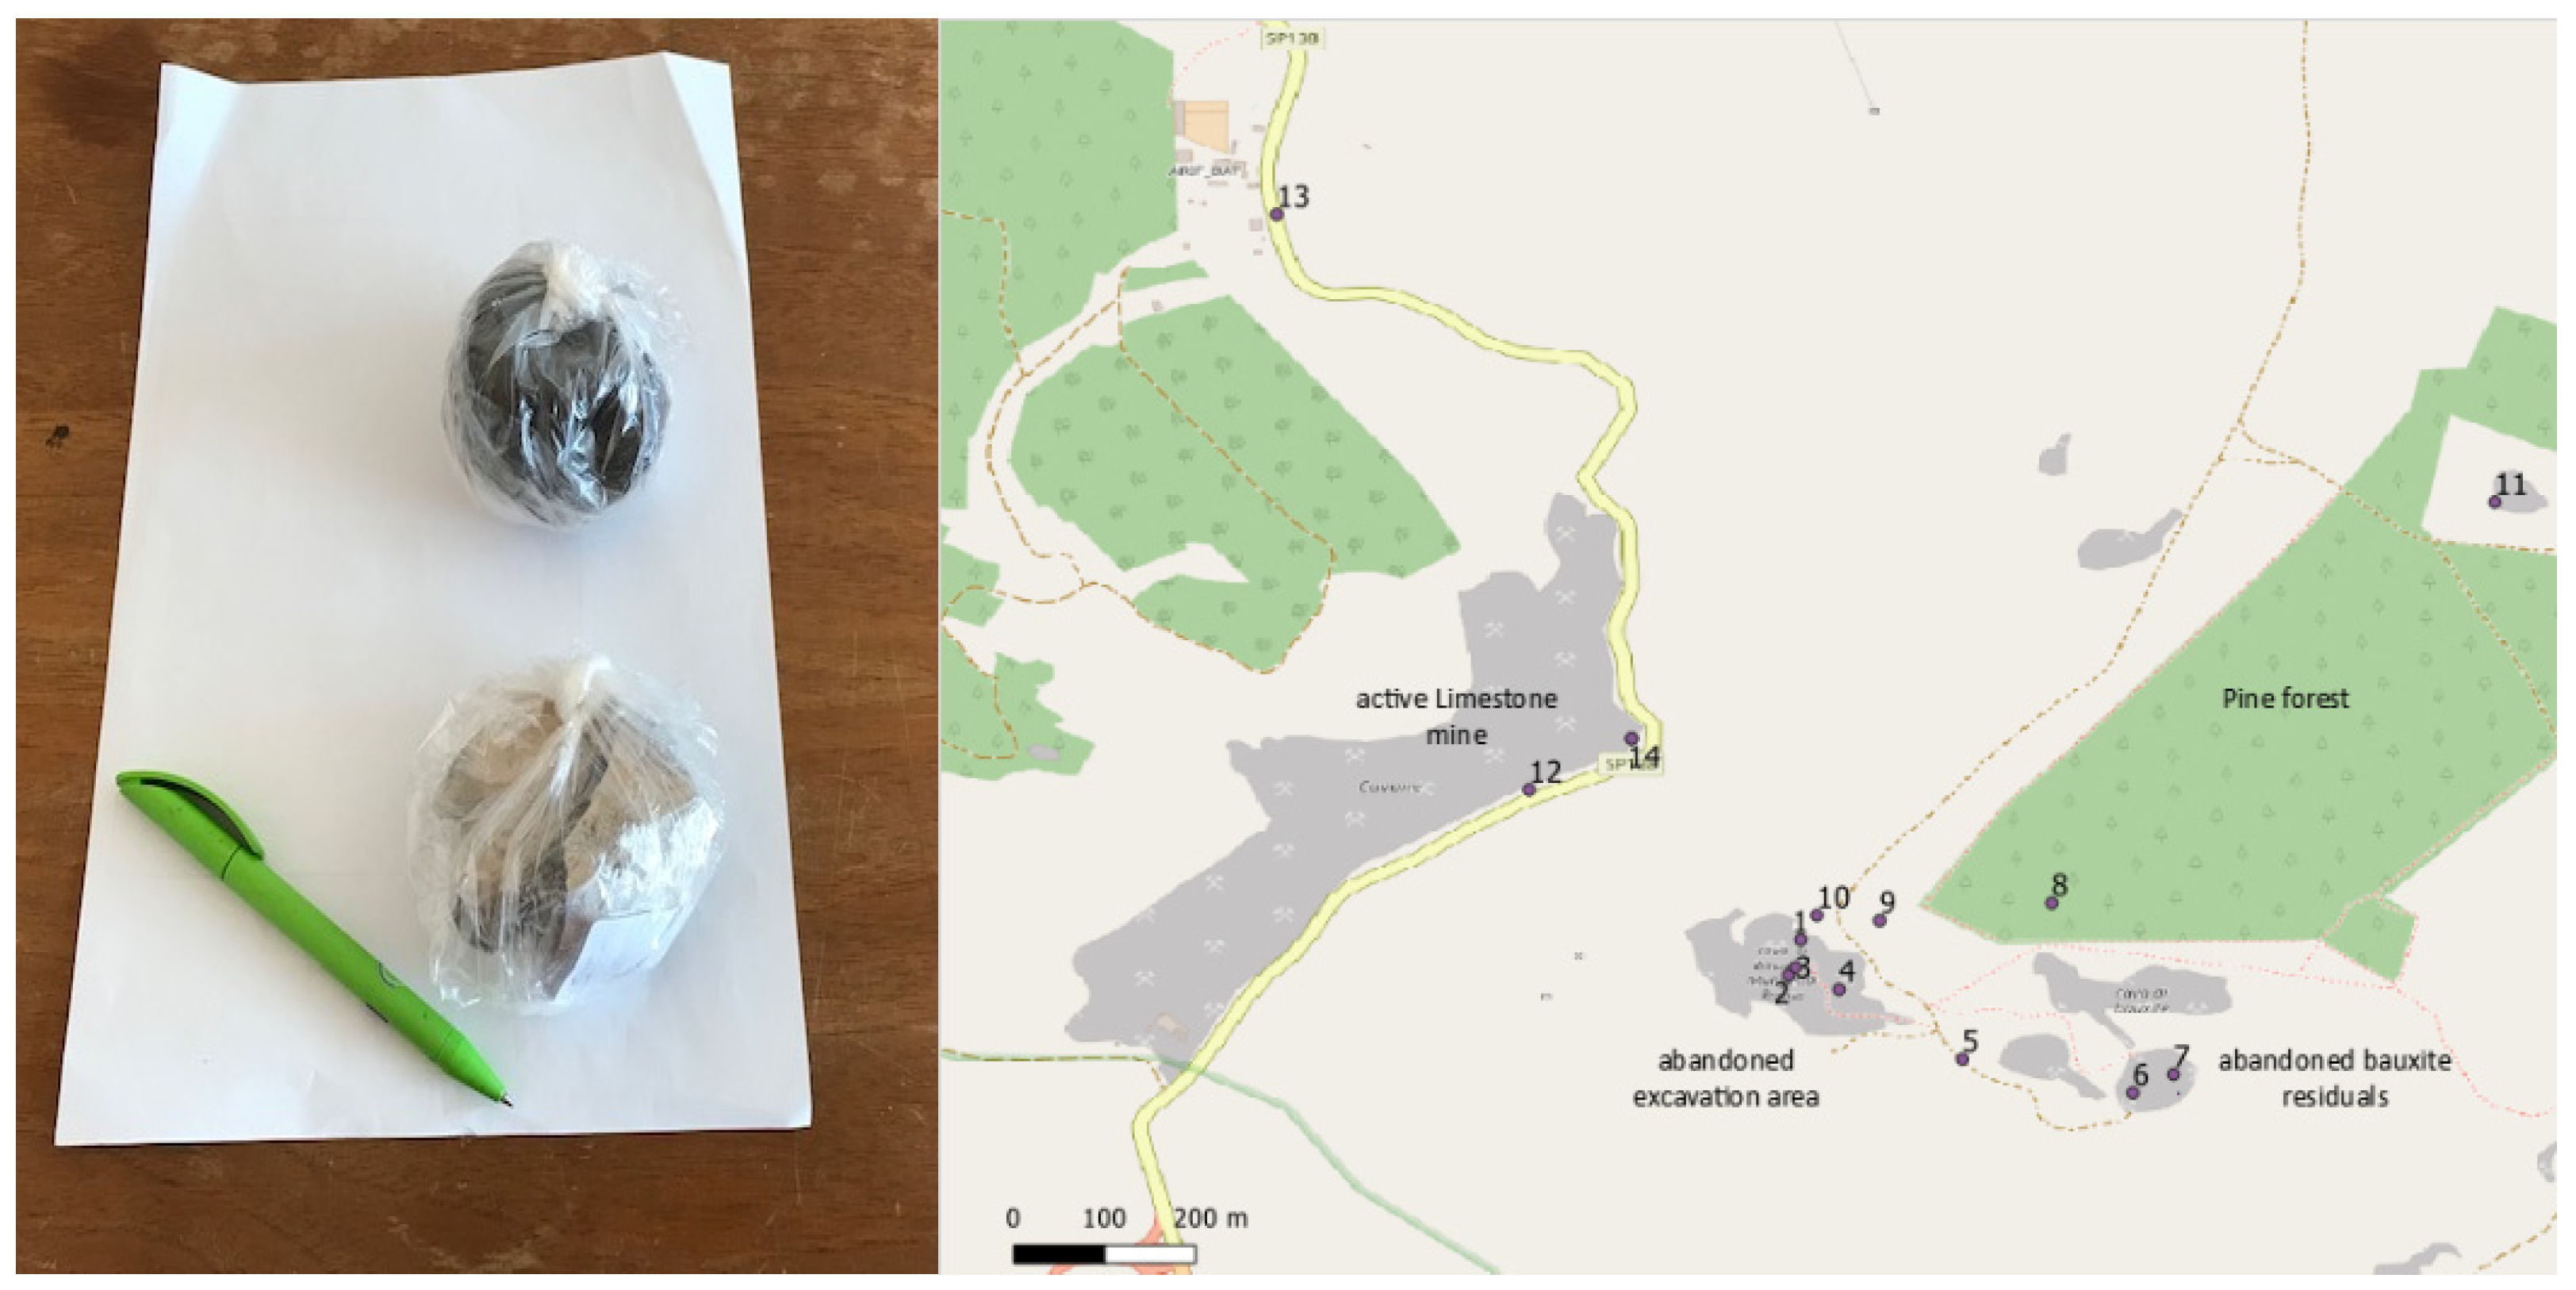
Around 15 in situ samples (grab samples around 200 g each) were taken from the case study area, some from the abandoned excavation areas, some from stockpiles and some extra ones from the surrounding areas without bauxite tracks that were useful as background (Figure 4). Moreover, the control points from the preliminary studies of bauxite residues were checked during the field visit for the geometry correction of the images.
3.3. Field Sampling
Sample analysis was performed at UNIBO labs; all samples were prepared in the Geoengineering and Natural Resources Lab (drying, grinding, quartering and milling). XRF analyses were performed on pressed powder pellets at the Biological, Geological and Environmental Department, University of Bologna. Based on repeated measurements, precision for major elements is always better than 3%, with the exception of P2O5 (9%). As for the considered trace elements, precision is better than 10%. A detailed account of the XRF procedure is available in [19]. The concentrations data were used for the metals mapping.
4. Results
4.1. Results of the Band Ratio Analysis
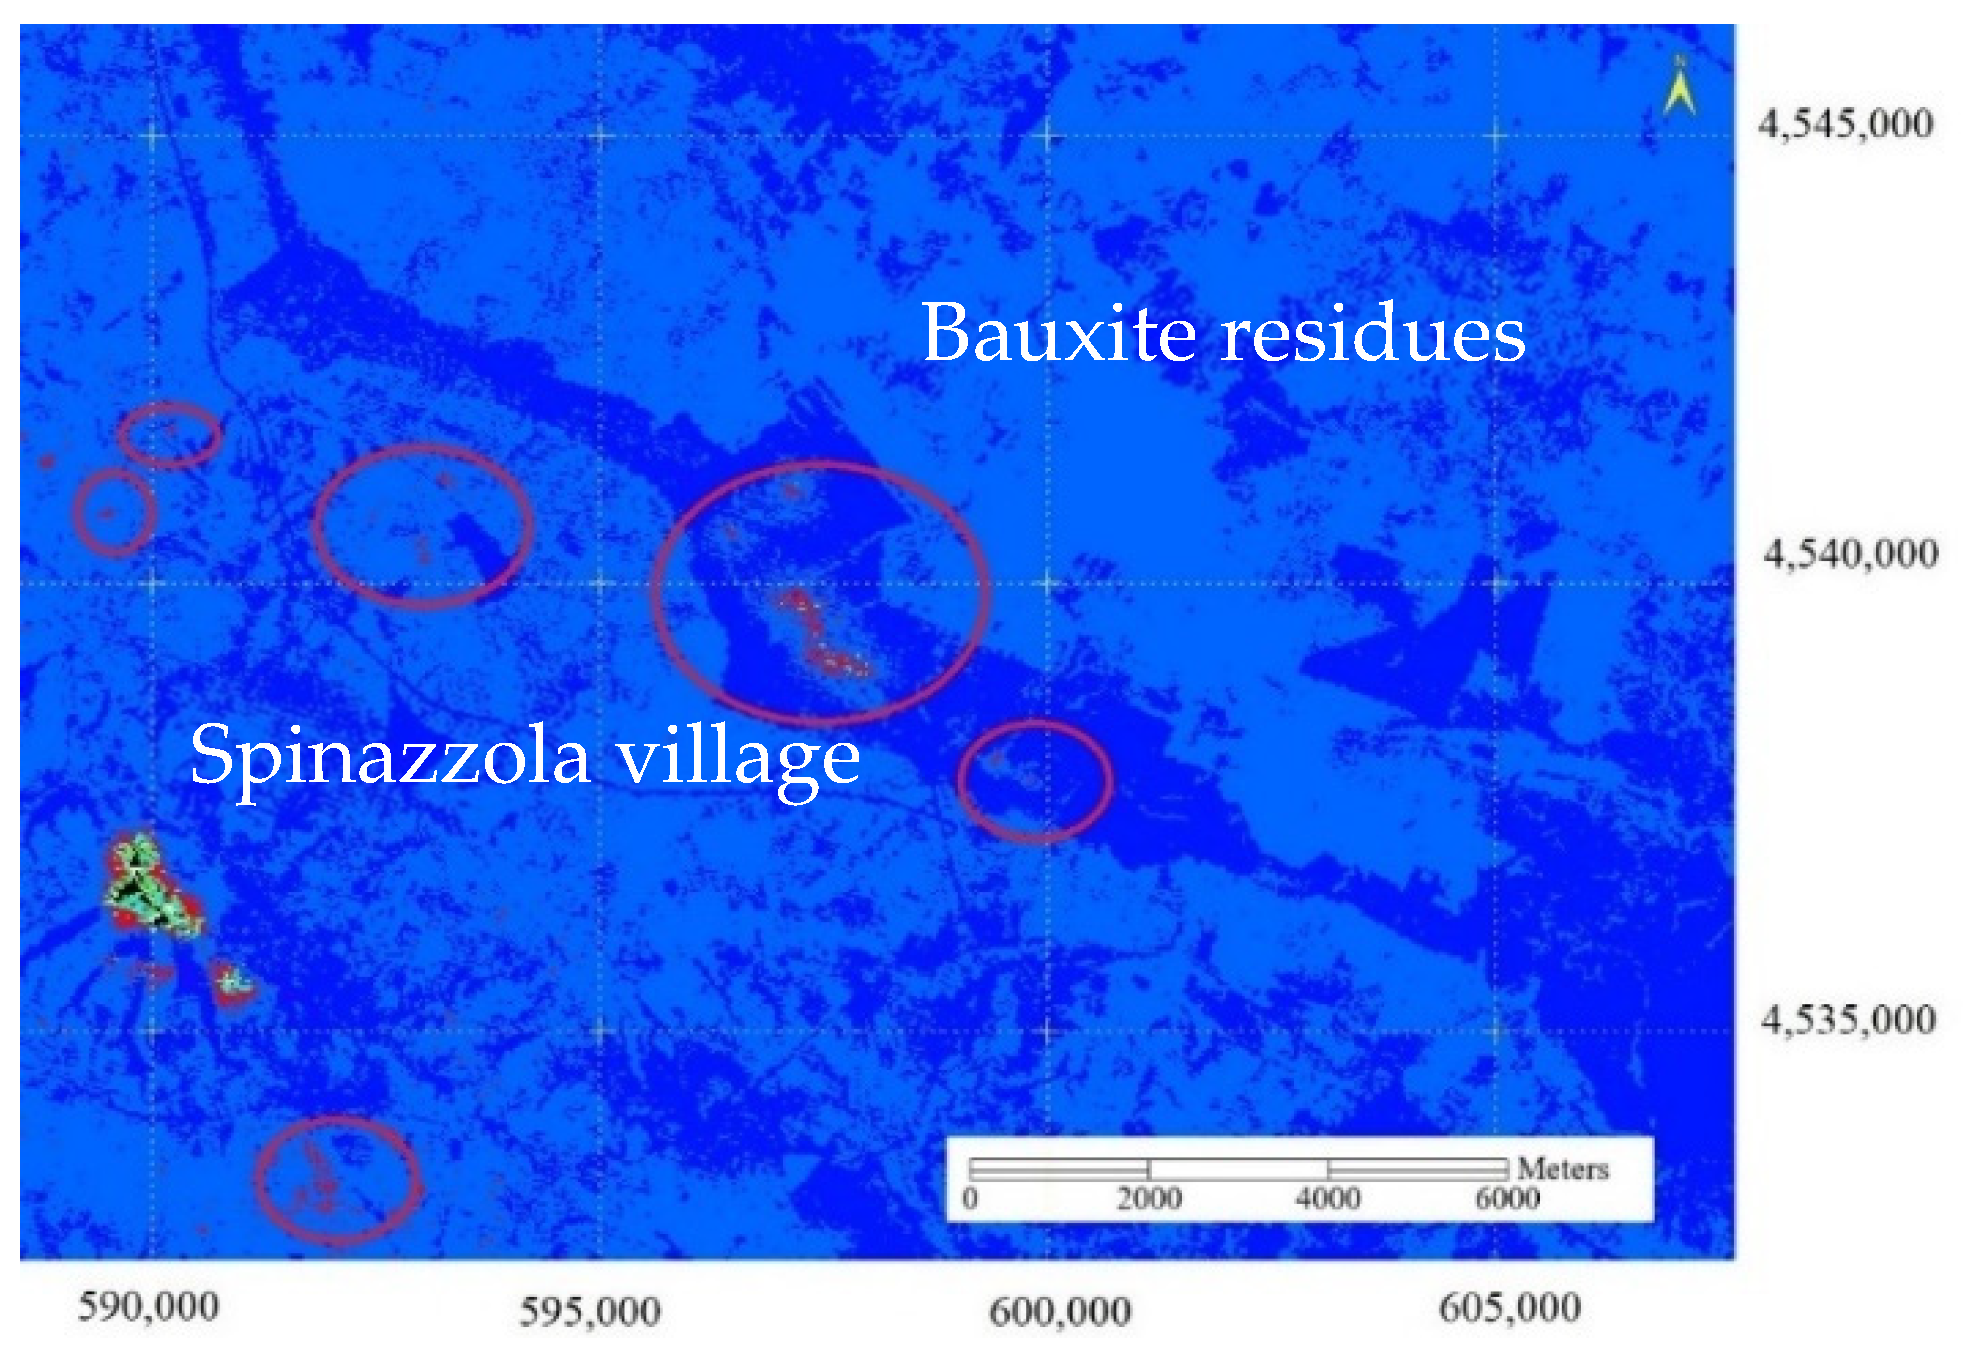
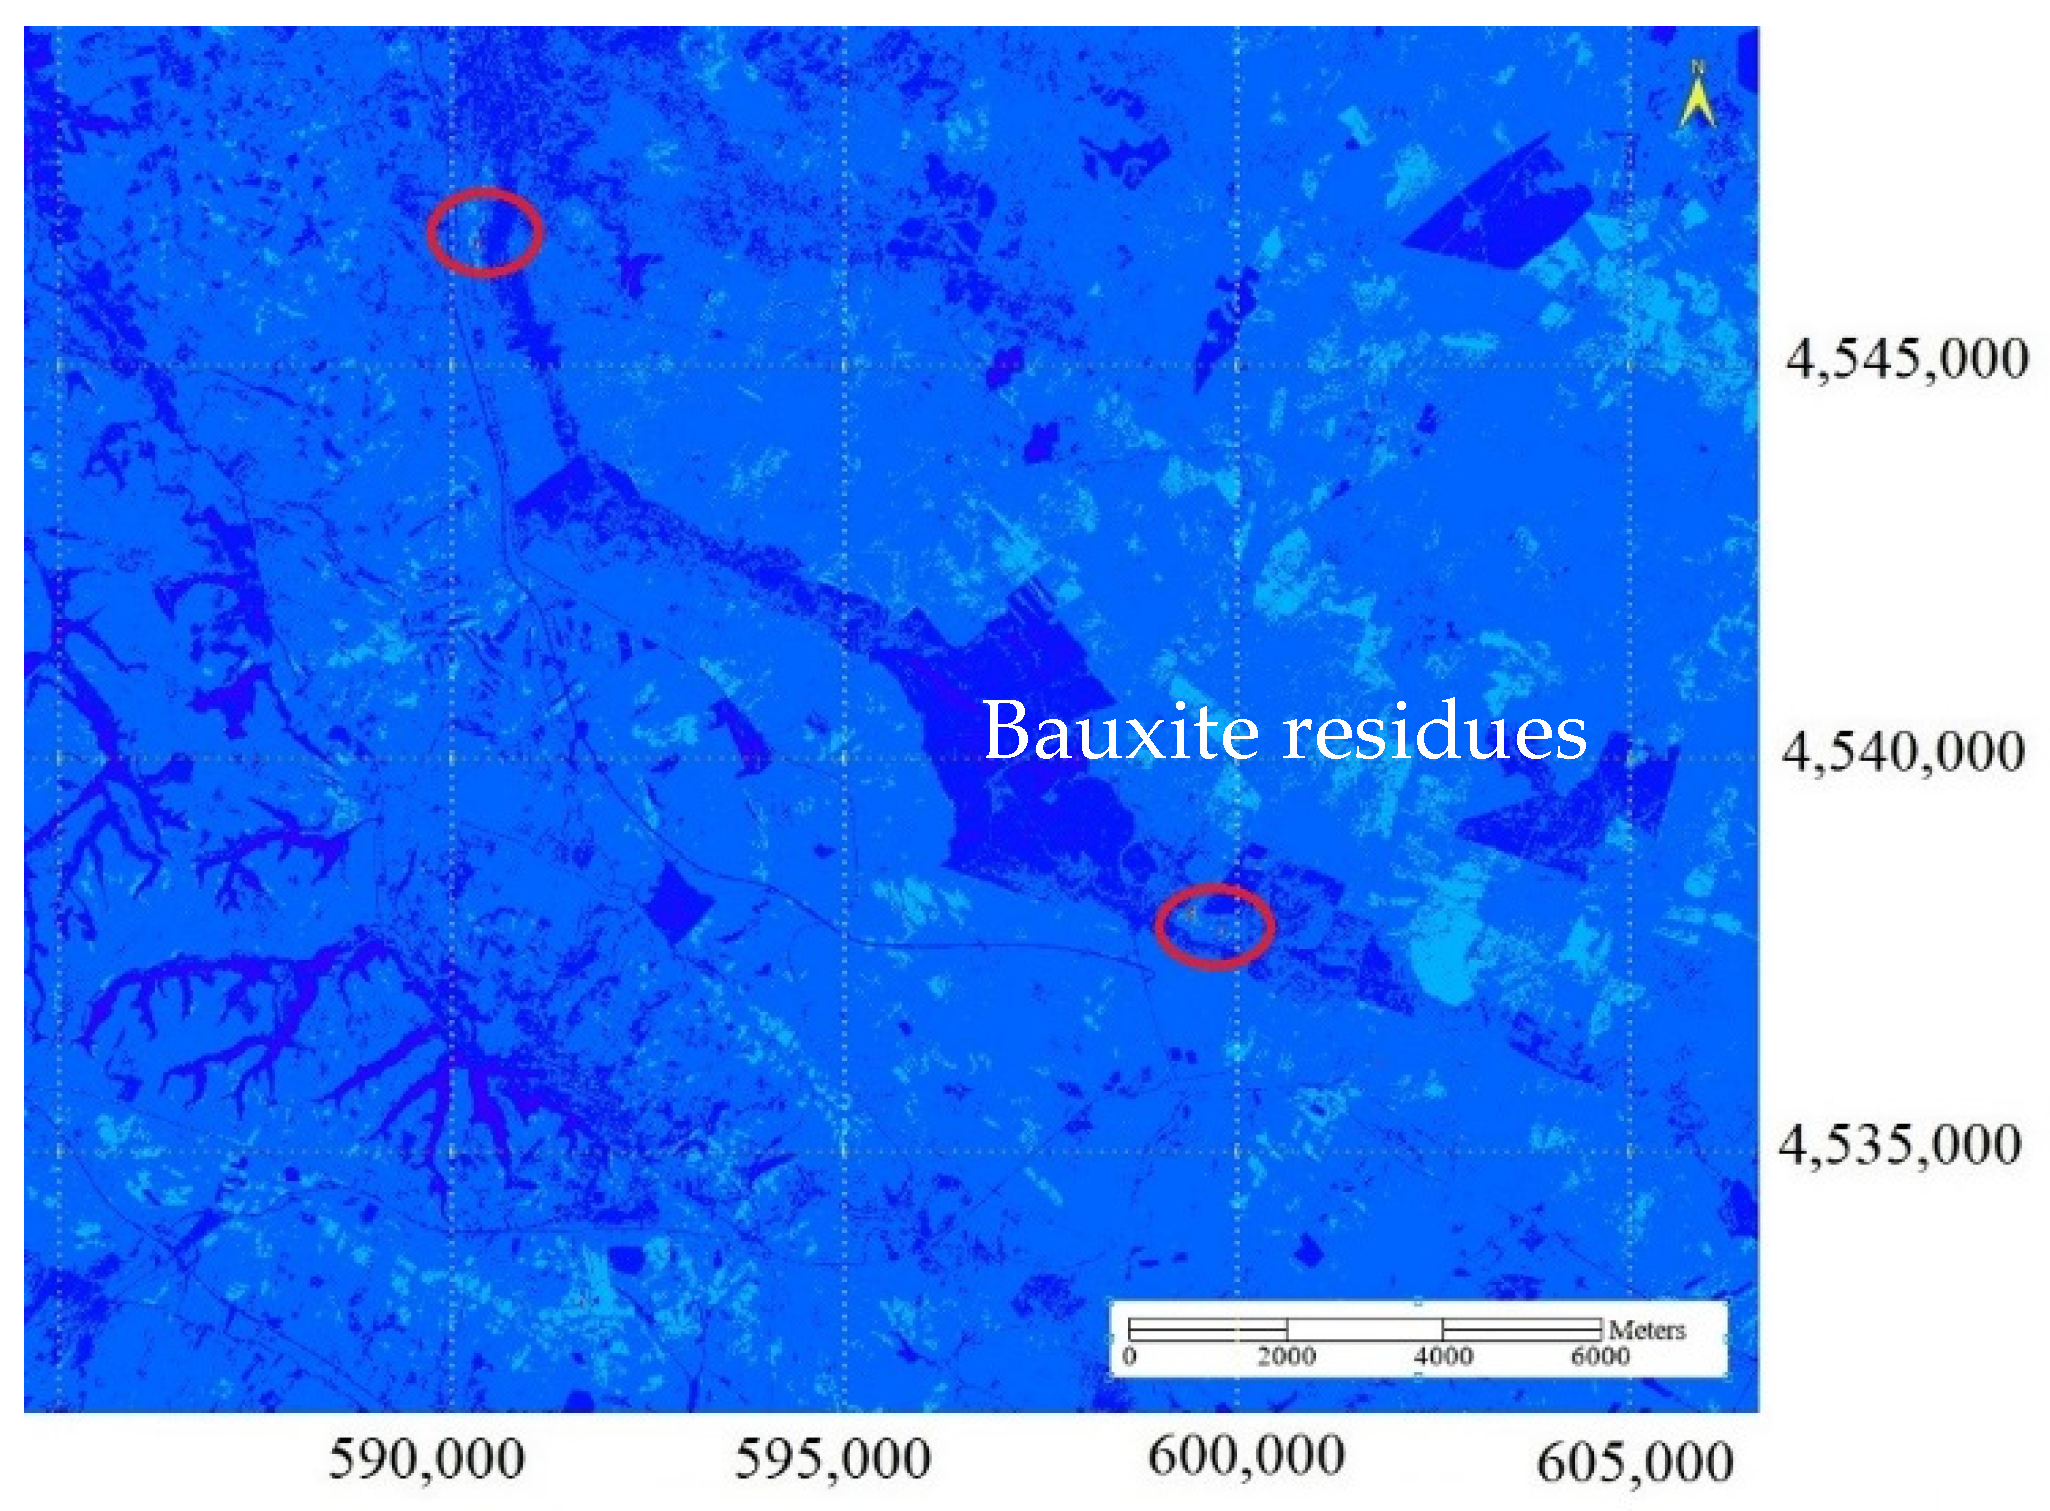
The analysis of different band ratios was performed on both Sentinel-2 and PRISMA images. As can be seen in Figure 5 and Figure 6, PRISMA highlighted new potential bauxite areas within the forest and in the southern part of the forest. These areas are considered as GCPs to check the presence of bauxite. During the second field controls, the reddish soils were indicated within the forest.
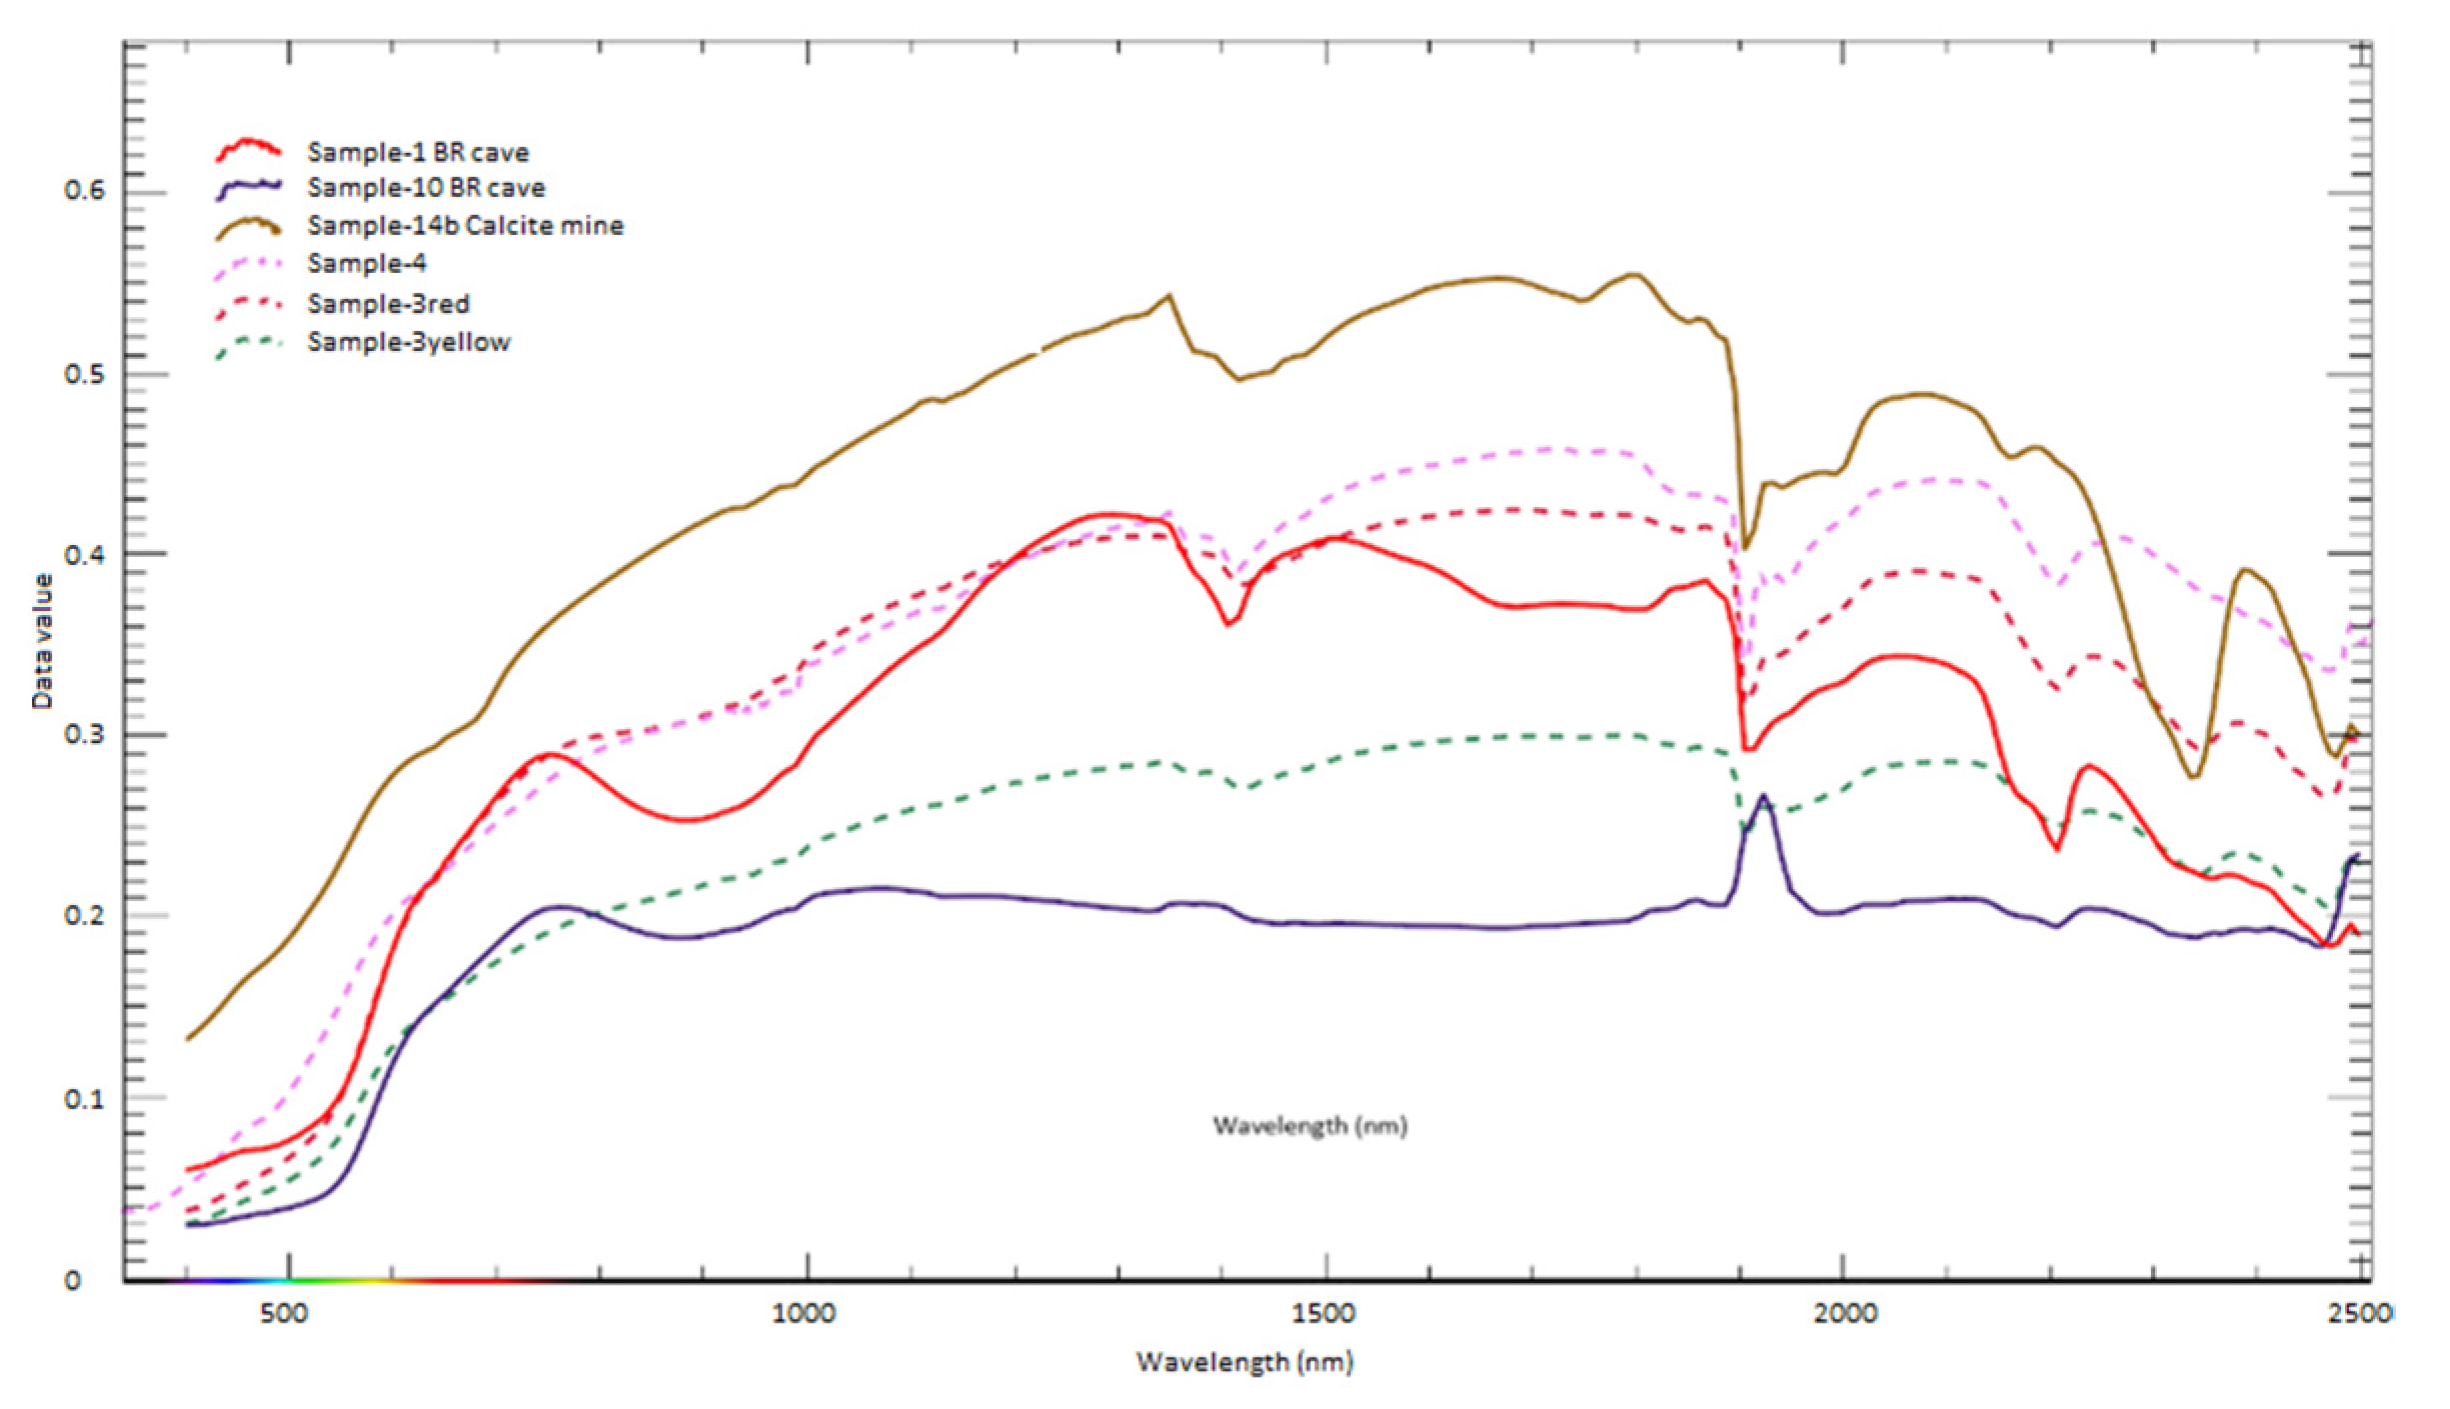
While PRISMA highlighted some bauxite features within the forest, from the Sentinel-2 image band ratios, another additional area was highlighted after the Minervino Murge village. The reddish soil area was present in the highlighted point, and field spectroradiometric surveys were performed (Sample-3). The measured point has a spectrum curve similar to the bauxite residues’ spectrum behavior, demonstrated in Figure 7.
Moreover, in the southern part of the forest, extra field spectroradiometer surveys were performed from the reddish soil area, which shows the similar spectrum curve to the samples within the bauxite cave (Sample-1 and Sample-4 in Figure 7). The mentioned points were not highlighted in the Sentinel-2 image.
Two ground control points (Sample-3red and Sample-4) have the reflectance curve similar to Sample-1, which is taken from the bauxite residue canyon. Sample-1 has low iron content (13%) but high aluminum content (41%).
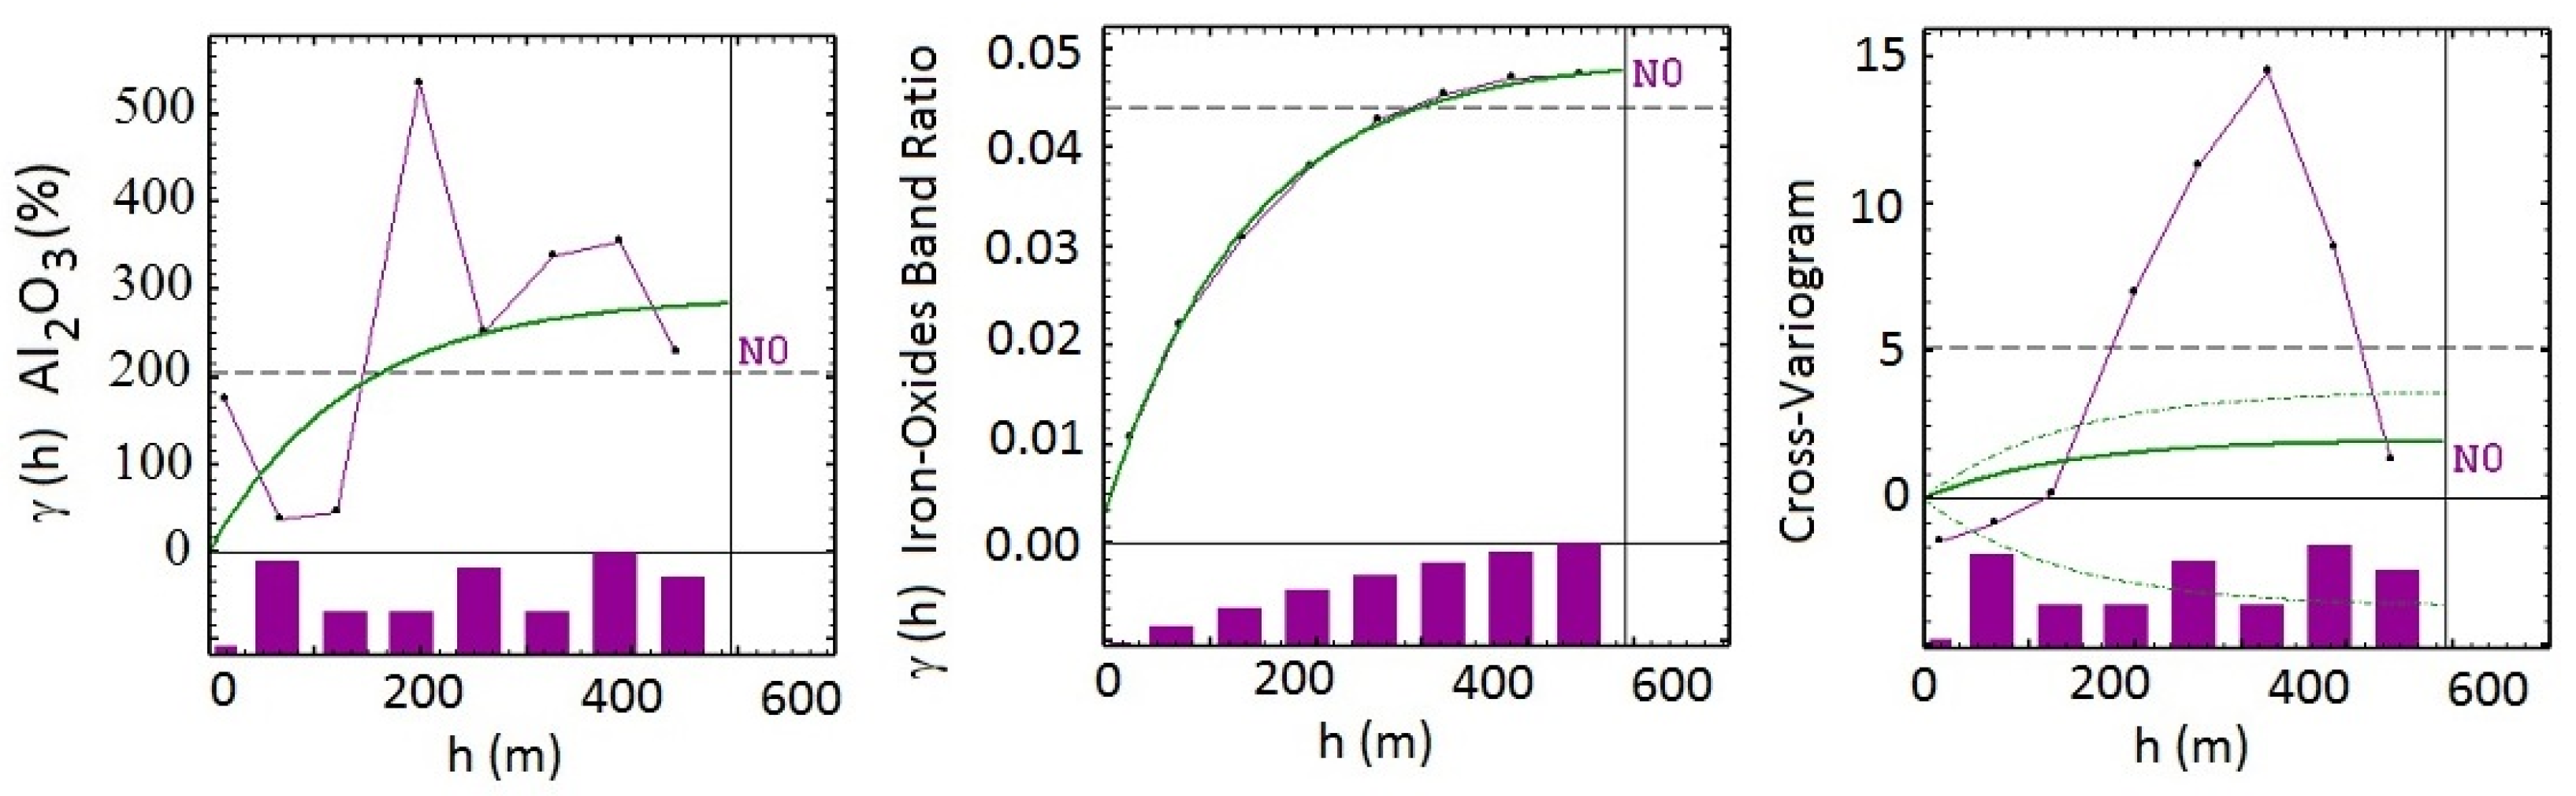
4.2. Results of the Multivariate Geostatistical Analysis
Due to the small number of field samples, using the secondary variable from EO data (band ratios) was fundamental for grade mapping. The correlation coefficients between EO data and concentrations in samples were calculated to find the highest correlation. As a result, the highest coefficient correlations between Al2O3 (%) and the band ratios are presented in Table 2.
4.3. Concentration Mapping
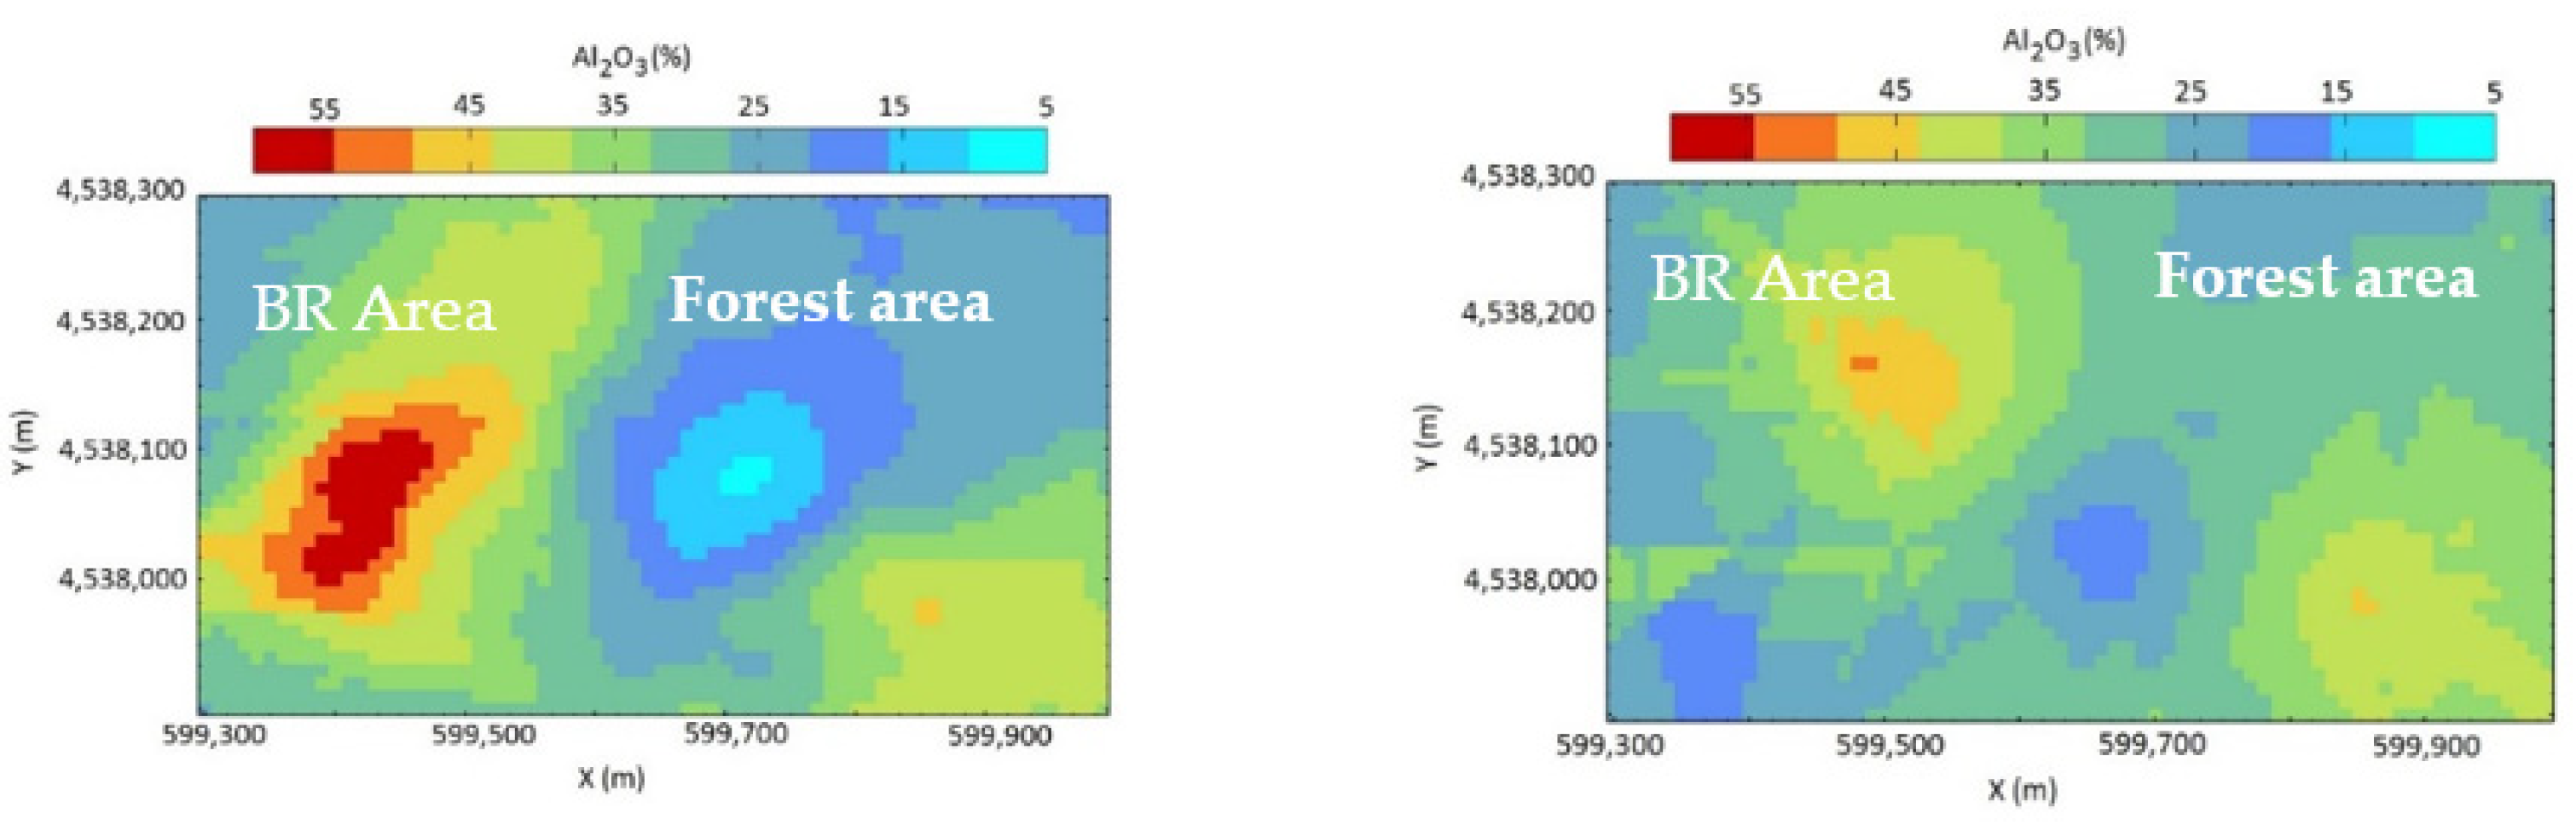
Using the variogram models, collocated co-kriging was performed to map aluminum in the selected area. The same grid size (10 m × 10 m) was used for all results to make the comparison easier. Results show the effect of the different spatial resolutions of satellite images (Figure 10).
As shown in Table 2, with higher resolution (in this case, using Sentinel-2), there is higher correlation between band ratios and the selected oxide (Al2O3).
5. Discussion and Conclusions
The target of the work was aluminum detection with subsequent evaluation of possible sources and environmental issues. The use of spatial variability analysis through the variogram models and the co-kriging estimation method applied to satellite images provided the possibility of mapping aluminum in the selected case study area, the abandoned bauxite mine of Spinazzola, Apulia (IT). The resulting maps for different satellite images were all created in the grid size 10 m × 10 m to facilitate the comparisons. Results show the importance of the images’ spatial resolutions, providing different secondary variable data sets for each estimation. By increasing the spatial resolution, the correlation between band ratios and the aluminum oxide (Al2O3) increased as well. The method used in this work can easily be adapted to any other target raw material or environmental index. There is still a wide space for improvement in this topic for characterization of abandoned mining residues and for exploration attempts of currently unexplored new sources of primary minerals. Many investigations can still be done to unlock the full PRISMA satellite potential for raw materials exploration and recovery integrated into the wide framework of the Copernicus program and its objectives.
Funding
This research was supported by the RawMatCop Programme (2018–2021), funded by the European Commission and EIT RawMaterials, grant agreement number “271/G/Gro/COPE/17/10036” and by the INCO-Piles 2020 Project (2020–2021), funded by EIT RawMaterials, Grant Agreement 19169.
Institutional Review Board Statement
Not applicable.
Informed Consent Statement
Not applicable.
Data Availability Statement
Not applicable.
Acknowledgments
Authors would like to thank Irene Benito Rodríguez the RawMatCop Programme manager, and Rima Dapous and Wesley Crock, from EIT RawMaterials. Moreover, authors would like to thank Michele Penza and Marco Alvisi from the Mediterranean Regional EIT Hub of Apulia (“MedinHub”) for their support relating to the field trip and data access for the case study.
Conflicts of Interest
The authors declare no conflict of interest.
References
- Kasmaeeyazdi, S.; Mandanici, E.; Balomenos, E.; Tinti, F.; Bonduà, S.; Bruno, R. Mapping of Aluminum Concentration in Bauxite Mining Residues Using Sentinel-2Imagery. Remote Sens. 2021, 13, 1517. [Google Scholar] [CrossRef]
- Bruno, R.; Kasmaeeyazdi, S.; Tinti, F.; Mandanici, E.; Balomenos, E. Spatial Component Analysis to Improve Mineral Estimation Using Sentinel-2 Band Ratio: Application to a Greek Bauxite Residue. Minerals 2021, 11, 549. [Google Scholar] [CrossRef]
- Sentinel 2 Online Website. Available online: https://sentinel.esa.int/web/sentinel/missions/sentinel-2 (accessed on 29 July 2021).
- Loizzo, R.; Ananasso, C.; Guarini, R.; Lopinto, E.; Candela, L.; Pisani, A.R. The Prisma Hyperspectral Mission; Special Publ. ESA SP SP-740; European Space Agency: Paris, France, 2016; pp. 9–13. [Google Scholar]
- Porcelli, M. Le Cavette di Bauxite di Spinazzola nelle Immagini D’archivio: Una Scoperta che vive nel Ricordo; Ricerche Speleologiche, n°1; Centro Altamurano Ricerche Speleologiche: Apulia, Italy, 2006. [Google Scholar]
- Ducart, D.F.; Silva, A.M.; Bemfica, C.L.; de Assis, L.M. Mapping iron oxides with Landsat-8/OLI and EO-1/Hyperion imagery from the Serra Norte iron deposits in the Carajás, Mineral Province, Brazil. Braz. J. Geol. 2016, 46, 331–349. [Google Scholar] [CrossRef]
- Van der Werff, H.; Van der Meer, F. Sentinel-2A MSI and Landsat 8 OLI Provide Data Continuity for Geological Remote Sensing. Remote Sens. 2016, 8, 883. [Google Scholar] [CrossRef] [Green Version]
- Rouskov, K.; Popov, K.; Stanislav Stoykov, S.; Yamaguchi, Y. Some applications of the remote sensing in geology by using of ASTER images. In Proceedings of the Scientific Conference “SPACE, ECOLOGY, SAFETY” with International Participation, Sofia, Bulgaria, 10–13 June 2005. [Google Scholar]
- Emery, X. Statistical tests for validating geostatistical simulation algorithms. Comput. Geosci. 2008, 34, 1610–1620. [Google Scholar] [CrossRef]
- Boisvert, J.B.; Rossi, M.E.; Ehrig, K.; Deutschbeucer, C.V. Geometallurgical modeling at Olympic Dam Mine, South Australia. Math. Geosci. 2013, 45, 901–925. [Google Scholar] [CrossRef]
- Rossi, M.E.; Deutsch, C.V. Mineral Resource Estimation; Springer Science+Business Media: Dordrecht, The Netherlands, 2014; Volume XIV, p. 332. [Google Scholar] [CrossRef]
- Dimitrakopoulos, R. Conditional simulation algorithms for modelling orebody uncertainty in open pit optimization. Int. J. Surf. Min. Reclam. Environ. 2007, 12, 173–179. [Google Scholar] [CrossRef]
- Wackernagel, H. Multivariate Geostatistics. In An Introduction with Applications; Springer: Heidelberg/Berlin, Germany, 2003; pp. 121–208. [Google Scholar] [CrossRef]
- Chiles, J.P.; Delfiner, P. Geostatistics Modeling Spatial Uncertainty, 2nd ed.; Wiley: Hoboken, NJ, USA, 2012; ISBN 978-0-470-18315-1. [Google Scholar]
- Mongelli, G.; Boni, M.; Oggiano, G.; Mameli, P.; Sinisi, R.; Buccione, R.; Mondillo, N. Critical metals distribution in Tethyan karst bauxite: The cretaceous Italian ores. Ore Geol. Rev. 2017, 86, 526–536. [Google Scholar] [CrossRef]
- Spalluto, L.; Caffau, M. Stratigraphy of the mid-Cretaceous shallow-water limestone of the Apulia Carbonate Platform (Murge, Apulia, southern Italy). Ital. J. Geosci. 2010, 129, 335–352. [Google Scholar] [CrossRef]
- Brinkman, R. Ferrolysis, a hydromorphic soil forming process. Geoderma 1970, 3, 199–206. [Google Scholar] [CrossRef]
- Mongelli, G. Ce-anomalies in the textural components of Upper Cretaceous karst bauxites from the Apulian carbonate platform (southern Italy). Chem. Geol. 1997, 140, 69–79. [Google Scholar] [CrossRef]
- Braga, R.; Cinelli, G. The gabbro and serpentinized peridotite of Bonassola (Bracco-Levanto ophiolite, Italy) -an extremely low natural radiation area to improve in situ gamma spectrometry. Ofioliti 2014, 39, 43–49. [Google Scholar] [CrossRef]
Figure 1.
Methodology flowchart.

Figure 2.
The bauxite mining residues located in Apulia (Google Earth Image, 12 April 2020).

Figure 3.
Spectroradiometer measurements of bauxite residues in Apulia.

Figure 4.
In situ samples (left) taken from different case study areas (numbers in the map, right).

Figure 5.
Band ratio analysis (iron oxides: Band28/Band8) detecting bauxite potentials in the Spinazzola rural area (PRISMA).
Figure 5.
Band ratio analysis (iron oxides: Band28/Band8) detecting bauxite potentials in the Spinazzola rural area (PRISMA).

Figure 6.
Band ratio analysis (iron oxides: Band28/Band8) detecting elements’ variety inside the bauxite residues (PRISMA).
Figure 6.
Band ratio analysis (iron oxides: Band28/Band8) detecting elements’ variety inside the bauxite residues (PRISMA).

Figure 7.
Comparison between spectrum signature of samples from bauxite residues and detected coordinates by PRISMA and Sentinel-2 band ratio analysis.
Figure 7.
Comparison between spectrum signature of samples from bauxite residues and detected coordinates by PRISMA and Sentinel-2 band ratio analysis.

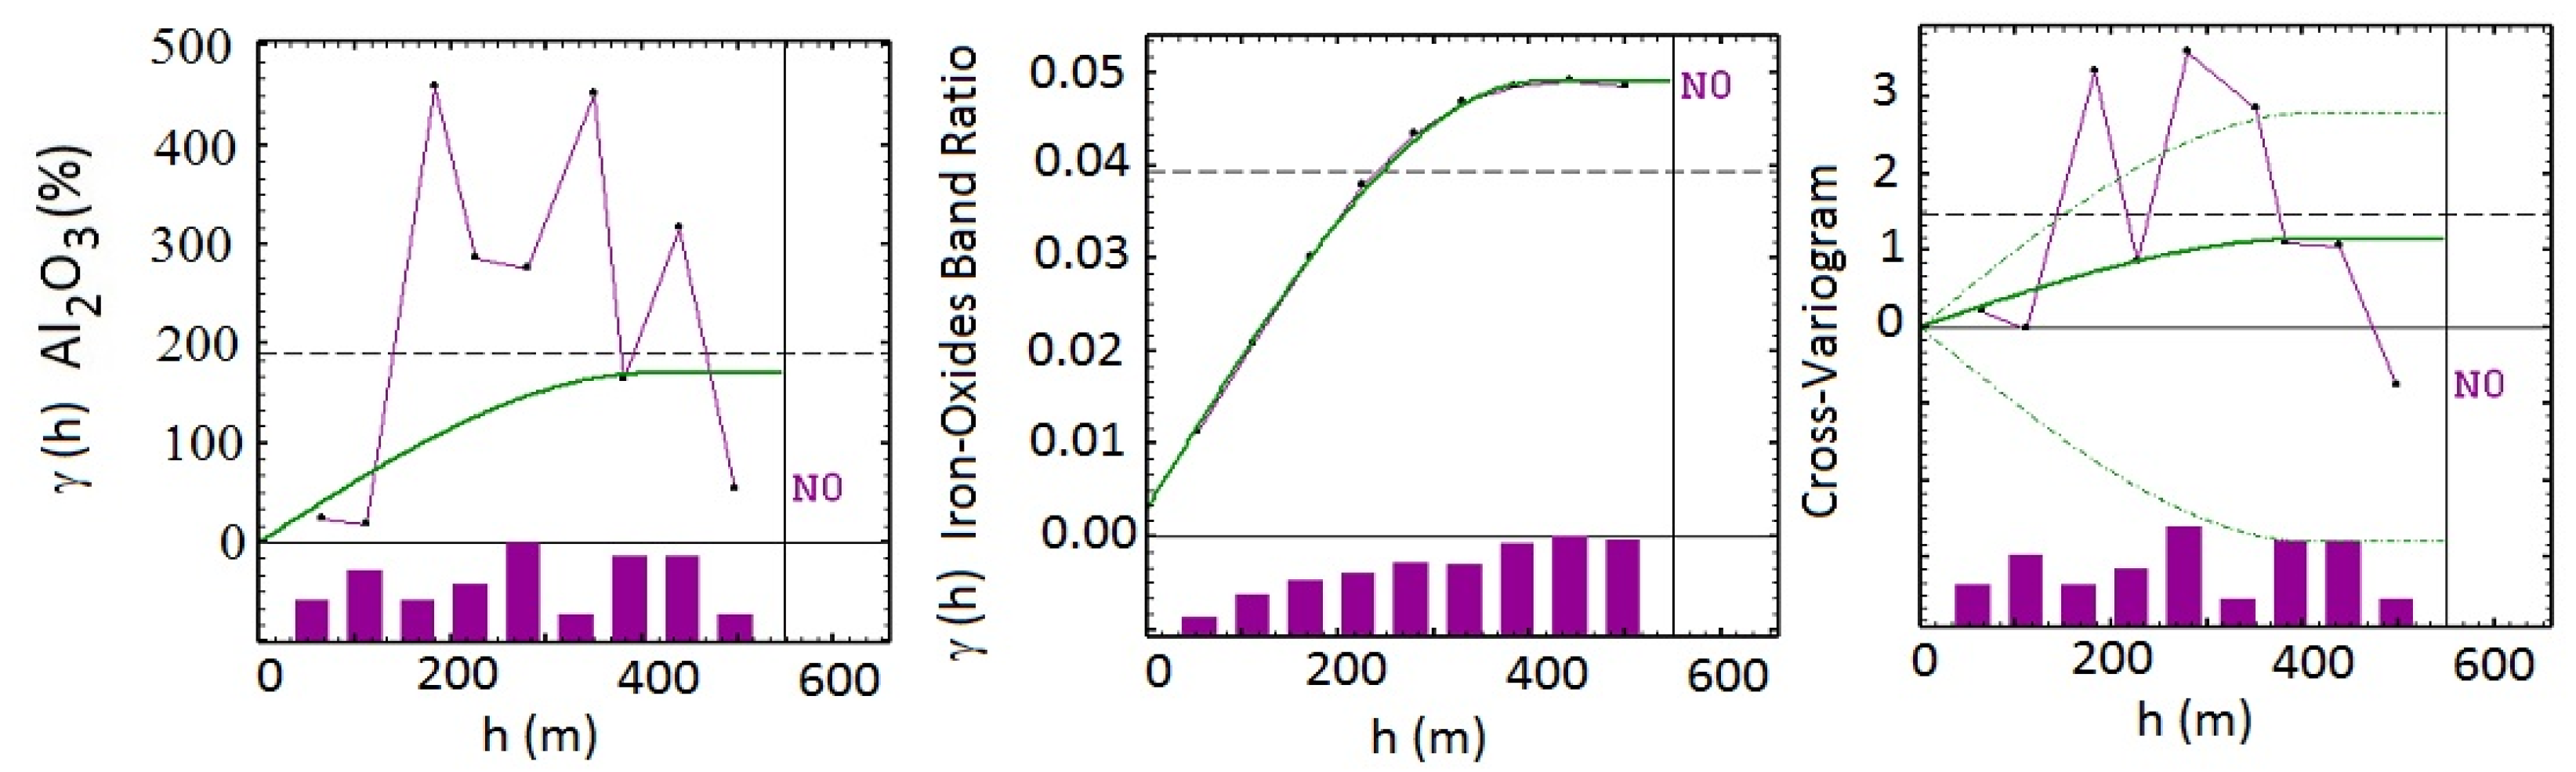
Figure 8.
Direct and cross sample variogram (purple) and the fitted model (green line) based on aluminum samples and iron oxides band ratio from PRISMA Image.
Figure 8.
Direct and cross sample variogram (purple) and the fitted model (green line) based on aluminum samples and iron oxides band ratio from PRISMA Image.

Figure 9.
Direct and cross sample variogram (purple) and the fitted model (green line) based on aluminum samples and iron oxides band ratio from Sentinel-2 Image.
Figure 9.
Direct and cross sample variogram (purple) and the fitted model (green line) based on aluminum samples and iron oxides band ratio from Sentinel-2 Image.

Figure 10.
Concentration maps of Al2O3 (%) from co-kriging estimation using the data from PRISMA (left) and Sentinel-2 (right).
Figure 10.
Concentration maps of Al2O3 (%) from co-kriging estimation using the data from PRISMA (left) and Sentinel-2 (right).


Table 1.
Band ratios of Sentinel-2A used as proxies for mapping different mineralogy.
| Feature | Sentinel-2A Bands Central Wavelength | PRISMA Bands Central Wavelength |
|---|---|---|
| Iron oxides | 4 (665 nm)/2 (490 nm) | 28 (660 nm)/8 (492 nm) |
| Laterite | 11 (1610 nm)/12 (2190 nm) | 105 (1606 nm)/148 (2190 nm) |
| Ferric oxides | 11 (1610 nm)/8 (842 nm) | 105 (1606 nm)/46 (844 nm) |
| Ferrous iron oxides | 4 (665 nm)/11 (1610 nm) | 28 (660 nm)/105 (1606 nm) |
| Ferric iron | 4 (665 nm)/3 (560 nm) | 28 (660 nm)/17 (562 nm) |
Table 2.
Selected variables and their correlation coefficients for concentration mapping.
| Variables | Coefficient Correlation | Reference Image |
|---|---|---|
| Al and iron oxides band ratio | 0.631 | Sentinel-2 |
| Al and iron oxides band ratio | 0.595 | Prisma |
Publisher’s Note: MDPI stays neutral with regard to jurisdictional claims in published maps and institutional affiliations. |
© 2022 by the authors. Licensee MDPI, Basel, Switzerland. This article is an open access article distributed under the terms and conditions of the Creative Commons Attribution (CC BY) license (https://creativecommons.org/licenses/by/4.0/).
Share and Cite
MDPI and ACS Style
Kasmaeeyazdi, S.; Braga, R.; Tinti, F.; Mandanici, E. Mapping Bauxite Mining Residues Using Remote Sensing Techniques. Mater. Proc. 2021, 5, 91. https://0-doi-org.brum.beds.ac.uk/10.3390/materproc2021005091
AMA Style
Kasmaeeyazdi S, Braga R, Tinti F, Mandanici E. Mapping Bauxite Mining Residues Using Remote Sensing Techniques. Materials Proceedings. 2021; 5(1):91. https://0-doi-org.brum.beds.ac.uk/10.3390/materproc2021005091
Chicago/Turabian StyleKasmaeeyazdi, Sara, Roberto Braga, Francesco Tinti, and Emanuele Mandanici. 2021. "Mapping Bauxite Mining Residues Using Remote Sensing Techniques" Materials Proceedings 5, no. 1: 91. https://0-doi-org.brum.beds.ac.uk/10.3390/materproc2021005091