Benchmarking Engineering, Procurement and Construction (EPC) Power Plant Projects by Means of Series Two-Stage DEA


School of Applied Mathematics and Physics, National Technical University of Athens, Athens 15780, Greece
Electricity 2020, 1(1), 1-11; https://0-doi-org.brum.beds.ac.uk/10.3390/electricity1010001
Submission received: 25 March 2020
/
Revised: 26 April 2020
/
Accepted: 29 April 2020
/
Published: 4 May 2020
Abstract
:A lot of companies in the power sector use Engineering, Procurement, and Construction (EPC) contracts for complex infrastructure projects such as power plants. This paper presents a series two-stage data envelopment analysis (DEA) approach for the ex ante benchmarking of EPC power plant projects. The current study aims to improve over single-stage DEA and evaluate the efficiency of a group of twelve domestic (located in Greece) and international natural gas-fired power plant projects of different technologies (combined cycle power plant (CCPP) projects with single and multi-shaft configuration, and open cycle power plant (OCPP) projects) by employing a series two-stage DEA model. In the first stage, performance of the EPC mode is evaluated, whereas in the second stage the plant annual operational efficiency is assessed. In the light of the results, there is a lower level of performance in the EPC mode than in operating efficiency. The OCPP projects have the best operating efficiency, whereas they are ranked in-between the CCPP projects with single and multi-shaft configuration in EPC mode performance.
1. Introduction
A Project Delivery System (PDS) is concerned with the management of an owner when executing a certain project, including the roles, responsibilities and the allocation of risk to project participants, and the payments of the owner to them. One of the most commonly used PDS is the Engineering, Procurement and Construction (EPC) mode [1]. In the relevant literature, the term EPC is used as a form of contract in which the contractor guarantees engineering, procurement (of materials, equipment and machinery) and construction for an infrastructure project [2]. EPC contractors execute infrastructure projects in industrial sectors such as transportation, power generation, oil and gas, and mining. As the project size increases, so does the complexity, design, financing, procurement and project execution [3].
EPC contracts appear mostly in large scale infrastructure projects, especially in the power sector [4] and they are not only domestic but also international in nature [5]. The power generation EPC contracts are classified into thermal (i.e., coal), gas, combined-cycle, nuclear and renewable (i.e., solar, wind, hydro) based power plant projects [6]. The EPC as an industrial plant construction contract is a turnkey agreement by which the construction risk of the project is transferred to the contractor, who ensures the completion date, the cost of the project and plant performance. Although risk is essential for EPC projects [5], safety and quality are also important, especially in the case of nuclear power plants [7].
In the case of power plant projects, the contractor must have access to the transmission grid [4]. In most cases, there may also be an operator or operation and maintenance contractor who steps in after construction is complete [2]. In these cases a holistic approach is needed, which should be extended and integrated from EPC to Engineering, Procurement, Construction, Operation and Maintenance (EPCOM).
There are no reports in the literature that determine the size of the EPC market. Wagner [8] states that EPC business has a share of 6% to 10% of the global construction market, which in 2015 was estimated to be 10 trillion USD and is expected to grow to 15 trillion USD by 2030. As for power generation EPC projects, the global market in 2018 was estimated to be 4.78 trillion USD [6].
There exist bodies of literature on methods for efficiency assessment of infrastructure projects, such as the Cobb-Douglas production function based approach [9], the fuzzy decision-making system [10] and data envelopment analysis (DEA) (see for example Xu et al. [11]).
DEA, introduced to the literature by Charnes et al. [12], is an operational research based approach that evaluates the efficiency of a set of decision-making units (DMUs); EPC projects, in our case. Ex post project efficiency deals with the ability of a project to obtain maximum outputs (i.e., achievements) given the resources (i.e., inputs). Although there are a number of ex post evaluation studies on the efficiency of construction projects using DEA (see for example [13,14,15]), they are focused mainly on evaluating the investment efficiency of the projects during the pre-construction and construction period.
In this regard, there is a lack of ex ante evaluation studies to assess the DEA-based efficiency of infrastructure projects with emphasis on the project EPCOM cycle. Against this backdrop, the current study aims to improve over single black box DEA [16] and evaluate the efficiency of a group of domestic (located in Greece) and international power plant projects of different technologies (Combined Cycle Power Plant (CCPP) projects with single and multi-shaft configuration and Open Cycle Power Plant (OCPP) projects) by employing a series two-stage DEA model to open the black box of the EPCOM cycle. The DEA assessment involves measuring the performance of similar EPC projects that form the portfolio of a contractor; thus, DEA is the selected approach to perform an internal benchmarking. For the types of benchmarking in construction industry, the reader is referred to Fisher et al. [17].
The DEA is a data driven method, a feature which distinguishes it from the experimental-in-nature methods used in the power industry (e.g., [18]). Its convergence with the conventional (experimental-in-nature) methods should be investigated further, since it can be integrated with simulation [19] and be employed for big data analysis, an approach that is also used in the power industry [20].
This study adds to the existing literature in several ways. First, it provides new empirical evidence on the efficiency of the project EPCOM cycle in the investment (pre-construction and construction) and operation stages. Second, it fills the gap created by the black box of the EPCOM cycle for power plant projects by using a series two-stage DEA model to evaluate efficiency in both the EPC and operational stages.
This study aims to determine:
- Best performance for the EPC and operational project stages, and
- Best efficiency for power plant (CCPP, OCPP) types.
The rest of the paper unfolds as follows. Section 2 provides the literature review. In Section 3, the problem to be solved is stated. In Section 4, the proposed series two-stage DEA model is presented. The data, along with selection of inputs and outputs for the case of a sample of EPC projects, are reported in Section 5. In Section 6, the results are presented and discussed. In Section 7, the policy implications are provided and the final section concludes.
2. Literature Review
2.1. Survey on DEA Approaches for Infrastructure Project Evaluation
Projects are usually managed as systems, the main objectives of which are to meet completion dates and budgets, and comply with quality standards [21,22]. These objectives are in line with the so called ‘project management triangle’ based on schedule, cost and quality, and they are used to determine the project’s success or failure [23,24,25]. Following a results-focused approach with the above objectives, project efficiency can be assessed. There are a few empirical studies on the relative efficiency of construction projects using DEA. This literature includes the works [11,13,14,15,26,27,28,29].
Williams [26] investigates different PDSs using data from building projects in Oregon employing radial DEA models. Farris et al. [14] carry out a DEA case study for evaluating the relative performance of engineering design projects. Vitner et al. [13] employ DEA to evaluate project efficiency using project management principles. Papadimitriou [27] uses single DEA to evaluate the efficiency of the EPCOM cycle of power plant projects. Guccio et al. [29] use DEA to measure the efficient management of public works contracts that concern interventions for roads and highways. Tsolas [15] employs range-adjusted measure (RAM) to derive composite performance indicators for a sample of building projects in Oregon. These studies are all based on the classic single-stage DEA within a black box framework.
Single black box DEA aims to measure the efficiency of a DMU as a whole system, without considering its internal structure; the system is treated as a black box, within which inputs that are used to produce outputs are identified [16].
In another research strand, model building is based on the series two-stage DEA. In contrast to the single DEA black box model, a series two-stage DEA model identifies sub-processes and aims at measuring their efficiency [16]. In this strand lie the works of Hedayat and Saghehei [28], Niu et al. [30], Tajbakhsh and Hassini [31], and Xu et al. [11]. Hedayat and Saghehei [28] employ a two-level fuzzy DEA model to assess a group of projects in an organization. Niu et al. [30] propose a series two sub-process DEA approach for analyzing wind turbine efficiency. Tajbakhsh and Hassini [31] present a series two-stage DEA to evaluate the efficiency of fossil fuel fired power plants, considering the financial and sustainable missions of the plants in the first and second stage, respectively. Xu et al. [11] use a series two-stage model to assess the efficiency of infrastructure Public-Private Partnerships (PPP) projects. It should be noted that the series two-stage DEA model is wholly different from the two-stage DEA approach used to regress the produced efficiency scores on control variables not included in the DEA assessment [32]. For the two-stage DEA applications, the reader is referred to the recent works by Wu et al. [33] and Sağlam [34,35].
2.2. Research Gaps in the Literature
Single- and series two-stage DEA have already been employed for ex-post evaluation of infrastructure projects. To the best of the author’s knowledge, the series two-stage DEA has not been applied so far to assess the performance of EPC projects taking into account the project EPCOM cycle. Moreover, there is a lack of ex ante evaluation studies to assess the DEA-based efficiency of infrastructure projects. The current study aims to fill this gap by employing series two-stage DEA to assess ex ante the efficiency of a sample of projects and open the black box of the EPCOM cycle. In addition, the current research contributes to the existing literature by employing series two-stage DEA for ex ante evaluation of EPC power plant projects.
3. Problem Statement
A number of EPC projects are over budget or behind schedule, and these failures are real challenges for EPC contractors. The assessment of a project portfolio’s performance relies upon data analysis and benchmarks. Having access to the project portfolio of a contractor, the benchmarks (i.e., best-in-class projects) for the investment (i.e., EPC) and operational stages can be defined by means of DEA and, moreover, these benchmarks can be used for planning necessary interventions to improve performance. Interventions does not involve actions concerning only time and budget in the investment stage, but also the revenue from sold electricity in the operational stage. Thus, for EPC power plant projects, benchmarks should be sought for the EPC and operational stage.
It is worth noticing that, in the case of power plants, the assumption about the existence of a local transmission grid should be made. In particular, the assumption about the existence of a micro grid seems more realistic, since a micro grid is an aggregate of many small-scale distributed energy resources [36,37]. The micro grid can operate either as independent unit or together with the existing grid.
The coordinated control of multiple sources in a micro grid has some technical difficulties, depending on the structure of micro grid [38], whereas the ultimate goal is the optimization of the micro grid, which may be achieved using simulation techniques [36]. Although the optimization of the micro grid or smart power grid (i.e., an intelligent power grid established by integrating information technology [37]) is challenging, especially from a distribution network operator’s point of view, in the current study the analysis is restricted to the EPC and operation stages of power plants (the cost of project completion includes the cost of connection with the existing power grid).
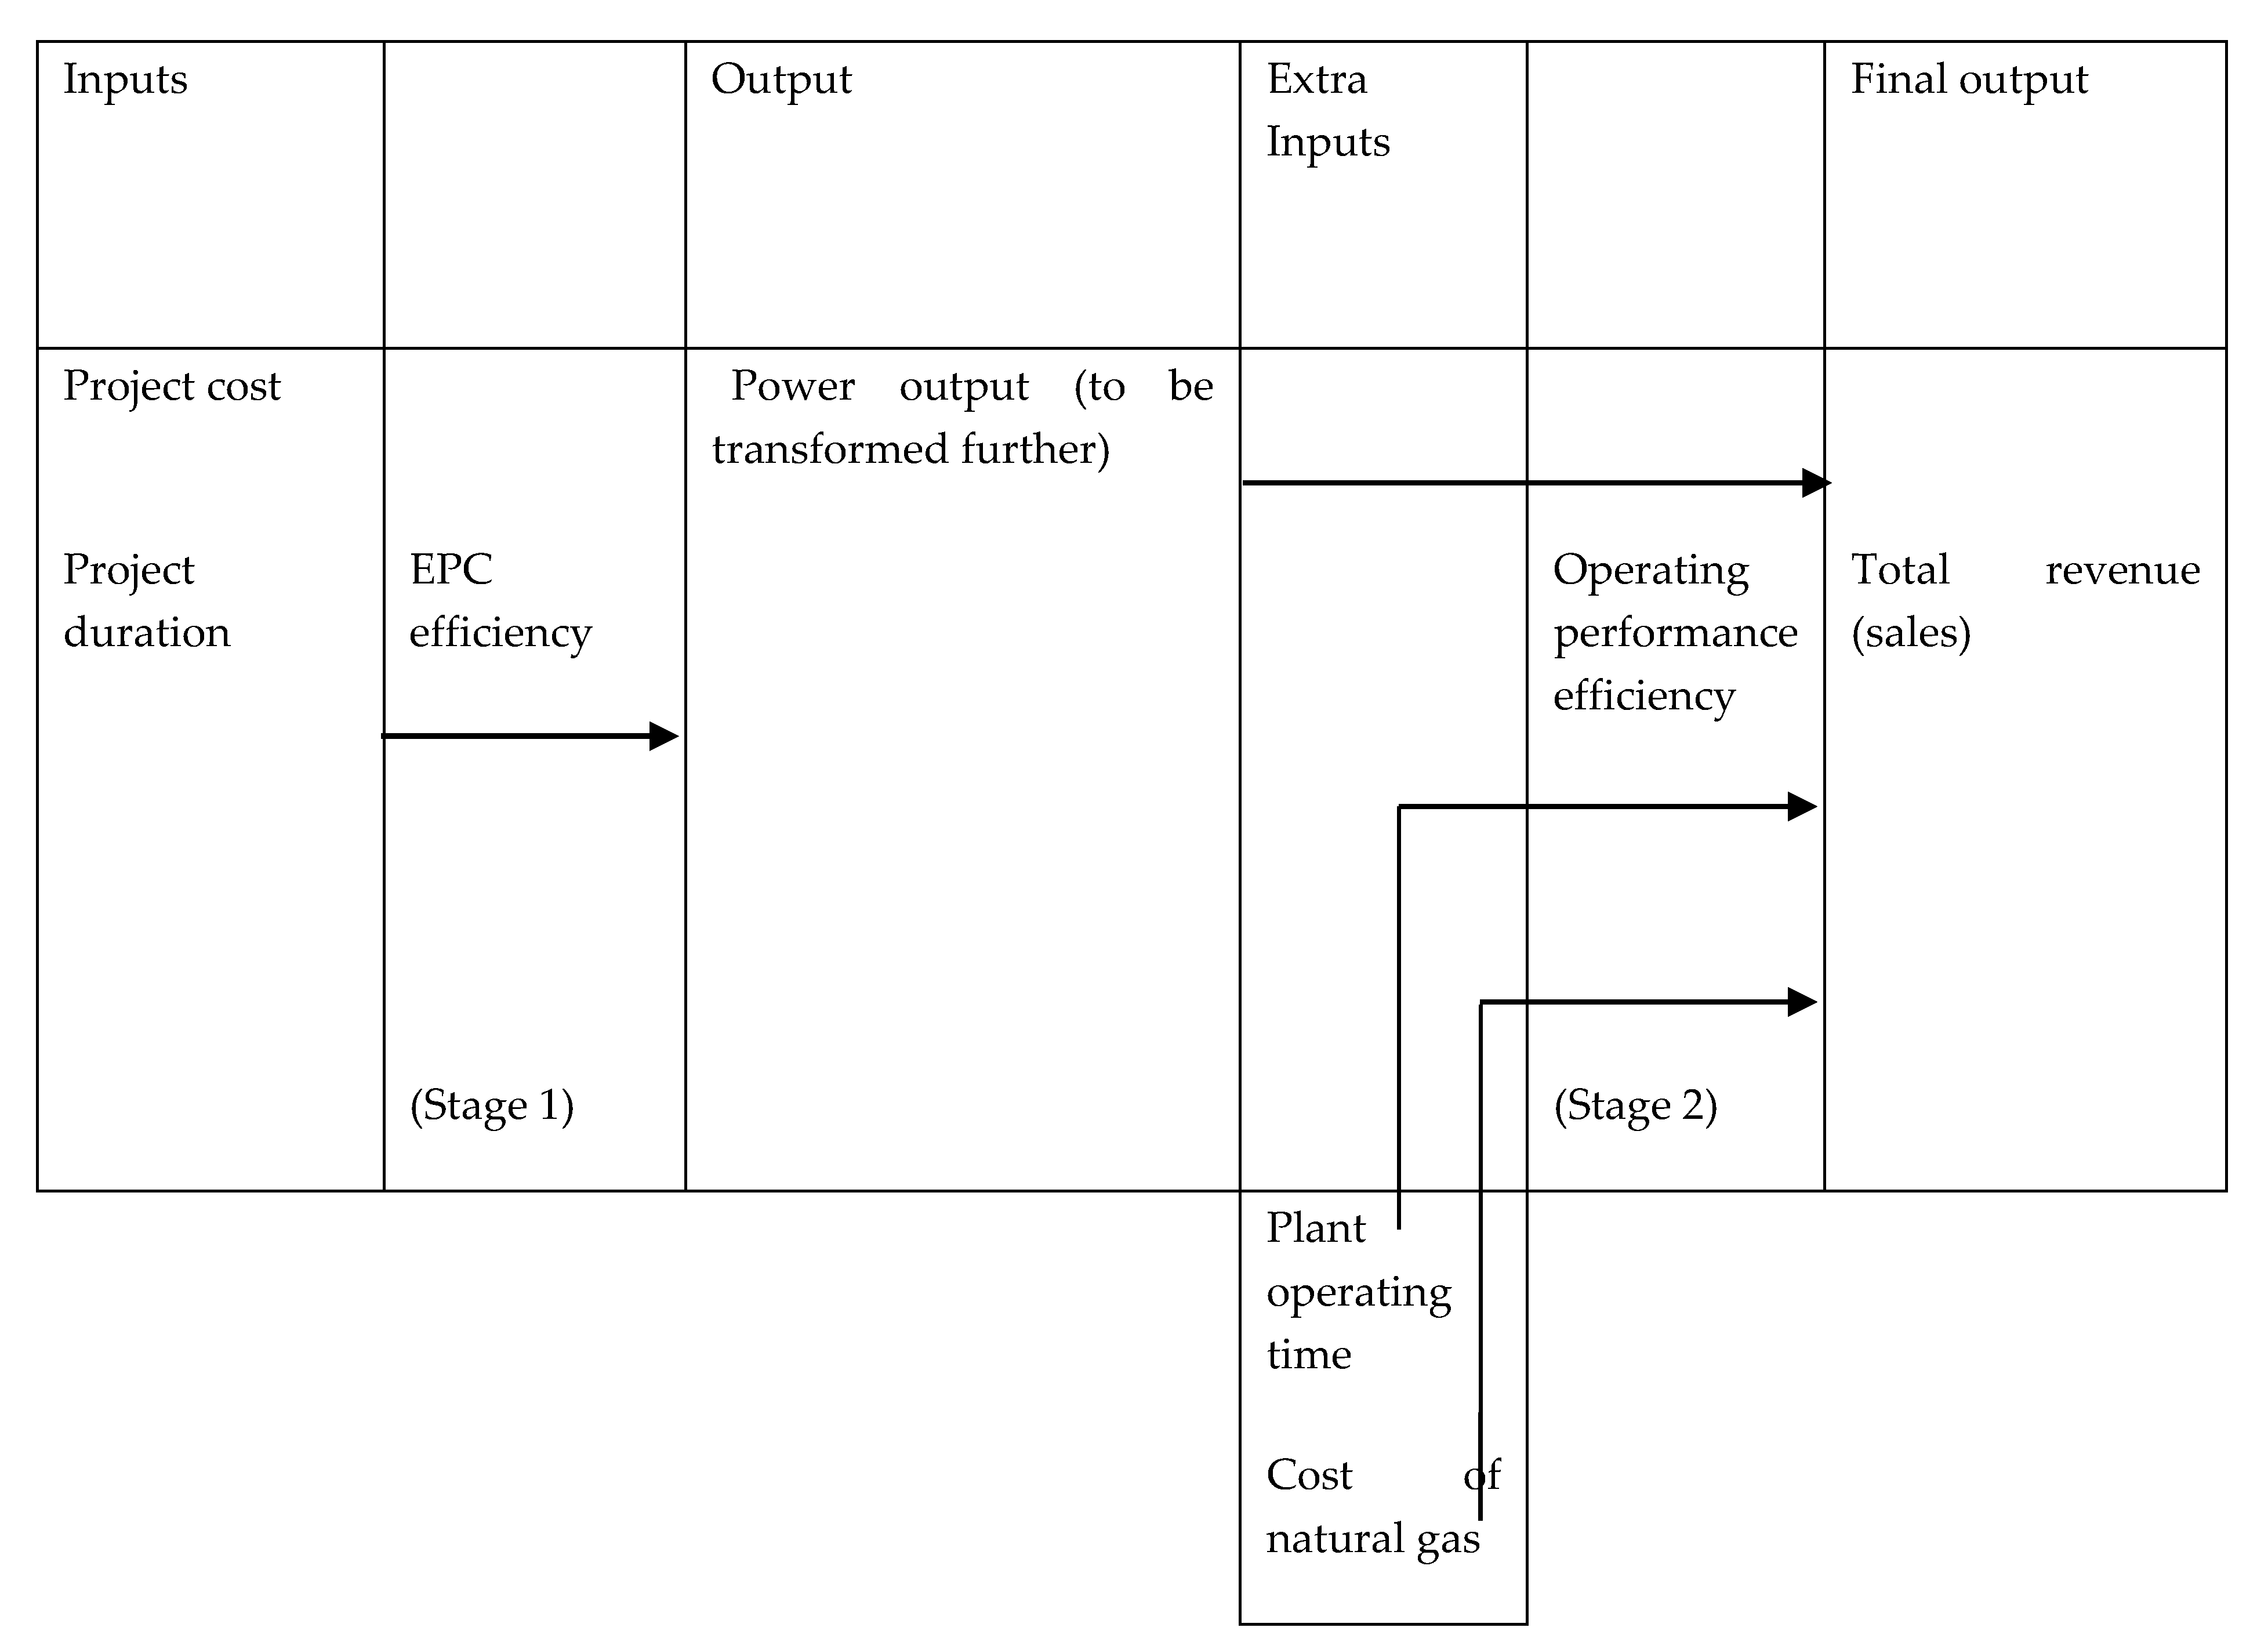
The classic single stage DEA method uses only the information on inputs and outputs to evaluate the efficiency, which reflects the relationship between inputs and outputs, and can be measured by the ratio of maximum outputs with fixed inputs or the ratio of minimum inputs with fixed outputs [39]. In the case of a group of power plant projects that form the portfolio of an EPCM contractor, each project is deemed as a system with two sub-processes: the EPC mode and the operation stage (i.e., production optimization). Instead of measuring the efficiency of each project as a whole system without considering its internal structure (i.e., EPC mode and operation stage), the whole system is divided into such two sub-processes and each of them is studied separately. Thus, the project efficiency can be evaluated with better effect than by employing the classic single stage DEA method. Therefore, the current paper proposes a series two-stage DEA approach. In the first stage (sub-process), the principles of internal benchmarking in construction are used; project cost and project duration are regarded as inputs, while the plant power output (i.e., capacity) is regarded as the output variable. In the second stage (sub-process), the internal benchmarking aims at identifying best practices within the group of projects; the plant power output (of the first stage) is regarded as input, together with other extra inputs, such as plant operating time and the cost of natural gas, while the revenue from sold electricity is regarded as the output variable.
4. DEA Modeling
This section deals with model structure (i.e., single or series two-stage DEA), model selection and model orientation.
4.1. Series Two-Stage DEA Model
The EPC contractor in our case study also provides operating services after project completion; thus, the life cycle of a sample project includes the EPC and operation stages. Taking into account the availability of project data, the current study employs the series two-stage DEA model to derive project efficiency scores in both the EPC and operation stages.
The independent approach [40] is employed for the assessment of projects (i.e., each stage is treated as operating independently of the other) and the efficiency of each stage is also therefore calculated independently.
In particular, by employing the independent approach, a series two-stage structure is adopted in which the output of the first sub-stage (i.e., EPC) is treated as input for the second sub-stage, together with some other extra inputs. In summary, inputs like funding (i.e., cost) and project duration are used in stage 1 to construct the power plants as proxied by their power output (capacity in MW). In (the operation) stage 2, the power output (of stage 1), together with plant operating time (in months per year) and cost of natural gas are used to create economic benefits (i.e., revenues). This series two-stage structure is illustrated in Figure 1.
4.2. Model Selection-Model Orientation
The sample used herein includes projects that are different in size; hence, the BCC model [41] is selected to take into account scale effects.
In regard to model orientation, input minimizing models determine the input decrease that could be attained with the current level of output(s), while output maximizing models indicate the maximum possible output increase for the given level of inputs.
Contractors and power plant operators typically have little or no direct control over both the pre-specified power plant output (stage 1) and the electricity demand required by the plant customers (stage 2), and, therefore, input-orientation was chosen (i.e., BCC input-oriented model).
The case study application seeks to determine to what extent the project management of the contractor could succeed in improving the performance of projects in stage 1 by reducing project duration (time) and cost, given project output (plant capacity), and, moreover, whether the operator could be effective by reducing project output (plant capacity), project operational cost (cost of natural gas) and plant operating hours, given total revenue.
Assuming that there is a group of n projects, j = 1,…, n, that use inputs X∈ℜm+ to produce outputs Y∈ℜk+, and xij and yrj are the ith input and rth output, respectively, used by the jth project, the following BCC or variable returns to scale input-oriented value-based Model (1) [42] is selected to assess the efficiency of projects:
where ε > 0, a small positive number (non-Archimedean); μr = output weights estimated by the model; and vi = input weights estimated by the model.
5. Data and Selection of Inputs and Outputs
The data on twelve (domestic and international) power plant EPC projects used in this study have been taken from Papadimitriou [27]. The sample of plants powered by natural gas includes 5 Combined Cycle Power Plants (CCPPs) with single shaft configuration, 5 CCPPs with multi-shaft configuration and 2 Open Cycle Power Plants (OCPPs) with single shaft configuration. Out of 12 power plant projects, 5 are domestic (located in Greece) and the rest are international. The selected project data include figures on contract project duration and cost, power output, plant operating time, annual cost of natural gas, and annual total revenue.
Taking into account the availability of project data, the current study employs the series two-stage DEA model to calculate the efficiency of projects in both the EPC and operational stages.
To justify the use of inputs and outputs in the DEA assessments, two isotonicity tests [43], one for each performance dimension, were conducted by calculating all inter-correlations between inputs and outputs. These tests are used to identify whether the increase of inputs leads to greater outputs. The tests were passed, as positive inter-correlations were found for the inputs and outputs used in the two stages.
The variables used in the analysis are depicted in Table 1.
As stems from the above, there are three and four variables in the first and second DEA assessments (Stage 1 and Stage 2), respectively. The selected 12 projects meet the requirements of the rule of thumb of Cooper et al. [44].
The descriptive statistics of the EPC project variables are depicted in Table 2.
In the project management literature, project efficiency designates the achievement of short-term project objectives such as project cost and duration. It is distinguished from project effectiveness, which is related to the long-term objectives (i.e., business performance, end-users’ satisfaction) [45]. The EPC mode DEA-based efficiency is in line with the accomplishment of short-term project objectives. The operational DEA-based efficiency is a sales model which assumes that the operator has access to the transmission grid. The analysis in the operational stage still focuses on the short-term by using annual figures on revenues in the output side, and plant capacity, annual operating time and natural gas cost in the input side of DEA. In this way, the use of the useful life time of project, value for money and the challenges associated with accounting principles are avoided. The incorporation of these variables can be done in future research which aims to measure long term performance.
The technology of power production of plants is used after the derivation of efficiency scores in order to make comparisons on the type of projects in terms of efficiency. Differences in the efficiency in both the EPC and operational performance mode are expected due to differences in the cost structures for the above mentioned power production technologies.
6. Results
6.1. EPC Performance Assessment vs. Operating Performance Efficiency
In the light of the results produced by the BCC input-oriented Model (1), out of the 12 projects, 3 (25%) were found ex ante relatively efficient. The discrimination power of the model is deemed satisfactory. The median efficiency is of the order of about 90%. The results indicate that there is scope for improvement in performance by reducing cost and duration by about 17% (= 1− 0.83) (Table 3).
The results derived by the BCC input-oriented Model (1) suggest that, out of the 12 projects, 7 (58%) were found ex ante relatively efficient. The discrimination power of the model is lower compared with stage 1, but this is a feature of the BCC model and, thus, the results are deemed acceptable. The median efficiency is of the order of about 100%. Moreover, there is the potential for improvement in operating performance efficiency by reducing plant capacity and operating time, and the cost of natural gas by about 11% (= 1− 0.89) (Table 3).
From the above results, it is evident that there is a lower level of performance in the EPC mode than in operating efficiency.
6.2. CCPP vs. OCPP Power Plant Project Performance
In the light of the results of the current study, CCPP-SS projects have on average the better performance in the EPC mode (93.30%), followed by OCPP-SS (77.34%) and CCPP-MS projects (75.25%).
The OCPP projects achieve the best operational efficiency (100%), followed by OCPP-SS (99.41%) and CCPP-MS projects (74.39%).
It should be noted that CCPP-MS projects have a higher implantation cost compared to other projects, whereas OCPP projects have lower fuel costs. These project characteristics are taken into account by the DEA model and thus the CCPP-MS projects have, on average, the worst efficiency in the EPC mode, whereas the OCPP projects have the best operating efficiency.
To investigate the sensitivity of the results, the two OCPP projects were excluded from the operating efficiency analysis. The derived operating efficiency scores for the rest of the CCPP projects remained the same.
6.3. The Best-In-Class Projects
The EPC performance assessment results provide as best-in-class the domestic project D1 and the international projects I2 and I6. The operating performance efficiency results provide as best-in-class four domestic projects (D2-D5) and three international projects (I1-I2, I6). The best-in-class projects in both dimensions of performance are the international projects I2 and I6.
7. Policy Implications
By employing the series two-stage model, the group of projects can be classified in stage 1 into EPC ex ante efficient (best-in-class) and inefficient, and in stage 2 into operating ex ante efficient and inefficient.
The managerial implications are clear. The BCC model determines the DEA rating of each project in both the EPC and operating stages. The derived DEA-based scores can help project managers, as they represent the level of predicted performance during the EPC and operating stages. These scores can allow project managers to set priorities and seek improvements along the EPC and operating stages. Moreover, the results may be also used by electricity producers and regulators.
8. Conclusions
The current study adopts a series two-stage DEA model for the ex ante performance assessment of a sample of 12 natural gas-fired power plant projects, taking into account their EPCOM cycle. The data on domestic and international power plant projects were used to demonstrate the applicability and analytical usefulness of the proposed framework. The series two-stage framework is deemed superior to classic single-stage DEA assessment because it tries to open the black box of the EPCOM mode in the case of power plant projects. In the first stage of analysis, EPC project DEA-based efficiency scores are produced from the input minimization BCC model using contract data on project cost and duration as inputs and power as output. In the second stage, the operating performance efficiency of the projects is also assessed by means of the input minimization BCC model, using the estimated plant capacity, cost of natural gas and plant operating time as inputs, and the estimated monetary outcomes (i.e., total revenue) generated as output. The series two-stage model provides for each stage a project DEA-based efficiency score that takes values between zero and unity, and it reflects how well the project is performing in each stage.
The results indicate that, out of the 12 sample projects, only three and seven are ex ante efficient in the DEA context in stages 1 and 2, respectively. It is also evident that there is a lower level of performance in the EPC mode than in operating efficiency. The OCPP projects have the best operating efficiency, whereas they are ranked in-between the CCPP-SS and CCPP-MS projects in EPC mode performance.
The derived consolidated metrics in stages 1 and 2 can serve for project managers and power plant operators as an indicator of the level of achievement of the projects in the EPC and operational stage, respectively. Moreover, it might be also considered as an indicator for the performance of the EPC and the operational team of the project.
In the current research, the performance of a sample of EPC power plant projects from the contractor’s/operator’s point of view was evaluated. Avenues for future research could be (i) the integration of DEA with other methods and (ii) the extension of research to incorporate variables that deal with the transmission grid.
Funding
This research received no external funding.
Conflicts of Interest
The author declares no conflict of interest.
References
- Chen, Y.Q.; Lu, H.; Lu, W.; Zhang, N. Analysis of project delivery systems in Chinese construction industry with data envelopment analysis (DEA). Eng. Constr. Archit. Manag. 2010, 17, 598–614. [Google Scholar] [CrossRef]
- Gatti, S. Project Finance in Theory and Practice; Elsevier: Burlington, MA, USA, 2008. [Google Scholar]
- Wagner, R. EPC-Projects, a Class of Its Own. 2018. Available online: https://www.ipma.world/epc-projectsclass/ (accessed on 28 October 2019).
- DLA Piper. EPC Contracts in the Power Sector. 2011. Available online: www.dlapiper.com (accessed on 11 April 2020).
- Pícha, J.; Tomek, A.; Löwitt, H. Application of EPC contracts in international power projects. Procedia Eng. 2015, 123, 397–404. [Google Scholar] [CrossRef] [Green Version]
- Marketwatch. Global Power Generation EPC Market 2019 Trends, Market Share, Industry Size, Opportunities, Analysis and Forecast to 2025. 2019. Available online: www.marketwatch.com/ (accessed on 11 April 2020).
- Zhang, L. Regulations Concerning Equipment Quality Supervision and Surveillance for Nuclear Power Plant EPC Projects. In Proceedings of the 18th International Conference on Nuclear Engineering, Xi’an, China, 17–21 May 2010; Volume 6, pp. 485–487. [Google Scholar]
- Wagner, R.F. EPC 4.0. The Quest of Reducing CAPEX in EPC Projects. In Proceedings of the 14th International Conference Organization, Technology and Management in Construction and 7th International Project Management Association Research Conference, Zagreb, Croatia, 4–7 September 2019; pp. 79–95. [Google Scholar]
- Munnell, A.H.; Cook, L.M. How does public infrastructure affect regional economic performance? N. Engl. Econ. Rev. 1990, 5, 11–32. [Google Scholar]
- Dweiri, F.T.; Kablan, M.M. Using fuzzy decision making for the evaluation of the project management internal efficiency. Decis. Support. Syst. 2006, 42, 712–726. [Google Scholar] [CrossRef]
- Xu, L.; Liu, N.; Zhang, S.; Qiu, H.; Chen, L.; Wang, Z. Efficiency and determinants analysis of Chinese infrastructure PPP projects in the construction and operation stages. Int. J. Strateg. Prop. Manag. 2019, 23, 156–170. [Google Scholar] [CrossRef] [Green Version]
- Charnes, A.; Cooper, W.W.; Rhodes, E. Measuring the efficiency of decision making units. Eur. J. Oper. Res. 1978, 2, 429–444. [Google Scholar] [CrossRef]
- Vitner, G.; Rozenes, S.; Spraggett, S. Using data envelope analysis to compare project efficiency in a multi-project environment. Int. J. Proj. Manag. 2006, 24, 323–329. [Google Scholar] [CrossRef]
- Farris, J.A.; Groesbeck, R.L.; Van Aken, E.M.; Letens, G. Evaluating the relative performance of engineering design projects: A case study using data envelopment analysis. IEEE Trans. Eng. Manag. 2006, 53, 471–482. [Google Scholar] [CrossRef]
- Tsolas, I.E. Construction project monitoring by means of RAM-based composite indicators. J. Oper. Res. Soc. 2013, 64, 1291–1297. [Google Scholar] [CrossRef]
- Kao, C. Network data envelopment analysis: A review. Eur. J. Oper. Res. 2014, 239, 1–16. [Google Scholar] [CrossRef]
- Fisher, D.; Miertschin, S.; Pollock, D.R., Jr. Benchmarking in construction industry. J. Manag. Eng. 1995, 11, 50–57. [Google Scholar] [CrossRef]
- Kim, J.-C.; Huh, J.-H.; Ko, J.-S. Improvement of MPPT control performance using fuzzy control and VGPI in the PV system for micro grid. Sustainability 2019, 11, 5891. [Google Scholar] [CrossRef] [Green Version]
- Dyson, R.G.; Shale, E.A. Data envelopment analysis, operational research and uncertainty. J. Oper. Res. Soc. 2010, 61, 25–34. [Google Scholar] [CrossRef]
- Lee, S.; Huh, J.H. An effective security measures for nuclear power plant using big data analysis approach. J. Supercomput. 2019, 75, 4267–4294. [Google Scholar] [CrossRef]
- McCollum, J.K.; Sherman, D.J. The effect of matrix organization size and number of project assignments on performance. IEEE Trans. Eng. Manag. 1991, 38, 75–78. [Google Scholar] [CrossRef]
- Belout, A.; Gauvreau, C. Factors influencing project success: The impact of human resource management. Int. J. Proj. Manag. 2004, 22, 1–11. [Google Scholar] [CrossRef]
- Gobeli, D.H.; Larson, E.W. Relative effectiveness of different project structures. Proj. Manag. J. 1987, 18, 81–85. [Google Scholar]
- de Wit, A. Measurement of project success. Int. J. Proj. Manag. 1988, 6, 164–170. [Google Scholar] [CrossRef]
- Pal, R.; Wang, P.; Liang, X. The critical factors in managing relationships in international engineering, procurement, and construction (IEPC) projects of Chinese organizations. Int. J. Proj. Manag. 2017, 35, 1225–1237. [Google Scholar] [CrossRef]
- Williams, G.H., Jr. An Evaluation of Construction Contracting Methods for the Public Building Sector in Oregon, 1986–2002, Using Data Envelopment Analysis. Ph.D Thesis, Portland State University, Portland, Oregon, 2003. [Google Scholar]
- Papadimitriou, E. Benchmarking of Construction and Operation of Electricity Power Plant Projects. Master’s Thesis, Hellenic Open University, Patras, Greece, 2011. [Google Scholar]
- Hedayat, M.H.; Saghehei, E. A two level DEA in project based organizations. Manag. Sci. Lett. 2012, 2, 11–20. [Google Scholar] [CrossRef]
- Guccio, C.; Pignataro, G.; Rizzo, I. Measuring the efficient management of public works contracts: A non-parametric approach. J. Public Procure 2012, 12, 528–546. [Google Scholar] [CrossRef] [Green Version]
- Niu, D.; Song, Z.; Xiao, X.; Wang, Y. Analysis of wind turbine micrositing efficiency: An application of two-subprocess data envelopment analysis method. J. Clean. Prod. 2018, 170, 193–204. [Google Scholar] [CrossRef]
- Tajbakhsh, A.; Hassini, E. Evaluating sustainability performance in fossil-fuel power plants using a two-stage data envelopment analysis. Energy Econ. 2018, 74, 154–178. [Google Scholar] [CrossRef]
- Tsolas, I.E. Firm credit risk evaluation: A series two-stage DEA modeling framework. Ann. Oper. Res. 2015, 233, 483–500. [Google Scholar] [CrossRef]
- Wu, Y.; Hu, Y.; Xiao, X.; Mao, C. Efficiency assessment of wind farms in China using two-stage data envelopment analysis. Energy Convers. Manag. 2016, 123, 46–55. [Google Scholar] [CrossRef]
- Sağlam, Ü. A two-stage data envelopment analysis model for efficiency assessments of 39 state’s wind power in the United States. Energy Convers. Manag. 2017, 146, 52–67. [Google Scholar] [CrossRef]
- Sağlam, Ü. A two-stage performance assessment of utility-scale wind farms in Texas using data envelopment analysis and Tobit models. J. Clean. Prod. 2018, 201, 580–598. [Google Scholar] [CrossRef]
- Jung, S.; Yoon, Y.T.; Huh, J.-H. An efficient micro grid optimization theory. Mathematics 2020, 8, 560. [Google Scholar] [CrossRef] [Green Version]
- Huh, J.-H. Smart Grid Test Bed Using OPNET and Power Line Communication; IGI Global: Hershey, PA, USA, 2017; pp. 1–425. [Google Scholar]
- Huang, W.; Lu, M.; Zhang, L. Survey on microgrid control strategies. Energy Procedia 2011, 12, 206–212. [Google Scholar] [CrossRef] [Green Version]
- Farrell, M.J. The measurement of productive efficiency. J. R. Stat. Soc. Ser. A 1957, 120, 253–290. [Google Scholar] [CrossRef]
- Koronakos, G. A Taxonomy and Review of the Network Data Envelopment Analysis Literature. In Machine Learning Paradigms: Applications of Learning and Analytics in Intelligent Systems; Tsihrintzis, G.A., Virvou, M., Sakkopoulos, E., Jain, L., Eds.; Springer: Berlin/Heidelberg, Germany, 2019; Volume 1, pp. 255–311. [Google Scholar]
- Banker, R.D.; Charnes, A.; Cooper, W.W. Models for estimating technical and scale efficiencies in Data Envelopment Analysis. Manag. Sci. 1984, 30, 1078–1092. [Google Scholar] [CrossRef] [Green Version]
- Thanassoulis, E. Introduction to the Theory and Application of Data Envelopment Analysis: A Foundation Text with Integrated Software; Kluwer Academic Publishers: Dordrecht, The Netherlands, 2001. [Google Scholar]
- Mostafa, M.M. Modeling the competitive market efficiency of Egyptian companies: A probabilistic neural network analysis. Expert Syst. Appl. 2009, 36, 8839–8848. [Google Scholar] [CrossRef]
- Cooper, W.W.; Seiford, L.M.; Tone, T. Data Envelopment Analysis: A Comprehensive Text with Models, Applications, References and DEA-Solver Software; Springer Science & Business Media, Inc.: New York, NY, USA, 2007. [Google Scholar]
- Aldhaheri, M.; Bakchan, A.; Sandhu, M.A. A structural equation model for enhancing effectiveness of engineering, procurement and construction (EPC) major projects: End-user’s perspective. Eng. Constr. Archit. Manag. 2018, 25, 1226–1252. [Google Scholar] [CrossRef]
Figure 1.
EPC and operating performance efficiency of sampled projects.


Table 1.
Variable descriptions.
| Variable | Definition | Units |
|---|---|---|
| Project cost | Estimated cost to complete the project | 106 Euros |
| Project duration | Estimated work months to complete the project | Months |
| Power output | Plant capacity | MW |
| Annual cost of natural gas | Estimated cost of natural gas that will be purchased at market prices during the period. | 106 Euros |
| Annual plant operating time | Estimated period of time that the plant is in operation taking into account planned (scheduled) plant outages for maintenance. | Months |
| Annual total revenue | Estimated revenue from sales of electricity | 106 Euros |
Table 2.
EPC projects: descriptive statistics.
| Project Cost (106 Euros) | Project Duration (Months) | Power Output (MW) | Annual Cost of Natural Gas (106 euros) | Annual Plant Operating Time | Annual Total Revenue (106 Euros) | |
|---|---|---|---|---|---|---|
| Mean | 387 | 30 | 577 | 38 | 9 | 46 |
| Standard deviation | 225 | 6 | 232 | 17 | 2 | 14 |
| Median | 314 | 28 | 566 | 37 | 11 | 45 |
| Min | 140 | 24 | 220 | 13 | 7 | 13 |
| Max | 767 | 40 | 871 | 75 | 12 | 76 |
Table 3.
Power plant project characteristics (production technology, location), efficiency measures and descriptive statistics.
Table 3.
Power plant project characteristics (production technology, location), efficiency measures and descriptive statistics.
| Project Category/No. | Technology | EPC Performance | Operating Efficiency |
|---|---|---|---|
| Domestic projects | |||
| D1 | CCPP-SS | 100.00% | 97.06% |
| D2 | CCPP-MS | 90.89% | 100.00% |
| D3 | CCPP-SS | 90.63% | 100.00% |
| D4 | CCPP-SS | 83.46% | 100.00% |
| D5 | CCPP-SS | 92.41% | 100.00% |
| International projects | |||
| I1 | OP-SS | 54.67% | 100.00% |
| I2 | OP-SS | 100.00% | 100.00% |
| I3 | CCPP-MS | 79.10% | 93.79% |
| I4 | CCPP-MS | 60.66% | 48.44% |
| I5 | CCPP-MS | 55.89% | 48.79% |
| I6 | CCPP-SS | 100.00% | 100.00% |
| I7 | CCPP-MS | 89.71% | 80.95% |
| Mean (all projects) | 83.12% | 89.09% | |
| Standard deviation (all projects) | 16.98% | 19.68% | |
| Median (all projects) | 90.17% | 100.00% | |
| Min (all projects) | 54.67% | 48.44% | |
| Max (all projects) | 100.00% | 100.00% | |
| Mean (CCPP-MS projects) | CCPP-MS | 75.25% | 74.39% |
| Mean (CCPP-SS projects) | CCPP-SS | 93.30% | 99.41% |
| Mean (OCPP-SS projects) | OCPP-SS | 77.34% | 100.00% |
CCPP-SS: Combined Cycle Power Plant, single shaft configuration; CCPP-MS: Combined Cycle Power Plant, multi-shaft configuration; OCPP-SS: Open Cycle Power Plant, single shaft configuration.
© 2020 by the author. Licensee MDPI, Basel, Switzerland. This article is an open access article distributed under the terms and conditions of the Creative Commons Attribution (CC BY) license (http://creativecommons.org/licenses/by/4.0/).
Share and Cite
MDPI and ACS Style
Tsolas, I.E. Benchmarking Engineering, Procurement and Construction (EPC) Power Plant Projects by Means of Series Two-Stage DEA. Electricity 2020, 1, 1-11. https://0-doi-org.brum.beds.ac.uk/10.3390/electricity1010001
AMA Style
Tsolas IE. Benchmarking Engineering, Procurement and Construction (EPC) Power Plant Projects by Means of Series Two-Stage DEA. Electricity. 2020; 1(1):1-11. https://0-doi-org.brum.beds.ac.uk/10.3390/electricity1010001
Chicago/Turabian StyleTsolas, Ioannis E. 2020. "Benchmarking Engineering, Procurement and Construction (EPC) Power Plant Projects by Means of Series Two-Stage DEA" Electricity 1, no. 1: 1-11. https://0-doi-org.brum.beds.ac.uk/10.3390/electricity1010001