1. Introduction
The increasing rollout of electric vehicles (EVs) will offer significant potential for sub-aggregation in the near future [
1,
2]. Network services, such as frequency regulation or peak shaving through scheduled reductions of EV charging loads, seem to be technically viable due to the disperse location of charging sites and to electric vehicles’ aggregated power capacity, relatively fast controllability, and long parking times [
3,
4,
5,
6,
7,
8]. EVs are not owned by a system operator, which means that before such services can be put into practice, private customers must be willing to participate in the process with their own vehicles. Naturally, this will put significant pressure on the system to maintain a high quality in charging services without reducing the customer experience while using the vehicles of the customers to support the power system. It has been demonstrated that 76% of the users of public charging stations prefer the quality of the charging service over the price of charging [
9]. Ideally, network services would be carried out without any noticeable harm to the customers; thus, it is essential to obtain insightful data on the load characteristics of charging sites in order to identify where and when planned load reductions can be carried out with a minimal impact on customers. This would mean that a customer would be able to use their EV without noticing that the vehicle has been charged at reduced power during the charging session.
A pilot study in Amsterdam analyzed the impacts of a smart charging algorithm on the quality of the charging service at public charging sites [
10]. A total of 43,904 charging sessions were analyzed, which were categorized according to the number of charging phases and the average charging power. The smart charging algorithm limited the charging during the daily peaks at 07:00−08:30 and 17:00−20:00 and increased the charging capacity outside the peak hours. The authors of the study concluded that 5% of charging sessions were negatively affected by the load reduction during peak hours. Due to the increment of the charging capacity, 4% of the sessions were positively affected. Further, 14% of the sessions were positively affected when only electric vehicles with higher charging powers were considered. Out of all sessions, 91% were not affected at all. Another study [
10] had many similarities with this paper, with the fundamental difference being that the purpose was not to maximize the quality of the charging service, but rather to analyze the impacts of a specific smart charging algorithm on the quality of the charging service. Another difference was that all of the charging data used in [
10] originated from public charging sites; thus, the previous study did not provide insights into the differences between various categories of charging sites. A third difference was that in [
10], the load increase was also studied, whereas in this paper we focus solely on load reductions, while during other times maximum charging capacity is provided to the customers.
Another earlier study [
11] presented a charging management method for EVs to optimize the state of the network, where the quality of the charging service was one constraint. For each EV, a minimum amount of energy-to-be-received is stated, which is about 0.17 kWh per driven kilometer, meaning that the algorithm must know either the number of kilometers driven or the state-of-charge of each vehicle before the start of each charging session. This is not possible in practice with the current charging systems. Even if the data could be provided manually by the users, users are often unwilling to do so [
12]. The study did not employ real charging data; rather the used data was based on a survey of parking times and driving distances in Beijing. As the used data was synthetic, the accuracy of the results may have not reflected the reality [
13]. As such, the study did not provide insights into charging behavior between charging sites. Indeed, the paper’s main focus was on theoretical findings; that is, presenting a methodology for energy management, without much discussion of real charging behavior or the practical implications. In [
14,
15], a smart charging algorithm was presented to minimize the frequency deviation of the network by considering the user preferences as one input. The customers can select between three different tariffs options that vary in terms of the maximum charging power: 1.5 kW, 2.5 kW, or 7.2 kW. As in [
11], the focus of these studies [
14,
15] was on presenting a new methodology for energy management rather than focusing primarily on the customer impacts. In these studies, no real commercial charging data were used; rather synthetic data were assessed. User behavior at different types of charging sites was not considered.
In [
16], the impacts of user behavior on the charging infrastructure were studied. Based on measurements of individual users, synthetic load curves for residential, work, and public charging stations were created. The study focused on the impacts of the price of parking and electricity on the power demands for the three categories of charging sites. The authors of [
17] generated daily load curves for EVs based on traveled distances and the social characteristics of the users, such as their gender, age, and level of education. Other previous studies [
16,
17] did not discuss smart algorithms or the quality of charging services but gave insights into the characteristics of different user groups when planning sub-aggregation. In another study [
18], a model for a fast-charging station was developed. The impacts of various parameters were studied, such as effects of the number of charging points and the locations of the stations on the peak power and the quality of the charging service. Three different models of EVs and three different locations (urban, suburban, and rural) were used. The charging curves were created synthetically from mobility data.
In the literature, most charging optimization studies have focused on reducing the frequency deviation [
19], peak load [
20], line or transformer overloading [
21], current unbalance [
22], voltage sags [
23], network costs [
24], charging costs to the EV owners [
25], or charging costs to the station owners [
26,
27]; however, the quality of charging service in terms of lost energy is considered in one way or another only in [
10,
11,
14]. From these three studies, real charging data is only used in [
10].
Based on the state-of-the-art research, clear research gaps are identified. From the found research articles, only [
10] has a primary focus on the quality of charging service that is based on real-charging data. No research papers were found that study the impact of load reduction or smart charging at different types of charging sites. Despite the importance of the topic, to the knowledge of the authors, no literature of finding an optimal load reduction schedule in order to minimize the customer impact is found. The main contributions of this paper are:
Analyze the charging characteristics of four different types of charging sites: public car parks, offices, residential sites, and shopping centers. An insightful analysis based on a total number of 80,416 charging sessions are provided.
Provide a new methodology how to find an optimal schedule of load reduction through optimizing the quality of charging service by using a commercial data from charging operators.
Apply the methodology (2.) on the data (1.) in order to provide an optimal schedule of load reduction for each type of charging site.
Thus, studies with a similar focus than this paper have not been presented so far. In practice, the planning process of sub-aggregation is rather complex, taking into account several factors, including technical constraints as well as the economic benefits and drawbacks, where quality of charging service should be one of the input factors. Before quality of charging service can be included in the sub-aggregation process, the decision makers should have an overall view on the negative impacts of load reduction on quality of charging service. The purpose of this paper is not to provide an off-the-shelf algorithm that a sub-aggregator can use as such to manage load reduction. Our primary intend is to provide background information to support the decision-making about the quality of charging service in sub-aggregation, due to the fact that in the commercial charging sites of today, the charging operator does not have the information of the state-of-charge of an EV. Thus, in this paper, the quality of charging service refers to the share of the energy that is charged in the original, measured, charging session.
The rest of the paper is organized as follows.
Section 2 presents first an analysis of the used charging data. Then, it presents the proposed method to minimize the impact of load reduction on customers.
Section 3 presents the schedules of optimal load reduction and its impact on the quality of charging service.
Section 4 discusses the results and
Section 5 concludes the paper and proposes ideas for future research.
2. Materials and Methods
This section is divided in two subsections. The first subsection provides an analysis of the used charging data. The second subsection introduces the optimization method how an optimal load reduction schedule that minimizes the negative impact on customers is found.
2.1. Analysis of Charging Data
The original dataset before pre-processing had 103,195 charging sessions. The data contains the starting time of the session, the stop time of the session, the power-to-zero time, the charged energy, and the location of the site. The dataset was cleaned in a similar way as in [
28], removing all erroneous or meaningless charging sessions, such as sessions with a charged energy of 0 kWh. After cleaning, the dataset consisted of 80,416 charging sessions gathered from various commercial charging sites in Finland. Next, the parking duration, the charging duration, and the average charging power for each session were calculated. The oldest used charging sessions in the dataset are from February 2019 and the latest ones from January 2020. Sessions after January 2020 are not included in the dataset since they are likely to be affected by the COVID-19 pandemic. In that case, the charging characteristics would not represent “normal” circumstances. The charging sites are divided into four categories: public car parks, offices, residential sites, and shopping centers.
Table 1 shows how the number of charging sessions is divided between the categories.
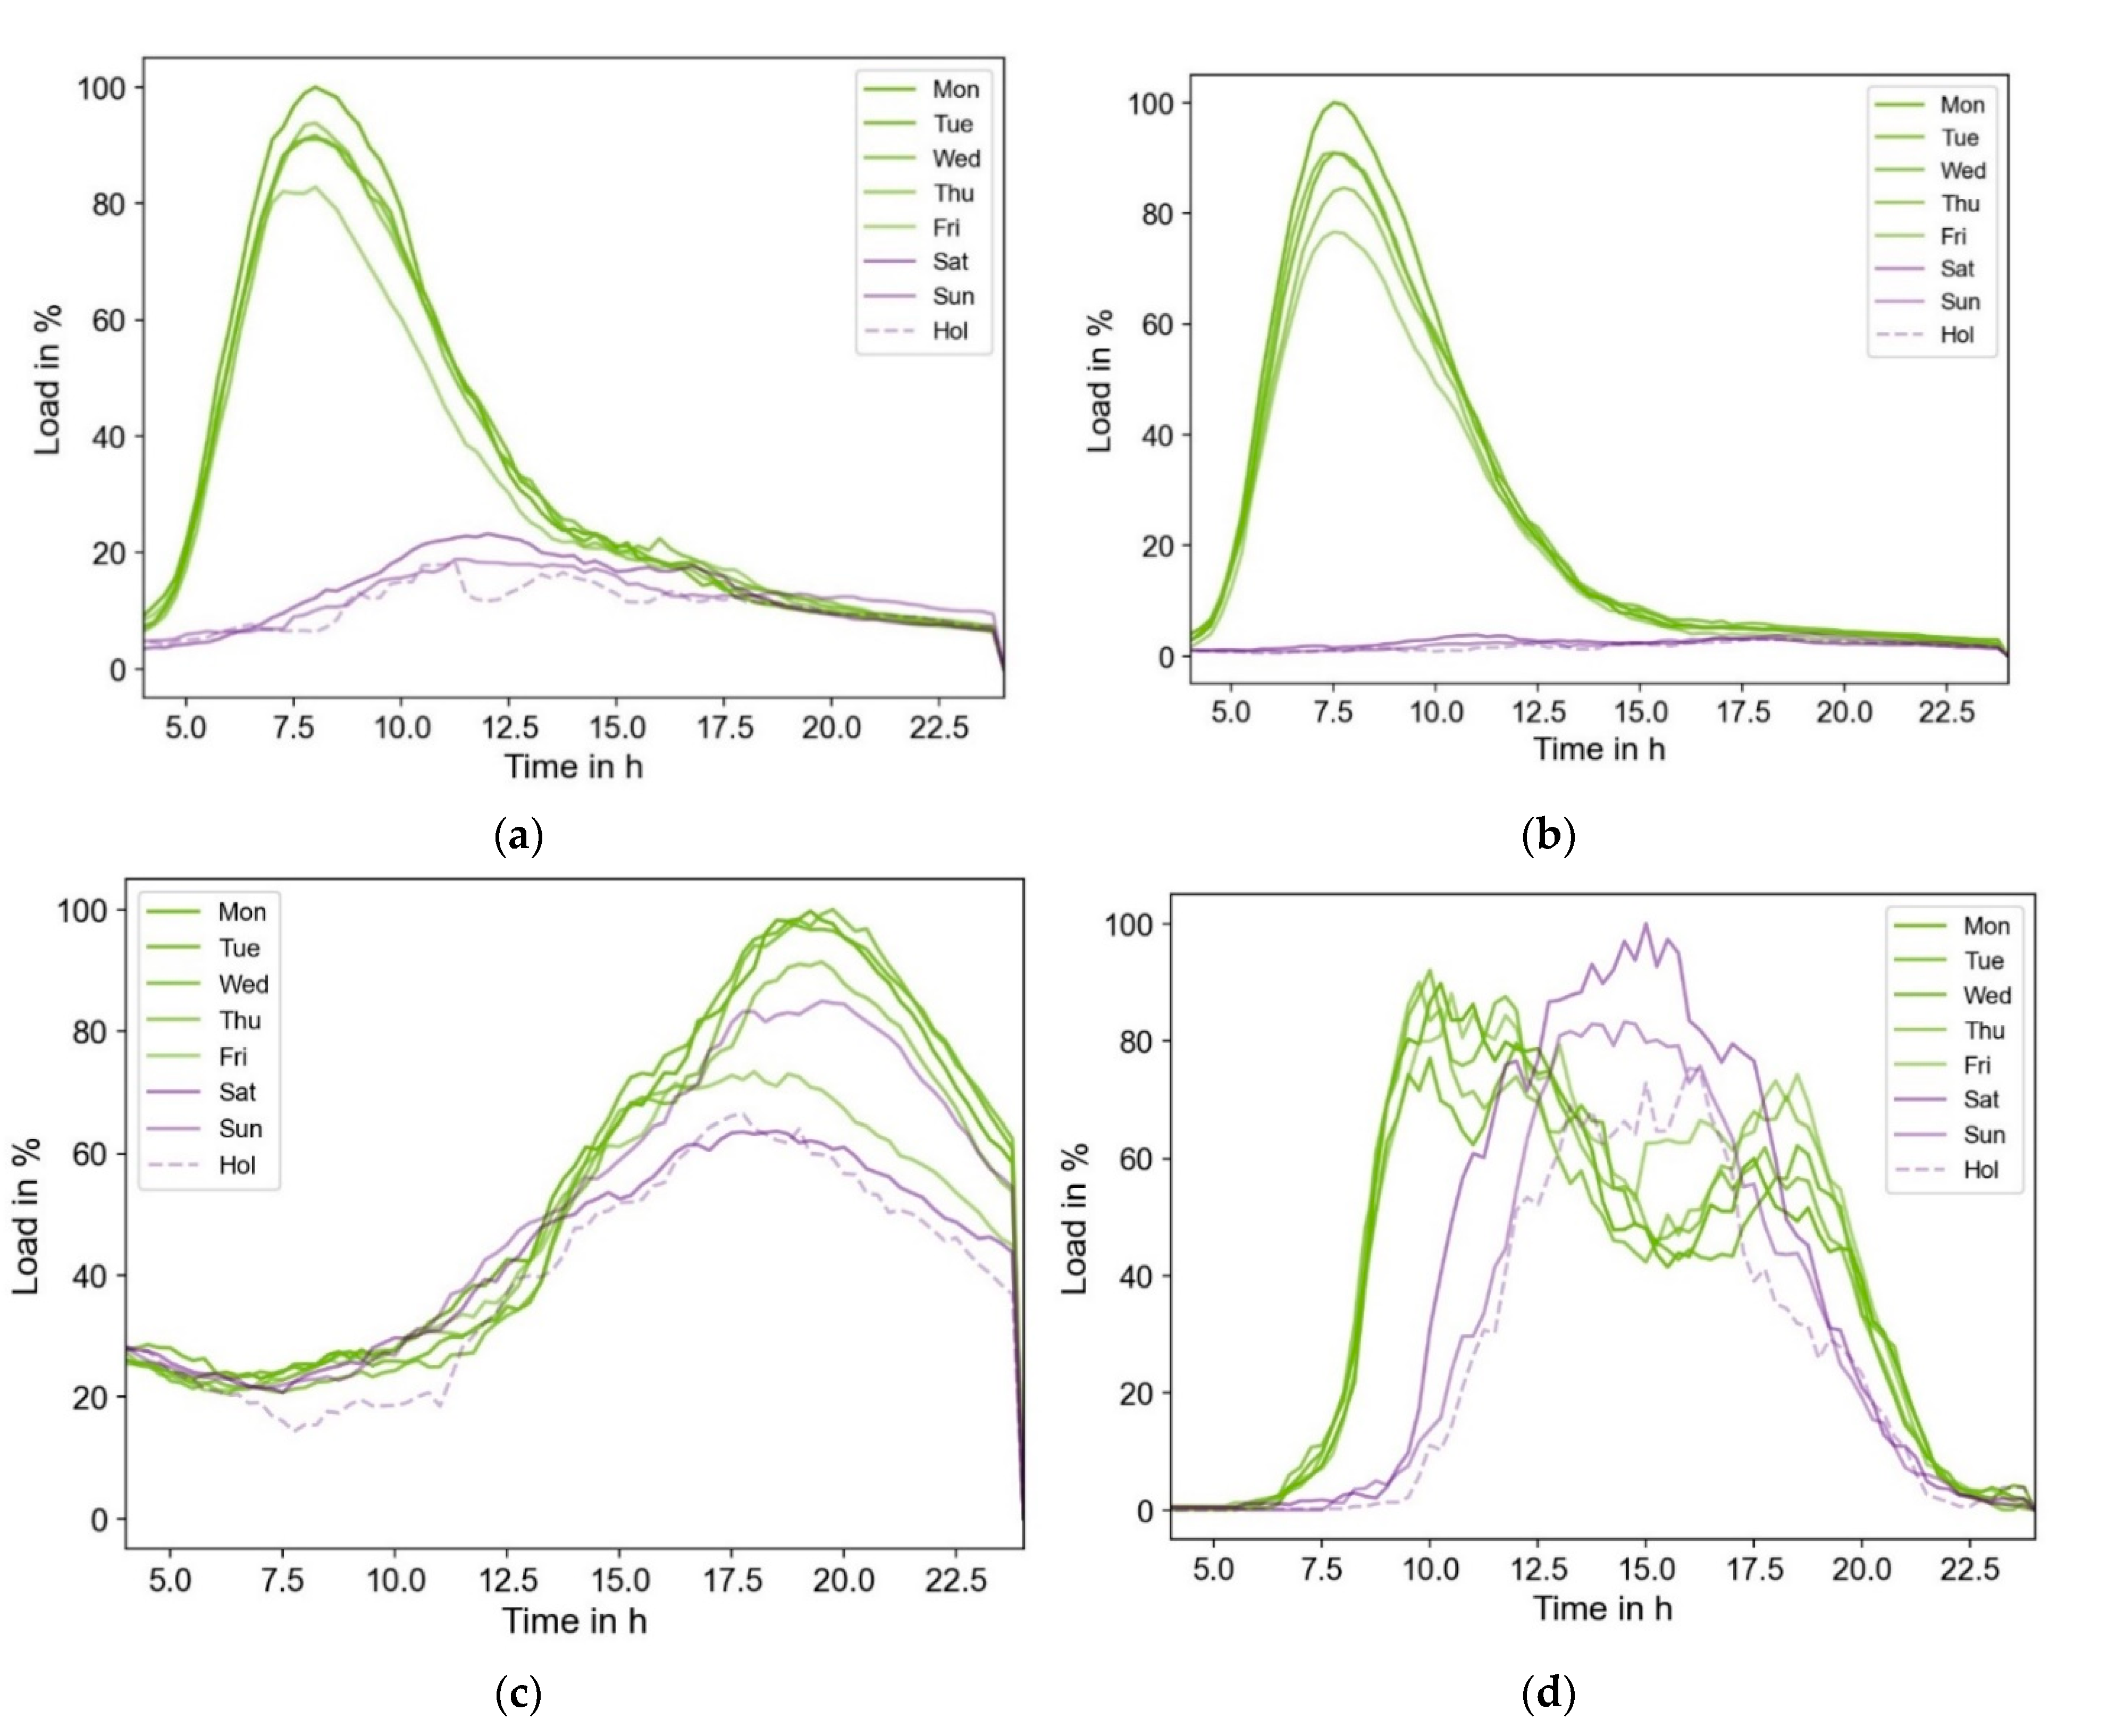
Car parks are public charging sites open to everyone. The number of charging points at all charging sites ranges from a few up to more than 300. No smart charging algorithm is applied at the charging sites. The customers could charge their EVs by using the nominal charging power of the charging station, which is in most cases is 22 kW or 11 kW. The aggregated load profiles of different types of charging sites are shown in
Figure 1. The weekdays are illustrated separately in order to highlight the difference between weekdays, weekends, and public holidays. The charging powers are normalized to percentages for easier comparison. The purpose of the figure is to provide an idea how the charging profiles vary according to the type of the site and the weekday. The curves are based on average charging powers with intervals of 5 min.
Figure 1 shows that car parks and offices have very similar load curves with the exception that car parks have more charging activities during the weekends and public holidays as the offices. The peak at both car parks and offices is roughly between 7:45 h and 8 h. On the contrary, residential charging sites possess very different charging characteristics. The load peak at the residential sites is about 20 h, and the valley period is during the early morning hours. Thus, charging load is heavily concentrated in late evenings and nighttime, although light load also occurs during the day. At residential sites, the load profile does not change dramatically between weekdays, weekends, and public holidays. In the case of shopping centers, the peak period is more dispersed than in the case of car parks, offices, and residential sites. The peak time at the shopping centers is roughly from 8 h to 19 h, which corresponds with the opening hours of most of their activities. The average peak loads of a day together with the times of occurrence are presented in
Table 2.
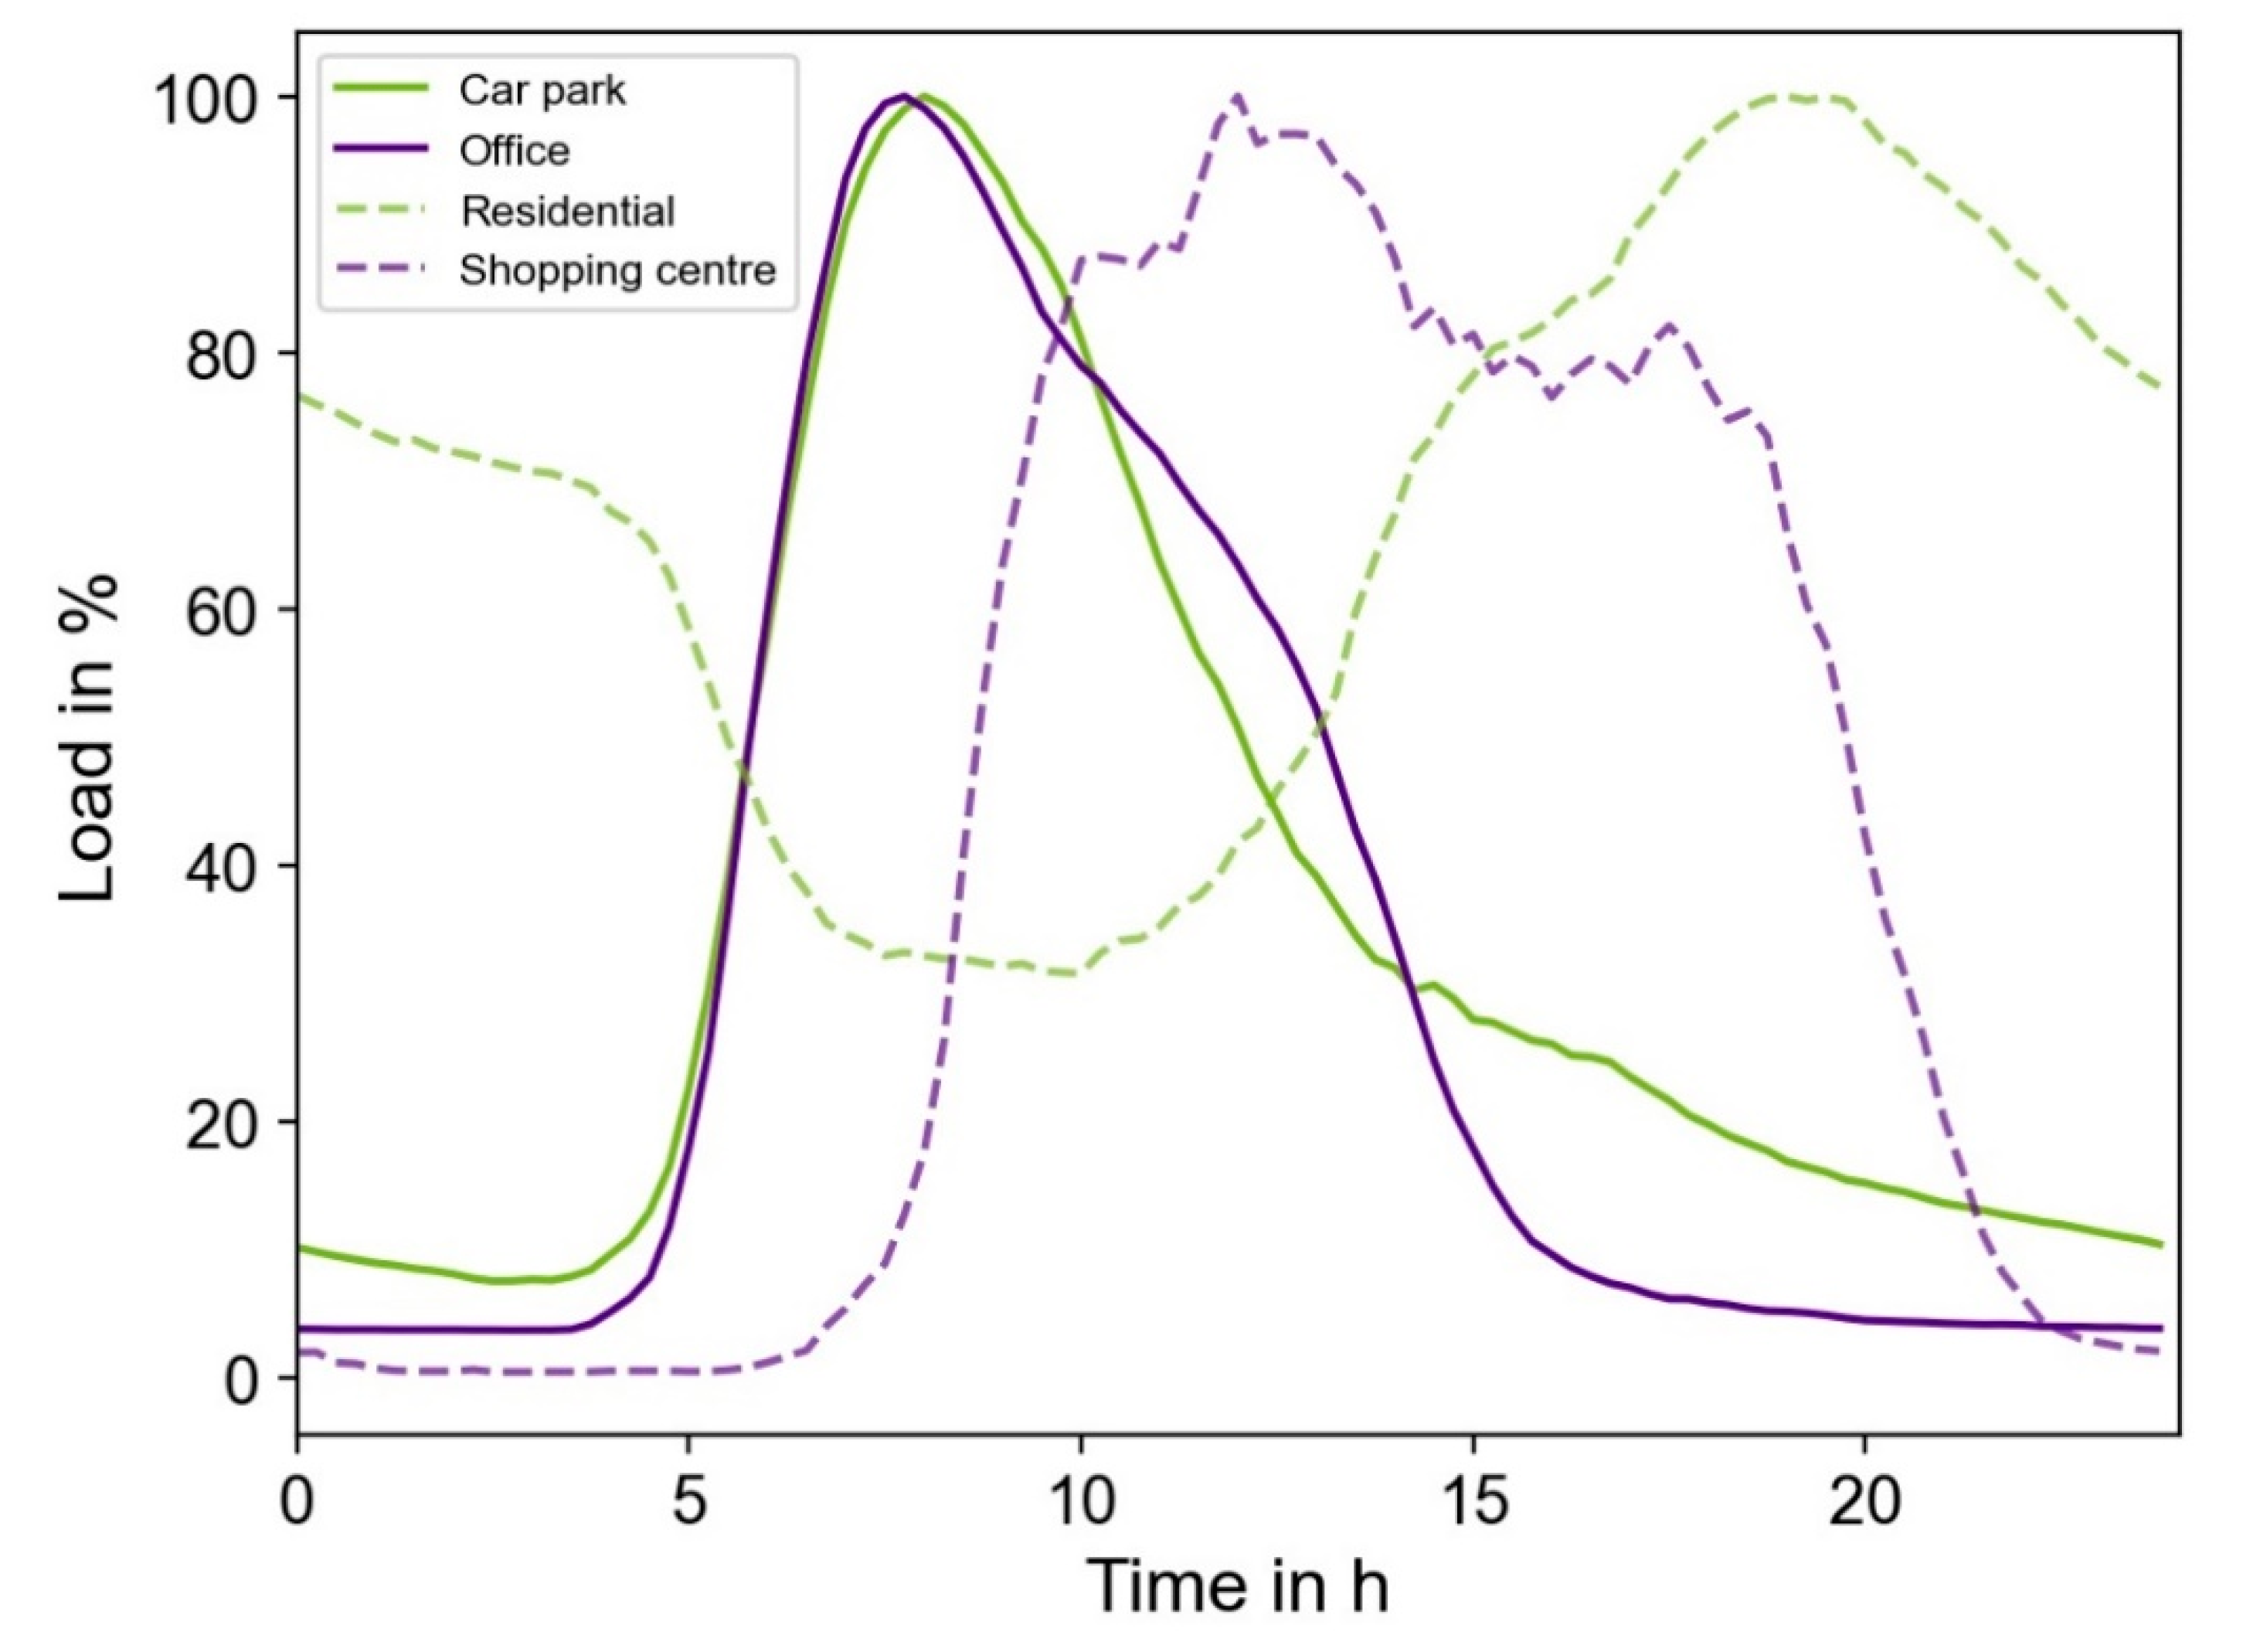
Figure 2 shows a comparison of the average load curve of all four types of charging sites. The figure illustrates the aggregated curves including all days. The purpose is to highlight the time shifts between the types of charging sites.
Figure 2 clearly illustrates that the peak of car parks and office sites coincide virtually at the same moment. It is likely that car parks are often used by a similar customer group as the users of office charging sites. They both are able to offer flexibility in terms of load reductions around the same hours. On the contrary,
Figure 2 shows that the peak hour at residential sites and shopping centers coincide at very different times than the office sites and car parks. Importantly, through
Figure 1 and in
Figure 2, it can be observed that EVs are able to provide flexibility potential to the power system almost at any given time of the day.
2.2. Optimization: Minimizing the Impact of Load Reduction on Customers
The objective of the optimization is to find a schedule of load reduction with the least impact on customers with a given amount of daily energy to be reduced. In other words, the schedule with the least total non-charged energy. Additionally, the time window, when the load reduction will be carried out, must be provided to the algorithm. The load reduction can be carried out on active charging sessions by varying three parameters: start time, duration, and power. The algorithm works in time intervals of 15 min, in the same scale as the European electricity market. The analysis considers a 5-h range (this means ι = 20 intervals).
First, the share of power of an individual charging session in the aggregated daily load is calculated as
where
σ represents the number of charging sessions during the concerned day and
represents a time interval. The participation of each vehicle in the daily load is added to form the participation pattern
ψ for each charging session as
where
is the number of all considered sessions. Analogous to (2)
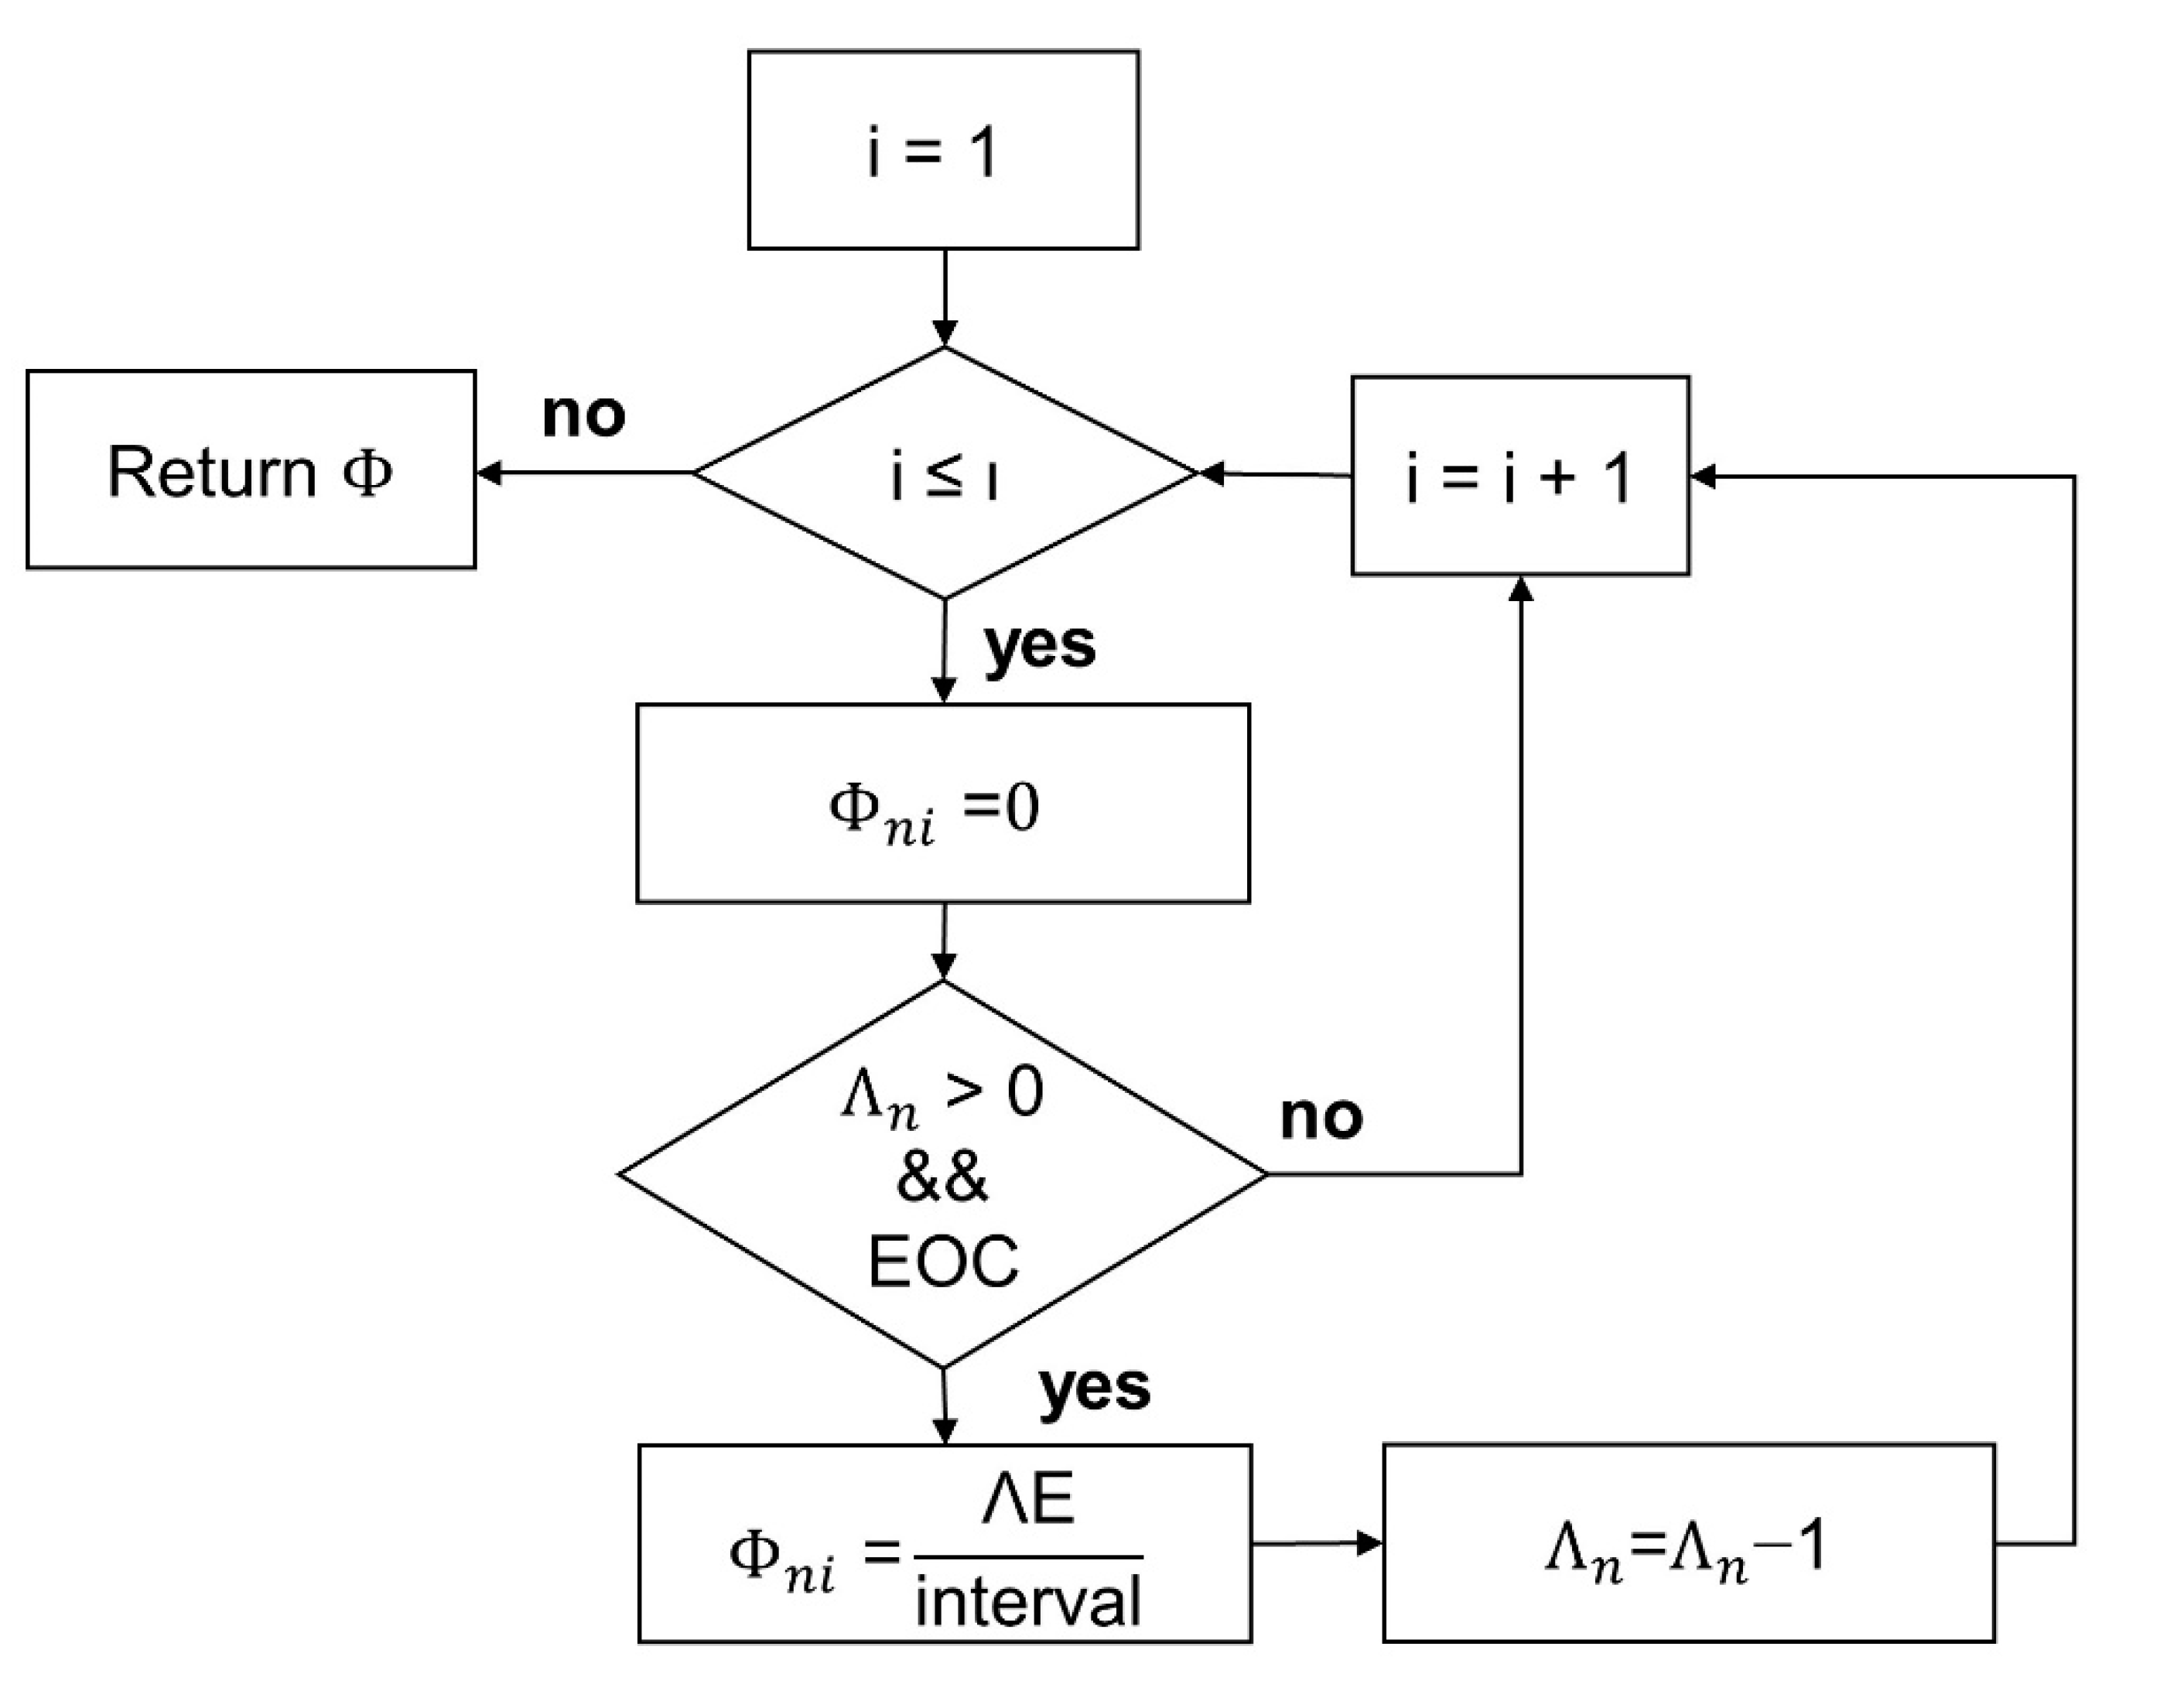
ι represents the considered intervals. The flexible sessions Λ are the difference between the parking time and the charging time in the dimension of 15 min intervals. The flowchart in
Figure 3 indicates in a simplified manner how a row n of the flexibility pattern is determined.
The first step is to verify, if the charging session is in the range, where the reduction takes place (i ≤ ι). In that case, it is determined, if flexible intervals are available and if the regular charging process has finished (EOC). As mentioned earlier, Λ can be understood as the gap between the full state-of-charge and the departure time of one charging session. Next the flexible pattern is derived by the energy (E) which is charged in one interval multiplied by the number of flexible charging sessions Λ. In conclusion, the flexibility pattern includes the energy that could be charged by postponing the charging process or reducing the charging power at the corresponding time interval.
It must be considered that the number of EVs increases every year. Thus, a vector is introduced to take this into account by weighting. Vector is a percentage between 0% and 100% and scales the total reduced energy related to the last considered day. It is derived by a least square polynomial fit with a degree of two over the aggregated daily consumed energy (). To obtain the percentage values, the vector is divided by its last element, as it turned out that those ones have been the largest. has η rows, so it includes a weight for each charging session. A constraint must guarantee that at least the requested amount of energy will be reduced within the given time window, which is an inequality constraint. Therefore, the reduced load is summed and multiplied by time to obtain the energy.
As mentioned, the objective is to find the best parameters for the load shifting between start time, duration, and power with the least effect on customers. Energy loss in each charging session is calculated as
where
is the power to be reduced.
is weighted by
to obtain an interval-wise reduction matrix for each charging session with respect to the growing energy demand during the year. The target is to find the reduction
with the least effect on the customer. The result of the weighted reduction is multiplied by the participation pattern
to form the reduced energy of a vehicle for each interval and charging session. With this, the share of one charging session (
) on the reduction of the day is related to the weighted (
κ) power which should be reduced (
). By evaluating the sum of all rows, the loss
contains the reduced energy for each charging session. To determine the end of a reduction, the last non-zero element of
is evaluated and represented by the parameter
. This permits creating a cost function
as
where
and
As seen in (3), the energy loss is set in relation with the originally charged energy in order to make the vehicles with smaller energy demand comparable with EVs with large energy demand.
The cost function is solved by minimizing the loss of energy, which also means maximizing the customer satisfaction with the given constraints. The optimization is carried out in Python by using sequential least square quadratic programming (SLSQP) in SciPy package [
29]. The minimization function returns the optimized vector of reducible energy
.
4. Discussion
Figure 1 shows the similarity between the working days in all categories of charging sites. The aggregated load curve from Monday to Friday (excluding public holidays) is very consistent. Additionally, the aggregated load curves are similar during weekends, except at shopping centers. Car parks and offices have very low loading during weekends and public holidays.
Table 2 indicates that the daily load peak happens in the morning, except at residential sites, where the peak occurs on average at 19 h. The findings suggest that when EVs are used in sub-aggregation, load reduction on weekends and public holidays should be carried out carefully and only at residential sites and shopping centers. Car parks and offices generally provide low potential for load reduction during weekends and public holidays. Due to the fact that flexibility to the power system can be offered only when the EVs are charging, it can be seen that car parks and offices can provide most of their flexibility on working days approximately from 7 h to 14 h, shopping centers from 9 h to 19 h, and residential sites from 16 h to midnight. This is without considering the impact on customers.
The reason why shopping centers also have significant load during weekends and public holidays is that in Finland there are no restrictions regarding the opening hours of shops, as in many other European countries. This means that most shops are also open on Sundays. Thus, in the countries where most shops are closed on Sundays, shopping centers are likely to provide less potential for load reduction. Additionally, other cultural differences, such as working schedules, may have a different influence on the aggregated load curves from country to country.
At car parks and office sites, the peak load occurs in the late morning, which coincides with the hours of strong sunlight. This indicates that car parks, especially in the car parks of offices, would greatly benefit from solar-powered charging sites as the EVs could be directly charged by solar energy without the need of an additional energy storage.
It can also be clearly seen in
Figure 2 that the relative load curves of office sites and car parks coincide with each other, being nearly identical. On the other hand, between residential and office sites, the situation is almost the opposite; the peak of office load occurs almost at the same time, with residential sites experiencing a period of valley. This shows how the load reduction potential of EVs spread not only geographically, but also in terms of time.
By cause of the quadratic cost function, the differences between the costs of different types of charging sites are well distinguished, which makes it a decent choice. However, the cost function could be further developed to reflect the real impact of loss of energy on the customers. The goal of this paper is to study the impact of load reduction on the quality of charging service, which means studying the impact on customers as objectively as possible. In this paper, the quality of charging service is defined as the percentage of the energy that the customers have charged in the measured real-life cases. Nevertheless, different customers may experience the same quality of charging service differently and even the same customers may experience the same quality of charging service differently in different locations. In future studies, the cost function could be further developed to reflect the customer experience instead of only the quality of charging service. This could enhance the overall customer experience, if load reductions can be carried out at locations and at times with the least impact on customer experience. Perhaps there could be a different function for each category of charging site. It can be that charging at home should be more reliable than, for example, charging at a shopping center. In any case, such improvements should be backed up by socio-economic studies in order to tie the quality of charging service with the customer experience.
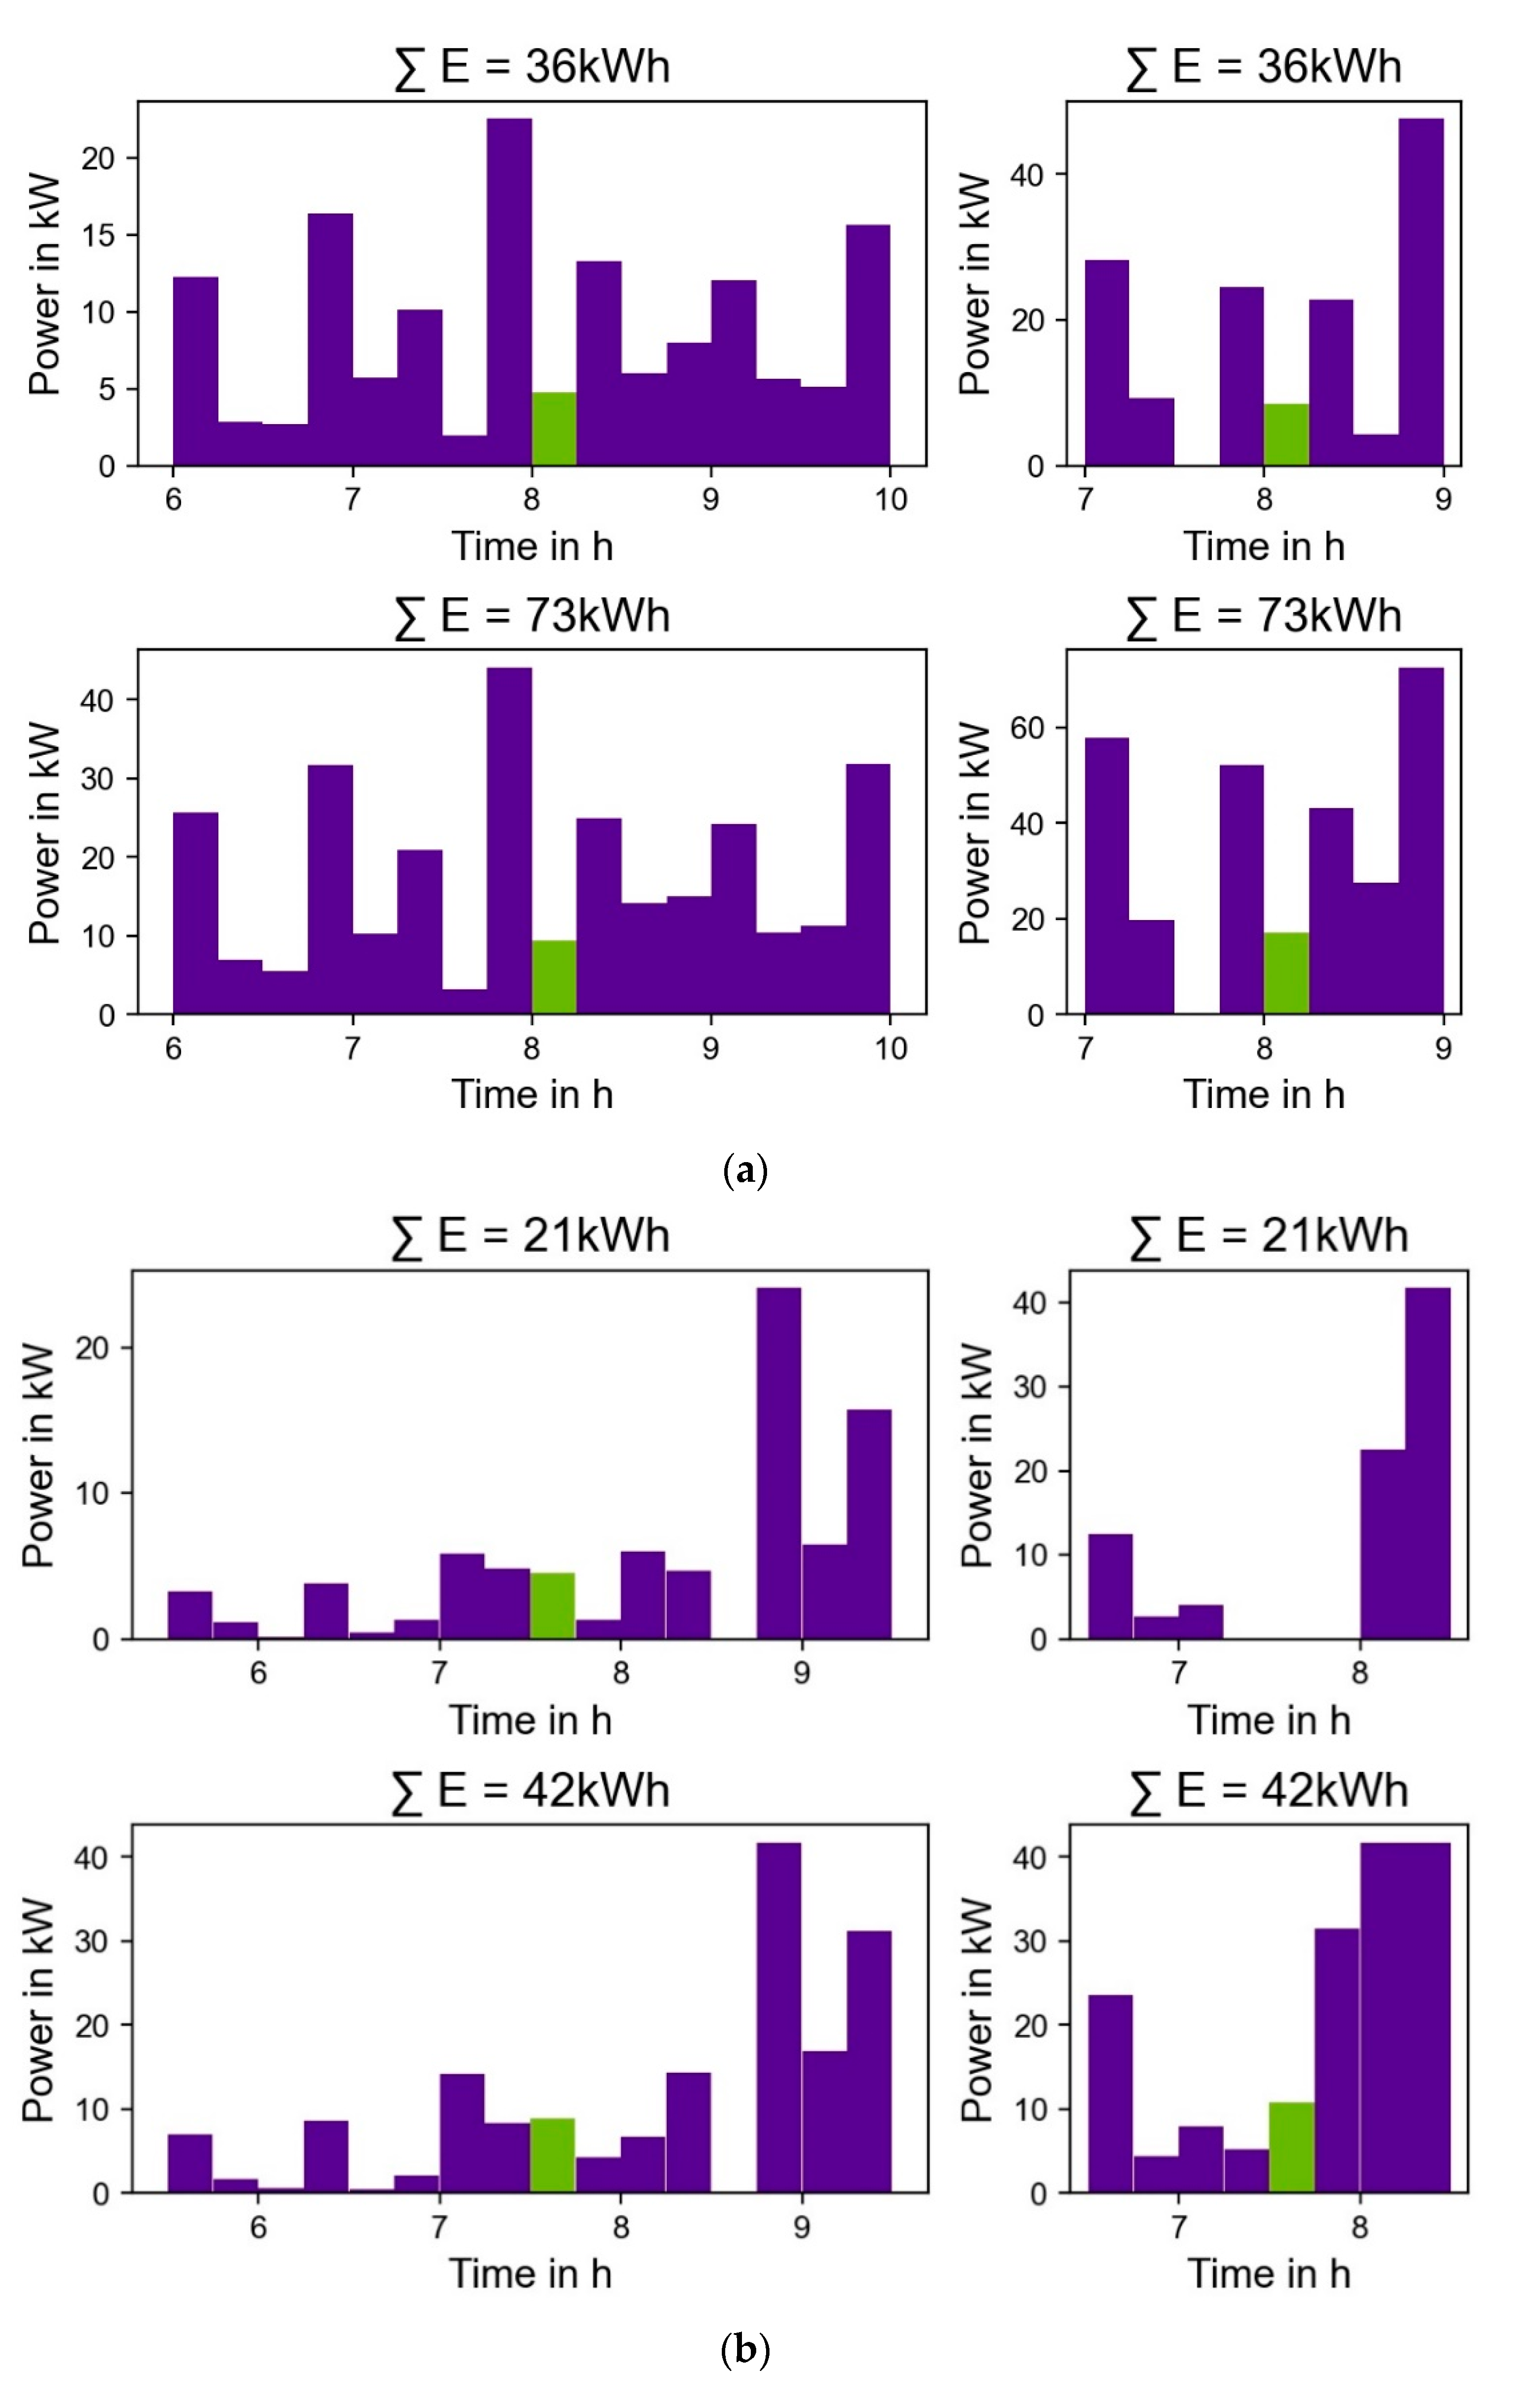
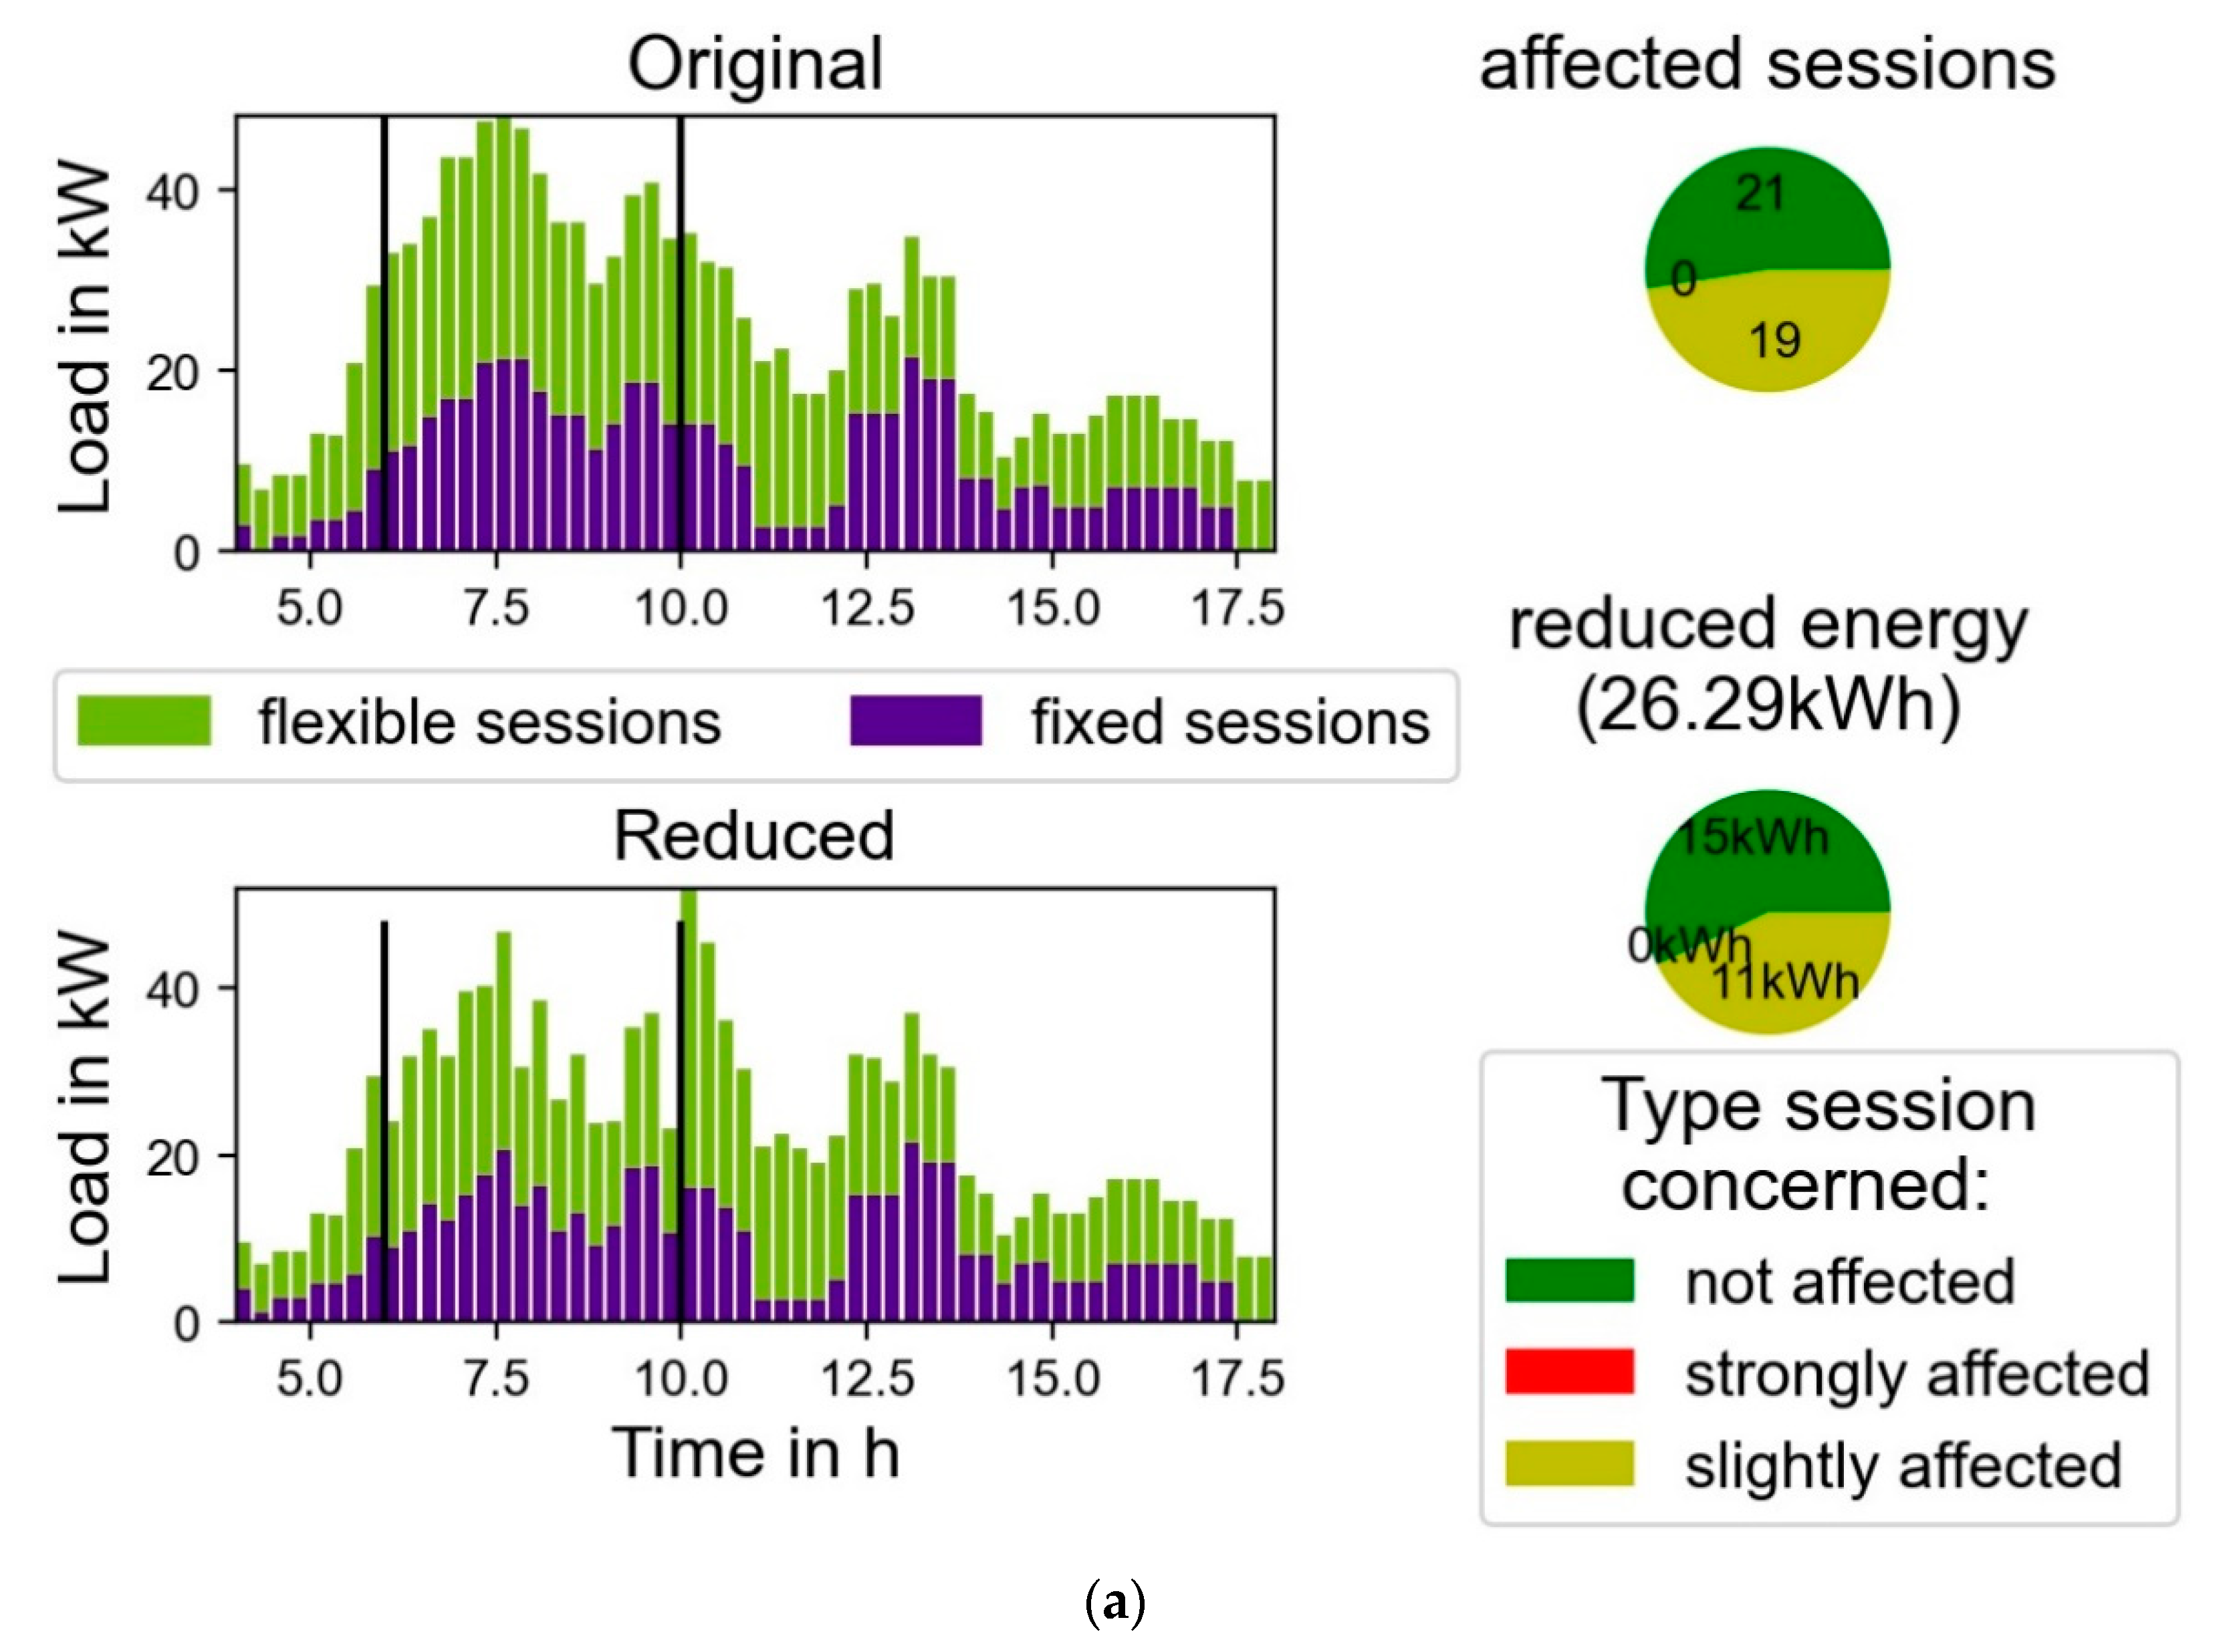
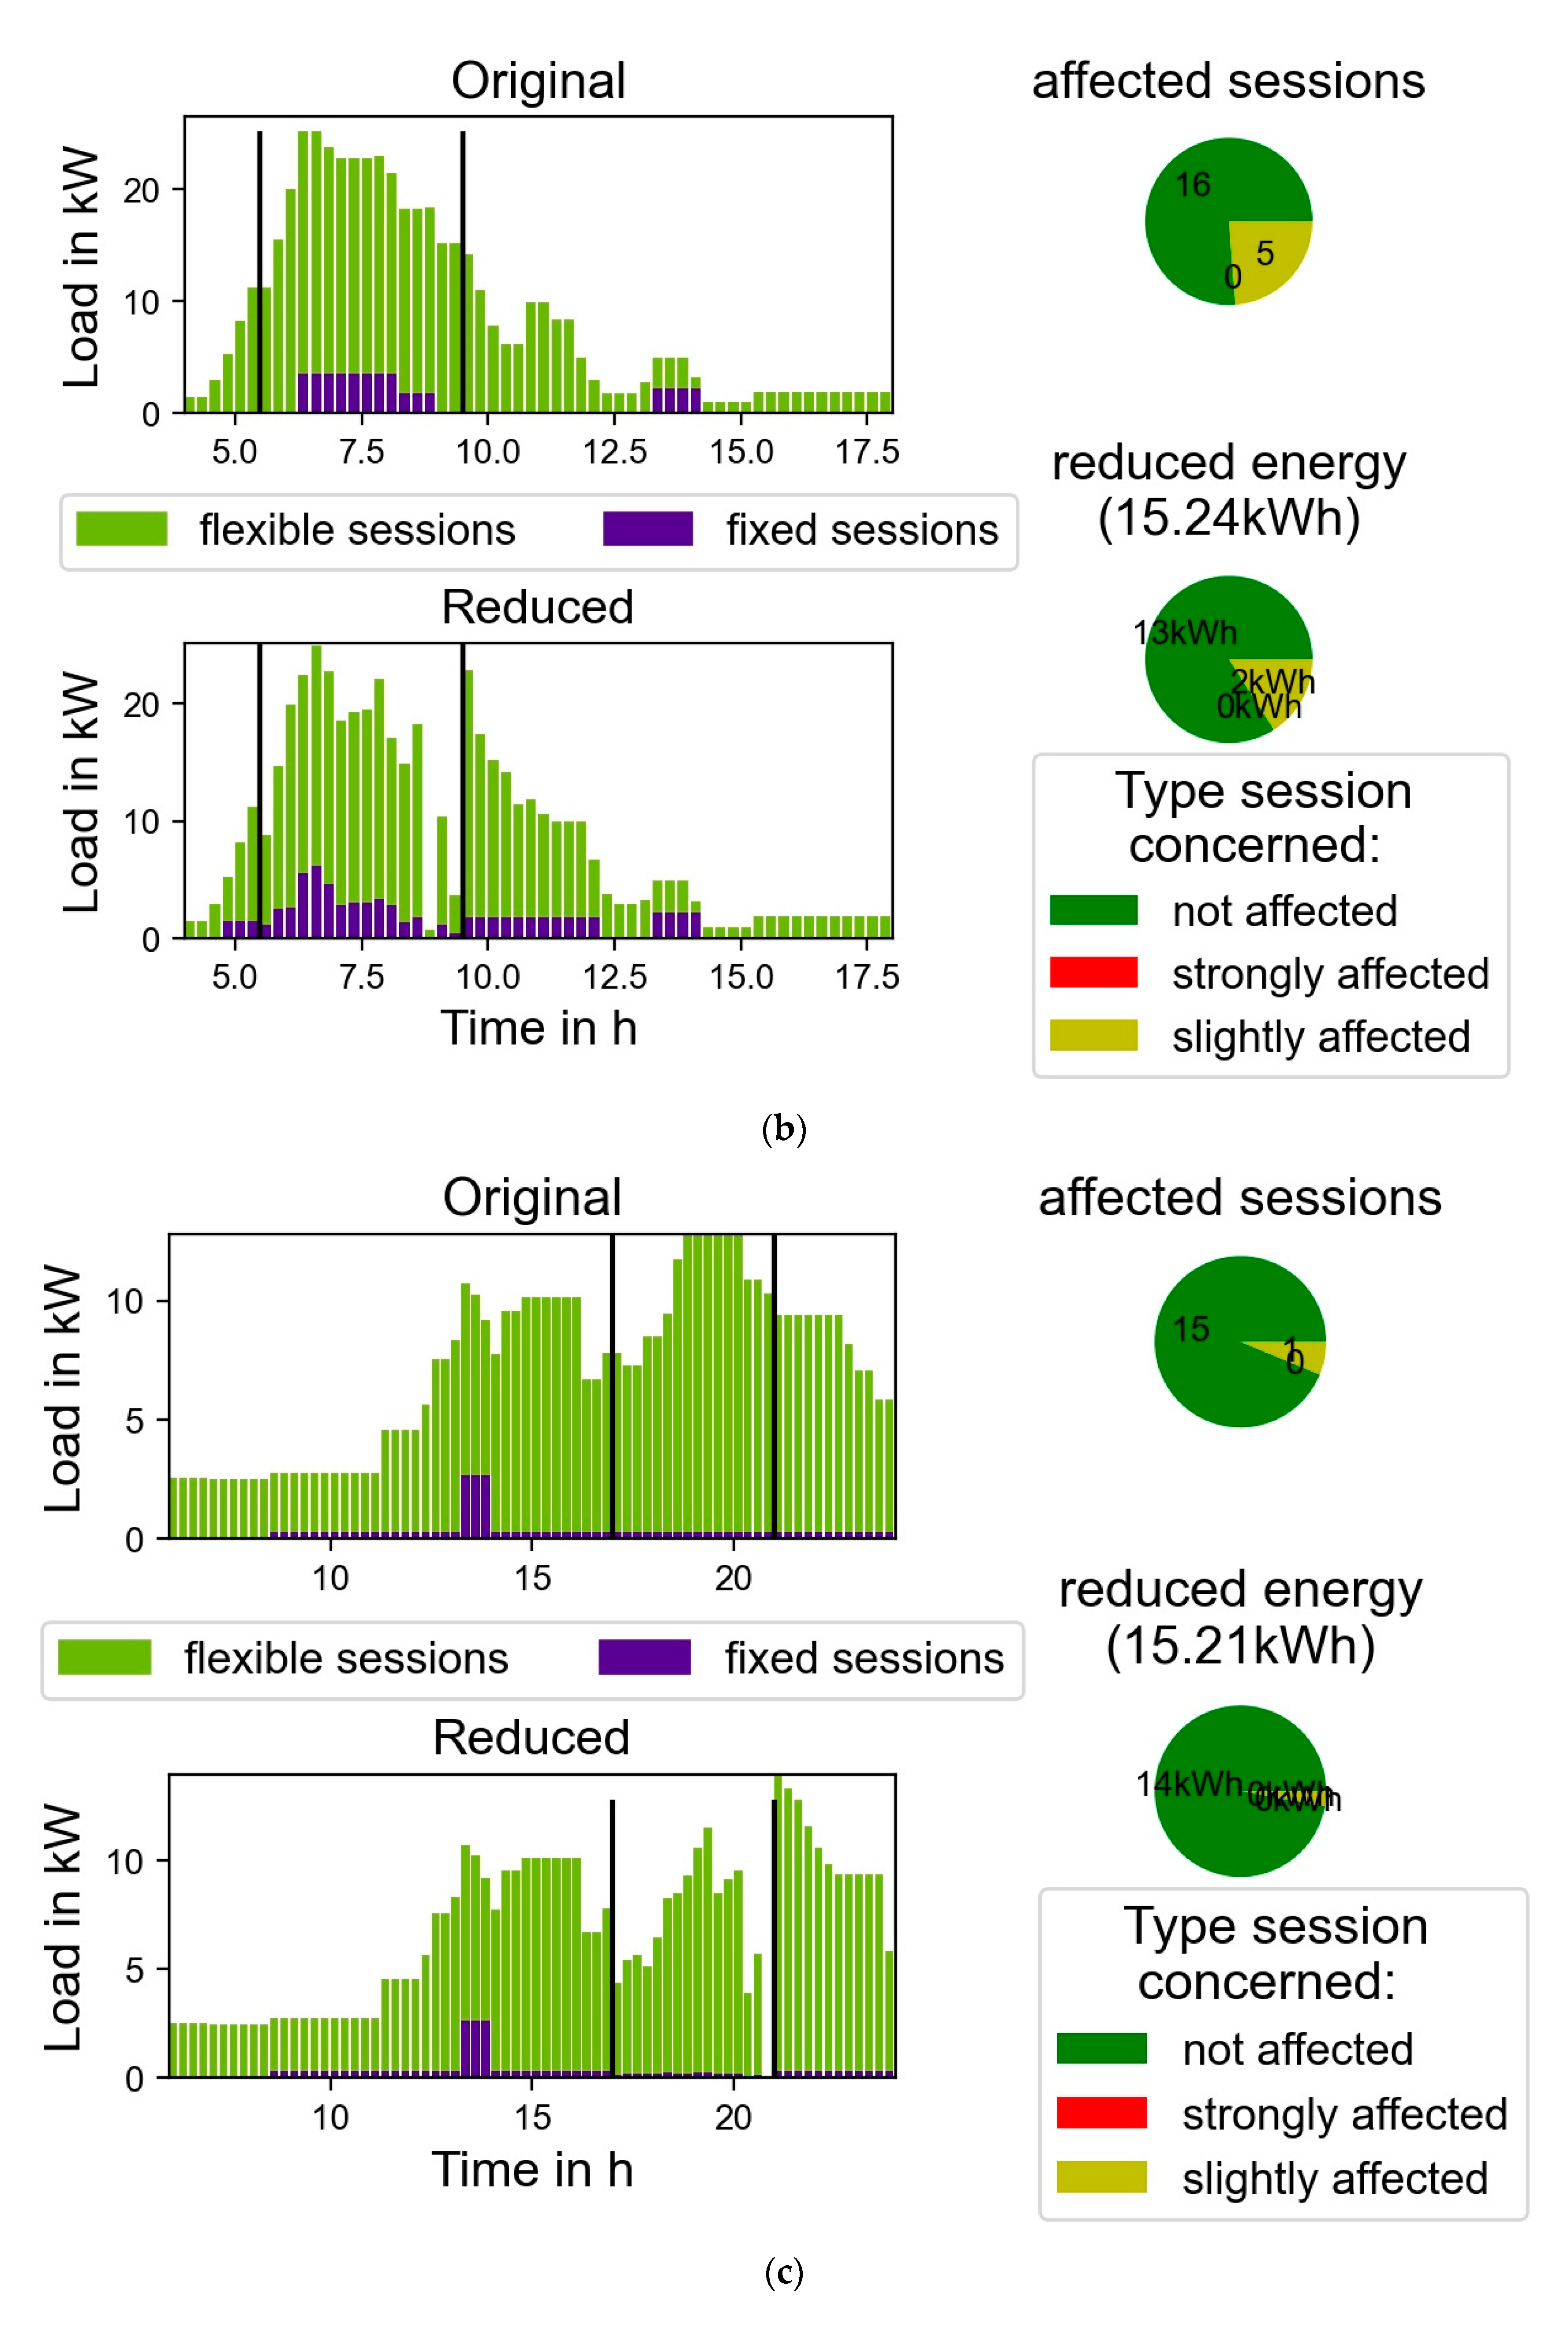
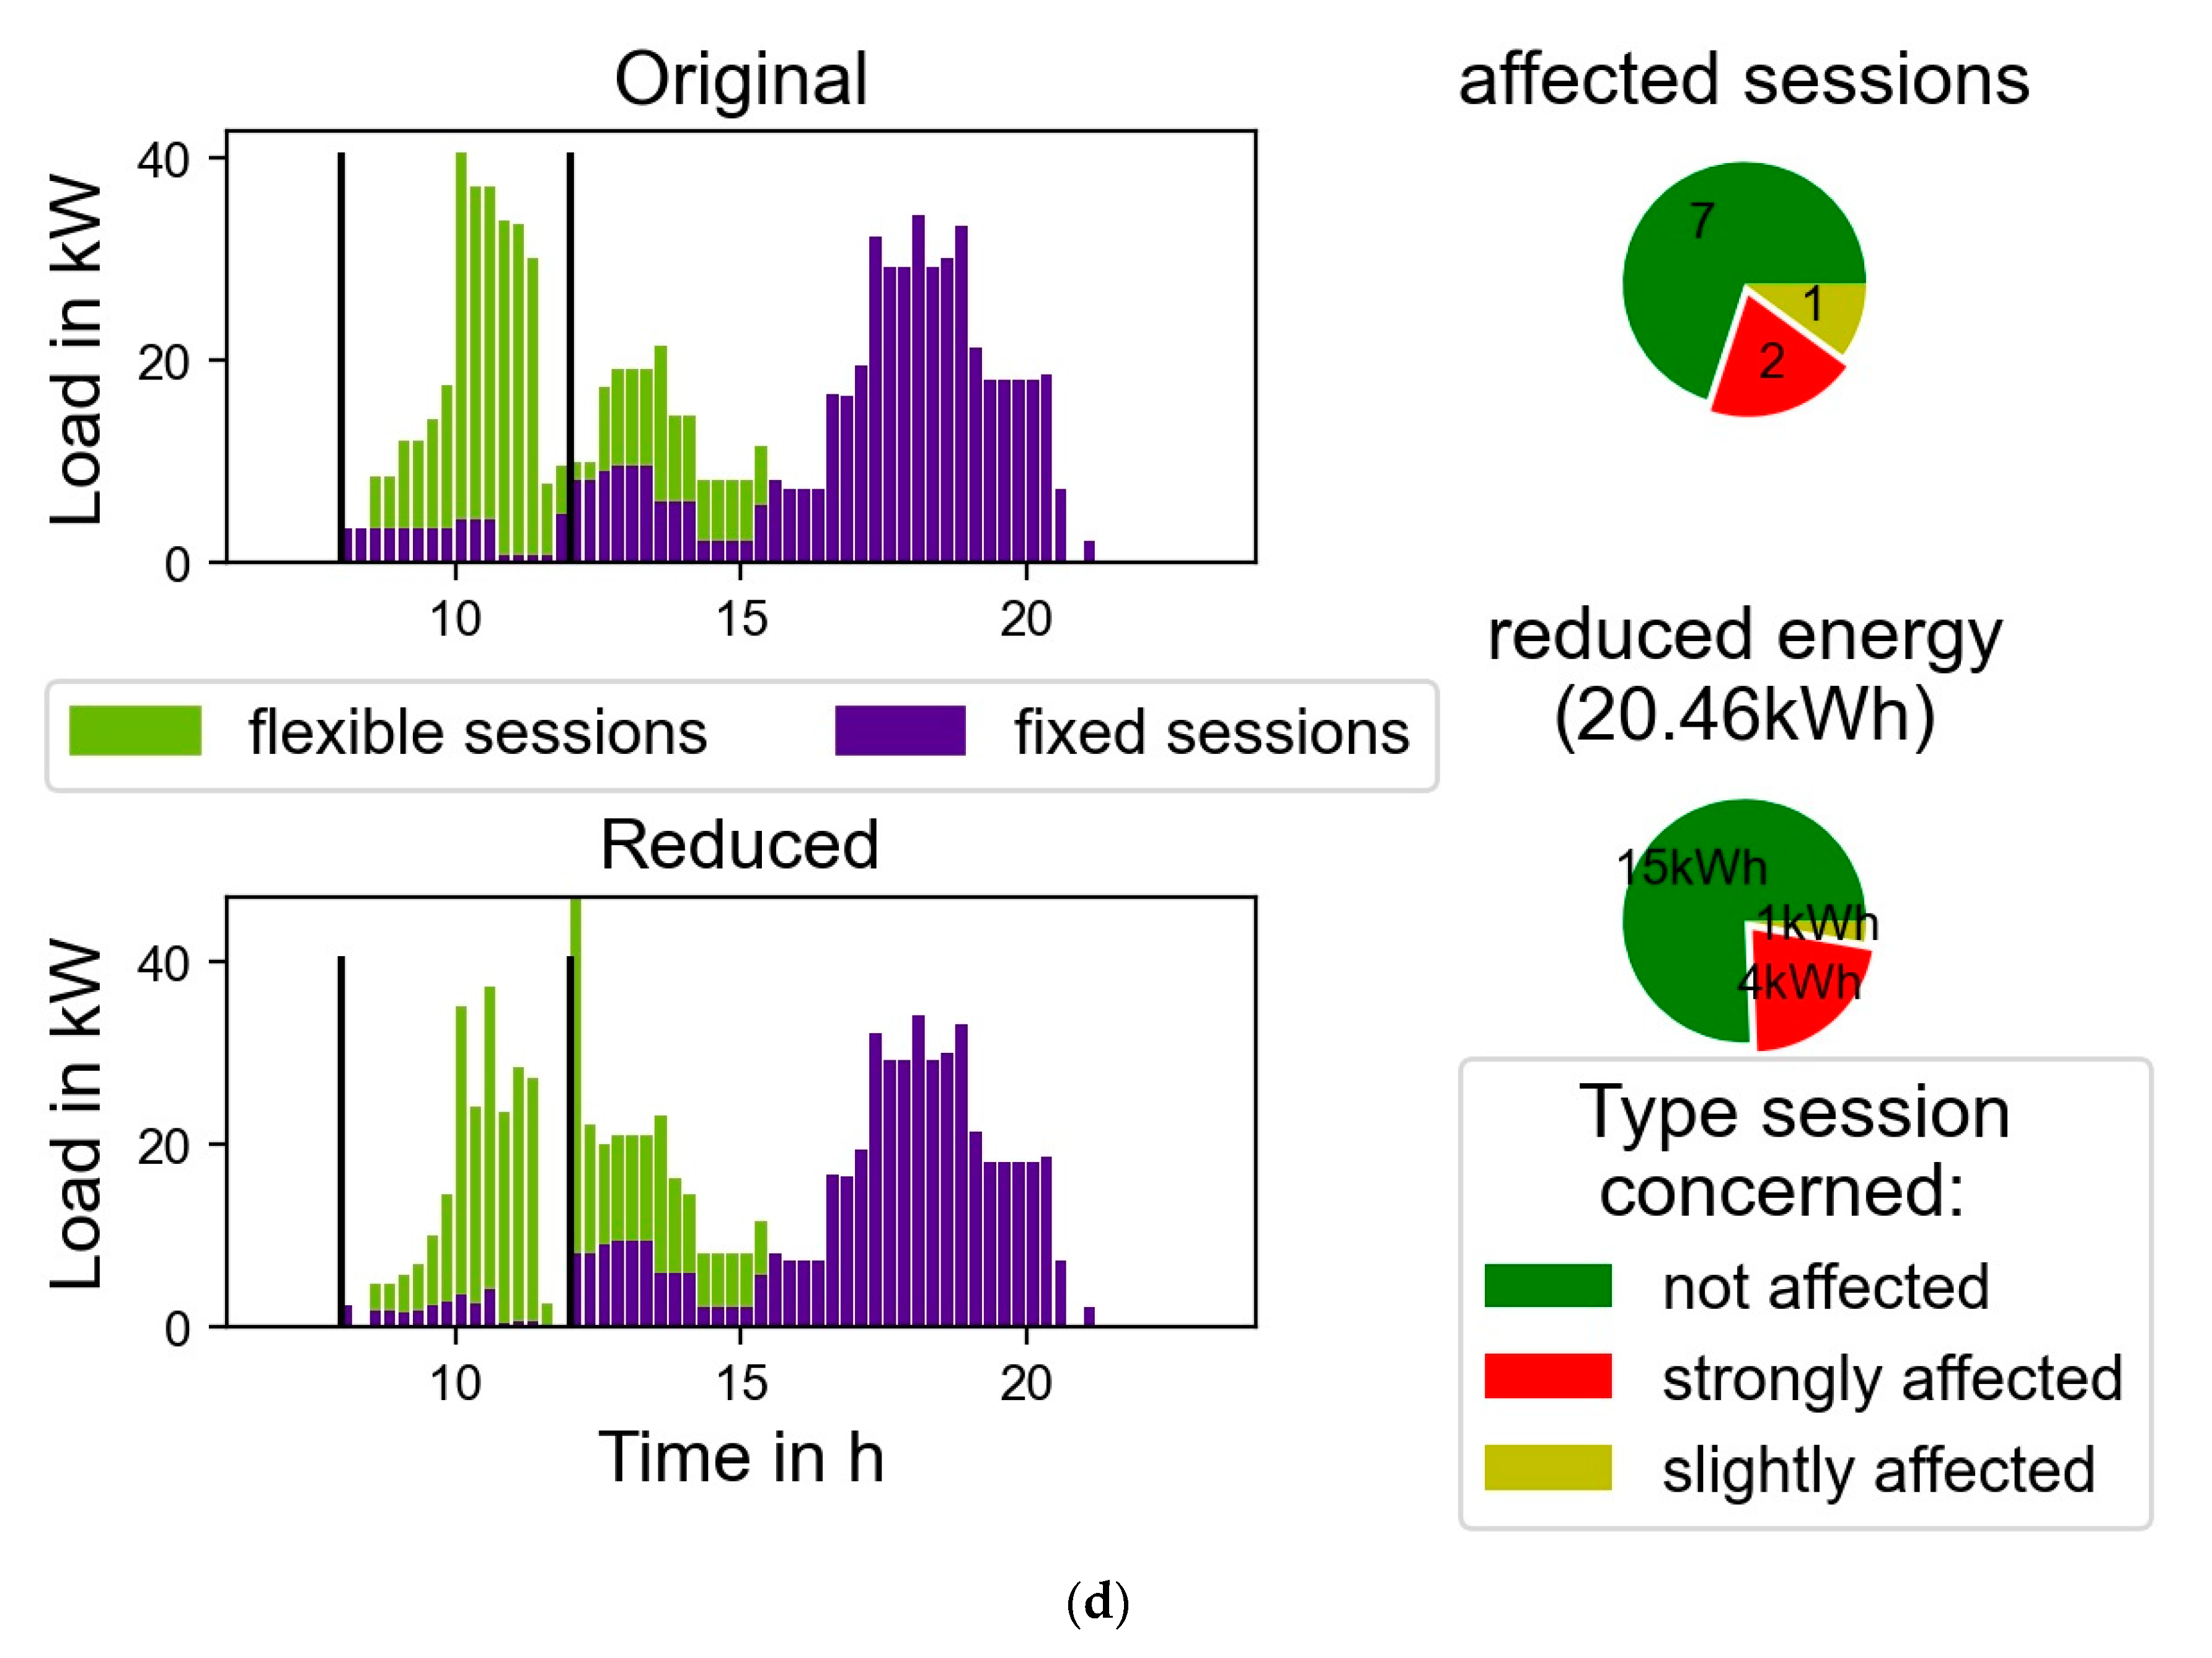
The optimization method leads to the schedules of load reduction illustrated in
Figure 4. Whether the time windows of load reduction is 4 h or 2 h (left and right side of each part of the figure, respectively), the pattern seems relatively similar in both cases, with an exception of the reduced power. This confirms that the presented method of optimization is able to find a similar pattern for both cases that is likely to be the global minima or very close to that.
The daily load curves in
Figure 5 show that the impact on customers is relatively small in the four presented categories. If an EV charges less than 80% of the original energy, the charging session is categorized as strongly affected. It should be considered that this 80% is not the state-of-charge of the battery. It is very rare that a customer arrives at a charging site with a completely empty battery. This means that even in the case of strongly affected sessions, the batteries of the EVs are charged more than 80% of their state-of-charge. In practice, many customers hardly notice such an impact in daily use. The examples on the effect of load reduction on daily load curves in
Figure 5 reveal a new peak that happens directly after the load reduction. This peak can be even higher than the original peak and, thus, must be considered in practical applications. It is also true that if load is reduced at a charging site and the customers who could not fully charge their vehicle during the charging session, they will have to charge more energy at the next charging site, causing the peak of demand to move somewhere else.
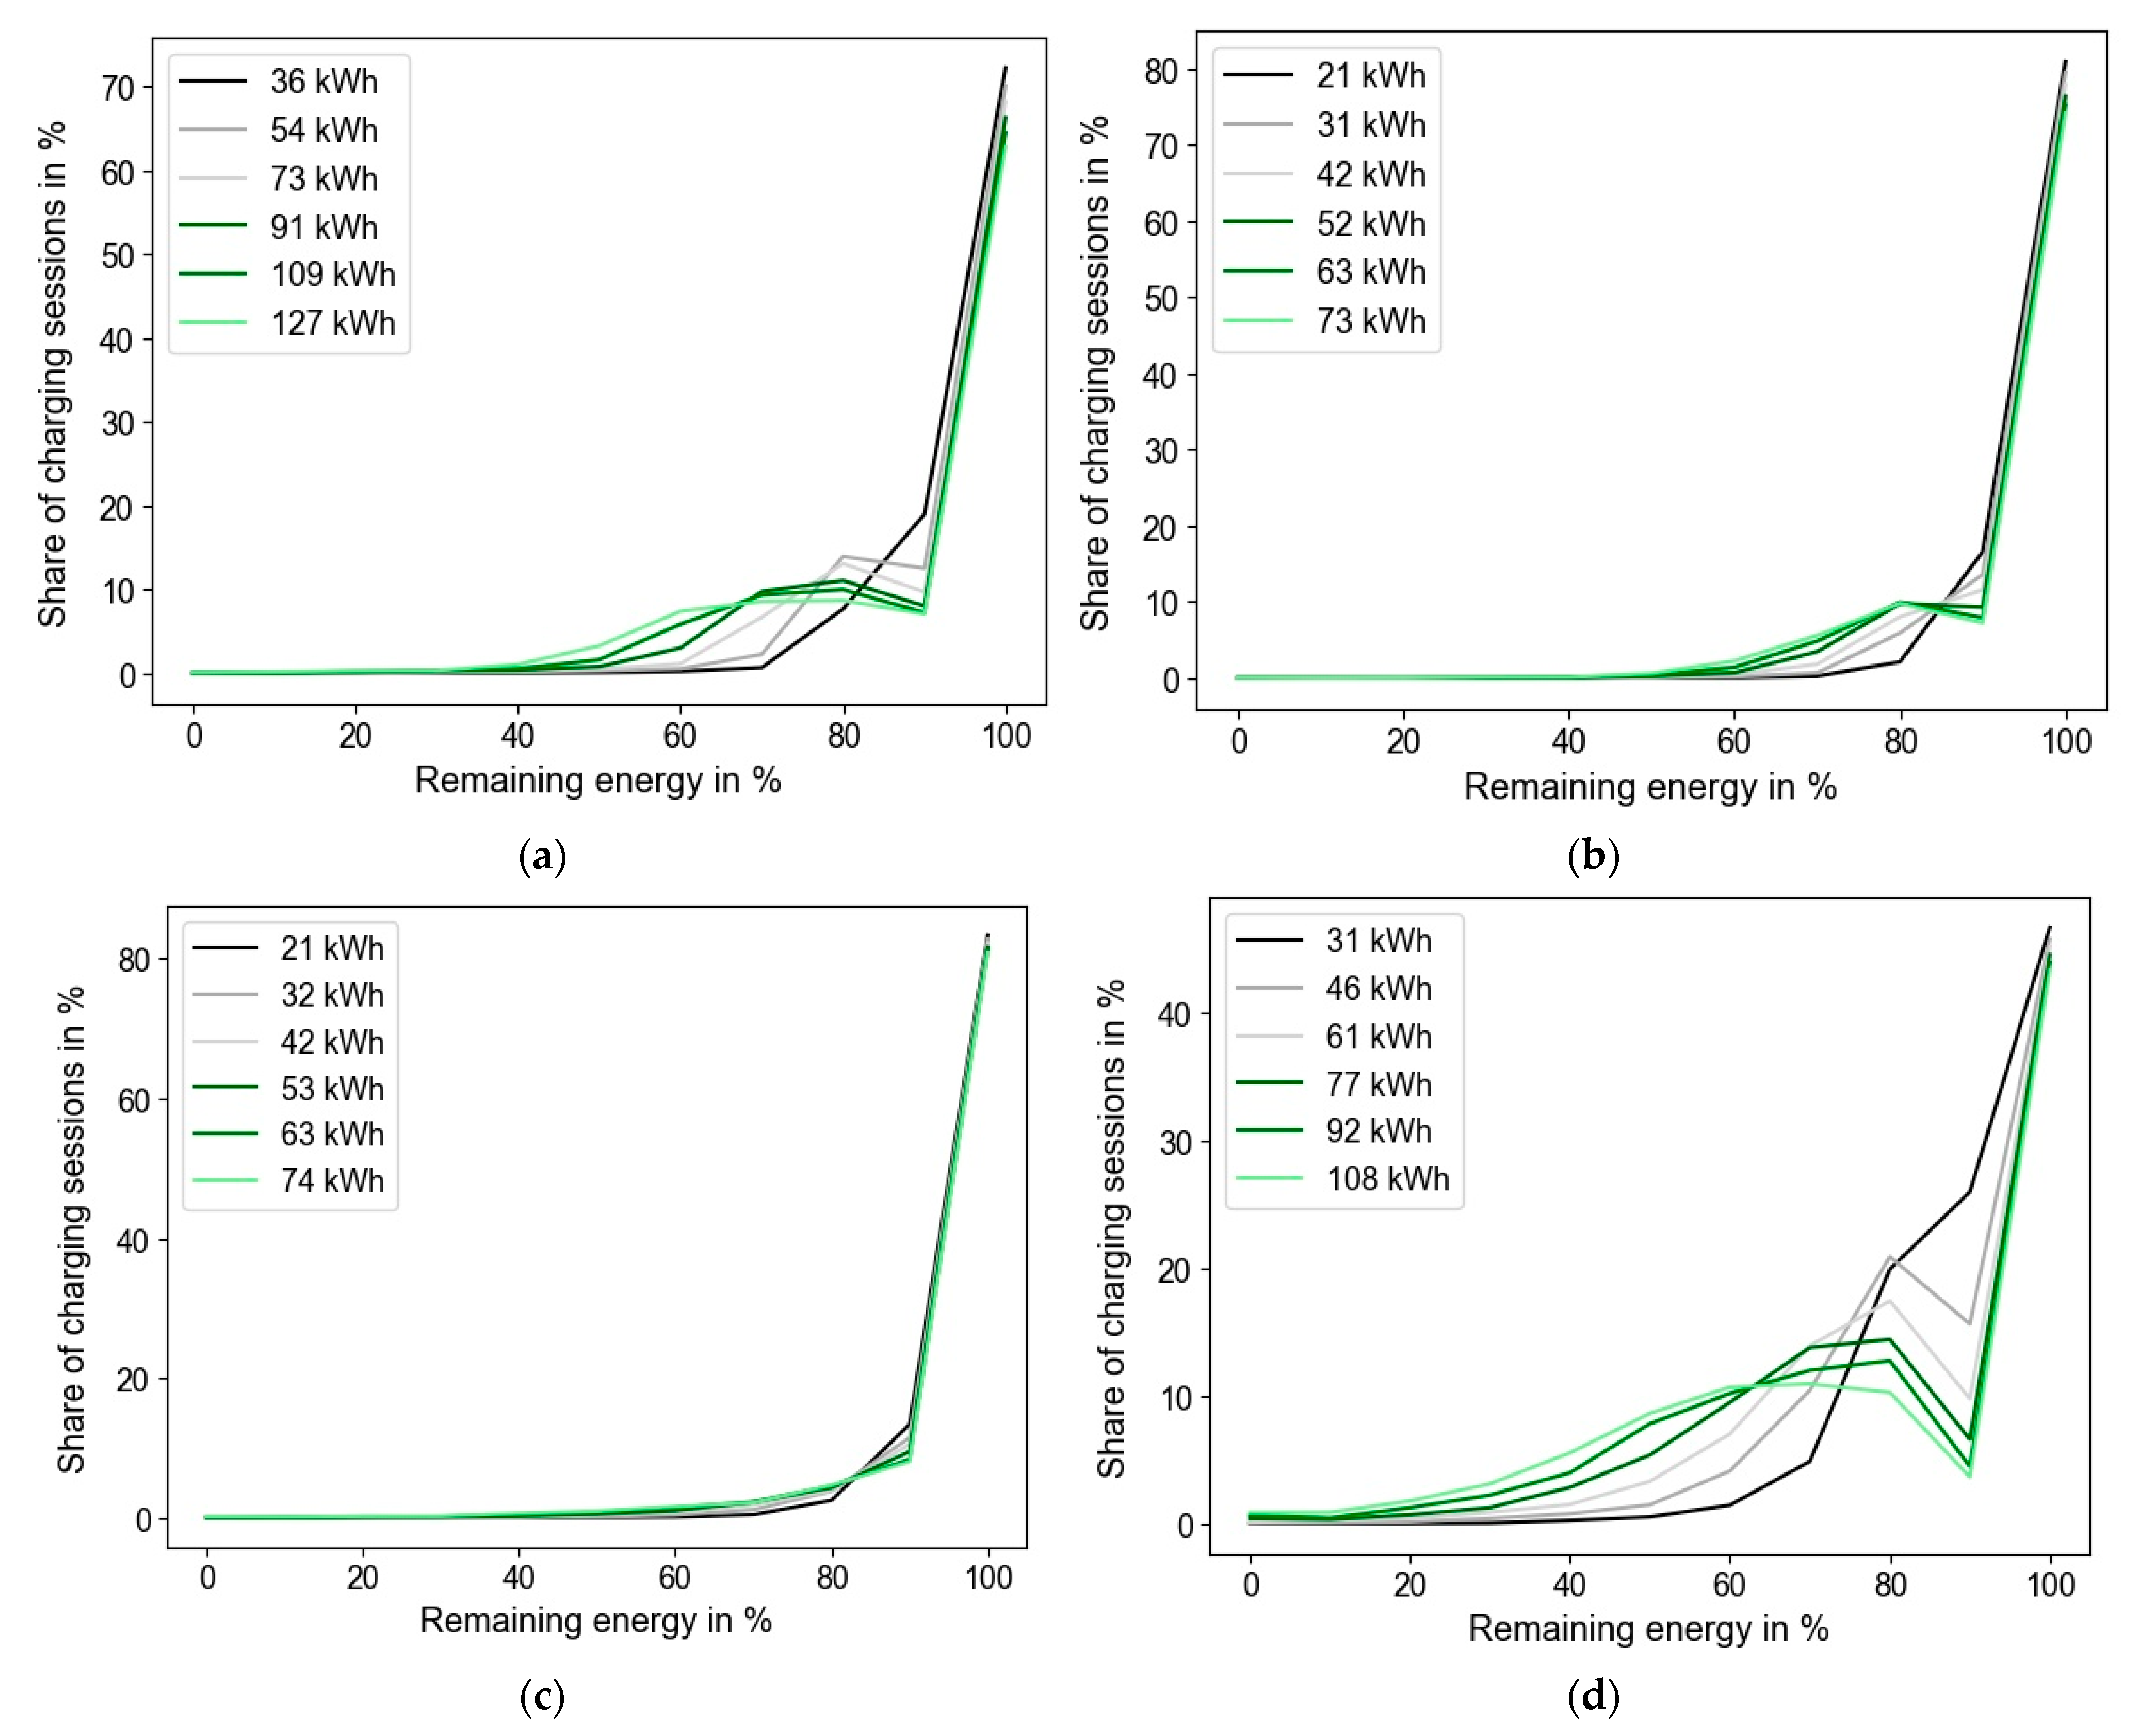
Figure 6 reveals that, in all four categories of charging sites, shopping centers have, relatively, the most affected charging session with the same relative amount of energy. It is also found out that residential and office sites have the least negative impact on the charging sessions with the optimized schedule of load reduction. This finding indicates that residential and offices sites should be used for load reduction if high quality of charging service is a major priority.
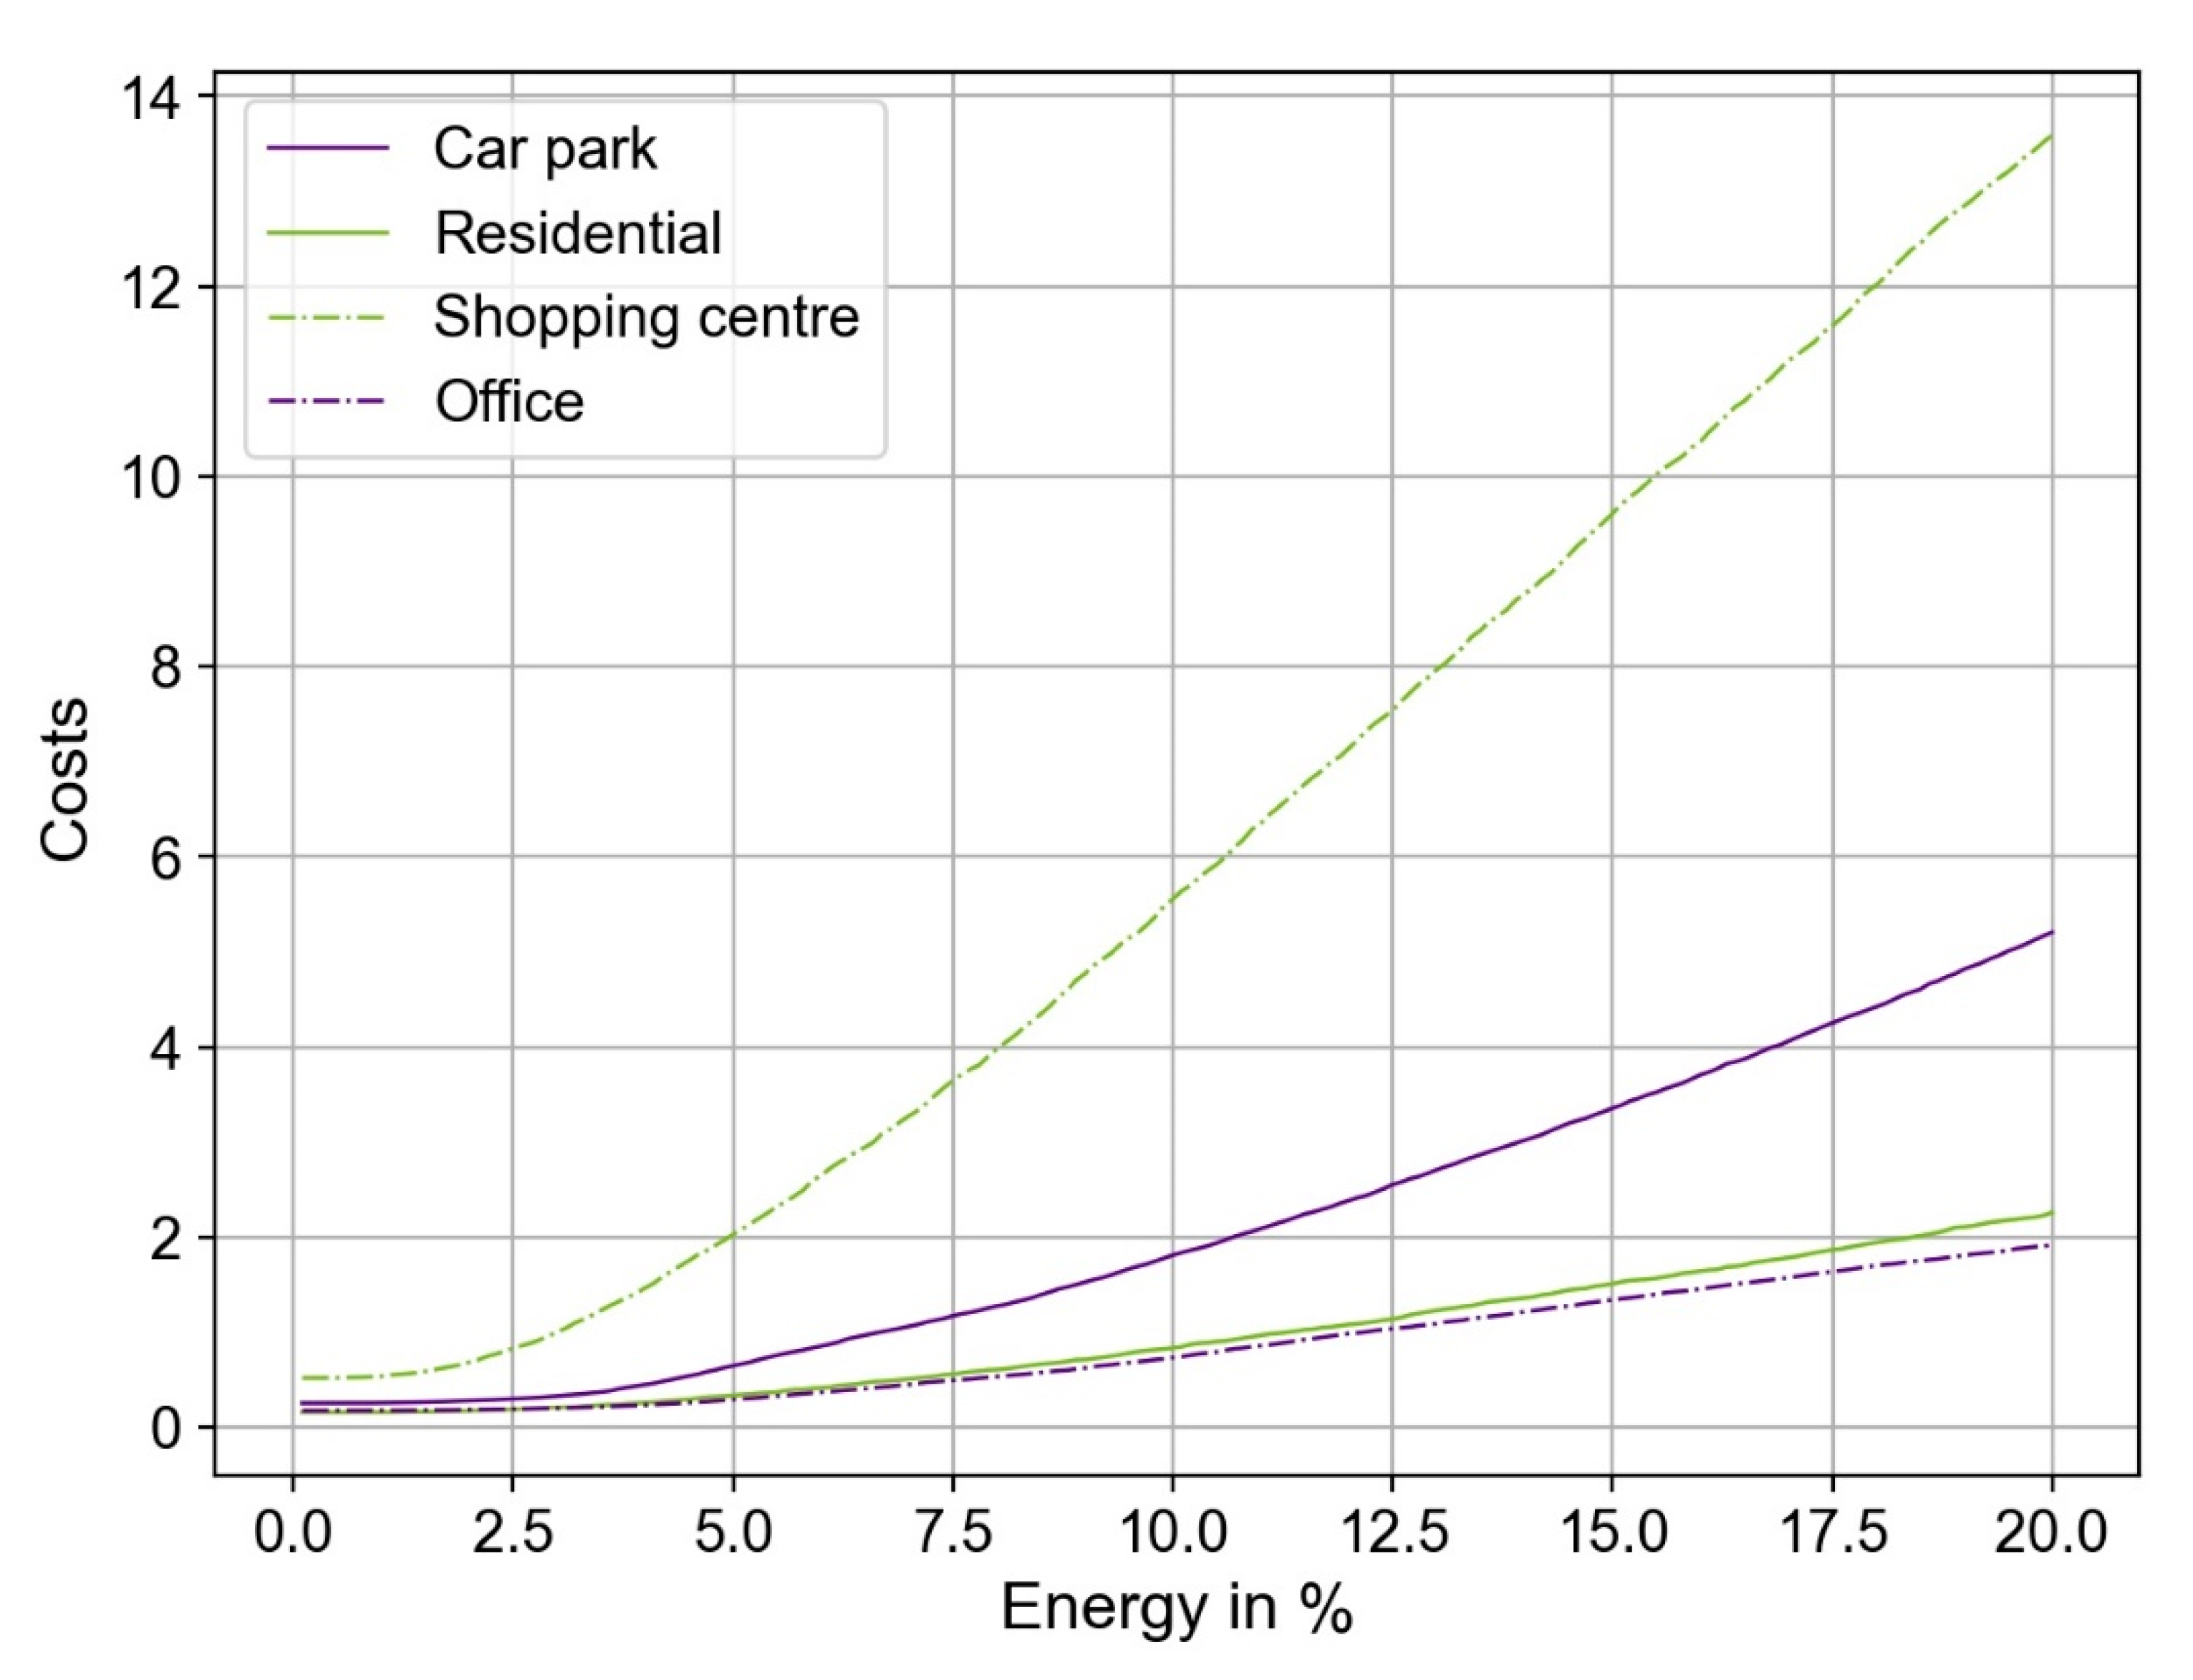
Figure 7 confirms the findings of
Figure 6 to show that offices and residential charging sites provide the largest potential of load reduction with the least impact on customers. The cost function is minimally lower at office sites than at residential sites with larger amounts of reduced energy. However, because the cost function is quadratic, the differences are somewhat exaggerated in order to see the differences. Without a quadratic cost function, the office and residential sites provide very similar results. The reason why the impact of optimal load reduction on customers is the lowest at offices is because offices sites have the most consistent charging hours. This means that the employees arrive roughly at the same hours in the morning and stay there during the whole working day. Such behavior provides very good predictability with a view to network ancillary services. Along the same analogy, the charging schedule at residential sites seems to be slightly less consistent than at office sites, due to the fact that the daily charging load at car parks is likely to be highly dependent on the location and on the pricing, which dictate the kind of customers that are using the charging services. If a car park is predominantly used by office workers, residential customers living in the proximity of the site, or park and ride customers, the cost function is likely to appear very similar to office and residential sites. Thus, before generalizing the results for car parks, differences and similarities between different car parks should be studied in more detail. Perhaps car parks could be divided into several sub-categories, depending on the charging characteristics, the location, or the type of customers. Shopping centers are the least attractive category for load reduction, likely due to the fact that they offer a large variety of services during an extent period of the day. Shopping centers have more reasons that may impact their load behavior more than the other three types of charging sites, such as winter and summer sales, and pre-Christmas shopping.
It is clear that a load reduction is not carried out only based on its impact on customers, but is strongly influenced by factors that drive the load reduction, such as the loading of transformers, the output of local solar energy or the price of electricity on the electricity market. However, the impact on customers should always be considered when planning a schedule for load reduction.
The impact of pricing on customer behavior is out of the scope of this work. However, it is likely that customers expect a higher quality of charging service when they pay a higher price for charging. In this light, for example, if a shopping center provides charging free of cost in order to attract more customers, it may not matter for the customers if the quality of charging service is somewhat reduced. It is also probable that customers find the quality of charging service less important if they are generously reimbursed by the charging operator.
Due to the fact that the schedule of life and traveled daily distances remain similar for most people in the future, it can be expected that the shapes of the aggregated load curves at different categories of charging sites will also remain similar, except the fact that the load will increase together with the increasing number of EVs. This suggests that the main findings of this work are likely to be true also in the near future. On the other hand, the application of smart charging algorithms, price of charging, and the increasing share of EVs with three-phase charging may reshape the aggregated load curves slightly. Even though our work is not directly comparable with previous research, it can be roughly said that the impact of load reduction on customers is of a similar order of magnitude as the results in [
10]. Thus, the main findings of these two works point towards the same direction.
5. Conclusions and Future Work
This paper studies an extensive amount of commercial charging data and presents a method to find a schedule of load reduction with the minimum negative impact on the quality of charging service. It is found out that working days offer the most flexibility potential among office sites, public parking sites, residential sites, and shopping centers. On weekends and public holidays, only residential sites and shopping centers provide potential for load reduction.
The findings indicate that office and residential sites are able to provide the most flexibility to the power system through load reduction, with minimum negative impact on quality of charging service. The results also point out that load reductions at shopping centers have the largest negative impact on the quality of charging service. When the quality of charging service is the main concern, car parks provide roughly half of the reduction potential in comparison with offices and residential charging sites. Further, at shopping centers, the power can be reduced to about a half compared with car parks. This suggests that shopping centers should be the last charging site to participate in sub-aggregation.
It is observed that load reduction provokes a peak of load demand that can be even higher than the original peak. This should be considered when planning load reduction. Based on the results, it is recommended that when using electric vehicles in sub-aggregation to provide ancillary services to the power system, load reduction should be first carried out at office and residential charging sites during weekdays in order to guarantee a high quality of charging service.
Future Work
Future research should focus on developing the cost function of the optimization method so that it ties the quality of charging service to customer experience. This will help to give an idea where and when load reductions should be done so that the negative impact on customer experience is minimized. In practical applications, quality of charging service or customer experience could be one factor, together with technical parameters, such as loadings of transformers and lines, and with economic parameters, such as the electricity tariff of the charging operator that could be considered when electric vehicles are used in sub-aggregation.


 ,
, 


