Article

Assessment of the Visual Impact of Existing High-Voltage Lines in Urban Areas

Centre d’Innovació Tecnològica en Convertidors Estàtics i Accionaments (CITCEA-UPC), Departament d’Enginyeria Elèctrica, ETS d’Enginyeria Industrial de Barcelona, Universitat Politècnica de Catalunya, 08028 Barcelona, Spain
*
Author to whom correspondence should be addressed.
Submission received: 11 June 2021 / Revised: 21 July 2021 / Accepted: 27 July 2021 / Published: 29 July 2021

Abstract

:
This article proposes a novel methodology to evaluate the visual impact of high-voltage lines in urban areas based on photographic images. The use of photographs allows for calculating the overall aesthetic impact while eliminating the subjective factors of the observer. To apply the proposed methodology based on photographs, the impact of the position and angle where the photograph was taken was analyzed, and a sensibility analysis was carried out. Moreover, it was applied to an application case, and a comparison with results from a previous study of a visual impact was performed. The methodology shows good performance and a better resolution of the indicator.

1. Introduction

The work presented here proposes a methodology to assess the visual impact of existing overhead transmission lines on the environment. Its main objective is a reduction of subjective influences in the assessment procedure. The proposed approach is combinable with the general impact assessment methodology by Sumper et al. [1] and aims to enhance the aesthetic impact assessment of this methodology.
Electricity is a prerequisite for social, industrial, and commercial development [2], and the transmission of electricity is of extreme importance to a proper electricity supply. However, the lack of social and public acceptance of the transmission line infrastructure [3] manifests the need for a deep analysis of the impact of transmission lines. Public opinion is dominated by social syndromes such as ’Not In My Backyard’ (NIMBY) [4], ’Build Absolutely Nothing Anywhere Near Anything’ (BANANA) [5], and ’Not In My Term of Office’ [6], which makes necessary more active participation of stakeholders in the decision processes to prevent and solve conflicts. Mediation techniques are powerful tools to involve the conflicting parties and to find a common, self-provided ‘win–win’ solution [7]. They often require us to include in the process expert opinion or an external evaluation of the situation by an objective impact analysis or indicators [8].
The measurement of the widespread and diverse impacts presents analytical challenges in developed countries [9]. Transmission lines have several types of impacts on the environment as stated by Bickel and Friedrich [10] and Doukas et al. [11]. The most common impacts are influences on the health of residents, urban development, flora and fauna, and the aesthetics of the landscape. The latter are often controversially discussed because of their highly subjective nature. An assessment of all these impacts is not trivial. Therefore, pairing systematically analytical and experiential methodologies is fundamental to ecological design to include intentional changes of landscapes in cities, their megaregions, and resource hinterlands as shown by Nassauer [12]. The literature commonly contains studies that focus only on a single aspect, such as Torres-Sibille et al. in [13,14]. Hadrian et al. [15] present an automated mapping method enabling us to choose corridors to minimize visual impacts depending on the surrounding landscape. Luken et al. [16] analyze the visual perception on forest edges of power line corridors by surveys and make recommendations to reduce the visual impact by camouflaging corridors in forests. Tempesta et al. [17] show the willingness-to-pay of the Italian population to eliminate the landscape impact of high-voltage overhead transmission lines in rural areas, and it was estimated for the entire national territory for four different landscape contexts. A similar result was shown by Frontuto et al. [18] for agricultural sheds, where residents are willing to pay for mitigation solutions.
A methodology for an environmental impact assessment of existing overhead lines was developed by Sumper et al. [1]. It includes all the above-mentioned impact types and is the first attempt to also account for the aesthetic impact of overhead lines. The approach supports the development of mitigation strategies by identifying the most critical sectors of the transmission line. The aesthetic impact is evaluated by experts. A lack of information can lead to conflicts with residents and lobby groups. Therefore, this work develops a transparent and comprehensive methodology for the aesthetic impact assessment of overhead lines. It reduces the subjective influences of the examiners during the evaluation procedure and aims to improve the acceptance of the assessment.
The contribution of this paper is a methodology for the determination of the aesthetic impact of overhead lines by using images of such lines. For the use of an image processing methodology, the range of observer distances and angles was determined to guarantee comparable results. The proposed methodology improves the overall impact assessment of existing overhead lines presented by Sumper et al. [1] by eliminating the subjective criteria of the observer for the aesthetic impact, which is part of the overall assessment.

2. Environmental Impact of Overhead Power Lines

Sumper et al. [1] propose an overall assessment methodology for the environmental impact of overhead transmission lines in urban areas. The aim of this methodology is to support a decision process for mitigation actions that include not only public authorities but also experts and citizens. The first group is small and usually legitimated by elections. The second group often represents interest groups such as companies or organizations. They are often supposed to act as impartial advisors that provide all necessary information required for the decision process. However, often they are linked to one group with individual interests. The latter group includes residents and other involved citizens. They are considered to be active or common. ‘Active’ means that these citizens contribute actively to the discussion process. This group is usually very critical and a relatively small group among the population. The ‘common’ citizens are usually a very heterogeneous group that behaves rather passively. It can include people from all social backgrounds. Therefore, this group often has very diverse interests and opinions. Furthermore, these interests are commonly difficult to gather because of the small willingness to contribute to this group. This is possibly linked to the heterogeneous character of this group and the small perception of common interests.
The methodology presented by Sumper et al. [1] includes eight steps as shown in Figure 1. The first step is the delimitation of the evolution area. In other words, the area that is influenced by the overhead line is defined, which consequently requires the acceptance of all involved parties, such as public authorities, companies, and citizens. In the second step, the area to be studied is defined. This is done by experts from the public side and the utility side. Subsequently, all involved groups determine the impact parameters of the study. This includes three steps. First, the impact types are defined, and then the scale and the weight of each impact parameter are determined. These three steps are very important for the evaluation and, consequently, for the acceptance of the final decision. Once the impact parameters are defined, experts can elaborate on the evaluation. This includes the determination of the individual impacts as well as an analysis of the results. Finally, the results are presented to the other involved parties, and possible mitigation strategies for identified problems can be discussed. Therefore, it is necessary to also agree on mitigation measures to ensure an impartial decision process. A detailed description of the methodology can be found in [1].
The above-described methodology for impact assessment of transmission lines accounts for several impacts that transmission lines can have on their environment. One important impact type is the visual impact assessment. Three indicators determine this visual impact, as shown in
I v i s u a l = V   · F   · I Q 3
where V is the visibility of the line, F is the fragility of the landscape, and IQ is the intrinsic quality of the area. The visibility accounts for the dimensions of the line. Overhead transmission lines with higher and wider pylons have a larger impact than small distribution lines. The fragility describes the effect the overhead line has on the area. For example, trees of a forest may partially hide the pylon, which consequently reduces the impact the structure has on this area. The intrinsic quality accounts for the characteristics or usage of the area. Obviously, an overhead line that passes through an industrial area is less critically observed than a similar line that passes through a residential area or a singular landscape.
A drawback of the indicators presented above is their subjective nature. This is because of the fact that the presented factors V, F, and IQ are determined by experts, and the values depend on the experience of those experts. The contribution of this paper is to implement a methodology to ensure an objective evaluation of the visual impact by using photographs. Torres-Sibille et al. used the objective aesthetic impact of a wind farm [13] and solar plants [14] located in a defined landscape by a combination of visibility, color, fractality, and continuity, which can be obtained from photographs. Torres-Sibille et al. [14] demonstrated that the calculated indicator correctly represents the order of preference resulting from the perception of impact determined by experts. The present paper adopts the methodology for the objective visual impact assessment of overhead lines and determines the conditions under which the photographs have to be taken.

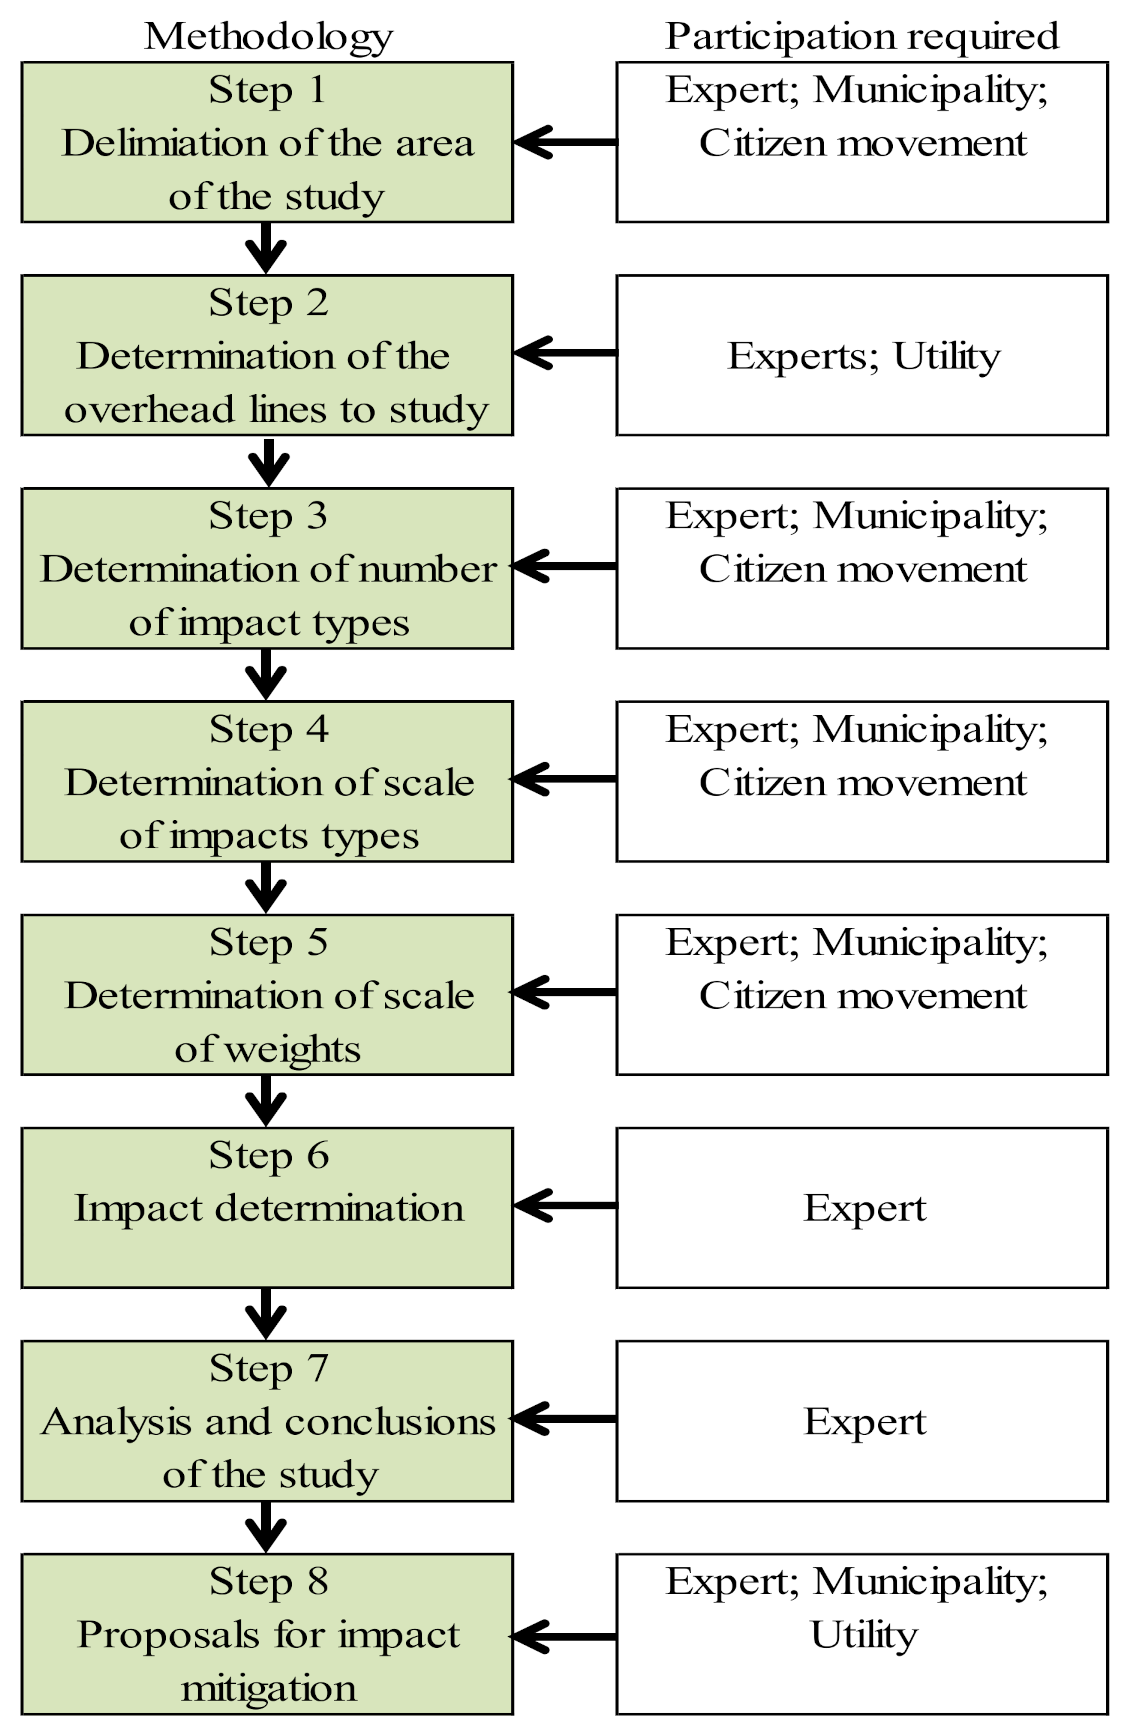
3. Methodology to Evaluate the Visual Impact of Overhead Power Lines

To create a methodology for the assessment of visual impacts of a structure on the environment it is necessary to identify parameters that influence the aesthetic impression. In order to develop an advanced approach for the visual impact assessment of overhead lines, methodologies from other fields were examined. The new methodology for visual impact assessment was derived from the methodology by Torres-Sibille et al. [13,14]. It aims to extend to the methodology by Sumper et al. presented in [1]. The approach uses four indicators: visibility, color, factuality, and quality of the landscape. As the original approach was used to determine the visual impact of wind turbines and solar power plants, these indicators had to be modified in order to apply this methodology to the evaluation of overhead power lines. A major difference compared with solar power plants and wind turbines, as considered by Torres-Sibille et al., is the influence of color on visibility. The visibility is significantly reduced when the contrast of the overhead line and the environment is small. This is due to the lattice structure of transmission line pylons and the small cross-section of conductors. On the other hand, a solar power plant is not easily overseen, even when its color matches the color of the environment. Consequently, visibility and color are not as independent as in the case of overhead lines. Furthermore, the indicators concurrence and continuity were not included in the presented methodology. Variance in the concurrence and continuity of overhead lines is negligible because the homogeneity and extension of the structure do not vary. Hence, there is no reason to include them in the assessment. Instead of these indicators, the quality of the landscape is accounted for. The new methodology and indicators presented here were developed in [19] and are explained in the following sections.

3.1. The Overall Aesthetic Impact Value

The overall aesthetic impact value (OAIV) is the parameter that quantifies the visual impact of an overhead line on a certain area. In order to assess the transmission line, the study zone is divided into sectors. The enhancement reduces subjective effects on the evaluation process. For each sector, an individual OAIV is computed. Hence, it is possible to compare different sectors and identify critical sections. Sectors do not overlap and are evaluated based on photos. The overall aesthetic impact value includes the quality of the landscape, the visibility impact, and the fragility impact. The first accounts for the relevance of the environment where the overhead line is built. The visibility impact includes all effects originating from the structure itself, and the fragility impact allows for an evaluation of the vulnerability of the landscape to a disturbance by a transmission line. In order to allow for an approach consistent with the methodology in [1], these impacts are determined by indicators. Thus, the overall aesthetic impact value is defined by
O A I V = I q u a l i · α · β · I v i s p y l o n + I c o l o u r · I v i s w i r e + γ · I f r a
where OAIV is between 0 and 1, Iquali is the quality indicator, β is the climatology coefficient, Ivis-pylon is the visibility indicator for the pylon, Ivis-wire is the visibility indicator for the wires, Icolor is the color indicator, Ifra is the fragility indicator, and α and γ the weighting factors for the fragility and visibility indicators, respectively. All indicators are between 0 and 1, and the sum of the weighting factors α and γ is 1. The OAIV does not exceed a value of 1 due to the small contrast between the grey color of the overhead line and the sky. In some cases, conductors are marked with signal orbs; for example, in the vicinity of airports. Then, the color indicator is given a value of 1, which could lead to an OAIV larger than 1. In order to make this methodology compatible with the assessment methodology presented in [1], the equation is limited to a maximum value of 1.

3.2. Quality of the Landscape
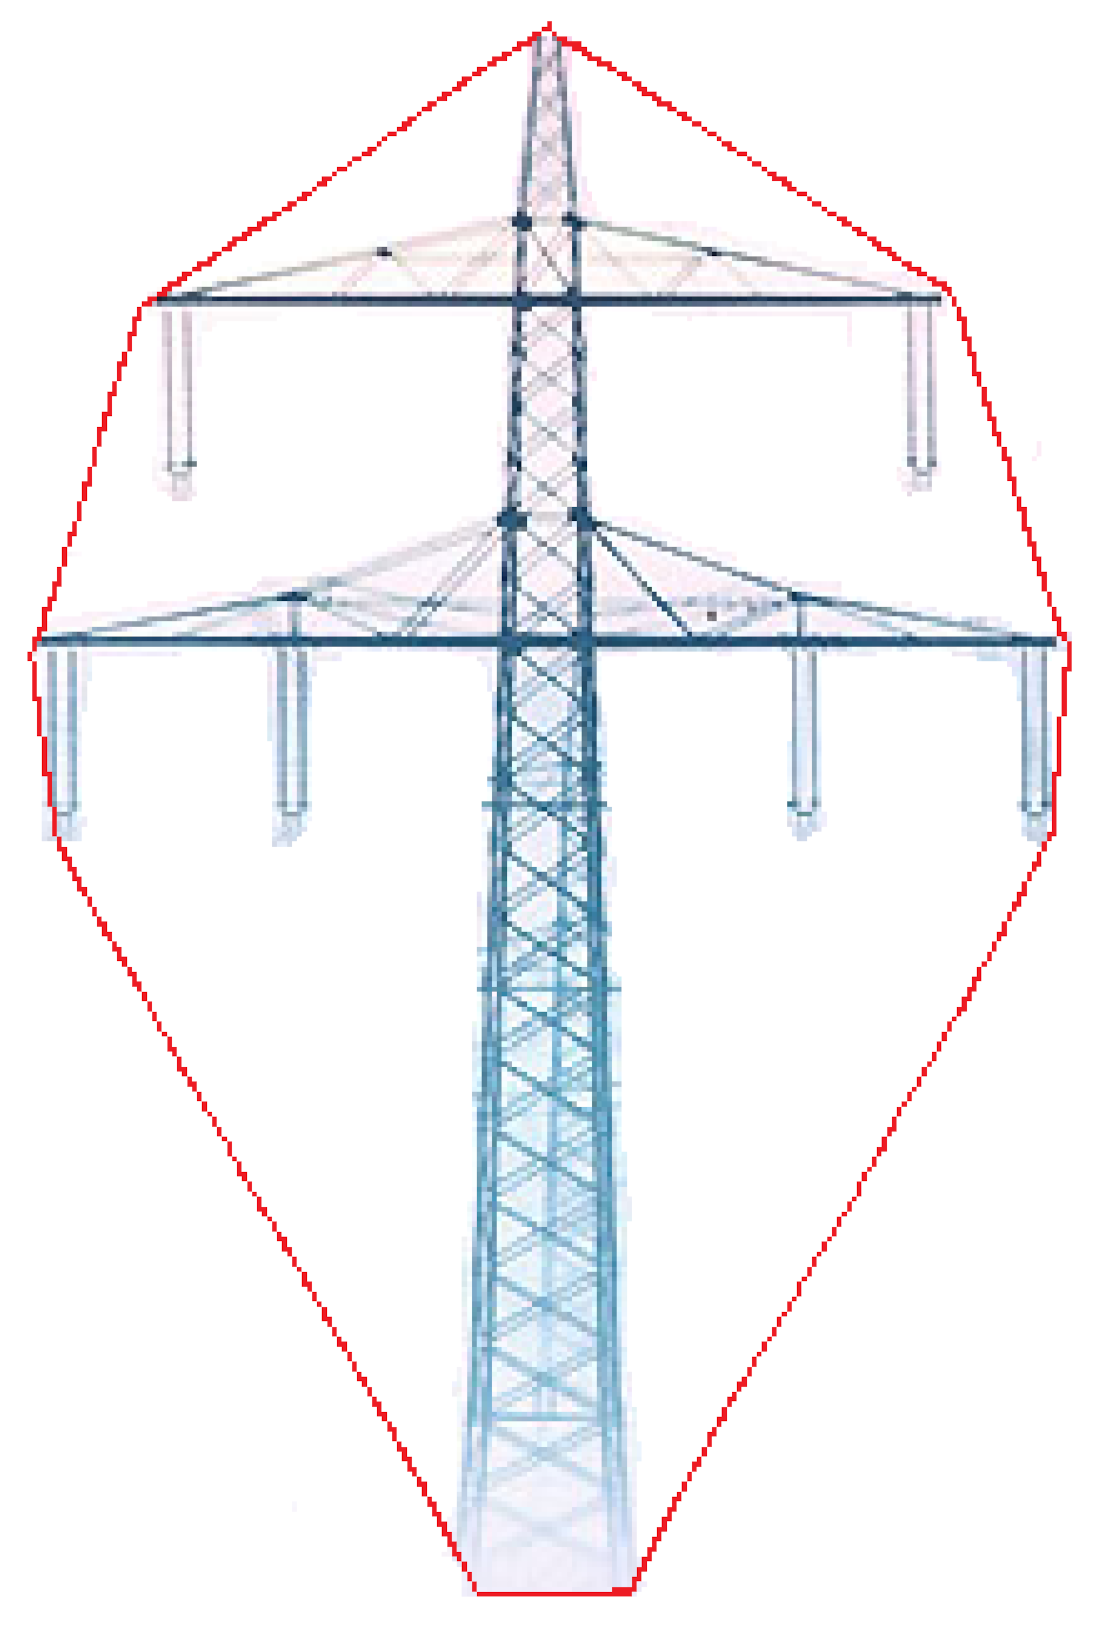
The quality of the landscape evaluates the relevance of the environment around the overhead line, in particular when the landscape is changing by crossing the overhead line, for example, in urban areas. The perception that people have about the landscape changes according to the way the landscape is used and shaped [20]. Obviously, a residential area is more vulnerable than an industrial area, and this has to be accounted for in the assessment procedure. This issue is addressed by the quality of the landscape indicator. However, this assessment is difficult to realize.
For example, consider an overhead line that passes over a historical building. The quality of the landscape should allow for the number of spectators and the time period of their presence. Above that, their personal perception may vary significantly. To account for all this is obviously not trivial. Another approach could use the monetary value of the area around the historical building before and after the construction of the line. Unfortunately, other events could also affect the monetary value, which needs to be considered. Furthermore, such a case is probably not trivial to generalize. Moreover, there are probably other aspects that have yet to be identified.
Due to the complexity of this issue, the methodology presented here uses a robust and rather simple approach. The quality of the landscape is based on photos of the sectors evaluated by a group of experts. In order to guarantee the independence of the indicator value, these people have to be neutral regarding the possible impacts of the line, e.g., neither residents of the zone nor workers of the utility should participate. Each of them classifies the sector into strong, medium, light, and no impact, as depicted in Table 1, following a linear approach. In this study, the approach proposed by Torres-Sibille in [13] was followed, where four different values for the impact measurement are introduced. A higher number of values would increase the granularity of the impact.
Finally, the average of all examiners gives the quality of the landscape of a certain sector. The evaluation of each sector includes the relevance of the area, such as an industrial or a residential area. Furthermore, the density of the population in the area is accounted for. The limitation of this method is that it includes a subjective factor of the criteria of the group of experts. The previous definition of landscape types and their associated values limits this subjective factor, as similar landscape types will be treated the same. Different approaches to assess the quality of the landscape are discussed in [21,22], where a systemized approach to landscape evaluation is discussed for Poland and Alpine regions. Moreover, the findings in [23] argue for the necessity of distinguishing between different ratings and landscape types. For the sake of simplicity, this paper uses the expert approach, as an evaluation of the quality of a landscape is not the primary aim of this paper.

3.3. Visual Impact

The visibility of an object depends on two aspects: the area it occupies in the field of view of a spectator and the contrast between the object and the environment. As mentioned above, they are not independent, especially in the case of slender structures such as overhead lines. Therefore, the indicators visibility and color are presented here together. The visibility indicator considers the occupied area in the field of view, and the indicator color considers the contrast between the line and the environment.

Visibility Indicator

The visibility indicator is proportional to the ratio of the area occupied by the overhead line to the whole area of the field of view. Even though this definition is rather elementary, it is difficult to give an exact value for this indicator. In order to do so, the occupied area and the field of view are examined using photos. The overhead line is divided into sectors, and photos are taken. Software packages such as Datinf, Coreldraw, and Photoshop can be used to compute the area of the overhead line in the pictures. This procedure is straightforward in the case of wind turbines or solar power plants. For example, a wind turbine occupies the area of the pylon and the circular area where the turbine blades move. In the presented method, this concept is transferred to transmission line pylons, which usually have a lattice structure. To do so, the occupied area is defined as a polygon of the most extreme points of the structure following the approach of [13] to wind turbines. The resulting surface appears larger than the actual steel surface of the beams and bracings as shown in Figure 2.
In our case, overhead lines and wind turbines are considered comparable structures. Therefore, the function defining the visibility indicator for wind turbines is considered to also be valid for overhead lines. Obviously, a validation similar to the one performed by Torres-Sibille et al. is desirable; however, at this point, it is a reasonable assumption. The indicator is separately computed for the pylons and the conductors by the following equation
I v i s x = 0.184   ·   x 0 < x 0.7 , 0.003   ·   x 2 + 0.114   · x + 0.051 0.7 < x 12.3 , 1 12.3 < x   20 ,
where
x = 100 · S f a S b a   ,
Sfa is the occupied area, and Sba is the whole area of the field of view. Figure 3 shows a graphical representation of this function.

3.4. Color Indicator

The color and the area of the structure have an influence on the visual impact, as already mentioned. In the case of wind turbines and solar power plants with large continuous surfaces, it is reasonable to use separate indicators for color and occupied area. The occupied area of a structure affects only the visual impact if it is noticeable. A grey transmission line pylon in front of a grey sky is still visible, but the conductor’s small cross-section is likely to be overseen. Therefore, the color indicator is applied as a factor for the visibility indicator of the conductors. The equation defining the color indicator follows the methodology of Torres-Sibille et al. [14].
I c o l o u r μ = 0 0 < μ 5 , 356   ·   10 9   ·   μ 2   +   12   · 10 4   ·   μ 56   ·   10 4 5 < μ 1563 , 1 1563 < μ   1700 ,
where μ is the difference in the color of the structure and the environment. The parameter μ is defined by
μ = Δ E f a / b a = ( L f a -   L b a ) 2 +   ( a f a -   a b a ) 2 + ( b f a -   b b a ) 2  
where Δ E f a / b a is the color difference, Lfa is the hue of the structure, Lba is the hue of the background, afa is the saturation of the structure, aba is the saturation of the background, bfa is the brightness of the structure, and bba is the brightness of the background [14].

3.5. Climatology Coefficient

The visibility of an overhead line also depends on climatology conditions. A cloudy day can reduce the difference in the color of the structure and the sky, for example. Consequently, the visibility of a line will be significantly reduced. This influence is accounted for by an atmospheric coefficient. It reflects the average atmospheric condition in the region where the overhead line is built. Climatology conditions are well documented by weather stations and usually easy to examine. Following the methodology in [14], the weather conditions are classified into four groups: clear, precipitation, fog, and cloudy days. These conditions are a measure of the average atmospheric conditions of a region. Calculation of the climatology coefficient requires the use of a group of experts [14]. Each group is considered to have a certain impact on the visibility. The climatology coefficient determines the average of these weather impacts by
β = i = 1 n P i m i   · m i
where Pi is the relative frequency of the weather condition, and mi is the impact value of the weather condition. Table 2 states the values for mi.
The methodology of Torres-Sibille et al. [13] weights the indicators of the visual impact and the fragility impact because studies showed that they do not have the same influence on the result. In the case of the visual impact of (1), the weighting factor α is 0.83.

3.6. Fragility Indicator

The fragility aims to allow for an evaluation of the degree of disturbance of the landscape due to the structure. It is difficult to define and to give an exact value for this effect. Therefore, four levels of disturbance are determined: strong, medium, light, and no impact. Their values vary from 0 to 1 with a linear relationship, as shown in Table 3.
As already mentioned, the indicators of the visual impact and the fragility impact are weighted because studies showed that they do not have the same influence on the result [13]. In the case of the fragility impact of (1), the weighting factor γ is 0.17.

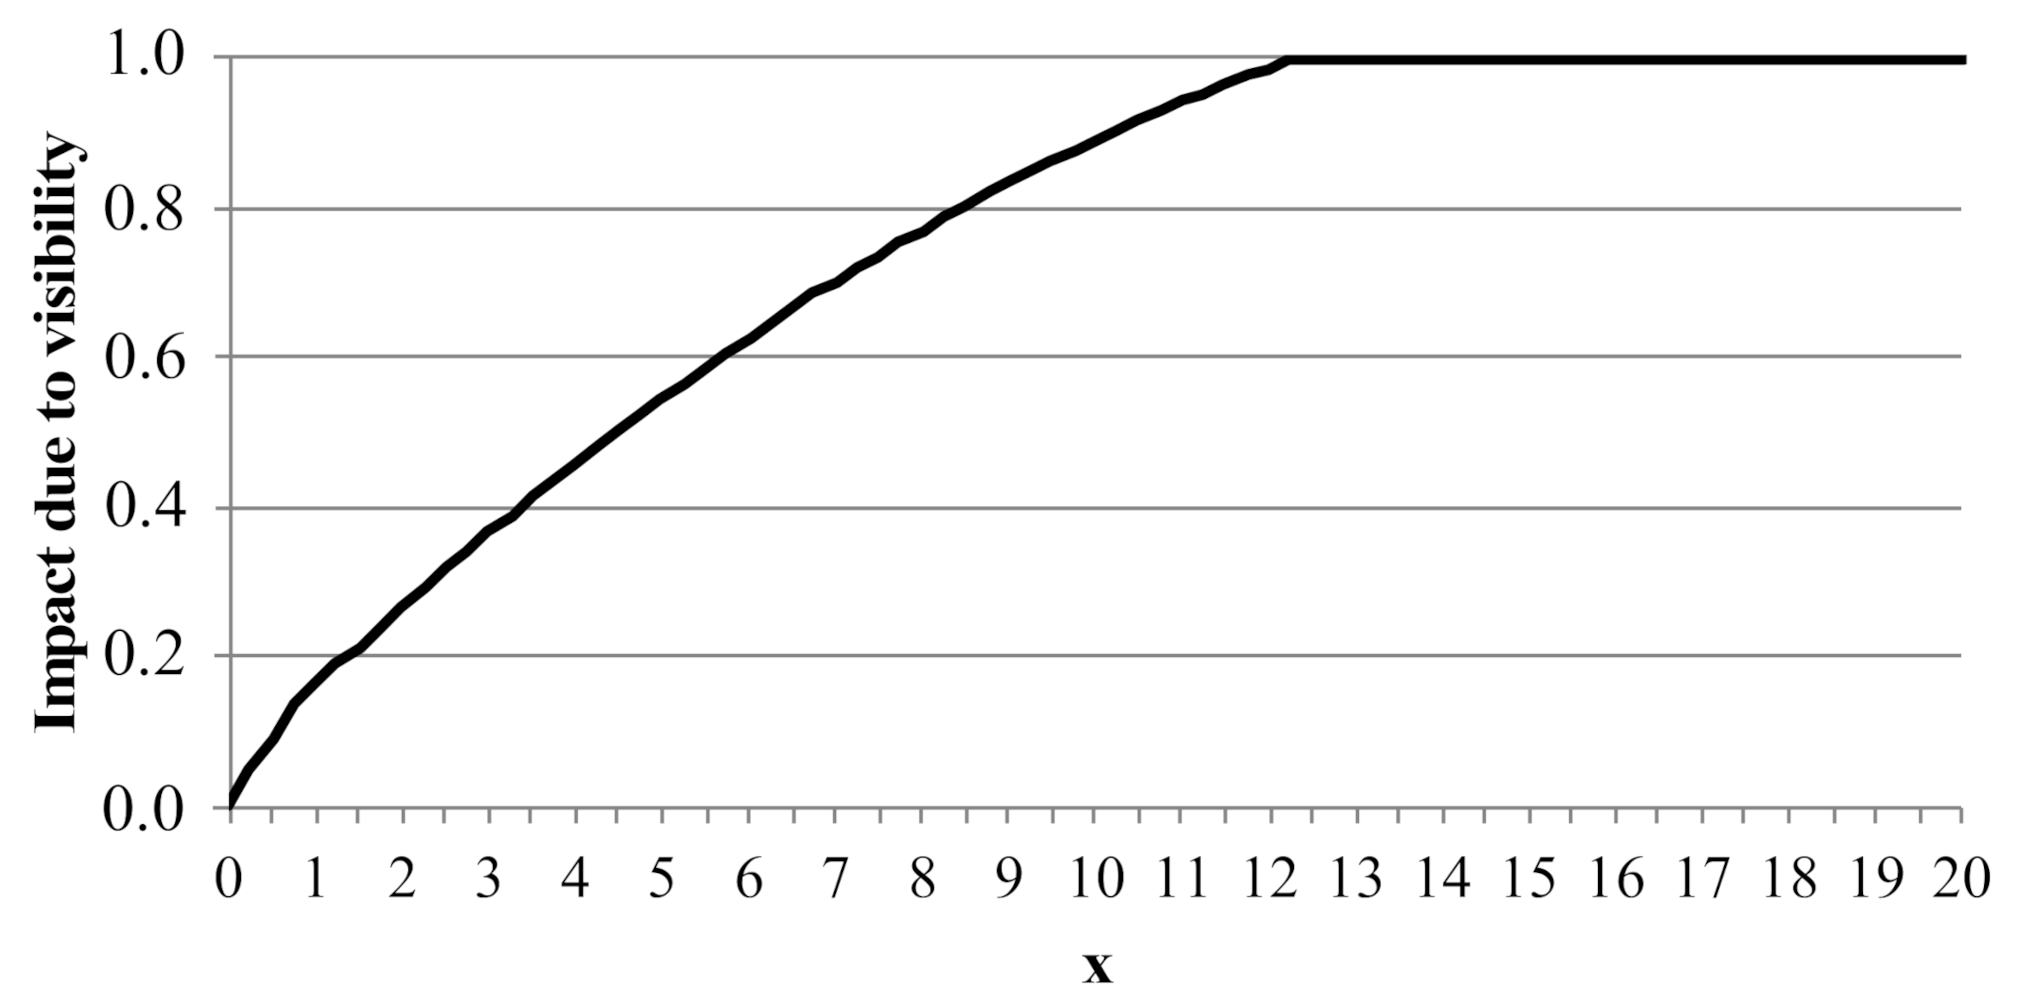
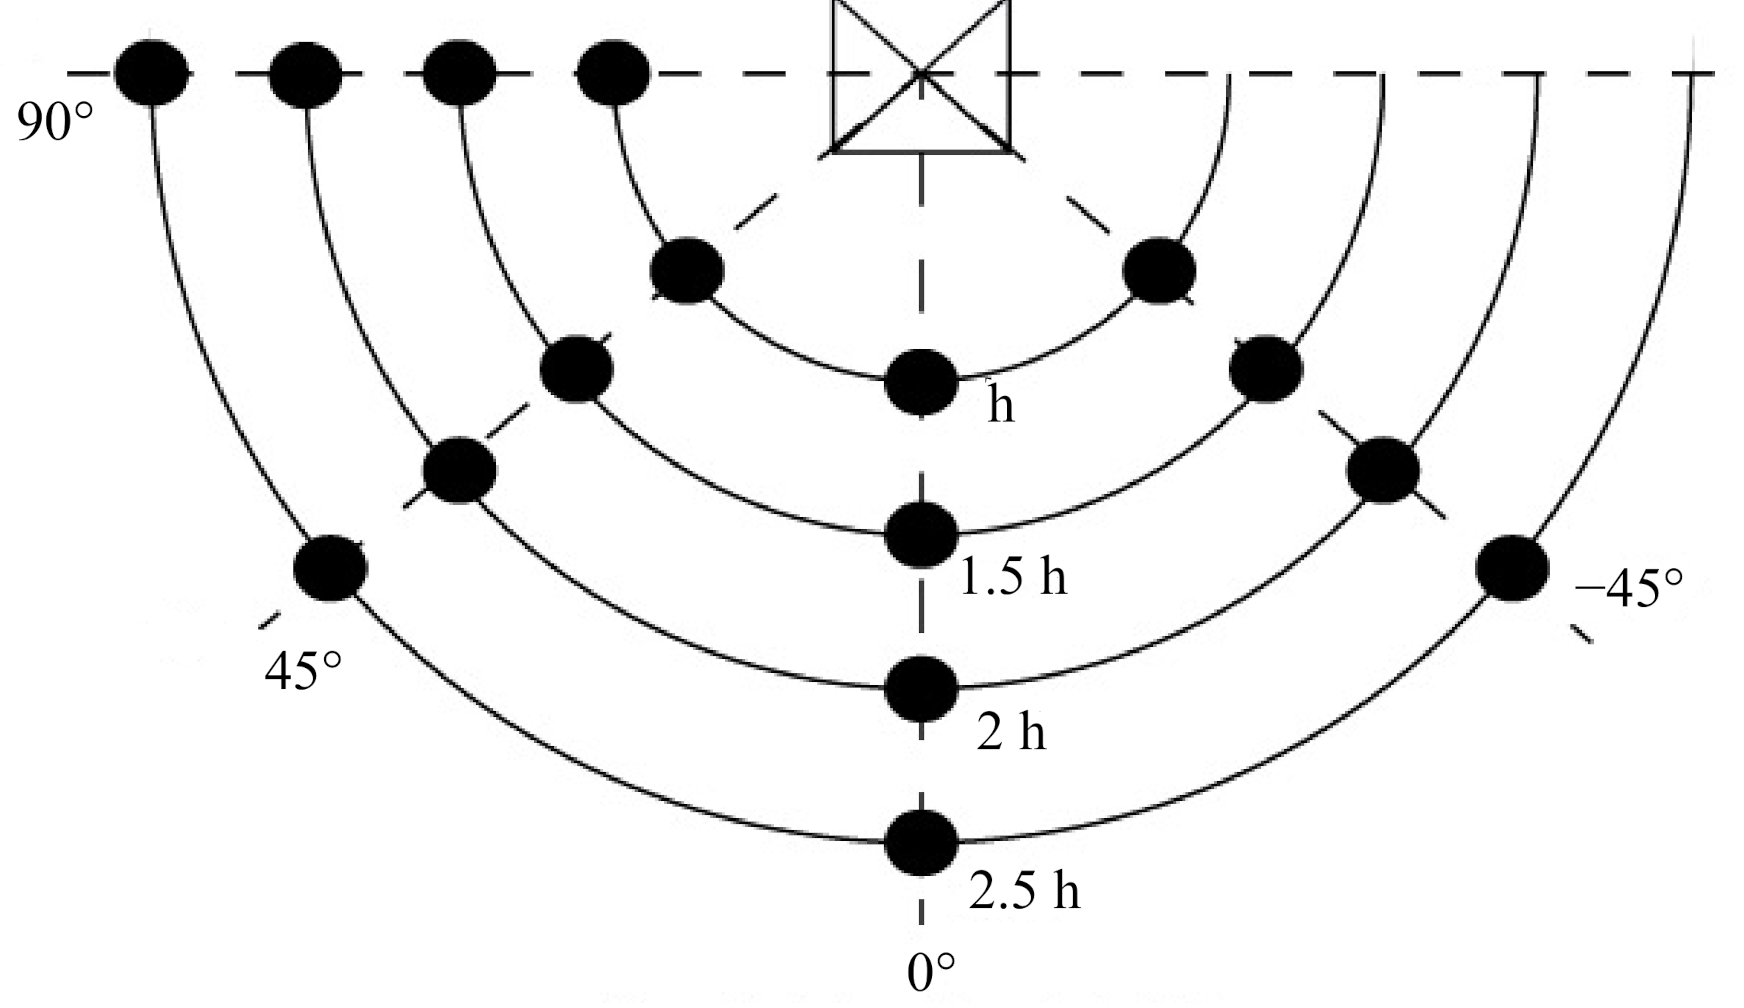
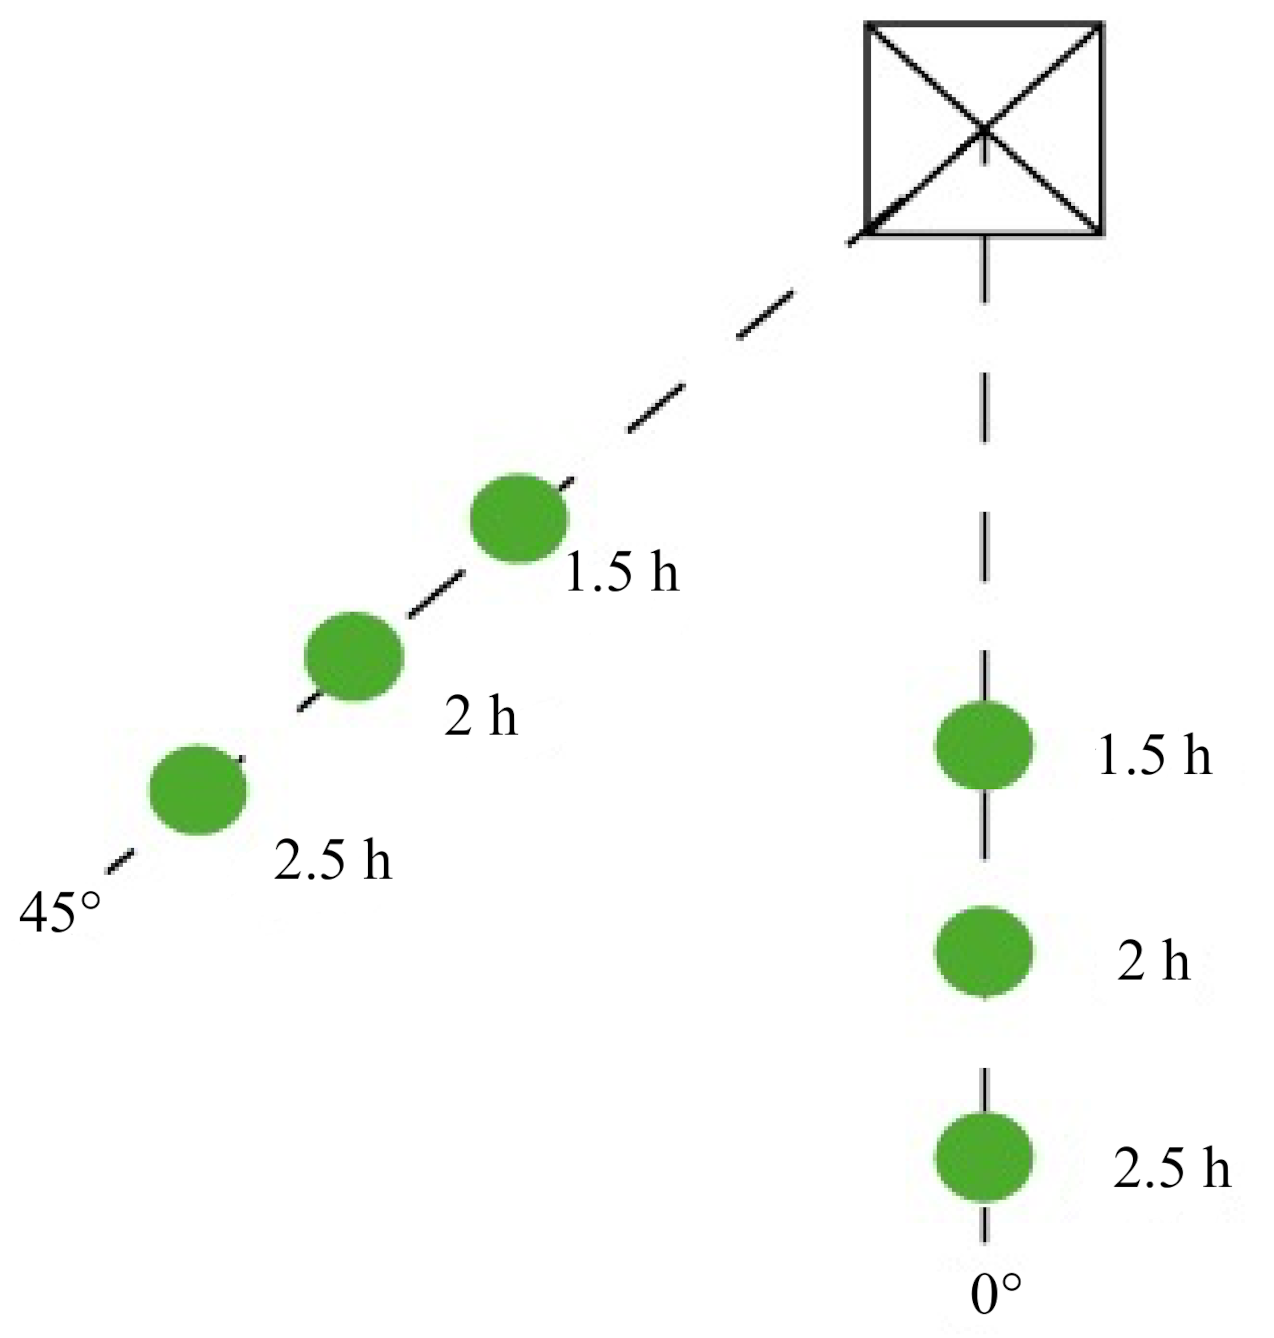
4. Impact of the Observation Angle on the Visibility Index

One of the most important drawbacks of the methodology presented in [19] is the fact that the shape of an overhead line has a strong relationship with the angle of vision and the distance of the observation point. With a given distance to the pylon, d, the distance of the camera to the earth, a, and the angle between the horizontal plane and the highest point of the pylon, α, the height, h, of the pylon can be determined by
h = d · t g α + a  
Once the height of the pylon is known, the observation distance interval can be defined by
h d 2.5   h
For each distance, the photographs can be made in relation to the distance and the angle in the intervals shown in Figure 4.
In order to realize a sensibility analysis to determine how the angle and the observation distance impact upon the visual impact calculation, a 110 kV line pylon of the Castell d’Aro to Vall Llobregat line (Figure 5) was analyzed in Girona Province, Spain [24]. As shown in Figure 4, 16 photographs need to be taken; however, for each photograph, there is the option to take it horizontally or vertically. So, finally, 32 photographs of the pylon were taken. The post analysis was performed by the software Adobe Photoshop CS5® to determine the number of pixels in the photograph and the evolution of the surface of the pylon and the cables, as shown as an example in Table 4. Table 5 shows the resulting percentage of occupation of the pylon and the cables of the photographs in relation to the angle and the height of the pylon for the horizontal and vertical cases.
By using Table 4, the visibility index Ivis was calculated by using (3). In order to perform a sensibility analysis between the same observation point distance and the different angles and possible orientations, the following equation was applied
Δ   % = I v i s x I v i s r e f I v i s r e f · 100  
where Ivis(x) is the visibility index, and Ivisref represents the reference visibility index.
Table 6 shows the differences between the visibility index photographs taken horizontally and vertically using (9). Different angles and pylon and cable visibilities were also analyzed. On the one hand, the pylon visibility suffers from differences of less than ±6.6%, which shows that its influence is low. On the other hand, the cable visibility varies significantly with the distance and angle, with a maximum of 11.7%. Table 7 shows the sensibility analysis of the influence of the angle with respect to the 0° angle. We can observe the high impact of the angle of the photograph taken on the visibility index. We can observe differences of up to 56% in the case of photographs taken vertically at 90°. Table 8 and Table 9 show the influence of the angle in relation to the −45° angle and the 45° angle, respectively. On the one hand, we can observe that the comparison between −45° and 45° shows similar values in both tables; on the other hand, some values vary by over 10% depending on the distance and the way the photograph was taken.
Analyzing the results of the sensibility analysis, we can highlight the most stable orientation of 0° and 45° of the horizontal case. This case has an average error of 7.17% for the pylons, while the average is zero for the cables. Choosing 0° and 45° as the preferred angles for taking photographs, the worst case was the distance of 1 h. For this reason, we propose to eliminate this distance.
In conclusion, the recommendation after performing the sensibility analysis is that photographs should be taken horizontally at a distance of 1.5 h, 2 h, and 2.5 h with an angle of 0° or 45°. Choosing these six positions in order to take photographs, the position will not influence significantly the result of the visibility index. Figure 6 shows the selected positions.

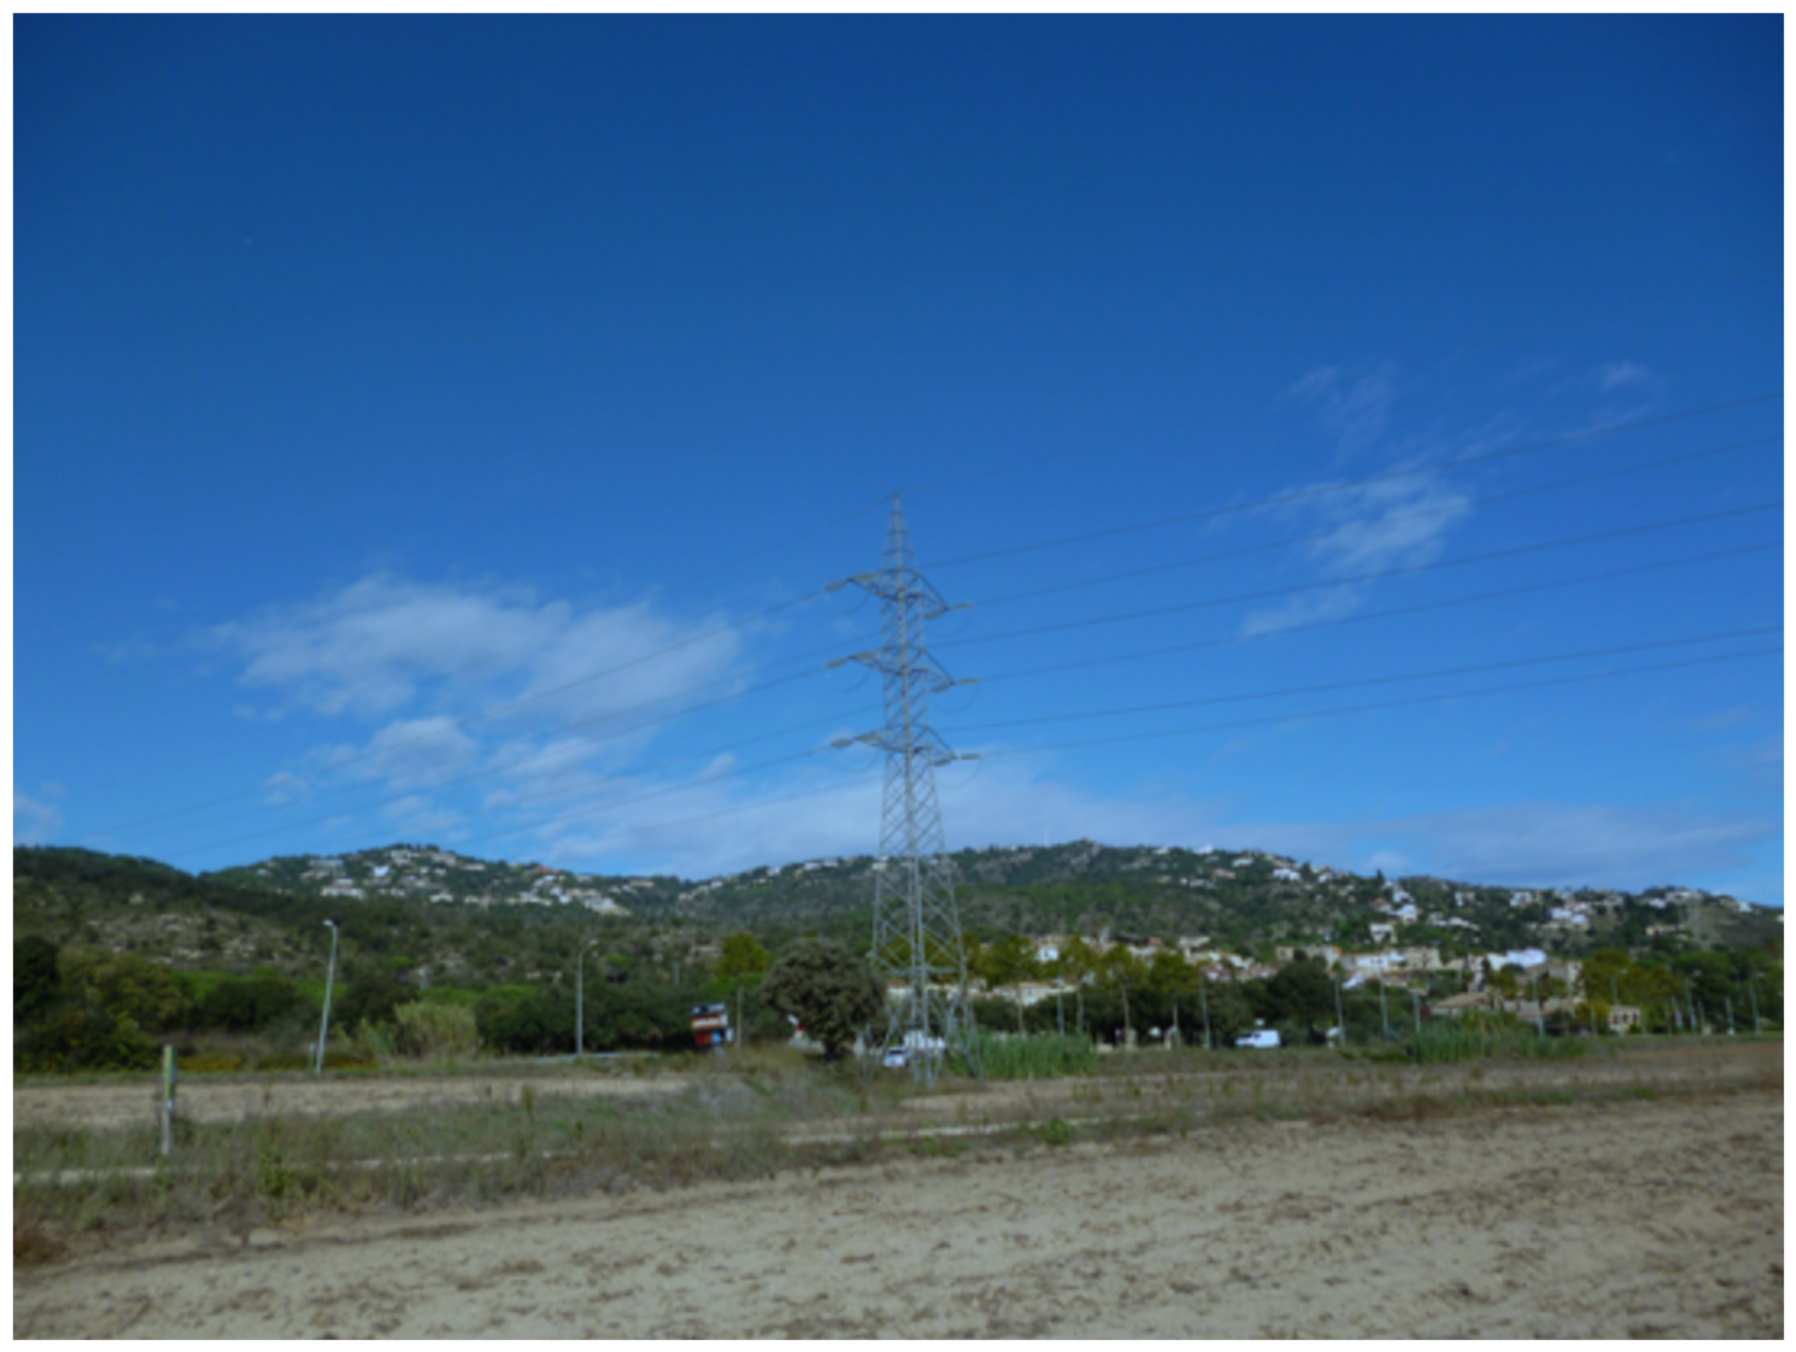
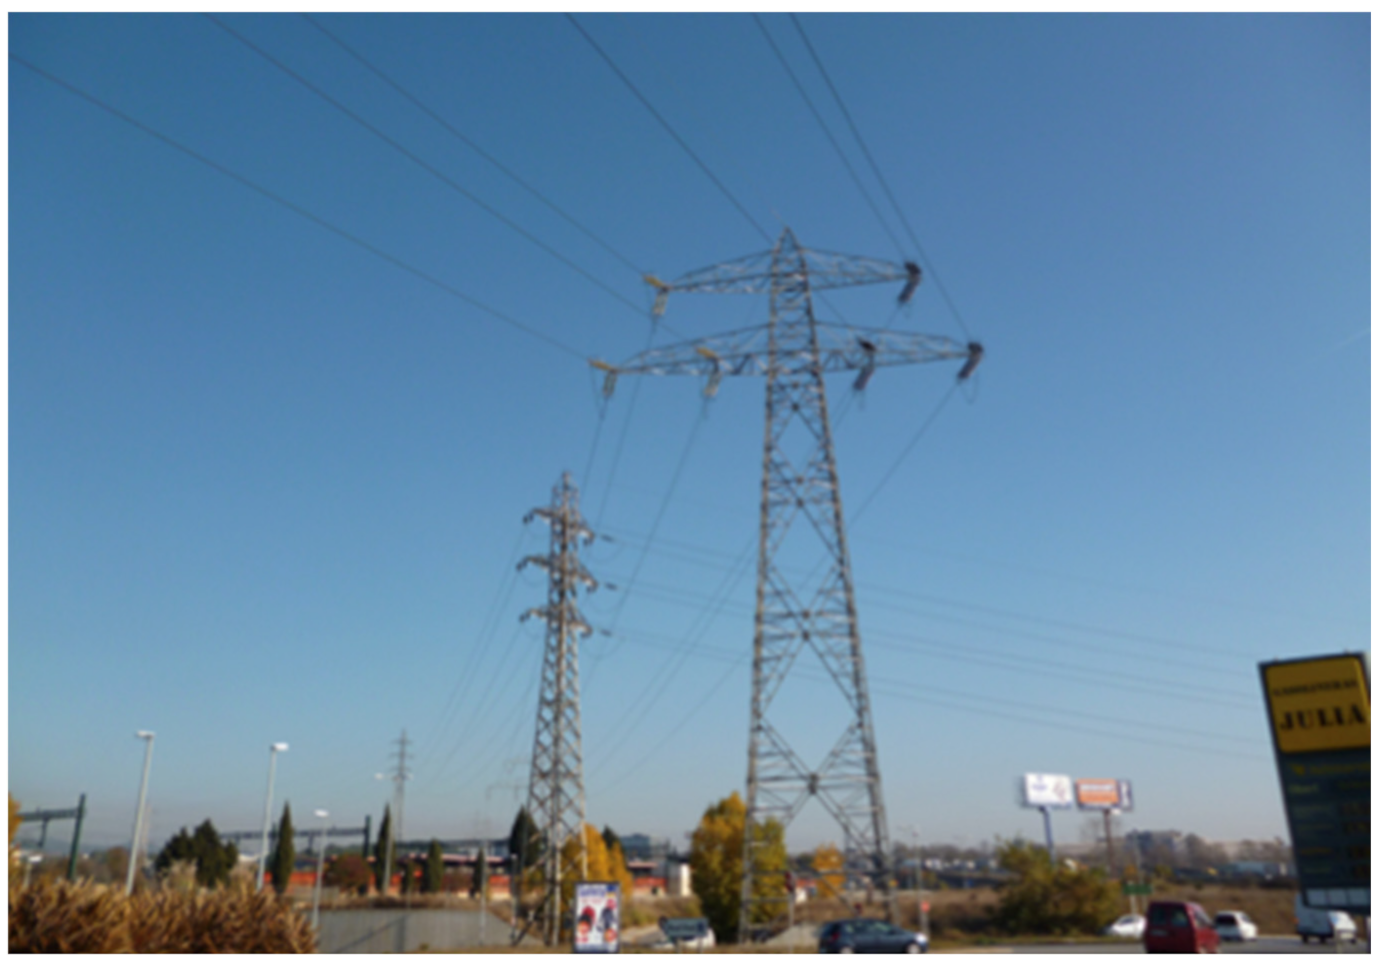
5. Application Case and Comparison with Previous Results

In this section, the objective is to apply the improvement proposed in this paper of finding the visual impact to tree transmission lines based in Spain. After that, the results are compared with the results of the previous studies [1,25]. The references present a methodology for the assessment of the impact of existing high-voltage lines in urban areas. The impact of transmission lines in urban areas was evaluated by a weighted combination of different factors. One of these factors is the visual impact, which was calculated by following (1). The drawback of this methodology is the subjective nature of the value obtained, as the different input factors of this formula are obtained by the estimations of experts. In this section, we analyze the following transmission lines located in Rubí (Barcelona, Spain) using the proposed methodology:
  • the 110 kV transmission line Can Jardí-Collblanc (R1), located at the Avinguda Pep Ventura;
  • the 220 kV transmission line Can Jardí-Sant Andreu-Canyet (R2), located at the turnaround Avinguda Electricitat and Passeig de les Torres; and
  • the 220 kV transmission line Foix-Mas Figueres (R3), located in the zone Can Fatjó.
Figure 7 shows the transmission line located in the Avinguda Electricitat as an example of the photographs taken. In the above-described locations, the visibility index was determined using (2), and the obtained results are depicted in Table 10, Table 11 and Table 12.
The OAIV was calculated by using (1). The values of the OAIV of the three transmission lines are shown in Table 13. The results of the visual impact assessment [1] and [25] were calculated on a scale from 0 to 27. In order to compare the results obtained using the novel methodology, the resulting OAIV was multiplied by 27. The comparison between the results of both methods is described in Table 14.
It can be seen that the novel methodology provides a similar result in terms of the absolute value of the impact. That means that the expert opinion and the results of the presented methodology lead to similar results, and it validates the proposed methodology for the presented case study. However, the situations R1 and R2 are, in the methodology described in [1], evaluated equally, e.g., in the same position of the ranking, while the novel methodology provides a higher resolution and, therefore, better differentiation between both cases. The presented methodology shows a higher granularity and enables us to differentiate better between the two cases. The application of the methodology is not limited to the specific conditions in Spain, and it is applicable in other countries. The limitation of the methodology lies in the possibility of taking photographs at the distances and angles indicated.

6. Conclusions

The presented paper contributes to the improvement of the calculation of the overall aesthetic impact value (OAIV) for the assessment of the visual impact of high-voltage overhead lines. The proposed methodology is based on the systematic analysis of photographs taken of the impacted area to eliminate the subjective aspects of methods used in previous studies. The observer’s position and angle have an impact on the results of the visual impact calculation, and therefore a sensibility analysis was performed. The analysis showed that photographs that were taken horizontally at a distance of 1.5 h, 2 h, and 2.5 h with an angle of 0° or 45° would not influence the result of the visibility index significantly. The methodology was applied to a study case near Barcelona, and results of the visual impact calculation show a higher resolution and better differentiation between the cases as compared with the previous methodologies used in the literature. The proposed methodology is not limited to the specific conditions in Spain and can be applied in the international context. It can improve the overall assessment of overhead lines and present an objective evaluation of their impact. This could improve the management of impacted areas by better public acceptance by using a scientific method.

Author Contributions

Conceptualization and methodology, A.S., O.B.-A., and J.R.-D.; investigation, J.W.; fieldwork, J.A.-A.; validation, J.W. and J.A.-A.; writing—original draft preparation, A.S., J.W., and J.A.-A.; writing—review and editing, A.S. and O.B.-A., and J.R.-D. All authors have read and agreed to the published version of the manuscript.

Funding

This research received no external funding.

Institutional Review Board Statement

Not applicable.

Informed Consent Statement

Not applicable.

Data Availability Statement

Not applicable.

Conflicts of Interest

The authors declare no conflict of interest.

References

  1. Sumper, A.; Boix-Aragonés, O.; Villafáfila-Robles, R.; Ramírez-Pisco, R. Methodology for the assessment of the impact of existing high voltage lines. Energy Policy 2010, 38, 6036–6644. [Google Scholar] [CrossRef]
  2. Sumper, A.; Ferreira, P. A New Open Access Journal. Electricity 2020, 1, 4. [Google Scholar] [CrossRef]
  3. Franken, M.; Schrief, A.B.; Barrios, H.; Puffer, R.; Moser, A. Co-optimization of multi-stage transmission expansion planning and grid operation. Electr. Power Syst. Res. 2020, 189, 106686. [Google Scholar] [CrossRef]
  4. Horst, D.V.d. NIMBY or not? Exploring the relevance of location and the politics of voiced opinions in renewable energy siting controversies. Energy Policy 2007, 35, 2705–2714. [Google Scholar] [CrossRef] [Green Version]
  5. Vajjhala, S.P.; Fischbeck, P.S. Quantifying siting difficulty: A case study of US transmission line siting. Energy Policy 2007, 35, 650–671. [Google Scholar] [CrossRef]
  6. Marshall, R.; Baxter, R. Strategic Routeing and Environmental Impact Assessment for Overhead Electrical Transmission Lines. J. Environ. Plan. Manag. 2002, 45, 747–764. [Google Scholar] [CrossRef]
  7. Rahman, K.A. Mediation and Mediator Skills: A Critical Appraisal. Available online: https://ssrn.com/abstract=3231684 (accessed on 1 February 2012).
  8. Cloquell-Ballester, V.-A.; Cloquell-Ballester, V.-A.; Monterde-Díaz, R.; San-tamarina-Siurana, M.-C. Indicators validation for the improvement of environmental and social impact quantitative assessment. Environ. Impact Assess. Rev. 2006, 26, 79–105. [Google Scholar] [CrossRef]
  9. Salci, S. A framework for assessing economic and environmental benefits from transmission line rehabilitation investments. Electr. J. 2018, 31, 75–81. [Google Scholar] [CrossRef]
  10. Bickel, P.; Friedrich, R. ExternE: Externalities of energy. Eur. Commun. 2005. Available online: https://op.europa.eu/en/publication-detail/-/publication/b2b86b52-4f18-4b4e-a134-b1c81ad8a1b2 (accessed on 29 July 2021).
  11. Doukas, H.; Karakosta, C.; Flamos, A.; Psarras, J. Electric Power Transmission: An overview of associated burdens. Int. J. Energy Res. 2011, 11, 970–988. [Google Scholar] [CrossRef]
  12. Nassauer, J.I. Landscape as medium and method for synthesis in urban ecological design. Landsc. Urban Plan. 2012, 106, 221–229. [Google Scholar] [CrossRef] [Green Version]
  13. Torres-Sibille, A.D.C.; Cloquell-Ballester, V.-A.; Cloquell-Ballester, V.-A.; Ramírez, M.Á.A. Aesthetic impact assessment of solar power plants: An objective and a subjective approach. Renew. Sustain. Energy Rev. 2009, 13, 986–999. [Google Scholar] [CrossRef]
  14. Torres-Sibille, A.D.C.; Coloquel-Ballester, V.-A.; Coloquell-Ballester, V.-A.; Darton, R. Development and validation of a multicriteria indicator for the assessment of objective aesthetic impact of wind farms. Renew. Sustain. Energy Rev. 2009, 13, 40–66. [Google Scholar] [CrossRef]
  15. Hadrian, D.R.; Bishop, I.D.; Mitcheltree, R. Automated Mapping of visual impacts in utility corridors. Landsc. Urbaaestheticng 1988, 16, 261–282. [Google Scholar] [CrossRef]
  16. Luken, J.O.; Hinton, A.C.; Baker, D.G. Forest edges associated with power-line corridors and implications for corridor siting. Landsc. Urban Plan. 1991, 20, 315–324. [Google Scholar] [CrossRef]
  17. Tempesta, T.; Vecchiato, D.; Girardi, P. The Landscape benefits of the burial of high voltage power lines: A study in rural areas of Italy. Landsc. Urban Plan. 2014, 126, 53–64. [Google Scholar] [CrossRef]
  18. Frontuto, V.; Corsi, A.; Novelli, S.; Gullino, P.; Larcher, F. The visual impact of agricultural sheds on rural landscapes: The willingness to pay for mitigation solutions and treatment effects. Land Use Policy 2020, 91, 104337. [Google Scholar] [CrossRef]
  19. Wagner, J. Methodology of Environmental Impact Assessment for Evaluating Existing Overhead Lines. Master’s Thesis, Universitat Politècnica de Catalunya, Barcelona, Spain, 2011. [Google Scholar]
  20. Antrop, M. Why landscapes of the past are important for the future. Landsc. Urban Plan. 2005, 70, 21–34. [Google Scholar] [CrossRef]
  21. Senetra, A.; Wasilewicz-Pszczółkowska, M.; Grzelak-Kostulska, E. The European landscape convention as a Tool for the protection, management and planning of landscapes. Barom. Reg. 2015, 3, 81–88. [Google Scholar]
  22. Schripke, U.; Zoderer, B.M.; Tappeiner, U.; Tasser, E. Effects of past landscape changes on aesthetic landscape values in the European Alps. Landsc. Urban Plan. 2021, 212, 104109. [Google Scholar] [CrossRef]
  23. Sevenant, M.; Antrop, M. Cognitive attributes and aesthetic preferences in assessment and differentiation of landscapes. J. Environ. Manag. 2008, 90, 2889–2899. [Google Scholar] [CrossRef] [PubMed]
  24. Amat, J. Metodologia d’avaluació de l’impacte Visual de les línies d’alta Tensió Existents. Master’s Thesis, Univeristat Politècnica de Catalunya, Barcelona, Spain, 2014. [Google Scholar]
  25. CITCEA-UPC. Estudi Sobre l’impacte de les Linies de Tensió Superior o Igual a 66 kV en les àrees Urbanes de Rubí; CITCEA-UPC: Barcelona, Spain, 2004. [Google Scholar]
Figure 1. Methodology to evaluate the overall impact of overhead lines in urban areas.
Electricity 02 00017 g001
Figure 2. The occupied area of a pylon.
Electricity 02 00017 g002
Figure 3. The value function Ivis, adopted from [13].
Electricity 02 00017 g003
Figure 4. Observation points in the relationship between the height and observation angle intervals.
Electricity 02 00017 g004
Figure 5. Pilon T-91 of the 110 kV Castell d’Aro overhead line. The photograph was taken from the observation point at 1.5 h, −45°, horizontal.
Electricity 02 00017 g005
Figure 6. Positions selected for taking photographs.
Electricity 02 00017 g006
Figure 7. Photograph taken of the 220 kV transmission line Can Jardí-Sant Andreu-Canyet (R2), located at the turnaround Avinguda Electricitat and Passeig de les Torres.
Electricity 02 00017 g007
Table 1. Strength of the landscape approach.
Strength of the ImpactIndicator Value
Strong impact1
Medium impact0.75
Light impact0.25
No impact0
Table 2. Climatology coefficient values [4].
ClimatologyClimatology Value mi
Clear day1
Cloudy day0.75
Precipitation0.5
Fog0.25
Table 3. Fragility impact values.
Strength of the ImpactIndicator Value
Strong impact1
Medium impact0.75
Light impact0.25
No impact0
Table 4. Example of the values of pixels obtained by the analysis of the photographs for 0° and −45° for the horizontal and vertical cases.
Num. of Pixels−45°
PhotographPylonCablesPhotographPylonCables
HORIZONTAL1 h13,996,800718,0943,701,33713,996,800907,9891,648,112
1.5 h13,996,800340,4112,520,07813,996,800451,2661,822,646
2 h13,996,800196,1061,781,71613,996,800260,5291,863,753
2.5 h13,996,800133,5221,229,32213,996,800168,9821,881,785
Num. of Pixels−45°
PhotographPylonCablesPhotographPylonCables
VERTICAL1 h13,996,800684,3292,838,62513,996,800928,7263,168,071
1.5 h13,996,800337,1392,006,03613,996,800488,6903,649,559
2 h13,996,800201,8571,446,96713,996,800278,2093,264,157
2.5 h13,996,800140,2601,045,12413,996,800185,1073,002,302
Table 5. Percentage of occupation of the pylon and the cables of the photographs in relation to the angle and the height of the pylon for the horizontal and vertical cases.
%−45°45°90°
PylonCablesPylonCablesPylonCablesPylonCables
HORIZONTAL1 h5.13026.4446.48711.7755.75921.1942.79628.922
1.5 h2.43218.0053.22413.0222.86018.7801.29620.636
2 h1.40112.7291.86113.3161.71815.4750.76216.130
2.5 h0.9548.7831.20713.4441.14511.9810.52813.023
%−45°45°90°
PylonCablesPylonCablesPylonCablesPylonCables
VERTICAL1 h4.88920.2816.63522.6345.93219.3872.80021.557
1.5 h2.40914.3323.49126.0742.80013.9911.18615.414
2 h1.44210.3381.98823.3211.74410.5230.75612.000
2.5 h1.0027.4671.32221.4501.1478.2900.5339.857
Table 6. Sensibility analysis for photographs taken horizontally (H) or vertically (V).
−45°45°90°
PylonCablesPylonCablesPylonCablesPylonCables
H vs. V1 h3.64−3.33−1.66−2.31−2.240.00−0.110.00
1.5 h0.750.00−6.480.001.640.006.050.00
2 h−2.129.11−5.120.00−1.168.160.461.30
2.5 h−3.3210.46−6.650.00−0.1119.91−0.5111.68
Table 7. Sensibility analysis of the influence of the angle to the 0° position.
Differences to 0° in %
0° and −45°0° and 45°0° and 90°
PylonCablesPylonCablesPylonCables
HORIZONTAL1 h16.160.998.47−2.3147.87−2.31
1.5 h19.840.009.010.0049.990.00
2 h18.97−1.605.870.0046.150.00
2.5 h14.7817.923.621.3840.120.00
Differences to 0° in %
0° and −45°0° and 45°0° and 90°
PylonCablesPylonCablesPylonCables
VERTICAL1 h20.540.007.950.0048.670.00
1.5 h25.280.0015.940.0055.870.00
2 h21.299.119.428.1649.011.30
2.5 h17.4526.509.5421.0143.5711.68
Table 8. Sensibility analysis of the influence of the angle to the −45° position.
Differences to −45° in %
45° and −45°90° and −45°
PylonCablesPylonCables
HORIZONTAL−9.18−3.3337.82−3.33
−13.510.0037.6111.58
−16.180.0033.541.58
−13.10−20.1529.73−21.83
Differences to −45° in %
45° and −45°45° and −45°
PylonCablesPylonCables
VERTICAL−15.840.0035.410.00
−12.500.0040.940.00
−15.08−1.0435.22−8.59
−9.59−7.4731.64−20.17
Table 9. Sensibility analysis of the influence of the angle to the 45° position.
Differences to 45° in %
45° and −45°45° and 90°
PylonCablesPylonCables
HORIZONTAL8.413.2243.050.00
11.900.0045.040.00
13.920.0042.800.00
11.5816.7737.87−1.40
Differences to 45° in %
45° and −45°45° and 90°
PylonCablesPylonCables
VERTICAL13.670.0044.240.00
11.110.0047.500.00
13.111.0343.71−7.47
8.756.9537.62−11.81
Table 10. Visibility index of the Pep Ventura (R1) application case.
(I vis) Pep Ventura R1
AngleDistancePylonsCables
1.5 h0.5120.908
Table 11. Visibility index of the Avinguda Electricitat application case.
(I vis) Av. Electricitat R2
AngleDistancePylonsCables
1.5 h1.0001.000
Table 12. Visibility index of the Can Fatjó application case.
(I vis) Can Fatjó R3
AngleDistancePylonsCables
1.5 h0.6071.000
Table 13. The evaluation result of the proposed methodology.
Indicator27 OAIV 1
IndexβColorVisibility of PylonsVisibility of WiresQualityFragilityTotal
R10.8270.020.5120.9080.500.6116.283
R20.8270.021.0001.0000.250.7925.616
R30.8270.020.6071.0001.000.63914.480
1 The OAIV calculated in study [1] is on the scale from 0 to 27.
Table 14. Comparison of the impact ranking of the methodology used in [1] and the proposed methodology.
The Methodology Used in [1]Proposed Methodology
IndexResultRankingResultRanking
R16.2426.2832
R26.2425.6163
R318.72114.4801
Publisher’s Note: MDPI stays neutral with regard to jurisdictional claims in published maps and institutional affiliations.

