
A Nexus-Based Impact Assessment of Rapid Transitions of the Power Sector: The Case of Greece

Department of Mechanical Engineering, Aalto University, Otakaari 4, 02150 Espoo, Finland
Electricity 2023, 4(3), 256-276; https://0-doi-org.brum.beds.ac.uk/10.3390/electricity4030016
Submission received: 1 August 2023
/
Revised: 29 August 2023
/
Accepted: 1 September 2023
/
Published: 5 September 2023
Abstract
:Power system transformation can unleash wide-ranging effects across multiple, frequently interlinked dimensions such as the environment, economy, resource systems, and biodiversity. Consequently, assessing the multidimensional impacts of power system transformation, especially under rapid transitions, has become increasingly important. Nonetheless, there is a gap in the literature when it comes to applying such an analysis to a Mediterranean country facing structural socioeconomic challenges. This paper explores the potential multifaceted implications of rapidly decarbonizing the Greek power sector by 2035, focusing on the local-level consequences. The evaluation criteria encompass the cost-optimal power mix, power costs, land use, biomass utilization, GDP, and employment. In this effort, a technology-rich cost optimization model representing Greece’s power sector is linked to a global Computable General Equilibrium (CGE) macroeconomic model focusing on the Greek economy. The results indicate that a fast decarbonization of the Greek power sector could trigger positive socioeconomic consequences in the short- and medium-term (GDP: +1.70, employees: +59,000 in 2030), although it may induce negative long-term socioeconomic effects due to increased capital investment requirements. Additionally, the impact on land use may only be trivial, with the potential to decrease over time due to the de-escalation of biomass power generation, thereby reducing the risk of harming biodiversity.
1. Introduction
1.1. Challenges and Opportunities of Power System Transformation
Today’s economic model has exerted severe pressure on planet Earth [1], as evidenced by the multiple systemic, escalating, and interlinked planetary crises, mainly comprising the climate and biodiversity crisis [2]. Addressing these crises requires the redesign of the current energy consumption and production models, with a focus on promoting renewable power generation [3]. This transition encompasses significant opportunities, as power generation can become cleaner and more decentralized, providing flexibility to the system and benefits to households and the environment [4,5]. Furthermore, it can assist in dealing with energy poverty and creating new jobs [6,7]. However, it also entails substantial risks and uncertainties across multiple dimensions and sectors, including resource systems, society, and the economy [8].
In contrast to conventional fossil fuel technologies, clean energy technologies, notably wind and solar, require extensive land areas for placing their infrastructure [9,10]. This attribute of clean power generation introduces risks to biodiversity and wildlife habitat cohesion, while posing threats to the aesthetic and cultural heritage of specific regions [11,12]. Consequently, while expanding clean power generation can mitigate climate change impacts, thereby benefitting biodiversity hotspots around the globe, it may also negatively affect them if not accompanied by comprehensive land-use planning [13]. In this respect, fostering a culture of integrated land-energy planning among power generation decision-makers becomes crucial.
Heretofore, three approaches have been mainly employed in the literature to measure the land area impact (LAI) of the power sector [14]: (1) “footprint”, (2) “footprint and spacing”, and (3) “life cycle”. The first approach focuses on the infrastructure required by the power sector, such as power plants, fossil fuel mines, and solar panels, but overlooks the required spacing between renewable technologies, such as wind turbines, to avoid efficiency losses. The second approach examines the aspect of spacing along with the land demanded by power generation technologies. The third approach considers the whole value chain of power generation infrastructure, including manufacturing, construction, and decommissioning processes, but also excludes the aspect of spacing between renewable technologies. These approaches have been applied at continental [15], national [16], and regional [17] scales to estimate the land area requirements of power system pathways.
Decarbonizing the power system involves a restructuring of power system costs, which in turn can trigger economy-wide impacts by affecting the disposable income of households and final demand [18]. On the one hand, this transition requires substantial upfront capital investments in the clean technology value chain to acquire the necessary infrastructure. On the other hand, unlike fossil fuel technologies, renewable technologies present low operational costs, which are mainly fixed regardless of the utilization rate. The latter characteristic can stabilize power generation costs, thereby increasing the resilience of the power system against market variability and enhancing energy security when renewable electricity is domestically produced [19].
Therefore, the energy transition can be positive for the general economy if it lowers energy costs, and vice versa. Similarly, it can bolster employment if the value chain of clean energy technologies integrated into the system creates more jobs than the fossil fuel sectors which are phased out [20,21]. Consequently, the socioeconomic impacts of this transition may vary on a regional and temporal basis according to the underlying technological and economic dynamics, necessitating a thorough evaluation at the local level. A significant body of literature has examined the socioeconomic implications of transitioning to highly renewable power systems (e.g., [21,22]). In this endeavour, a power system cost optimization model is usually linked to a macroeconomic model, such as Computable General Equilibrium (CGE), to examine both the technological dynamics of the power sector and its impact on the broader economy.
Furthermore, the intermittent nature of wind and solar power generation calls for the diversification of the power mix beyond conventional renewable technologies, alongside the development of electricity interconnections with other countries [23,24]. However, several renewable technologies present restricted or zero potential due to geographical particularities, technological limitations, or social resistance (e.g., hydro, geothermal, and nuclear). To that end, biomass can play an important role in the pursuit of highly renewable power systems as a low-carbon energy carrier [25]. However, while the share of biomass in the power mix increases, so does the risk of harming species and their habitats [2]. Therefore, biomass utilization can be utilized as a proxy for assessing the potential impacts of a power system pathway from a biodiversity viewpoint.
It should be noted that, along with the aforementioned considerations regarding the transformation of power systems, several other perspectives that refer to the global scale may be important for decision-makers. For example, clean technology production presents a critical material intensity and can adversely affect human health and biodiversity [26,27]. These aspects increase the risk of power system decarbonization pathways, which are connected to supply disruption events and unwanted consequences. However, these aspects mostly concern decision-makers in countries actively involved in the clean technologies value chain [28].
Accounting for the interlinked dynamics of renewable power generation with resource systems is of utmost importance when assessing power system decarbonization pathways, especially under rapid transitions. A significant body of literature has delved into this field [22,29,30,31], providing critical information to power system decision-makers regarding the implications of power system transformation pathways on resource systems. These studies highlight the limitations of cost optimization models for assessing clean energy transitions alone [32]. Incorporating these interconnections into cost optimization models constitutes an important step forward in rendering them more relevant for the kind of problems that decision-makers are facing today, a procedure commonly referred to as “integrated assessment modelling” [33].
1.2. Research Gap and Paper’s Contribution
An extensive body of literature has examined power system transformation with respect to the aforementioned perspectives. However, there remains a research gap in assessing the rapid expansion of renewable power generation against these aspects jointly for a Mediterranean country that (1) possesses a high potential for variable renewable power generation and (2) faces structural socioeconomic challenges (e.g., social inequalities). This type of analysis can provide additional insights compared to the previous body of literature based on the following logic. These countries have the potential to rapidly and extensively expand their renewable power generation. However, mitigation efforts in the power sector may lead to unwanted consequences for biodiversity, land use, and the broader economy, further exacerbating the existing socioeconomic challenges. Additionally, as these countries are already vulnerable to climate change, such as the loss of precious ecosystems from extensive wildfires, an increase in land-use competition may impede their future efforts to deal with climate change repercussions, thereby magnifying their severity [34].
This paper contributes to the literature by examining the potential implications of a rapid decarbonization of the Greek power sector from a multidimensional viewpoint. Greece serves as a typical example of a country with the aforementioned characteristics, considering its climatic conditions, geographical position, and economy [35]. The study focuses on local-level considerations of power system transformation, overlooking aspects related to the global scale. In particular, the evaluation is performed over the following axes: cost-optimal technology mix, power generation costs, land use requirements, biodiversity impacts, and socioeconomic implications. Biomass utilization is used as a proxy for evaluating biodiversity impacts, while Gross Domestic Product (GDP) and employment are used as indicators for assessing socioeconomic repercussions.
The study investigates two scenarios for the transformation of the Greek power sector. The first scenario involves the official power generation targets set by the Greek government, serving as the baseline scenario for this analysis. The second scenario explores a transition towards achieving renewable power generation by 2035, accompanied by an accelerated electrification of the Greek economy. To evaluate these scenarios against the chosen criteria, the study adopts an integrated modelling framework that combines a cost optimization model representing Greece’s power sector with a global macroeconomic CGE model that focuses on the Greek economy.
The remainder of the paper is organized into four sections. Section 2 outlines the methods and materials utilized in the study, with a focus on the adopted modelling and scenario frameworks. Section 3 presents and discusses the key results derived from implementing this framework in Greece, while Section 4 concludes the paper and suggests potential ways forward for this study.
2. Materials and Methods
2.1. Modelling Framework
The study employs an integrated modelling framework linking two models: (1) a technology-rich cost optimization model representing the power sector of Greece (hereafter referred to as OSeMOSYS-Greece) [36] and (2) a global CGE macroeconomic model focusing on the Greek economy (hereafter referred to as GTAP-Greece) [20]. OSeMOSYS-Greece addresses various aspects related to power generation, including the cost-optimal technology mix, power generation capital investment and operational costs, as well as land use requirements. On the other hand, GTAP-Greece examines the broader socioeconomic consequences arising from power system development, including its impact on GDP and employment. To achieve this, it leverages the results of the cost optimization model regarding amendments to power system costs resulting from decarbonization efforts, which are then translated into economic shocks to the broader economy and applied to the broader economy.
2.1.1. Power and Land Systems Illustration
To simulate the examined scenarios, the analysis utilizes a cost optimization model that illustrates the Greek power sector [36]. This model has been built upon the Open-Source energy MOdeling SYStem (OSeMOSYS) framework [37] and has been appropriately parametrized to reflect the functioning of the Greek power sector from 2019 to 2050. The model performs deterministic linear programming cost optimization with perfect foresight on an annual basis. This means that, each year, the model computes the cost-optimal way in terms of power technology capacity and production to meet the exogenously defined final electricity demand, subject to the established restrictions in it (e.g., emissions cap). To do so, it assumes a single social planner who possesses complete knowledge about how technology costs and policy targets will evolve in the future, including the consequences of earlier decisions on the subsequent years within the modelling horizon.
Apart from the cost-optimal power mix, other primary outputs of the model include the annual capital and operational costs (both fixed and variable) of the system, annual newly added technology capacity, and annual CO2 emissions from power generation. Additionally, for the purposes of this study, the model code is expanded to calculate the annual land area impact of power generation on a yearly and technology-specific basis. The time resolution of the model involves 24 time slices, assuming 2 daily time brackets (day and night) for each of the 12 seasons (1 for each month).
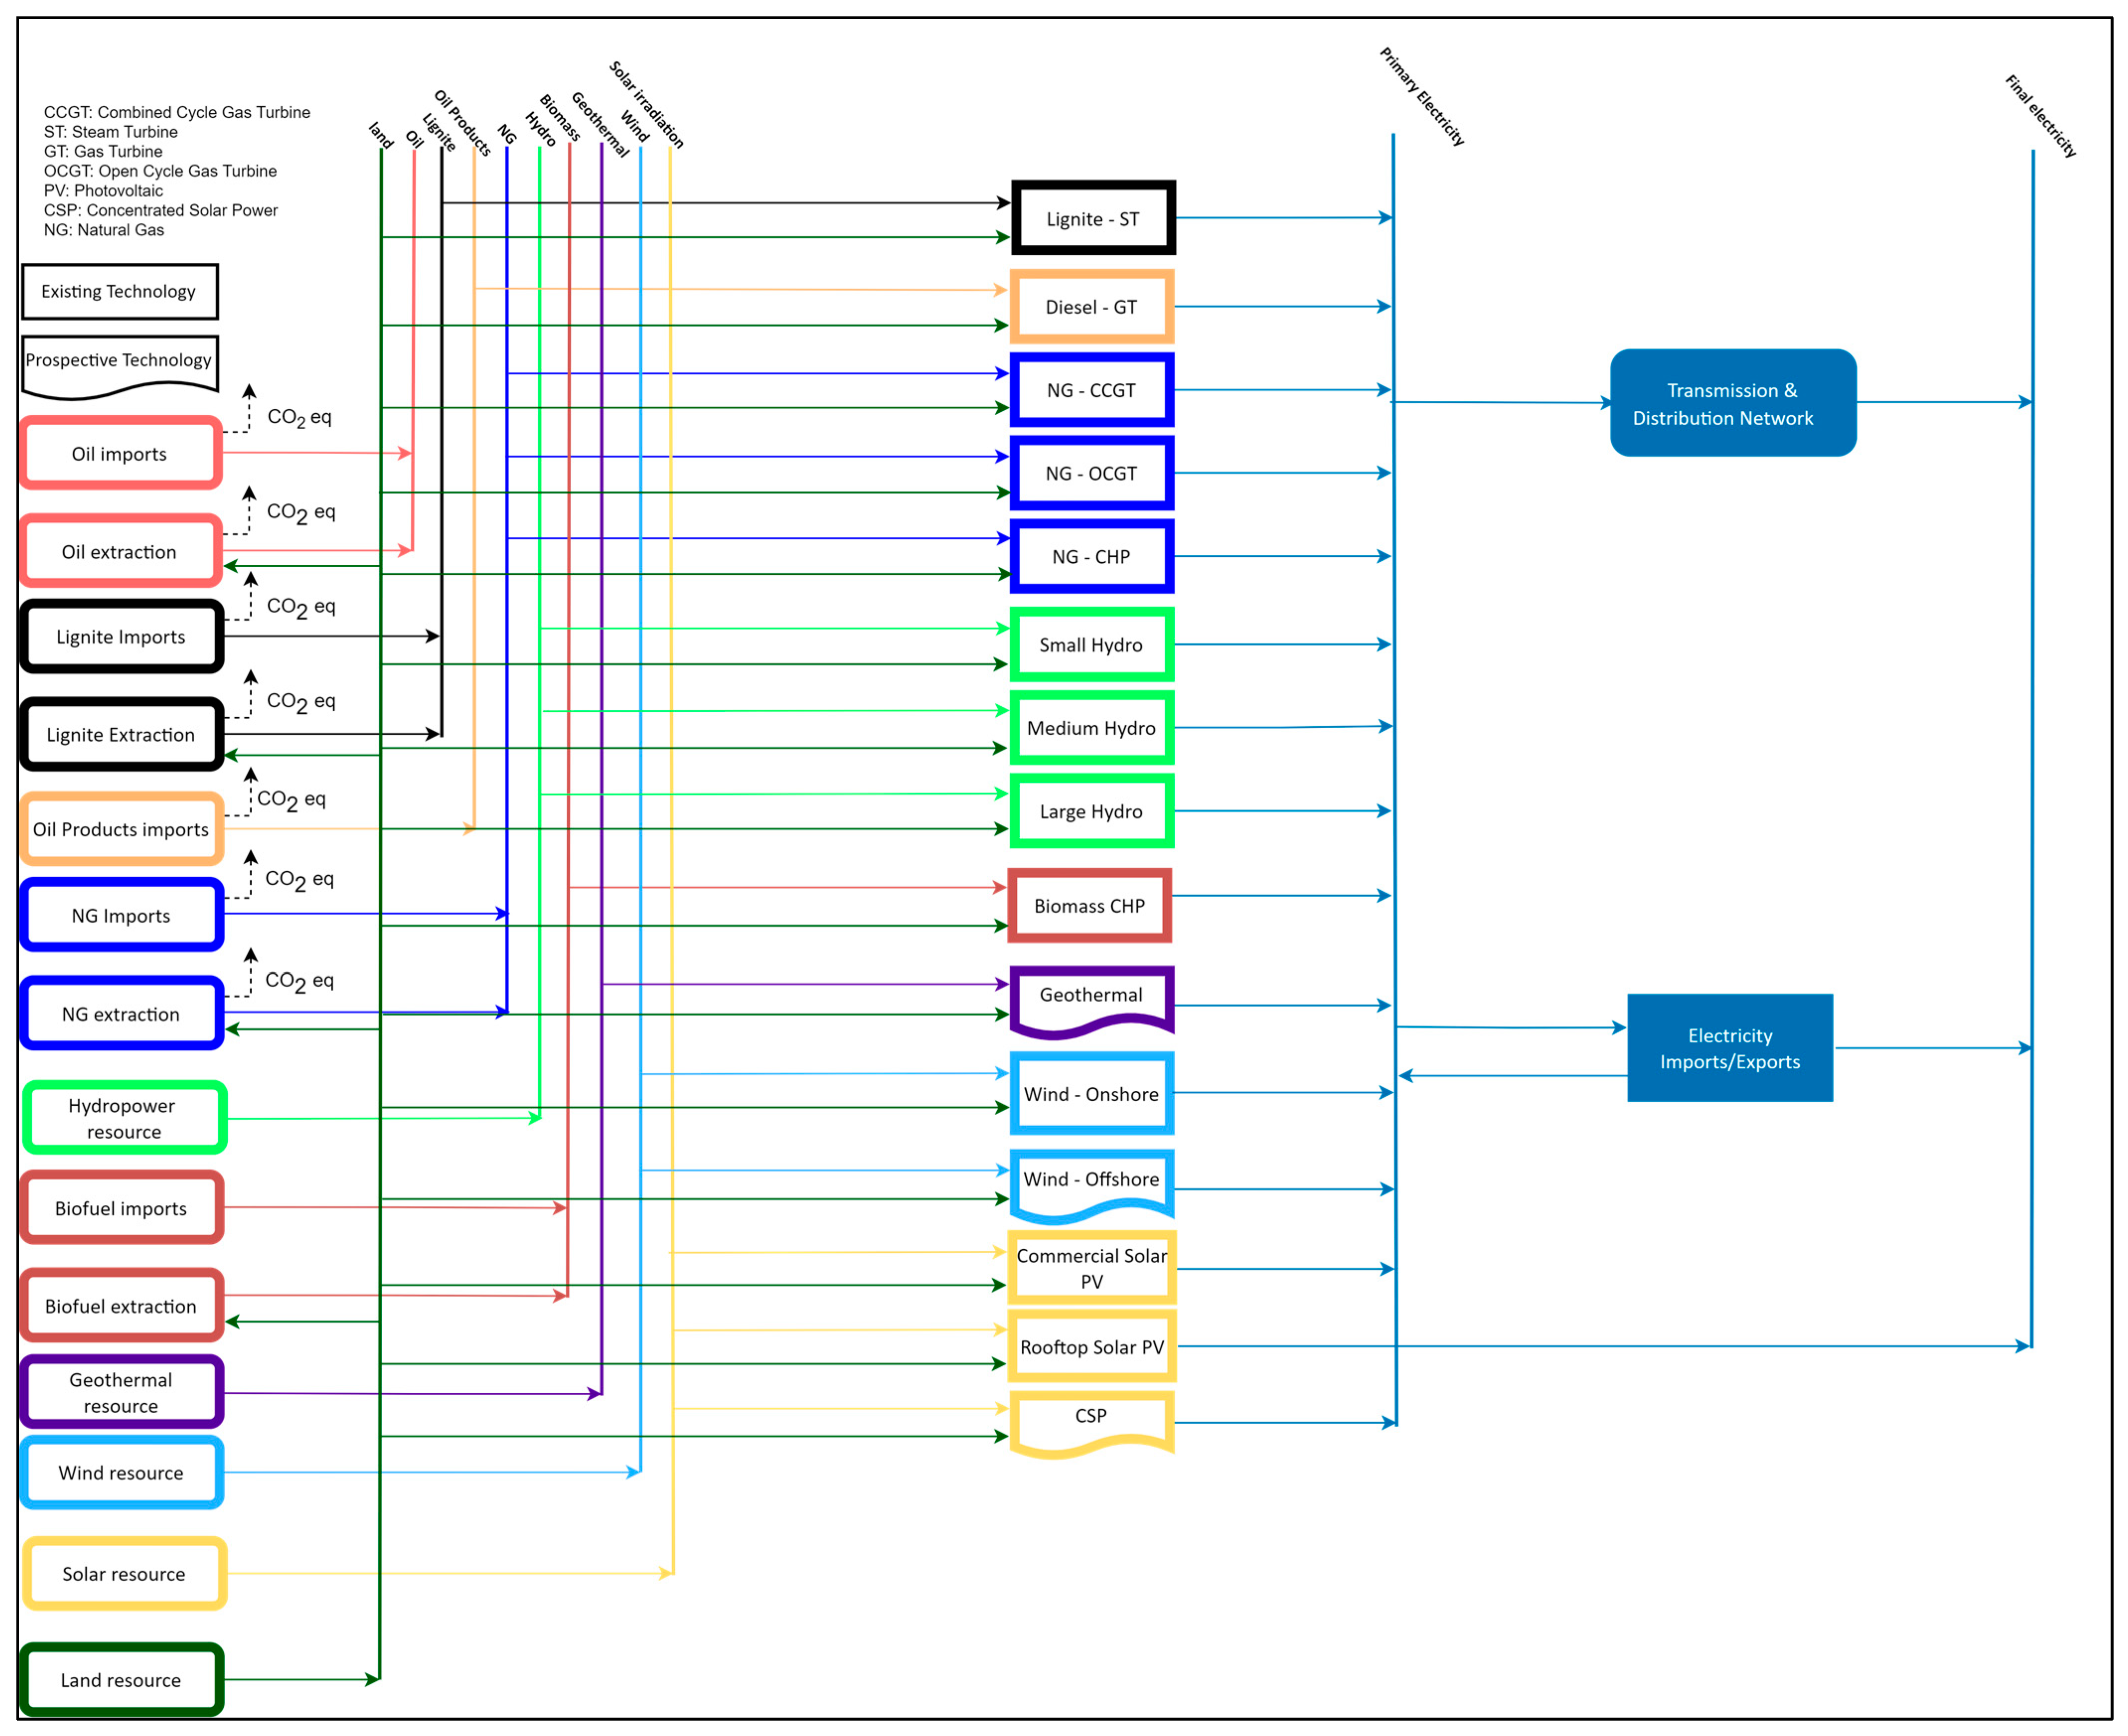
Figure 1 presents the Reference Energy System (REF) of the Greek power sector, as sketched in the model. This figure illustrates the whole spectrum and sequence of procedures followed in a serial manner, from collecting the primary sources (energy and land; left side of the figure) to converting them into electricity (middle part of the figure) and finally transmitting and distributing electricity to the final demand sectors (right side of the figure). The squares in the figure represent the currently deployed system technologies, whereas the arrows denote their input and output fuels. Additionally, distorted squares represent prospective technologies that can be introduced into the system in the future. These technologies are selected based on the Greek government’s established targets and stated intentions, as outlined in official documents such as the National Energy and Climate Plan (NECP) of Greece [38]. Consequently, the model encompasses both the current and target structures of the Greek power sector.
The technologies already diffused in the system can be categorized into fossil fuel and clean energy technologies. The fossil fuel category encompasses (1) lignite power plant steam turbines (ST), (2) diesel gas turbines, (3) natural gas combined-cycle gas turbines (CCGT), (4) natural gas open-cycle gas turbines (OCGT), and (5) natural gas combined heat and power (CHP) plants. On the other hand, the system’s renewable technologies comprise (1) biomass CHP, (2) small hydropower plants (<10 MW), (3) medium hydropower plants (10–100 MW), (4) large hydropower plants (>100 MW), (5) commercial solar photovoltaics (PV), (6) rooftop solar PV, and (7) onshore wind turbines. Additionally, the renewable technologies anticipated to be integrated into the power generation mix in future years involve (1) geothermal power plants (both high enthalpy and medium enthalpy), (2) concentrated solar power (CSP), and (3) offshore wind turbines. Furthermore, the electricity interconnections of the Greek power sector with other countries, namely, Albania, Bulgaria, North Macedonia, Turkey, and Italy, are depicted in the model.
To ensure the relevance of the modelling framework to Greece, the techno-economic parameters used in the model throughout the modelling horizon are extracted from literature sources that explicitly pertain to the Greek power sector, such as the Greek NECP and Long Term Strategy 2050 (LTS). For instance, the maximum capacity for each power technology in the model is determined based on these studies. This constraint reflects the geographical particularities of Greece and/or the technological limitations of certain technologies (e.g., geothermal, and hydropower plants). Furthermore, the maximum annual growth rate of power technologies is set proportionally within the modelling horizon, according to the maximum capacity level and the residual capacity at the beginning of the modelling horizon. Additionally, the financial costs (e.g., interests) that can occur during the construction of power plants are integrated into the capital costs of the technologies involved in the model.
However, in instances of data unavailability, the necessary information is derived from literature sources and datasets with broader regional scopes (e.g., [39,40,41]), as, for example, occurs for the demand profile of the Greek power sector, defined based on data from the ENTSO-E database [42]. Furthermore, when data for specific parameters, such as capital costs, are provided only for specific years, the intermediary year values are estimated based on a linear extrapolation. Electricity inflows and outflows with other countries are set exogenously in the model based on official projections [39]. The rationale behind this action is that the level of electricity trade can significantly affect the results of a cost optimization model concerning domestic power generation. However, their cost-optimal level depends highly on electricity prices, for which there is high uncertainty about their future evolution.
Regarding the estimation of the land requirements for power generation, this study adopts the “footprint and spacing” approach. This approach is selected over alternatives since it accounts for the substantial distances required between and around renewable technologies to ensure optimal performance. Consequently, it allows for a thorough evaluation of the trade-offs between the expansion of renewable power generation and the associated land area requirements. According to this approach, the annual land area requirements for power generation are calculated based on the following formula:
where represents the land area impact factor of the capacity of generator G per unit of installed capacity; refers to the installed capacity of generator G in year y; denotes the energy land area impact factor of input fuel R per unit of produced electricity; and signifies the electricity produced by generator G in year y using fuel resource R.
Table 1 presents the LAI factors of capacity and energy assigned to each power technology, which are derived from a literature review [14,16,43,44]. Offshore wind turbines and rooftop solar PVs are considered to have zero land requirements, as their associated infrastructure pertains to sea areas and roofs, respectively, rather than terrestrial land. In addition, to calculate the land use required for biomass cultivation, it is assumed that 88% of the biomass used in power generation is domestically produced throughout the modelling horizon, with the remaining 12% being imported from abroad. This assumption is based on the average statistics obtained from the latest available energy balances of Greece [45]. All simulations conducted with the model utilize the GLPK linear-programming solver [46].
2.1.2. Evaluating the Socioeconomic Consequences of Power System Development
To assess the socioeconomic implications of power system development, the study adopts a “top-down” approach, considering the economy as a whole. This is achieved by utilizing a global CGE macroeconomic model [20] that captures the interactions among economic agents and sectors, thereby simulating the functioning of the economy. The model is built based on the standard version of the global macroeconomic model GTAP [47] and is calibrated to the GTAP database version 11 [48]. It represents the Greek economy distinctly from the rest of the global economy, thereby allowing for evaluating the socioeconomic ramifications stemming from the implementation of policy measures and transformations within the Greek economy.
The model features four key economic agents: (1) households, (2) firms, (3) government, and (4) the rest of the world (RoW). Households are the owners of the production factors (i.e., labour, capital, land), which they lease to firms to generate income, aiming to maximize their utility. Firms, in turn, utilize production factors by compensating households accordingly, along with intermediate materials, to produce products and services, which they, in turn, sell with the aim of maximizing their profits. On the other hand, the government enforces taxes and grants subsidies to households and firms, while also spending money on the economy. Finally, RoW represents international monetary flows and trade interactions, including imports, exports, and direct foreign investments.
The model operates on a comparative static basis, thereby not explicitly considering the aspect of time. Instead, it examines two states of the economy: (i) the initial equilibrium state and (ii) the post-economic shock equilibrium state. The model commences from an initial equilibrium state (i), which typically represents a snapshot of the economy in question for the base year. Exogenous shocks are then applied to the model to simulate the economy-wide consequences of the policy measures in question, prompting it to calculate a new equilibrium state (ii). The new equilibrium state is then contrasted with the initial state of the economy, thereby estimating the net effects of the applied shocks.
In this study, the model runs multiple times for varying time horizons to evaluate the economy-wide implications of the examined scenario at different time points, rather than just at the end of the time horizon of the analysis. In each simulation, the base year remains constant, while the projected final year varies at a 5-year interval before reaching the total length of the analysis modelling horizon. To account for the flexibility of economic agents in terms of modifying their behaviour over longer time horizons, the elasticity parameters of the model are adjusted in each simulation according to the projected time horizon.
Initially, this procedure is performed for the baseline scenario of both the Greek and global economies, which describes how they are going to evolve based on the main macroeconomic and demographic projections over the examined period, including GDP, population, workforce, and capital supply. In this effort, data from the second shared socioeconomic pathway (SSP2) and World Bank [49,50,51] are harnessed, assuming a fixed supply of land and natural resources during the period of interest [52]. SSP2 is selected over alternatives as it depicts a moderate socioeconomic development that does not significantly deviate from historical trends. The capital supply is calculated based on the formula proposed in [53], and a depreciation rate of 4% was considered based on data from the GTAP database. In the post-2020 period, gross fixed capital investments are projected via a linear regression model that correlates them with GDP and population [54].
Subsequently, the economy-wide implications of the examined scenario are simulated by applying the shocks arising from its implementation, together with the baseline growth rates. In this endeavour, the results of the cost optimization model regarding the implementation costs of the examined scenario are exploited, including annualized capital investments and fixed and variable operational costs. The shocks are determined by calculating the percentage of deviation in system costs compared to the baseline. The changes in power generation costs are considered to be passed on to the final electricity price, thereby applying the shocks into the model upon the variable denoting “household expenditure”.
The main indicators considered for the macroeconomic evaluation are GDP and employment. To estimate the impacts of employment on the Greek economy, the unemployment closure is set in the model. This closure allows for a mismatch between labour supply and demand, thereby enabling the estimation of the effects of employment [55]. To set this closure, the variable representing “employment supply” is exchanged with the one indicating “employment wages”, with the former becoming endogenous instead of the latter.
2.1.3. Scenario Framework
The study examines two scenarios for the decarbonization of the Greek power sector. The first scenario aligns with the official targets established by the Greek government in its NECP, which can be summarized in the following points [38]:
- Achieving a renewable technology share in the power mix of over 65% by 2030;
- Phasing out all lignite power plants by 2023, apart from “Ptolemaida V”, which will continue to operate until 2028;
- Integrating non-interconnected islands into the main grid by 2030.
This scenario (henceforth referred to as the NECP scenario) serves as the business-as-usual scenario for our analysis. On top of this scenario, the study considers an ambitious scenario (henceforth referred to as the ambitious scenario), in which the power sector will completely decarbonize by 2035. Moreover, to ensure a smooth transition in the ambitious scenario, the following two restrictions are imposed in the cost optimization model:
- No new investments in natural gas technologies are allowed from 2022 onwards;
- The existing infrastructure of natural gas power plants depreciates by 10% annually, starting from 2022, until its complete phase-out in 2035.
Regarding the final electricity demand, both scenarios envision a profound electrification of the Greek economy, mainly driven by the transportation sector. In particular, the ambitious scenario assumes the same electrification rate as the Greek NECP until 2030, and a slightly higher rate afterward, as shown in Figure 2. Additionally, the ambitious scenario involves a slightly higher electricity demand than that of the NECP in the post-2030 period.
3. Results and Discussion
3.1. Simulation Results
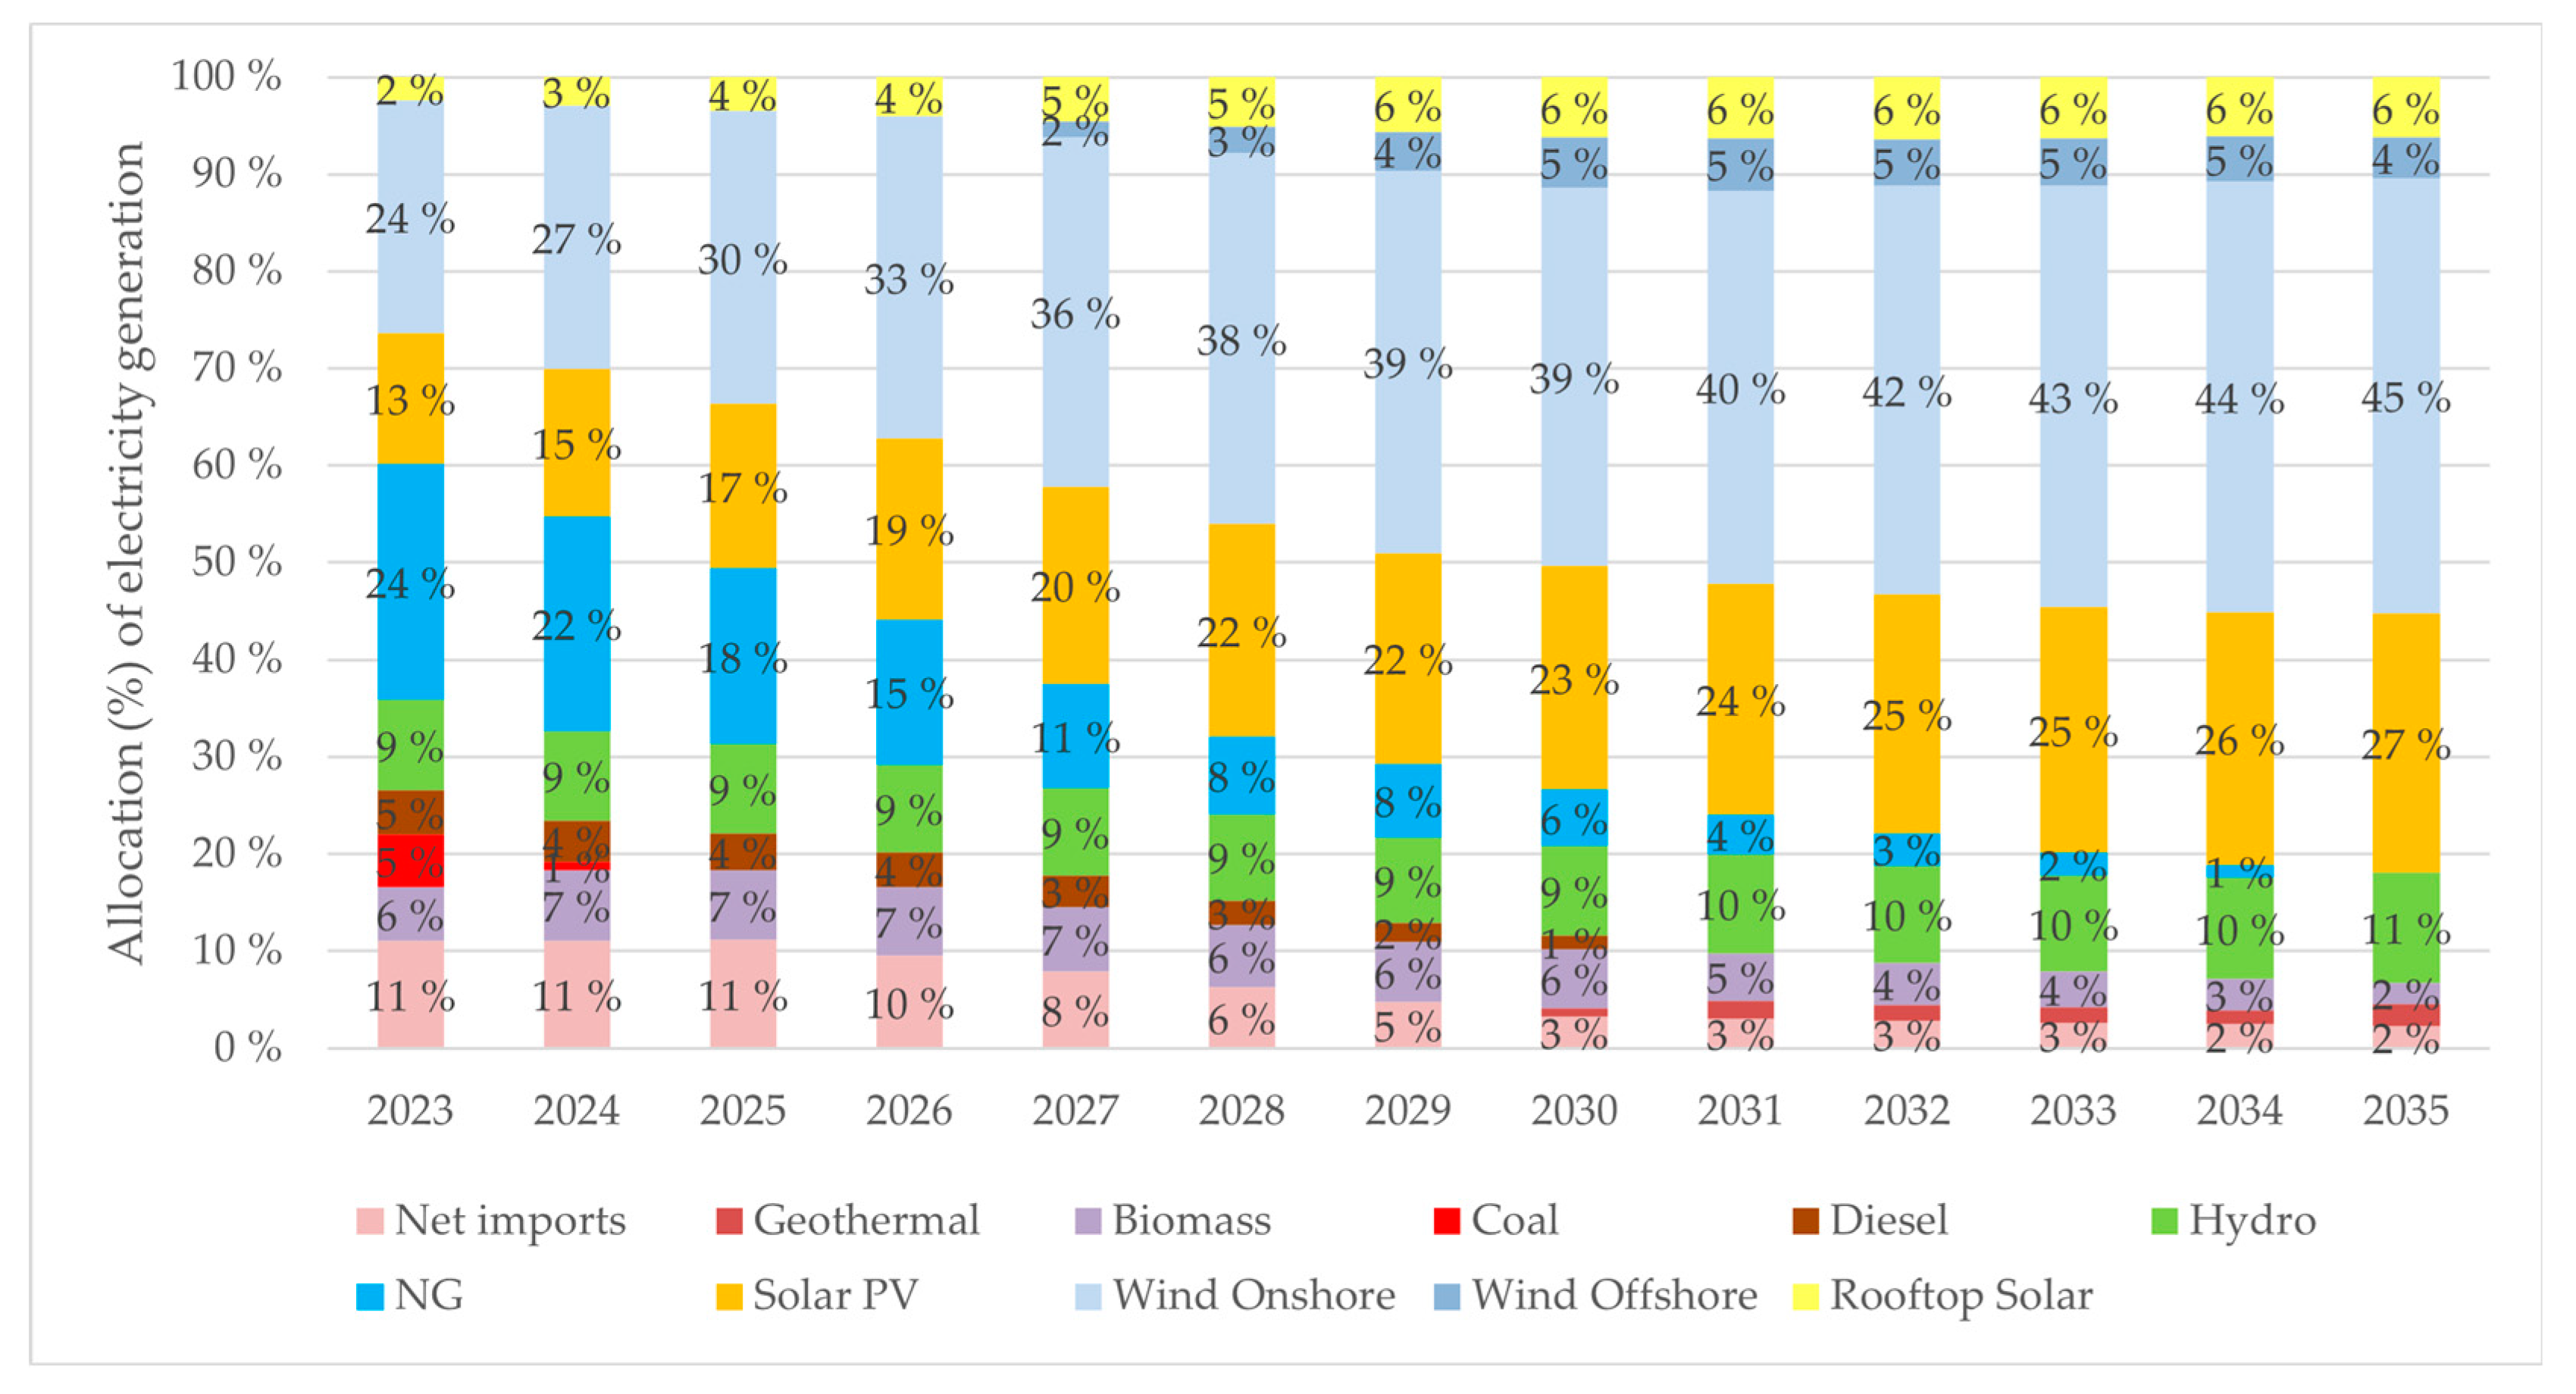
This section presents the key findings derived from the applied modelling framework for the decarbonization pathway involving 100% renewable Greek power generation by 2035. The results for the baseline scenario are also provided for benchmarking purposes. The analysis focuses on the key aspects of power generation, including the cost-optimal power mix, capital investments, power generation costs, CO2 emissions, land use, and main socioeconomic factors, such as GDP and employment. First, Figure 3 displays the annual electricity production per type of power technology throughout the 2023–2035 period for the ambitious scenario. In the same context, Figure 4 illustrates the allocation of annual electricity production across the system’s power technologies for the same scenario.
As shown, in this scenario, natural gas is gradually phased out of the system and is predominantly replaced by wind and solar technologies. Particularly, wind and solar technologies can dominate the power mix by 2035, with their shares reaching 49% and 33%, respectively. Consequently, they can constitute the driving forces behind the transformation of the Greek power sector. It is noteworthy that, unlike conventional solar panels, solar photovoltaic thermal (PVT) panels can harness heat during energy conversion, thereby cogenerating electricity and heat [56]. In this respect, incorporating PVT panels as a candidate technology in the system could enhance the preference for solar power generation over competing renewable technologies (e.g., onshore wind turbines), potentially leading to a different cost-optimal power mix. However, the optimization model used in this study cannot account for the higher exergy of PVT panels when solving for the cost-optimal power technology combination as it focuses on the power sector, thereby resulting in a no-PVT power mix. Notably, even if the model were to factor in the increased exergy of PVT panels, it would remain uncertain whether, and to what extent, they would be included in the cost-optimal power mix due to their increased costs, thereby necessitating a system-wide analysis to examine this possibility.
Moreover, the role of offshore wind and rooftop solar PV technologies in this transition is critical from an ecological standpoint. Notably, their increased participation in the power mix can diminish the system’s reliance on biomass power generation. This aspect bears significant implications for biodiversity, as the increasing percentage of biomass in the power mix raises the risk of harming species and their habitats [57]. On the other hand, hydro penetration in the power mix remains relatively unaffected by decarbonization efforts. This is primarily ascribed to the fact that large and medium hydropower plants had already almost reached saturation at the beginning of the modelling horizon. The small expansion of hydropower capacity over the examined period mainly pertains to small hydropower plants.
Similarly, Figure 5 displays the annual installed capacity of each type of power technology in the system from 2023 to 2035 for the ambitious scenario. From this figure, it becomes evident once again that the decarbonization of the Greek power sector, coupled with the electrification of the economy, is closely tied to the capacity expansion of onshore wind and commercial PV technologies. By 2030, the total installed capacity of the power sector can exceed 30 GW, ultimately reaching almost 35 GW by 2035. The slight decrease in the total installed capacity observed in 2024 can be attributed to the phasing-out of most lignite power plants, except for “Ptolemaida V”. The latter power plant joined the system in 2023, with a capacity of 0.7 GW, and is planned to cease operations in 2028. Hence, it can be inferred that the transition to a highly renewable power system is associated with a larger power sector.
This trajectory of the power sector can increase land competition, primarily due to the substantial land areas required for the placement of wind and solar technologies’ infrastructures. Figure 6 provides an approximation of the annual land use each system power generator would require during the 2023–2035 period for the ambitious scenario, as well as the potential total annual land requirements for the NECP scenario.
It also gives an estimate of the annual land use which would be needed for biomass cultivation. As shown, onshore wind infrastructure is expected to be the main contributor to the increased land use competition, accounting for around 77% of the total land use for power generation operations in 2035. While the difference in land use for power generation between the NECP and ambitious scenarios could reach a peak as high as 84% in 2024, it is expected to decrease over time, reaching as low as 9% by 2035. This trend is attributed to the gradual decline of biomass power generation and the associated land needs for biomass cultivation under the rapid decarbonization scenario. In contrast, the NECP scenario exhibits the opposite trend, resulting in higher biomass power generation than the ambitious scenario by 2033. This course is illustrated in Figure 7, which shows the annual biomass power generation in the NECP and ambitious scenarios. In the ambitious scenario, more non-conventional renewable technologies are inserted into the system over time, thereby reducing the reliance of the system on biomass power generation. However, there is a lag in the process of building the required renewable energy capacity to facilitate the reduction in biomass power generation.
In summary, the total land area used for power generation in 2035 under the ambitious scenario corresponds to approximately 6% of Greece’s total land area, which amounts to around 132,000 square kilometres (km2). Therefore, it can be inferred that through effective land planning, the siting of power generation infrastructure can be set to avoid adversely affecting biodiversity hotspots and socially significant landscapes. However, a finer analysis with higher spatial resolution is required in order to assess Greece’s capacity to accommodate this infrastructure, thereby identifying potential negative ramifications and bottlenecks in this regard. Furthermore, while a rapid decarbonization pathway can increase the risk of harming biodiversity in the short-term, it can mitigate it in the long run by offering a more diverse renewable power mix, thereby reducing the reliance of the system on biomass power generation.
Moreover, the rapid decarbonization pathway of the power sector can result in significant CO2 emission reductions. Figure 8 demonstrates the estimated CO2 emissions of the power sector for both the ambitious and NECP scenarios over the 2023–2035 period. Under the ambitious scenario, the target of attaining 100% renewable power generation by 2035 leads to zero CO2 emissions for power generation by then. It is worth mentioning that in this case, the reduction in CO2 emissions is front-loaded and will be significantly curbed by 2030 (>75% reduction compared to NECP in 2030). This trend signifies the environmental rationale of expeditiously investing in clean technologies. However, in the real world, numerous barriers may impede this endeavour, such as electricity network saturation and delays in legal permitting processes for renewable energy projects, rendering this ambitious endeavour challenging, if not unattainable [58,59].
Meeting the objective of decarbonizing the Greek power sector by 2035 while simultaneously electrifying the economy necessitates substantial capital investments. Additionally, disinvestments in fossil fuel technologies must occur, which also entail a cost owing to the curtailment of their operational lifetimes. Figure 9 presents the potential capital investments for the examined scenarios over the 2023–2035 period. In the ambitious scenario, capital investment requirements are presented on a technological basis, whereas for the NECP scenario, which serves as a benchmark, only the annual total capital investment requirements are provided.
As revealed, the Greek government’s lock-in on fossil fuels could have a substantial impact on capital investment requirements. Notably, apart from 2035, when the power sector is set to decarbonize, the highest capital needs are observed for 2023, the year in which the fossil fuel power plant “Ptolemaida V” commences operations. Addressing this strategically-myopic lock-in is crucial for the Greek government to transition the operations of this power plant to clean energy, thereby minimizing costs [60]. Over the 2023–2035 period, the net present value (NPV) of the required capital investments in power technologies amounts to almost EUR 21 billion, which is EUR 7.3 billion higher than the NECP scenario.
While transitioning to 100% renewable power generation requires substantial investments in clean energy technologies, the implications differ for the system’s operational costs. In particular, the variable cost of the system significantly decreases under the ambitious scenario. This can be attributed to the lower utilization of fossil fuels, mainly fossil gas, which subsequently leads to reduced Emissions Trading Scheme (ETS) costs. Consequently, the rapid decarbonization of the power sector can have a positive impact on power generation costs. This can be observed in Figure 10, which depicts the annual levelized cost of electricity (LCOE) per megawatt-hour (MWh) of the final electricity demand for both the ambitious and NECP scenarios. For the ambitious scenario, the LCOE is depicted per cost component, including capital investments, fixed and variable operational costs, and ETS costs, while for the NECP scenario, the total annual LCOE is provided.
Over the 2023–2035 period, power generation costs in the rapid decarbonization scenario are, on average, EUR 4/MWh lower than those in the NECP scenario. Annually, this translates to a mitigation of power generation costs by EUR 0.3/MWh throughout the 2023–2035 period. However, this trend is reserved in the post-2032 period. The higher capital investment requirements of clean energy technologies under the ambitious scenario lead to increased annualized investment costs, which begin to accumulate after 2032, thereby driving up electricity generation costs. Therefore, while the rapid decarbonization pathway can significantly alleviate power generation costs in the short- and medium-terms, primarily by decreasing the high operational costs resulting from fossil gas usage, there is a long-term risk of increased power generation costs owing to the capital investments made in previous years.
The trajectory of power generation costs in each of the examined scenarios provides key insights into the subsequent socioeconomic implications. Figure 11 charts the potential evolution of the impact of the implementation of the ambitious scenario over the 2023–2035 period on the GDP of the Greek economy as a percentage deviation in relation to the NECP scenario. As shown, the rapid decarbonization of the power sector is, by and large, expected to have a positive impact on the GDP of the Greek economy. This impact follows a similar trajectory to that of the power generation costs (Figure 10). Particularly, until 2030, the impact on GDP is predicted to be increasingly positive as power generation costs steadily decline. Notably, in 2030, the GDP of the Greek economy could be 1.7% higher under the ambitious scenario compared to the NECP scenario. This can be attributed to the alleviation of power generation costs, which is associated with the expansion of the disposable income of households and the final demand, subsequently growing and broadening the economy.
The positive impact on GDP becomes less profound in the post-2030 period when power generation costs begin to increase. However, even in 2035, the GDP of the Greek economy is expected to be 0.59% higher under the ambitious scenario compared with the trajectory involving fewer mitigation efforts. On average, the rapid decarbonization of the power sector can result in an annual enlargement of the GDP of the Greek economy by approximately 0.05% over the 2023–2035 period. Regarding the impact on employment in the Greek economy, it unfolds rather similarly to the impact on GDP. Figure 12 presents the effect of speedier decarbonization of the power sector on the employment in the Greek economy, as a deviation of one thousand employees compared to the NECP scenario.
As shown, the rapid decarbonization of the Greek power sector is expected to have a positive effect on employment in the Greek economy. This can be primarily attributed to the fiscal space which power generation cost reductions can create for households. Consequently, the circulation of this money within the economy can generate an expansionary effect, resulting in the creation of more working positions. As with GDP, the highest positive employment impact is projected to occur in 2030, when the ambitious scenario will be able to generate additional 59.8 thousand working positions compared with the NECP scenario. After this point, the positive impact will gradually become less intense due to the slight increase in electricity generation costs. However, the impact is predicted to remain positive even in 2035, resulting in 23,110 additional employees. On average, the rapid decarbonization of the power sector can generate 1,777 additional working positions annually across the examined period.
3.2. Discussion
In view of the previous studies, the results of the analysis diverge primarily by highlighting that rapidly decarbonizing the power sector can reduce both carbon emissions from power generation and the risk of harming ecosystems and biodiversity. This finding contradicts an existing body of literature [57] and stems from the increased integration of non-conventional renewable technologies into the power mix, which mitigates the need for biomass power generation. Simultaneously, land requirements for power generation do increase, yet they remain at manageable levels through effective land programming, factoring in aesthetic and biodiversity considerations. Therefore, the analysis underscores that the risks arising from the decarbonization of the power sector and the expansion of renewable power generation hinge on the particular combination of the technologies constituting the power mix [9].
The analysis further indicates a potential reduction in the short- and medium-term power generation costs resulting from the rapid decarbonization of the power sector. This development is primarily ascribed to the decreased fossil fuel utilization in power generation, which presents highly variable operational costs, as has also been reported in the literature (e.g., [31,61]). Nonetheless, a prevailing body of literature (e.g., [8,62]) suggests the opposite trajectory, mainly because of the substantial capital investments needed for acquiring renewable technologies. It should be noted that the analysis aligns with the latter body of literature, yet in longer time horizons (>10 years) due to the accumulation of annualized capital investments from previous years. The effects on the general economy mirror the trajectory of power generation costs, i.e., being positive when power generation costs decrease and vice versa, in alignment with the prevailing literature [62]. Furthermore, the analysis results accentuate an increase in land use competition due to the accelerated decarbonization of the power sector. This outcome is in line with the established literature addressing the land implications of wind- and solar-based decarbonization pathways for the power sector [14]. However, the analysis goes further and pinpoints diminishing land use competition over time due to the decreased reliance of the system on biomass power generation.
It is important to note that this study does not examine the technical feasibility of achieving 100% renewable power generation by 2035 in depth [31]. Technical feasibility considerations encompass factors like electricity network bottlenecks and delays in legal permitting processes. Another key limitation of the study comprises the fact that it focuses on the power and land sectors as well as the overall economy, thereby overlooking the interconnections between the power system and the rest of the sectors that constitute the energy system (e.g., industry, heating, and transport). These sectors, apart from being important on their own given their energy intensity and decarbonization challenges, can also significantly influence the power sector’s evolution. The energy system’s sectors are intricately intertwined, as the trajectory of each sector can affect, and be affected by, the development of the other sectors. For instance, the electrification rate in the transport sector can influence the required electricity production. Another typical linkage between the power sector and the remaining sectors of the energy system revolves around the utilization of waste heat from thermal power plants. In particular, the extent to which waste heat is harnessed can affect the demand for primary heat production, potentially assisting in the decarbonization of the heating sector.
4. Conclusions
The ever-growing intensity of climate change repercussions and the ongoing energy price crisis have underscored the urgency of accelerating the expansion of renewable power generation, alongside energy efficiency improvement [63]. However, this endeavour is closely intertwined with an increase in land-use competition and capital investment requirements, which may lead to supply disruptions and negative socioeconomic consequences. This paper examines these considerations for Greece, a Mediterranean country with significant potential for variable renewable power generation and structural economic problems. Specifically, it assesses the implications of decarbonizing the power sector by 2035 on the power generation mix and costs, land use, biodiversity, GDP, and employment.
The findings of this study indicate that wind and solar technologies can form the backbone of the rapid decarbonization process of the power sector. By 2035, their combined capacity could reach 82% of the total capacity, with wind and solar technologies comprising around 49% and 33% of the power mix, respectively. Achieving this ambitious endeavour would require additional capital investments of approximately EUR 7.3 billion over the 2023–2035 period compared to the NECP scenario. The NPV of the total capital needs of the power sector would amount to EUR 21.3 billion, with wind and solar technologies accounting for around 47% and 18% of this amount, respectively. Despite the higher capital investment requirements, this scenario can lead to reduced power generation operational costs. This reduction is primarily ascribed to the decreased fossil fuel utilization, particularly fossil gas, leading to lower variable operational costs. The decrease in variable power generation operational costs effectively counterbalances the increased capital investment and fixed operational costs associated with this scenario, potentially mitigating power generation costs by approximately EUR 0.3/MWh annually during the 2023–2035 period.
The decrease in power generation costs can increase the disposable income of households and the final demand, in turn boosting economic activity as measured by GDP. Particularly, the rapid decarbonization scenario can result in an average annual GDP growth rate of 0.05% for the Greek economy over the 2023–2035 period. Notably, in 2035, the GDP could experience a 1.7% increase compared to the scenario involving the current decarbonization efforts. Additionally, the benefits of this transition may extend to employment, potentially generating an average of 1,900 additional working positions annually from 2023 to 2035 in the Greek economy. However, it is essential to note that the positive impact on both costs and economy-wide implications mainly refers to the short- and medium-terms. In the long-term (i.e., the post-2032 period), there is a risk that the rapid decarbonization pathway may induce negative socioeconomic consequences due to the capital investment requirements of previous years. Therefore, decision-makers should adopt a long-term view to identify measures that can mitigate this risk, such as implementing supportive policies or pursuing economies of scale to lower power generation costs [64,65].
The results further stress that the rapid decarbonization of the power sector may increase land use competition, on average, in the order of 2,000 km2 annually over the 2023–2035 period. However, given the relatively modest scale of this requirement with respect to Greece’s total land area, it can be concluded that careful land planning can effectively mitigate potential adverse impacts on biodiversity and socially significant scenic areas. Furthermore, while the land requirements may peak at around 2,800 km2 in 2028 for the rapid decarbonization pathway, they can decrease to only 584 km2 by 2035. This reduction can be attributed to the decreasing reliance on biomass power generation and, consequently, the diminishing land needs for biomass cultivation as the non-conventional renewable energy sources, such as offshore wind and geothermal energy, gradually integrate into the system. This development not only reduces the risk of harming biodiversity, for which biomass utilization can serve as a proxy, but also enhances the system’s resilience against factors such as weather variability. The latter can also be achieved by decreasing the share of weather-dependent hydropower technologies in the power mix. Hence, within a span of around a decade, the rapid decarbonization pathway entails a lower risk of supply bottlenecks, disruption events, unwanted consequences for biodiversity, and social opposition.
Potential extensions of this analysis could firstly involve integrating the other sectors of the energy system, thereby examining how the power sector interacts with them. Additionally, the other considerations for decision-makers beyond system costs, such as land use, could be considered when solving for the “optimal’’ power mix, such as by applying multi-objective optimization or by setting specific restrictions for them into the optimization model. Furthermore, additional aspects that may be important for decision-makers at a global level, such as critical material demand, could also be considered as evaluation criteria for the examined power system transformation pathways. In addition, land use requirements could be more comprehensively examined, such as by applying sensitivity analyses to them against the variability of the land factors considered for each technology. This could also be achieved by increasing the spatial resolution of the analysis, for example, by using Geographic Information Systems (GIS).
Funding
This research received no external funding.
Data Availability Statement
The data used in this study to calibrate the cost optimization model for the Greek power sector were extracted from the Greek NECP [38] and LTS [66], the EU Reference scenario 2020 [39], and the ENTSO-E database [42]. The land use coefficients for system’s power technologies were determined based on relevant peer-reviewed research articles. The data used to calibrate the macroeconomic model were extracted from the GTAP Database version 11 ([48]; an appropriate license is required). The baseline scenarios for the Greek and global economies were built based on data from the SSP2 scenario [49].
Conflicts of Interest
The author declares no conflict of interest.
Abbreviations
| LAI | Land Area Impact |
| CGE | Computable General Equilibrium |
| GDP | Gross Domestic Product |
| OSeMOSYS | Open-Source energy MOdeling SYStem |
| REF | Reference Energy System |
| NECP | National Energy and Climate Plan |
| ST | Steam Turbines |
| CCGT | Combined Cycle Gas Turbines |
| OCGT | Open Cycle Gas Turbines |
| CHP | Combined Heat and Power |
| PV | Photovoltaics |
| CSP | Concentrated Solar Power |
| LTS | Long Term Strategy 2050 |
| RoW | Rest of the World |
| SSP2 | Second Shared Socioeconomic Pathway |
| NPV | Net Present Value |
| ETS | Emissions Trading Scheme |
| PVT | Solar Photovoltaic Thermal |
| LCOE | Levelized Cost of Electricity |
| GIS | Geographic Information Systems |
References
- Steffen, W.; Broadgate, W.; Deutsch, L.; Gaffney, O.; Ludwig, C. The Trajectory of the Anthropocene: The Great Acceleration. Anthr. Rev. 2015, 2, 81–98. [Google Scholar] [CrossRef]
- Tong, S.; Bambrick, H.; Beggs, P.J.; Chen, L.; Hu, Y.; Ma, W.; Steffen, W.; Tan, J. Current and future threats to human health in the Anthropocene. Environ. Int. 2022, 158, 106892. [Google Scholar] [CrossRef] [PubMed]
- Popescu, C.R.G.; González, A.L. Current High-Powered Challenges and High-Reaching Reforms: Moving to a New Economic Model Based on Green Energy, Digitalization, and Shock Resistance. In Frameworks for Sustainable Development Goals to Manage Economic, Social, and Environmental Shocks and Disasters; IGI Global: Hershey, PA, USA, 2022; pp. 133–154. [Google Scholar] [CrossRef]
- Zakeri, B.; Gissey, G.C.; Dodds, P.E.; Subkhankulova, D. Centralized vs. Distributed Energy Storage—Benefits for Residential Users. Energy 2021, 236, 121443. [Google Scholar] [CrossRef]
- Gitelman, L.; Kozhevnikov, M. Energy Transition Manifesto: A Contribution towards the Discourse on the Specifics Amid Energy Crisis. Energies 2022, 15, 9199. [Google Scholar] [CrossRef]
- Baruah, D.C.; Enweremadu, C.C. Prospects of Decentralized Renewable Energy to Improve Energy Access: A Resource-Inventory-Based Analysis of South Africa. Renew. Sustain. Energy Rev. 2019, 103, 328–341. [Google Scholar] [CrossRef]
- Hondo, H.; Moriizumi, Y. Employment Creation Potential of Renewable Power Generation Technologies: A Life Cycle Approach. Renew. Sustain. Energy Rev. 2017, 79, 128–136. [Google Scholar] [CrossRef]
- Price, J.; Zeyringer, M.; Konadu, D.; Sobral Mourão, Z.; Moore, A.; Sharp, E. Low Carbon Electricity Systems for Great Britain in 2050: An Energy-Land-Water Perspective. Appl. Energy 2018, 228, 928–941. [Google Scholar] [CrossRef]
- Santangeli, A.; Toivonen, T.; Pouzols, F.M.; Pogson, M.; Hastings, A.; Smith, P.; Moilanen, A. Global Change Synergies and Trade-offs between Renewable Energy and Biodiversity. GCB Bioenergy 2016, 8, 941–951. [Google Scholar] [CrossRef]
- Bennun, L.; van Bochove, J.; Ng, C.; Fletcher, C.; Wilson, D.; Phair, N.; Carbone, G. Mitigating Biodiversity Impacts Associated with Solar and Wind Energy Development; International Union for Conservation of Nature: Gland, Switzerland, 2021. [Google Scholar]
- Pasqualetti, M.J. Opposing Wind Energy Landscapes: A Search for Common Cause. Ann. Assoc. Am. Geogr. 2011, 101, 907–917. [Google Scholar] [CrossRef]
- Jones, N.F.; Pejchar, L. Comparing the Ecological Impacts of Wind and Oil & Gas Development: A Landscape Scale Assessment. PLoS ONE 2013, 8, e81391. [Google Scholar] [CrossRef]
- Mörtberg, U.; Pang, X.-L.; Treinys, R.; Trubins, R.; Mozgeris, G. Sustainability Assessment of Intensified Forestry—Forest Bioenergy versus Forest Biodiversity Targeting Forest Birds. Sustainability 2021, 13, 2789. [Google Scholar] [CrossRef]
- Palmer-Wilson, K.; Donald, J.; Robertson, B.; Lyseng, B.; Keller, V.; Fowler, M.; Wade, C.; Scholtysik, S.; Wild, P.; Rowe, A. Impact of Land Requirements on Electricity System Decarbonisation Pathways. Energy Policy 2019, 129, 193–205. [Google Scholar] [CrossRef]
- Berrill, P.; Arvesen, A.; Scholz, Y.; Gils, H.C.; Hertwich, E.G. Environmental Impacts of High Penetration Renewable Energy Scenarios for Europe. Environ. Res. Lett. 2016, 11, 14012. [Google Scholar] [CrossRef]
- Trainor, A.M.; McDonald, R.I.; Fargione, J. Energy Sprawl Is the Largest Driver of Land Use Change in United States. PLoS ONE 2016, 11, e0162269. [Google Scholar] [CrossRef]
- Wu, G.C.; Torn, M.S.; Williams, J.H. Incorporating Land-Use Requirements and Environmental Constraints in Low-Carbon Electricity Planning for California. Environ. Sci. Technol. 2015, 49, 2013–2021. [Google Scholar] [CrossRef]
- Paltsev, S.; Capros, P. Cost Concepts for Climate Change Mitigation. Clim. Chang. Econ. 2013, 4, 1340003. [Google Scholar] [CrossRef]
- Cergibozan, R. Renewable Energy Sources as a Solution for Energy Security Risk: Empirical Evidence from OECD Countries. Renew. Energy 2022, 183, 617–626. [Google Scholar] [CrossRef]
- Koutsandreas, D.; Spiliotis, E.; Doukas, H.; Psarras, J. What Is the Macroeconomic Impact of Higher Decarbonization Speeds? The Case of Greece. Energies 2021, 14, 2235. [Google Scholar] [CrossRef]
- Grottera, C.; La Rovere, E.L.; Wills, W.; Pereira, A.O., Jr. The Role of Lifestyle Changes in Low-Emissions Development Strategies: An Economy-Wide Assessment for Brazil. Clim. Policy 2020, 20, 217–233. [Google Scholar] [CrossRef]
- Almulla, Y.; Ramirez, C.; Joyce, B.; Huber-Lee, A.; Fuso-Nerini, F. From Participatory Process to Robust Decision-Making: An Agriculture-Water-Energy Nexus Analysis for the Souss-Massa Basin in Morocco. Energy Sustain. Dev. 2022, 70, 314–338. [Google Scholar] [CrossRef]
- Asiaban, S.; Kayedpour, N.; Samani, A.E.; Bozalakov, D.; De Kooning, J.D.M.; Crevecoeur, G.; Vandevelde, L. Wind and Solar Intermittency and the Associated Integration Challenges: A Comprehensive Review Including the Status in the Belgian Power System. Energies 2021, 14, 2630. [Google Scholar] [CrossRef]
- Halbrügge, S.; Buhl, H.U.; Fridgen, G.; Schott, P.; Weibelzahl, M.; Weissflog, J. How Germany Achieved a Record Share of Renewables during the COVID-19 Pandemic While Relying on the European Interconnected Power Network. Energy 2022, 246, 123303. [Google Scholar] [CrossRef]
- Sani, L.; Khatiwada, D.; Harahap, F.; Silveira, S. Decarbonization Pathways for the Power Sector in Sumatra, Indonesia. Renew. Sustain. Energy Rev. 2021, 150, 111507. [Google Scholar] [CrossRef]
- Gielen, D. Critical Materials for the Energy Transition; International Renewable Energy Agency: Abu Dhabi, United Arab Emirates, 2021; ISBN 978-92-9260-366-3. [Google Scholar]
- Arvesen, A.; Luderer, G.; Pehl, M.; Bodirsky, B.L.; Hertwich, E.G. Deriving Life Cycle Assessment Coefficients for Application in Integrated Assessment Modelling. Environ. Model. Softw. 2018, 99, 111–125. [Google Scholar] [CrossRef]
- Bacher, J.; Pohjalainen, E.; Yli-Rantala, E.; Boonen, K.; Nelen, D. Environmental Aspects Related to the Use of Critical Raw Materials in Priority Sectors and Value Chains; European Topic Centre Waste and Materials in a Green Economy: Flanders, Belgium, 2020. [Google Scholar]
- Khan, Z.; Linares, P.; Rutten, M.; Parkinson, S.; Johnson, N.; García-González, J. Spatial and Temporal Synchronization of Water and Energy Systems: Towards a Single Integrated Optimization Model for Long-Term Resource Planning. Appl. Energy 2018, 210, 499–517. [Google Scholar] [CrossRef]
- Parkinson, S.C.; Makowski, M.; Krey, V.; Sedraoui, K.; Almasoud, A.H.; Djilali, N. A Multi-Criteria Model Analysis Framework for Assessing Integrated Water-Energy System Transformation Pathways. Appl. Energy 2018, 210, 477–486. [Google Scholar] [CrossRef]
- Adesanya, A.A.; Sommerfeldt, N.; Pearce, J.M. Achieving 100% Renewable and Self-Sufficient Electricity in Impoverished, Rural, Northern Climates: Case Studies from Upper Michigan, USA. Electricity 2022, 3, 264–296. [Google Scholar] [CrossRef]
- Niet, T.; Arianpoo, N.; Kuling, K.; Wright, A.S. Increasing the Reliability of Energy System Scenarios with Integrated Modelling: A Review. Environ. Res. Lett. 2022, 17, 043006. [Google Scholar] [CrossRef]
- Keppo, I.; Butnar, I.; Bauer, N.; Caspani, M.; Edelenbosch, O.; Emmerling, J.; Fragkos, P.; Guivarch, C.; Harmsen, M.; Lefèvre, J.; et al. Exploring the Possibility Space: Taking Stock of the Diverse Capabilities and Gaps in Integrated Assessment Models. Environ. Res. Lett. 2021, 16, 053006. [Google Scholar] [CrossRef]
- Fujimori, S.; Wu, W.; Doelman, J.; Frank, S.; Hristov, J.; Kyle, P.; Sands, R.; van Zeist, W.-J.; Havlik, P.; Domínguez, I.P. Land-Based Climate Change Mitigation Measures Can Affect Agricultural Markets and Food Security. Nat. Food 2022, 3, 110–121. [Google Scholar] [CrossRef] [PubMed]
- Dianellou, A.; Christakopoulos, T.; Caralis, G.; Kotroni, V.; Lagouvardos, K.; Zervos, A. Is the Large-Scale Development of Wind-PV with Hydro-Pumped Storage Economically Feasible in Greece? Appl. Sci. 2021, 11, 2368. [Google Scholar] [CrossRef]
- Koutsandreas, D.; Trachanas, G.; Pappis, I.; Nikas, A.; Doukas, H.; Psarras, J. A Multicriteria Modeling Approach for Evaluating Power Generation Scenarios under Uncertainty: The Case of Green Hydrogen in Greece. Available online: https://www.researchgate.net/profile/Diamantis-Koutsandreas/publication/368388357_A_multicriteria_modeling_approach_for_evaluating_power_generation_scenarios_under_uncertainty_The_case_of_green_hydrogen_in_Greece/links/63e5233fc002331f7266daa3/A-multicriteria-modeling-approach-for-evaluating-power-generation-scenarios-under-uncertainty-The-case-of-green-hydrogen-in-Greece.pdf (accessed on 31 July 2023).
- Howells, M.; Rogner, H.; Strachan, N.; Heaps, C.; Huntington, H.; Kypreos, S.; Hughes, A.; Silveira, S.; DeCarolis, J.; Bazillian, M.; et al. OSeMOSYS: The Open Source Energy Modeling System. An Introduction to Its Ethos, Structure and Development. Energy Policy 2011, 39, 5850–5870. [Google Scholar] [CrossRef]
- Hellenic Ministry of Environment and Energy. National Energy and Climate Plan; Hellenic Ministry of Environment and Energy: Athens, Greece, 2019; Available online: https://energy.ec.europa.eu/system/files/2020-03/el_final_necp_main_en_0.pdf (accessed on 31 July 2023).
- European Commission. EU Reference Scenario 2020; European Commission: Brussels, Belgium, 2021. [Google Scholar]
- Carlsson, J.; Fortes, M.; de Marco, G.; Giuntoli, J.; Jakubcionis, M.; Jäger-Waldau, A.; Lacal-Arantegui, R.; Lazarou, S.; Magagna, D.; Moles, C. ETRI 2014—Energy Technology Reference Indicator Projections for 2010–2050; Publications Office of the European Union: Luxembourg, 2014. [Google Scholar]
- International Energy Agency. IEA World Energy Outlook 2021; International Energy Agency: Paris, France, 2021. [Google Scholar]
- Hirth, L.; Mühlenpfordt, J.; Bulkeley, M. The ENTSO-E Transparency Platform–A Review of Europe’s Most Ambitious Electricity Data Platform. Appl. Energy 2018, 225, 1054–1067. [Google Scholar] [CrossRef]
- Jordaan, S.M.; Heath, G.A.; Macknick, J.; Bush, B.W.; Mohammadi, E.; Ben-Horin, D.; Urrea, V.; Marceau, D. Understanding the Life Cycle Surface Land Requirements of Natural Gas-Fired Electricity. Nat. Energy 2017, 2, 804–812. [Google Scholar] [CrossRef]
- Rochelle, G.T. Amine Scrubbing for CO2 Capture. Science 2009, 325, 1652–1654. [Google Scholar] [CrossRef]
- United Nations Statistics Division. Energy Statistics. Available online: https://unstats.un.org/unsd/energystats/pubs/balance/ (accessed on 31 July 2023).
- Makhorin, A. GNU Linear Programming Kit; Moscow Aviation Institute: Moscow, Russia, 2001; p. 38. [Google Scholar]
- Hertel, T.; Tsigas, M. Structure of the GTAP Model. In Global Trade Analysis: Modeling and Applications; Cambridge University Press: Cambridge, MA, USA, 1997; pp. 9–71. [Google Scholar]
- Aguiar, A.; Chepeliev, M.; Corong, E.; van der Mensbrugghe, D. The Global Trade Analysis Project (GTAP) Data Base: Version 11. J. Glob. Econ. Anal. 2022, 7. [Google Scholar] [CrossRef]
- Riahi, K.; Van Vuuren, D.P.; Kriegler, E.; Edmonds, J.; O’neill, B.C.; Fujimori, S.; Bauer, N.; Calvin, K.; Dellink, R.; Fricko, O. The Shared Socioeconomic Pathways and Their Energy, Land Use, and Greenhouse Gas Emissions Implications: An Overview. Glob. Environ. Chang. 2017, 42, 153–168. [Google Scholar] [CrossRef]
- Rogelj, J.; Popp, A.; Calvin, K.V.; Luderer, G.; Emmerling, J.; Gernaat, D.; Fujimori, S.; Strefler, J.; Hasegawa, T.; Marangoni, G. Scenarios towards Limiting Global Mean Temperature Increase below 1.5 C. Nat. Clim. Chang. 2018, 8, 325–332. [Google Scholar] [CrossRef]
- Gidden, M.J.; Riahi, K.; Smith, S.J.; Fujimori, S.; Luderer, G.; Kriegler, E.; van Vuuren, D.P.; van den Berg, M.; Feng, L.; Klein, D. Global Emissions Pathways under Different Socioeconomic Scenarios for Use in CMIP6: A Dataset of Harmonized Emissions Trajectories through the End of the Century. Geosci. Model Dev. 2019, 12, 1443–1475. [Google Scholar] [CrossRef]
- Hertel, T. Global Trade Analysis: Modeling and Applications; Cambridge University Press: Cambridge, MA, USA, 1996; ISBN 9780521643740. [Google Scholar]
- Fouré, J.; Bénassy-Quéré, A.; Fontagné, L. The Great Shift: Macroeconomic Projections for the World Economy at the 2050 Horizon; SSRN: Rochester, NY, USA, 2012. [Google Scholar]
- Koutsandreas, D. Does Complexity Compensate for Accuracy in Annual Final Energy Demand Forecasting? A Multi-Methods Case Study in G7 Countries. In Proceedings of the 2023 19th International Conference on the European Energy Market (EEM), Lappeenranta, Finland, 6–8 June 2023; pp. 1–7. [Google Scholar] [CrossRef]
- Burfisher, M.E. Introduction to Computable General Equilibrium Models, 2nd ed.; Cambridge University Press: Cambridge, MA, USA, 2017. [Google Scholar] [CrossRef]
- Chandrasekar, M.; Senthilkumar, T. Five Decades of Evolution of Solar Photovoltaic Thermal (PVT) Technology—A Critical Insight on Review Articles. J. Clean. Prod. 2021, 322, 128997. [Google Scholar] [CrossRef]
- Gasparatos, A.; Doll, C.N.H.; Esteban, M.; Ahmed, A.; Olang, T.A. Renewable Energy and Biodiversity: Implications for Transitioning to a Green Economy. Renew. Sustain. Energy Rev. 2017, 70, 161–184. [Google Scholar] [CrossRef]
- Barragán-Escandón, A.; Jara-Nieves, D.; Romero-Fajardoc, I.; Zalamea-Leónesteban, E.F.; Serrano-Guerrero, X. Barriers to Renewable Energy Expansion: Ecuador as a Case Study. Energy Strategy Rev. 2022, 43, 100903. [Google Scholar] [CrossRef]
- Oryani, B.; Koo, Y.; Rezania, S.; Shafiee, A. Barriers to Renewable Energy Technologies Penetration: Perspective in Iran. Renew. Energy 2021, 174, 971–983. [Google Scholar] [CrossRef]
- Trachanas, G.P.; Mantzaris, N.; Marinakis, V.; Doukas, H. Multicriteria Evaluation of Power Generation Alternatives towards Lignite Phase-out: The Case of Ptolemaida V. Int. J. Multicriteria Decis. Mak. 2022, 9, 17–42. [Google Scholar] [CrossRef]
- Hache, E. Do Renewable Energies Improve Energy Security in the Long Run? Int. Econ. 2018, 156, 127–135. [Google Scholar] [CrossRef]
- Almutairi, K.; Thoma, G.; Durand-Morat, A. Ex-Ante Analysis of Economic, Social and Environmental Impacts of Large-Scale Renewable and Nuclear Energy Targets for Global Electricity Generation by 2030. Sustainability 2018, 10, 2884. [Google Scholar] [CrossRef]
- Kleanthis, N.; Koutsandreas, D.; Karakosta, C.; Doukas, H.; Flamos, A. Bridging the Transparency Gap in Energy Efficiency Financing by Co-Designing an Integrated Assessment Framework with Involved Actors. Energy Rep. 2022, 8, 9686–9699. [Google Scholar] [CrossRef]
- Scipioni, A.; Manzardo, A.; Ren, J. Hydrogen Economy: Processes, Supply Chain, Life Cycle Analysis and Energy Transition for Sustainability; Elsevier: Amsterdam, The Netherlands, 2023; ISBN 0323995438. [Google Scholar]
- Koutsandreas, D.; Kleanthis, N.; Flamos, A.; Karakosta, C.; Doukas, H. Risks and Mitigation Strategies in Energy Efficiency Financing: A Systematic Literature Review. Energy Rep. 2022, 8, 1789–1802. [Google Scholar] [CrossRef]
- Hellenic Ministry of Environment and Energy. Long-Term Strategy for 2050. Available online: https://ypen.gov.gr/wp-content/uploads/2020/11/lts_gr_el.pdf (accessed on 31 July 2023).
Figure 1.
The Reference Energy System (RES) of the Greek power sector, as illustrated in the cost optimization model. The RES represents the entire network of sequential procedures in the power sector, from collecting primary energy and land resources (left part of the figure) and generating electricity (middle part of the figure) to finally transmitting and distributing electricity to the final demand sectors (right part of the figure).

Figure 2.
Annual final electricity demand considered for the ambitious scenario (per sector and in total) and National Energy and Climate Plan (NECP) scenario (in total) over the 2020–2035 period.
Figure 2.
Annual final electricity demand considered for the ambitious scenario (per sector and in total) and National Energy and Climate Plan (NECP) scenario (in total) over the 2020–2035 period.

Figure 3.
Annual electricity production in terawatt-hours (TWh) from each type of power technology in the system over the 2023–2035 period, for the ambitious scenario.
Figure 3.
Annual electricity production in terawatt-hours (TWh) from each type of power technology in the system over the 2023–2035 period, for the ambitious scenario.

Figure 4.
Allocation of annual electricity production across the system’s types of power technologies over the 2023–2035 period, for the ambitious scenario.
Figure 4.
Allocation of annual electricity production across the system’s types of power technologies over the 2023–2035 period, for the ambitious scenario.

Figure 5.
Annual installed capacity in gigawatts (GW) per type of power technology every year, over the 2023–2035 period, for the ambitious scenario.
Figure 5.
Annual installed capacity in gigawatts (GW) per type of power technology every year, over the 2023–2035 period, for the ambitious scenario.

Figure 6.
Annual land area, in square kilometres (km2), occupied for power generation under the ambitious scenario (in total and on a technological basis) and the NECP scenario (in total) over the 2023–2035 period.
Figure 6.
Annual land area, in square kilometres (km2), occupied for power generation under the ambitious scenario (in total and on a technological basis) and the NECP scenario (in total) over the 2023–2035 period.

Figure 7.
Annual biomass power generation in TWh under the ambitious and NECP scenarios over the 2023–2035 period. This indicator is used as a proxy for assessing the risk of harming biodiversity.
Figure 7.
Annual biomass power generation in TWh under the ambitious and NECP scenarios over the 2023–2035 period. This indicator is used as a proxy for assessing the risk of harming biodiversity.

Figure 8.
Annual CO2 emissions in megatons (Mt) of power generation in Greece under the ambitious and NECP scenarios over the 2023–2035 period.
Figure 8.
Annual CO2 emissions in megatons (Mt) of power generation in Greece under the ambitious and NECP scenarios over the 2023–2035 period.

Figure 9.
Annual capital investment requirements in EUR millions for the ambitious scenario (in total and on a technological basis) and the NECP scenario (in total) over the 2023–2035 period.
Figure 9.
Annual capital investment requirements in EUR millions for the ambitious scenario (in total and on a technological basis) and the NECP scenario (in total) over the 2023–2035 period.

Figure 10.
Annual levelized cost of electricity (LCOE) in EUR per megawatt-hour (EUR/MWh) of the final electricity demand under the ambitious scenario (in total and per cost component) and the NECP scenario (in total) over the 2023–2035 period.
Figure 10.
Annual levelized cost of electricity (LCOE) in EUR per megawatt-hour (EUR/MWh) of the final electricity demand under the ambitious scenario (in total and per cost component) and the NECP scenario (in total) over the 2023–2035 period.

Figure 11.
Impact of the ambitious scenario’s realization on the GDP of the Greek economy over the 2023–2035 period, as a percentage change compared to the NECP scenario.
Figure 11.
Impact of the ambitious scenario’s realization on the GDP of the Greek economy over the 2023–2035 period, as a percentage change compared to the NECP scenario.

Figure 12.
Impact of the ambitious scenario’s implementation on the working positions of the Greek economy over the 2023–2035 period, as a deviation of one thousand employees compared to the NECP scenario.
Figure 12.
Impact of the ambitious scenario’s implementation on the working positions of the Greek economy over the 2023–2035 period, as a deviation of one thousand employees compared to the NECP scenario.


Table 1.
Capacity and energy land area impact factors assumed for each power technology in the system.
Table 1.
Capacity and energy land area impact factors assumed for each power technology in the system.
| Technology | Land Area Impact (LAI) Factors | |
|---|---|---|
| Capacity (km2/GW) | Energy (km2/GWh) | |
| Geothermal power plant | 38.8 | - |
| Biomass CHP power plant | 2 | 0.76 |
| Coal power plant | 2 | 124.2 × 10⁻⁶ |
| Diesel power plant | 2 | 144 × 10−6 |
| Hydropower plant | 84.6 | - |
| Natural gas power plant | 2 | 144 × 10−6 |
| CSP | 30 | - |
| Rooftop solar PV | - | - |
| Commercial solar PV | 34.4 | - |
| Wind onshore turbine | 368.3 | - |
| Wind offshore turbine | - | - |
Disclaimer/Publisher’s Note: The statements, opinions and data contained in all publications are solely those of the individual author(s) and contributor(s) and not of MDPI and/or the editor(s). MDPI and/or the editor(s) disclaim responsibility for any injury to people or property resulting from any ideas, methods, instructions or products referred to in the content. |
© 2023 by the author. Licensee MDPI, Basel, Switzerland. This article is an open access article distributed under the terms and conditions of the Creative Commons Attribution (CC BY) license (https://creativecommons.org/licenses/by/4.0/).
Share and Cite
MDPI and ACS Style
Koutsandreas, D. A Nexus-Based Impact Assessment of Rapid Transitions of the Power Sector: The Case of Greece. Electricity 2023, 4, 256-276. https://0-doi-org.brum.beds.ac.uk/10.3390/electricity4030016
AMA Style
Koutsandreas D. A Nexus-Based Impact Assessment of Rapid Transitions of the Power Sector: The Case of Greece. Electricity. 2023; 4(3):256-276. https://0-doi-org.brum.beds.ac.uk/10.3390/electricity4030016
Chicago/Turabian StyleKoutsandreas, Diamantis. 2023. "A Nexus-Based Impact Assessment of Rapid Transitions of the Power Sector: The Case of Greece" Electricity 4, no. 3: 256-276. https://0-doi-org.brum.beds.ac.uk/10.3390/electricity4030016