Proceeding Paper

Bridging the Gap between the Estimates of Forest Management Emissions from the National GHG Inventories and Integrated Assessment Models via Model–Data Fusion †

by
Mykola Gusti
1,2,*,
Andrey Lessa Derci Augustynczik
1,
Fulvio Di Fulvio
1,
Pekka Lauri
1 and
Nicklas Forsell
1
1
Biodiversity and Natural Resources Program, International Institute for Applied Systems Analysis, 2361 Laxenburg, Austria
2
Department of International Information, Lviv Polytechnic National University, 79013 Lviv, Ukraine
*
Author to whom correspondence should be addressed.
Presented at the 2nd International Electronic Conference on Forests—Sustainable Forests: Ecology, Management, Products and Trade, 1–15 September 2021; Available Online: https://iecf2021.sciforum.net/.
Environ. Sci. Proc. 2022, 13(1), 23; https://0-doi-org.brum.beds.ac.uk/10.3390/IECF2021-10795
Published: 31 August 2021

Abstract

:
Current criteria to define managed forests are inconsistent among countries’ reports of GHG emissions to UNFCCC. Integrated assessment models used for assessing countries’ mitigation pathways employ a proxy for managed forests that differ from the countries’ criteria. This is one of the reasons for the gap of 5.5 GtCO2 year−1 between the modelled and reported global land-use GHG emissions. Using multiple data, we developed a map of managed forests (0.5 × 0.5 deg), consistent with official GHG inventories. We applied the map in the G4M model for masking a managed forest area and estimating the GHG emissions from that area.

1. Introduction

The Intergovernmental Panel on Climate Change (IPCC) provides a general definition of managed land and allows countries to adapt this definition to national circumstances [1]. Managed land may include land used for intensive production purposes as well as protected areas with minimum human activity. As a result, the countries apply slightly different criteria to define managed forest areas in their reports of greenhouse gas (GHG) emissions to the UNFCCC. Some countries communicate the managed forest area in their GHG inventory reports to the UNFCCC, which has been compiled in a table by Grassi et al. (2021) [2], while only a few countries have published maps of managed forests. In turn, integrated assessment models (IAM) used for assessing countries’ mitigation pathways employ a proxy for managed forests for modelling purposes that usually includes only forests used for commercial wood supply. This difference in the managed forest definition is one of the reasons for the gap of about 5.5 GtCO2 year−1 between the modelled global land-use GHG emissions and the one reported by the countries to the UNFCCC. Such inconsistency adds uncertainty to the contribution of the forest sector to climate change mitigation efforts and undermines its monitoring [2]. To our best knowledge, a global map of managed forests that is consistent with the UNFCCC definition of managed land and the managed forest areas used in countries’ GHG inventory reports does not exit.
The objective of the study was to develop a harmonized map of managed forests, consistent with official GHG inventories. We developed the map for application in the Global Forest Model (G4M) [3] operating on a 0.5 × 0.5 deg. regular grid for masking the managed forest area, which is consistent with the estimates of countries GHG emissions’ reports to the UNFCCC and estimating the GHG emissions from that area.

2. Materials and Methods

The following input data are used in the study:
Country data on the area of managed forest: Grassi et al. (2021) [2].
Spatial data: Forest cover map used in G4M that is based on GLC 2000 [4]; the layer ‘Human impact on forest’ from the Nature map [5] (Nature map); road density [6]; mean annual increment [7], travel time to major cities [8] and maps of forest classes and forest uses by Schulze et al. (2019) [9].
We used managed forest area for countries presented in Grassi et al., 2021 [2] as the target values. The managed forest area was derived from the National Inventory Reports from the Annex-I parties, Biennial Update Report submissions from Non-Annex I Parties, Nationally Determined Contributions, other documents communicated by the parties in the UNFCCC process or estimates from the FAO FRA non-primary forests [2].
As a basic map for classification, we used the forest cover map based on GLC 2000 adjusted to the 2000 forest area data from the FAO FRA 2015 [10]. The map is of 0.5 × 0.5 degrees resolution. This map was chosen as it is used in the Global Forest Model (G4M) as the initial (year 2000) forest map.
For each country, we collected grid cells containing forests until the sum of the forest area in the collected grid cells matched the managed forest area for that country. The grid cells within the borders of each country were arranged by forest type, starting from the Nature map class ‘Short rotation plantations for timber’ followed by ‘Planted forest’. The Nature map class ‘Agroforestry’ includes orchards, tree shelter-belts, and individual trees on pastures; it partially overlaps with mosaic classes from GLC 2000 and the classes from the forest-uses map by Schulze et al. (2019) [9] of ‘Primarily used for production’ and ‘Multiple uses’. Therefore, we collected the cells under the ‘Agroforestry’ class overlapping with the ‘Primarily used for production’ class and then with the ‘Multiple uses’ class. Then, the grid cells under the Nature map class ‘Naturally regenerating forest with signs of human activities, e.g., logging, clear cuts, etc.’ followed by ‘Naturally regenerating forest without any signs of human activities, e.g., primary forests’ (since the protected forests are managed as well) were collected. Another complex class from the Nature map is ‘Oil palm plantations’ as it partially overlaps with forest classes in GLC 2000 and Schulze et al. (2019) [9] maps. Those overlapping cells were collected after all the other classes. Within each country and Nature forest class, the grid cells were sorted by road density (descending), forest productivity (descending) and travel time to major cities.

3. Results and Discussion

Managed forest area estimated from the map after application of the abovementioned method is presented in Table 1 for selected countries and in Figure 1, the developed map is available in supplementary material. Globally, we spatially allocated 95% of the managed forest land area that is presented in [2] or estimated from the FAO FRA. Over 75% of the forest is managed. In the Annex-I parties to the Kyoto Protocol, except Canada, 65%, and Russia, 80%, most of the forest land is considered as managed. Among the non-Annex-I parties, Peru has the lowest share of the managed forest, 10%, the other main countries (as presented in [2]) with managed forest area below 50% are Brazil, 45%, Democratic Republic of the Congo, 31%, Ecuador, 39% and Guyana, 43%.
Our forest management map is based on a simplified assumption that each grid contains only one type of forest (managed or unmanaged). This assumption somewhat biases our results, since in reality, half-degree grids (about 50 × 50 km) may contain both managed and unmanaged forests. The analysis could be improved by allowing each grid to contain both managed and unmanaged forests, but this would complicate the initialization of age-class dynamics in the G4M model. In particular, because all the grid cells were classified as managed or unmanaged, the area of the managed forest land on the resulting map may exceed the country data presented in [2] (e.g., Argentina, Brazil, Canada, Colombia). However, the area of the managed forest on the map is below the area presented in [2] for a number of countries. There are four main reasons for this:
(1)
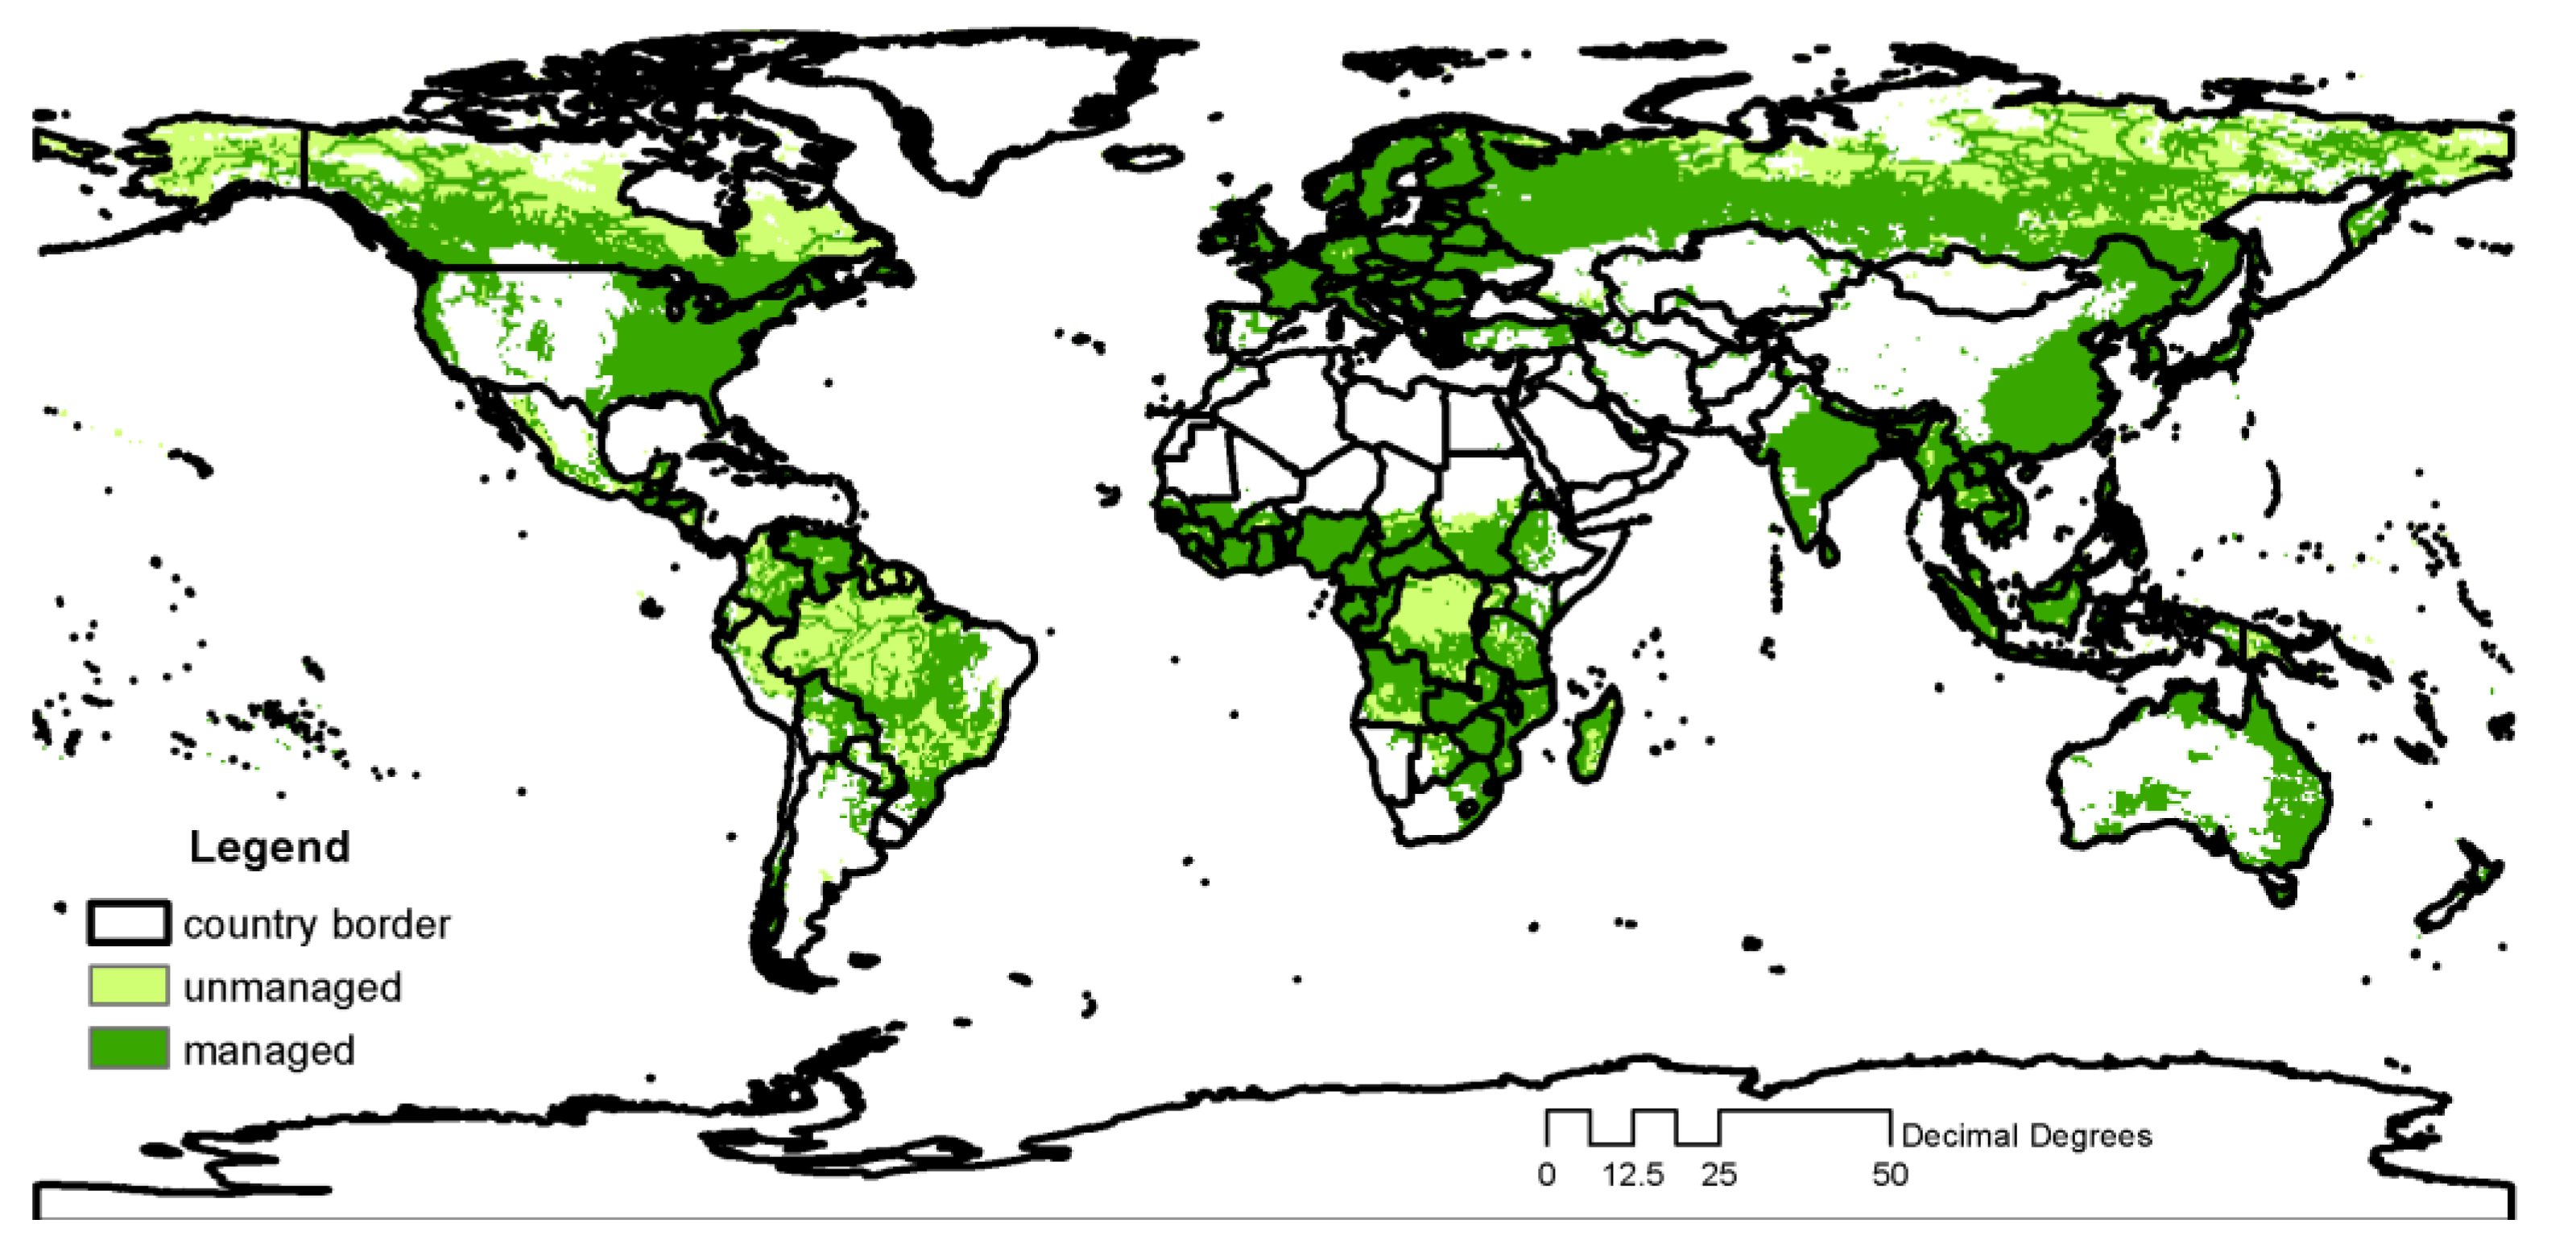
Our basic map is GLC 2000 adjusted to the FAO FRA forest area in 2000, while the Grassi et al., 2021 [2] data represents the 2005–2015 average. In some countries, the forest area increased after 2000; therefore, our basic map does not contain all forest accounted for in 2005–2015 (e.g., India, Viet-Nam);
(2)
In the UNFCCC process, the countries use the national definition of forest that in some cases differ from the FAO definition applied in our basic map (e.g., Turkey, where forest area is 10,183 kha according to FAO FRA against 23,000 kha of managed forest derived from national GHG inventory report in [2]; South Africa where forest area is 9241 kha according to FAO FRA against 23,000 kha of managed forest derived from national GHG inventory report in [2]);
(3)
Due to its coarse resolution, our basic map misses some forest area on the borders and coasts;
(4)
In some cases, woody vegetation is sparse and is not classified as forest in remote-sensing-based products; therefore, forest area in the FAO FRA and GHG inventory reports may be considerably greater than the area derived from GLC 2000 (e.g., Morocco).
The IPCC definition of managed land allows for wide interpretation of the term. Therefore, national definitions of managed land including managed forests differ among countries [11]. In this study, we applied general criteria to all countries, regardless of local forest practices and actual criteria applied in the countries that may result in wrong classification.
A further development of managed forest maps, with consistent definitions at country-level, and country-specific rules for managed/unmanaged forest classification, deserves further investigation. Such efforts can support the harmonization of GHG emissions estimates from models and official statistics and improve the design of mitigation policies informed by IAMs. In particular, country-specific rules for determining location of the managed forests should be applied and a comparison of the developed map to the national maps of managed forests should be provided where feasible. Development of managed forest maps with a finer resolution is another planned improvement to smooth the effect of all cells being classified as managed or unmanaged.

Supplementary Materials

The following supporting information can be downloaded at: https://0-www-mdpi-com.brum.beds.ac.uk/article/10.3390/IECF2021-10795/s1 UNFCCC managed forest map.

Author Contributions

Conceptualization, M.G. and N.F.; methodology, M.G., A.L.D.A., F.D.F., P.L.; software, M.G.; validation, M.G., A.L.D.A. and P.L.; formal analysis, M.G.; writing—original draft preparation, M.G. and A.L.D.A.; writing—review and editing, F.D.F., N.F., P.L.; visualization, M.G. All authors have read and agreed to the published version of the manuscript.

Funding

This research received no external funding.

Institutional Review Board Statement

Not applicable.

Data Availability Statement

The data presented in this study are available in supplementary material.

Conflicts of Interest

The authors declare no conflict of interest.

References

  1. Eggleston, H.S.; Buendia, L.; Miwa, K.; Ngara, T.; Tanabe, K. (Eds.) 2006 IPCC Guidelines for National Greenhouse Gas Inventories; Prepared by the National Greenhouse Gas Inventories Programme; IGES: Hayama, Japan, 2006; Available online: https://www.ipcc-nggip.iges.or.jp/public/2006gl/ (accessed on 1 March 2022).
  2. Grassi, G.; Stehfest, E.; Rogelj, J.; van Vuuren, D.; Cescatti, A.; House, J.; Nabuurs, G.-J.; Rossi, S.; Alkama, R.; Viñas, R.A.; et al. Critical adjustment of land mitigation pathways for assessing countries’ climate progress. Nat. Clim. Chang. 2021, 11, 425–434. [Google Scholar] [CrossRef]
  3. Gusti, M.; Kindermann, G. An approach to modeling landuse change and forest management on a global scale. In Proceedings of the 1st International Conference on Simulation and Modeling Methodologies, Technologies and Applications (SIMULTECH 2011), Noordwijkerhout, The Netherlands, 29–31 July 2011; pp. 180–185. [Google Scholar]
  4. Bartholomé, E.; Belward, A.S. GLC2000: A new approach to global land cover mapping from Earth observation data. Int. J. Remote Sens. 2005, 26, 1959–1977. [Google Scholar] [CrossRef]
  5. Lesiv, M.; Schepaschenko, D.; Buchhorn, M.; See, L.; Dürauer, M.; Georgieva, I.; Jung, M.; Hofhansl, F.; Schulze, K.; Bilous, A.; et al. Global forest management data at a 100m resolution for the year 2015 (Version 1) [Data set]. Nat. Sci. Data Zenodo 2021. [Google Scholar] [CrossRef]
  6. Center for International Earth Science Information Network–CIESIN–Columbia University, and Information Technology Outreach Services–ITOS–University of Georgia: Global Roads Open Access Data Set, Version 1 (gROADSv1); NASA Socioeconomic Data and Applications Center (SEDAC): Palisades, NY, USA, 2013. [CrossRef]
  7. Kindermann, G.; Obersteiner, M.; Rametsteiner, E.; McCallcum, I. Predicting the Deforestation–Trend under Different Carbon–Prices. Carbon Balance Manag. 2006, 1, 15. [Google Scholar] [CrossRef] [PubMed] [Green Version]
  8. Travel Time to Major Cities: A Global Map of Accessibility. Available online: https://forobs.jrc.ec.europa.eu/products/gam/index.php (accessed on 15 October 2008).
  9. Schulze, K.; Malek, Ž.; Verburg, P.H. Towards better mapping of forest management patterns: A global allocation approach. For. Ecol. Manag. 2019, 432, 776–785. [Google Scholar] [CrossRef] [Green Version]
  10. Global Forest Resources Assessment 2015; Food and Agriculture Organization of the United Nations: Rome, Italy, 2015.
  11. Ogle, S.M.; Domke, G.; Kurz, W.A.; Rocha, M.T.; Huffman, T.; Swan, A.; Smith, J.E.; Woodall, C.; Krug, T. Delineating managed land for reporting national greenhouse gas emissions and removals to the United Nations framework convention on climate change. Carbon Balance Manag. 2018, 13, 9. [Google Scholar] [CrossRef] [PubMed]
Figure 1. A map of managed forest area consistent with the countries’ reports of GHG emissions to UNFCCC.
Environsciproc 13 00023 g001
Table 1. Managed and unmanaged forest area estimated from the map, and managed forest area presented in Grassi et al., 2021 [2] or estimated from FAO FRA for selected countries and globally.
CountryUnmanaged, Estimated from the Map, khaManaged, Estimated from the Map, khaManaged, Reported in [2] or Estimated from FAO FRA, kha
Argentina488627,17427,000
Brazil283,523235,120235,000
Canada121,584226,076226,000
China 176,980180,000
Colombia10,76751,06151,000
Ethiopia67413,03013,000
India 65,39070,000
Morocco 16575632
Mexico34,83133,02633,000
Russian Federation155,475654,038654,000
Thailand81416,19316,000
Turkey 10,18323,000
Ukraine 950811,000
United States of America28,337274,141274,000
Viet Nam 11,52014,000
South Africa 924223,000
Global963,4783,026,2123,174,000
Publisher’s Note: MDPI stays neutral with regard to jurisdictional claims in published maps and institutional affiliations.

