1. Introduction
Nowadays, the average population density in coastal areas is about twice the world’s average, and the number of buildings and facilities close to the coastline is still increasing. For instance, eight of the world’s top ten biggest cities are located by the coast. Coastal areas are thus stressed by human activities, and the impacts of climate change, such as variations in sea level, wave conditions and storm surges, are expected to worsen the problems coastal areas are already facing [
1]. The effects of climate change on coastal areas can be analyzed considering long-term records of sea states. However, these data are scarce if compared with large datasets of land variables, e.g., rainfall and temperature, regularly collected since the beginning of the past century. However, wave climate variability and trends have been largely studied worldwide (e.g., [
2]). For example, Aarnes et al. [
3] investigated the significant wave height trend at annual and monthly scales for the period 1979–2012 and for the entire world. The results of this study evidenced a positive trend in mean wave conditions in the tropical ocean areas, and no trend or a slightly negative trend in the northern parts of the Pacific and Atlantic Oceans. A statistical analysis of sea states in two sub-periods, 1960–1999 and 1958–2001, has been performed in the Mediterranean basin considering the wave model WAM based on the ERA-40 dataset [
4]. As a result, a clear negative trend in significant wave height during the first three decades and a positive trend in the last decade have been detected. With regard to Italy, significant wave height trends in the northern Adriatic Sea have been analyzed by Pomaro et al. [
5] in the period 1979–2015, evidencing a clear reduction of the highest percentile (99th) and a smaller growth of the 50th and 75th ones. In southern Italy (Calabria region) Caloiero et al. [
6] identified positive trends in two synthetic parameters, i.e., significant wave height and energy period.
Within this context, in this paper a trend analysis of the annual and seasonal mean values of two synthetic parameters, significant wave height and energy period, and of the wave power has been here carried out for the Italian coasts through the application of the Mann–Kendall non-parametric test.
2. Interest Zone and Input Wave Data
Italy is located in Southern Europe between latitudes 35° and 47° N, and longitudes 6° and 19° E. To the north, Italy borders France, Switzerland, Austria and Slovenia, and is roughly delimited by the Alpine watershed. To the south, it consists of the entirety of the Italian Peninsula and the two Mediterranean islands of Sicily and Sardinia, in addition to many smaller islands. Including the islands, Italy has a coastline length of about 7600 km. The Italian Seas are part of the Mediterranean Sea and, in particular, four different seas surround the Italian Peninsula: the Adriatic Sea in the east, the Ionian Sea in the south, and the Ligurian Sea and the Tyrrhenian Sea in the west. The maximum depth of the Italian seas exceeds 5000 m (in the Ionian Sea).
With reference to wave climate in the Italian Seas, the most energetic area is located off the western coast of Sardinia, with a yearly average wave power per unit crest length of about 12 kW/m. Moreover, the Sicilian channel, located off the northwestern and southern Sicilian coasts, highlights a yearly average wave energy flux per unit crest length that reaches 9 kW/m [
7,
8]. On the other hand, the Adriatic Sea, where the average wave power does not exceed 3 kW/m, is one of the least productive areas in Italy in terms of wave power. Similar values are observed in various zones of the Ionian and Tyrrhenian Seas and near the strait of Messina (e.g., [
9]). A strong variability was observed off the Italian coasts on monthly basis for wave parameters, which resulted in relevant oscillations on a seasonal scale (e.g., [
10]).
In this work, the wave data related to the significant wave height, Hs, and the energy period, Te, in the period 1979–2018 were obtained from the global atmospheric reanalysis ERA-INTERIM by the European Center for Medium-Range Weather Forecasts (ECMWF), for a total of 40 years, a spatial resolution of 0.75° × 0.75° and time sampling of 6 h.
4. Results
In this section, the results of the trend analysis applied to the mean yearly and seasonal series of
Hs,
Te and
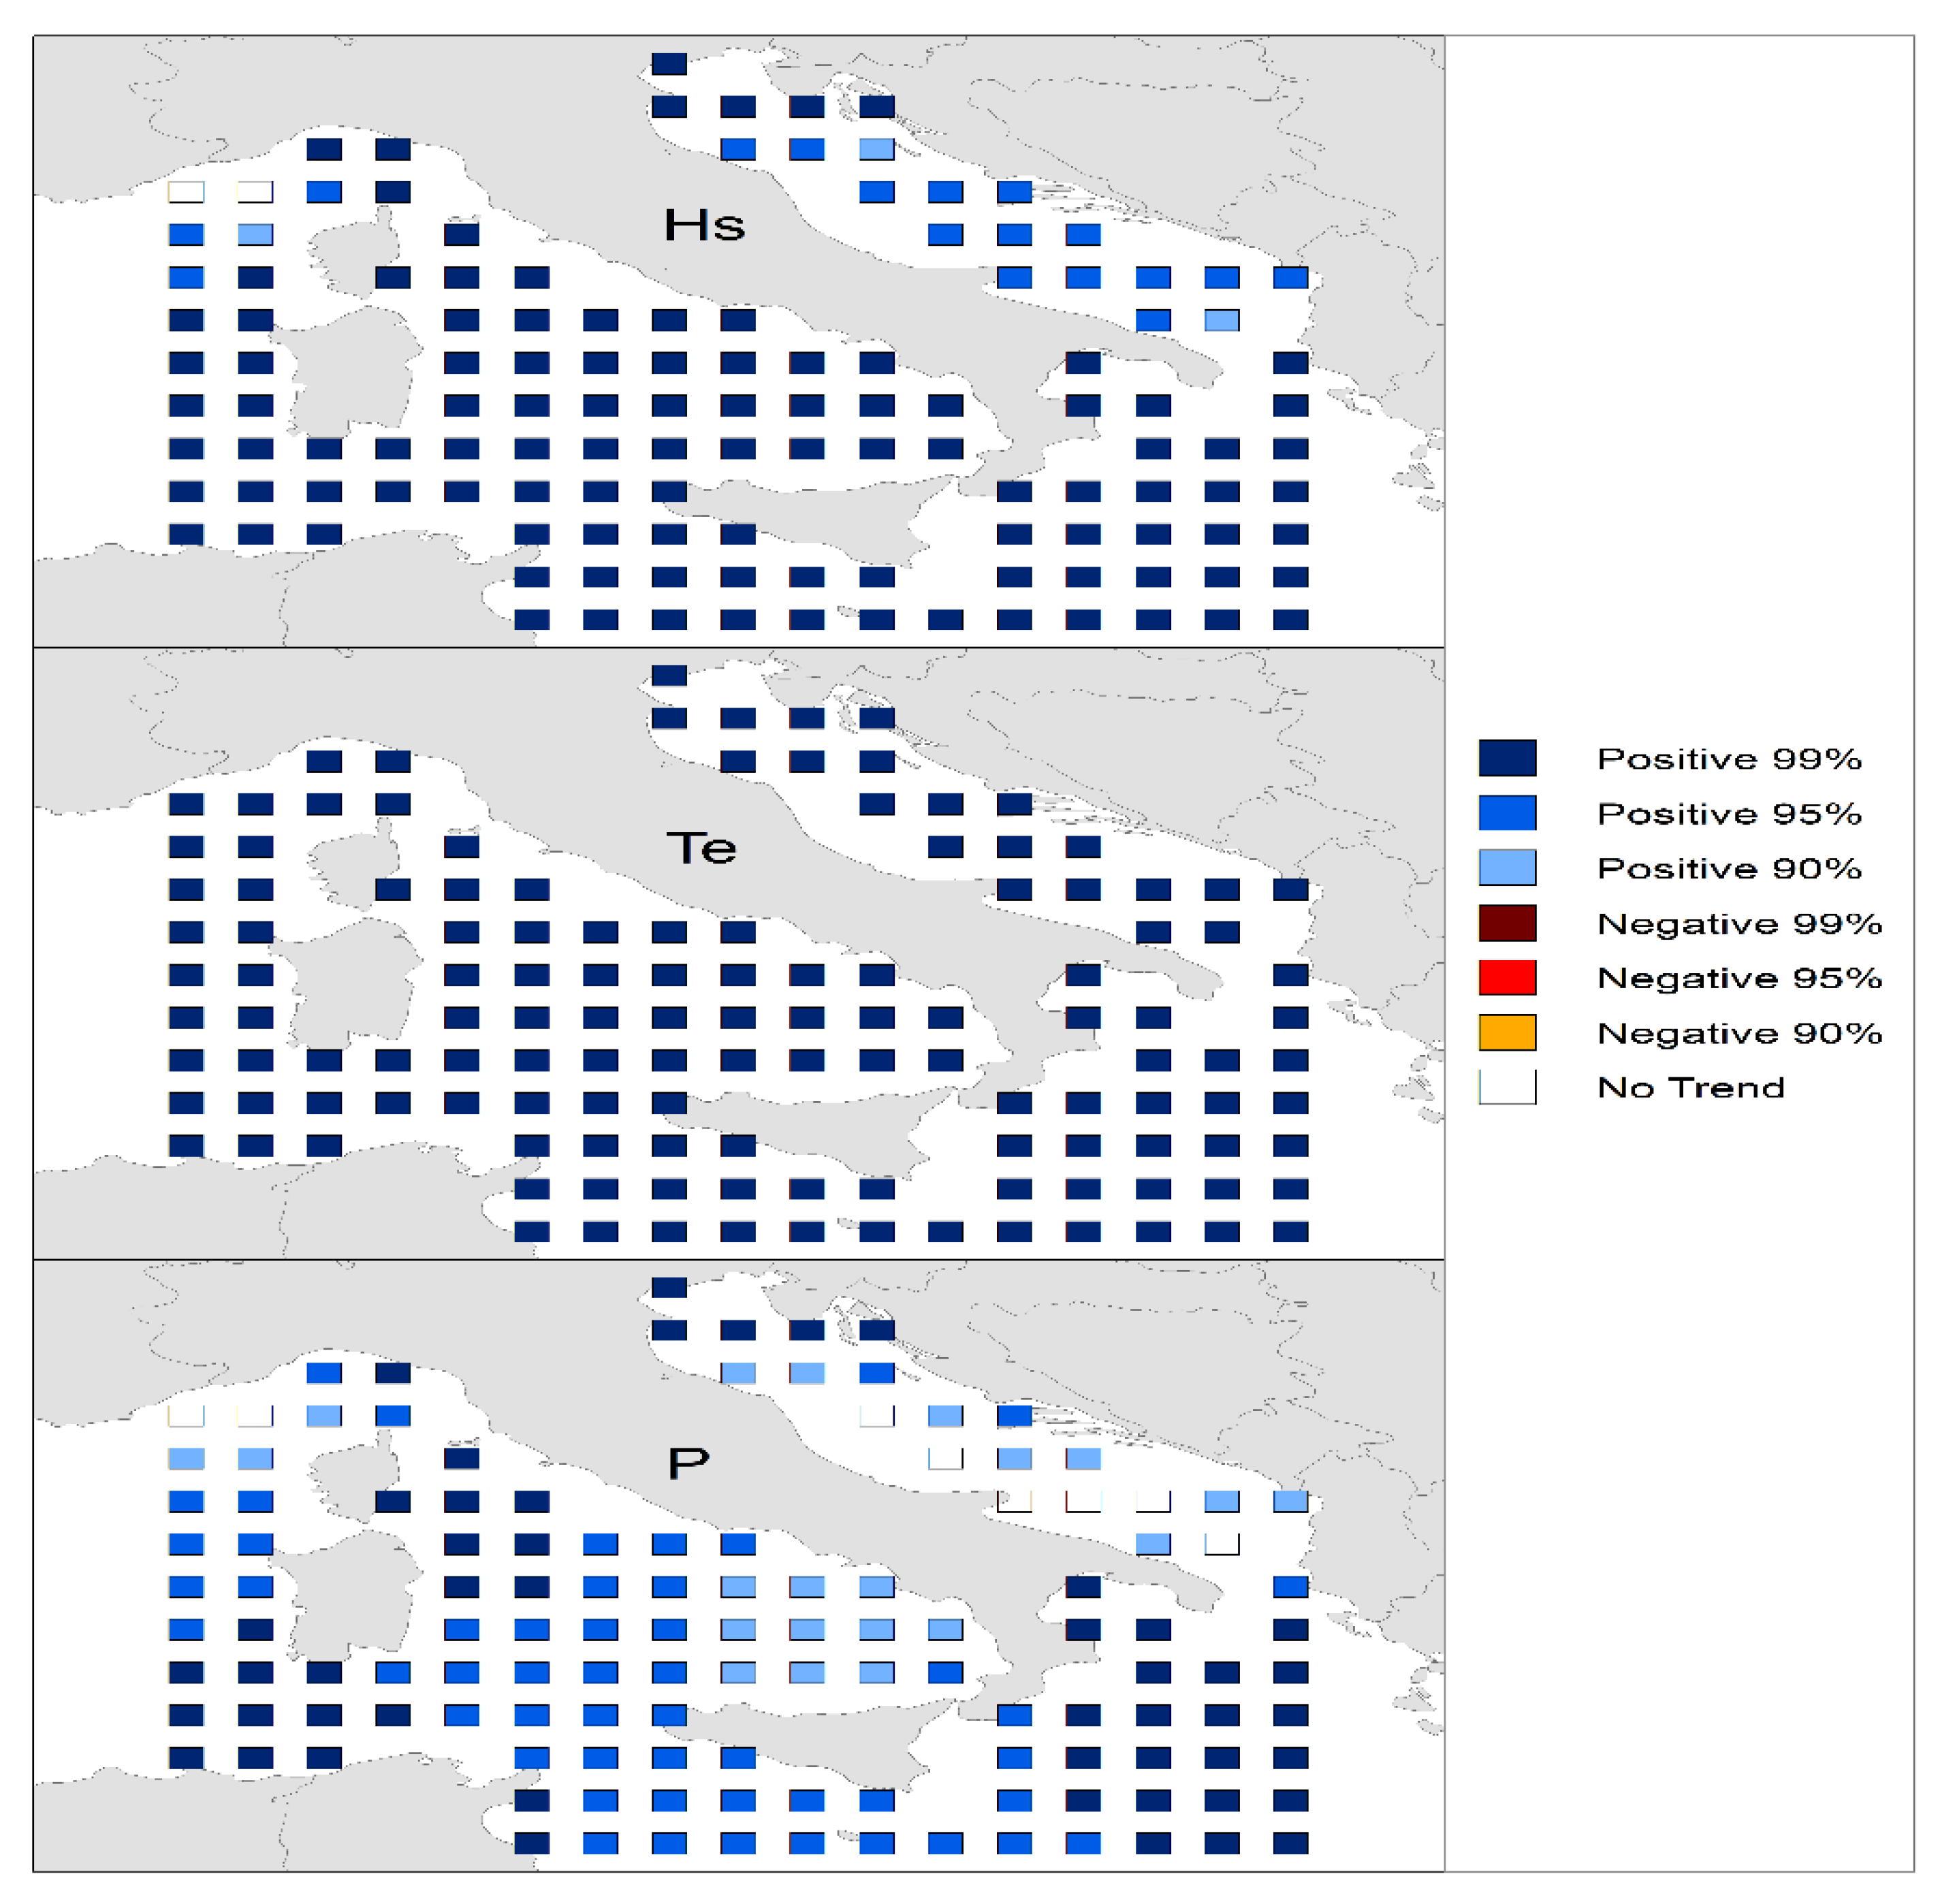
P off the Italian coasts are analyzed. Concerning the mean annual values of
Hs,
Figure 1 shows the results obtained by the application of the Mann–Kendall test. A relevant number of positive trends for
Hs with a significance level of 99% can be noted. These values are located in the Tyrrhenian and Ionian Seas, close to the islands of Sardinia and Sicily and in the northern zone of the Adriatic Sea. Positive trends with a lower significance level (i.e., 90% and 95%) have been observed in the central and southern parts of the Adriatic Sea, and between Sardinia and the Ligurian Sea. Null trends have been detected for two nodes close the Ligurian Sea. With regard to
Te, positive trends with a significance level of 99% have been detected in all the areas of the Italian Seas (
Figure 1). Regarding the last wave parameter involved, i.e.,
P, which depends on
Hs and
Te, the trend analysis shows a significant variability off the Italian coasts (
Figure 1). Indeed, positive trends with a significance level of 99% can be substantially noted in the Ionian Sea, in the northern zones of the Tyrrhenian and Adriatic Seas and in the southern part of Sardinia. Positive trends with significance levels of 90% and 95% refer to some parts of the central and southern areas of the Adriatic Sea, the majority of the Tyrrhenian Sea and close to the islands of Sicily and Sardinia. Null trends of
P have been detected near the Ligurian Sea and along the Adriatic Sea.
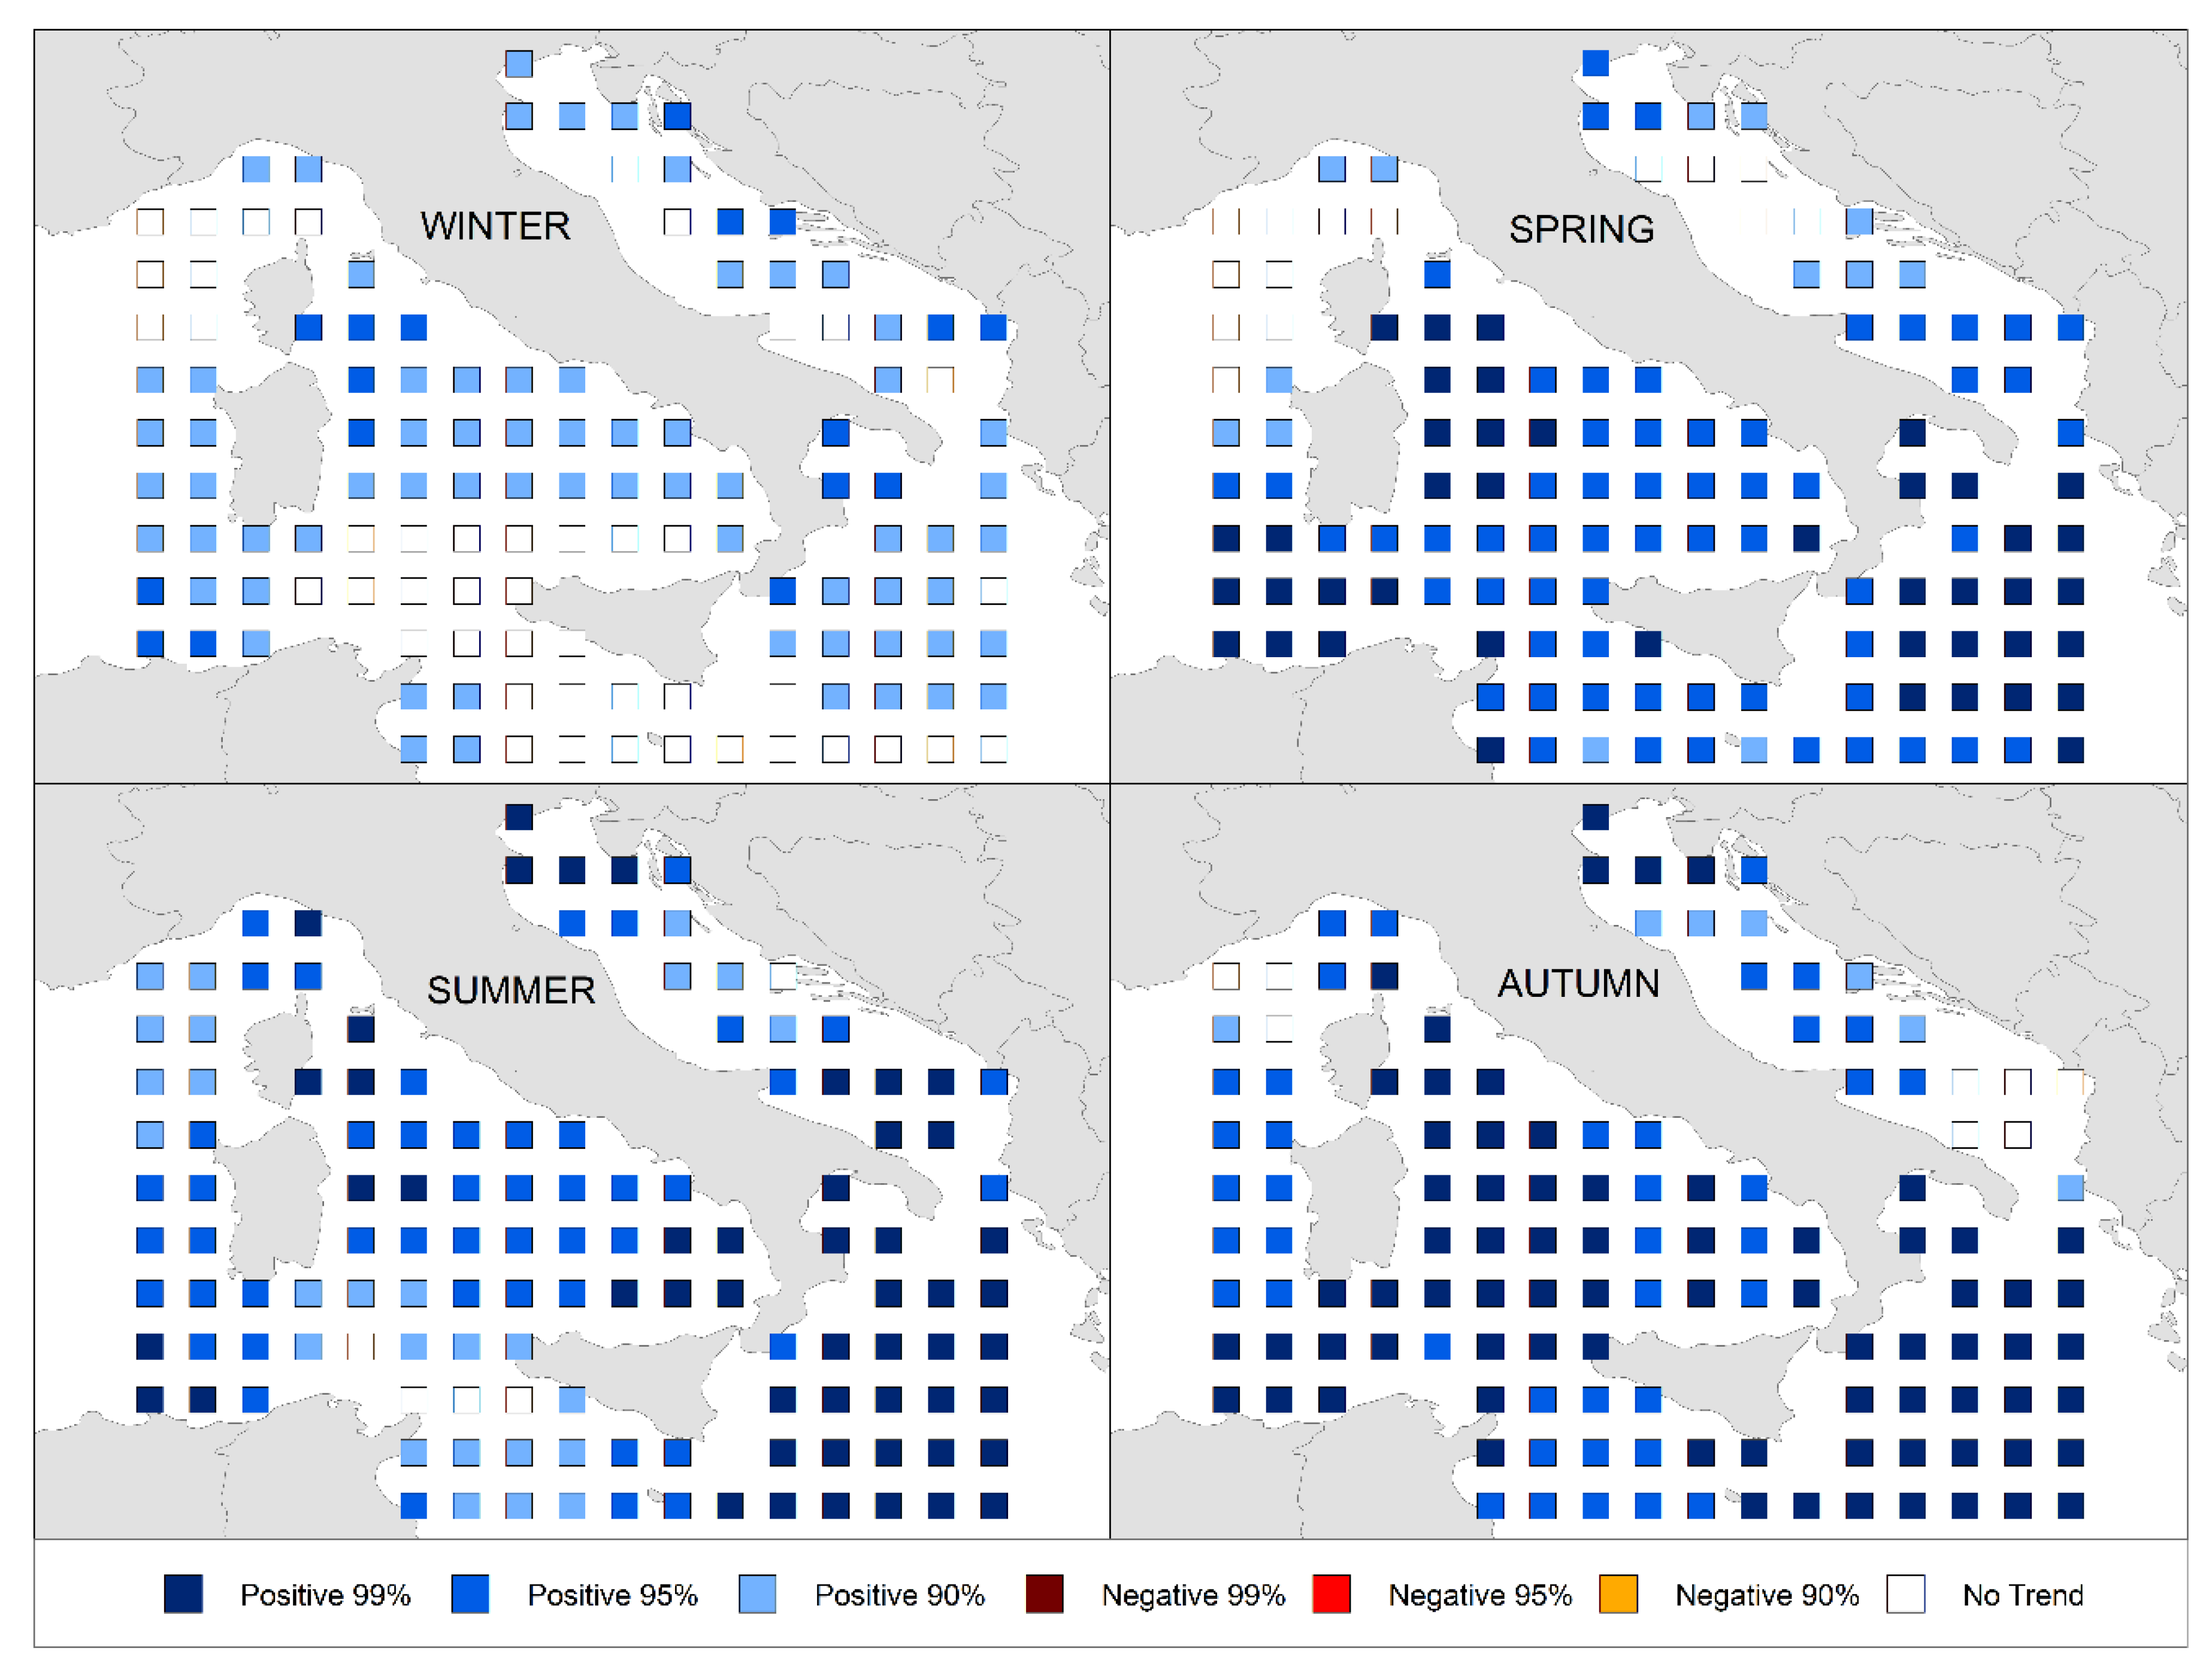
On the basis of the application of the Mann–Kendall test,
Figure 2 describes the spatial distribution of the mean seasonal trend of
Hs in the Italian Seas. First, considerable variability in the four seasons can be observed. In winter (
Figure 2), positive trends for
Hs reach a maximum significance level of 95%, detected for few nodes located in the Adriatic, Ionian and Tyrrhenian Seas and close to the southern part of Sardinia. Instead, more diffused nodes with trends have a significance level of 90%. No trends have been observed in the Ligurian Sea, in the southern zone of the Tyrrhenian and Ionian Seas, close to Sicily or along the Adriatic Sea. During spring (
Figure 2), positive trends of
Hs with a significance level of 99% are principally concentrated in the whole of the Ionian Sea, in the northern area of the Tyrrhenian Sea and between Sardinia and Sicily. The majority of the wave nodes in spring have a positive trend with a significance level of 95%. In particular, they are placed in the central and southern parts of the Tyrrhenian Sea, in the southern area of the Adriatic Sea and near Sicily. No trends have been observed near the Ligurian Sea or the northern part of the Adriatic Sea. Regarding summer (
Figure 2), positive trends of
Hs with a significance level of 99% have been substantially detected in the Ionian Sea and in some nodes of the Tyrrhenian and Adriatic Seas. Positive trends with a lower significance level have been mainly detected in the other areas of the Italian Seas. In this season, null trends have been observed close the Strait of Sicily. During autumn (
Figure 2), the majority of the wave nodes show positive trends for
Hs, with a significance level of 99%, in particular in the Ionian and Tyrrhenian Seas. Positive trends with lower significance levels have been detected close to Sicily and Sardinia and along the Adriatic Sea. No trends occur near the Ligurian Sea and in the southern part of the Adriatic Sea.
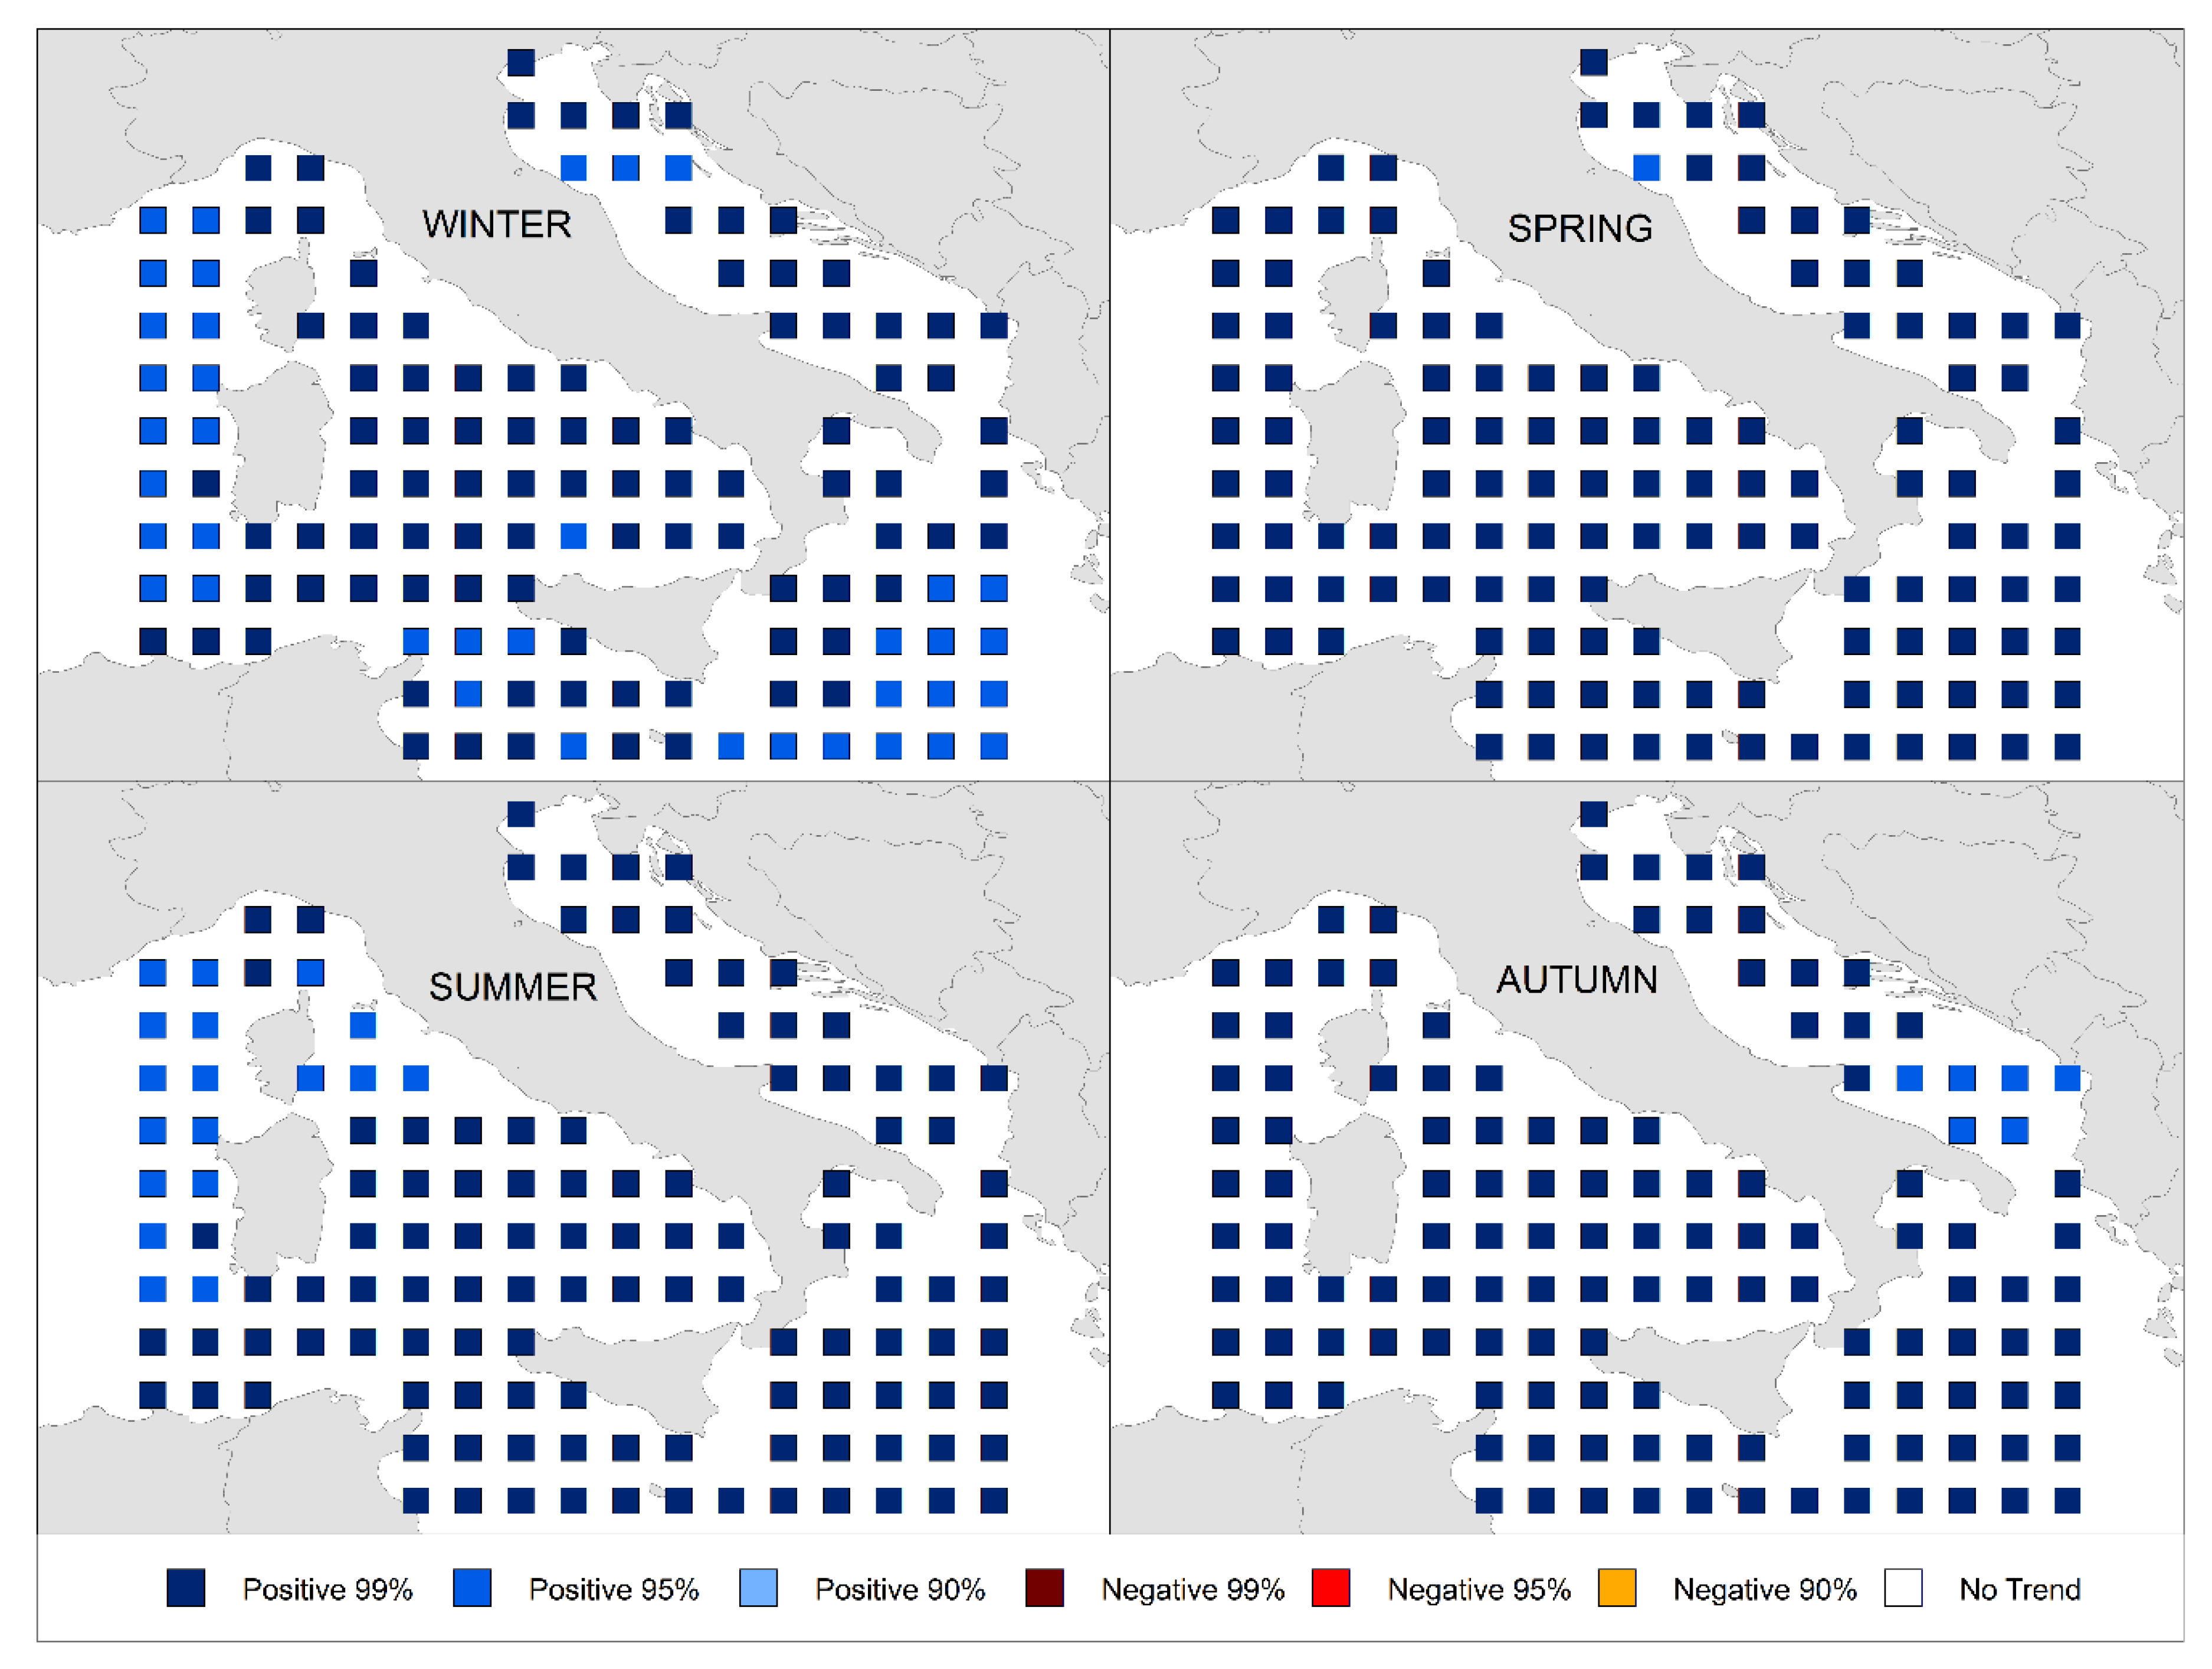
Figure 3 highlights the spatial distribution of the seasonal trend of the mean values of
Te in the Italian Seas. Compared to
Hs, a different feature regarding the magnitude of the positive trends for the involved wave parameter is evident. Indeed, most of the wave nodes show marked positive trends for
Te, with a maximum significance level equal to 99% in every season. This is particularly clear during spring (
Figure 3) and autumn (
Figure 3). Additionally, the remaining nodes highlight a positive seasonal trend with a significance level of 95%. During winter (
Figure 3), positive trends for
Te with a significance level of 95% appear in the southern part of the Ionian Sea and close to Sardinia and Sicily. In spring (
Figure 3), just one wave node located in the Adriatic Sea shows a positive trend with a significance level of 95%. During summer (
Figure 3), these trends have been detected only in the northern area of the Tyrrhenian Sea and in the western part of Sardinia. With regard to autumn (
Figure 3), few nodes with positive trends with a significance level of 95% have been observed in the southern part of the Adriatic Sea.
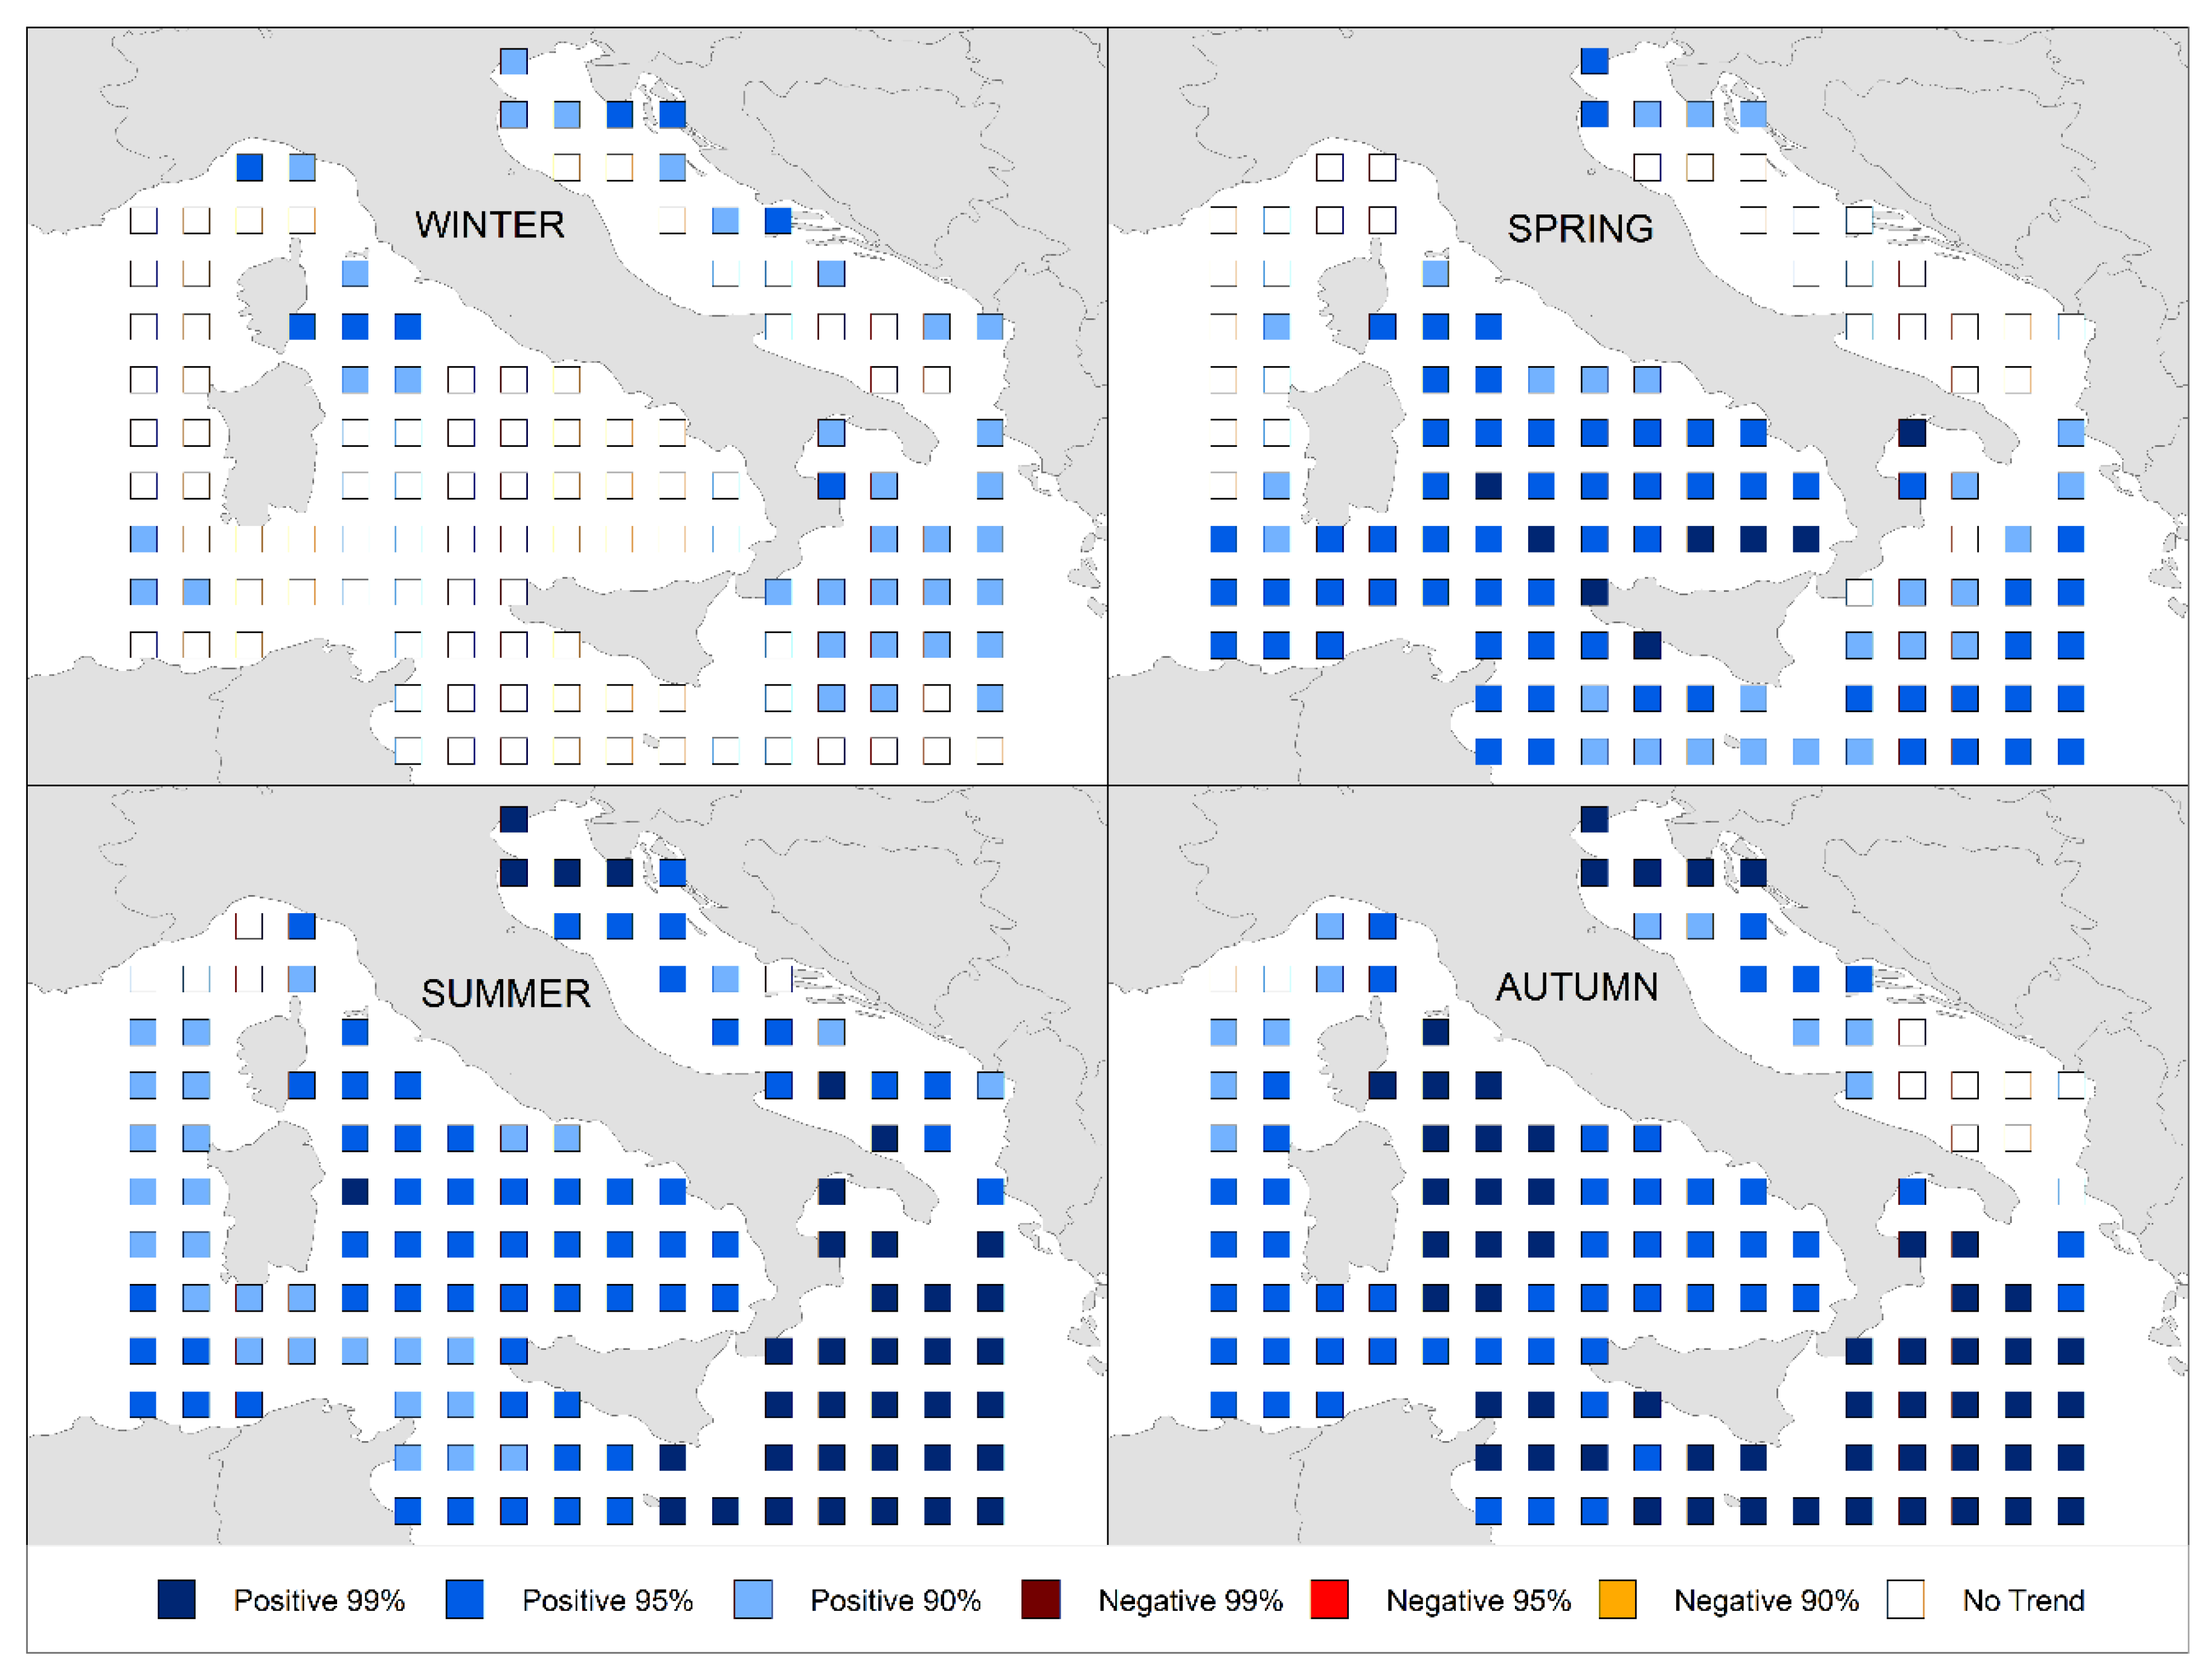
A seasonal trend analysis has been also performed on
P and results are shown in
Figure 4. In this case, as in the case of
Hs, a strong variability for the trends during the four seasons occurs. Indeed, a combination of positive and null trends for
P appears. In winter (
Figure 4), the majority of the wave nodes show a null trend, with the exception of some nodes located especially in the Ionian Sea, where positive trends with a significance level of 90% have been observed. During spring (
Figure 4), a significant rate of the wave nodes highlights a positive trend with significance levels of 90% and 95%. These nodes are mainly concentrated in the Tyrrhenian and Ionian Seas. A few nodes located in the southern part of the Tyrrhenian Sea show a positive trend with a significance level of 99%. No trends in this season have been detected in the Adriatic and the Ligurian Seas or in the western part of the Sardinia. During summer (
Figure 4), a remarkable positive trend with a significance level equal to 99% has been detected in the Ionian Sea and in the northern area of the Adriatic Sea. The other areas of the Italian Seas highlight positive trends with a lower significance level. Null trends have been detected in the Ligurian Sea. For the last involved season, i.e., autumn (
Figure 4), the spatial distribution of the trends is similar to summer. Indeed, positive trends with a significance level of 99% occur in the same seas, with the addition of the western part of the Tyrrhenian Sea. Positive trends with a lower significance level have been principally detected in the eastern part of the Tyrrhenian Sea, in the central part of the Adriatic Sea and close to Sardinia. The majority of null trends have been observed in the southern part of the Adriatic Sea.
5. Conclusions
A statistical trend analysis of the mean annual and seasonal values of significant wave energy, energy period and wave power has been performed in the Italian Seas. For this purpose, a 40-year-long time series of waves deduced from the global atmospheric reanalysis ERA-INTERIM by the ECMWF has been considered. The Mann–Kendall non-parametric test has been used to identify possible trends.
Regarding the statistical results at an annual scale, the majority of the wave nodes involved highlight positive trends with a significance level of 99% for Hs. When Te is considered, all wave nodes show positive trends with a significance level of 99%. Regarding P, this quantity shows the highest spatial variability in the Italian Seas. In any case, positive trends with different significance levels have been detected, with the exception of the Ligurian Sea and along the Adriatic Sea, where null trends appear.
Concerning the seasonal trend analysis applied to the Italian Seas, a higher percentage of variability has been observed if compared to the annual analysis, particularly for Hs and P. Specifically, in the Ionian Sea, positive trends with high significance levels have been detected for the three variables involved. It has also been observed that positive trends occur in most of the other seas and, especially, in the Tyrrhenian Sea. The autumn season highlights the highest percentage of positive trends with a significance level equal to 99%, while winter represents the season with the highest frequency of null trends.
The obtained results, if confirmed in the future, could have significant impacts on the morphodynamic evolution of the coasts, with a possible increase in erosion phenomena. Furthermore, the general increase in wave power could be useful to identify possible locations of marine sites for the installation of WECs for electricity purposes.
Further analyses will be dedicated to identifying possible annual and seasonal trends linked to extreme values of Hs, Te and P, and how they influence the magnitude of the design waves.


