Current and Economic Price of Water in Serbia †

Jaroslav Černi Water Institute, 11226 Belgrade, Serbia
*
Author to whom correspondence should be addressed.
†
Presented at the 4th EWaS International Conference: Valuing the Water, Carbon, Ecological Footprints of Human Activities, Online, 24–27 June 2020.
Environ. Sci. Proc. 2020, 2(1), 45; https://0-doi-org.brum.beds.ac.uk/10.3390/environsciproc2020002045
Published: 3 September 2020
(This article belongs to the Proceedings of The 4th EWaS International Conference: Valuing the Water, Carbon, Ecological Footprints of Human Activities)
Abstract
:In the context of this paper, the term “price of water” refers to the charges for drinking water supply and sewage services. The current price of water in Serbia is generally set at an affordable level and does not reflect the real costs. It varies from approximately 0.4 €/m3 in smaller settlements of less developed regions of the country, to approximately 1.0 €/m3 in some cities of more developed regions. Lower prices in some cases are the result of fact that these settlements do not provide sewage services (SS). The average price of water in the country is currently about 0.7 €/m3. This paper presents the current and economic price of water in Serbia, and its structure, from a sample of 34 public utility companies (PUC), which perform water supply (WSS) and sewerage services (SS).
1. Introduction
More intensive developments of water supply began in Serbia in the middle of the twentieth century. The number of users included in the public water supply system has increased over time, so that today it is around 85%. Total specific consumption also increased, from about 50–100 L per user per day in the 1950s to 3–4 times that value 50 years later, when it stabilized [1]. Today, the average total specific consumption is about 300 L per user per day, but there are significant differences from system to system, whereas just under 50% of the water produced relates to household consumption, the losses are about 40%, and the rest is used by public institutions and industries.
At the beginning of the 21st century, in Serbia, without Kosovo and Metohija (K and M), an average of about 23 m3/s of water (about 730 million m3/year) was abstracted annually for public water supply systems. This quantity has been gradually decreasing over the last 15 years, partly due to lower levels of economic activity, partially due to demographic decline, and today amounts to about 21 m3/s of water (about 660 million m3/year) [2]. This is illustrated by indicators for 2014, for which Table 1 shows the abstracted quantities of water and gives an approximate number of inhabitants and users of water supply and sewerage, as well as specific consumption. The results are divided into northern Serbia (Vojvodina region); population about 1.9 mil., Belgrade; about 1.6 mil. and central Serbia; about 3.6 mil. inhabitants. The reason for the division into these three sections is that Belgrade’s water supply and sewerage system is by far the largest in the country, and Vojvodina is a lowland area with lower losses and a slightly lower average specific consumption than the rest of the country. Sewerage infrastructure in this region is least developed.
As the topic of this paper is the price of drinking water in Serbia, Table 1 gives only basic indicators of utility systems operations, while other aspects of water supply will not be mentioned (types of sources, water quality, types of treatment, characteristics of distribution systems, etc.).
Water services systems, particularly drinking water supply, were in a good condition in the beginning of 1990s due to quite high investments in water sector at that time. Today, average price of drinking water in Serbia is about 0.7 €/m3, and barely covers operational and to some extent maintenance (O and M) costs of public utility companies (PUC). In the last 30 years only high priority investments have occurred. water supply (WSS) and sewerage services (SS) degradation that occurred mainly due to the lack of funding. Such a situation makes the sustainability of these systems impossible. Therefore, there is a need for the alignment of price of water with real costs.
2. Current Price of Water in Serbia
Generally, three types of consumers connected to water supply systems (WSS) are recognized: households, public institutions (schools, hospitals, culture centres, etc.), and industrial consumers. In the majority of cases, the prices of water for household and public institutions are the same, while price for industry is significantly higher. On average, 80% of water is delivered to households and public institutions, while about 20% of water is delivered to industrial consumers. So, overall price has been calculated as a sum of the price for households (WSS + SS) multiplied by 0.8 and the price for industry (WSS + SS) multiplied by 0.2. The current rate is 117.5 dinars for 1 euro.
Table 2 presents the current prices in 34 Public utility companies (PUC), split across Belgrade (1), Vojvodina (12) and central Serbia (21 PUCs). The prices are from 2018, but in the of majority cases, current prices are the same.
As can be seen from Table 2, current prices are low, and they cannot cover all the needs of one PUC (WSS + SS).
3. Economic Price of Water in Serbia—Methodology
In the context of a municipal water system, the concept of the economic price (EP) of water covers all necessary costs of the WSS and SS operation and maintenance, all depreciation and planned WSS development expenses, all depreciation and planned SS development expenses, as well as expenses related to state fees for the development of the facilities of significant public importance. The economic price also includes non-realization of profits made from the sale of services provided by the PUCs. In order to respond to the task, it has been necessary to process adequate sample data, comprised of enough public utility systems from all parts of Serbia.
The economic price of water can be divided into 6 parts:
- A.
- Operational expenses,
- B.
- Waterworks depreciation expenses,
- C.
- Sewerage depreciation expenses,
- D.
- Water supply system development expenses,
- E.
- Sewerage system development expenses,
- F.
- Fees payable to the state for the development of facilities of public significance.
- A.
- Operational expenses comprise:
- Employees’ wages,
- Costs payable to third parties unrelated to the water supply or sewerage systems themselves (fuel, electricity, telephone, representation, external assistance in solving some problems, etc.),
- Renovation and re-organization of the fixed assets owned by the PUC,
- Modernization of the mechanization owned by the PUC.
- B.
- Waterworks depreciation expenses comprise (annual depreciation shown on Table 3):
- Depreciation of water source facilities,
- Depreciation of water treatment plants (WTPs),
- Depreciation of pump stations,
- Depreciation of reservoirs,
- Depreciation of pipelines,
- Depreciation of other water supply system facilities.
- C.
- Sewerage depreciation expenses comprise (annual depreciation shown on Table 3):
- Depreciation of wastewater treatment plants (WWTPs),
- Depreciation of pump stations,
- Depreciation of main sewers,
- Depreciation of other sewerage facilities.
- D.
- Water supply system development expenses are the costs of adding new elements to the water supply system over the course of the next 15 years. The following are principles for determining the development level have been determined:
- Investment in the treatment plant development at the municipal level equals the WTP’s investment value of the municipality’s central water supply system. Central municipal WSS which need a water treatment device yet do not have one, will have one built over the stated time period. Other, smaller local municipal systems will, if needed, have one built later. Those central municipal water supply systems already equipped with WTPs for drinking water, will start the development process,
- Investment in the development of water sources and of distribution systems at the municipal level are based on the current WSS value, as well as on the percentage of the population that is connected to the system, proportionally up to a connectivity of 95%,
- Total development of WSS at the municipal level is equal to the sum of investments planned for the WTP, the water source and the distribution network. The distribution of investments within the municipality by built-up areas is proportional to each area’s population,
- The investments are to be repaid through the price of water over a time period of 15 years.
- E.
- Sewerage system development expenses are the costs of SS adding new elements to the SS over the course of the next 15 years. The following principles for determining the development level have been determined:
- Investment in SS development is based on the same principles applied to WSS, with the difference being that the central municipal SS already equipped with WWTPs are to begin developing WWTPs in smaller scale built-up areas, equal to the half of the value of the given central municipal system’s WWTP. Another difference is that the sewerage connectivity agreed upon for the near future, amounts to up to 90% (as opposed to 95% in the case of the WSS).
- F.
- All above parts of economic price of water (A - E) are related and covered on the municipality level. But, the need for fees payable to the state for the development of the facilities of a regional or public significance also exist. There is a prescribed percentage (nowadays, 50% in most cases) subsidized by the state, when it comes to constructing water source facilities, plants and main supply pipes. The state also funds the construction of common use facilities, such as regional WSS and SS, and the development of important studies and designs pertinent to the subject area. The Study has defined that these fees should be the same for all the systems in Serbia (approx. between 0.15 and 0.20 €/m3).
Other notes and defined principles necessary for understanding the Study:
- ➢
- As a means of loss reduction, a realistic limit has been set for the reduction of the unbilled portion at 25% of the total water production. Hence, the amount of water which determines its economic price, is 75% of the total water production in the given WSS.
- ➢
- Investments are determined by considering standard principles and specific prices applied in Serbia for these purposes [3].
4. Economic Price of Water in Serbia—Results
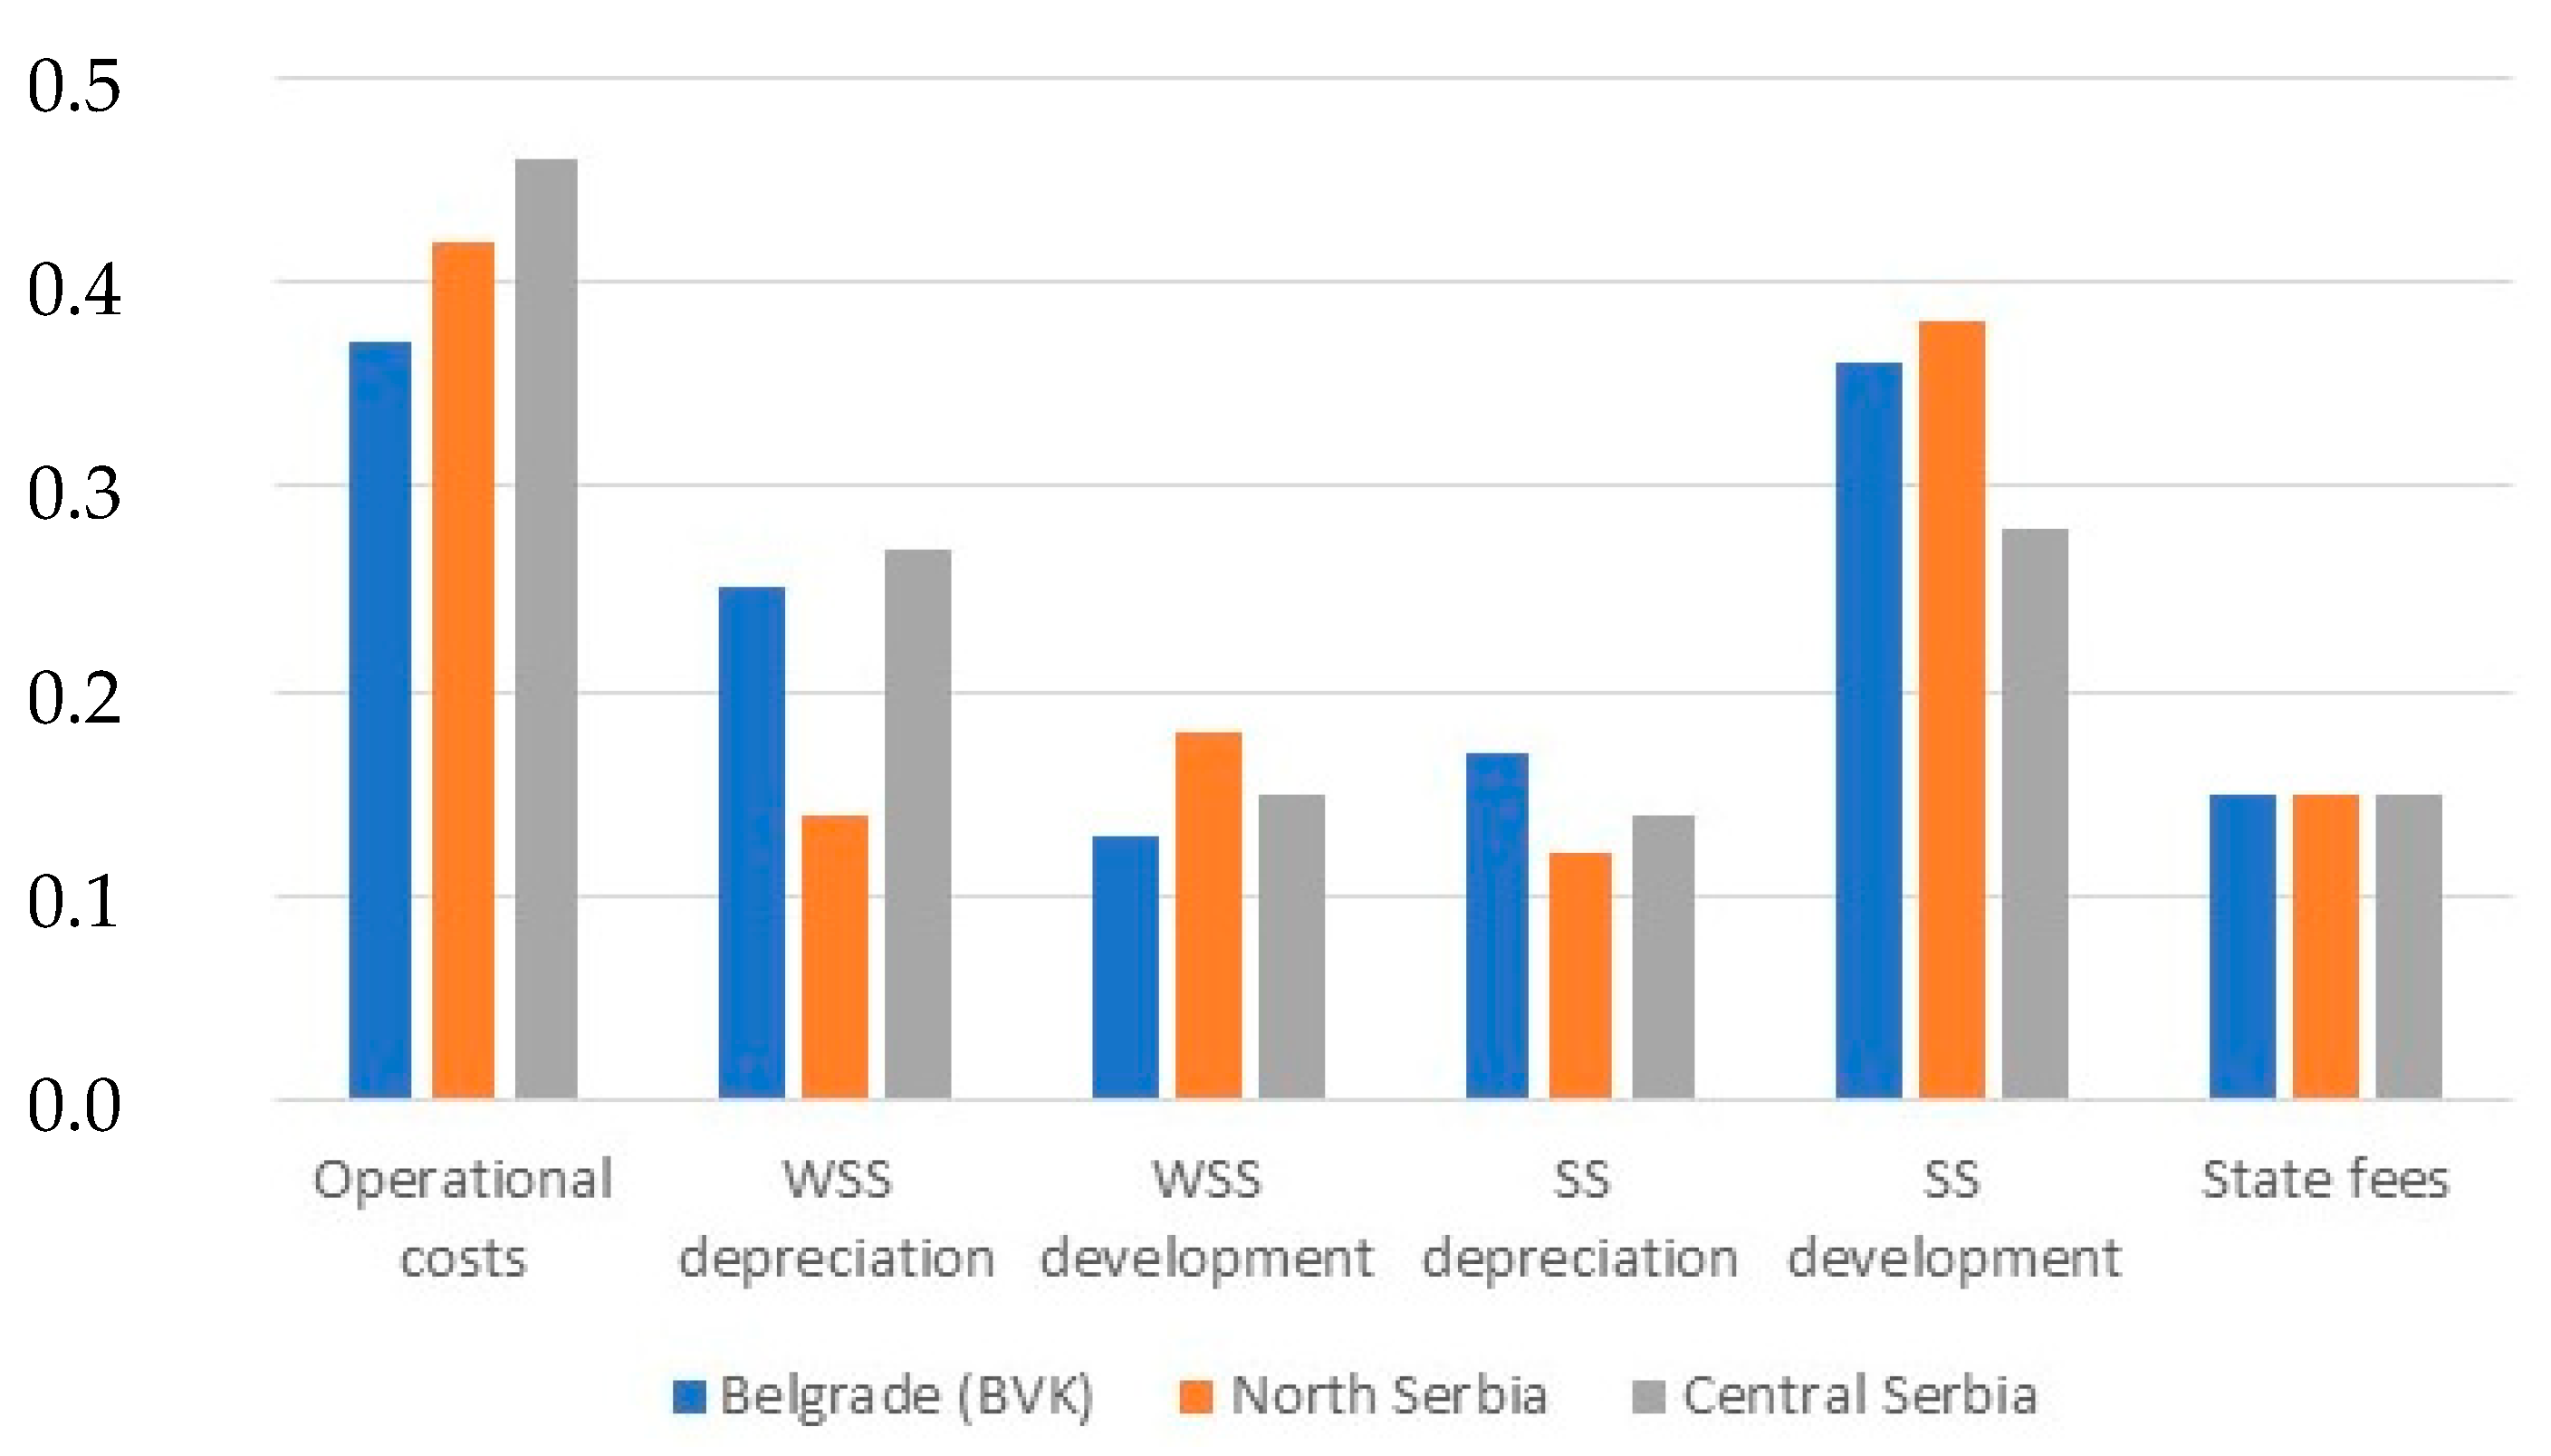
Table 4 presents EP for the same 34 PUCs as in Section 2, split across Belgrade (1), Vojvodina (12) and central Serbia (21). Prices are without Value Added Tax (VAT). The displayed calculations for each PUC should be accepted with an accuracy of ± 10%, as they have been performed for the purpose of the global Study. The estimated mean economic price of drinking water by categories in Belgrade, North Serbia and Central Serbia (€/m3) are shown in Figure 1.
5. Discussion and Conclusions
It could be seen that current overall prices vary from 0.39 €/m3 in Plandište to 1.13 €/m3 in Sombor, with a country average of about 0.7 €/m3. The average current price in central Serbia (0.64 €/m3) is slightly lower than in the rest of the country, probably due to the slightly lower standard.
The EP for operational costs is, in the majority of PUCs, between 0.3 €/m3 and 0.5 €/m3.
The average EP for WSS for the depreciation part (approx. 0.2 €/m3) is slightly higher than the development part of EP (approx. 0.15 €/m3), while for the SS it is quite the opposite (approx. 0.15 €/m3 for the depreciation part and approx. 0.35 €/m3 for the development part). It is logical and also a consequence of the percentage makeup of these systems—Table 1 (WSS 85%, SS 55%) and especially due to the low number of built wastewater treatment plants. It should be said that the WSS depreciation is higher in central Serbia primarily due to the existence of dams in some WSS (Aranđelovac, Zaječar, Užice and Čajetina from the list).
The average EP in Vojvodina (1.39 €/m3) is slightly lower than in the rest of the country (PUC Belgrade 1.45 €/m3 and PUCs in central Serbia 1.44 €/m3). One of the main reasons is the terrain configuration in the north of the country (plain). The difference would be greater if the coverage with SS in this part of the country was higher (just 34% now).
State fees, which should cover national important regional studies, designs and jobs (such as regional water supply systems) should be the same for all PUCs and has been defined at a level between 0.15 and 0.20 €/m3.
Author Contributions
The author (D.D.) and first Co-Author (M.M.) have written the whole paper, second (M.D.) and third co-authors (S.M.) have checked the paper and have given relevant data. All authors have read and agree to the published version of the manuscript.
Funding
This research received no external funding.
Conflicts of Interest
The authors declare no conflict of interest.
References
- Jaroslav Černi Water Institute. Water Management Master Plan of Serbia, Belgrade, 2001. Available online: http://www.srbijavode.rs/Data/Files/vodoprivredna_osnova_republike_srbije.pdf (accessed on 16 January 2020).
- Statistical Office of the Republic of Serbia. Eco-Bulletin 2018, Belgrade, 2019. Available online: https://publikacije.stat.gov.rs/G2019/Pdf/G20195651.pdf (accessed on 16 January 2020).
- Jaroslav Černi Water Institute; Economic Institute of Serbia. Instruments for the Development of Water Sector; Jaroslav Černi Water Institute: Belgrade, Serbia; Economic Institute of Serbia: Belgrade, Serbia, 2006. (In Serbian) [Google Scholar]
- National document: Strategy for Water Management in the Republic of Serbia up to 2034, 2017, Of. Gaz. of the RS, 3/2017. Available online: https://www.znrfak.ni.ac.rs/serbian/010-STUDIJE/MAS/PREDMETI/UKS/I%20GODINA/116-VODOSNABDEVANJE%20I%20KANALISANJE%20VODA/DINAMICKI%20PLAN/Literatura%20ViKV%202020.pdf (accessed on 3 September 2020).
- Dimkić, M.; Milovanović, M.; Dimkić, D. Sustainable and Adaptive Water Management: Case Study of Water Management in Serbia. Water Res. Manag. 2011, 1, 9–19. [Google Scholar]
- Kanakoudis, V.; Gonelas, K.; Tolikas, D. Basic principles for urban water value assessment and price setting towards its full cost recovery—Pinpointing the role of the water losses, Water Supply Res. Technol. AQUA 2011, 60, 27–39. [Google Scholar] [CrossRef]
- Griffin, R. Effective water pricing. J. AWWA 2011, 37, 1335–1347. [Google Scholar] [CrossRef]
- Ward, F.A.; Velazquez, M.P. Incentive pricing and cost recovery at the basin scale. J. Env. Manag. 2009, 90, 293–313. [Google Scholar] [CrossRef] [PubMed]
Figure 1.
Estimated mean economic price of drinking water by categories in three main parts of Serbia (€/m3).
Figure 1.
Estimated mean economic price of drinking water by categories in three main parts of Serbia (€/m3).


Table 1.
Number of inhabitants, % and number of users of water supply (WSS) and sewerage services (SS), produced water and specific drinking water consumption in 2014 in Serbia by regions.
Table 1.
Number of inhabitants, % and number of users of water supply (WSS) and sewerage services (SS), produced water and specific drinking water consumption in 2014 in Serbia by regions.
| Region | Number of Inhabitants, % and Number of Users of WSS and SS | Produced in 2014 | Specific Total Drinking Water Consumption | |||||
|---|---|---|---|---|---|---|---|---|
| Inhab. | WSS | SS | ||||||
| 106 | % | 106 | % | 106 | m3/s | 106 m3/Year | L/WSS User/Day | |
| Vojvodina | 1.9 | 93 | 1.8 | 34 | 0.6 | 5.3 | 166 | 257 |
| Belgrade | 1.6 | 96 | 1.5 | 90 | 1.4 | 5.7 | 180 | 321 |
| Central Serbia | 3.6 | 75 | 2.7 | 50 | 1.8 | 9.9 | 312 | 317 |
| Whole Serbia without K and M | 7.1 | 85 | 6.0 | 55 | 3.9 | 20.9 | 658 | 300 |
Table 2.
Current prices in the sample of 34 Public utility companies (PUC) in Serbia.
| Name of the PUC | WSS Price (din/m3) | SS Price (din/m3) | Overall Price | Overall Price | |||
|---|---|---|---|---|---|---|---|
| House. | Ind. | House. | Ind. | (din/m3) | (€/m3) | ||
| 1 | Belgrade (BVK) | 51.48 | 85.19 | 20.81 | 45.84 | 84.0 | 0.72 |
| NORTH SERBIA (Region Vojvodina) | |||||||
| 1 | Zrenjanin | 29.36 | 65.77 | 30.03 | 62.34 | 73.1 | 0.62 |
| 2 | Sombor | 58.87 | 92.46 | 62.55 | 87.59 | 133.1 | 1.13 |
| 3 | Vrbas | 54.76 | 81.80 | 30.30 | 40.90 | 92.6 | 0.79 |
| 4 | Plandište | 30.61 | 30.61 | 15.31 | 15.31 | 45.9 | 0.39 |
| 5 | Srem. Mitrovica | 49.70 | 71.30 | 24.80 | 37.00 | 81.3 | 0.69 |
| 6 | Bačka Topola | 46.63 | 144.11 | 23.32 | 70.31 | 98.8 | 0.84 |
| 7 | Subotica | 47.00 | 47.00 | 30.00 | 30.00 | 77.0 | 0.66 |
| 8 | Kikinda | 47.12 | 110.00 | 41.62 | 107.00 | 114.4 | 0.97 |
| 9 | Bela Crkva | 37.70 | 114.21 | 18.87 | 58.72 | 79.8 | 0.68 |
| 10 | Odžaci | 54.89 | 125.54 | 27.45 | 62.76 | 103.5 | 0.88 |
| 11 | Bečej | 44.00 | 83.00 | 17.00 | 30.00 | 71.4 | 0.61 |
| 12 | Inđija | 48.00 | 88.00 | 18.00 | 30.00 | 76.4 | 0.65 |
| Vojvodina averages | 45.72 | 87.82 | 28.27 | 52.66 | 87.28 | 0.74 | |
| CENTRAL SERBIA | |||||||
| 1 | Bor | 52.82 | 144.72 | 52.92 | 31.72 | 119.9 | 1.02 |
| 2 | Požega | 57.15 | 98.94 | 14.28 | 25.54 | 82.0 | 0.70 |
| 3 | Knjaževac | 59.40 | 75.00 | 17.60 | 25.90 | 81.8 | 0.70 |
| 4 | Despotovac | 45.56 | 91.12 | 11.37 | 30.36 | 69.8 | 0.59 |
| 5 | Koceljeva | 42.10 | 86.32 | 9.38 | 12.49 | 60.9 | 0.52 |
| 6 | Aranđelovac | 56.85 | 115.07 | 12.22 | 32.26 | 84.7 | 0.72 |
| 7 | Obrenovac | 69.81 | 187.41 | 19.70 | 65.12 | 122.1 | 1.04 |
| 8 | Mladenovac | 53.00 | 105.19 | 12.17 | 39.98 | 81.2 | 0.69 |
| 9 | Ljig | 50.75 | 93.69 | 9.00 | 38.73 | 74.3 | 0.63 |
| 10 | Knić | 40.67 | 82.98 | 5.57 | 18.54 | 57.3 | 0.49 |
| 11 | Svilajnac | 53.22 | 105.50 | 25.99 | 51.60 | 94.8 | 0.81 |
| 12 | Zaječar | 60.00 | 105.00 | 23.00 | 31.50 | 93.7 | 0.80 |
| 13 | Užice | 50.33 | 100.66 | 12.58 | 25.16 | 75.5 | 0.64 |
| 14 | Čajetina | 42.50 | 77.40 | 12.50 | 20.40 | 63.6 | 0.54 |
| 15 | Ražanj | 50.00 | 100.00 | 10.00 | 30.00 | 74.0 | 0.63 |
| 16 | Svrljig | 24.61 | 64.88 | 9.61 | 20.69 | 44.5 | 0.38 |
| 17 | Bela Palanka | 44.00 | 108.00 | 12.00 | 36.00 | 73.6 | 0.63 |
| 18 | Dimitrovgrad | 30.00 | 30.00 | 8.64 | 8.64 | 38.6 | 0.33 |
| 19 | Pirot | 48.48 | 24.24 | 12.05 | 6.03 | 54.5 | 0.46 |
| 20 | Bosilegrad | 36.36 | 123.60 | 14.54 | 36.00 | 72.6 | 0.62 |
| 21 | Vladičin Han | 42.60 | 101.20 | 12.60 | 23.00 | 69.0 | 0.59 |
| Central Serbia averages | 48.11 | 96.23 | 15.13 | 30.05 | 75.6 | 0.64 | |
Table 3.
Presents adopted annual depreciation rates for water supply (WS) and sewerage systems (SS).
Table 3.
Presents adopted annual depreciation rates for water supply (WS) and sewerage systems (SS).
| Part of PUC | Annual Depreciation (%) |
|---|---|
| Fixed Assets | 1.8 |
| Mechanization and miscellaneous equipment (cars, trucks and other vehicles, as well as other property of the PUC which is not included in fixed assets and does not comprise a part of the WS or SS) | 12.0 |
| Water Supply and Sewerage Systems | |
| Water Source | 3.0 |
| WTP & WWTP | 3.5 |
| Pump Stations (all) | 4.0 |
| Pipelines & Main Sewers | 2.0 |
| Reservoirs | 2.0 |
| Other Parts of Water Supply and Sewerage Systems | 3.0 |
Table 4.
Estimated economic price of drinking water in 34 PUCs all over Serbia.
| Name of the PUC | Operational Costs | Water Supply System | Sewage System | State Fees | Overall Economic Price | |||
|---|---|---|---|---|---|---|---|---|
| Depreciation | Development | Depreciation | Development | |||||
| (€/m3) | (€/m3) | (€/m3) | (€/m3) | (€/m3) | (€/m3) | (€/m3) | ||
| (1) | (2) | (4) | (3) | (5) | (6) | (7) = ∑(1÷6) | ||
| 1 | Belgrade (BVK) | 0.37 | 0.25 | 0.13 | 0.17 | 0.36 | 0.15 | 1.44 |
| NORTH SERBIA (Region Vojvodina) | ||||||||
| 1 | Zrenjanin | 0.41 | 0.10 | 0.27 | 0.10 | 0.34 | 0.15 | 1.37 |
| 2 | Sombor | 0.34 | 0.15 | 0.09 | 0.26 | 0.41 | 0.15 | 1.39 |
| 3 | Vrbas | 0.28 | 0.16 | 0.08 | 0.15 | 0.34 | 0.15 | 1.16 |
| 4 | Plandiste | 0.58 | 0.09 | 0.06 | 0.01 | 0.19 | 0.15 | 1.08 |
| 5 | Sr. Mitrovica | 0.19 | 0.06 | 0.09 | 0.06 | 0.51 | 0.15 | 1.06 |
| 6 | Backa Topola | 0.47 | 0.08 | 0.18 | 0.06 | 0.48 | 0.15 | 1.41 |
| 7 | Subotica | 0.45 | 0.16 | 0.18 | 0.29 | 0.40 | 0.15 | 1.64 |
| 8 | Kikinda | 0.34 | 0.12 | 0.31 | 0.20 | 0.59 | 0.15 | 1.71 |
| 9 | Bela Crkva | 0.42 | 0.24 | 0.23 | 0.06 | 0.20 | 0.15 | 1.29 |
| 10 | Odzaci | 0.48 | 0.13 | 0.25 | 0.06 | 0.23 | 0.15 | 1.30 |
| 11 | Becej | 0.41 | 0.19 | 0.15 | 0.23 | 0.56 | 0.15 | 1.69 |
| 12 | Indjija | 0.68 | 0.12 | 0.25 | 0.01 | 0.37 | 0.15 | 1.59 |
| Vojvodina averages | 0.42 | 0.14 | 0.18 | 0.12 | 0.38 | 0.15 | 1.39 | |
| CENTRAL SERBIA | ||||||||
| 1 | Bor | 0.47 | 0.28 | 0.12 | 0.03 | 0.13 | 0.15 | 1.19 |
| 2 | Požega | 0.31 | 0.16 | 0.22 | 0.10 | 0.18 | 0.15 | 1.12 |
| 3 | Knjaževac | 0.37 | 0.31 | 0.28 | 0.08 | 0.60 | 0.15 | 1.79 |
| 4 | Despotovac | 0.49 | 0.15 | 0.04 | 0.17 | 0.24 | 0.15 | 1.25 |
| 5 | Koceljeva | 0.29 | 0.17 | 0.19 | 0.10 | 0.32 | 0.15 | 1.22 |
| 6 | Aranđelovac | 0.42 | 0.92 | 0.48 | 0.10 | 0.57 | 0.15 | 2.65 |
| 7 | Obrenovac | 0.47 | 0.33 | 0.19 | 0.09 | 0.33 | 0.15 | 1.56 |
| 8 | Mladenovac | 0.89 | 0.21 | 0.27 | 0.05 | 0.25 | 0.15 | 1.81 |
| 9 | Ljig | 0.46 | 0.18 | 0.05 | 0.10 | 0.23 | 0.15 | 1.17 |
| 10 | Knić | 0.41 | 0.12 | 0.09 | 0.04 | 0.48 | 0.15 | 1.29 |
| 11 | Svilajnac | 0.37 | 0.15 | 0.23 | 0.35 | 0.43 | 0.15 | 1.69 |
| 12 | Zaječar | 0.59 | 0.50 | 0.41 | 0.05 | 0.24 | 0.15 | 1.93 |
| 13 | Užice | 0.29 | 0.75 | 0.05 | 0.12 | 0.12 | 0.15 | 1.47 |
| 14 | Čajetina | 0.45 | 0.41 | 0.06 | 0.05 | 0.12 | 0.15 | 1.25 |
| 15 | Ražanj | 0.89 | 0.31 | 0.09 | 0.07 | 0.34 | 0.15 | 1.85 |
| 16 | Svrljig | 0.50 | 0.08 | 0.07 | 0.17 | 0.15 | 0.15 | 1.13 |
| 17 | Bela Palanka | 0.42 | 0.16 | 0.06 | 0.24 | 0.12 | 0.15 | 1.15 |
| 18 | Dimitrovgrad | 0.26 | 0.05 | 0.08 | 0.32 | 0.41 | 0.15 | 1.27 |
| 19 | Pirot | 0.45 | 0.20 | 0.06 | 0.41 | 0.12 | 0.15 | 1.40 |
| 20 | Bosilegrad | 0.48 | 0.12 | 0.05 | 0.16 | 0.16 | 0.15 | 1.12 |
| 21 | Vladičin Han | 0.38 | 0.16 | 0.14 | 0.07 | 0.32 | 0.15 | 1.22 |
| Central Serbia averages | 0.46 | 0.27 | 0.15 | 0.14 | 0.28 | 0.15 | 1.45 | |
Publisher’s Note: MDPI stays neutral with regard to jurisdictional claims in published maps and institutional affiliations. |
© 2020 by the authors. Licensee MDPI, Basel, Switzerland. This article is an open access article distributed under the terms and conditions of the Creative Commons Attribution (CC BY) license (https://creativecommons.org/licenses/by/4.0/).
Share and Cite
MDPI and ACS Style
Dimkić, D.; Milovanović, M.; Dimkić, M.; Milojković, S. Current and Economic Price of Water in Serbia. Environ. Sci. Proc. 2020, 2, 45. https://0-doi-org.brum.beds.ac.uk/10.3390/environsciproc2020002045
AMA Style
Dimkić D, Milovanović M, Dimkić M, Milojković S. Current and Economic Price of Water in Serbia. Environmental Sciences Proceedings. 2020; 2(1):45. https://0-doi-org.brum.beds.ac.uk/10.3390/environsciproc2020002045
Chicago/Turabian StyleDimkić, Dejan, Miodrag Milovanović, Milan Dimkić, and Slađana Milojković. 2020. "Current and Economic Price of Water in Serbia" Environmental Sciences Proceedings 2, no. 1: 45. https://0-doi-org.brum.beds.ac.uk/10.3390/environsciproc2020002045