
Trends of Hydro-Meteorological Indices in Tendaho Catchment Part of Awash River Basin, Ethiopia †


1
Department of Civil Engineering, College of Architecture and Civil Engineering, Addis Ababa Science and Technology University, Addis Ababa 16417, Ethiopia
2
Department of Earth and Environment, Florida International University, Miami, FL 33199, USA
*
Author to whom correspondence should be addressed.
†
Presented at the 3rd International Electronic Conference on Atmospheric Sciences, 16–30 November 2020; Available online: https://ecas2020.sciforum.net/ .
Environ. Sci. Proc. 2021, 4(1), 33; https://0-doi-org.brum.beds.ac.uk/10.3390/ecas2020-08127
Published: 13 November 2020
(This article belongs to the Proceedings of The 3rd International Electronic Conference on Atmospheric Sciences)
Abstract
:The variability in the intensity and frequency of extreme hydro-meteorological events due to climate change have an enormous impact on managing water resources in developing countries. Frequently it has been recognized as sudden droughts and severe floods. This study analyzed the spatial and temporal trends of five meteorology indices: annual maximum precipitation (AMP), annual precipitation (AP), mean areal precipitation (MAP), annual maximum temperature (AMaT) and annual minimum temperature (AMiT), and three streamflow indices: mean annual flow(MAF), annual maximum flow (AMaxF) and total mean annual flow (TMAF) over the Tendaho Catchment. Mann–Kendall (MK), Spearman Rho (SR), Sen’s slope (SS) test in R-program modifiedmk package, and Sen’s innovative trend test were used to detect trends of 16 meteorological and one streamflow stations from 1979–2017. The result showed that there is statistically significant temporal trends only in AMP, AP, AMaT, and AMiT at 6, 19, 56, and 50% of the stations respectively. The remaining indices have no statistically significant trend in all the stations. It also dictates that the catchment is characterized by a slightly increasing AP and AMP; a slightly decreasing MAP and significant increasing AMaT and AMiT trends. Except for AMaT, there is no particular spatial pattern of AP, MAP, and AMiT on the majority of the stations. Whereas, all streamflow indices showed a slightly decreasing temporal trend at 95% confidence. From this, we can conclude that the decreasing flow trend could be due to the decrement of MAP, an increment of temperature, and construction of reservoirs in the catchment.
1. Introduction
The spatial and temporal variability of the hydrological and meteorological indices due to climate change has an enormous impact on the environment, society, proper water resources management, and infrastructure safety. Trend identification plays a significant role in climate change studies to make future predictions about possible consequences on the urban environment, agriculture, water availability, etc. [1]. During the twentieth century, the intensity and frequency of extreme events have significantly altered globally due to climate change. A large spatial and temporal variability of rainfall leads to an increased incidence of extreme events like floods and droughts [2].
Spatial and temporal trends of extreme precipitation and other hydro-meteorological variables have been investigated by many researchers at global, regional, and local scales. Among these different studies were conducted to assess the trend and variability of rainfall in different parts of Ethiopia. [3,4] in Awash River Basin of Ethiopia, [2] in Lake Tana Basin of Ethiopia, [5] in Upper Blue Nile River basin of Ethiopia, [6] in the Central Rift Valley of Ethiopia, and [7] in 13 different watersheds of Ethiopia agreed that there is no statistically significant and consistent trend in the annual rainfall pattern. Contrasting results of annual and seasonal rainfall trends in some study areas of Ethiopia also reported by [8,9]. These studies were used methods of slopes of regression lines using the least-squares, Sen’s slope estimator, Mann–Kendall trend test, Spearman’s rho, and Innovative Şen Trend test to detect the trends.
Similarly, [10] investigated the temporal variability of extreme precipitation on Konya Closed Basin in Turkey. The trend analysis of extreme precipitations was conducted using Spearman’s Rho (SR), Mann–Kendall (MK), and Innovative Şen Trend test. The result examined non-significant decreasing trends of the majority of stations. [11] investigated the increasing incidence of extreme hydro-climatic conditions, particularly drought, which plays a vital role in regulating water resource availability in Southeast Florida. In this study, the presence of rainfall monotonic trends was analyzed using linear regression and Mann–Kendal trend tests. Pettit’s single point detection test examined the presence of an abrupt change of rainfall. [12] studied the trend of annual temperature and precipitation time series data in the Trarza region, Mauritania using the Mann–Kendall, the Spearman’s rho, and the Şen trend test. The result of this study showed significant increasing precipitation and temperature trend in most of the stations and all of the stations respectively.
The main aims of this study are (1) to analyze the temporal trends, and (2) to investigate the spatial trend patterns of hydro-meteorological variables of Tendaho Catchment. We have analyzed historical daily rainfall data in and near-by the catchment stations from 1979 to 2017. For such long-term historical data, the hydro-meteorological trend were evaluated using the modified version of the R-program modified-MK package. Based on the overall analyses, we have evaluated and concluded the temporal and spatial variability of the hydro-meteorological variables over the study catchment.
2. Experiments
2.1. Data
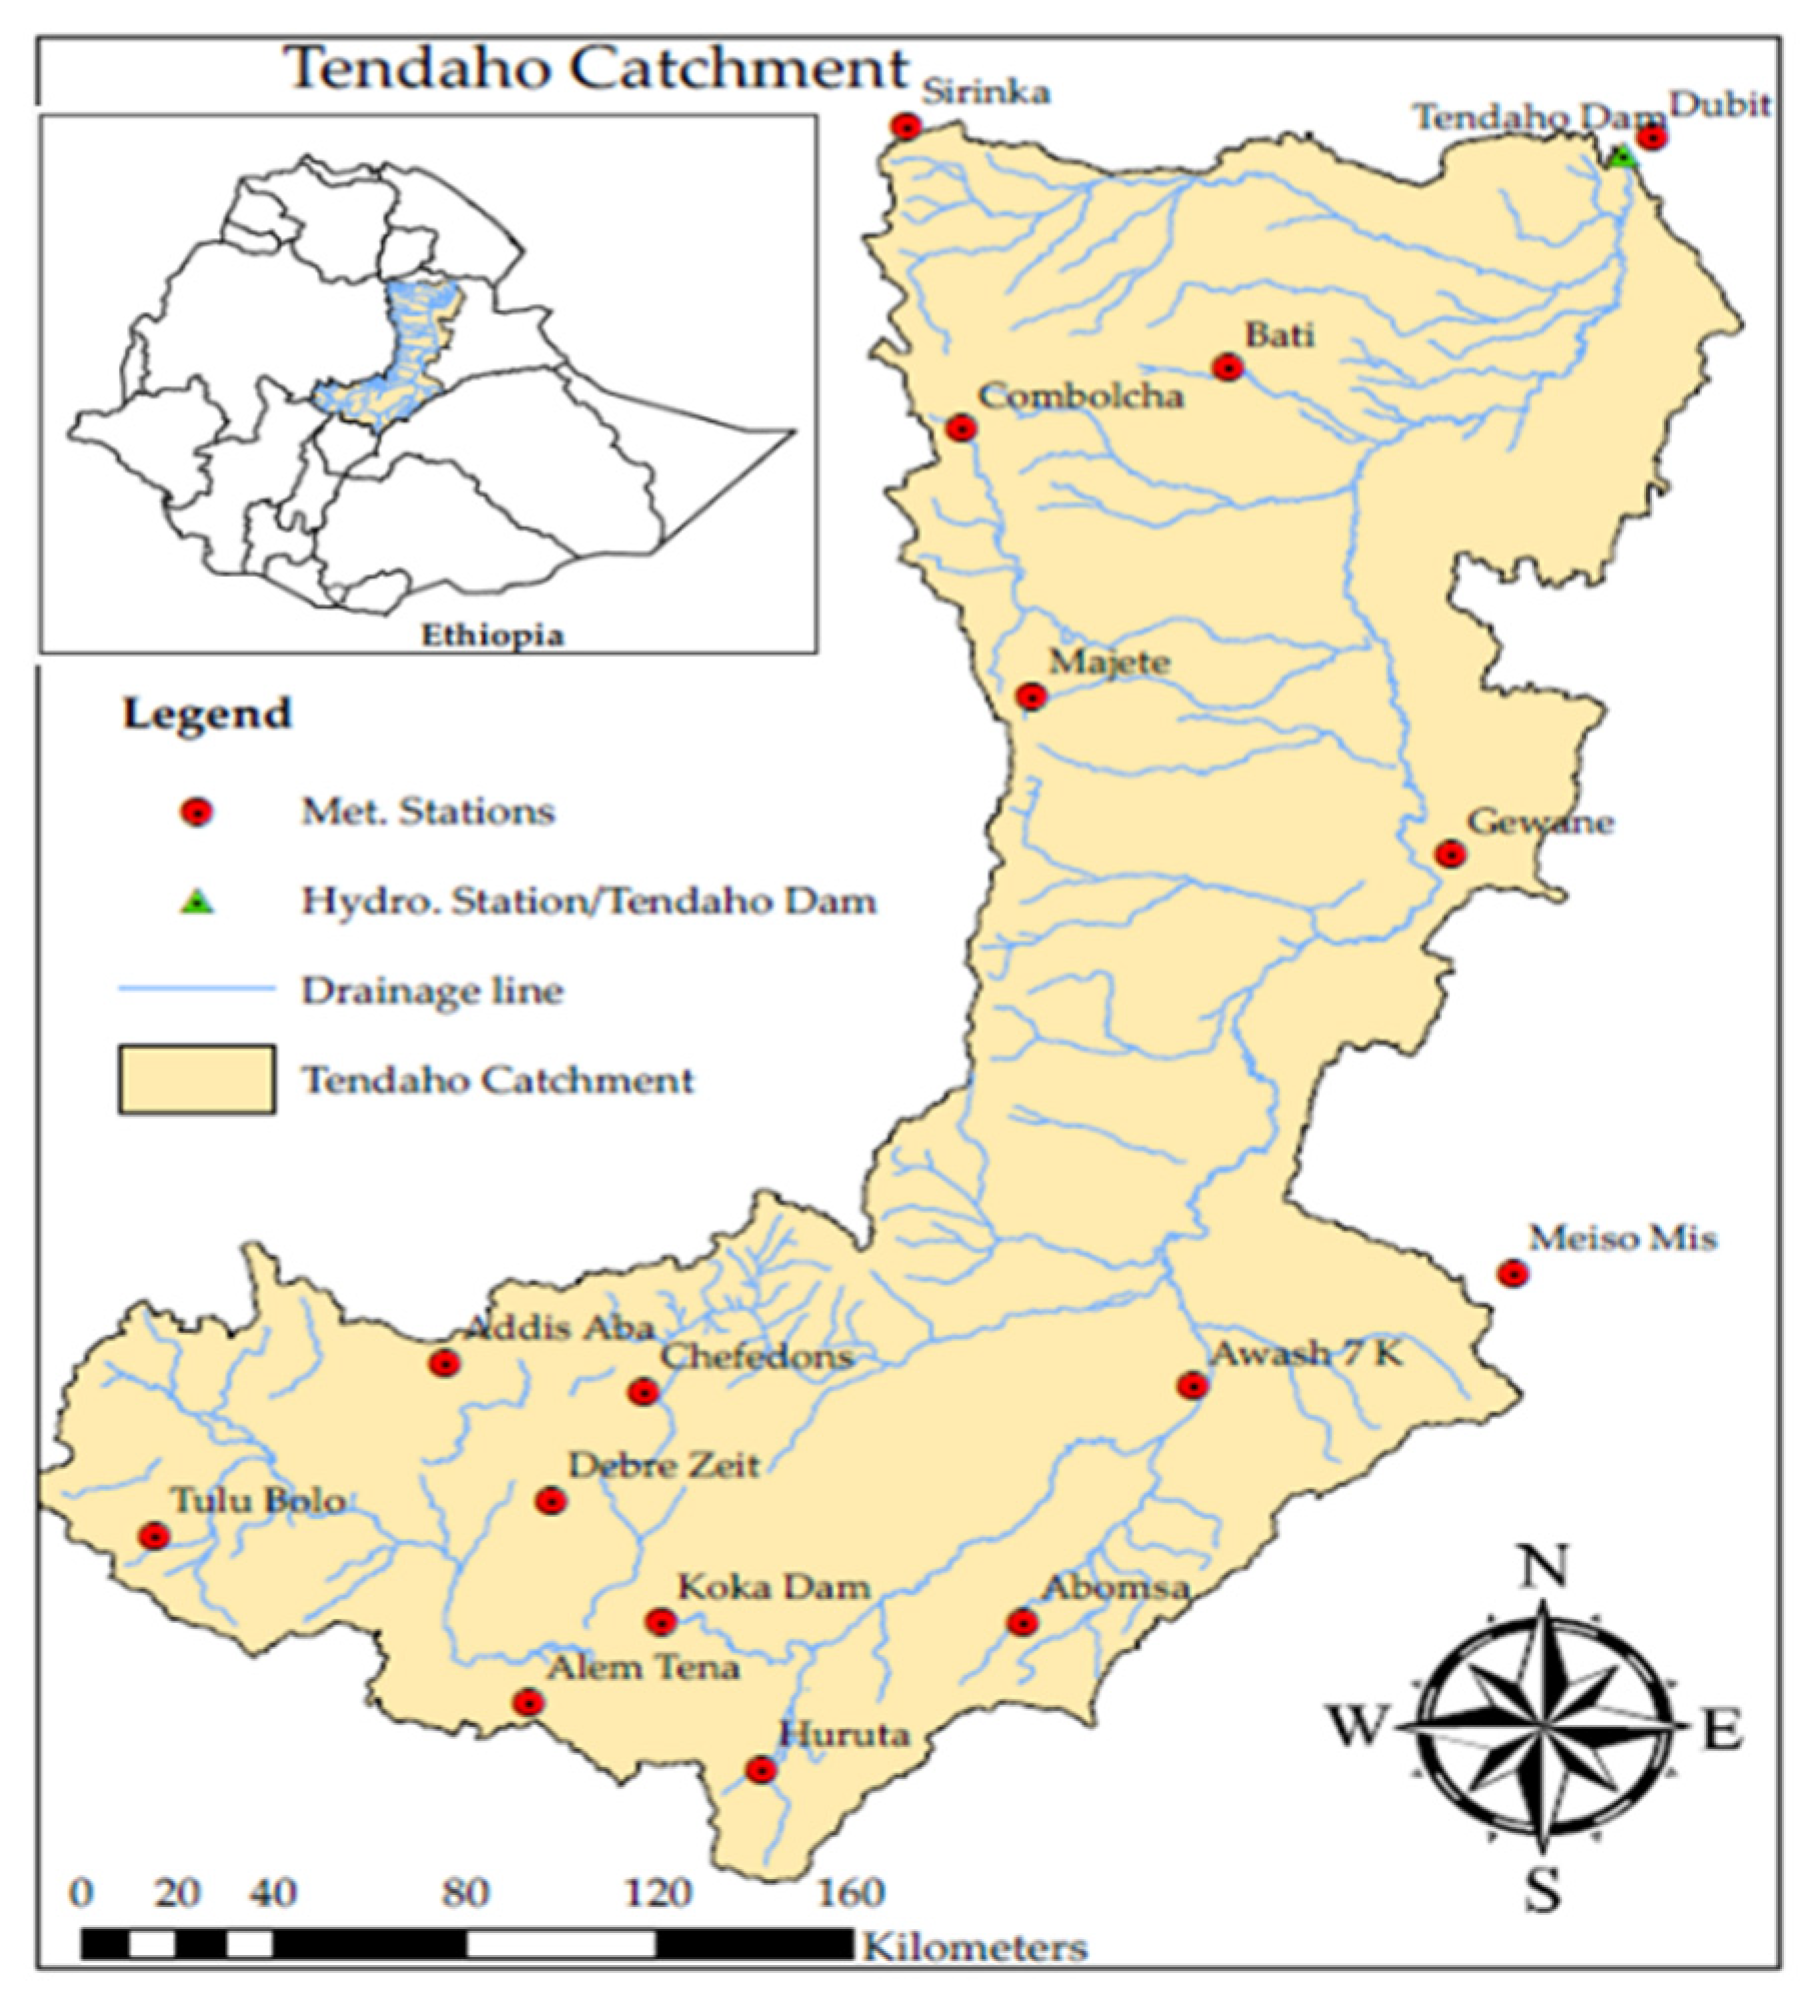
For hydro-meteorological trend assessment in this study using the R-program modifiedmk package long-term streamflow, temperature, and precipitation data were used. Daily precipitation and temperature data from 1979 to 2017 were collected from Ethiopia National meteorology service Agency and the streamflow data from 1979 to 2005 were collected from the Ministry of Water, Irrigation, and Energy. 16 meteorology and one hydrology station at the catchment outlet were used (Figure 1).
2.2. Methodology
For detecting significant trends in hydro-meteorological data, two techniques are always used: parametric and non-parametric. The main assumption in all techniques is the independence of the data and the non-parametric methods were the most widely used for trend analysis [4,13,14]. In this study, four different non-parametric trend methods (Mann–Kendall (MK), Sen’s slope (SS), Spearman’s Rho (SR), and the Sen innovative trend method) were used to detect the trends of annual maximum, areal mean, annual precipitation, annual average minimum and maximum temperature and annual streamflow of Tendaho catchment. Before use, all-time series data were checked for autocorrelation and the pre-whitening procedure was performed at a 5% significant level.
3. Results
3.1. Data Quality Assessment
Daily precipitation, Temperature, data of 16 stations from 1979–2017, and the available streamflow data from 1979–2005 at the outlet of the catchment have been calculated into monthly, annual maximum, annual totals. For the independent sample data, the stations selected have no much-missed data and in some stations, the missed data were filled and outliers were checked. However, to avoid autocorrelation problem, the serial correlation between the data set was checked and was not found to be autocorrelated, and hence to use it for further statistical analysis pre-whitening is done using the modifiedmk package. From the result of AP, AMP, AMaT, and AMiT autocorrelation test 31.25%, 6.25%, 87.5%, and 75% of the stations have a significant autocorrelation respectively.
3.2. Temporal Trends
3.2.1. Analysis of Precipitation
The annual maximum precipitation (AMP) series was analyzed for each station to identify significant temporal trends. The results from MK, SR, and Sen’s Slope test show that one station (Gewane) shows a statistically significant (Sig) increasing trend at a 5% significant level. For the remaining 15 stations, 80% stations show a slight increase while the remaining 20% stations show a slightly decreasing and statistically non-significant trend (Table 1).
The result of the trend analysis for the annual precipitation (AP) series are shown in Table 2. From MK, SR, and Sen’s Slope test, three (18.75%) out of the 16 stations show a statistically significant trend. Two (Abomsa and Awash 7 kilo) of the stations indicate a decreasing trend and one (Gewane) station has an increasing trend. Although the 13 (81.25%) of the stations have no statistically significant trend, eight (61.54%) of the station shows slightly increasing trend and the remaining five (38.46%) stations have a slightly decreasing trend. The maximum increase and decrease rate of annual precipitation were found to be +11.018 mm/year at Gewane and −7.814 mm/year at Abomsa stations, respectively.
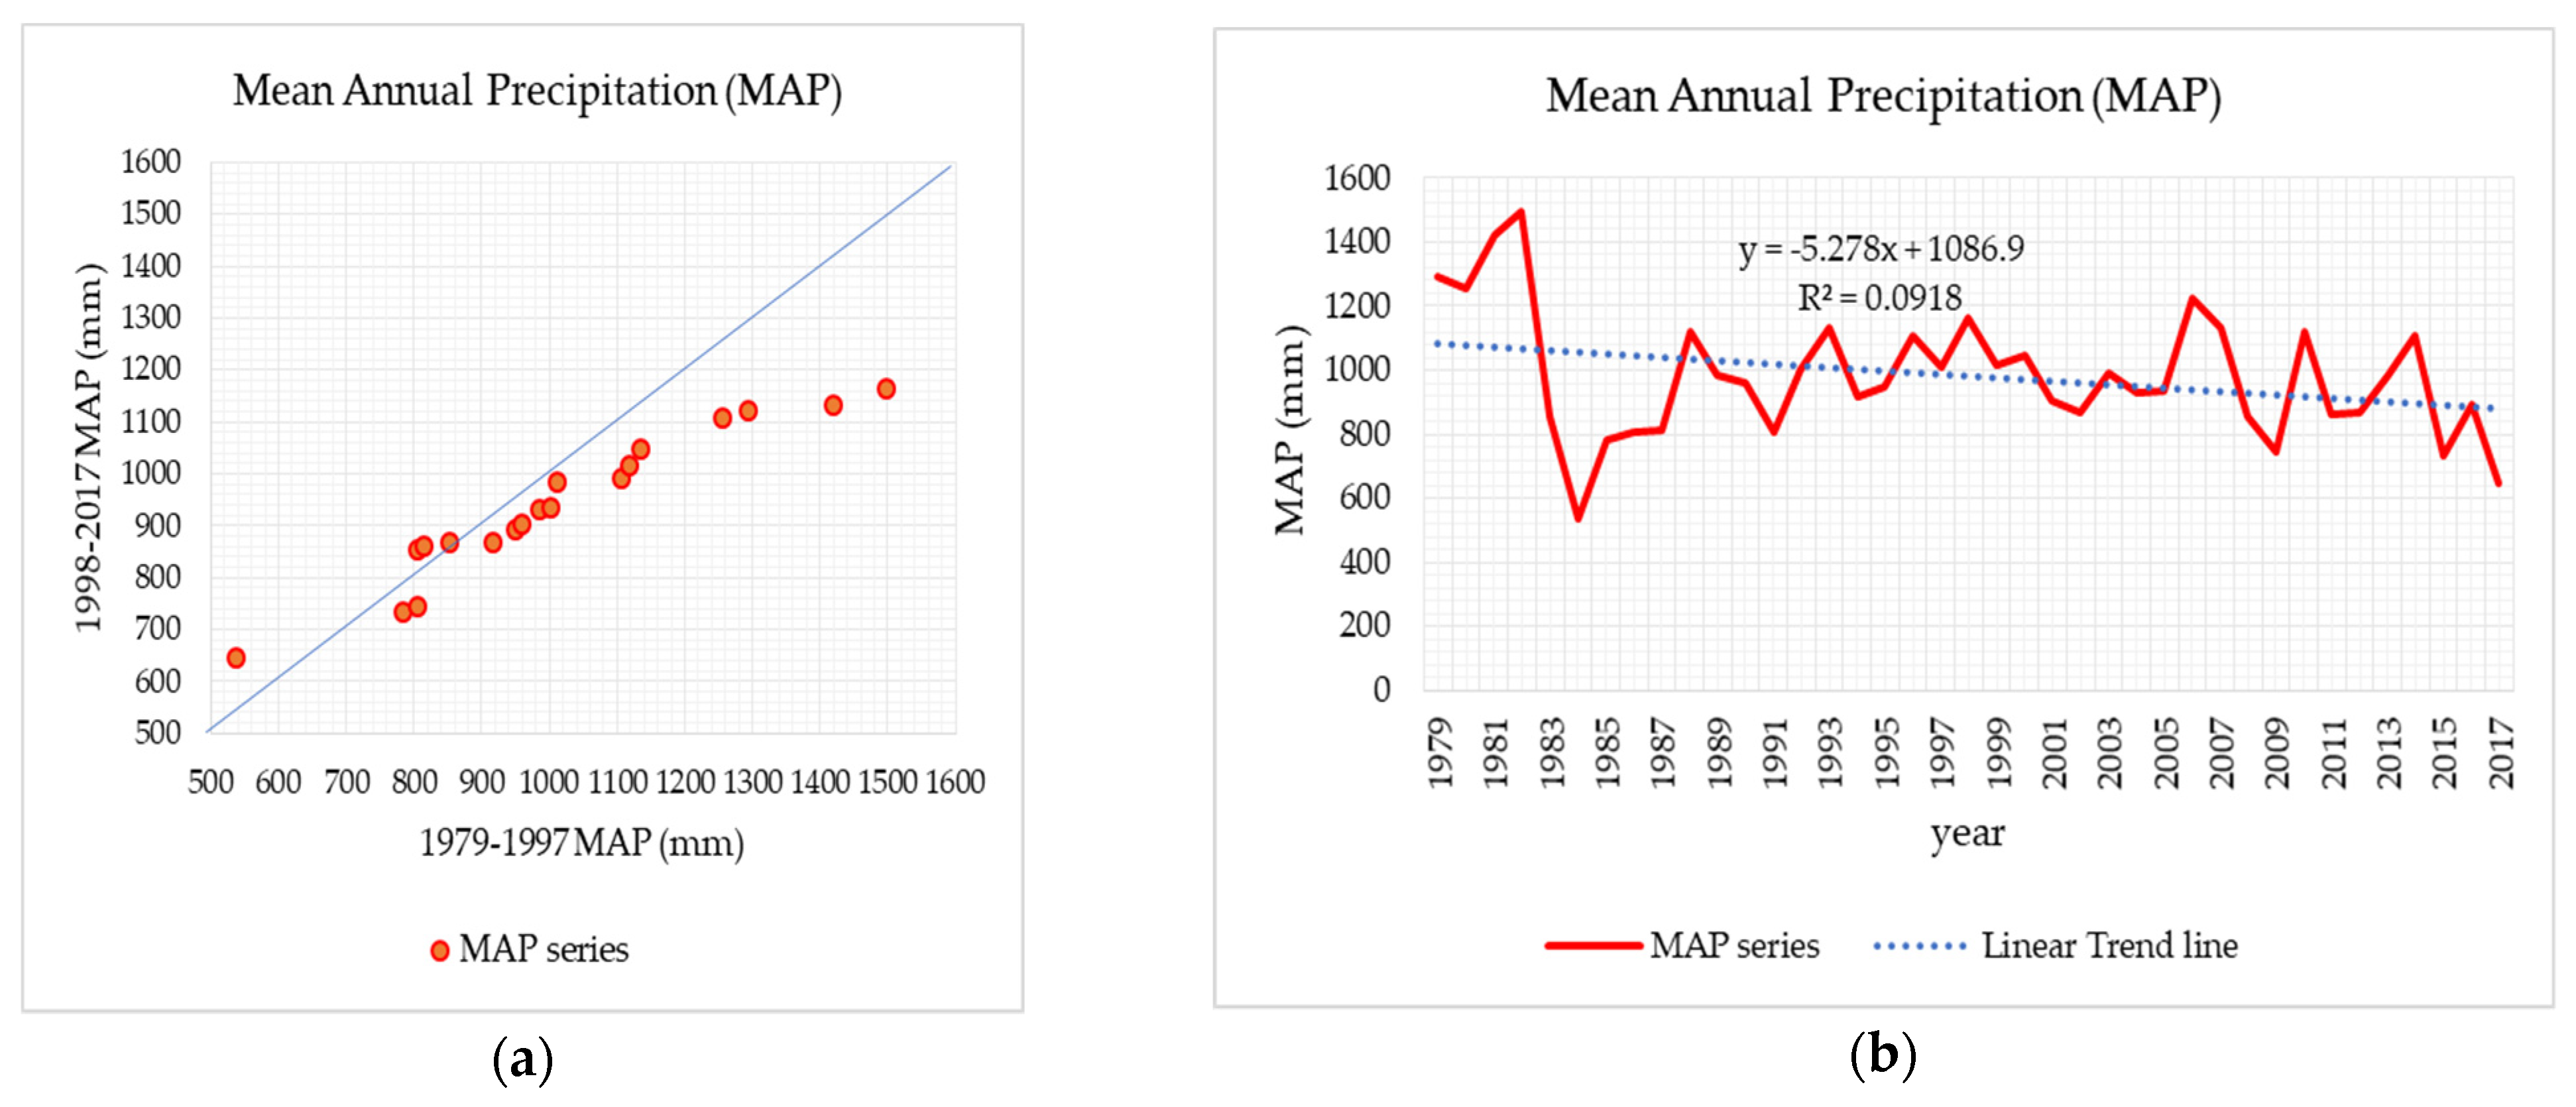
On the other hand, analysis of the mean annual precipitation (MAP) for the catchment area using Sen innovative trend and linear trend test result indicates there is a slightly decreasing trend (Figure 2a,b).
3.2.2. Analysis of Temperature
The annual maximum Temperature (AMaT) and annual minimum temperature (AMiT) trends were analyzed using MK and Sen’s slope trend test methods. The result of the AMaT using MK and Sen’s slope test indicates that nine (56.25%) stations have significant trends; the remaining seven (43.75%) stations have no significant trend and an increasing trend for all stations except Combolcha. The maximum increment in temperature is 0.061 °C/year (Table 3).
The annual Minimum Temperature (AMiT) test using MK and Sen’s slope method show half of the stations have a statistically significant trend. Both the methods indicate most of the stations have an increasing trend except Bati, Tulubolo, Koka Dam, and Debrezeit. The magnitude of the largest increasing trend of AMiT is 0.071 °C/year (Table 3).
3.2.3. Analysis of Observed Stream Flow
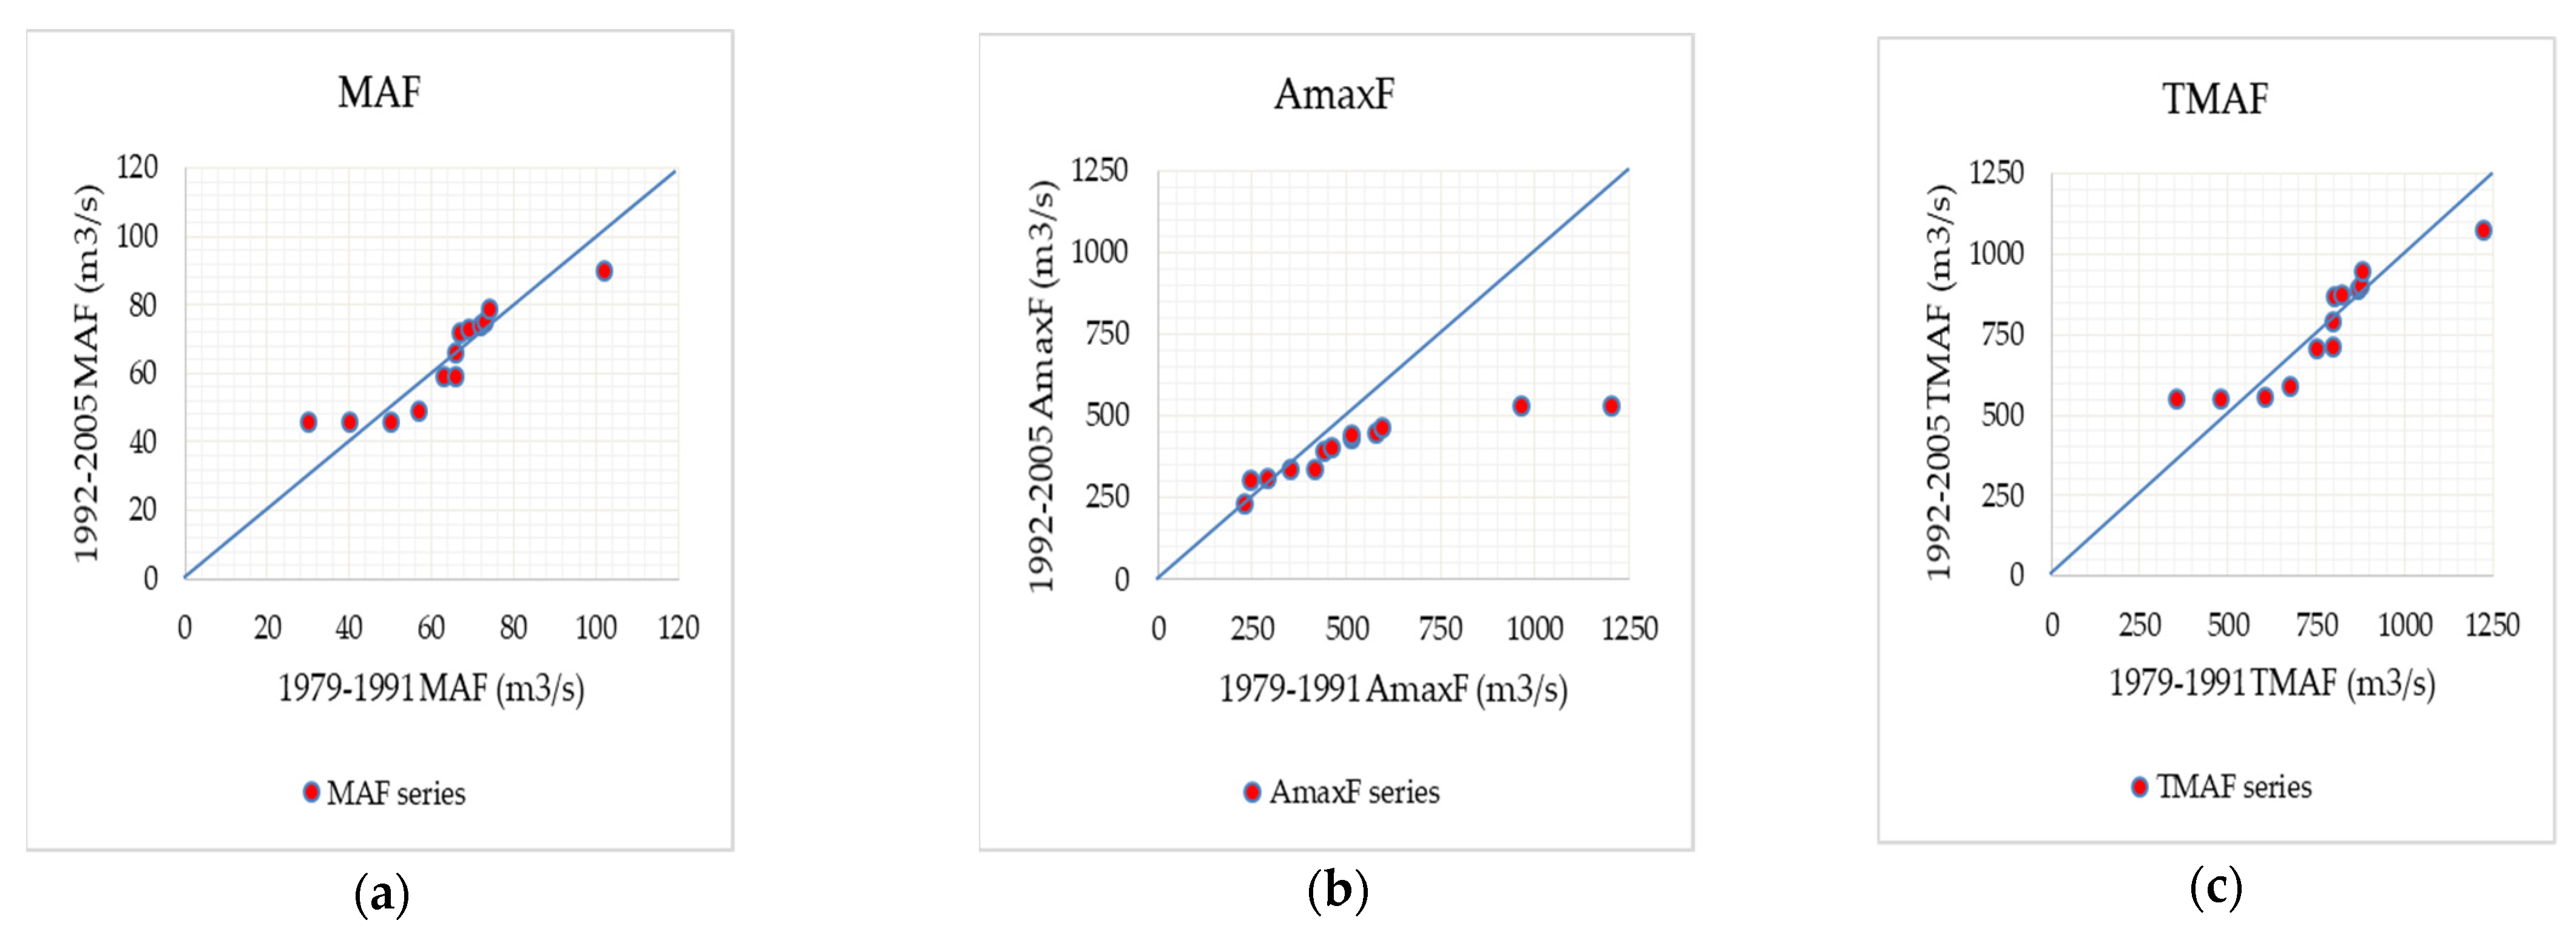
For the discharge trend analysis, the available streamflow data from the 1979–2005 period at the outlet (Tendaho station) of the Tendaho catchment was used. The summary of the result using MK, Sen’s slope, and SR trend test for mean annual flow (MAF), annual Maximum Flow (AMaxF), and total mean annual flow (TMAF) are Witten in Table 4 and Figure 3.
The result of the trend for all MAF, AMaxF, and TMAF indicates there were no statistically significant trend with Z = −0.669, Z = −0.573, and Z = −0.750, respectively, at 95% confidence. However, there were slightly decreasing trends.
3.3. Spatial Trends
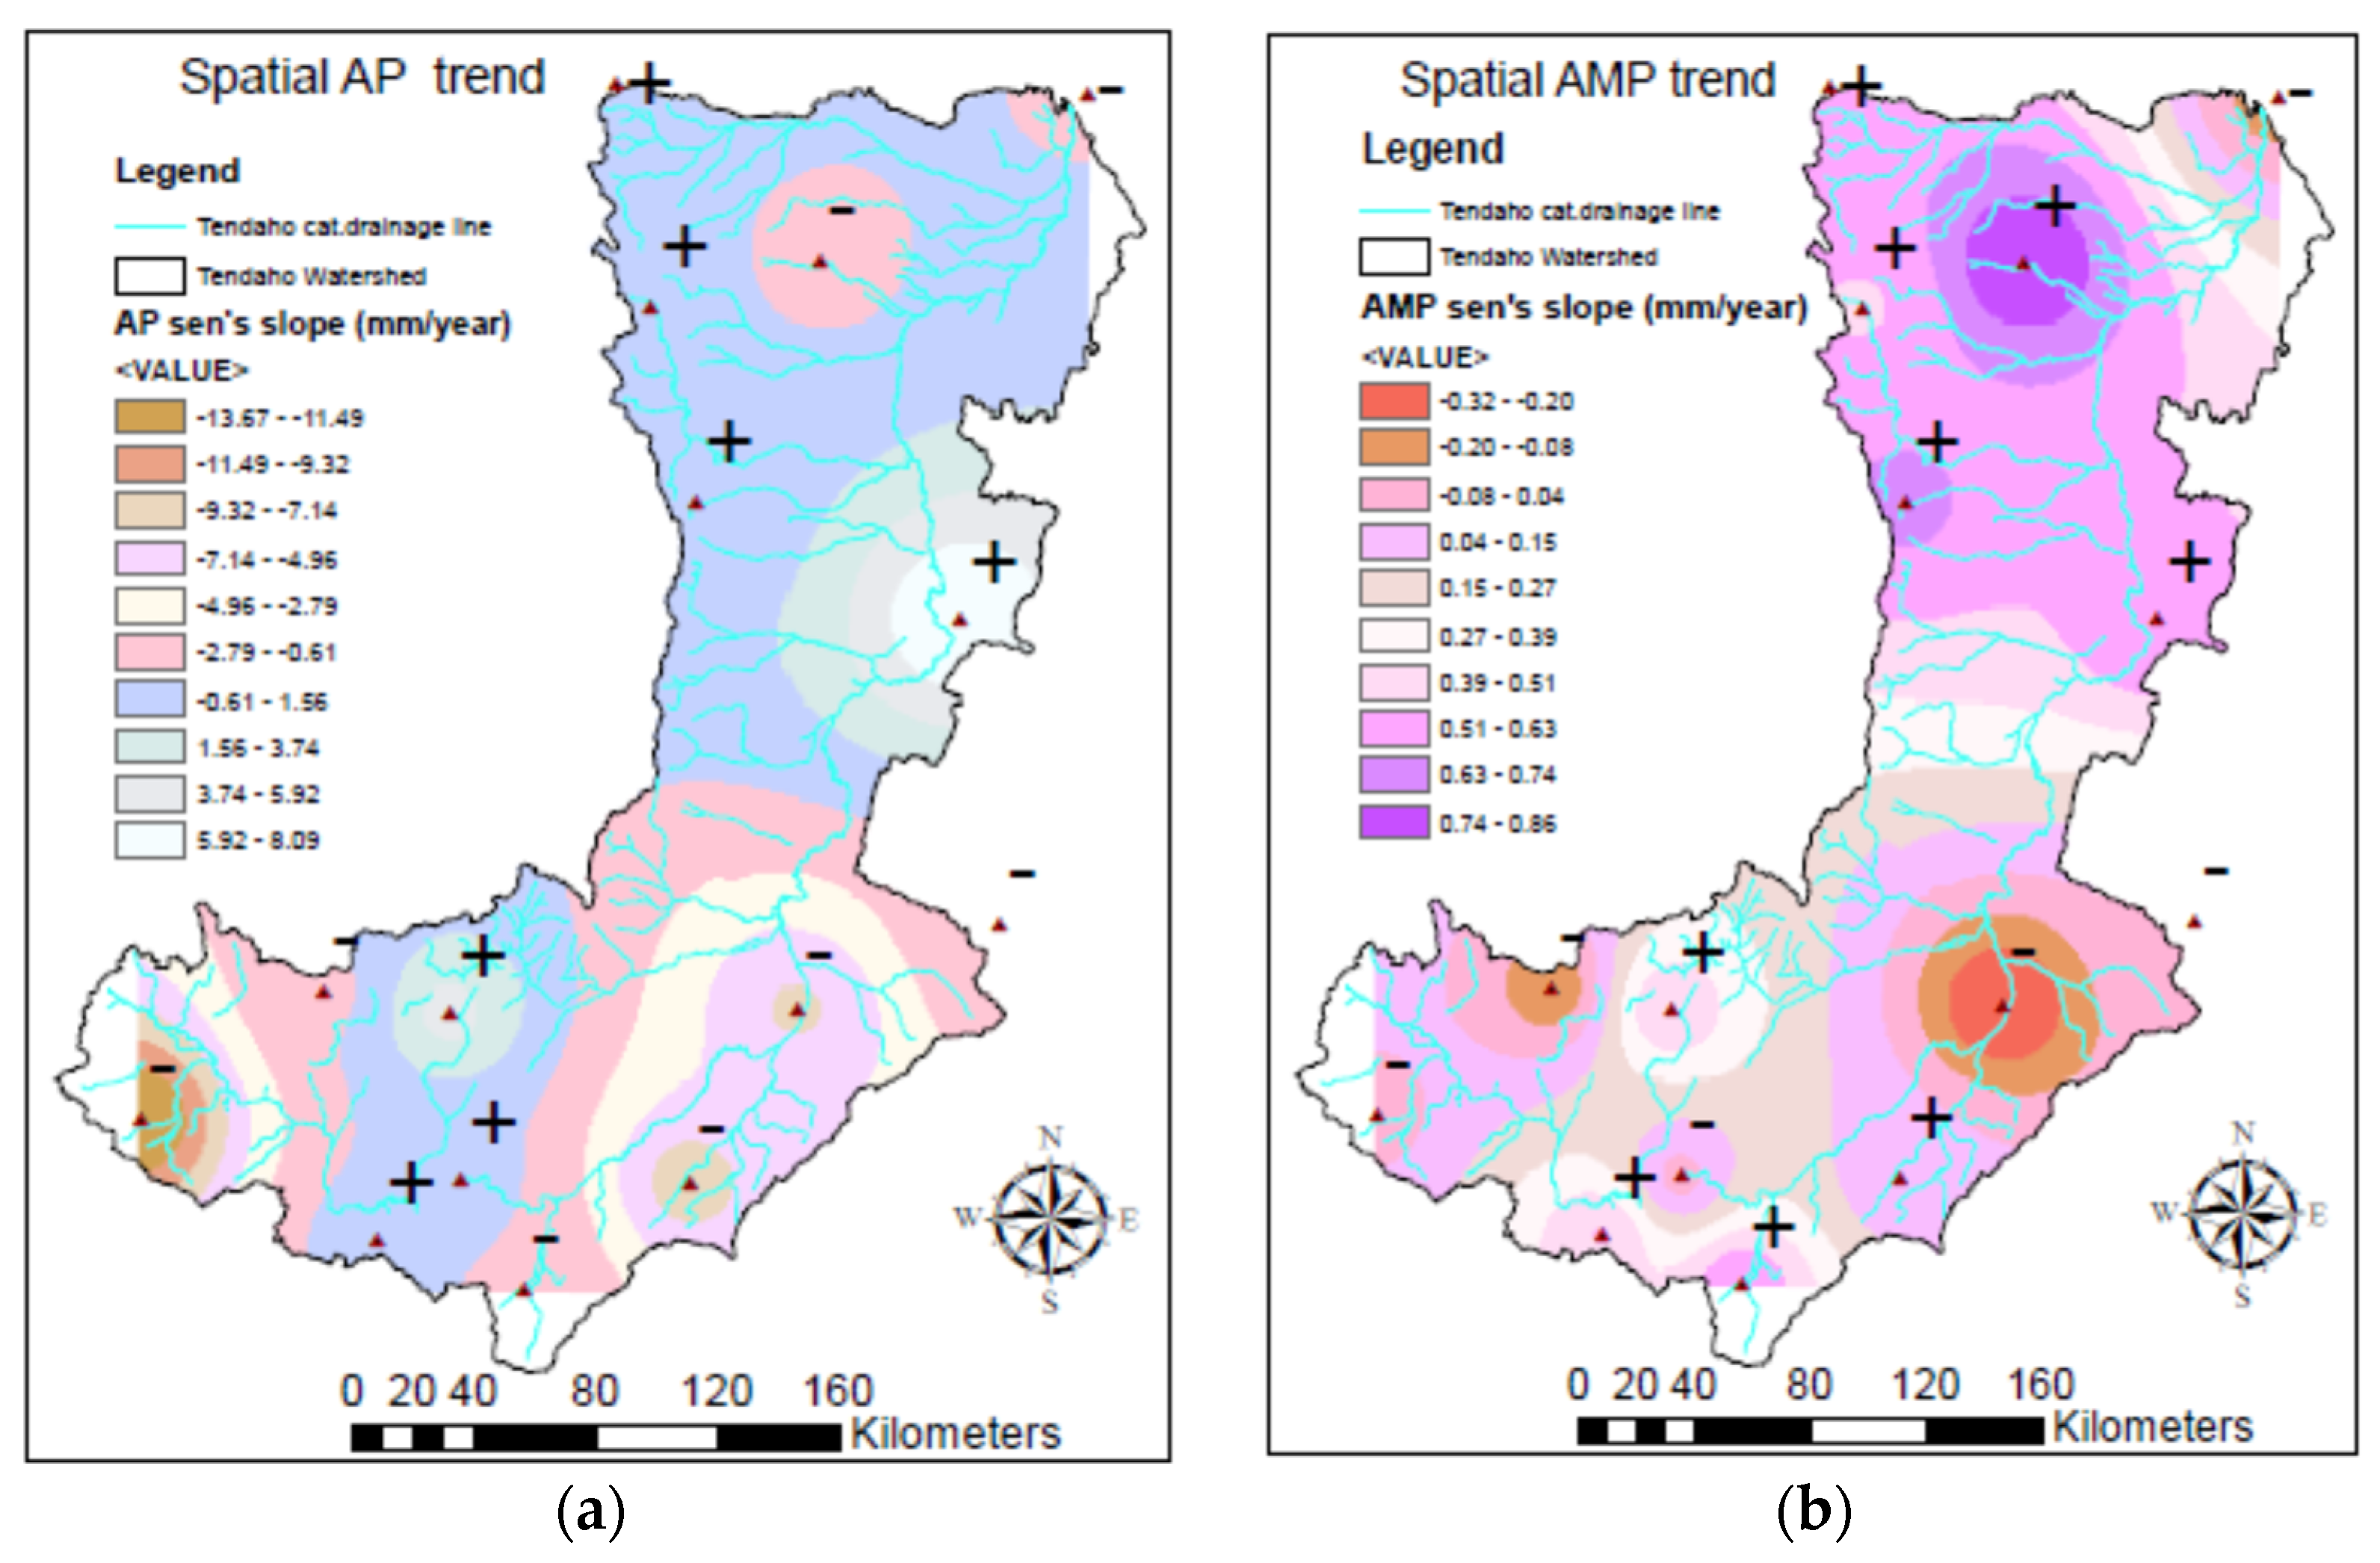
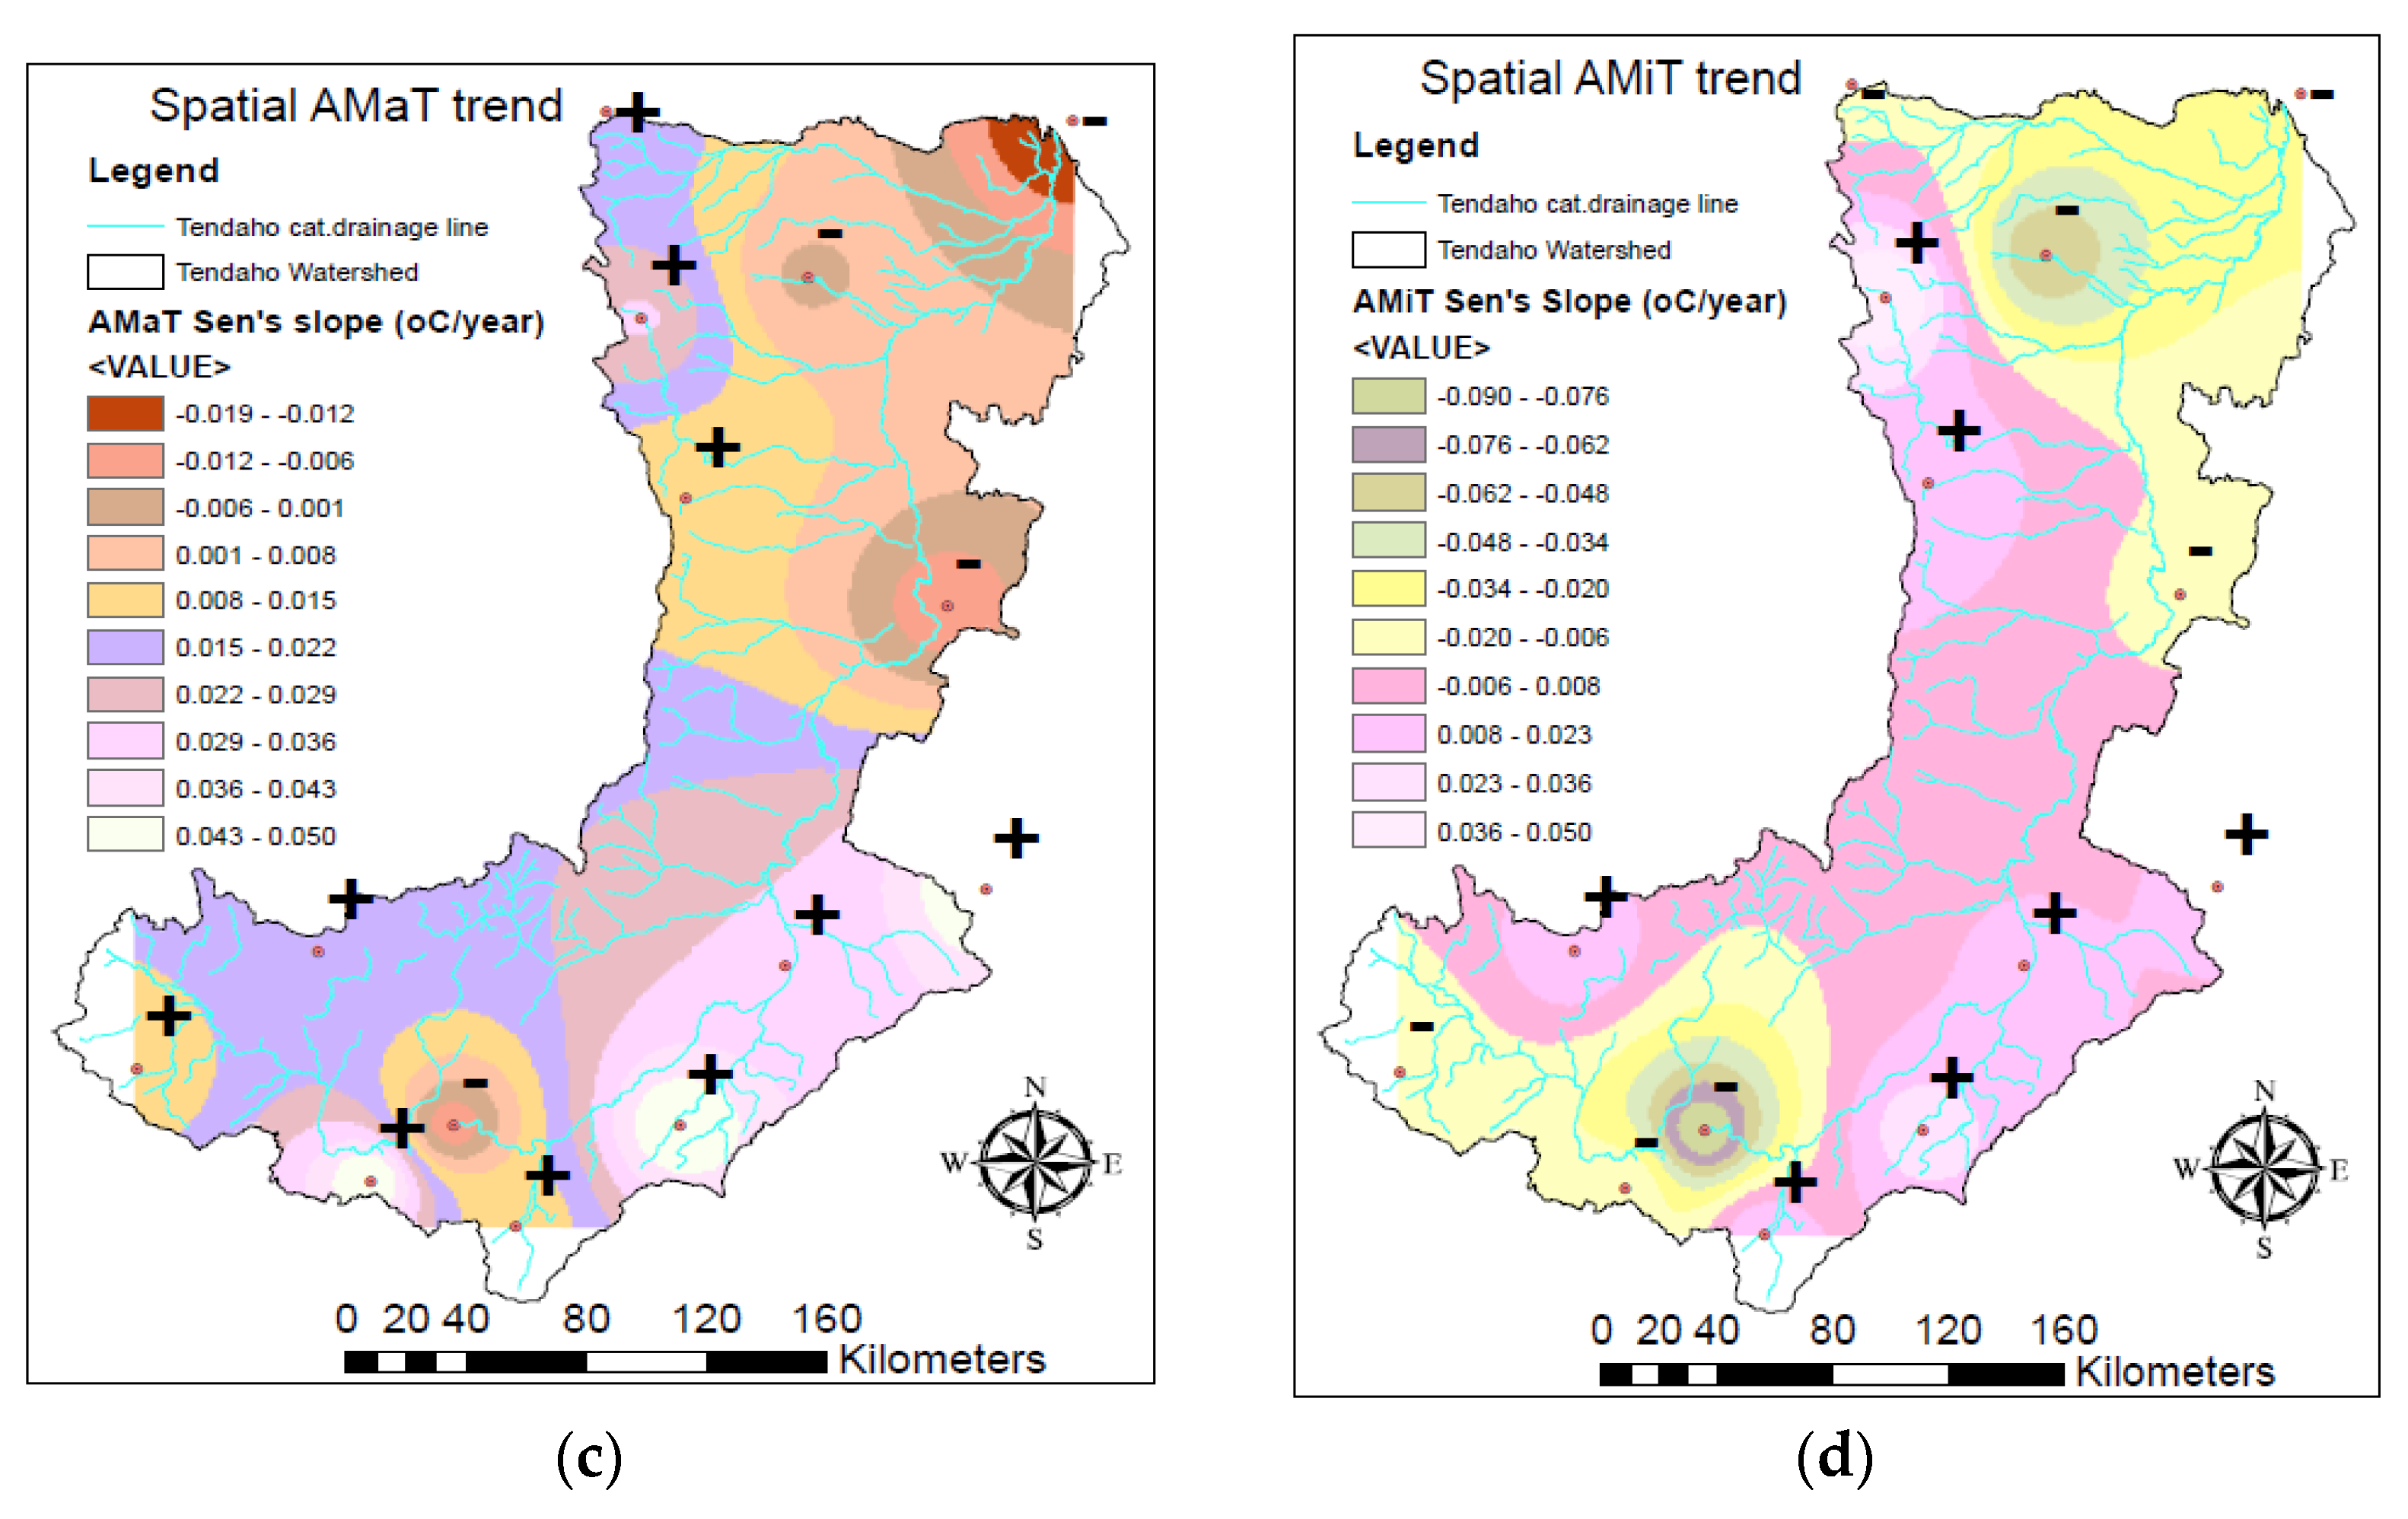
For the regional trend analysis, it is preferred that all considered stations shall have the same period of record [14]. Thus, in this section, a recent common period of record (1991–2017) was selected, and 15 stations for precipitation and 14 stations for Temperature were included to investigate the spatial distribution of annual trends in the case study. The spatial distribution of trends and magnitudes in annual maximum precipitation (AMP), annual precipitation (AP), annual minimum Temperature (AMiT), and annual maximum Temperature (AMaT) are shown in Figure 4. The result indicates that there is no particular pattern in the spatial distribution of AP, MAP, and AMiT with a statistically significant trend on the majority of the stations. Whereas the AMaT shows an increasing pattern except in the lower eastern part of the catchment with a significant trend. In this study, the inverse distance weighting method (IDW) was used to interpolate rainfall trends of the available stations to produce continued raster surface for the Tendaho catchment.
4. Discussion
In this study, the result showed that the Annual maximum precipitation (AMP), annual precipitation (AP), and areal mean annual precipitation (MAP) in most of the stations detected a statistically non-significant trend. However, the study argues that the Tendaho catchment is characterized by a slightly increasing AP and AMP and a slight decreasing trend of areal MAP. Regarding AP and AMP are consistent with those obtained from a previous trend study in most stations of the Awash River basin [13]. These results revealed that the AP trends were significantly increasing in most of the stations and slightly decreasing in some other stations. The other study which agrees with this study was [15] review, which was reported by Africa climate change resilience Alliance (2011) and McSweeney et al. (2008) specified that there is no a statistically substantial trend in observed mean precipitation in any season in Ethiopia between 1990 and 2006. The spatial trend of both rainfall indices (AP and AMP) indicated that there is no particular pattern in the spatial distribution of the stations with significant trends across the catchment. The result obtained by [3] also indicates the direction and magnitude of the seasonal rainfall trend were not uniform throughout different stations.
On the other hand, the annual maximum temperature (AMaT) and the annual minimum temperature (AMiT) show a significant increasing trend over 1979–2017 reflecting the warming of most of the catchment. Generally, there is a rising tendency in temperature in the study area. According to the literature, [13] revealed that the annual temperature trends in the Awash river basin were significantly increasing in most of the stations and slightly decreasing in some other stations. [15] reported that McSweetney et al. (2008) confirmed that the average yearly temperature in Ethiopia has raised by 1.3 °C from 1960 to 2006, with an average increment rate of 0.28 °C per decade.
The trend of the streamflow assessment indicates that there is no statistically significant trend but a slight decrement at the outlet gage. This result of the study, similar to previous studies, reported no significant trends in streamflow variables over Ethiopia [16]. Similarly, the Sen innovative trend test showed that the high values of AMaxF decreased more than the lower values during the study period. [13] studied for Awash basin gives the similar conclusion that the discharge in the basin showed a decreasing trend. Generally, the decrement of streamflow indices could be due to the decrement of mean annual rainfall and an increment of Temperature in the catchment area as explained earlier. Other activities, such as man-made structures like diversions and land use and land cover changes besides the annual and seasonal distribution of rainfall.
Regarding the trend tests used in the study, the result of Mann–Kendall, Spearman rho, Sen’s slope, and innovative trend test are almost the same in the majority of the stations.
5. Conclusions
This study examines the trend of the hydro-meteorological variables in the Tendaho catchment and their significance. From the study, we can conclude that the majority of stations temporal trend for the precipitation indicates a statistically non-significant trend with the slightly increasing trend of AP and AMP. While a slightly decreasing trend of MAP. For the temperature indices (AMaT and AMiT) the majority of the stations shown a significant increasing trend. These results will reflect the warming of the study region as a whole. Unlike the temperature, the streamflow indices (MAF, AMaxF, and TMAF) indicate that there is a slightly decreasing trend and statistically non-significant trend.
For the spatial trend, the detected AMP, AP, and AMiT trends do not form the systematic pattern. Nevertheless, most of the detected trends are a slightly increasing (+) trend. On the other hand, the spatial trend of the AMaT indicates an increasing (+) Pattern except for the lower eastern catchment area.
In general, the results of this study can be used as a reference to adoptive water resource management by local government and different stakeholders, wherein this catchment Irrigation and Agricultural productions are intense. Keeping in mind that the historic rainfall and streamflow records used in the study ended in 2017 and 2005 respectively, the analysis might not include the recently observed extremes. Thus it is recommended to collect recent records to determine the possible climate change effect and the exact cause of the decreasing streamflow in the catchment.
Author Contributions
Conceptualization and methodology, F.N.W., A.M.M. and B.A.; program, F.N.W.; formal analysis, F.N.W., A.M.M. and B.A.; data collection, F.N.W.; writing—original draft preparation, F.N.W.; writing—review and editing, A.M.M.; supervision, A.M.M. and B.A. All authors have read and agreed to the published version of the manuscript.
Acknowledgments
The first author is thankful for the financial support from the Ethiopian government for carrying out his Ph.D. at Addis Ababa Science and Technology University (AASTU). The authors would like to express their sincere gratitude to Ethiopian National Meteorology Service Agency, Ministry of Water, Irrigation and Energy, and Ministry of Agriculture for providing data.
Conflicts of Interest
The authors declare no conflict of interest.
References
- Mahmood, R.; Jia, S.; Zhu, W. Analysis of climate variability, trends, and prediction in the most active parts of the Lake Chad basin, Africa. Sci. Rep. 2019, 9, 1–18. [Google Scholar] [CrossRef] [PubMed]
- Weldegerima, T.M.; Zeleke, T.T.; Birhanu, B.S.; Zaitchik, B.F.; Fetene, Z.A. Analysis of Rainfall Trends and Its Relationship with SST Signals in the Lake Tana Basin, Ethiopia. Adv. Meteorol. 2018, 2018, 5869010. [Google Scholar] [CrossRef]
- Bekele, D.; Alamirew, T.; Kebede, A.; Zeleke, G.; Melese, A.M. Analysis of rainfall trend and variability for agricultural water management in Awash River Basin, Ethiopia. J. Water Clim. Chang. 2016, 8, 127–141. [Google Scholar] [CrossRef]
- Mulugeta, S.; Fedler, C.; Ayana, M. Analysis of Long-Term Trends of Annual and Seasonal Rainfall in the Awash River Basin, Ethiopia. Water 2019, 11, 1498. [Google Scholar] [CrossRef]
- Mengistu, D.; Bewket, W.; Lal, R. Recent spatiotemporal temperature and rainfall variability and trends over the Upper Blue Nile River Basin, Ethiopia. Int. J. Clim. 2014, 34, 2278–2292. [Google Scholar] [CrossRef]
- Kassie, B.T.; Rötter, R.P.; Hengsdijk, H.; Asseng, S.; Van Ittersum, M.K.; Kahiluoto, H.; Van Keulen, H. Climate variability and change in the Central Rift Valley of Ethiopia: Challenges for rainfed crop production. J. Agric. Sci. 2013, 152, 58–74. [Google Scholar] [CrossRef]
- Cheung, W.H.; Senay, G.B.; Singh, A. Trends and spatial distribution of annual and seasonal rainfall in Ethiopia. Int. J. Clim. 2008, 28, 1723–1734. [Google Scholar] [CrossRef]
- Fentaw, F.; Hailu, D.; Nigussie, A. Trend and Variability Analysis of Rainfall & Stream Flow Series at Tekeze River Basin. Ethiopia 2017, 8, 17. [Google Scholar]
- Seleshi, Y.; Zanke, U. Recent changes in rainfall and rainy days in Ethiopia. Int. J. Clim. 2004, 24, 973–983. [Google Scholar] [CrossRef]
- Köyceğiz, C.; Büyükyıldız, M. Temporal trend analysis of extreme precipitation. Pamukkale Univ. J. Eng. Sci. 2019, 25, 956–961. [Google Scholar] [CrossRef]
- Abiy, A.Z.; Melesse, A.M.; Abtew, W.; Whitman, D. Rainfall trend and variability in Southeast Florida: Implications for freshwater availability in the Everglades. PLoS ONE 2019, 14, e0212008. [Google Scholar] [CrossRef] [PubMed]
- Yacoub, E.; Tayfur, G. Trend analysis of temperature and precipitation in Trarza region of Mauritania. J. Water Clim. Chang. 2018, 10, 484–493. [Google Scholar] [CrossRef]
- Gedefaw, M.; Wang, H.; Yan, D.; Song, X.; Yan, D.; Dong, G.; Wang, J.; Girma, A.; Ali, B.A.; Batsuren, D.; et al. Trend Analysis of Climatic and Hydrological Variables in the Awash River Basin, Ethiopia. Water 2018, 10, 1554. [Google Scholar] [CrossRef]
- Gado, T.A.; El-Hagrsy, R.M.; Rashwan, I.M.H. Spatial and temporal rainfall changes in Egypt. Environ. Sci. Pollut. Res. 2019, 26, 28228–28242. [Google Scholar] [CrossRef] [PubMed]
- Rabba, Z.A. Flood Estimation in Developing Countries with Case Studies in Ethiopia. Ph.D. Thesis, University of KwaZulu-Natal, Durban, South Africa, 2017. [Google Scholar]
- Degefu, M.A.; Alamirew, T.; Zeleke, G.; Bewket, W. Detection of trends in hydrological extremes for Ethiopian watersheds, 1975–2010. Reg. Environ. Chang. 2019, 19, 1923–1933. [Google Scholar] [CrossRef]
Figure 1.
Location map of Tendaho Catchment and hydro-meteorology stations.

Figure 2.
Trends of mean annual precipitation (MAP): (a) Sens innovative trend; (b) linear trend and time series of MAP in the studied catchment.
Figure 2.
Trends of mean annual precipitation (MAP): (a) Sens innovative trend; (b) linear trend and time series of MAP in the studied catchment.

Figure 3.
Observed streamflow using Sen innovative trend at the outlet gauging station: (a) Mean annual flow (MAF); (b) Annual Maximum Flow (AMaxF); (c) Total mean annual flow (TMAF).
Figure 3.
Observed streamflow using Sen innovative trend at the outlet gauging station: (a) Mean annual flow (MAF); (b) Annual Maximum Flow (AMaxF); (c) Total mean annual flow (TMAF).

Figure 4.
Spatial trends: (a) Annual precipitation (AP); (b) Annual maximum precipitation (AMP); (c) Annual maximum Temperature (AMaT); (d) Annual minimum Temperature (AMiT). (+) indicate a slightly increasing trend and (–) slightly decreasing trend pattern.
Figure 4.
Spatial trends: (a) Annual precipitation (AP); (b) Annual maximum precipitation (AMP); (c) Annual maximum Temperature (AMaT); (d) Annual minimum Temperature (AMiT). (+) indicate a slightly increasing trend and (–) slightly decreasing trend pattern.


Table 1.
Summary of Mann–Kendall (MK) and Spearman Rho (SR) test for annual maximum precipitation (AMP).
Table 1.
Summary of Mann–Kendall (MK) and Spearman Rho (SR) test for annual maximum precipitation (AMP).
| Station Name | MK-Z | p-Value | Sen’s Slope | Pre-Whitened SS | Var(S) | SR-Z | Sig Trend | Trend Type |
|---|---|---|---|---|---|---|---|---|
| Abomsa | 0.275 | 0.783 | 0.058 | 5841.3 | 0.389 | no | Increasing | |
| Addis Aba | 0.490 | 0.624 | 0.113 | 6326 | 0.506 | no | Increasing | |
| Alem Tena | 0.490 | 0.624 | 0.113 | 6326 | 0.506 | no | Increasing | |
| Awash 7 K | −1.378 | 0.168 | −0.444 | 3802.7 | −1.441 | no | Decreasing | |
| Bati | 0.750 | 0.453 | 0.388 | 2841 | 0.745 | no | Increasing | |
| Chefedonsa | −1.597 | 0.110 | −0.289 | 6326 | −1.639 | no | Decreasing | |
| Combolcha | 0.379 | 0.704 | 0.059 | 0.054 | 5846 | −0.161 | no | Increasing |
| Dubity | 0.101 | 0.920 | 0.059 | 6325 | −0.161 | no | Increasing | |
| Gewane | 2.080 | 0.038 | 0.727 | 5844 | 2.131 | yes | Increasing | |
| Huruta | −0.692 | 0.489 | −0.113 | 6326 | −0.735 | no | Decreasing | |
| Majete | 0.257 | 0.797 | 0.187 | 2562 | 0.287 | no | Increasing | |
| Sirinka | 0.257 | 0.797 | 0.187 | 2562 | 0.287 | no | Increasing | |
| Tulu Bolo | −0.541 | 0.589 | −0.541 | 6319.3 | −0.618 | no | Decreasing | |
| Meiso | 0.022 | 0.982 | 0.024 | 2057.3 | 0.048 | no | Increasing | |
| Koka Dam | 0.022 | 0.982 | 0.024 | 2057.3 | 0.048 | no | Increasing | |
| Debre Zeit | 1.171 | 0.241 | 0.258 | 4549.3 | 1.187 | no | Increasing |
Table 2.
Summary of MK and SR test for annual precipitation (AP).
| Station Name | MK-Z | p-Value | Sen’s Slope | Pre-Whitened SS | Var(S) | SR-Z | Sig Trend | Trend Type |
|---|---|---|---|---|---|---|---|---|
| Abomsa | −2.120 | 0.034 | −7.814 | 2842 | −2.111 | yes | Decreasing | |
| Addis Aba | 1.634 | 0.102 | 4.427 | 6327 | 1.782 | no | Increasing | |
| Alem Tena | 0.982 | 0.326 | 0.284 | 3138.7 | 1.265 | no | Increasing | |
| Awash 7 K | −2.108 | 0.035 | −5.541 | −4.121 | 3461.7 | −2.604 | yes | Decreasing |
| Bati | −0.581 | 0.561 | −2.324 | 2842 | −0.563 | no | Decreasing | |
| Chefedonsa | 1.659 | 0.097 | 5.100 | 6327 | 1.915 | no | Increasing | |
| Combolcha | 0.589 | 0.556 | 7.828 | 6.402 | 5846 | 0.431 | no | Increasing |
| Dubity | 0.957 | 0.339 | 0.310 | 2840 | 1.129 | no | Increasing | |
| Gewane | 3.283 | 0.001 | 11.018 | 5846 | 3.031 | yes | Increasing | |
| Huruta | 0.830 | 0.407 | 1.704 | 6327 | 0.841 | no | Increasing | |
| Majete | −0.083 | 0.934 | −5.814 | −0.506 | 2301 | −1.229 | no | Decreasing |
| Sirinka | −0.232 | 0.817 | 0.076 | −0.046 | 5390 | 0.449 | no | Decreasing |
| Tulu Bolo | −0.528 | 0.597 | −2.858 | 6327 | −0.425 | no | Decreasing | |
| Meiso | 0.970 | 0.332 | 4.949 | 2058.3 | 0.863 | no | Increasing | |
| Koka Dam | −0.510 | 0.610 | −3.418 | −1.830 | 5846 | −1.159 | no | Decreasing |
| Debre Zeit | 0.356 | 0.722 | 0.646 | 4550.3 | 0.563 | no | Increasing |
Table 3.
Summary of MK and Sen’s slope test for Annual Maximum Temperature (AMaT) and Annual Minimum Temperature (AMiT).
Table 3.
Summary of MK and Sen’s slope test for Annual Maximum Temperature (AMaT) and Annual Minimum Temperature (AMiT).
| Station Name | Annual Maximum Temprature (AMaT) | Annual Minimum Temprature (AMiT) | ||||||||
|---|---|---|---|---|---|---|---|---|---|---|
| MK-Z | Sen’s Slope | Pre-Whitened SS | MK Sig | MK Trend | MK-Z | Sen’s Slope | Pre-Whitened SS | MK Sig | MK Trend | |
| Abomsa | 3.433 | 0.063 | 0.061 | yes | Increasing | 2.045 | 0.029 | 0.02 | yes | Increasing |
| Addis Aba | 3.746 | 0.034 | 0.022 | yes | increasing | 1.986 | 0.058 | 0.013 | yes | Increasing |
| Alem Tena | 1.986 | 0.058 | 0.013 | yes | Increasing | 0.431 | 0.053 | 0.009 | no | Increasing |
| Awash 7 K | 3.454 | 0.039 | 0.031 | yes | Increasing | 1.411 | 0.023 | 0.007 | no | Increasing |
| Bati | 0.769 | 0.039 | 0.011 | no | Increasing | −2.997 | −0.046 | yes | decreasing | |
| Chefedonsa | 0.49 | 0.145 | 0.014 | no | Increasing | 5.424 | 0.071 | yes | Increasing | |
| Combolcha | 0 | 0.12 | −0.001 | no | Decreasing | 3.294 | 0.059 | 0.04 | yes | increasing |
| Dubity | 3.17 | 0.043 | 0.033 | yes | Increasing | 5.424 | 0.071 | yes | Increasing | |
| Gewane | 1.766 | 0.085 | 0.017 | no | Increasing | 1.399 | 0.064 | 0.029 | no | Increasing |
| Huruta | 1.584 | 0.029 | 0.009 | no | Increasing | 3.017 | 0.067 | 0.054 | yes | Increasing |
| Majete | 4.09 | 0.053 | yes | Increasing | 0.25 | 0.009 | 0.003 | no | Increasing | |
| Sirinka | 3.596 | 0.026 | yes | Increasing | 0.302 | 0.002 | no | Increasing | ||
| Tulu Bolo | 1.257 | 0.062 | 0.033 | no | Increasing | −0.994 | 0.017 | −0.017 | no | Decreasing |
| Meiso | 3.35 | 0.05 | 0.048 | yes | Increasing | 0.176 | 0.004 | 0.008 | no | Increasing |
| Koka Dam | 0.114 | 0.037 | 0.003 | no | Increasing | −2.301 | −0.110 | −0.042 | yes | Decreasing |
| Debre Zeit | 2.154 | 0.023 | 0.017 | yes | Increasing | −0.418 | −0.008 | −0.005 | no | Decreasing |
(+) indicates an increasing trend and (−) indicates a decreasing trend type.
Table 4.
Mean annual Flow (MAF), Annual Maximum Flow (AMaxF), and Total mean Annual Flow (TMAF) trends of Tendaho station using MK and SR methods.
Table 4.
Mean annual Flow (MAF), Annual Maximum Flow (AMaxF), and Total mean Annual Flow (TMAF) trends of Tendaho station using MK and SR methods.
| Indices | MK-Z | p-Value | Sen’s Slope | Pre-Whitened SS | MK Sig | MK Trend | SR-Z | SR Sig | SR Trend |
|---|---|---|---|---|---|---|---|---|---|
| MAF | −0.669 | 0.504 | −0.333 | no | Decreasing | −0.738 | no | Decreasing | |
| AMaxF | −0.573 | 0.567 | −6.630 | −2.91 | no | Decreasing | −1.382 | no | Decreasing |
| TMAF | −0.750 | 0.453 | −3.889 | no | Decreasing | −0.772 | no | Decreasing |
Publisher’s Note: MDPI stays neutral with regard to jurisdictional claims in published maps and institutional affiliations. |
© 2020 by the authors. Licensee MDPI, Basel, Switzerland. This article is an open access article distributed under the terms and conditions of the Creative Commons Attribution (CC BY) license (https://creativecommons.org/licenses/by/4.0/).
Share and Cite
MDPI and ACS Style
Wakeyo, F.N.; Melesse, A.M.; Abate, B. Trends of Hydro-Meteorological Indices in Tendaho Catchment Part of Awash River Basin, Ethiopia. Environ. Sci. Proc. 2021, 4, 33. https://0-doi-org.brum.beds.ac.uk/10.3390/ecas2020-08127
AMA Style
Wakeyo FN, Melesse AM, Abate B. Trends of Hydro-Meteorological Indices in Tendaho Catchment Part of Awash River Basin, Ethiopia. Environmental Sciences Proceedings. 2021; 4(1):33. https://0-doi-org.brum.beds.ac.uk/10.3390/ecas2020-08127
Chicago/Turabian StyleWakeyo, Fekremariam N., Assefa M. Melesse, and Brook Abate. 2021. "Trends of Hydro-Meteorological Indices in Tendaho Catchment Part of Awash River Basin, Ethiopia" Environmental Sciences Proceedings 4, no. 1: 33. https://0-doi-org.brum.beds.ac.uk/10.3390/ecas2020-08127