
Analysis of Community Interaction Modules of European and American Universities


Department of Mass Communication, Tamkang University, Tamsui District, New Taipei City 25137, Taiwan
Journal. Media 2021, 2(2), 129-154; https://0-doi-org.brum.beds.ac.uk/10.3390/journalmedia2020009
Submission received: 5 March 2021
/
Revised: 29 March 2021
/
Accepted: 6 April 2021
/
Published: 14 April 2021
Abstract
:Purpose—Using a sample of universities from Europe and North America the research herein seeks to understand the content trends of university brand pages through an exploration of the social community and the measurement of user participation and behavior. The analysis relies on an artificial intelligence approach. Through the verification of interactions between users and content on the university brand pages, recommendations are made, which aim to ensure the pages meet the needs of users in the future. Design/methodology/approach—The study sample was drawn from six well-known universities in Europe and North America. The content of 23,158 posts made over the course of nine years between 1 January 2011 to 31 December 2019 was obtained by a web crawler. Concepts in the fields of computer science, data mining, big data and ensemble learning (Random Decision Forests, eXtreme Gradient Boosting and AdaBoost) were combined to analyze the results obtained from social media exploration. Findings—By exploring community content and using artificial intelligence analysis, the research identified key information on the university brand pages that significantly affected the cognition and behavior of users. The results suggest that distinct levels of user participation arise from the use of different key messages on the university fan page. The interactive characteristics identified within the study sample were classified as one of the following module-types: (a) information and entertainment satisfaction module, (b) compound identity verification module or (c) compound interactive satisfaction module. Research limitations/implications—The study makes a contribution to the literature by developing a university community information interaction model, which explains different user behaviors, and by examining the impact of common key (image) clues contained within community information. This work also confirms that the behavioral involvement of users on the university’s brand page is closely related to the information present within the university community. A limitation of the study was the restriction of the sample to only European and North American cultural and economic backgrounds and the use of Facebook as the sole source of information about the university community. Practical implications—Practically, the research contributes to our understanding of how, in official community interactions, user interactions can be directed by features such as information stimuli and brand meanings. In addition, the work clarifies the relationship between information and user needs, explaining how the information characteristics and interaction rules particular to a given school can be strengthened in order to better manage the university brand page and increase both the attention and interaction of page users. Originality/value—This research provides an important explanation of the role of key information on the university fan pages and verifies the importance of establishing key (image) clues in the brand community, which in turn affect user cognition and interaction. Although related research exists on information manipulation and the importance of online communities, few studies have directly discussed the influence of key information on the fan pages of university brands. Therefore, this research will help to fill gaps in the literature and practice by examining a specific context, while at the same time providing a valuable and specific reference for the community operation and management of other related university brands.
1. Research Background
It is estimated that there are approximately 2 billion people active on social media globally. Given such a huge potential audience, academic institutions have sought to use social media for messages about brand promotion, research successes and community development (Salomon 2013). Frequently, messages address topics of interest such as available courses and more general topics of interest (Hansen et al. 2012). Moreover, in light of the competition among high-ranking universities across the world, brand building has become important for the image of high schools as well. Equally, university pages have also become an important tool of brand promotion (Opoku et al. 2006). Fan pages often supply unofficial lifestyle or study information, but may also serve as a reference for high school students seeking to choose a university (Rolfe 2003). Universities can conduct informal conversations through communities and use different social media platforms such as Facebook, Instagram, Snapchat, Twitter and LinkedIn to interact with a greater number of potential students (Camilleri 2019). Social media has also increased the brand awareness of universities (Constantinides and Stagno 2011; Kuzma and Wright 2013) while offering a valuable marketing tool. The effective use of social media can help students to identify suitable universities and establish a positive dialogue between both parties through continuous brand communication. Therefore, to be successful, the university must seek to use innovative methods to highlight the university’s unique image.
In light of this, the construction of a community image is very important for any university (Abdelmaaboud et al. 2020; Kiang et al. 2000; Opoku et al. 2006). The combination of text and images contained on the fan page may serve as the basis for a user’s general impression of the institution (Saichaie and Morphew 2014). At present, most universities in the United States and the United Kingdom use Twitter for community conversations. Unfortunately, much of the literature on university social media sites focuses on the effectiveness of teaching and learning (Fikkers and Piotrowski 2020), seldom mentioning the value and significance of the page’s content. This research aims to investigate how a university can successfully establish an interactive relationship with users through the analysis of university fan pages. The research examines the fan pages of six well-known universities in Europe and America, including the following UK universities: Imperial College London, University of Cambridge and University of Oxford; and the following US universities: California Institute of Technology, Massachusetts Institute of Technology and Stanford University. By analyzing the unconstructed text on the Facebook pages of the above universities, the study attempts to answer the following two questions:
- (a)
- Do posts on the fan pages of European and North American universities have specific “key (image) clues” to help build and promote the brand image of the university?
- (b)
- Using a machine learning, artificial intelligence approach, can the gratification of users, drawn from the information provided, be actively discovered based on interactive data, and is this amenable to behavioral analysis and prediction?
Previous related research on information management has shown that high-level visual information can successfully trigger positive emotional and behavioral responses from users (Foroudi et al. 2020; Foroudi et al. 2019). For example, stimuli such as gratification, trust and value recognition can help to promote the accuracy of a user’s judgment of information, while at the same time also increasing the task value of information (Liu and Goodhue 2012; Wells et al. 2011). Furthermore, such stimuli can also increase brand trust and strengthen the link between the information and brand. However, within the field of community research, attention is generally limited to investigations of the behavior of users (Hashim et al. 2020; Parboteeah et al. 2009; Weng et al. 2010). To date, there are few discussions on the influence of social media content on behavioral interactions and even fewer that explore and analyze the content of the university social media pages.
Therefore, this study focuses specifically on: (a) examining a sample of well-known universities in Europe and North America; (b) understanding the content trends of university brand pages through community content exploration technology and using artificial intelligence calculation analysis to measure users’ participation and behavior; (c) proposing relevant verifications of the interactive benefits and making feasible suggestions for future analysis of the needs of users in university communities.
Overall, complete hypothesis verification and result analyses are constructed based on the open and transparent content and data available on the fan page, from which reviews are conducted and the social media operating characteristics of well-known European and North American universities are characterized. The second section of this paper briefly discusses the current literature on social media information, social media use and the theory of gratification. The third section of this paper suggests relevant hypotheses relating to university brand pages to evaluate the relationship between key information and user behavior. The fourth section of this paper focuses on the research methods. The fifth section contains data analysis and, finally, the sixth section discusses results, suggesting how the research model can be used to plan relevant university community information.
2. Literature Review
2.1. Community Information and Crowd Participation
Common Facebook fan-page information includes text, images, videos, URL links, votes, calls to action, etc. (De Vries et al. 2012). Pages users are able to like, share and comment by posting (Araujo and Neijens 2012; Curras-Perez et al. 2014). Facebook pages are widely used in political communication (Woolley et al. 2010), advertising (Chu 2011), demand gratification (Park et al. 2009), life consultation (Bender et al. 2011) and a range of other purposes including education (Meishar-Tal et al. 2012). In addition to regular brands, many non-profit organizations have also created fan pages, which serve as exclusive communication platforms (Cvijikj and Michahelles 2011; Fumasoli et al. 2020).
Facebook fan pages have settings for images, videos and links (De Vries et al. 2012). This diverse selection of media features produces rich online presentations (Coyle and Thorson 2001), stimulating user interaction based on different types of content (Liu and Shrum 2002). Furthermore, due to differences in brand positioning, content characteristics can be altered (De Vries et al. 2012; Lee et al. 2020). For example, posts that emphasize functional purposes are suitable for providing specific, practical information (Cvijikj and Michahelles 2011). On the other hand, entertaining posts can attract attention with humor and interesting content. If page managers were able to ensure that the information design of the fan page was appropriate, a better understanding of user gratification would develop and an overall improved user experience would become possible. (Liu et al. 2013). In addition, the issue of users rejecting information because of poor design and unattractiveness would become easier to avoid (Liu and Goodhue 2012; Pinar et al. 2020).
Since the importance of community participation continues to be valued, a greater number of studies have focused on observing the interaction between social media and its users. This includes studies on how brand messages may be effectively delivered to users, or how users may be stimulated to effectively and actively participate, thereby becoming active members of the brand community (Valenzuela et al. 2009). Behavioral responses have always been regarded as indicators of reference significance (Brodie et al. 2013; Schau et al. 2009). For example, online clicks and webpage views are used for multiple examinations and evaluations (Lehmann et al. 2012). Regarding the cognitive and behavioral responses of users, common drivers of responses include affection needs, tool needs, information needs and evaluation needs. Information needs and affection needs are necessary prerequisites for behavioral participation and are dependent on the extent of users’ appetite for information or emotional stimuli (Liang et al. 2011). Information needs refer to the practical value and significance of the content and result in behaviors such as recommending, suggesting or sharing (Liang et al. 2011; Yousaf et al. 2020). Affection needs refer to the emotions that users invest in the process, such as care, understanding, anger, sadness and sympathy, which are often then expressed as likes or dislikes on posts.
The existing literature has found that different factors underlie public participation (Laroche et al. 2013). For example, participation is not only driven by the desire to obtain a product (Weinberg and Pehlivan 2011), a service or brand information (Bruhn et al. 2012). Participation also allows users to build relationships with the community, which is frequently achieved through blogs, videos or images, sharing and recommendations (Schivinski and Dabrowski 2016). Such participation stimulates website traffic and increases brand discussions and popularity (Kim and Ko 2012; Lee et al. 2020). To exert a positive effect on user–brand interaction (Laroche et al. 2013), brands must constantly consider the impact of social media on the public (Bruhn et al. 2012). Only when the value of social media is better understood will brands be able to maximize the gratification benefits.
2.2. Uses and Gratifications
According to the different functions mentioned above, different forms of gratification exist (Horton and Richard Wohl 1956) and can be generated via the interaction of users with social media (Thorson and Rodgers 2006). This is particularly the case when communities offer unique interactivity. There exists a wide body of information-related research, including studies on information interaction and community association verification (Teo et al. 2003), information profitability, online participation characteristics and multiple other aspects. In relation to content, the context structure of traditional media newspapers (Robins et al. 2001), the characteristics of online content (Luo et al. 2011) and the information needs of mobile services have all been previously investigated (Lee et al. 2010).
Early research into use and gratification can be roughly divided into two categories (Katz et al. 1973): process gratification and content gratification (Raacke and Bonds-Raacke 2008; Stafford et al. 2004). In addition to exploring the reasons behind the choices made by users, research has sought to verify how users achieve self-gratification through experiences. As such, use and gratification theories are particularly relevant in explaining user decision-making motivations and the key drivers of choice (Luo et al. 2011; Xu et al. 2012).
“Process gratification” refers to the cognition, experience and evaluation of users (Weng et al. 2010). This includes participation, searching, dialogue and communication, especially in cases where a community provides a demand framework that can simultaneously meet pragmatic demands, social demands, available demands and enjoyment demands. Process gratification also explains the basic motivation of user participation in the community. A user may derive satisfaction in terms of cognition, interaction and enjoyment, which reflects the importance of pragmatic demands, social demands and enjoyment demands (Kohler et al. 2011).
On the other hand, the four keys to “content gratification” include information recognition gratification, emotional cognitive gratification, social gratification and entertainment gratification (Leung 2009). By enabling communication, entertainment, an escape from reality and the ability to maintain relationships, social media can meet the content demands of users. Therefore, young people frequently use social media to satisfy one or more of the following six items: amusement, affection, fashion, sharing, social interaction and social information (Dunne et al. 2010). In relation to content gratification, recognizing the reasons for the use of social media and strengthening the practical, social and enjoyment aspects should all be important objectives for social media information. The practical level refers to the feedback received by users in the information acquisition process (Kohler et al. 2011). In the process of receiving information, users may obtain brand-related knowledge, which contributes to the overall perceptions of the brand (Nambisan and Baron 2009). The community is the relationship between the brand and users, and the content is the basic element that affects community participation. Therefore, precise content serves to establish and enhance the physical participation of users, community identity and overall sense of community.
Users who share similar interests can recommend and comment (Pagani and Mirabello 2011) and, through such interactions, can establish their own social identity and build community support, friendship or intimacy (Dholakia et al. 2004). Furthermore, psychological support and attention can help users within the community to obtain inner gratification (Liang et al. 2011). Community experience may also prompt users to realize their own self-worth in the community. When the community environment reflects the personal values of users, more active participation in the community is engendered (Pagani and Mirabello 2011; Webster et al. 1993), mainly because users wish to present themselves through interaction (Liang et al. 2011).
According to social exchange theory, in addition to obtaining information value from community interaction, user interaction produces a sense of self-demand. Therefore, information content with a high degree of perception is more likely to produce self-expression, which in turn generates recognition and support for the community. Therefore, whether content perception is positive or not will further affect the perception of a brand (Fortin and Dholakia 2005; Wallace et al. 2014a). Efficient content and behavior complement each other, which in turn leads to positive communication effects (Rafaeli and Ariel 2007). In addition, interaction results in increased use of media (Thorson and Rodgers 2006); this is consistent with gratification theory, as users who identify with fan pages are more willing to interact in order to gain gratification. If a user’s self-image can be displayed in the community (Animesh et al. 2011), their sense of imagination can be satisfied naturally. Through personal participation and self-image projection, a user’s self-image may be transformed into a sense of belonging within the community. According to complementary needs theory, users are likely to choose multiple pieces of information drawn from the same category, which may elicit similar effects and convey a greater sense of practicality. In addition, multi-faceted information can help users obtain multiple pieces of information as well as gain multiple forms of gratification, such as interpersonal communication, self-expression, practicality and entertainment, as mentioned before. Therefore, in seeking a higher degree of complementary demands, users often actively seek information from different competing brands.
3. Research Hypotheses
After referring to the above literature, it is evident that information affects the cognitive state of users (Mehrabian and Russell 1974). For instance, in the example of e-commerce, it is clear that information exerts a positive impact on user perceptions (Parboteeah et al. 2009). Diversified information presentation may not only satisfy the multi-level curiosity of users regarding a given brand but may also induce users to experience a more complete entertainment effect (Muniz and O’Guinn 2001). Of course, it is assumed that the more frequently information is presented in alignment with a given task, the greater the possibility of task accomplishment (Nambisan and Baron 2009). This affirms the notion that information can help construct entertainment value and that well-positioned information is more likely to succeed in stimulating a pleasant experience among users (Animesh et al. 2011).
Therefore, we argue that the quality of information can be used to measure the accuracy and adequacy of a brand community’s content positioning, and in order to improve information efficiency, the behavioral gratification stimulated by the information is a suitable benchmark with which to measure the gratification of users. Currently, brands tend to use social media to convey information, not only by simply delivering the information but also by providing interactive posts that will encourage users to participate (Nambisan and Baron 2009). Social interaction by users can help to build stronger connections with the brand and establish a consistent brand identity with other users. Therefore, information not only connects users but also promotes social integration among them (Muniz and O’Guinn 2001).
If the self-realization and existence value of users are to be enhanced through interaction with the information by users (Tsai and Pai 2012), we argue that the content of the social media post is a basic element that will directly affect community participation. This is because information can directly drive the cognitive and emotional response of users as well as affect user participation behavior (Zhang et al. 2014). Through the observation of the social media pages of most businesses, it is evident that key elements are frequently used to raise the emotional support of their audience and strengthen the information power of the community (Schau et al. 2009). Brand communities not only reflect the objective attributes of users (Zhang et al. 2011) but also reflect the subjective demands of users (Weng et al. 2010).
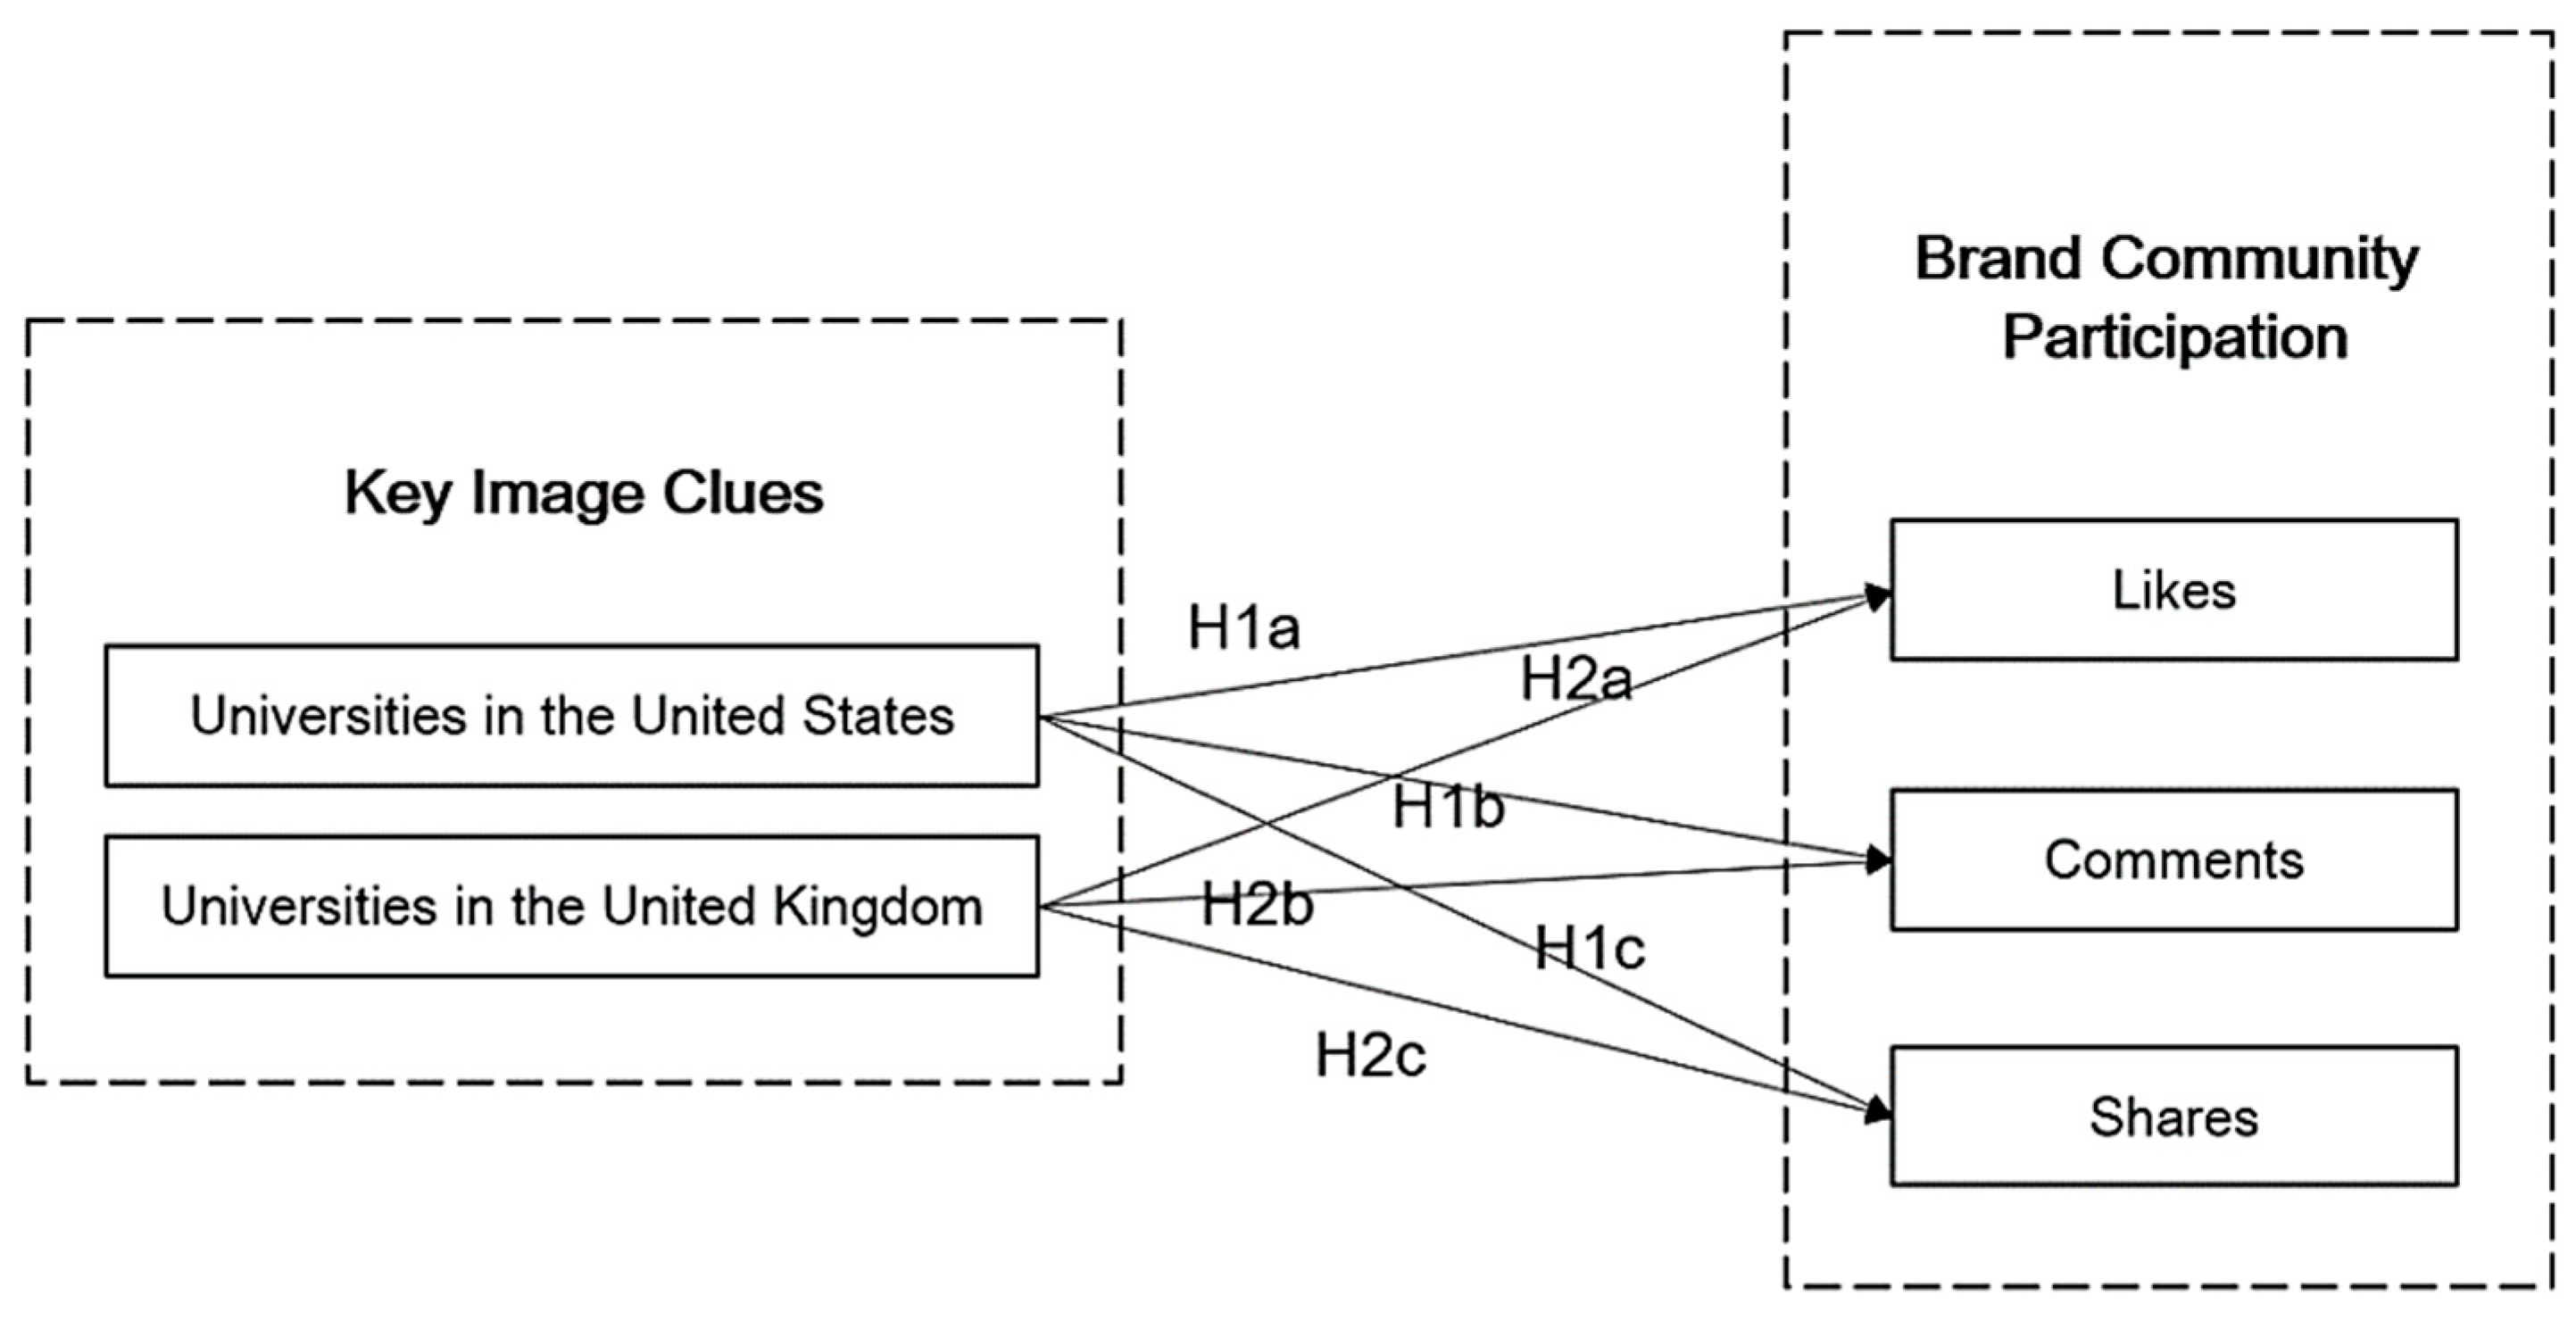
In particular, the click-through rate is more often regarded as an effective measurement of participation behavior (Brodie et al. 2013) and can also be used as a quantitative indicator of online participation (Lehmann et al. 2012). Measurements on Facebook include clicks, likes, comments, sharing and other substantive behaviors (Wallace et al. 2014a). Frequent information sharing creates a supportive environment in which brand information, brand knowledge and relevant experience are shared within the community (Liang et al. 2011). Therefore, stronger social interaction is more likely to result in high-quality information being shared by others. In view of this, this research attempts to understand the so-called information value by examining key (image) clues as a means of evaluating user gratification with information, and based on the above concepts, two central hypotheses are proposed (Figure 1).
Hypothesis 1a (H1a).
The university pages of universities in the United States possess “key (image) clues,” which have a significant influence on the “likes” of users.
Hypothesis 1b (H1b).
The university pages of universities in the United States possess “key (image) clues,” which have a significant influence on the “comments” of users.
Hypothesis 1c (H1c).
The university pages of universities in the United States possess “key (image) clues,” which have a significant influence on the “shares” of users.
Hypothesis 2a (H2a).
The university pages of universities in the United Kingdom possess “key (image) clues,” which have a significant influence on the “likes” of users.
Hypothesis 2b (H2b).
The university pages of universities in the United Kingdom possess “key (image) clues,” which have a significant influence on the “comments” of users.
Hypothesis 2c (H2c).
The university pages of universities in the United Kingdom possess “key (image) clues,” which have a significant influence on the “shares” of users.
4. Research Methodology
The study proceeded by conducting an empirical analysis of university brand pages to explore how key information contained within the post influences user participation. Facebook’s terms of service allow app designers to monitor interactions (Cvijikj and Michahelles 2011; Goorha and Ungar 2010). Most of the information on the Facebook fan pages is presented in four formats: text, photos, videos and links. The behavioral benchmark for measuring online participation includes three methods: clicking likes, commenting and sharing information (Wallace et al. 2014b). Therefore, this research adhered to Facebook’s terms of service, allowing app designers to participate in the relevant actions of interaction monitoring and in obtaining post data and content for the purpose of research (Cvijikj and Michahelles 2011; Goorha and Ungar 2010). Furthermore, to ensure the accuracy of the information, the Facebook Graph API was used to collect daily posts, including the content of each post, post type, posting time, post likes, post shares and post comments; this information was subsequently extracted and stored in the database for classification.
The samples of this study were taken from six well-known universities in Europe and America, including the following university fan pages: Imperial College London, University of Cambridge, University of Oxford, California Institute of Technology, Massachusetts Institute of Technology and Stanford University. Each fan page must meet the criteria of being stable and continuously updated, and the university must be among the top ten universities in North America and Europe. The content of posts from January 1, 2011 to December 31, 2019 was obtained through web crawlers, as well as the number and content of public responses to all corresponding articles. In total, 23,158 posts were received, of which 12,411 were posts from universities in the United Kingdom and 10,747 were posts from universities in the United States.
To ensure the validity of the content, the measurement items in this study directly adopted the functional classification set by Facebook and were appropriately divided into behavioral responses (like, comment, share). In addition, relevant research on visual perception was referred to (Loiacono et al. 2007), and the cognitive gratification and behavioral gratification of the crowd was measured (Nambisan and Baron 2009) in order to integrate relevant research theory. At the same time, concepts from the fields of computer science, data mining, big data and ensemble learning (Random Decision Forests, eXtreme Gradient Boosting and AdaBoost) were combined to discuss social media exploration.
5. Data Analyses and Results
5.1. Reliability and Validity
For reliability and validity analysis of the data, principal component factor analysis was performed to test the factor validity of the scale. The factor characteristic value of universities in the United States had a total variance of 74.094% and a KMO value of 0.910. The factor characteristic value of universities in the United Kingdom had a total variance of 81.987% and a KMO value of 0.886. The expected load factor for all items is >0.5, indicating good convergence and discriminant validity. In addition, the reliability test produced a Cronbach’s alpha of 0.898 for universities in the United States and 0.886 for universities in the United Kingdom. Each of these results shows good reliability (Figure 2).
5.2. Hypothesis Testing
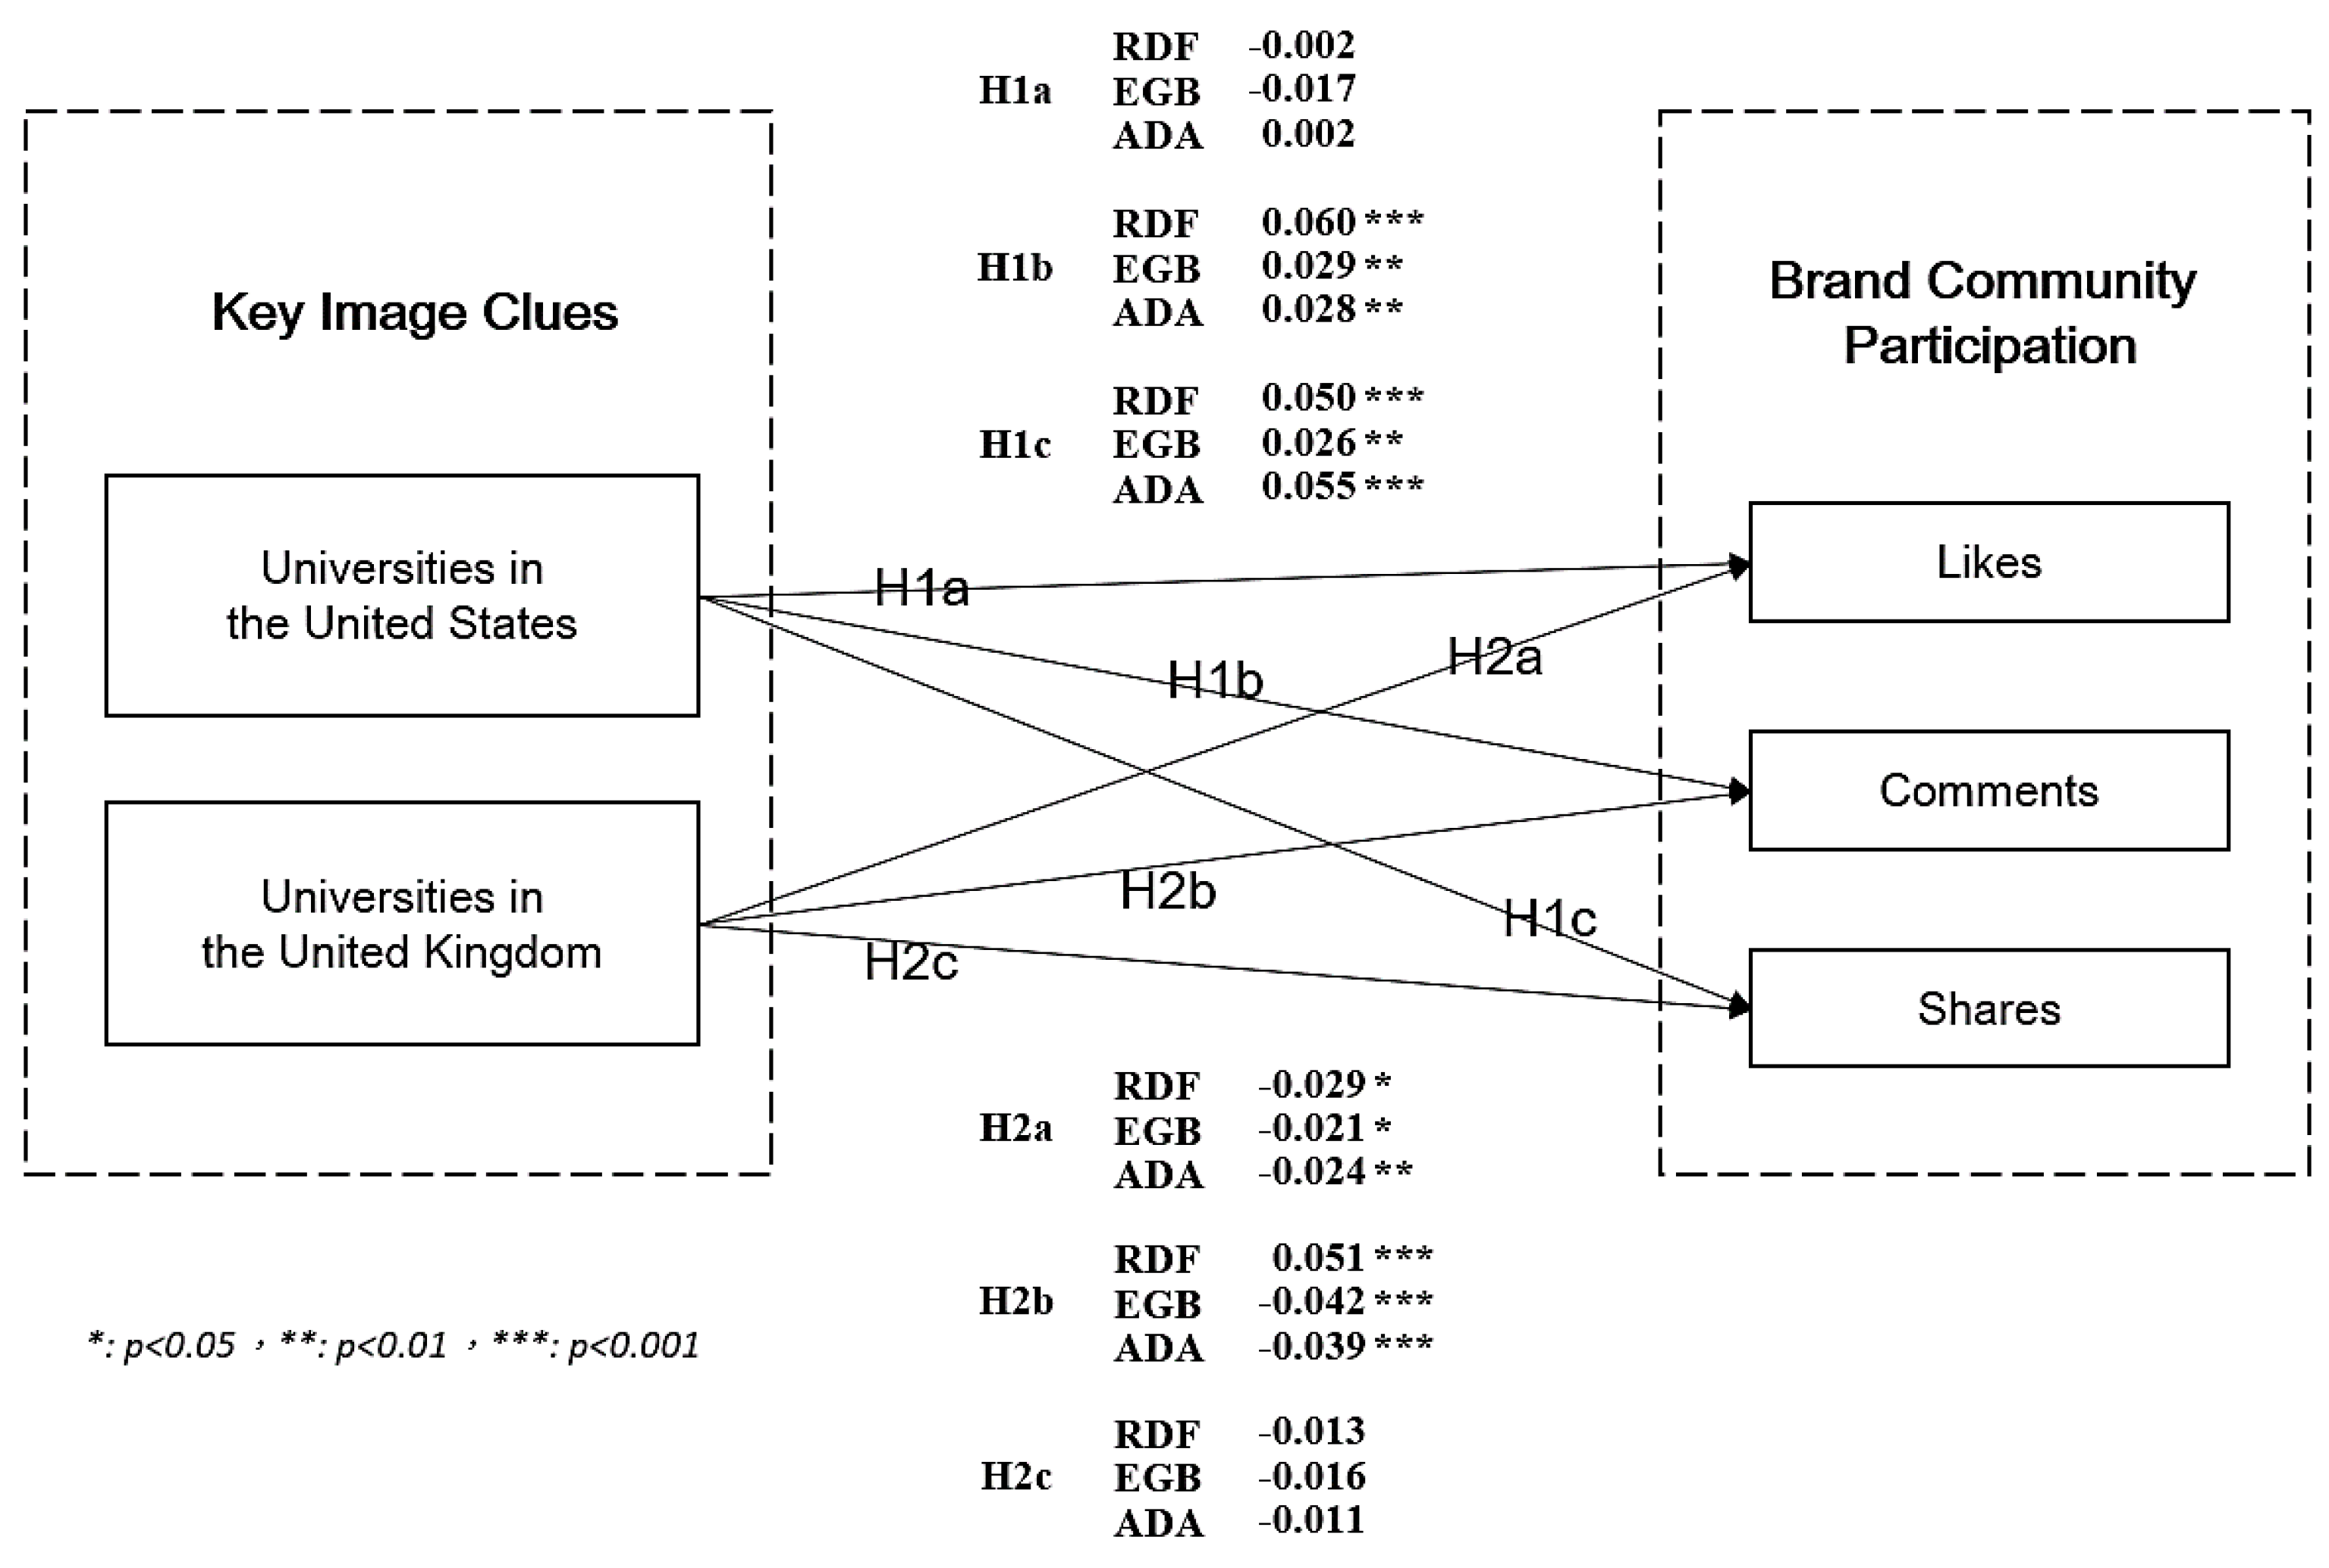
The results show that the university pages of universities in the United States possess “key (image) clues” and had a significant influence on the behavior of users (likes, comments, shares). Through ensemble learning, the following results were obtained: the key (image) clues provided by Random Decision Forests, AdaBoost and eXtreme Gradient Boosting were found to be significant predictors of comments and shares. The results show that the key predictions provided by Random Decision Forests, AdaBoost and eXtreme Gradient Boosting indicate that interaction via likes and comments were as predicted for the university pages of universities in the United Kingdom (Table 1).
5.3. Data Verification
The results show that the key clues of social media significantly affected the public’s response to content and behavior. The hypotheses on information among universities in the United States are supported. The behavior of users (comments) was found to have a significant impact on Random Decision Forests (β = 0.060, p < 0.000), eXtreme Gradient Boosting (β = 0.029, p < 0.002) and AdaBoost (β = 0.028, p < 0.003) made by users. Shares were found to have a significant impact on Random Decision Forests (β = 0.050, p < 0.000), eXtreme Gradient Boosting (β = 0.026, p < 0.007) and AdaBoost (β = 0.055, p < 0.000) (Table 2). Furthermore, the hypotheses on information among universities in the United Kingdom are supported. The behavior of users (likes) was found to have a significant impact on Random Decision Forests (β = −0.029, p < 0.001), eXtreme Gradient Boosting (β = −0.021, p < 0.018) and AdaBoost (β = −0.024, p < 0.008) made by users. Comments were found to have a significant impact on Random Decision Forests (β = 0.051, p < 0.000), eXtreme Gradient Boosting (β = −0.042, p < 0.000) and AdaBoost (β = −0.039, p < 0.000) (Table 3).
5.4. Data Findings
Ensembled learning was used to recommend key clues and organize the key (image) clues to achieve the significant impacts shown in Figure 3. This study uses three integrated analyses to compare each university page’s posts with their higher-than-average interactions through positive clues (red) and negative clues (blue). It was found that there are some similarities and differences in the operation of key clues of each brand. The main characteristics of the clues after comparison are as follows.
(A) University in the United States: Stanford University
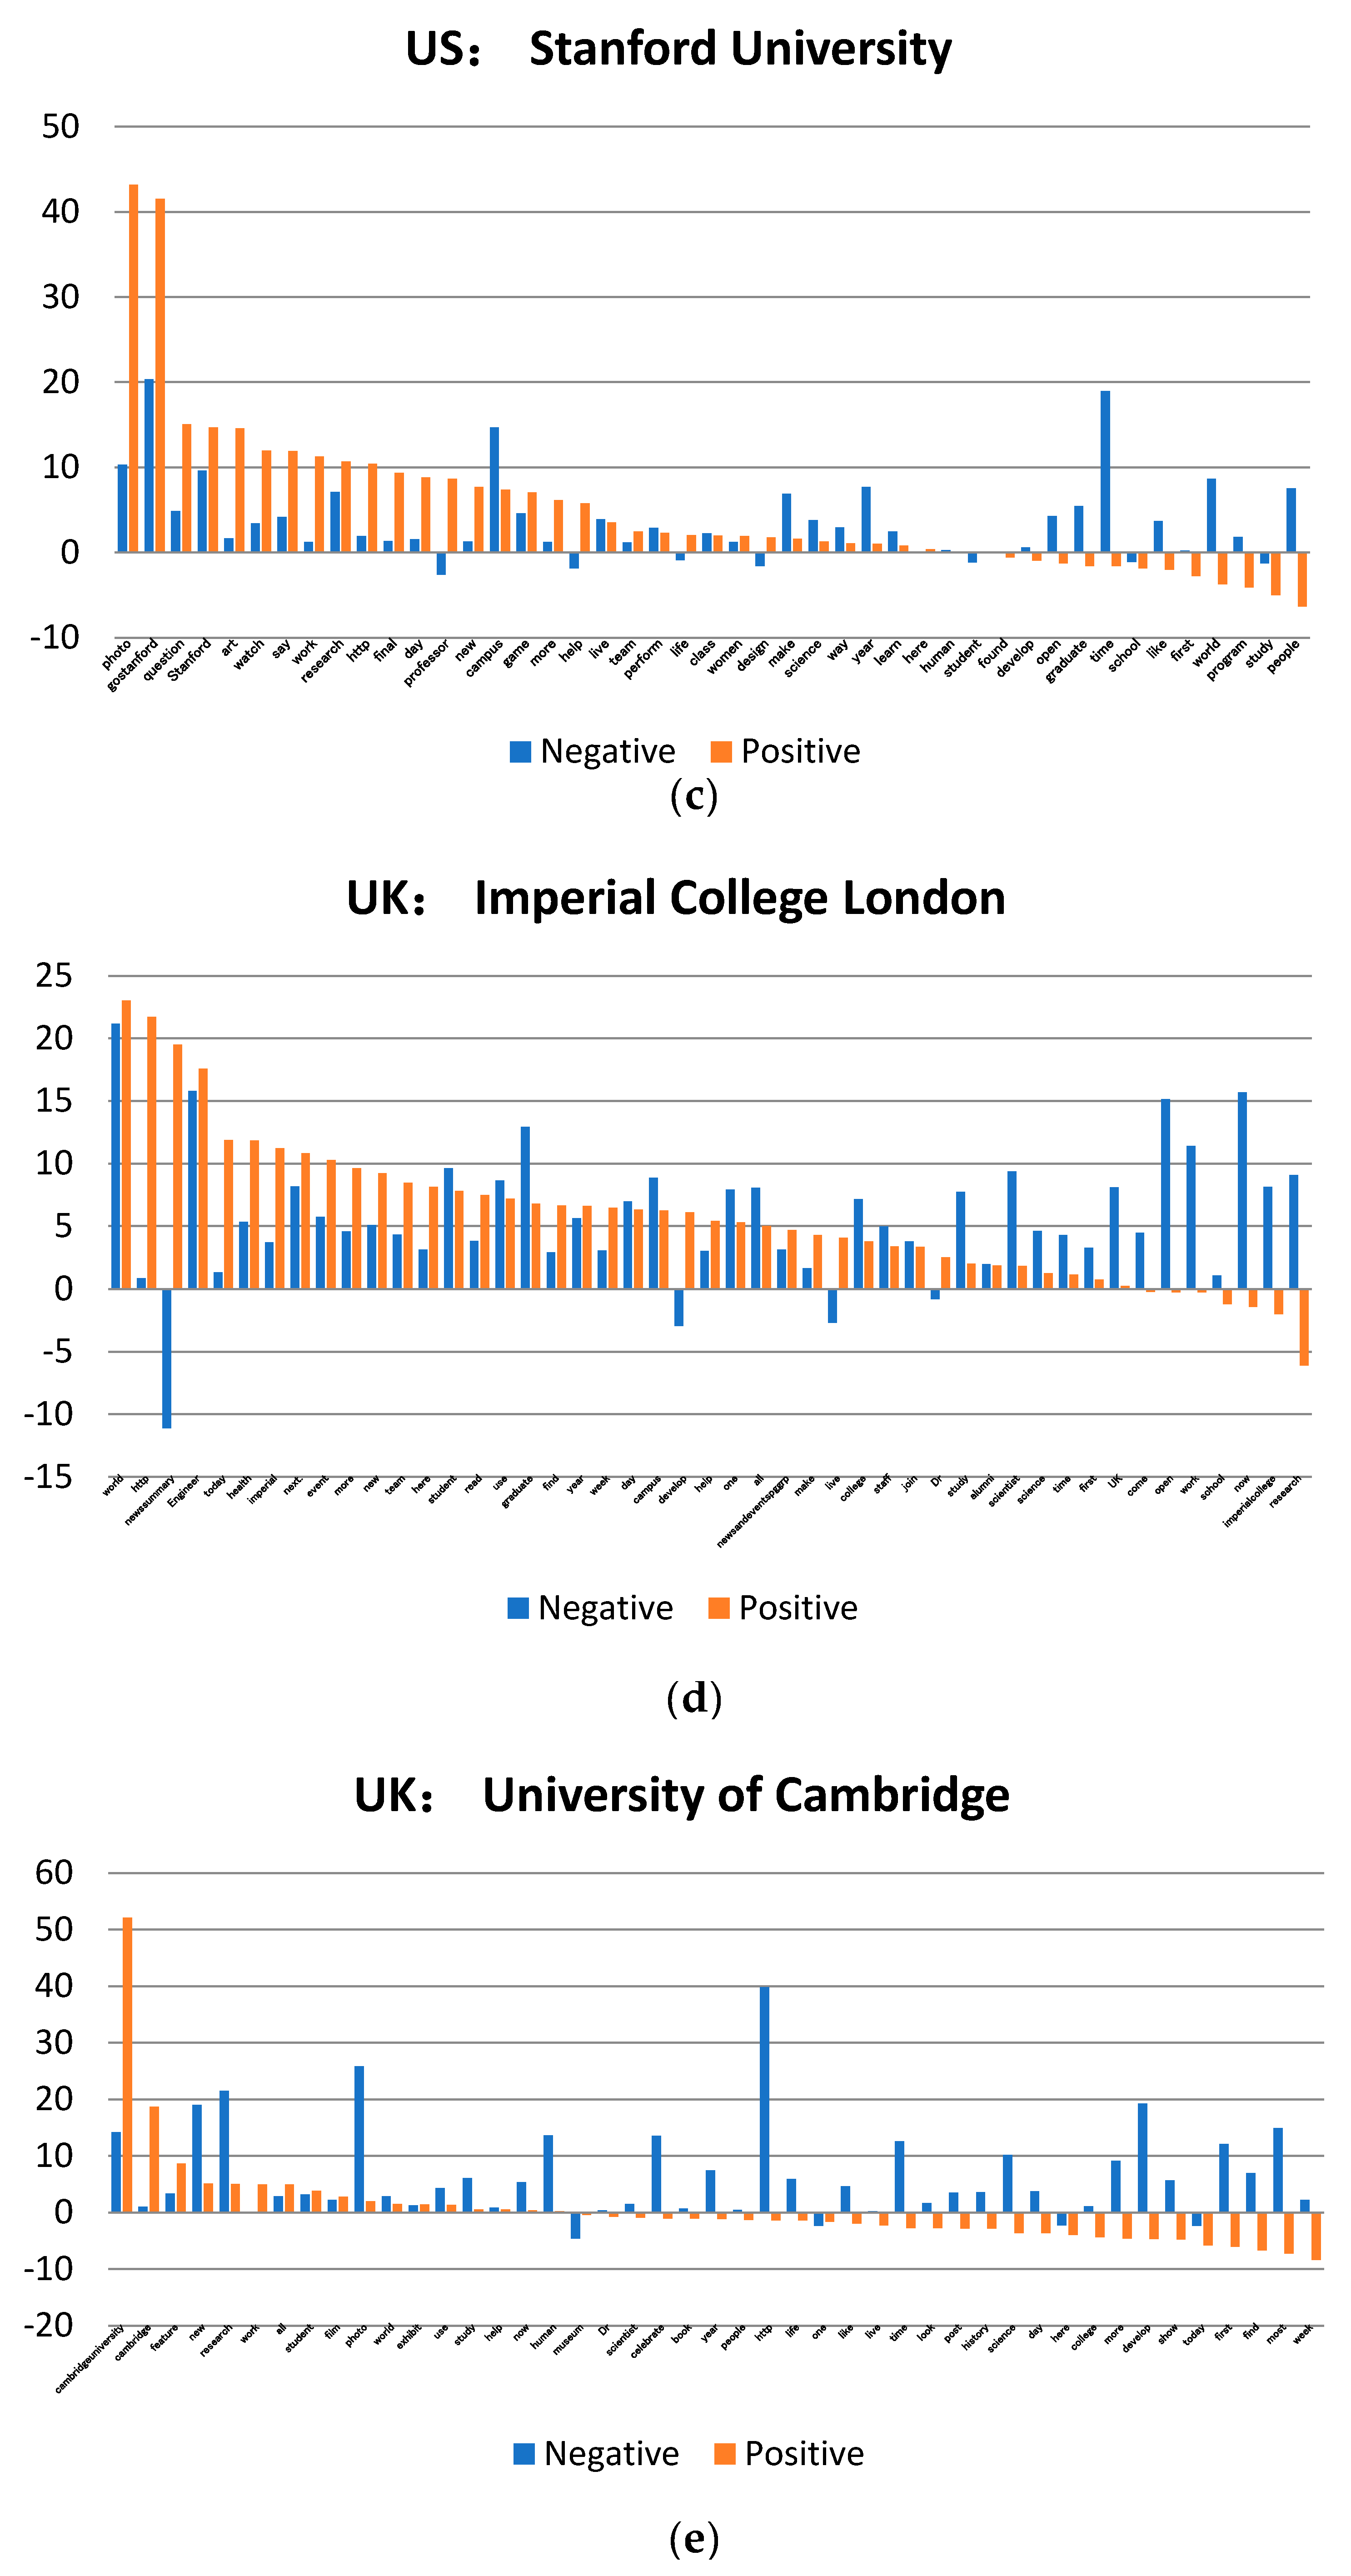
The key (image) clues provided by Random Decision Forests for likes included “photos,” “gostanford,” “question,” “Stanford” and “art”; the clues for comments included “gostanford,” “photo,” “http,” “watch” and “game”; the clues provided by eXtreme Gradient Boosting for likes included “Stanford,” “art,” “http,” “day” and “campus”; and the clues provided by AdaBoost for likes included “open,” “science,” “like,” “make” and “world” (Table A1, Appendix A).
Random Decision Forests and eXtreme Gradient Boosting jointly recommended “Stanford,” “art” and “campus”. These constituted recommendations for image construction, such as “Stanford” or “campus,” which received a high level of attention in terms of likes and comments. AdaBoost, on the other hand, returned “open,” “program,” “science” and “world.” These are keyword feature that, after the initial image construction is completed, are packaged into popular user topics such as, for example, course-related information, such as “open” and “program,” or representative research achievements, such as “science” and “world.” These then serve to successfully stimulate the cognition and intentions of the audience.
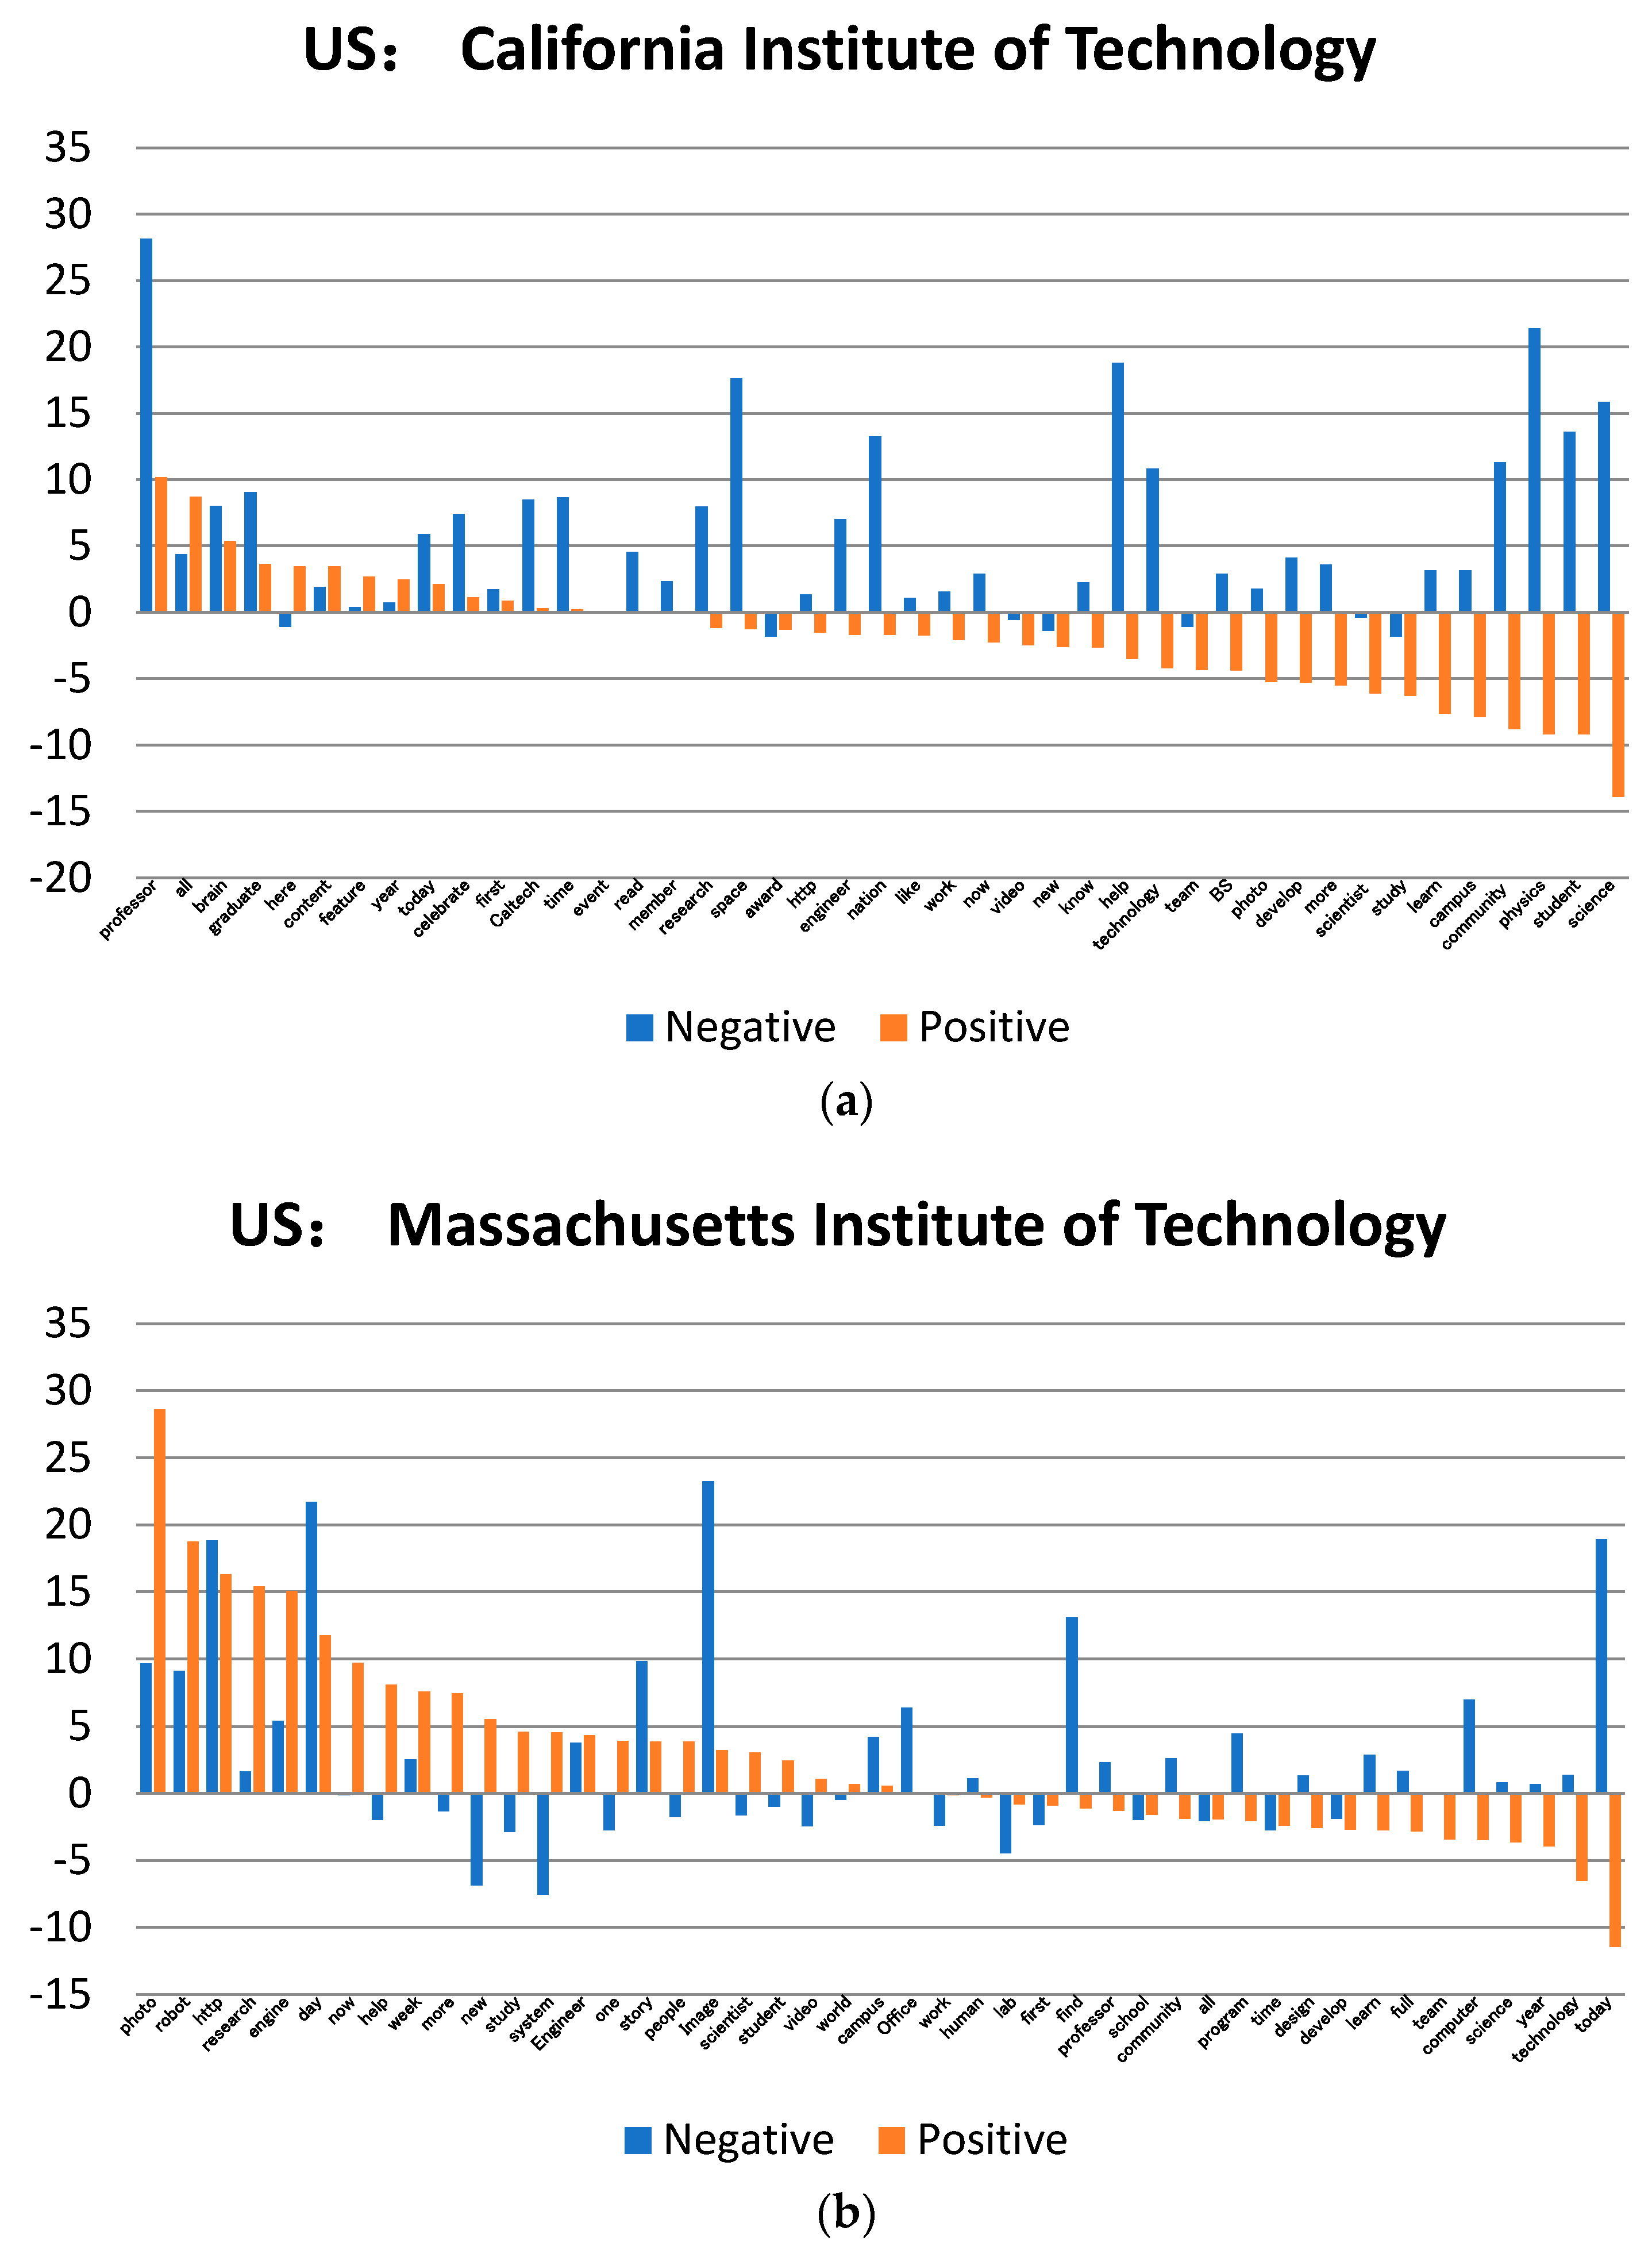
(B) University in the United States: Massachusetts Institute of Technology
The key (image) clues provided by Random Decision Forests for comments included “campus,” “http,” “engine,” “research” and “robot”; the clues for shares included “more,” “engine,” “research,” “http” and “scientist”; the clues provided by eXtreme Gradient Boosting for comments included “http,” “research,” “now,” “new” and “more”; and the clues for shares included “http,” “Office,” “all,” “new” and “more.” The key (image) clues provided by AdaBoost for shares included “study,” “today,” “school,” “Office” and “scientist” (Table A2).
Random Decision Forests and eXtreme Gradient Boosting jointly recommended “research,” “http” and “new.” AdaBoost suggested “study,” “today,” “school,” “Office” and “scientist,” and it found that the use of advanced recommended keywords obtained excellent interactive results in terms of comments and shares. In addition, it was also found that the information in which users were most interested included two key themes, “Office” and “today,” which reflected the most up-to-date information on the school, and research-related terms including “scientist” and “research.”
(C) University in the United States: California Institute of Technology
The key (image) clues provided by Random Decision Forests for likes included “professor,” “all,” “brain,” “graduate” and “here”; the clues provided by eXtreme Gradient Boosting for likes included “Caltech,” “professor,” “all,” “new” and “http”; and the clues provided by AdaBoost for likes included “physics,” “content,” “like,” “brain” and “know” (Table A3).
Random Decision Forests and eXtreme Gradient Boosting jointly recommended “Caltech,” “professor,” “new” and “research.” As such, the university’s brand image construction could be better focused by incorporating the terms “Caltech,” “professor” and “research” to reflect a professional image. Through AdaBoost, “physics,” “brain,” “space,” “engineer” and “award” were obtained, indicating that the school’s unique specialized achievements may be further utilized by words such as “physics,” “brain” and “award” to strengthen the connection and impression of themes and information.
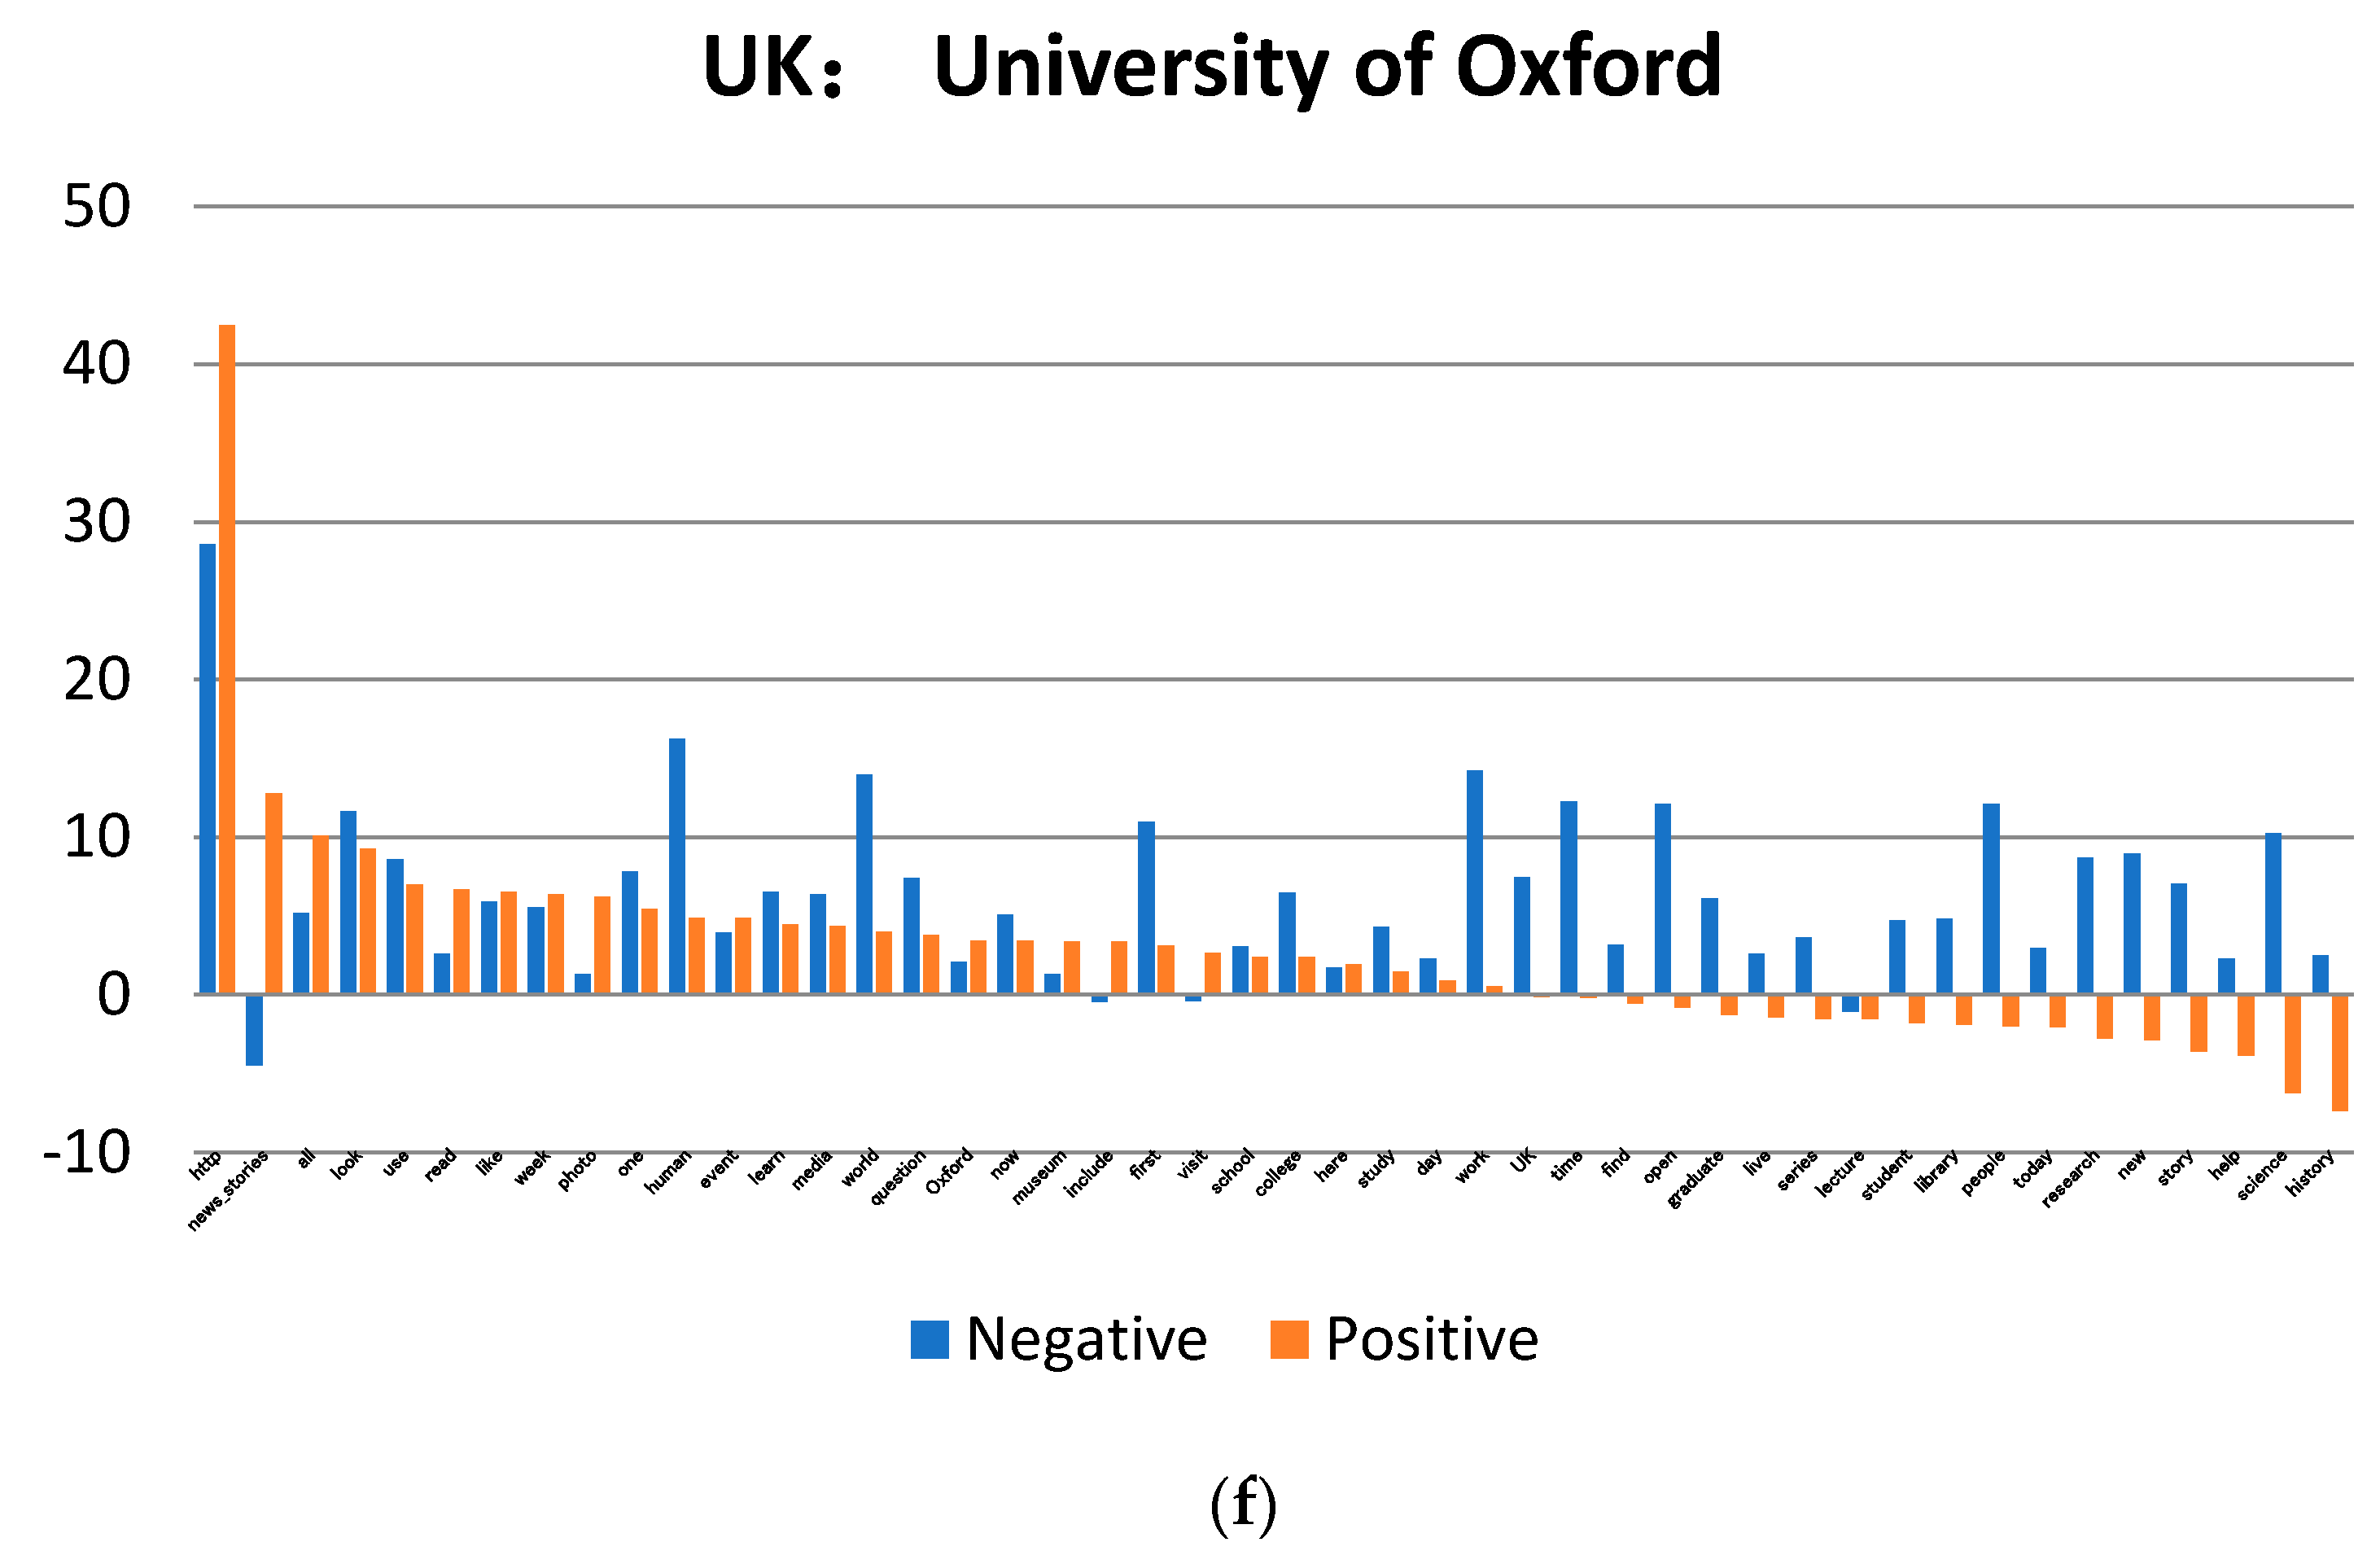
(D) University in the United Kingdom: University of Oxford
The key (image) clues provided by Random Decision Forests for comments included “http,” “photo,” “college,” “event” and “media”; the clues provided by eXtreme Gradient Boosting for comments included “http,” “college,” “all,” “day” and “here”; and the clues provided by AdaBoost for comments included “media,” “news_stories,” “include,” “new” and “question” (Table A4).
Random Decision Forests and eXtreme Gradient Boosting jointly recommended “http,” “photo” and “college.” The key clues recommended by AdaBoost included “media,” “news_stories,” “new” and “question.” In addition to providing general information, users were more likely to leave messages on special topics such as “news_stories” and “question,” owing to user interests and demands.
(E) University in the United Kingdom: University of Cambridge
The key (image) clues provided by Random Decision Forests for likes included “cambridgeuniversity,” “cambridge,” “feature,” “new,” and “research.” The key (image) clues provided by eXtreme Gradient Boosting for likes included “http,” “cambridgeuniversity,” “photo,” “research” and “new”; the clues for comments included “http,” “cambridgeuniversity,” “year,” “student” and “all.” The key (image) clues provided by AdaBoost for likes included “feature,” “cambridge,” “more,” “new” and “research,” and the clues for comments included “cambridge,” “new,” “feature,” “more” and “research” (Table A5).
Random Decision Forests and eXtreme Gradient Boosting jointly recommended “cambridgeuniversity,” “http,” and “year.” AdaBoost, on the other hand, recommended “cambridge,” “new,” “feature,” “more,” “research” and “college.” According to the verification result of the integrated analysis, the brand is heavily focused on the content of the image type, such as “cambridgeuniversity,” “cambridge” and “college”. Therefore, the interactive stimulation is principally based on the results of likes and comments, and it is difficult to measure the value of the active sharing of information.
(F) University in the United Kingdom: Imperial College London
The key (image) clues provided by Random Decision Forests for likes included “world,” “http,” “newssummary,” “Engineer” and “today”; the clues provided by eXtreme Gradient Boosting for likes included “http,” “student,” “day,” “more” and “research.” The key (image) clues provided by AdaBoost for likes included “newsandeventspggrp,” “imperialcollege,” “newssummary,” “today” and “staff” (Table A6).
Random Decision Forests and eXtreme Gradient Boosting jointly recommended “http,” “student,” “world,” and “research.” AdaBoost recommended “newsandeventspggrp,” “imperialcollege,” “newssummary” and “today.” However, if pure image promotion or informative information were to be selected as the main theme, such as “newsandeventspggrp,” “imperialcollege” and “newssummary,” it may be impossible to generate further comments and shares due to a lack of entertainment or interactive value in the information.
6. Contributions and Suggestions
6.1. Research Module Inference
The study found that, through social context exploration combined with artificial intelligence analysis, key information on the university brand page did indeed affect the perception and behavior of users. Well-known university pages not only make effective use of their reputation but also place focus on the quality and quantity of posts. Aside from focusing on appropriate key information, the range of themes is diverse.
On the other hand, based on the above verification results, it is found that users intend to interact with multiple university fan pages simultaneously. Based on the theory of use and gratification, users’ choice of content inevitably complements their behavior. Due to differences in demands and personalities, different demands may be fulfilled through the choice of information. This includes the first level, involving information gratification, which is the most basic purpose of information acquisition, fulfilling demands for music, fashion, culture and the other current and relevant information. The second level, which includes entertainment gratification, is the main motivation for reading or participating on account of the interesting nature of the content. The third level, interactive gratification, is established to satisfy users’ desires to establish interactive relationships with friends or acquaintances through the community. The fourth level, identity verification gratification, allows particularity and distinction of individuals to be showcased, including interpersonal relationships, self-expression and social status (Choi et al. 2013).
In alignment with the above four major gratification characteristics, the information obtained in the study can be classified into three categories: (a) information and entertainment gratification module, (b) composite identity verification gratification module, and (c) composite interactive gratification module.
(a) Information and entertainment gratification module.
The first type of module tends to use simple “like” interactions as the desired response to a post, and, through information gratification and entertainment gratification, the behavioral purpose of the module can be achieved. This module is present on the pages of Imperial College London and California Institute of Technology. Information gratification and entertainment gratification are subjective characteristics of user experience. Based on artificial intelligence analysis of users’ behavioral responses after receiving information, it was found that practical information is one of the most critical factors affecting this type of module (Animesh et al. 2011; Sledgianowski and Kulviwat 2009).
(b) Composite identity verification gratification module.
This module is designed to offer multiple stimuli, including information gratification, entertainment gratification and identity verification gratification, by operating comments or by combining behavioral modes such as likes and comments. The university brands that meet the characteristics of this module include the University of Oxford, University of Cambridge and Stanford University. After further observation, it is found that most of the information that successfully achieved the promotion effect was applied or adjusted based on content positioning, rather than the repeated information for publicity and notifications so that the basic demands of the users were met. When users experience social media, they immediately respond to gratification via emotional and behavioral responses (Weng et al. 2010). Information with information gratification, entertainment gratification and identity verification gratification can thus be transformed into likes and comments by the higher user brand cognition.
(c) Composite interactive gratification module.
The third type of module is the most diverse. By combining the above-mentioned information relating to gratification, entertainment gratification, interaction gratification and identity verification gratification, active participation in comments and shares is promoted. The most obvious case of implementation is by the Massachusetts Institute of Technology. The brand is particularly good at enabling users to obtain easy-to-use information and successfully avoids excessive image packaging, which may result in content being ineffectively communicated to users. In addition, more complete information can be delivered directly via videos or website links. The purpose is to help users understand more detailed university information through simple operations, thereby increasing users’ willingness to like and share information. Therefore, in addition to the text, the adequate use of links and the comment and share functions in brand posts is very important (Fortin and Dholakia 2005). This is supported by Social exchange theory, whereby, in addition to allowing gratification of users following social interaction, there is value in allowing users to generate positive emotions such as self-expression, contribution or support (Crocker and Canevello 2008). Social interaction can enhance communication, encouraging sharing and allow a university community to create an overall positive communication environment (Liang et al. 2011).
6.2. Theoretical Contributions
Based on the research results and findings, the following three academic contributions are listed systematically.
- (A)
- This research verifies a university communication information interaction model, showing how users participate in different behaviors, and successfully examines the impact of common key (image) clues in community information. The research model explains the key information benefits of the fan pages of university brands and verifies the importance of establishing key (image) clues in the brand community through diverse levels of cognition and interaction. Although previous research exists on the topics of information operation (De Vries et al. 2012) and community importance (Fikkers and Piotrowski 2020; Zarrella 2009), few studies directly explore the impact of key information characteristics on the fan pages of university brands. Therefore, this research has the potential to fill a gap in the literature and practice within this area of study and may also be used as a specific reference for the operation and management of other relevant brands (Schmitt et al. 2011).
- (B)
- This research sets out to verify the influence of key (image) clues on several types of interactions by analyzing university brand communities. By publishing specific content to promote continuous online communication among users via various forms of information, key information corresponding to brand image may successfully attract user attention and recognition (Fumasoli et al. 2020). For example, when a user visits a fan page, to what key information will they pay most attention? This research uses artificial intelligence and machine learning to perform calculations, which may be used to aid in the administration of a fan page, successfully identify key pieces of influential information and clues, and better understand the impact of this information on different types of interactions (Gensler et al. 2013).
- (C)
- Verifying that the involvement of users on the university’s brand page has an inseparable relationship with the image of the university community. With respect to the availability of information, it is important to focus on the practical aspects that determine user participation. In other words, it is important to consider the experience and tangible benefits of participation received by users while obtaining information (Yousaf et al. 2020). It is also important to convey relevant brand knowledge through the process, such as brand culture, brand strategy and brand information. (Laroche et al. 2013). Furthermore, through interaction on social media, users develop higher loyalty and trust for a given brand (Valerio-Ureña et al. 2020). Therefore, this research analyzes the behavioral involvement of users on university brand pages and considers the possible impact of key information. Effort is made to explore the relationship between users’ cognitive involvement and behavioral support while also analyzing the lack of response to content from different competing brands (Fikkers and Piotrowski 2020).
6.3. Practical Implications
The contribution at the practical level includes the following three points.
(A) This research focuses on disentangling the relationship between information and the demands of users. This is achieved by investigating how information characteristics and interaction rules exclusive to a given school may be strengthened by a successfully designed university brand page and by examining how the attention and participation of users can be promoted.
By exploring the relationship between key information and community behavior, this research explains the complementary relationship between content positioning and experience gratification in university brand pages. The demand for information by users in terms of community content is examined, and through artificial analysis, the content may be curated to better meet the expectations of users in terms of achieving more positive social interactions and more effective click performance. Moreover, it is believed that this framework provides a method to effectively examine the content and interaction of multiple university fan pages.
(B) This research module helps improve the understanding, in the context of official community interactions, of how to stimulate users’ recognition of a brand and generate interactive intentions.
For example, because the majority of users are likely to be students or alumni of the school, they would naturally respond to participation under a high degree of brand recognition and would therefore be willing to share any posts that are pleasant or joyful. Moreover, they might actively invite the participation of friends or family, thus achieving the rolling value of spreading information continuously. In addition, research confirms that users’ acceptance of information availability is of great benefit to content interaction (Campbell et al. 2013). Therefore, it can be inferred that the behavior of users and the information presentation on social media are complementary. When the crowd perceives specific information, regardless of whether the information successfully meets the demands, it may still exert a strong impact on the behavior of users.
(C) The study examines how the university brand page uses content, communication and traffic guidance to create a better brand interaction mechanism.
With the widespread use of social media, the media landscape has undergone major changes (Bruhn et al. 2012). Social media generates communication through collaboration and content sharing (Kaplan and Haenlein 2010). Social media today is all-embracing, including blogs, Weibo, Wiki, live streaming, photos and video sharing (Laroche et al. 2013). Social media continues to replace traditional media, gaining greater popularity among the public (Bruhn et al. 2012). Therefore, an increasing number of brands are focusing on enhancing the promotion of products and services through social media platforms (Weinberg and Pehlivan 2011). Much of these efforts are focused on content, communication and traffic guidance in order to create a more complete brand interaction mechanism (Kim and Ko 2012). Therefore, this research confirms the impact of social media on users and universities, and by understanding the role that social media can play, reveals the mechanisms underlying the successful construction of key (image) clues (Schultz and Peltier 2013).
6.4. Research Recommendations and Limitations
Despite many clear contributions, the study has several limitations. For example, the sample is limited to the European and North American cultural and economic backgrounds; therefore, cross-cultural research and comparison with user participation beyond this background is not analyzed. It is suggested that, in the future, a broader analysis of multinational university brands is conducted to better identify the relevant factors of information construction based on cultural or economic characteristics (Viswanathan et al. 2017; Yousaf et al. 2020). Furthermore, this research is limited to Facebook’s brand community, so the observation of other social networking sites is not included. In the future, investigations should be conducted on different social media platforms, and customized content planning should be implemented according to the platform for different types of information presentation (Fikkers and Piotrowski 2020).
After multiple analyses of the brand pages of six European and American universities, this research proposes three suggestions for the content management and brand planning of the university pages.
(A) Page administrators should show initiative when thinking about the content of the information and should adapt to more appropriate means of presentation.
Of the samples selected in this study, the universities have strong reputations, and the types of community content on which they rely are diverse. By sharing the research results of the university through the fan page and its exceptional performance in international competition, the page can inspire a sense of pride in users, and they may be willing to share this information through interaction. Even users who are not members of the school, provided that the published research is deemed to contribute broadly to the users’ interests, may still share and like content due to recognition of the value of the school’s achievement (Abdelmaaboud et al. 2020). Therefore, whether a post is a simple school celebration video with campus photos or a professional-led research report, a simple and understandable presentation method should be chosen to reduce the barriers to the reception of information for the public (Hashim et al. 2020).
(B) The traditional use of university fan pages and official bulletin boards for information dissemination should be avoided.
After examining posts to which the response was poor, it was found that most fan pages still remain in the information and entertainment gratification module, focusing solely on university publicity or official bulletin boards, which leads to a sense of distance from or difficulty in interacting with the content. This greatly reduces any sense of shared identity and the willingness of users to share. This again emphasizes how effectively responding to the needs of users is the primary task that all community managers must not ignore (Fikkers and Piotrowski 2020; Zhang et al. 2012).
(C) Universities should seek to use different methods for releasing brand information, guiding users to interact with the brand, so the amount of brand attention can be increased.
The most important objectives are to avoid unnecessary duplication of information as much as possible, to strengthen user experiences with dialogue and interaction functions, and to support the brand in launching content that meets the preferences of the audience through more precise key information operations, so as to reach a consensus on the demands of both parties. The administrators should therefore formulate a unified content strategy based on the brand’s community positioning, and combine different types of information (such as photos and videos) and interactions (such as user-generated content, fan feedbacks and KOL effects) and images (such as campus information and university-specific images). This can be achieved through regular publicity, activities that aim to create relevant content, and by striving to create a strong connection effect through information and brand image.
Funding
This research was funded by the Ministry of Science and Technology—Digital Humanities Program (No. 0510234) (No. 0610234).
Data Availability Statement
Not applicable.
Conflicts of Interest
The author declares no conflict of interest.
Appendix A. Measurement and Items

Table A1.
Negative and positive clues (Stanford University).
| Likes | Negative | Positive | Comments | Negative | Positive | Shares | Negative | Positive |
|---|---|---|---|---|---|---|---|---|
| photo | 10.31 | 43.19 | gostanford | 17.42 | 35.19 | gostanford | 0.67 | 12.32 |
| gostanford | 20.33 | 41.5 | photo | −10.9 | 17.84 | question | 3.81 | 7.53 |
| question | 4.89 | 15.04 | http | −1.38 | 13.58 | human | 3.51 | 7.28 |
| Stanford | 9.63 | 14.71 | watch | 15.73 | 9.21 | game | 2.01 | 6.47 |
| art | 1.64 | 14.56 | game | 4.26 | 6.75 | time | 14.93 | 6.25 |
| watch | 3.45 | 11.98 | Stanford | 4.09 | 5.65 | design | 2.84 | 5.86 |
| say | 4.15 | 11.9 | day | 6.88 | 5.5 | develop | −1.58 | 5.6 |
| work | 1.25 | 11.27 | work | 1.63 | 5.36 | photo | −2.15 | 4.99 |
| research | 7.11 | 10.67 | help | 0.37 | 4.18 | school | 3.23 | 4.45 |
| http | 1.92 | 10.41 | team | −0.22 | 4.16 | help | −1.89 | 4.21 |
| final | 1.33 | 9.36 | make | 8.23 | 4.13 | team | −4.68 | 3.77 |
| day | 1.58 | 8.82 | like | −0.37 | 3.76 | campus | 0.1 | 3.62 |
| professor | −2.58 | 8.67 | student | 0 | 3.59 | found | −0.59 | 3.12 |
| new | 1.28 | 7.72 | research | −1.07 | 3.54 | art | 1.84 | 3.05 |
| campus | 14.7 | 7.36 | professor | 1.36 | 3.3 | Stanford | 0.56 | 3.01 |
| game | 4.6 | 7.03 | art | 5.14 | 3 | http | −1.81 | 2.24 |
| more | 1.24 | 6.15 | develop | −6.17 | 2.93 | more | 0.21 | 1.88 |
| help | −1.88 | 5.78 | way | 1.61 | 2.73 | class | 4.73 | 1.53 |
| live | 3.92 | 3.56 | question | 6.22 | 2.68 | new | −1.84 | 1.35 |
| team | 1.17 | 2.49 | more | −0.79 | 2.02 | watch | 6.05 | 1.3 |
| perform | 2.87 | 2.33 | year | 5.83 | 1.77 | live | 1.16 | 1.14 |
| life | −0.92 | 2.06 | say | 1.34 | 1.73 | people | −0.15 | 1.02 |
| class | 2.26 | 1.98 | final | −1.03 | 1.37 | year | 1.49 | 0.92 |
| women | 1.26 | 1.95 | open | 4.86 | 1.34 | student | 1.03 | 0.87 |
| design | −1.58 | 1.77 | campus | 13.8 | 1.25 | life | −2.88 | 0.55 |
| make | 6.9 | 1.6 | time | 17.85 | 0.81 | like | 1.2 | 0.21 |
| science | 3.79 | 1.3 | program | 3 | 0.42 | day | −1.12 | −0.02 |
| way | 2.93 | 1.06 | visit | 0.77 | 0.24 | here | 2.41 | −0.34 |
| year | 7.69 | 1.01 | found | −5.64 | 0.17 | perform | 1.38 | −0.59 |
| learn | 2.47 | 0.81 | live | 3.97 | −0.01 | world | 4.62 | −0.76 |
| here | −0.02 | 0.36 | perform | 3.52 | −0.07 | work | −3.25 | −1.02 |
| human | 0.28 | 0.03 | life | −2.82 | −0.22 | way | −4.76 | −1.04 |
| student | −1.14 | 0.01 | class | 0.44 | −0.28 | program | −0.84 | −1.41 |
| found | −0.03 | −0.6 | people | 0.88 | −0.29 | research | 2.17 | −2.12 |
| develop | 0.62 | −0.95 | first | −3.81 | −0.67 | say | 1.91 | −2.21 |
| open | 4.27 | −1.25 | here | 7.76 | −1.43 | first | −3.64 | −2.24 |
| graduate | 5.47 | −1.58 | new | 3.81 | −1.52 | make | 2.41 | −2.3 |
| time | 18.97 | −1.61 | design | 4.72 | −2.62 | professor | −1.62 | −2.39 |
| school | −1.1 | −1.88 | science | 11.3 | −2.64 | open | 2.96 | −2.56 |
| like | 3.72 | −2.04 | human | 2.65 | −3.2 | women | 4.07 | −2.67 |
| first | 0.21 | −2.75 | women | 6.22 | −3.56 | study | 2.98 | −2.69 |
| world | 8.66 | −3.71 | learn | 3.6 | −3.66 | learn | 1.8 | −2.7 |
| program | 1.8 | −4.09 | graduate | 4.52 | −3.67 | graduate | 1.43 | −2.96 |
| study | −1.28 | −5.02 | world | 6.1 | −4.17 | final | −3.85 | −3.12 |
| people | 7.56 | −6.33 | study | 3.03 | −6.04 | visit | 7.98 | −4.03 |
| visit | 14.47 | −9.31 | school | 7.09 | −6.8 | science | 10.3 | −6.75 |
Table A2.
Negative and positive clues (Massachusetts Institute of Technology).
| Likes | Negative | Positive | Comments | Negative | Positive | Shares | Negative | Positive |
|---|---|---|---|---|---|---|---|---|
| photo | 9.66 | 28.62 | campus | 17.42 | 25.25 | more | 0.2 | 19.08 |
| robot | 9.1 | 18.74 | http | 10.23 | 24.29 | engine | 3.64 | 16.44 |
| http | 18.82 | 16.28 | engine | 0.29 | 15.84 | research | 5.42 | 16.38 |
| research | 1.64 | 15.4 | research | 1.13 | 15.1 | http | 12.2 | 16.32 |
| engine | 5.42 | 15.04 | robot | 6.75 | 13.73 | scientist | 11.59 | 15.96 |
| day | 21.69 | 11.77 | week | 10.77 | 12.41 | new | −4.2 | 15.5 |
| now | −0.11 | 9.7 | more | 1.09 | 10.86 | human | 12.21 | 8.65 |
| help | −1.98 | 8.1 | study | −4.31 | 10.05 | Engineer | 7.42 | 7.82 |
| week | 2.54 | 7.59 | system | −4.9 | 8.76 | system | 5.76 | 7.53 |
| more | −1.32 | 7.47 | now | 1.16 | 8.56 | campus | 4.78 | 6.21 |
| new | −6.87 | 5.56 | new | −4.15 | 7.93 | robot | 9.55 | 6.13 |
| study | −2.85 | 4.58 | science | −1.97 | 6.58 | school | 4.07 | 6.1 |
| system | −7.52 | 4.55 | one | −1.14 | 4.26 | world | 4.46 | 5.05 |
| Engineer | 3.77 | 4.32 | photo | −2.45 | 4.22 | people | −0.87 | 4.14 |
| one | −2.74 | 3.93 | year | 2.96 | 4.12 | week | 6.14 | 3.85 |
| story | 9.84 | 3.86 | help | 1.7 | 3.75 | develop | 9.81 | 3.62 |
| people | −1.74 | 3.86 | Image | 12.71 | 3.51 | all | −0.9 | 3.01 |
| Image | 23.24 | 3.24 | Office | −1.12 | 3.3 | student | 2.17 | 2.36 |
| scientist | −1.6 | 3.04 | Engineer | 1.6 | 2.87 | design | −1.52 | 2.22 |
| student | −0.98 | 2.45 | design | −2.22 | 2.76 | study | −5.1 | 2.18 |
| video | −2.43 | 1.07 | develop | 3.64 | 1.88 | one | −0.8 | 2.02 |
| world | −0.47 | 0.69 | day | 5.12 | 1.83 | work | 7.84 | 1.91 |
| campus | 4.23 | 0.56 | full | 0.75 | 1.51 | Office | 6.8 | 1.7 |
| Office | 6.38 | 0.07 | human | 4.98 | 1.08 | first | −7.21 | 0.87 |
| work | −2.37 | −0.1 | video | −2.57 | 1.04 | story | 7.86 | 0.52 |
| human | 1.11 | −0.3 | learn | 11.83 | 0.92 | time | −0.02 | 0.51 |
| lab | −4.46 | −0.79 | all | −0.87 | 0.75 | program | 4.7 | 0.34 |
| first | −2.34 | −0.9 | work | 8.3 | 0.67 | computer | 12.16 | 0.25 |
| find | 13.08 | −1.11 | student | 0.06 | 0.64 | find | 6.9 | −0.03 |
| professor | 2.32 | −1.27 | time | 2.39 | 0.24 | video | 3.99 | −0.47 |
| school | −1.96 | −1.58 | lab | −0.73 | −0.07 | full | −2.94 | −0.85 |
| community | 2.63 | −1.87 | community | −6.14 | −0.84 | learn | 4.85 | −1.42 |
| all | −2.03 | −1.9 | team | 1.46 | −0.98 | day | 9.23 | −1.45 |
| program | 4.47 | −2.03 | first | 3.82 | −1.18 | team | 3.01 | −1.54 |
| time | −2.73 | −2.4 | computer | 2.99 | −1.79 | year | −0.48 | −1.66 |
| design | 1.33 | −2.58 | people | 0.73 | −1.8 | community | 2.24 | −1.8 |
| develop | −1.89 | −2.69 | today | 7.24 | −2 | professor | 0.82 | −1.83 |
| learn | 2.87 | −2.72 | world | 1.4 | −2.07 | photo | 4.71 | −2.15 |
| full | 1.7 | −2.83 | professor | −1.91 | −2.4 | now | −2.88 | −2.31 |
| team | −0.06 | −3.4 | program | 5.55 | −2.85 | today | 5.05 | −2.44 |
| computer | 7.01 | −3.47 | school | −1.99 | −2.88 | Image | 7.97 | −2.91 |
| science | 0.84 | −3.63 | story | 5.23 | −2.91 | science | −0.15 | −3.39 |
| year | 0.71 | −3.95 | technology | 5.84 | −3.77 | lab | 2.94 | −4.12 |
| technology | 1.39 | −6.49 | scientist | 3.58 | −3.99 | help | −0.16 | −4.81 |
| today | 18.92 | −11.44 | find | 10.65 | −5.44 | technology | 0.32 | −9.52 |
Table A3.
Negative and positive clues (California Institute of Technology).
| Likes | Negative | Positive | Comments | Negative | Positive | Shares | Negative | Positive |
|---|---|---|---|---|---|---|---|---|
| professor | 28.13 | 10.16 | graduate | 5.1 | 20.62 | content | −2.53 | 20.91 |
| all | 4.37 | 8.69 | content | 1.58 | 14.04 | http | −6.85 | 17.93 |
| brain | 8 | 5.35 | year | −3.83 | 10.27 | professor | 21.31 | 17.8 |
| graduate | 9.05 | 3.64 | like | −0.62 | 10.09 | scientist | 11.04 | 10.97 |
| here | −1.07 | 3.48 | space | 10.91 | 9.37 | first | 5.9 | 9.97 |
| content | 1.92 | 3.46 | know | 6.9 | 9.02 | graduate | −1.94 | 7.92 |
| feature | 0.39 | 2.68 | all | −6.76 | 7.97 | today | −6.93 | 6.87 |
| year | 0.74 | 2.45 | http | 3.77 | 6.68 | video | −4.71 | 5.8 |
| today | 5.9 | 2.12 | more | −3.75 | 6.63 | new | 1.59 | 5.18 |
| celebrate | 7.41 | 1.13 | nation | 4.93 | 4.87 | space | 2.17 | 4.99 |
| first | 1.75 | 0.85 | photo | 9.09 | 4.42 | event | −0.93 | 4.12 |
| Caltech | 8.48 | 0.3 | now | 0.59 | 4.28 | engineer | 4.69 | 3.82 |
| time | 8.64 | 0.23 | first | 0.42 | 3.55 | time | 2.09 | 3.71 |
| event | 0 | 0.02 | brain | 2.33 | 1.84 | physics | 2.2 | 3.68 |
| read | 4.53 | −0.01 | member | 1.34 | 1.66 | BS | 1.66 | 3.39 |
| member | 2.35 | −0.1 | campus | 8.69 | 1.64 | member | 4.15 | 3.33 |
| research | 7.97 | −1.17 | video | −4.49 | 1.27 | team | −4.01 | 3.27 |
| space | 17.61 | −1.26 | award | −0.22 | 0.81 | campus | 6.61 | 2.87 |
| award | −1.8 | −1.3 | develop | 1.68 | 0.8 | year | −6.74 | 2.79 |
| http | 1.36 | −1.53 | BS | −0.43 | 0.57 | all | −1.93 | 2.75 |
| engineer | 7.03 | −1.67 | technology | −1.32 | 0.33 | like | 2.05 | 2.65 |
| nation | 13.24 | −1.68 | research | −1.8 | −0.45 | more | 0.32 | 2.38 |
| like | 1.09 | −1.75 | help | −0.89 | −0.49 | student | 0.86 | 2.27 |
| work | 1.56 | −2.07 | time | 2.28 | −0.59 | read | −8.13 | 1.55 |
| now | 2.91 | −2.26 | new | 0.61 | −0.76 | know | 0.92 | 1.54 |
| video | −0.55 | −2.45 | feature | 0.25 | −0.88 | Caltech | 7.14 | 0.83 |
| new | −1.4 | −2.61 | team | −1.4 | −1.67 | science | 4.68 | 0.33 |
| know | 2.27 | −2.62 | Caltech | 3.54 | −2.19 | brain | 0.34 | −0.1 |
| help | 18.77 | −3.49 | scientist | 3.7 | −2.51 | feature | −0.94 | −0.31 |
| technology | 10.83 | −4.2 | physics | 9.46 | −2.76 | develop | 15.41 | −0.62 |
| team | −1.07 | −4.31 | celebrate | 2.65 | −2.86 | help | 11.85 | −1.74 |
| BS | 2.88 | −4.39 | work | 4.12 | −3.18 | award | −2.89 | −1.74 |
| photo | 1.78 | −5.24 | read | −8.02 | −3.6 | nation | 0.14 | −2.25 |
| develop | 4.11 | −5.27 | learn | 10.71 | −3.64 | technology | 3.7 | −2.51 |
| more | 3.61 | −5.48 | here | −6.98 | −4.02 | work | −1.12 | −2.61 |
| scientist | −0.41 | −6.12 | student | 8.65 | −4.29 | now | −0.86 | −2.95 |
| study | −1.8 | −6.26 | professor | 11.63 | −4.3 | research | 8.68 | −2.99 |
| learn | 3.17 | −7.62 | today | 0.74 | −4.81 | community | 7.83 | −3.09 |
| campus | 3.16 | −7.88 | science | 8.26 | −6.04 | here | −3.87 | −3.26 |
| community | 11.28 | −8.78 | study | 0.85 | −6.18 | celebrate | 7.34 | −4.44 |
| physics | 21.39 | −9.17 | engineer | 7.87 | −6.53 | learn | 3.49 | −5.04 |
| student | 13.58 | −9.18 | event | −0.55 | −8.94 | photo | 0.81 | −5.21 |
| science | 15.83 | −13.91 | community | 15.17 | −11.39 | study | −0.23 | −8.14 |
Table A4.
Negative and positive clues (University of Oxford).
| Likes | Negative | Positive | Comments | Negative | Positive | Shares | Negative | Positive |
|---|---|---|---|---|---|---|---|---|
| http | 28.61 | 42.47 | http | 43.67 | 79.3 | http | 27.71 | 61.03 |
| news_stories | −4.46 | 12.76 | photo | 23.63 | 43.74 | photo | 10.22 | 32.19 |
| all | 5.18 | 10.11 | college | 38.54 | 27.23 | college | 30.61 | 23.61 |
| look | 11.64 | 9.29 | event | 1.31 | 20.59 | media | −7.4 | 12.76 |
| use | 8.58 | 7 | media | −13.98 | 18.53 | new | −1.21 | 12.46 |
| read | 2.6 | 6.67 | new | −2.14 | 16.4 | event | 2.5 | 11.5 |
| like | 5.89 | 6.53 | today | 10.9 | 15.22 | now | 3.8 | 11.33 |
| week | 5.54 | 6.37 | Oxford | 8.45 | 14.82 | here | 8.35 | 11.19 |
| photo | 1.34 | 6.21 | study | 3.55 | 13.6 | look | 5.14 | 10.77 |
| one | 7.83 | 5.44 | research | 5.75 | 12.49 | study | 0.27 | 10.23 |
| human | 16.25 | 4.86 | news_stories | −4.53 | 10.64 | Oxford | 2.16 | 9.54 |
| event | 3.96 | 4.86 | day | 15.65 | 10.43 | include | 11.4 | 9.27 |
| learn | 6.55 | 4.45 | all | 16.76 | 9.58 | news_stories | −7.84 | 8.61 |
| media | 6.36 | 4.38 | like | 7.78 | 8.56 | week | −1.53 | 8.6 |
| world | 13.98 | 4.01 | week | 5.71 | 8.45 | like | 1.23 | 8.07 |
| question | 7.42 | 3.82 | graduate | 11.91 | 7.95 | human | 10.75 | 7.84 |
| Oxford | 2.08 | 3.43 | first | −3.13 | 7.52 | all | 0.39 | 7.69 |
| now | 5.08 | 3.41 | work | 9.16 | 7.15 | school | 4.63 | 7.06 |
| museum | 1.32 | 3.36 | question | 4.46 | 7.05 | museum | 5.42 | 6.85 |
| include | −0.44 | 3.36 | look | 10.42 | 6.73 | work | 9.4 | 5.86 |
| first | 11 | 3.1 | open | 17.31 | 6.58 | one | 2.95 | 5.42 |
| visit | −0.39 | 2.65 | now | 21.53 | 6.28 | read | 3.59 | 5.41 |
| school | 3.06 | 2.41 | series | 6.22 | 6.19 | visit | 6.47 | 5.4 |
| college | 6.49 | 2.39 | school | 10.96 | 6.13 | world | 11.75 | 4.6 |
| here | 1.73 | 1.91 | lecture | 2.59 | 6.02 | day | 1.94 | 4.24 |
| study | 4.33 | 1.46 | library | 9.95 | 5.29 | find | 6.4 | 4.08 |
| day | 2.31 | 0.89 | history | 2.73 | 5.15 | library | 7.06 | 3.72 |
| work | 14.21 | 0.53 | learn | −1.03 | 4.8 | research | 1.96 | 3.5 |
| UK | 7.48 | −0.14 | use | 5.32 | 4.52 | UK | 6.98 | 3.17 |
| time | 12.29 | −0.19 | human | 8.28 | 4.22 | learn | 5.53 | 3.13 |
| find | 3.19 | −0.55 | read | 0.06 | 4.07 | time | 6.51 | 3 |
| open | 12.11 | −0.79 | visit | 4.05 | 3.96 | today | −0.46 | 2.71 |
| graduate | 6.12 | −1.28 | include | 13.4 | 3.74 | first | −0.03 | 2.27 |
| live | 2.63 | −1.44 | live | 10.02 | 3.73 | help | 11.2 | 1.34 |
| series | 3.63 | −1.53 | here | 10.15 | 3.2 | question | 0.98 | 1.2 |
| lecture | −1.05 | −1.53 | story | 9.39 | 2.72 | use | 5.59 | 1.09 |
| student | 4.7 | −1.77 | time | 8.08 | 2.4 | open | 14.94 | 1.02 |
| library | 4.83 | −1.9 | student | 6.65 | 2.3 | live | 9.19 | 0.46 |
| people | 12.09 | −1.99 | UK | 6.8 | 1.78 | series | 2.4 | 0.3 |
| today | 2.97 | −2.02 | science | 6.07 | 1.73 | graduate | 10.58 | −0.03 |
| research | 8.7 | −2.76 | museum | −1.42 | 1 | lecture | 3.31 | −0.09 |
| new | 8.97 | −2.89 | world | 3.46 | 0.5 | student | 7.87 | −1.91 |
| story | 7.05 | −3.58 | one | 13.06 | 0.22 | story | 7.83 | −2.03 |
| help | 2.32 | −3.83 | help | 4.13 | −0.85 | people | 9.55 | −3.35 |
| science | 10.25 | −6.23 | find | 1.83 | −1.47 | history | 1.75 | −4.64 |
| history | 2.49 | −7.35 | people | 10.37 | −2.9 | science | 10.42 | −5.89 |
Table A5.
Negative and positive clues (University of Cambridge).
| Likes | Negative | Positive | Comments | Negative | Positive | Shares | Negative | Positive |
|---|---|---|---|---|---|---|---|---|
| cambridgeuniversity | 14.15 | 52.13 | cambridgeuniversity | 6.61 | 42.6 | cambridgeuniversity | −4.98 | 10.19 |
| cambridge | 1 | 18.67 | cambridge | −3.77 | 13.95 | cambridge | −5.92 | 4.75 |
| feature | 3.34 | 8.65 | student | 3.65 | 9.8 | celebrate | 0.73 | 3.92 |
| new | 19 | 5.12 | year | −0.04 | 3.56 | day | 2 | 3.9 |
| research | 21.49 | 5.07 | use | 2.92 | 3.5 | first | 3.57 | 3.38 |
| work | 0 | 4.97 | world | 2.45 | 2.68 | post | −4.51 | 3.33 |
| all | 2.83 | 4.93 | all | −2.99 | 2.35 | human | 6.94 | 2.88 |
| student | 3.17 | 3.81 | museum | −4.04 | 2.08 | work | −4.66 | 2.55 |
| film | 2.21 | 2.78 | first | 6.32 | 0.13 | like | 3.44 | 1.62 |
| photo | 25.8 | 2.02 | life | −2.99 | −0.21 | help | 0.85 | 1.53 |
| world | 2.89 | 1.52 | celebrate | 11.28 | −0.42 | exhibit | −2.38 | 1.52 |
| exhibit | 1.27 | 1.46 | work | −2.88 | −0.56 | book | −4.5 | 1.25 |
| use | 4.33 | 1.37 | one | −1.07 | −0.57 | museum | 1.42 | 1 |
| study | 6.04 | 0.53 | like | 0.21 | −0.68 | find | 2.57 | 0.68 |
| help | 0.84 | 0.53 | week | 2.95 | −0.72 | develop | 4.57 | 0.43 |
| now | 5.32 | 0.4 | human | 6.88 | −1.22 | world | −3.49 | 0.38 |
| human | 13.65 | 0.21 | history | 3.5 | −1.57 | now | 0.45 | 0.34 |
| museum | −4.64 | −0.41 | college | 1.55 | −1.57 | show | −0.36 | 0.2 |
| Dr | 0.35 | −0.72 | here | 1.77 | −2.1 | college | −5.53 | 0.03 |
| scientist | 1.54 | −0.9 | now | 2.81 | −2.16 | science | 0.59 | −0.23 |
| celebrate | 13.58 | −1.1 | new | 16.11 | −2.38 | here | 1.01 | −0.4 |
| book | 0.67 | −1.11 | film | −0.45 | −2.6 | Dr | 1.06 | −0.59 |
| year | 7.48 | −1.19 | day | 10.22 | −2.74 | research | 11.33 | −0.8 |
| people | 0.48 | −1.3 | help | −1.09 | −2.79 | people | 3.97 | −0.93 |
| http | 39.85 | −1.36 | book | 0.6 | −2.88 | year | −2.3 | −1.11 |
| life | 5.88 | −1.38 | look | 5.45 | −2.99 | most | 2.09 | −1.13 |
| one | −2.34 | −1.66 | people | 0.56 | −3.31 | life | −1.58 | −1.5 |
| like | 4.61 | −1.98 | science | −0.93 | −3.89 | time | 3.23 | −1.91 |
| live | 0.22 | −2.3 | time | 1.66 | −3.97 | http | 16.13 | −1.95 |
| time | 12.61 | −2.77 | exhibit | 1.59 | −4.01 | film | −2.4 | −1.99 |
| look | 1.69 | −2.79 | research | 17.54 | −4.6 | feature | 10.17 | −2 |
| post | 3.53 | −2.81 | live | 4.04 | −4.64 | one | −2.88 | −2.19 |
| history | 3.62 | −2.85 | show | −1.49 | −4.8 | history | −2.31 | −2.26 |
| science | 10.17 | −3.64 | scientist | 5.06 | −4.98 | all | −0.11 | −2.62 |
| day | 3.71 | −3.65 | find | 3.42 | −5.17 | live | 0.54 | −2.87 |
| here | −2.3 | −3.94 | study | 2.54 | −5.51 | new | 7.98 | −3.57 |
| college | 1.1 | −4.36 | most | 3.39 | −5.68 | study | 5.01 | −3.62 |
| more | 9.1 | −4.64 | Dr | 3.65 | −6.22 | scientist | 2.83 | −3.63 |
| develop | 19.26 | −4.71 | develop | 0.93 | −6.45 | use | 0.08 | −3.74 |
| show | 5.66 | −4.75 | more | 10.97 | −6.93 | today | 0.17 | −4.13 |
| today | −2.36 | −5.82 | post | 8.38 | −7.11 | student | 4.35 | −4.27 |
| first | 12.1 | −6.02 | today | 2.99 | −8.48 | photo | 7.7 | −4.99 |
| find | 6.93 | −6.69 | photo | 26.68 | −8.52 | week | −1.34 | −5.04 |
| most | 14.88 | −7.22 | feature | 23.64 | −16.13 | more | 3.49 | −5.05 |
| week | 2.21 | −8.39 | http | 34.68 | −17.85 | look | 1.11 | −6.29 |
Table A6.
Negative and positive clues (Imperial College London).
| Likes | Negative | Positive | Comments | Negative | Positive | Shares | Negative | Positive |
|---|---|---|---|---|---|---|---|---|
| world | 21.16 | 23.03 | live | −3.38 | 53.74 | world | 16.66 | 26.52 |
| http | 0.84 | 21.71 | newssummary | −2.91 | 28.85 | newssummary | −13.71 | 23.13 |
| newssummary | −11.12 | 19.5 | UK | −2.64 | 27.46 | http | 0.39 | 19.56 |
| Engineer | 15.78 | 17.56 | use | −2.4 | 26.97 | imperial | 3.4 | 16.08 |
| today | 1.31 | 11.87 | world | −1.69 | 26.54 | study | 3.98 | 15.95 |
| health | 5.34 | 11.84 | year | −1.65 | 23.44 | more | 4.89 | 15.85 |
| imperial | 3.72 | 11.22 | develop | −1.62 | 21.28 | today | 7.64 | 15.22 |
| next. | 8.18 | 10.82 | read | −1.42 | 20.09 | here | 3.39 | 13.99 |
| event | 5.72 | 10.26 | campus | −1.12 | 19.63 | scientist | 6.38 | 13.08 |
| more | 4.57 | 9.61 | week | −1 | 18.94 | Engineer | 7.8 | 12.75 |
| new | 5.09 | 9.22 | science | −0.6 | 17.77 | next. | 2.96 | 12.47 |
| team | 4.32 | 8.47 | next | −0.58 | 16.48 | develop | −0.26 | 12.19 |
| here | 3.14 | 8.12 | new | −0.58 | 16.14 | live | −0.13 | 11.15 |
| student | 9.61 | 7.8 | make | −0.33 | 16.12 | all | 11.92 | 10.83 |
| read | 3.82 | 7.49 | Dr | −0.26 | 15.66 | day | 5.24 | 10.71 |
| use | 8.63 | 7.18 | school | 0 | 15.53 | now | 6.48 | 9.92 |
| graduate | 12.92 | 6.8 | health | 0 | 15.17 | help | −0.4 | 9.9 |
| find | 2.89 | 6.63 | now | 0 | 14.59 | one | 6.52 | 9.73 |
| year | 5.62 | 6.61 | newsandeventspggrp | 0.6 | 14.19 | event | 10.56 | 9.04 |
| week | 3.06 | 6.45 | alumni | 0.71 | 13.88 | week | 3.3 | 9.04 |
| day | 6.96 | 6.33 | Engineer | 0.9 | 13.01 | newsandeventspggrp | −2.1 | 9.02 |
| campus | 8.85 | 6.26 | come | 0.95 | 12.76 | graduate | 11.84 | 8.48 |
| develop | −2.95 | 6.09 | scientist | 1.11 | 11.98 | year | 13.3 | 8.04 |
| help | 3 | 5.41 | one | 1.12 | 11.59 | campus | 7.33 | 8.02 |
| one | 7.93 | 5.29 | find | 1.61 | 11.16 | student | 11.06 | 7.97 |
| all | 8.05 | 5.02 | staff | 1.64 | 10.74 | science | 5.42 | 7.42 |
| newsandeventspggrp | 3.12 | 4.69 | research | 1.87 | 10.4 | new | 7.77 | 6.79 |
| make | 1.65 | 4.3 | open | 1.99 | 10.39 | health | 2.7 | 6.02 |
| live | −2.69 | 4.08 | imperialcollege | 2.05 | 9.53 | work | 12.22 | 5.98 |
| college | 7.14 | 3.78 | more | 2.11 | 8.85 | alumni | −0.46 | 5.85 |
| staff | 4.98 | 3.38 | here | 2.24 | 8.69 | team | 3.58 | 5.65 |
| join | 3.77 | 3.33 | college | 2.55 | 8.41 | first | 0.05 | 5.57 |
| Dr | −0.79 | 2.5 | graduate | 2.77 | 8.04 | staff | 6.12 | 5.43 |
| study | 7.72 | 1.99 | team | 2.92 | 7.98 | use | 4.73 | 4.9 |
| alumni | 1.95 | 1.84 | all | 3 | 7.22 | read | 0.46 | 4.76 |
| scientist | 9.36 | 1.82 | http | 3.15 | 7.09 | time | 8.03 | 4.72 |
| science | 4.61 | 1.24 | today | 3.19 | 7.07 | come | 4.85 | 4.68 |
| time | 4.28 | 1.14 | event | 3.42 | 6.78 | UK | 9.65 | 4.18 |
| first | 3.27 | 0.71 | work | 3.57 | 6.7 | Dr | −1.05 | 3.8 |
| UK | 8.1 | 0.27 | time | 3.57 | 6.49 | open | 13.47 | 3.48 |
| come | 4.45 | −0.21 | student | 3.69 | 6.44 | find | 2.48 | 3.17 |
| open | 15.15 | −0.25 | study | 3.87 | 6.35 | school | 5.3 | 2.47 |
| work | 11.39 | −0.27 | first | 4.07 | 5.33 | imperialcollege | 7.02 | 2.33 |
| school | 1.07 | −1.21 | day | 4.11 | 4.37 | join | 9.63 | 1.89 |
| now | 15.68 | −1.43 | help | 4.25 | 3.04 | research | 10.43 | 0.68 |
| imperialcollege | 8.14 | −1.98 | imperial | 5.57 | 0.06 | make | −1.84 | −0.45 |
| research | 9.09 | −6.1 | join | 6.89 | −5.62 | college | 16.94 | −7.18 |
References
- Abdelmaaboud, Abdelmaaboud, Ana Isabel Polo Peña, and Abeer Mahrous. 2020. The influence of student-university identification on student’s advocacy intentions: The role of student satisfaction and student trust. Journal of Marketing for Higher Education, 1–23. [Google Scholar] [CrossRef]
- Animesh, Alain Pinsonneault, Sung-Byung Yang, and Wonseok Oh. 2011. An odyssey into virtual worlds: Exploring the impacts of technological and spatial environments on intention to purchase virtual products. MIS Quarterly: Management Information Systems 35: 789–810. [Google Scholar] [CrossRef] [Green Version]
- Araujo, Theo, and Peter Neijens. 2012. Friend me: Which factors influence top global brands participation in social network sites. Internet Research 22: 626–40. [Google Scholar] [CrossRef]
- Bender, Jacqueline, Maria Carolina, Jimenez Marroquin, and Alejandro Jadad. 2011. Seeking support on Facebook: A content analysis of breast cancer groups. Journal of Medical Internet Research 13: 16. [Google Scholar] [CrossRef] [PubMed]
- Brodie, Roderick, Ana Ilic, Biljana Juric, and Linda Hollebeek. 2013. Consumer engagement in a virtual brand community: An exploratory analysis. Journal of Business Research 66: 105–14. [Google Scholar] [CrossRef]
- Bruhn, Manfred, Verena Schoenmueller, and Daniela Schäfer. 2012. Are social media replacing traditional media in terms of brand equity creation? Management Research Review 35: 770–90. [Google Scholar] [CrossRef] [Green Version]
- Camilleri, Mark Anthony. 2019. The Use of Data-Driven Technologies for Customer-Centric Marketing. International Journal of Big Data Management 1: 50–63. [Google Scholar] [CrossRef]
- Campbell, Damon, John Wells, and Joseph Valacich. 2013. Breaking the ice in B2C relationships: Understanding pre-adoption e-commerce attraction. Information Systems Research 24: 219–38. [Google Scholar] [CrossRef]
- Choi, Junho, Jaemin Jungb, and Sang Woo Lee. 2013. What causes users to switch from a local to a global social network site? the cultural, social, economic, and motivational factors of Facebook’s globalization. Computers in Human Behavior 29: 2665–73. [Google Scholar] [CrossRef]
- Chu, Shu Chuan. 2011. Viral advertising in social media: Participation in Facebook groups and responses among college-aged users. Journal of Interactive Advertising 12: 30–43. [Google Scholar] [CrossRef]
- Constantinides, Efthymios, and Marc Zinck Stagno. 2011. Potential of the social media as instruments of higher education marketing: A segmentation study. Journal of Marketing for Higher Education 21: 7–24. [Google Scholar] [CrossRef]
- Coyle, James, and Esther Thorson. 2001. The effects of progressive levels of interactivity and vividness in web marketing sites. Journal of Advertising 30: 75–77. [Google Scholar] [CrossRef]
- Crocker, Jennifer, and Canevello Amy. 2008. Creating and Undermining Social Support in Communal Relationships: The Role of Compassionate and Self-Image Goals. Journal of Personality and Social Psychology 95: 555–75. [Google Scholar] [CrossRef] [Green Version]
- Curras-Perez, Rafael, Carla Ruiz Mafe, and Silvia Sanz Blas. 2014. Determinants of user behaviour and recommendation in social networks: An integrative approach from the uses and gratifications perspective. Industrial Management and Data Systems 114: 1477–98. [Google Scholar] [CrossRef]
- Cvijikj, Irena Pletikosa, and Florian Michahelles. 2011. Monitoring trends on Facebook. Paper presented at the IEEE Ninth International Conference on Dependable, Autonomic and Secure Computing, Sydney, Australia, December 12–14. [Google Scholar]
- De Vries, Lisette, Sonja Gensler, and Peter Leeflang. 2012. Popularity of Brand Posts on Brand Fan Pages: An Investigation of the Effects of Social Media Marketing. Journal of Interactive Marketing 26: 83–91. [Google Scholar] [CrossRef]
- Dholakia, Utpal, Richard P. Bagozzi, and Lisa Klein Pearo. 2004. A social influence model of consumer participation in network- and small-group-based virtual communities. International Journal of Research in Marketing 21: 241–63. [Google Scholar] [CrossRef]
- Dunne, Áine, Margaret Anne Lawlor, and Jennifer Rowley. 2010. Young people’s use of online social networking sites—A uses and gratifications perspective. Journal of Research in Interactive Marketing 4: 46–58. [Google Scholar] [CrossRef] [Green Version]
- Fikkers, Karin, and Jessica Taylor Piotrowski. 2020. Content and person effects in media research: Studying differences in cognitive, emotional, and arousal responses to media content. Media Psychology 23: 493–520. [Google Scholar] [CrossRef] [Green Version]
- Foroudi, Pantea, Qionglei Yu, Suraksha Gupta, and Mohammad Foroudi. 2019. Enhancing university brand image and reputation through customer value co-creation behaviour. Technological Forecasting and Social Change 138: 218–27. [Google Scholar] [CrossRef]
- Foroudi, Pantea, Alireza Nazarian, Sayabek Ziyadin, Philip Kitchen, Khalid Hafeez, Costas Priporas, and Eleonora Pantano. 2020. Co-creating brand image and reputation through stakeholder’s social network. Journal of Business Research 114: 42–59. [Google Scholar] [CrossRef]
- Fortin, David, and Ruby Roy Dholakia. 2005. Interactivity and vividness effects on social presence and involvement with a web-based advertisement. Journal of Business Research 58: 387–96. [Google Scholar] [CrossRef]
- Fumasoli, Tatiana, Giovanni Barbato, and Matteo Turri. 2020. The determinants of university strategic positioning: A reappraisal of the organisation. Higher Education 80: 305–34. [Google Scholar] [CrossRef] [Green Version]
- Gensler, Sonja, Franziska Völckner, Yuping Liu Thompkins, and Caroline Wiertz. 2013. Managing brands in the social media environment. Journal of Interactive Marketing 27: 242–56. [Google Scholar] [CrossRef]
- Goorha, Saurabh, and Lyle Ungar. 2010. Discovery of significant emerging trends. Paper presented at the Proceedings of ACM SIGKDD International Conference on Knowledge Discovery and Data Mining, Washington, DC, USA, July 24–28. [Google Scholar]
- Hansen, Kirsten. Gillian Nowlan, and Christina Winter. 2012. Pinterest as a tool: Applications in academic libraries and higher education. Partnership: The Canadian Journal of Library and Information Practice and Research 7: 1–11. [Google Scholar] [CrossRef] [Green Version]
- Hashim, Sharizal, Norjaya Mohd Yasin, and Siti Aisyah Ya’kob. 2020. What constitutes student–university brand relationship? Malaysian students’ perspective. Journal of Marketing for Higher Education 30: 180–202. [Google Scholar] [CrossRef]
- Horton, Donald, and R. Richard Wohl. 1956. Mass Communication and Para-Social Interaction. Psychiatry 19: 215–29. [Google Scholar] [CrossRef] [PubMed]
- Kaplan, Andreas, and Michael Haenlein. 2010. Users of the world, unite! The challenges and opportunities of Social Media. Business Horizons 53: 59–68. [Google Scholar] [CrossRef]
- Katz, Elihu, Hadassah Haas, and Michael Gurevitch. 1973. On the use of the mass media for important things. American Sociological Review 38: 164–81. [Google Scholar] [CrossRef]
- Kiang, Melody, T. S. Raghu, and Kevin Huei Min Shang. 2000. Marketing on the Internet—Who can benefit from an online marketing approach? Decision Support Systems 27: 383–93. [Google Scholar] [CrossRef]
- Kim, Angella, and Eunju Ko. 2012. Do social media marketing activities enhance customer equity? An empirical study of luxury fashion brand. Journal of Business Research 65: 1480–86. [Google Scholar] [CrossRef]
- Kohler, Thomas, Johann Fueller, Kurt Matzler, Daniel Stieger, and Johann Füller. 2011. CO-creation in virtual worlds: The design of the user experience. MIS Quarterly: Management Information Systems 35: 773–88. [Google Scholar] [CrossRef]
- Kuzma, Joanne, and Warren Wright. 2013. Using social networks as a catalyst for change in global higher education marketing and recruiting. International Journal of Continuing Engineering Education and Life-Long Learning 23: 53–66. [Google Scholar] [CrossRef] [Green Version]
- Laroche, Michel, Mohammad Reza Habibi, and Marie Odile Richard. 2013. To be or not to be in social media: How brand loyalty is affected by social media? International Journal of Information Management 33: 76–82. [Google Scholar] [CrossRef]
- Lee, Chei Sian, Dion Hoe Lian Goh, Alton Chua, and Rebecca Ang. 2010. Indagator: Investigating perceived gratifications of an application that blends mobile content sharing with gameplay. Journal of the American Society for Information Science and Technology 61: 1244–57. [Google Scholar] [CrossRef]
- Lee, Daisy, Peggy Ng, and Svetlana Bogomolova. 2020. The impact of university brand identification and eWOM behaviour on students’ psychological well-being: A multi-group analysis among active and passive social media users. Journal of Marketing Management 36: 384–403. [Google Scholar] [CrossRef]
- Lehmann, Janette, Mounia Lalmas, Elad Yom Tov, and Georges Dupret. 2012. Models of user engagement. In User Modeling, Adaptation, and Personalization. UMAP 2012. Lecture Notes in Computer Science (Including Subseries Lecture Notes in Artificial Intelligence and Lecture Notes in Bioinformatics); Berlin and Heidelberg: Springer, vol. 36, pp. 164–175. [Google Scholar]
- Leung, Louis. 2009. User-generated content on the internet: An examination of gratifications, civic engagement and psychological empowerment. New Media and Society 11: 1327–47. [Google Scholar] [CrossRef]
- Liang, Ting Peng, Yi Ting Ho, Yu Wen Li, and Efraim Turban. 2011. What drives social commerce: The role of social support and relationship quality. International Journal of Electronic Commerce 16: 69–90. [Google Scholar] [CrossRef] [Green Version]
- Liu, Ben, and Dale Goodhue. 2012. Two worlds of trust for potential e-commerce users: Humans as cognitive misers. Information Systems Research 23: 1246–62. [Google Scholar] [CrossRef]
- Liu, Yuping, and L. J. Shrum. 2002. What is interactivity and is it always such a good thing? Implications of definition, person, and situation for the influence of interactivity on advertising effectiveness. Journal of Advertising 31: 53–64. [Google Scholar] [CrossRef]
- Liu, Yong, Hongxiu Li, and Feng Hu. 2013. Website attributes in urging online impulse purchase: An empirical investigation on consumer perceptions. Decision Support Systems 55: 829–37. [Google Scholar] [CrossRef]
- Loiacono, Eleanor, Richard Watson, and Dale Goodhue. 2007. WebQual: An instrument for consumer evaluation of web sites. International Journal of Electronic Commerce 11: 51–87. [Google Scholar] [CrossRef]
- Luo, Margaret Meiling, Sophea Chea, and Ja Shen Chen. 2011. Web-based information service adoption: A comparison of the motivational model and the uses and gratifications theory. Decision Support Systems 51: 21–30. [Google Scholar] [CrossRef]
- Mehrabian, Albert, and Russell James. 1974. An Approach to Environmental Psychology. Cambridge: MIT Press, p. 266. [Google Scholar]
- Meishar-Tal, Hagit, Gila Kurtz, and Efrat Pieterse. 2012. Facebook groups as LMS: A case study. International Review of Research in Open and Distance Learning 13: 33–48. [Google Scholar] [CrossRef] [Green Version]
- Muniz, Albert, and Thomas O’Guinn. 2001. Brand community. Journal of Consumer Research 27: 412–32. [Google Scholar] [CrossRef]
- Nambisan, Satish, and Robert Baron. 2009. Virtual customer environments: Testing a model of voluntary participation in value co-creation activities. Journal of Product Innovation Management 26: 388–406. [Google Scholar] [CrossRef]
- Opoku, Robert, Russell Abratt, and Leyland Pitt. 2006. Communicating brand personality: Are the websites doing the talking for the top South African business schools? Journal of Brand Management 14: 20–39. [Google Scholar] [CrossRef]
- Pagani, Margherita, and Alessandra Mirabello. 2011. The influence of personal and social-interactive engagement in social TV web sites. International Journal of Electronic Commerce 16: 41–67. [Google Scholar] [CrossRef]
- Parboteeah, Veena, Joseph Valacich, and John Wells. 2009. The influence of website characteristics on a consumer’s urge to buy impulsively. Information Systems Research 20: 60–78. [Google Scholar] [CrossRef]
- Park, Namsu, Kerk Kee, and Sebastián Valenzuela. 2009. Being immersed in social networking environment: Facebook groups, uses and gratifications, and social outcomes. Cyberpsychology and Behavior 12: 729–33. [Google Scholar] [CrossRef] [Green Version]
- Pinar, Musa, Tulay Girard, and Cigdem Basfirinci. 2020. Examining the relationship between brand equity dimensions and university brand equity: An empirical study in Turkey. International Journal of Educational Management 34: 1119–41. [Google Scholar] [CrossRef]
- Raacke, John, and Jennifer Bonds-Raacke. 2008. MySpace and facebook: Applying the uses and gratifications theory to exploring friend-networking sites. Cyberpsychology and Behavior 11: 169–74. [Google Scholar] [CrossRef] [PubMed]
- Rafaeli, Sheizaf, and Yaron Ariel. 2007. Assessing interactivity in computer-mediated research. In The Oxford Handbook of Internet Psychology. Oxford: Oxford University Press, pp. 71–88. [Google Scholar]
- Robins, Garry, Philippa Pattison, and Peter Elliott. 2001. Network models for social influence processes. Psychometrika 66: 161–89. [Google Scholar] [CrossRef]
- Rolfe, Heather. 2003. University strategy in an age of uncertainty: The effect of higher education funding on old and new universities. Higher Education Quarterly 57: 24–47. [Google Scholar] [CrossRef]
- Saichaie, Kem, and Christopher Morphew. 2014. What college and university websites reveal about the purposes of higher education. Journal of Higher Education 85: 499–530. [Google Scholar] [CrossRef]
- Salomon, Danielle. 2013. Moving on from Facebook: Using Instagram to connect with undergraduates and engage in teaching and learning. College and Research Libraries News 74: 408–12. [Google Scholar] [CrossRef]
- Schau, Hope Jensen, Albert Muñiz, and Eric J. Arnould Jr. 2009. How brand community practices create value. Journal of Marketing 73: 30–51. [Google Scholar] [CrossRef]
- Schivinski, Bruno, and Dariusz Dabrowski. 2016. The effect of social media communication on consumer perceptions of brands. Journal of Marketing Communications 22: 189–214. [Google Scholar] [CrossRef] [Green Version]
- Schmitt, Philipp, Bernd Skiera, and Christophe Van den Bulte. 2011. Referral programs and customer value. Journal of Marketing 75: 46–59. [Google Scholar] [CrossRef]
- Schultz, Don E., and James (Jimmy) Peltier. 2013. Social media’s slippery slope: Challenges, opportunities and future research directions. Journal of Research in Interactive Marketing 7: 86–99. [Google Scholar] [CrossRef]
- Sledgianowski, Deb, and Songpol Kulviwat. 2009. Using social network sites: The effects of playfulness, critical mass and trust in a hedonic context. Journal of Computer Information Systems 49: 74–83. [Google Scholar]
- Stafford, Thomas, Marla Royne Stafford, and Lawrence Schkade. 2004. Determining uses and gratifications for the internet. Decision Sciences 35: 259–88. [Google Scholar] [CrossRef]
- Teo, Hock Hai, Lih Bin Oh, Chunhui Liu, and Kwok Kee Wei. 2003. An empirical study of the effects of interactivity on web user attitude. International Journal of Human Computer Studies 58: 281–305. [Google Scholar] [CrossRef]
- Thorson, Kjerstin, and Shelly Rodgers. 2006. Relationships between blogs as eWOM and interactivity, perceived interactivity, and parasocial interaction. Journal of Interactive Advertising 6: 5–44. [Google Scholar] [CrossRef]
- Tsai, Hsien Tung, and Peiyu Pai. 2012. Positive and negative aspects of online community cultivation: Implications for online stores’ relationship management. Information and Management 49: 111–17. [Google Scholar] [CrossRef]
- Valenzuela, Sebastián, Namsu Park, and Kerk Kee. 2009. Is There social capital in a social network site?: Facebook use and college student’s life satisfaction, trust, and participation. Journal of Computer-Mediated Communication 14: 875–901. [Google Scholar] [CrossRef] [Green Version]
- Valerio-Ureña, Gabriel, Dagoberto Herrera Murillo, and Sergio Madero Gómez. 2020. Analysis of the presence of most best-ranked universities on social networking sites. Informatics 7: 9. [Google Scholar] [CrossRef] [Green Version]
- Viswanathan, Vijay, Linda Hollebeek, Edward C. Malthouse, Ewa Maslowska, Su Jung Kim, and Wei Xie. 2017. The dynamics of consumer engagement with mobile technologies. Service Science 9: 36–49. [Google Scholar] [CrossRef]
- Wallace, Elaine, Isabel Buil, and Leslie de Chernatony. 2014a. Consumer engagement with self-expressive brands: Brand love and WOM outcomes. Journal of Product and Brand Management 23: 33–42. [Google Scholar] [CrossRef] [Green Version]
- Wallace, Elaine, Isabel Buil, Leslie de Chernatony, and Michael Hogan. 2014b. Who “likes” you…and why? A typology of facebook fans: From “fan”-atics and self- expressives to utilitarians and authentics. Journal of Advertising Research 54: 92–109. [Google Scholar] [CrossRef] [Green Version]
- Webster, Jane, Linda Klebe Trevino, and Lisa Ryan. 1993. The dimensionality and correlates of flow in human-computer interactions. Computers in Human Behavior 9: 411–26. [Google Scholar] [CrossRef]
- Weinberg, Bruce, and Ekin Pehlivan. 2011. Social spending: Managing the social media mix. Business Horizons 54: 275–82. [Google Scholar] [CrossRef]
- Wells, John, Veena Parboteeah, and Joseph Valacich. 2011. Online impulse buying: Understanding the interplay between consumer impulsiveness and website quality. Journal of the Association of Information Systems 12: 32–56. [Google Scholar] [CrossRef] [Green Version]
- Weng, Jianshu, Ee Peng Lim, Jing Jiang, and Qi He. 2010. TwitterRank: Finding topic-sensitive influential twitterers. Paper presented at the WSDM 2010—Proceedings of 3rd ACM International Conference on Web Search and Data Mining, New York, NY, USA, February 3–6. [Google Scholar]
- Woolley, Julia, Anthony Limperos, and Mary Beth Oliver. 2010. The 2008 presidential election, 2.0: A content analysis of user-generated political facebook groups. Mass Communication and Society 13: 631–52. [Google Scholar] [CrossRef]
- Xu, Chenyan, Sherry Ryan, Victor Prybutok, and Chao Wen. 2012. It is not for fun: An examination of social network site usage. Information and Management 49: 210–17. [Google Scholar] [CrossRef] [Green Version]
- Yousaf, Anish, Abhishek Mishra, and Makhmoor Bashir. 2020. Brand trust, institutional commitment, and their impact on student loyalty: Evidence for higher education in India. Studies in Higher Education 45: 878–91. [Google Scholar] [CrossRef]
- Zarrella, Dan. 2009. The Social Media Marketing Book. Farnham: O’Reilly Media. [Google Scholar]
- Zhang, Tongxiao (Catherine), Ritu Agarwal, and Henry Lucas. 2011. The value of IT-enabled retailer learning: Personalized product recommendations and customer store loyalty in electronic markets. Management Information Systems Quarterly 35: 1–23. [Google Scholar]
- Zhang, Lun, Tai Quan Peng, Ya Peng Zhang, and Xiao Hong Wang. 2012. Content or context: Which carries more weight in predicting popularity of tweets in china. Paper presented at the 65th Annual Conference of World Association for Public Opinion Research, Hong Kong, China, June 14–16. [Google Scholar]
- Zhang, Kem, Sesia Zhao, Mei Kwan Cheung, and Matthew Lee. 2014. Examining the influence of online reviews on consumers’ decision-making: A heuristic-systematic model. Decision Support Systems 67: 78–89. [Google Scholar] [CrossRef]
Figure 1.
Extended research model.

Figure 2.
Model results. *: p < 0.05; **: p < 0.01; ***: p < 0.001

Figure 3.
(a) Clues of California Institute of Technology; (b) clues of Massachusetts Institute of Technology; (c) clues of Stanford University; (d) clues of Imperial College London; (e) clues of University of Cambridge; (f) clues of University of Oxford.
Figure 3.
(a) Clues of California Institute of Technology; (b) clues of Massachusetts Institute of Technology; (c) clues of Stanford University; (d) clues of Imperial College London; (e) clues of University of Cambridge; (f) clues of University of Oxford.


Table 1.
Summary of hypotheses.
| ID | Hypothesis | Verdict |
|---|---|---|
| H1a | The university pages of universities in the United States possess “key (image) clues,” which have a significant influence on the “likes” of users. | Not established |
| H1b | The university pages of universities in the United States possess “key (image) clues,”which have a significant influence on the “comments” of users. | Established |
| H1c | The university pages of universities in the United States possess “key (image) clues,” which have a significant influence on the “shares” of users. | Established |
| H2a | The university pages of universities in the United Kingdom possess “key (image) clues,” which have a significant influence on the “likes” of users. | Established |
| H2b | The university pages of universities in the United Kingdom possess “key (image) clues,” which have a significant influence on the “comments” of users. | Established |
| H2c | The university pages of universities in the United Kingdom possess “key (image) clues,” which have a significant influence on the “shares” of users. | Not established |
Table 2.
Linear regression coefficient of determination and beta (universities in the United States).
Table 2.
Linear regression coefficient of determination and beta (universities in the United States).
| Universities in the United States | R | R2 | Adjusted R2 | F-Change | ∆F | Durbin–Watson | B | Standard Error | Beta | T | Sig. | |
|---|---|---|---|---|---|---|---|---|---|---|---|---|
| Likes | Random Decision Forests | 0.002 | 0.000 | 0.000 | 0.000 | 0.044 | 1.639 | −0.955 | 4.576 | −0.002 | −0.209 | 0.835 |
| eXtreme Gradient Boosting | 0.017 | 0.000 | 0.000 | 0.000 | 3.023 | 1.637 | −7.011 | 4.033 | −0.017 | −1.739 | 0.082 | |
| AdaBoost | 0.002 | 0.000 | 0.000 | 0.000 | 0.027 | 1.640 | 0.981 | 6.016 | 0.002 | 0.163 | 0.870 | |
| Comments | Random Decision Forests | 0.060 | 0.004 | 0.004 | 0.004 | 39.129 | 1.701 | 1.325 | 0.212 | 0.060 | 6.255 | 0.000 |
| eXtreme Gradient Boosting | 0.029 | 0.001 | 0.001 | 0.001 | 9.313 | 1.692 | 0.582 | 0.191 | 0.029 | 3.052 | 0.002 | |
| AdaBoost | 0.028 | 0.001 | 0.001 | 0.001 | 8.658 | 1.692 | 0.742 | 0.252 | 0.028 | 2.942 | 0.003 | |
| Shares | Random Decision Forests | 0.050 | 0.003 | 0.002 | 0.003 | 27.111 | 1.876 | 7.756 | 1.490 | 0.050 | 5.207 | 0.000 |
| eXtreme Gradient Boosting | 0.026 | 0.001 | 0.001 | 0.001 | 7.326 | 1.873 | 3.550 | 1.312 | 0.026 | 2.707 | 0.007 | |
| AdaBoost | 0.055 | 0.003 | 0.003 | 0.003 | 32.043 | 1.876 | 10.848 | 1.916 | 0.055 | 5.661 | 0.000 | |
Table 3.
Linear regression coefficient of determination and beta (universities in the United Kingdom).
Table 3.
Linear regression coefficient of determination and beta (universities in the United Kingdom).
| Universities in the United Kingdom | R | R2 | Adjusted R2 | F-Change | ∆F | Durbin–Watson | B | Standard Error | Beta | T | Sig. | |
|---|---|---|---|---|---|---|---|---|---|---|---|---|
| Likes | Random Decision Forests | 0.029 | 0.001 | 0.001 | 0.001 | 10.152 | 1.881 | −49.326 | 15.481 | −0.029 | −3.186 | 0.001 |
| eXtreme Gradient Boosting | 0.021 | 0.000 | 0.000 | 0.000 | 5.638 | 1.879 | −31.632 | 13.322 | −0.021 | −2.374 | 0.018 | |
| AdaBoost | 0.024 | 0.001 | 0.000 | 0.001 | 7.088 | 1.880 | −38.524 | 14.471 | −0.024 | −2.662 | 0.008 | |
| Comments | Random Decision Forests | 0.051 | 0.003 | 0.003 | 0.003 | 32.271 | 1.800 | 2.902 | 0.511 | 0.051 | 5.681 | 0.000 |
| eXtreme Gradient Boosting | 0.042 | 0.002 | 0.002 | 0.002 | 22.344 | 1.788 | −1.919 | 0.406 | −0.042 | −4.727 | 0.000 | |
| AdaBoost | 0.039 | 0.002 | 0.001 | 0.002 | 18.672 | 1.790 | −2.068 | 0.479 | −0.039 | −4.321 | 0.000 | |
| Shares | Random Decision Forests | 0.013 | 0.000 | 0.000 | 0.000 | 2.150 | 1.993 | −24.569 | 16.755 | −0.013 | −1.466 | 0.143 |
| eXtreme Gradient Boosting | 0.016 | 0.000 | 0.000 | 0.000 | 3.289 | 1.993 | −26.942 | 14.857 | −0.016 | −1.813 | 0.070 | |
| AdaBoost | 0.011 a | 0.000 | 0.000 | 0.000 | 1.518 | 1.993 | −20.533 | 16.664 | −0.011 | −1.232 | 0.218 | |
Publisher’s Note: MDPI stays neutral with regard to jurisdictional claims in published maps and institutional affiliations. |
© 2021 by the author. Licensee MDPI, Basel, Switzerland. This article is an open access article distributed under the terms and conditions of the Creative Commons Attribution (CC BY) license (https://creativecommons.org/licenses/by/4.0/).
Share and Cite
MDPI and ACS Style
Chen, Y. Analysis of Community Interaction Modules of European and American Universities. Journal. Media 2021, 2, 129-154. https://0-doi-org.brum.beds.ac.uk/10.3390/journalmedia2020009
AMA Style
Chen Y. Analysis of Community Interaction Modules of European and American Universities. Journalism and Media. 2021; 2(2):129-154. https://0-doi-org.brum.beds.ac.uk/10.3390/journalmedia2020009
Chicago/Turabian StyleChen, Yulin. 2021. "Analysis of Community Interaction Modules of European and American Universities" Journalism and Media 2, no. 2: 129-154. https://0-doi-org.brum.beds.ac.uk/10.3390/journalmedia2020009