1. Introduction
In the dynamic landscape of political science, digital platforms have progressively become a focal point of exploration and research. The following academic discourse synthesises insights from multiple sources to examine the role of social media in political discourse, the behaviours of different generations online, and the impact of algorithms on content visibility.
The advent of social media platforms has yet to revitalise the public sphere as envisioned (
Kruse et al. 2018). Recent studies suggest that social media users, particularly Millennials and Generation Xers, avoid online political discourse due to fear of harassment, surveillance and the preference for engaging only with politically like-minded individuals (
Kruse et al. 2018). Thus, the envisioned social media-facilitated public sphere remains contested.
In addition to shaping the contours of the public sphere, the Internet and social media have been found to affect voting patterns, street protests, attitudes toward the government, and politicians’ behaviour (
Zhuravskaya et al. 2020). This influence is attributed to the unique traits of online platforms, such as low entry barriers and user-generated content (
Zhuravskaya et al. 2020). Nevertheless, empirical research reveals a complexity underlying these digital interactions (
Pond and Lewis 2019).
Particularly noteworthy is the emergent form of connective action exhibited through social media platforms like
(formerly Twitter), especially during politically charged events (
Pond and Lewis 2019). This phenomenon involves political movements coalescing around specific hashtags and memes, evidenced by movements in the wake of the 2011 UK riots (
Pond and Lewis 2019). However, the potential influence of social media as a source of political information needs to be more recognised within the general population (
Bode 2016).
The role of social media in the proliferation of political disinformation is another area of exploration, which includes a broad spectrum of political content from fake news to hyper-partisan news (
Tucker et al. 2018). Moreover, the impact of social media on political polarisation is a topic of increasing concern (
Tucker et al. 2018).
In the context of political communication strategies, social media usage patterns among Millennial and Gen Z voters are particularly interesting (
Saputro et al. 2023). Despite their active social media engagement, these generations need to be more accepting of political parties (
Saputro et al. 2023). This highlights the importance of understanding the nuanced interaction between political ideologies and social media trends across different age demographics.
An essential component of this discourse is the examination of the political usage of
, characterised by its brevity and impulsivity, as epitomised by the case of Donald J. Trump (
Ott 2017). When combined with the potential of algorithmic amplification, this characteristic can shape political conversations and the visibility of certain political groups (
Huszár et al. 2022). For example, research has revealed a pro-right bias in
’s algorithmic amplification across seven countries (
Huszár et al. 2022).
Finally, we turn to the transnational potential of social media, which provides an opportunity for political engagement that transcends national boundaries (
Bossetta et al. 2017). This potential appears more prominent on
than on Facebook, suggesting a platform-specific variation in political engagement (
Bossetta et al. 2017).
As the narrative of the current research unfolds, the synergy of Political Science and Network Theory is cautiously explored, offering a multidisciplinary vantage point. The incorporation of Network Theory, a mathematical approach, plays an essential part in comprehending and analysing the complexities inherent in social media and its influence on political discourse and behaviour.
Network Theory studies graphs as a representation of symmetric relations or, more generally, asymmetric relations between discrete objects (
Newman 2018). In the context of social networks, these discrete objects can be individuals or groups, and the relationships can range from friendship, communication, conflict, or any other form of social interaction. It is noted that Network Theory’s unique capacity for modelling and analysing such complex systems allows for insights that traditional, linear models of communication and interaction might overlook (
Barabási 2016).
When applied to politics and social media, Network Theory enables a deeper understanding of the multifaceted interactions within these digital public spheres. It could be argued that social media platforms, such as
and Facebook, exist as complex networks where nodes represent individual users, and edges symbolise various forms of interaction (
Liu et al. 2017). These interactions include sharing political news, engaging in political discourse, disseminating or debunking disinformation, or even amplifying political messages through algorithmic functions.
It is acknowledged that Network Theory provides a mathematical basis to discern the structures and dynamics of these interactions, aiding in comprehending the systemic patterns, clusters and propagation pathways that emerge within these social media landscapes. For example, the role of highly connected nodes or “hubs”, as coined by Barabási (
Barabási 2016), could be pivotal in spreading political information or misinformation, creating echo chambers, and the potential for political mobilisation.
Furthermore, studying temporal patterns within these networks might show how political discourse evolves or how specific events or influential individuals (celebrities, political figures) can affect these digital public spheres (
Wasserman and Faust 1994).
Overall, through the integration of Network Theory, this mathematical approach facilitates a comprehensive analysis of the intricate dynamics of social media platforms, contributing significantly to our understanding of the contemporary political landscape, shaped to a considerable extent by digital discourse.
’s increasing role in political campaigning has been thoroughly examined by various studies, reflecting on its instrumental utility for politicians, parties, and the broader electorate, especially during election periods (
Vergeer 2015). Consequently, the network-based analysis of
activities associated with politics, such as the content of political tweets, user networks, and interactions, provides substantial insights into the mechanics of digital political engagement.
Inclusivity is a fundamental principle driving policy networks on global platforms, including
. As an illustrative example, the
network promoting inclusive education policy features diverse actors, including international organisations like the United Nations and disabled persons’ organisations. In virtue of their centrality within the network, these actors exercise significant influence over the dissemination of information and the discourse trajectory (
Schuster et al. 2021).
Online conversational practices of political parties reveal distinct patterns of behaviour and idiosyncrasies, providing insights into the complex cultural phenomena inherent in the digital political discourse. These practices are amenable to quantification and can be leveraged to understand the use of social media platforms such as
witter by different political entities (
Lietz et al. 2014).
Analysing politicians’
networks can further illuminate political discourse’s inherent biases and echo-chamber dynamics. For instance, during the German Bundestag election 2009, most connections were established between members of the same political party, with cross-party links significantly less represented. Furthermore, the discourse was predominantly confined to party clusters and was more favourable towards members of the same political party (
Plotkowiak and Stanoevska-Slabeva 2013).
A nuanced understanding of these network dynamics is advanced by novel measures introduced to evaluate audience diversity and communication connector bridging, which provide insights into the role and influence of various actors in political discourse. These measures, applied to discussions regarding the Transatlantic Trade Investment Partnership in Europe, helped discern different actors’ influence in disseminating political information within online social networks (
Maireder et al. 2017).
The role of Social Network Analysis becomes apparent when understanding the interconnectedness and influence within these digital spaces. For instance, the SNA of
discussions following the announcement of the National Health Insurance Bill to the South African parliament identified the key influencers and gatekeepers shaping the narrative (
Struweg 2020).
Analysing
networks of environmental and political events, such as the United Nations Conference of the Parties in Paris in 2015, also showed that accounts belonging to non-profit and government agencies were more influential, while individual accounts were more likely to retweet others (
Wang et al. 2020).
During televised political debates,
network analysis provides real-time insights into public opinion formation, allowing for a comprehensive understanding of the process. Such research can help identify influential users, gauge sentiment shifts, and understand the role of journalists and media figures (
Tremayne and Minooie 2015)
This network-centric perspective is crucial in recognising opinion leaders within social media spaces. For instance,
data from political debates in Turkey revealed unconventional actors emerging as opinion leaders, employing various tactics to manage their online presence and disseminate their ideas (
Gökçe et al. 2014).
Social network analysis, guided by principles of Network Theory, aids in understanding the dynamics and dispersion of data within these networks. Utilising tools like ‘Network Overview, Discovery and Exploration for Excel Pro’ (NodeXL Pro) simplifies tasks related to social media analytics, providing more precise insights into social media networks (
Struweg 2020).
Finally, the role of in contemporary political discourse must be considered. By examining these networks, political scientists can better understand the dynamics, influencers, and overall flow of information within these digital ecosystems, further influencing policy-making and political strategies.
In light of the burgeoning role of social media platforms in shaping political landscapes and discourse, exploring the intricacies of these connections within specific political contexts is imperative. The dynamics of interactions among politicians in Greece’s governing party provide a compelling case for this investigation. Thus, the focus of this study is shifted towards understanding how these connections evolve, what underlying patterns can be deciphered, and how Network Theory can shed light on the multifaceted dynamics of political communication on . The research question guiding this inquiry is: “How do political connections within Greece’s governing party evolve, and what underlying patterns and dynamics are revealed through a network analysis of interactions on ?” This study aims to contribute to political communication and the broader realm of social sciences by employing mathematical tools derived from Network Theory.
In parallel with the above considerations, data journalism represents a paradigm shift in how information, including political connections and interactions, is gathered, analysed, and presented (
Veglis and Bratsas 2021,
2017a;
Kalatzi et al. 2018;
Veglis and Bratsas 2017b). The application of data-driven techniques akin to those used in this study enhances the rigour and depth of analysis and facilitates a more nuanced understanding of complex political landscapes. In the context of Greece’s governing party, data journalism methods can elucidate the intricacies of
interactions, revealing underlying patterns that traditional journalistic methods might overlook (
Veglis and Bratsas 2017a;
Kalatzi et al. 2018). Consequently, integrating Network Theory with data journalism offers a promising avenue for an enriched exploration of political communication. By combining mathematical precision with the interpretive capabilities of journalism, this study seeks to contribute to both the methodological advancement and the practical implications of political analysis in the digital age.
2. Methodology
This study delves into exploring political connections within the governing party of Greece, utilising Network Theory and analysing the directed and weighted network derived from interactions among politicians. Key network indicators were examined, including out-degree centrality, in-degree centrality, hubs centrality, authorities centrality, vertex entropy in, and vertex entropy out.
In the current political landscape, social media has become intricately interwoven, thus facilitating innovative methods to analyse dynamics and influence among political figures.
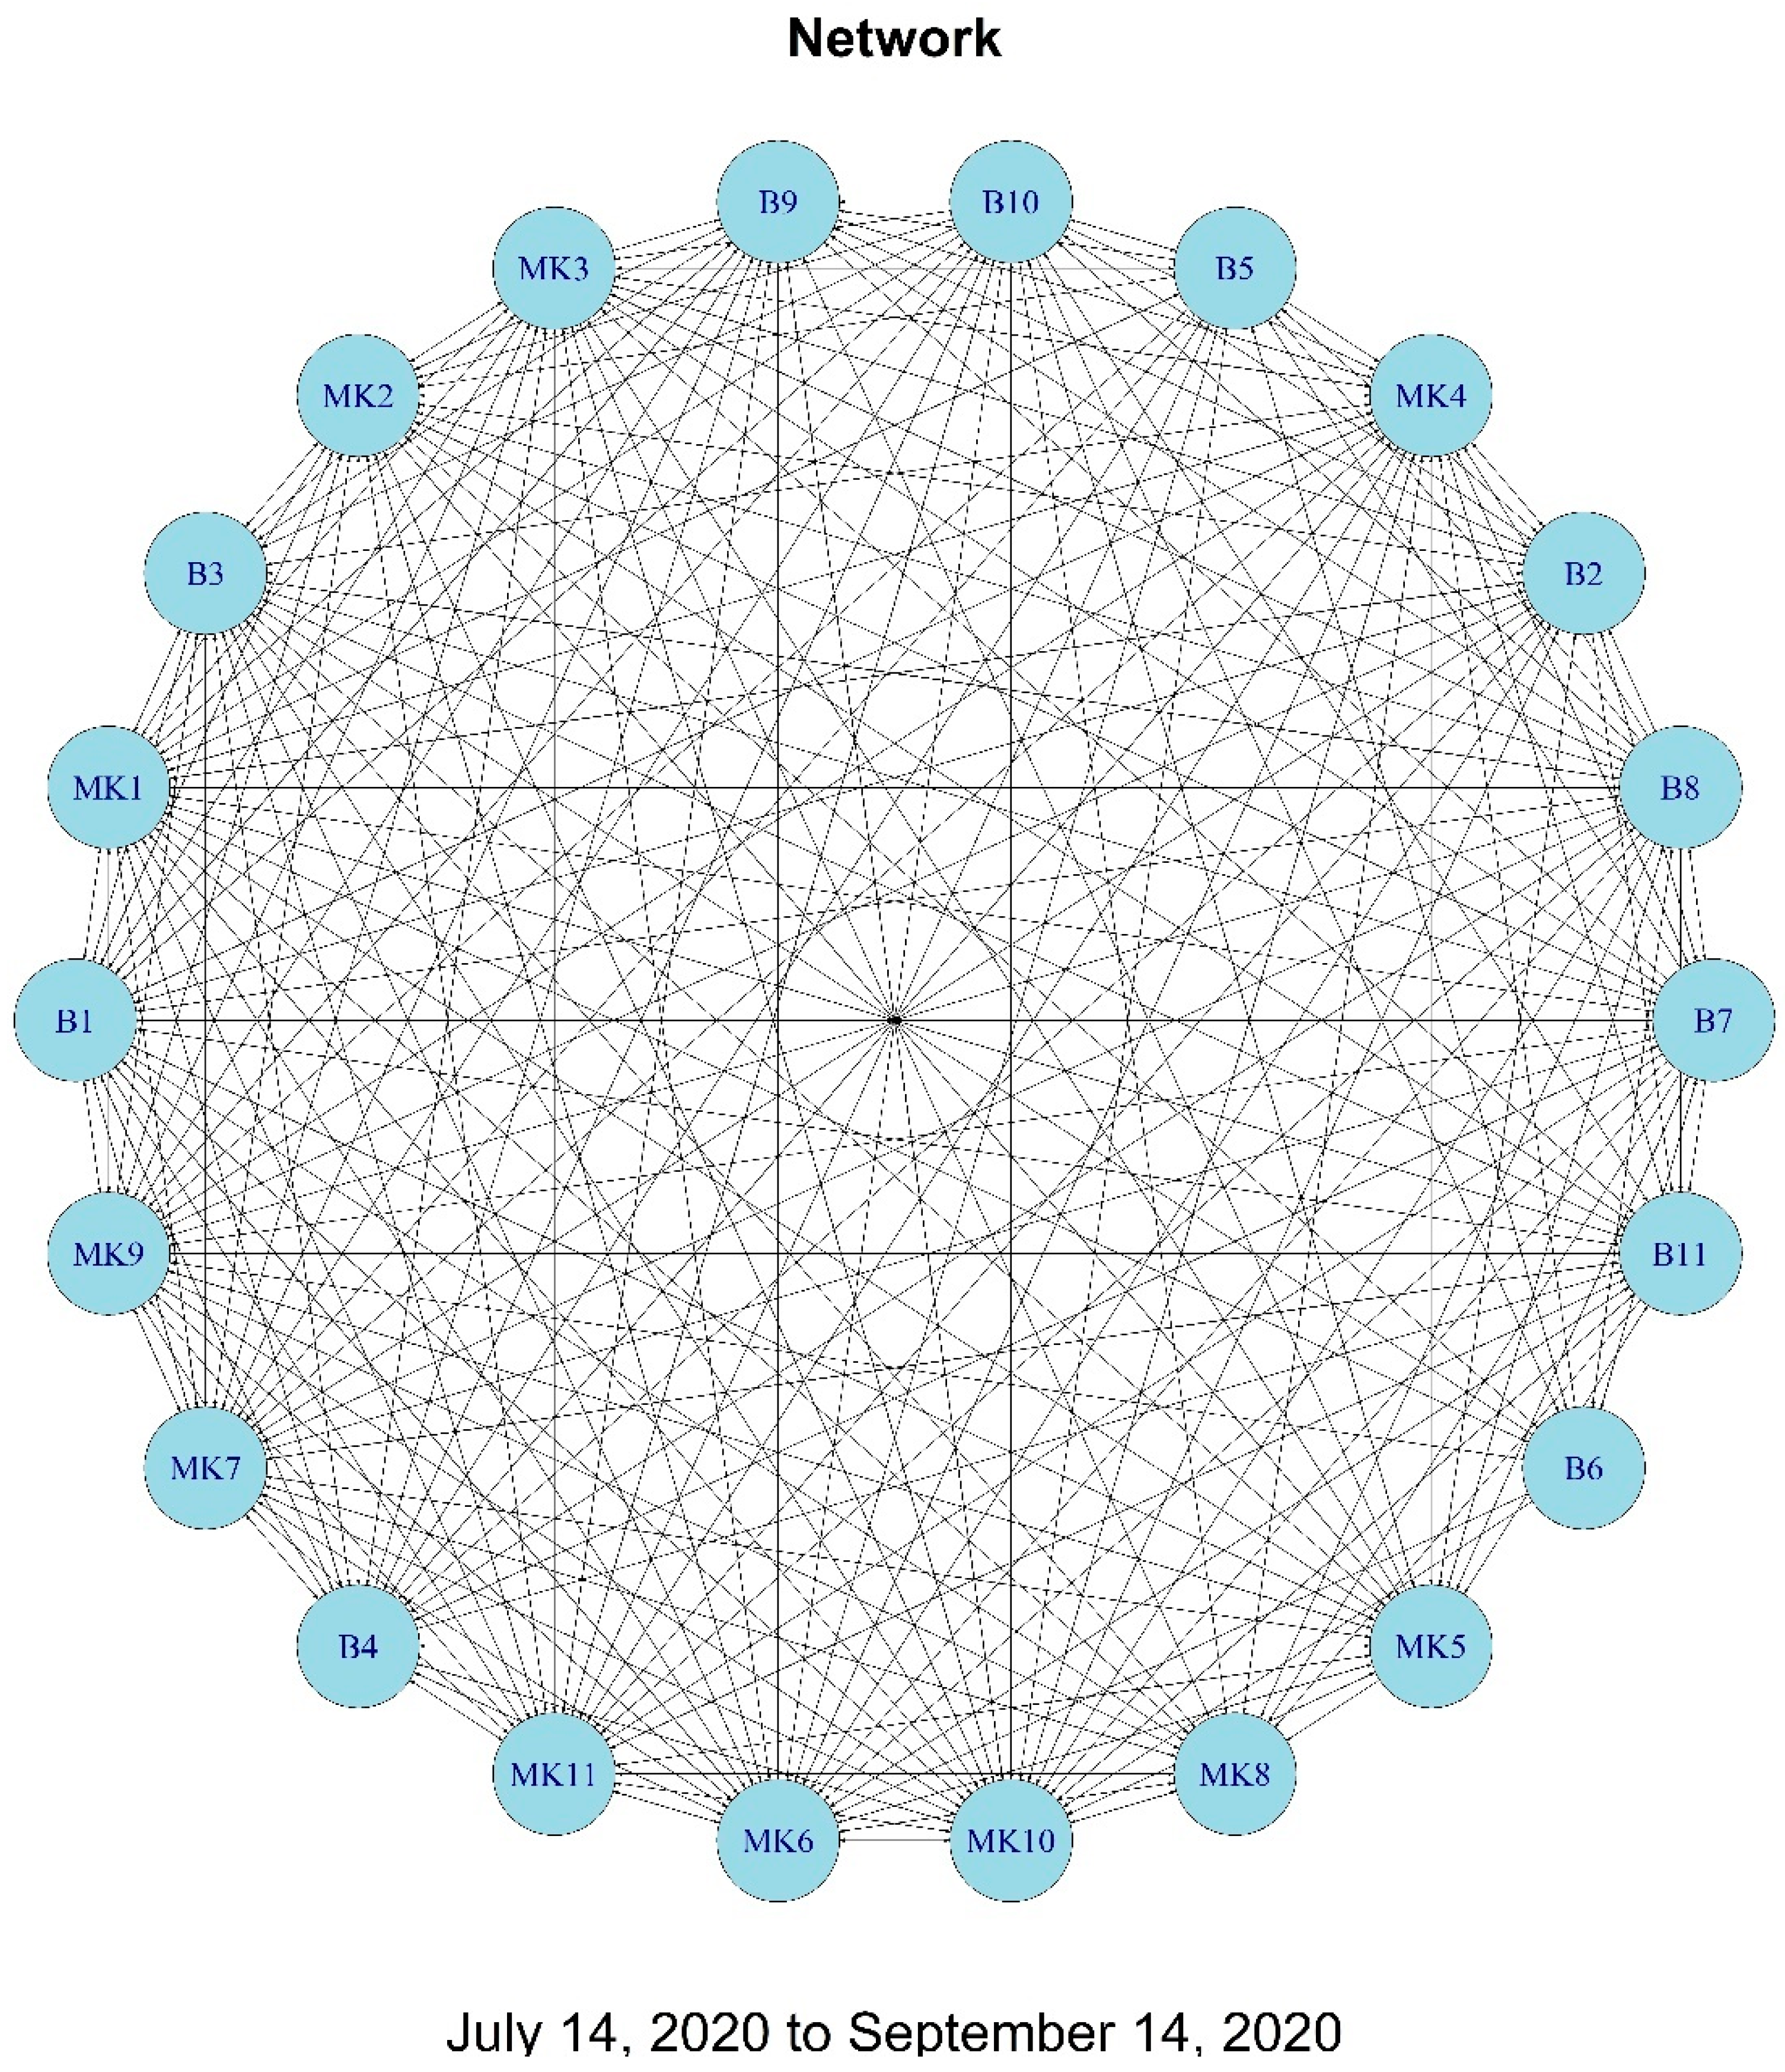
, a platform extensively utilised for microblogging, provides a valuable basis for probing these interactions. In this study, the connections between members of the governing party in Greece were examined, with a clear distinction made between government members (prefix “MK”) and party representatives in the parliament (prefix “B”). 11 nodes from the government and 11 from the governing party’s parliamentary representatives were ultimately selected. These random selections produced a directed and weighted network of 22 nodes (
Figure 1 and
Figure 2). Data were obtained from
, and connections between politicians were identified and categorised based on three criteria: (1) follows were allocated a weight of 1; (2) retweets were given a weight of 2; (3) mentions were assigned a weight of 3. This methodology culminated in a network amenable to investigation through Network Theory. This study was confined to individuals from the same political party, as the intention was for the weights of the connections to signify positive relationships. It was noted that members from opposing parties often employ retweets and mentions to critique and assail their political rivals, which might lead to the network reflecting both positive and negative weights.
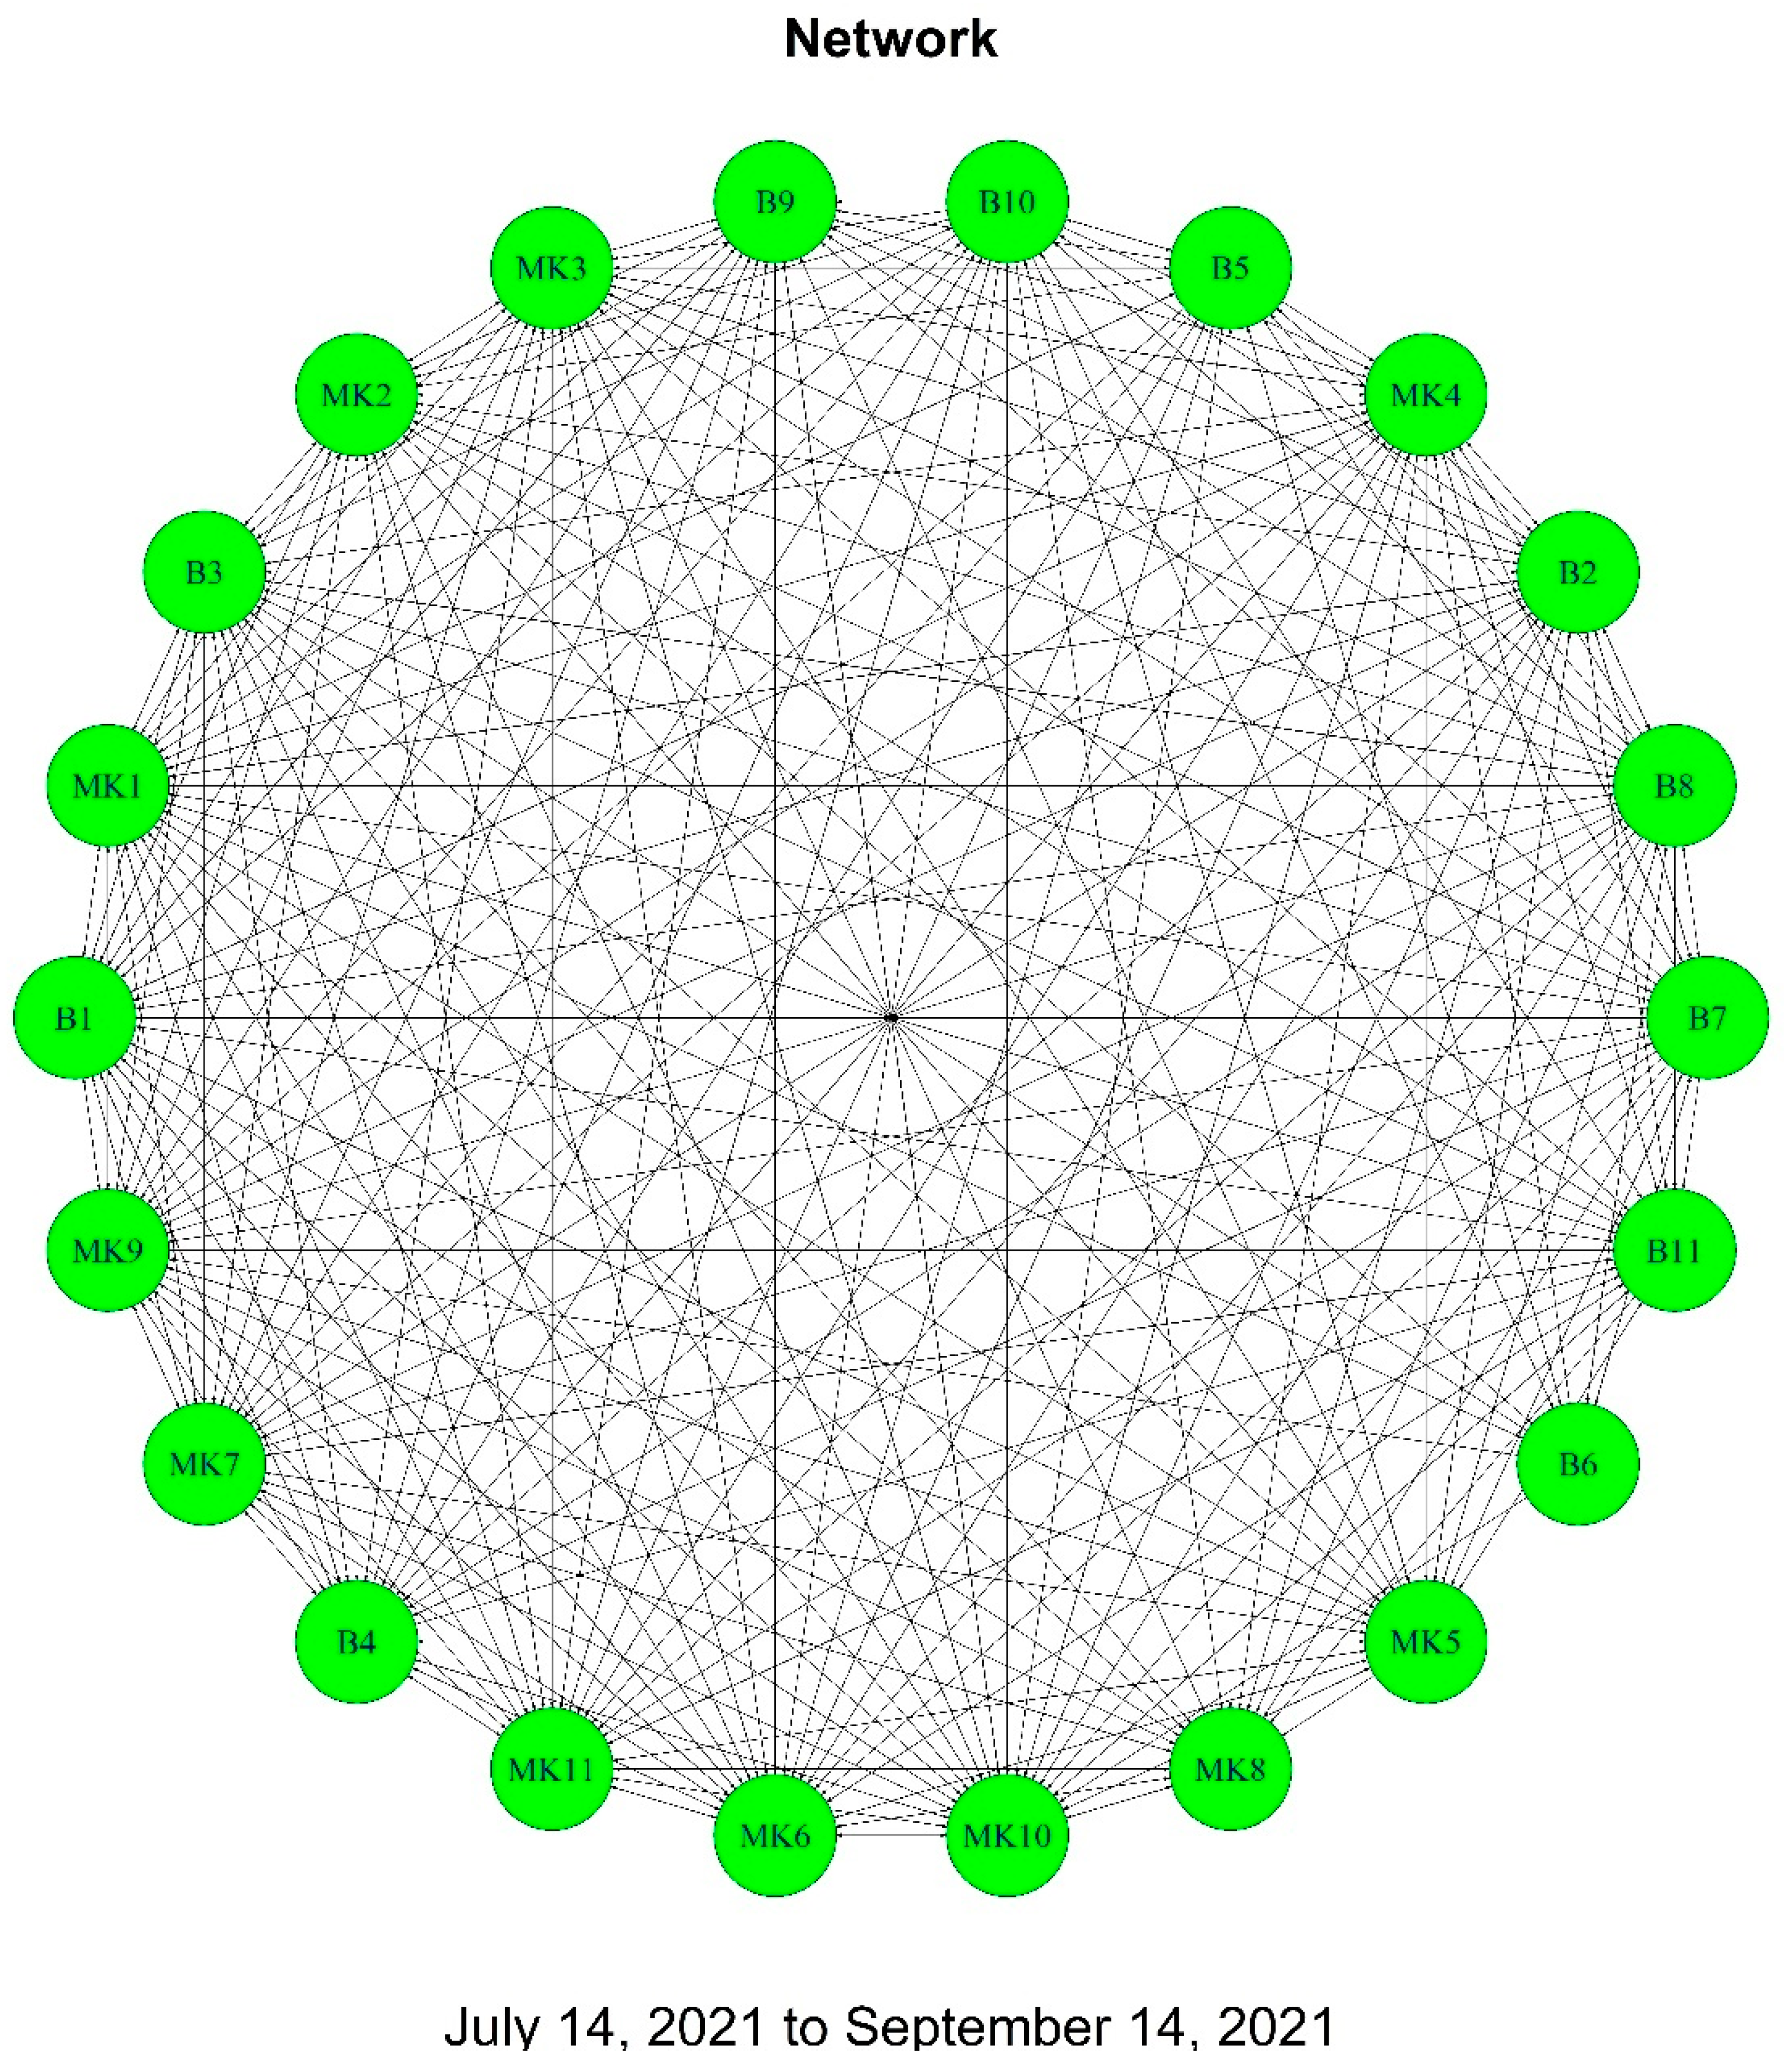
This study was conducted over two periods, from 14 July to 14 September 2020 and 2021 (
Figure 1 and
Figure 2). These two-month windows were carefully chosen to analyse the evolution of political networks over time, focusing on periods marked by low political activity but framed by two significant annual events. (i) Wildfires in Greece: Each year, during July and early August, Greece experiences severe and extensive wildfires. These natural disasters prompt heated political discussions concerning prevention measures, response inefficiencies, and the overall ability of the government to contain such emergencies. The debates and political dynamics arising from the wildfires shape the political networks during these periods (
Analytica 2021;
Stougiannidou et al. 2020;
Dimitrakopoulos et al. 2011;
Ferrara et al. 2018;
Turquety et al. 2009;
Koutsias et al. 2012), and (ii) Thessaloniki International Fair: Every year in the second week of September, this event serves as a platform where the government announces its economic policy (
Katsikas and Papakonstantinou n.d.,
2018;
Tsatsanis and Teperoglou 2018;
Hoskins and Tulloch 2016;
Sheehan 2017). The decisions and announcements made during this fair have substantial implications for the political landscape, affecting the relationships and interactions among politicians and political groups. This study aims to track the changes and continuities in the network’s structure and function by examining these two periods a year apart. The timing allows for exploring the network’s characteristics in the wake of significant but contrasting events: the crisis management following the wildfires and the economic policy announcements at the fair.
Within the scope of this study, it is acknowledged that the platform formerly known as Twitter has undergone significant changes following its acquisition by Elon Musk, subsequently being renamed to
(
Dam 2023;
Malhotra and Malhotra 2016;
Ante 2023). These alterations, including the introduction of new algorithms and presentation methods for posts, have impacted the functionality of the platform (
Corte 2020;
Šević et al. 2023). However, it is emphasised that the current study is based on data collected prior to these changes, and the core communication processes on the platform, such as following, retweeting, and mentioning, remain fundamentally unchanged (
Shahzad et al. 2022;
Martin et al. 2023).
While acknowledging the platform’s transition is important, the findings of this research remain relevant and valid for understanding political communications on social networks. Furthermore, it is underlined that the data collection methodology, although conducted during the period when the platform was known as Twitter, continues to be relevant and applicable, as the essential functions of communication through the platform are substantially the same (
Dam 2023;
Malhotra and Malhotra 2016;
Shahzad et al. 2022;
Martin et al. 2023).
In the methodology of this study, attention was given to the selection of data based on the authenticity of the accounts. The data were collected exclusively from verified political figures on the platform, previously known as Twitter and now referred to as . Verification of these accounts was ascertained based on their publicly recognised status on the platform. This verification process served as a crucial step in ensuring the authenticity and reliability of the data, thereby significantly reducing the risk of including information from inauthentic sources.
Given the focus on verified accounts, additional filtering of the data for noise reduction or elimination of fake accounts was not deemed necessary. The data, derived from publicly available and verified communications of these political figures, provided a direct and authentic insight into the dynamics of political communication on the platform. This approach allowed for an accurate capture of the interaction dynamics, without the need for further filtration. This study, thus, utilised these verified communications as a reliable source, focusing on the core communication processes of following, retweeting, and mentioning, which are fundamental in understanding political discourse on social networks.
In this study, an exploratory approach was adopted, characterised by the absence of predefined hypotheses. This methodological choice was made to allow for a more in-depth and unbounded exploration of the political communication dynamics on , particularly within the context of Network Theory and data journalism. The exploratory nature of this research enabled the examination of complex and evolving political connections without the constraints of specific hypotheses, providing a broader understanding of the interactions and influences within the governing party. This approach aligns with the aim of this study to uncover underlying patterns and dynamics in political communication on social networks, which may not have been apparent under a more hypothesis-driven research design.
From the mathematical theory of networks, the following tools are utilised:
The degree of node
in a network of order
is the number of connections of the node
and takes values from
to
. The value 0 indicates the absence of links, and there are no self-loops. The normalised degree is the degree of centrality (
Wasserman and Faust 1994;
Spyropoulos et al. 2021,
2022a;
Newman 2018):
where
In this paper, the out-strength centrality measures the activeness of a politician, indicating their tendency to initiate interactions. The in-strength centrality reflects how often a politician is targeted in interactions, possibly indicating their prominence or influence.
Studying Hubs and Authorities Centralities is particularly beneficial in the case of directed networks. These indices can highlight Authorities: nodes that possess valuable information, and Hubs: nodes that lead to authorities. A characteristic example of a hub is Google, as through this website, users can navigate to many sites considered authorities, such as Wikipedia. Similarly, Wikipedia is regarded as an authority as it is “pointed to” by many hubs (e.g., Google). The Hub Score of a node is equal to the sum of the Authority Scores of the nodes to which it sends an edge. A node has a high Hub Score when linked to nodes considered Authorities on a subject.
In the case of directed networks, studying Hubs and Authorities Centralities is particularly beneficial (
Kolaczyk and Csárdi 2020c;
Freeman 1978;
Newman 2018;
Wasserman and Faust 1994;
Opsahl et al. 2010). These indices can highlight Authorities: nodes that possess valuable information, and Hubs: nodes that lead to authorities. A characteristic example of a hub is Google, as through this website, users can navigate to many sites considered by authorities, such as Wikipedia. Similarly, Wikipedia is regarded as an authority as it is “pointed to” by many hubs (e.g., Google). The Hub Score of a node is equal to the sum of the Authority Scores of the nodes to which it sends an edge. A node has a high Hub Score when linked to nodes considered Authorities on a subject.
The κ-component of the Perron–Frobenius Eigenvector of the Matrix
:
The Authority Score of a node equals the sum of the Hub Scores of the nodes from which it receives an edge. A node has a high Authority Score when it is connected to nodes recognised as Hubs.
The κ-component of the Perron–Frobenius Eigenvector of the Matrix
:
In this paper, Hubs Centrality indicates how well a node serves as a connection hub among other nodes, and Authorities Centrality represents a node’s perceived reliability or authority within the network.
Vertex Entropy measures for each vertex κ the uniformity of edge weights for the edges adjacent to vertex κ (
Angelidis et al. 2020,
2021;
Spyropoulos et al. 2023a,
2023b).
Vertex Entropy Out measures for each vertex κ the uniformity of edge weights for the out-edges adjacent to vertex κ. Take values:
.
Normalised values:
Vertex Entropy In measures for each vertex κ the uniformity of edge weights for the in-edges adjacent to vertex
κ. Take values:
.
Normalised values:
In the above mathematical formulas: , , , , and .
In this paper, Vertex Entropy Out assesses the complexity of outgoing connections, possibly reflecting diverse communication targets, and Vertex Entropy In measures the complexity of incoming connections, possibly reflecting diverse sources of influence.
3. Results
Calculations were carried out using the mathematical tools in
Section 2 on the adjacency and weight matrices as they appear in the
Supplementary Material (S1). The results of the measurements for the two bimonthly periods: 14 July to 14 September 2020 and 2021, are presented in
Table 1 and
Table 2 and are visualised in
Figure 3 and
Figure 4. Additionally, in
Figure 5,
Figure 6,
Figure 7,
Figure 8,
Figure 9,
Figure 10,
Figure 11,
Figure 12,
Figure 13,
Figure 14,
Figure 15 and
Figure 16, the network is represented so that the size of each node corresponds to the score it received in each centrality measure relative to the other nodes in the network. To facilitate a comparison between the two time periods under examination, nodes corresponding to the year 2020 are coloured in light blue, while those corresponding to the year 2021 are in green.
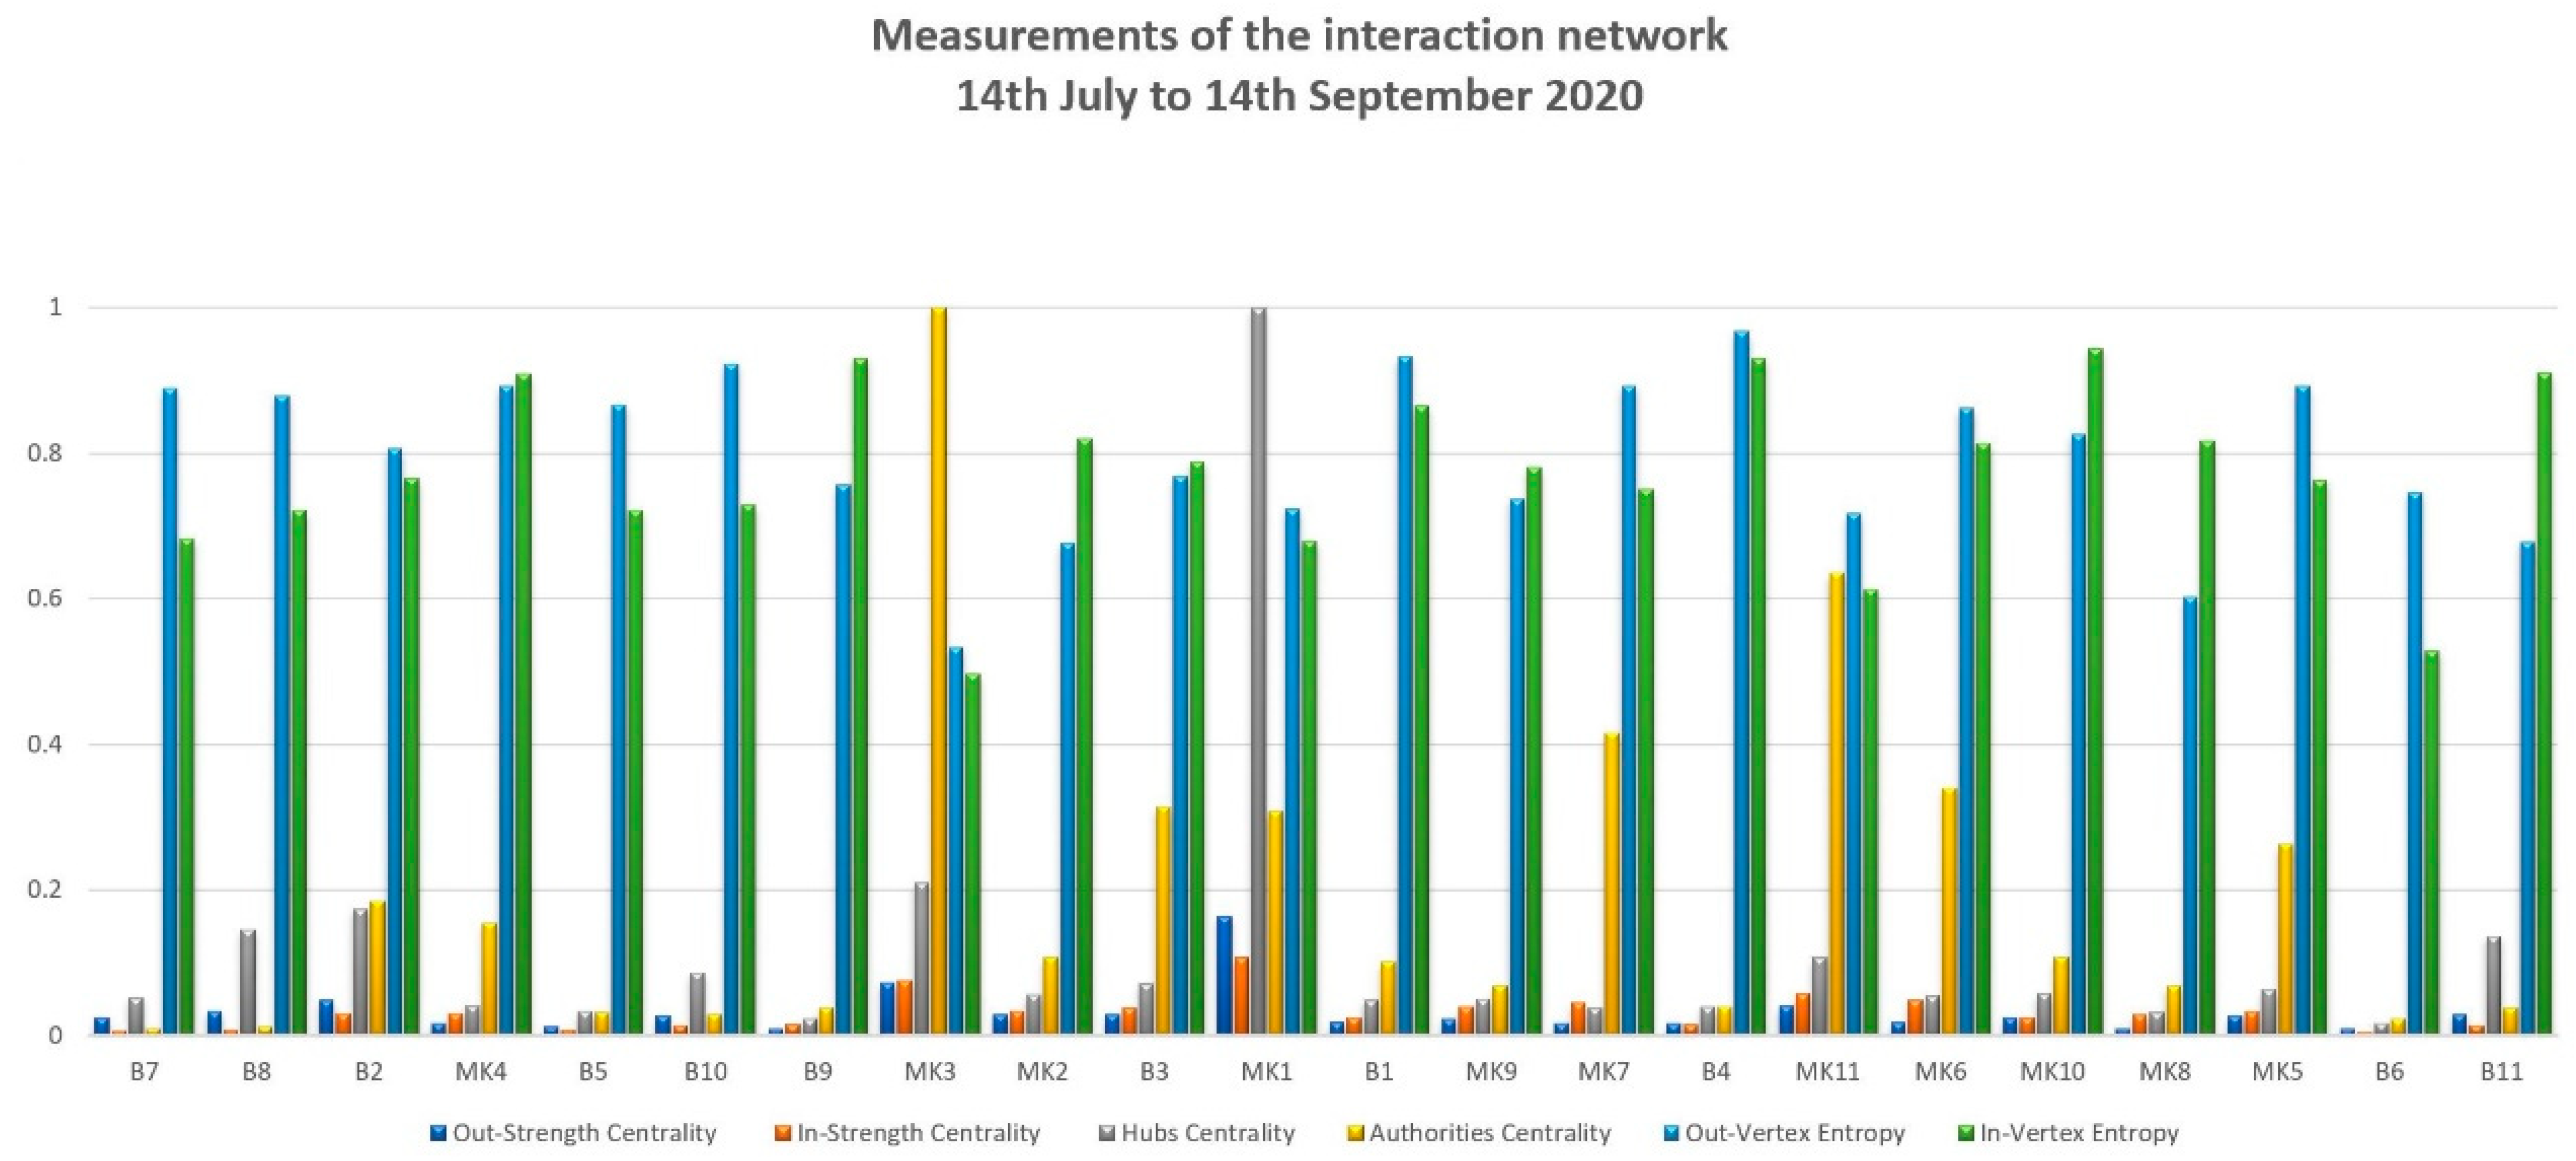
Table 1 and
Figure 3 present a comprehensive analysis of the interaction network on
(formerly Twitter) among 22 political figures from the governing coalition in Greece, spanning from 14 July to 14 September 2020. This period is crucial for understanding the dynamics of political communication during significant national events.
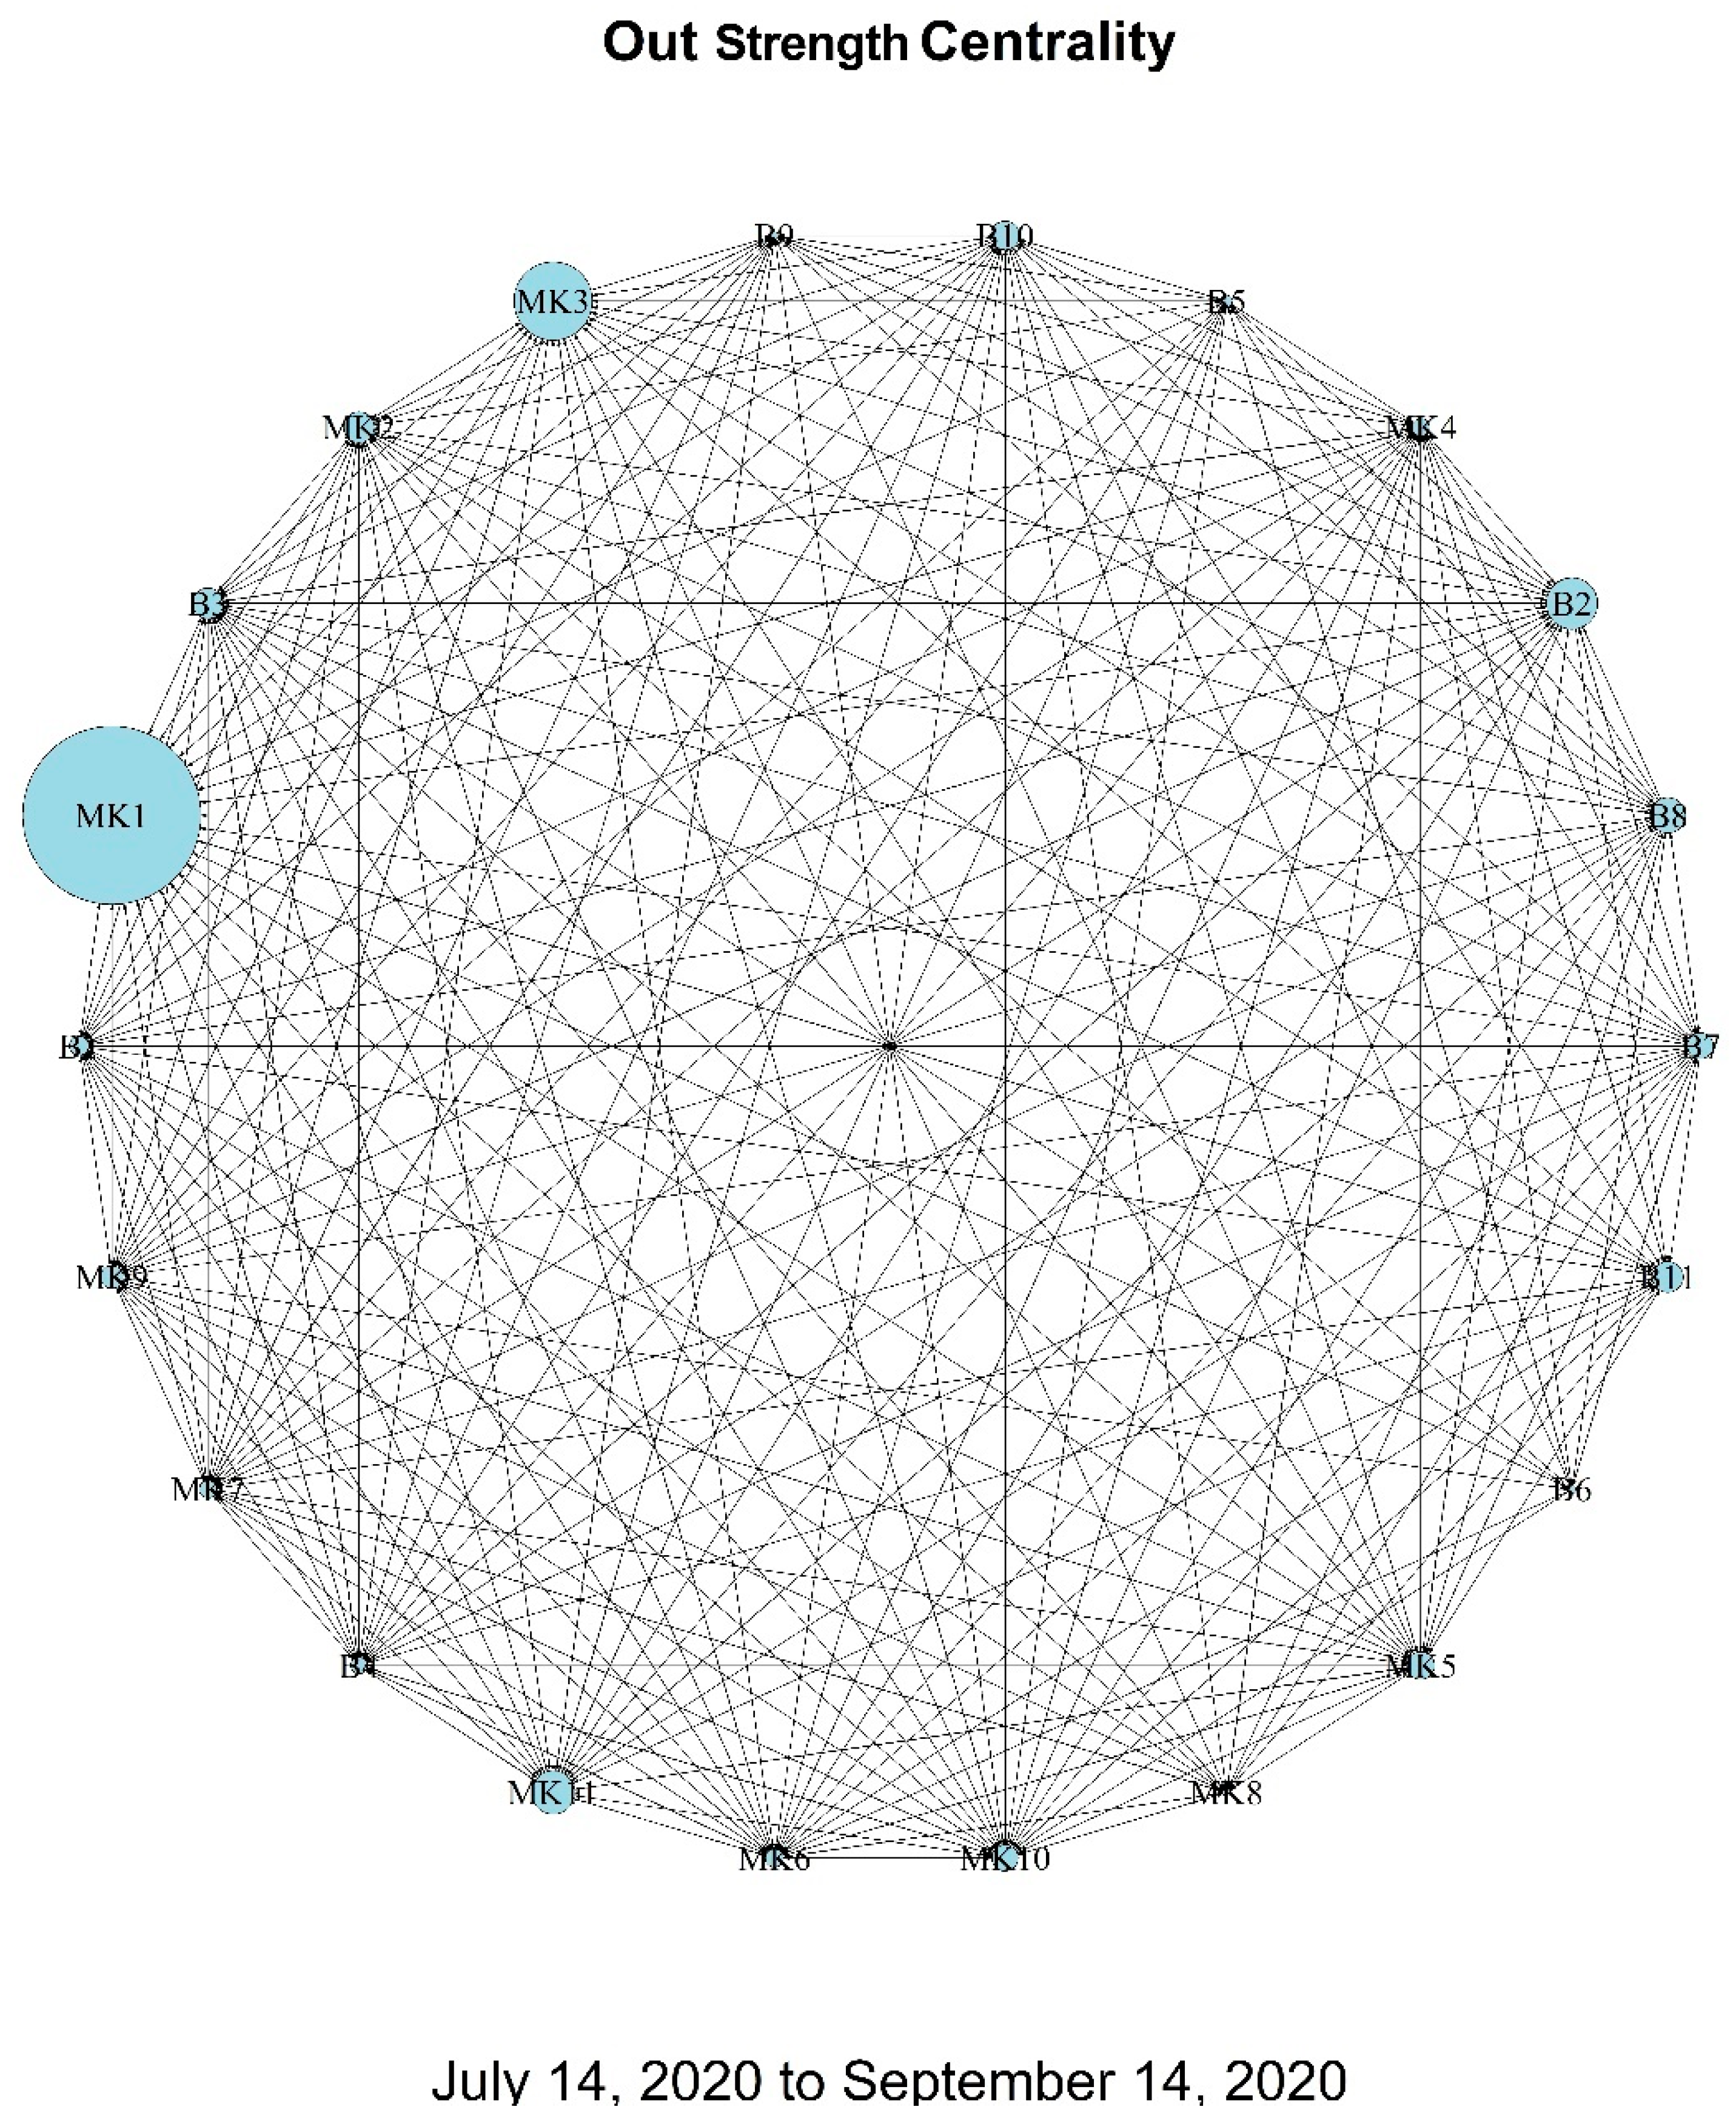
Out-Strength Centrality: Measures the level of activity of each politician in initiating interactions. Higher values indicate a greater tendency to engage with others. For instance, MK1 demonstrates a notably high out-strength centrality, suggesting an active role in initiating political discourse.
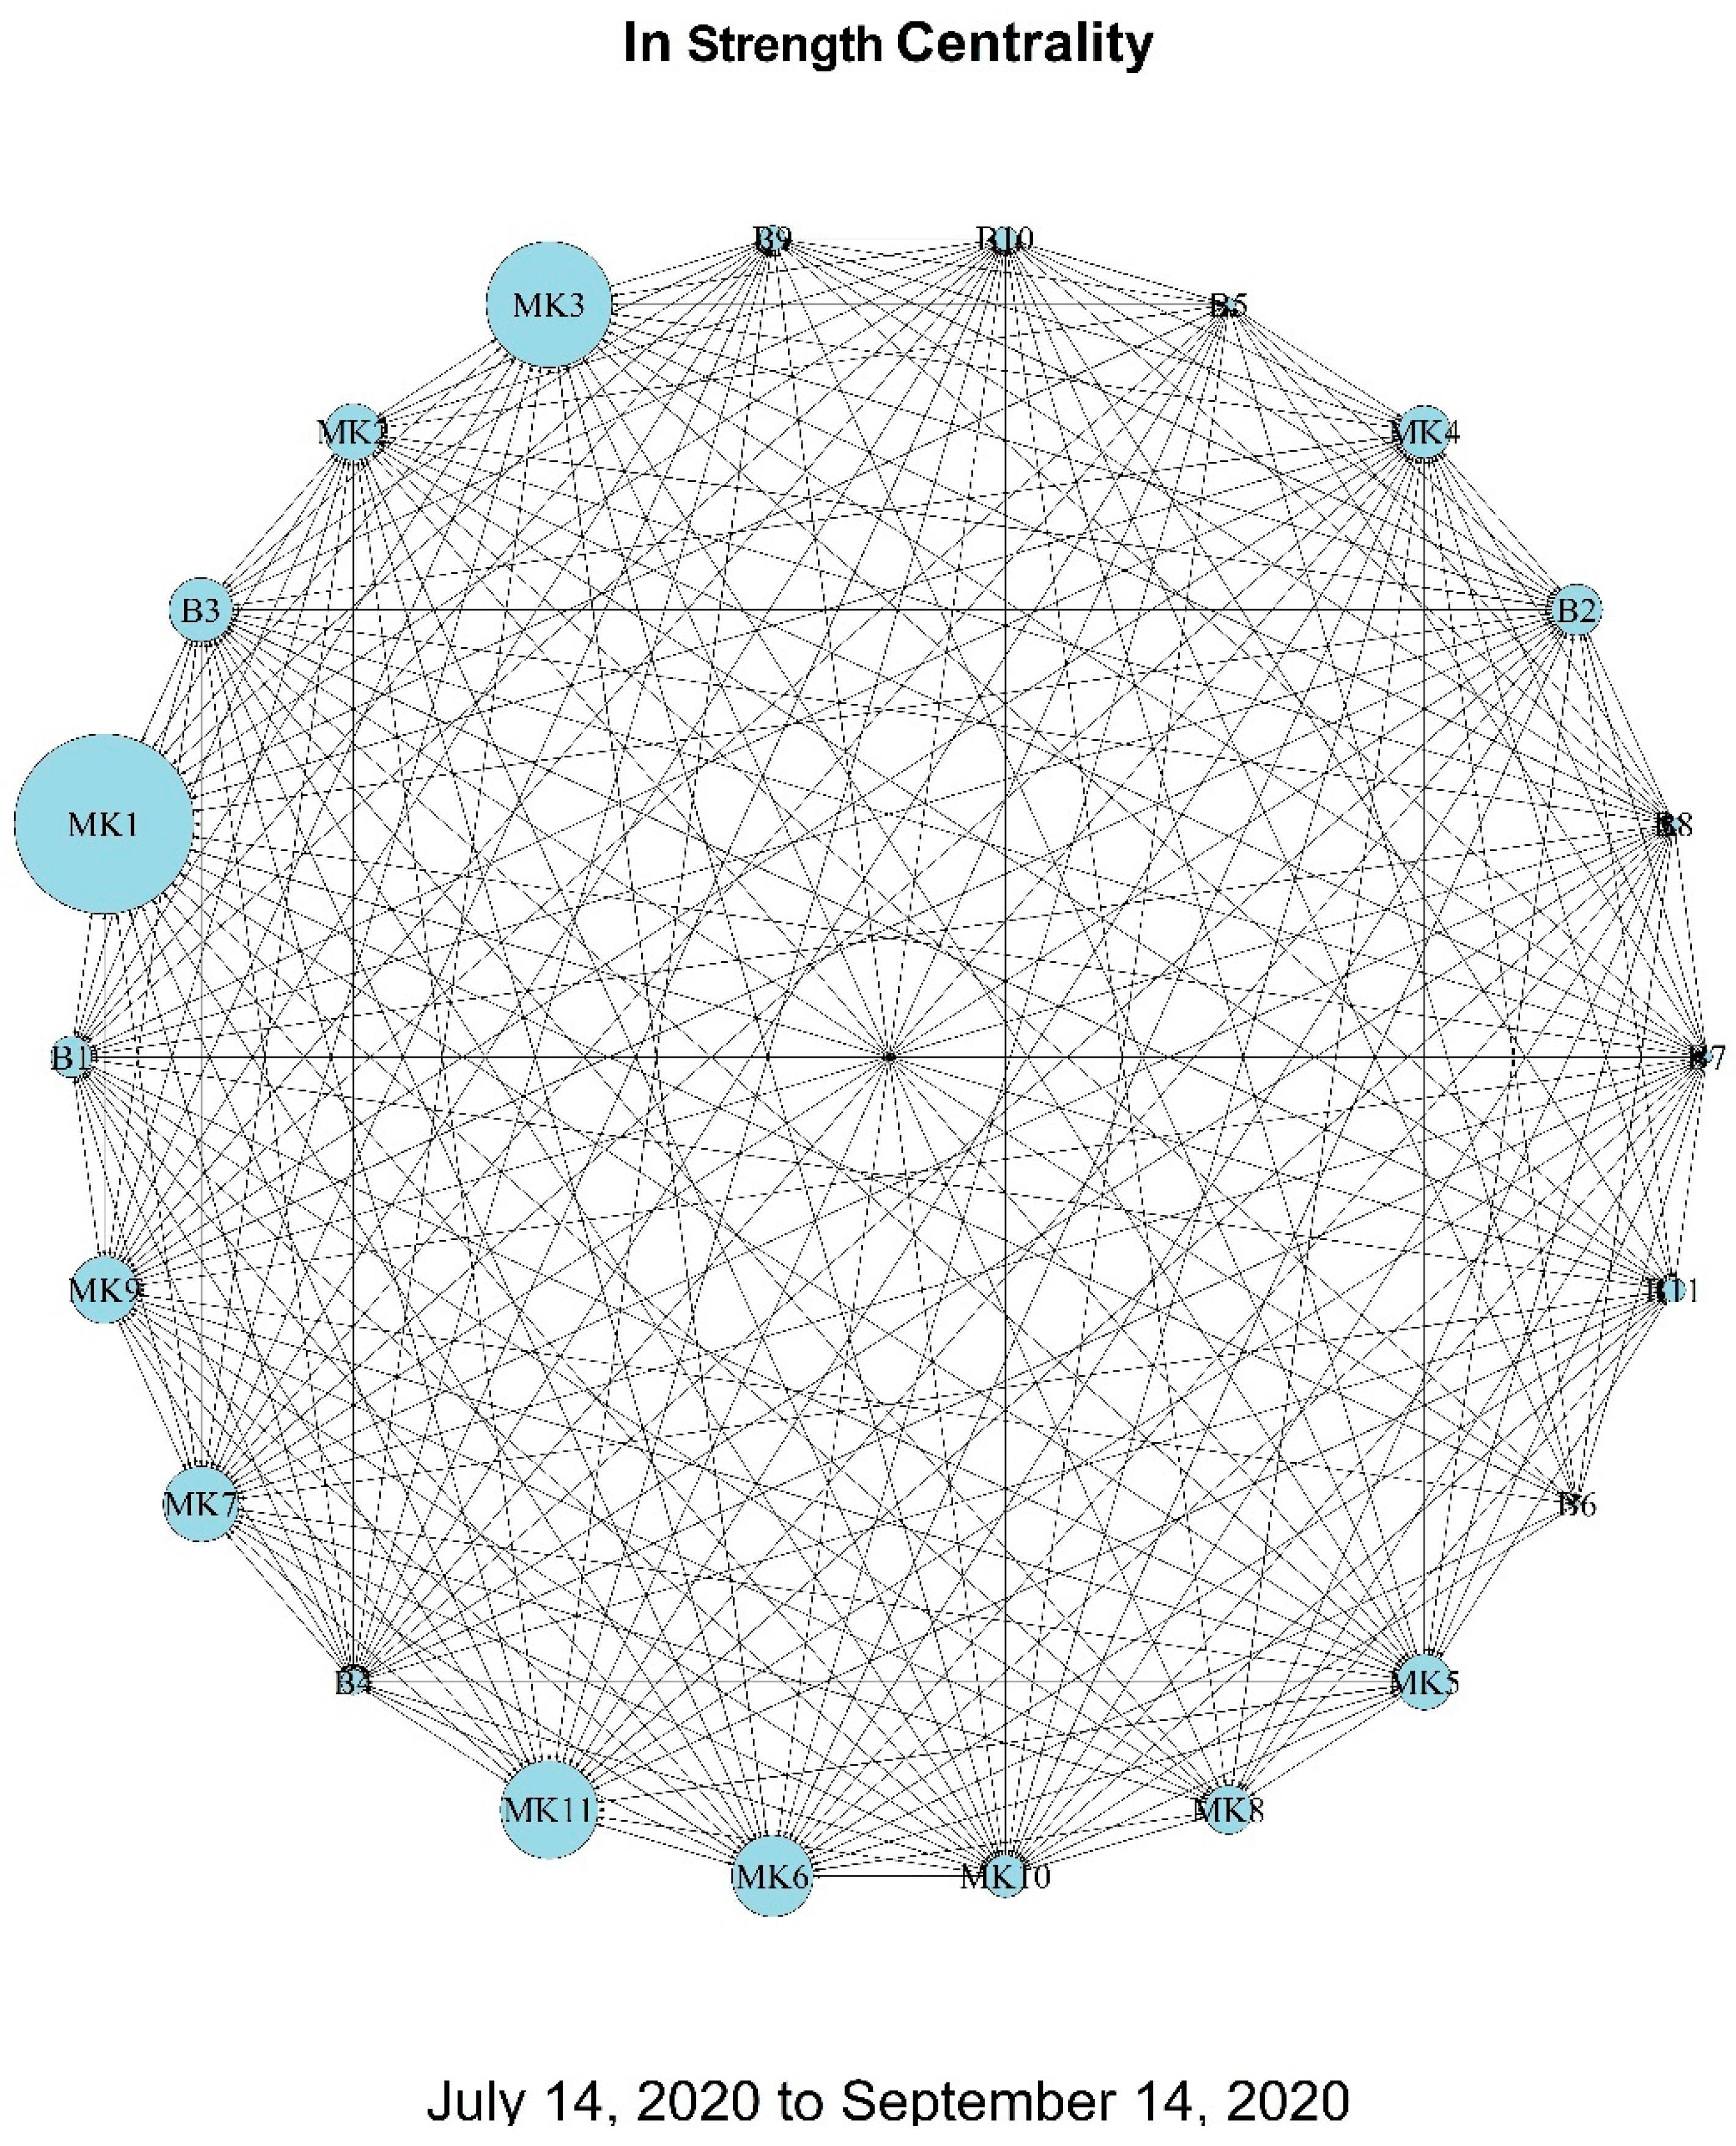
In-Strength Centrality: Reflects how often a politician is the target of interactions, potentially indicating their influence or prominence. MK3’s high in-strength centrality suggests they are a significant focus within the network.
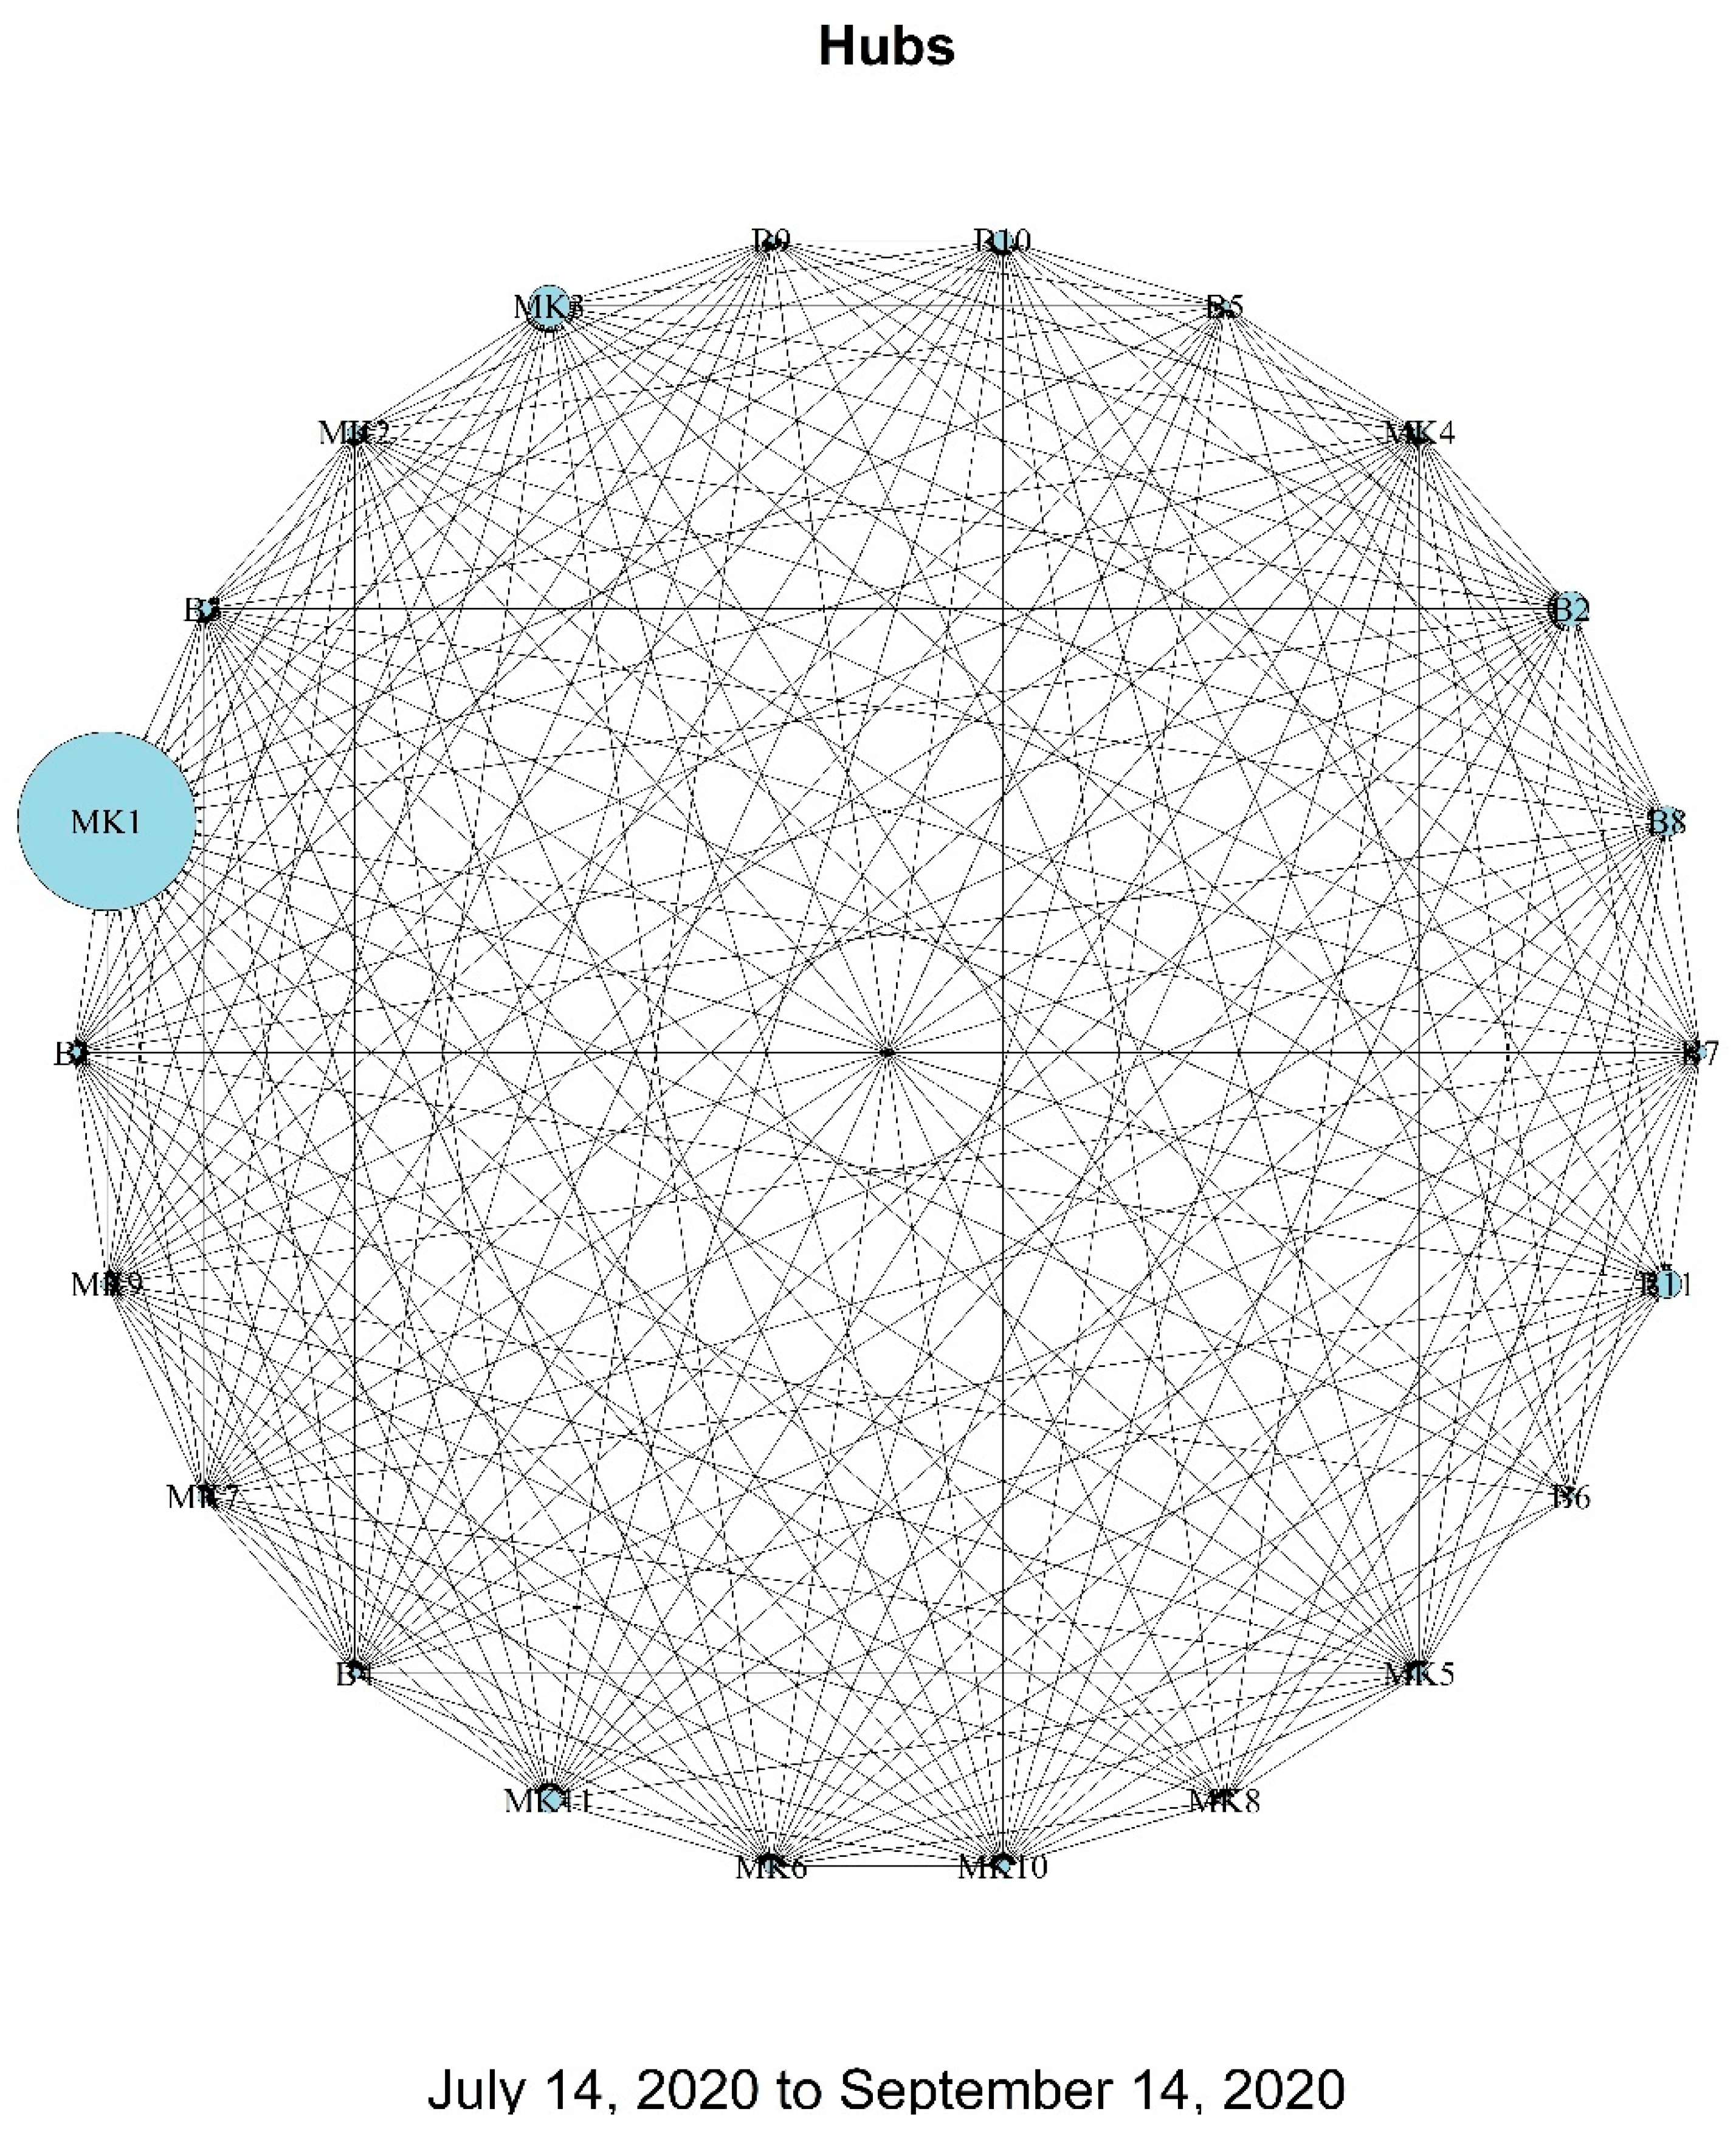
Hubs Centrality: Indicates how well a node serves as a conduit to others. MK1 and MK3 exhibit high hubs centrality, implying they are key connectors in the network, leading others to important information or nodes.
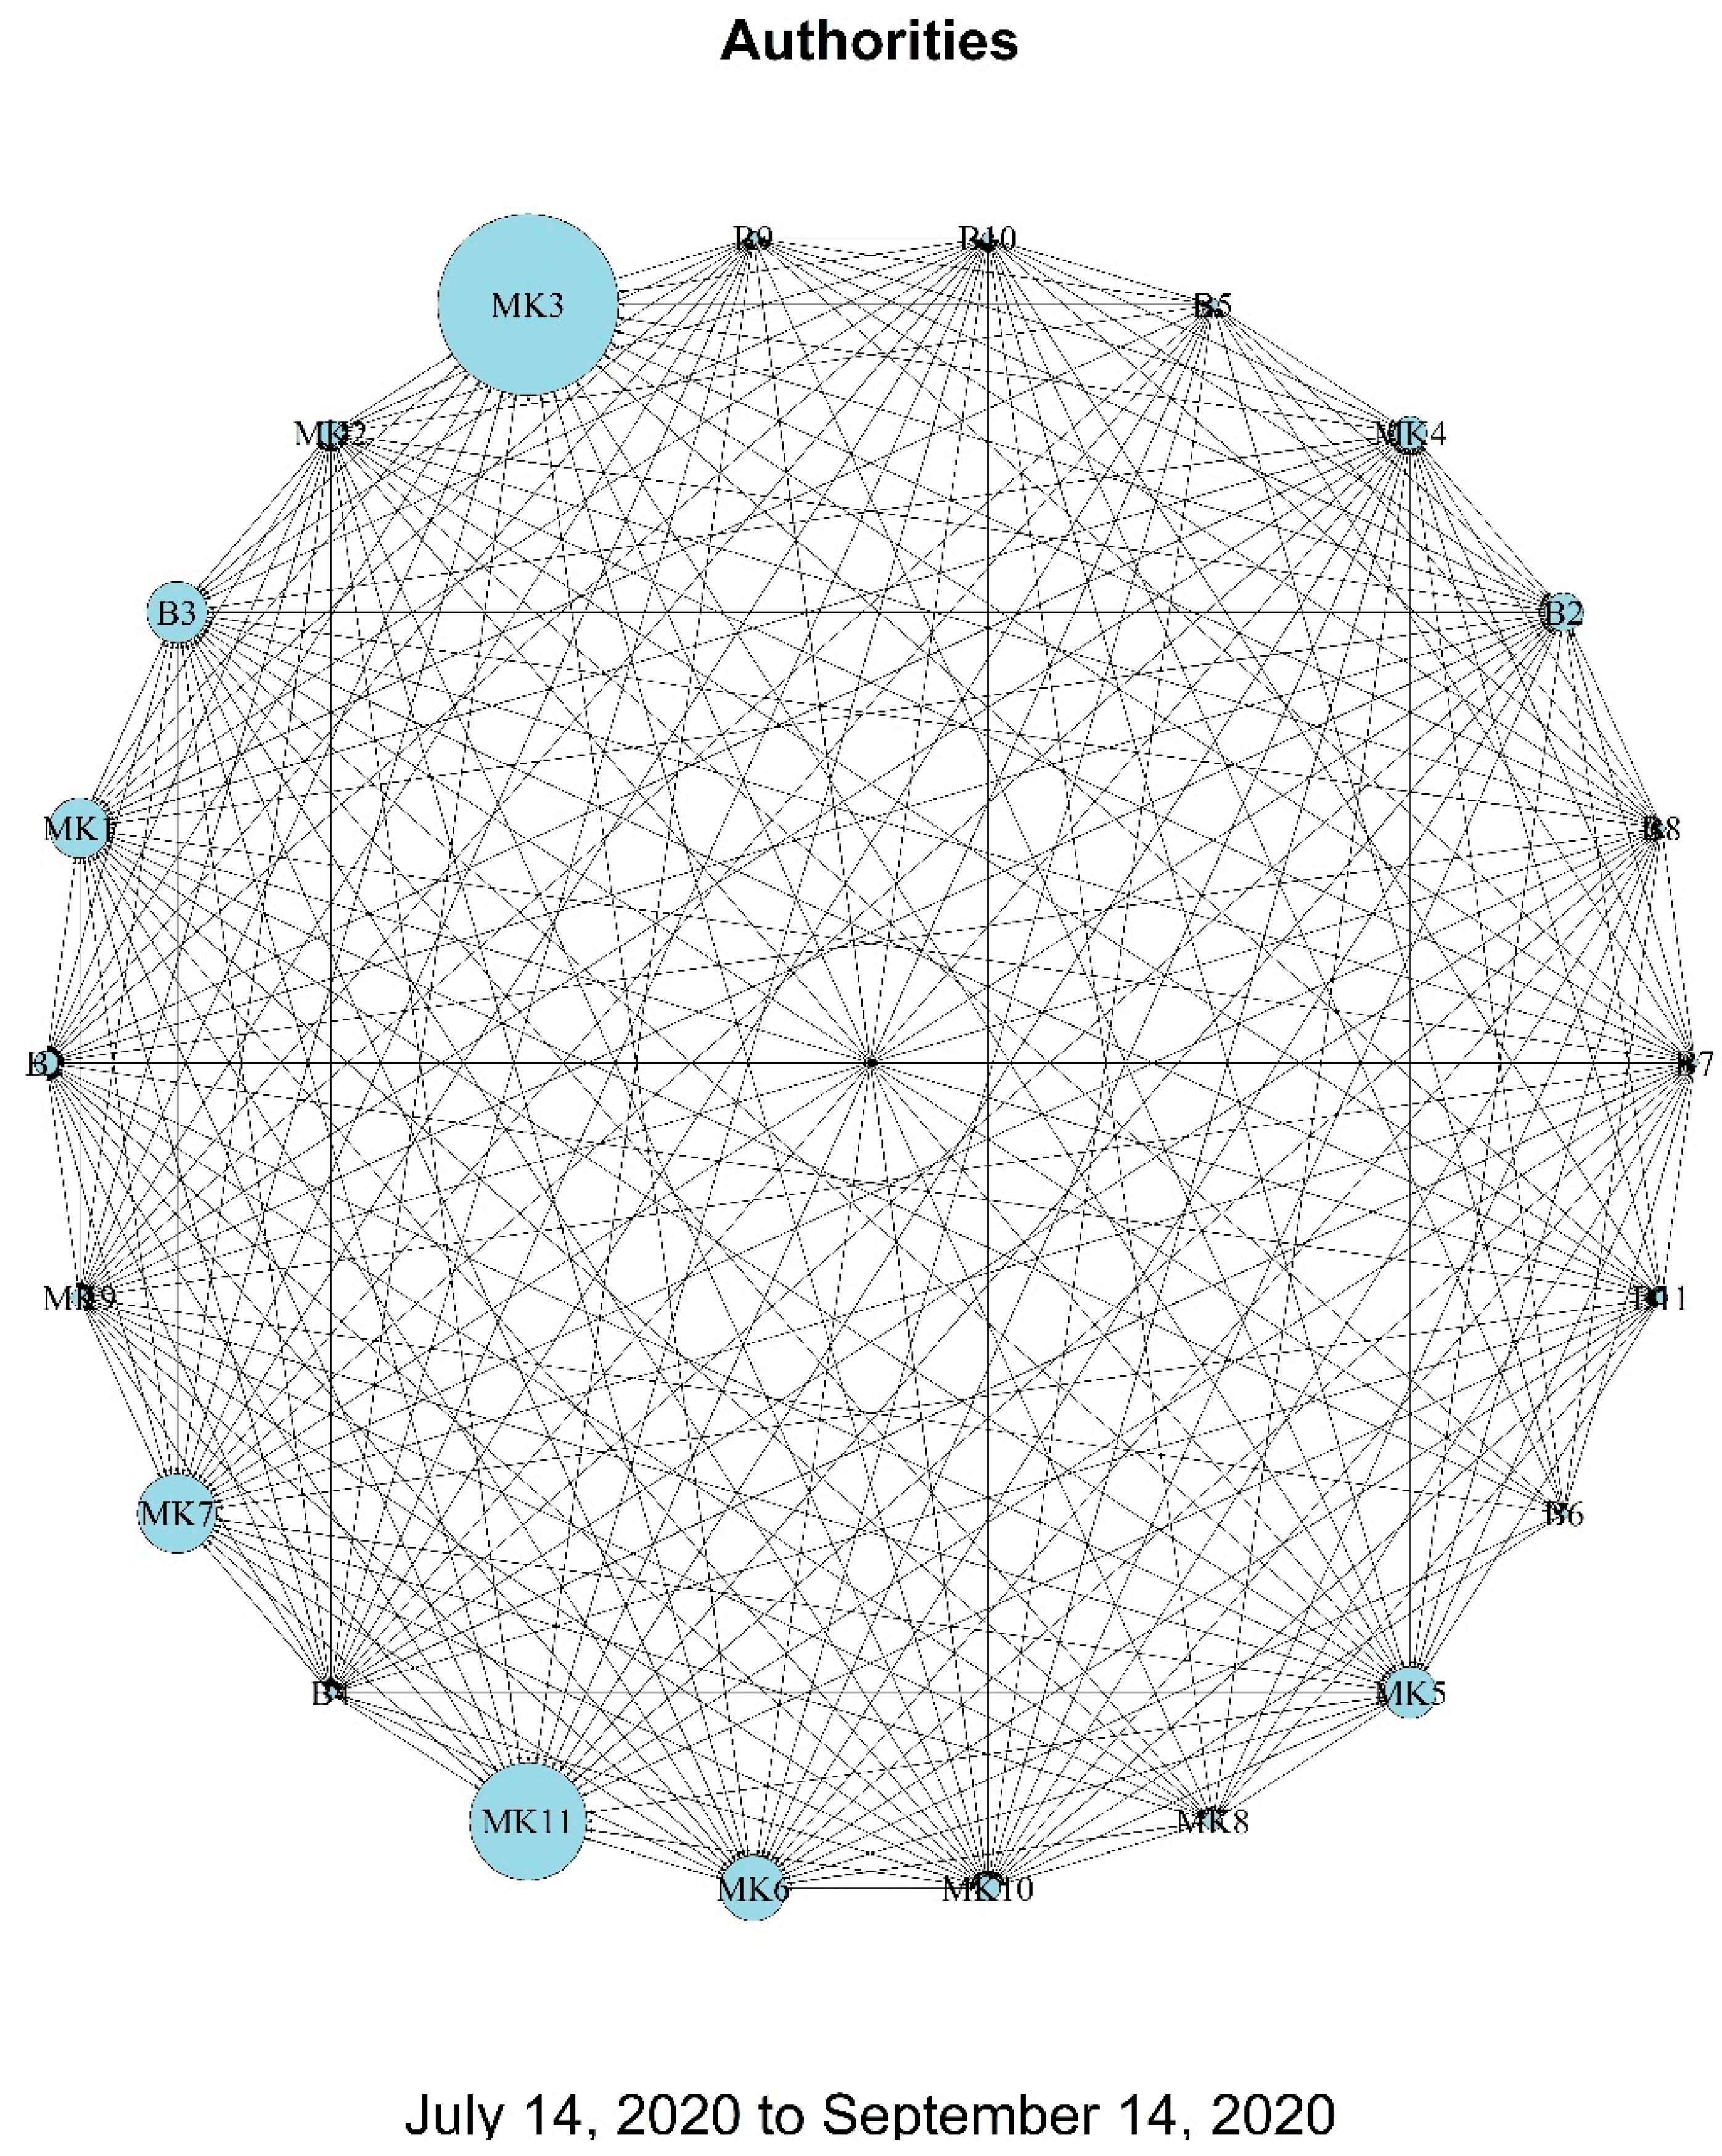
Authorities Centrality: Represents the perceived reliability or authority of a node. MK3, with the highest authorities centrality, is likely regarded as a credible source within the network.
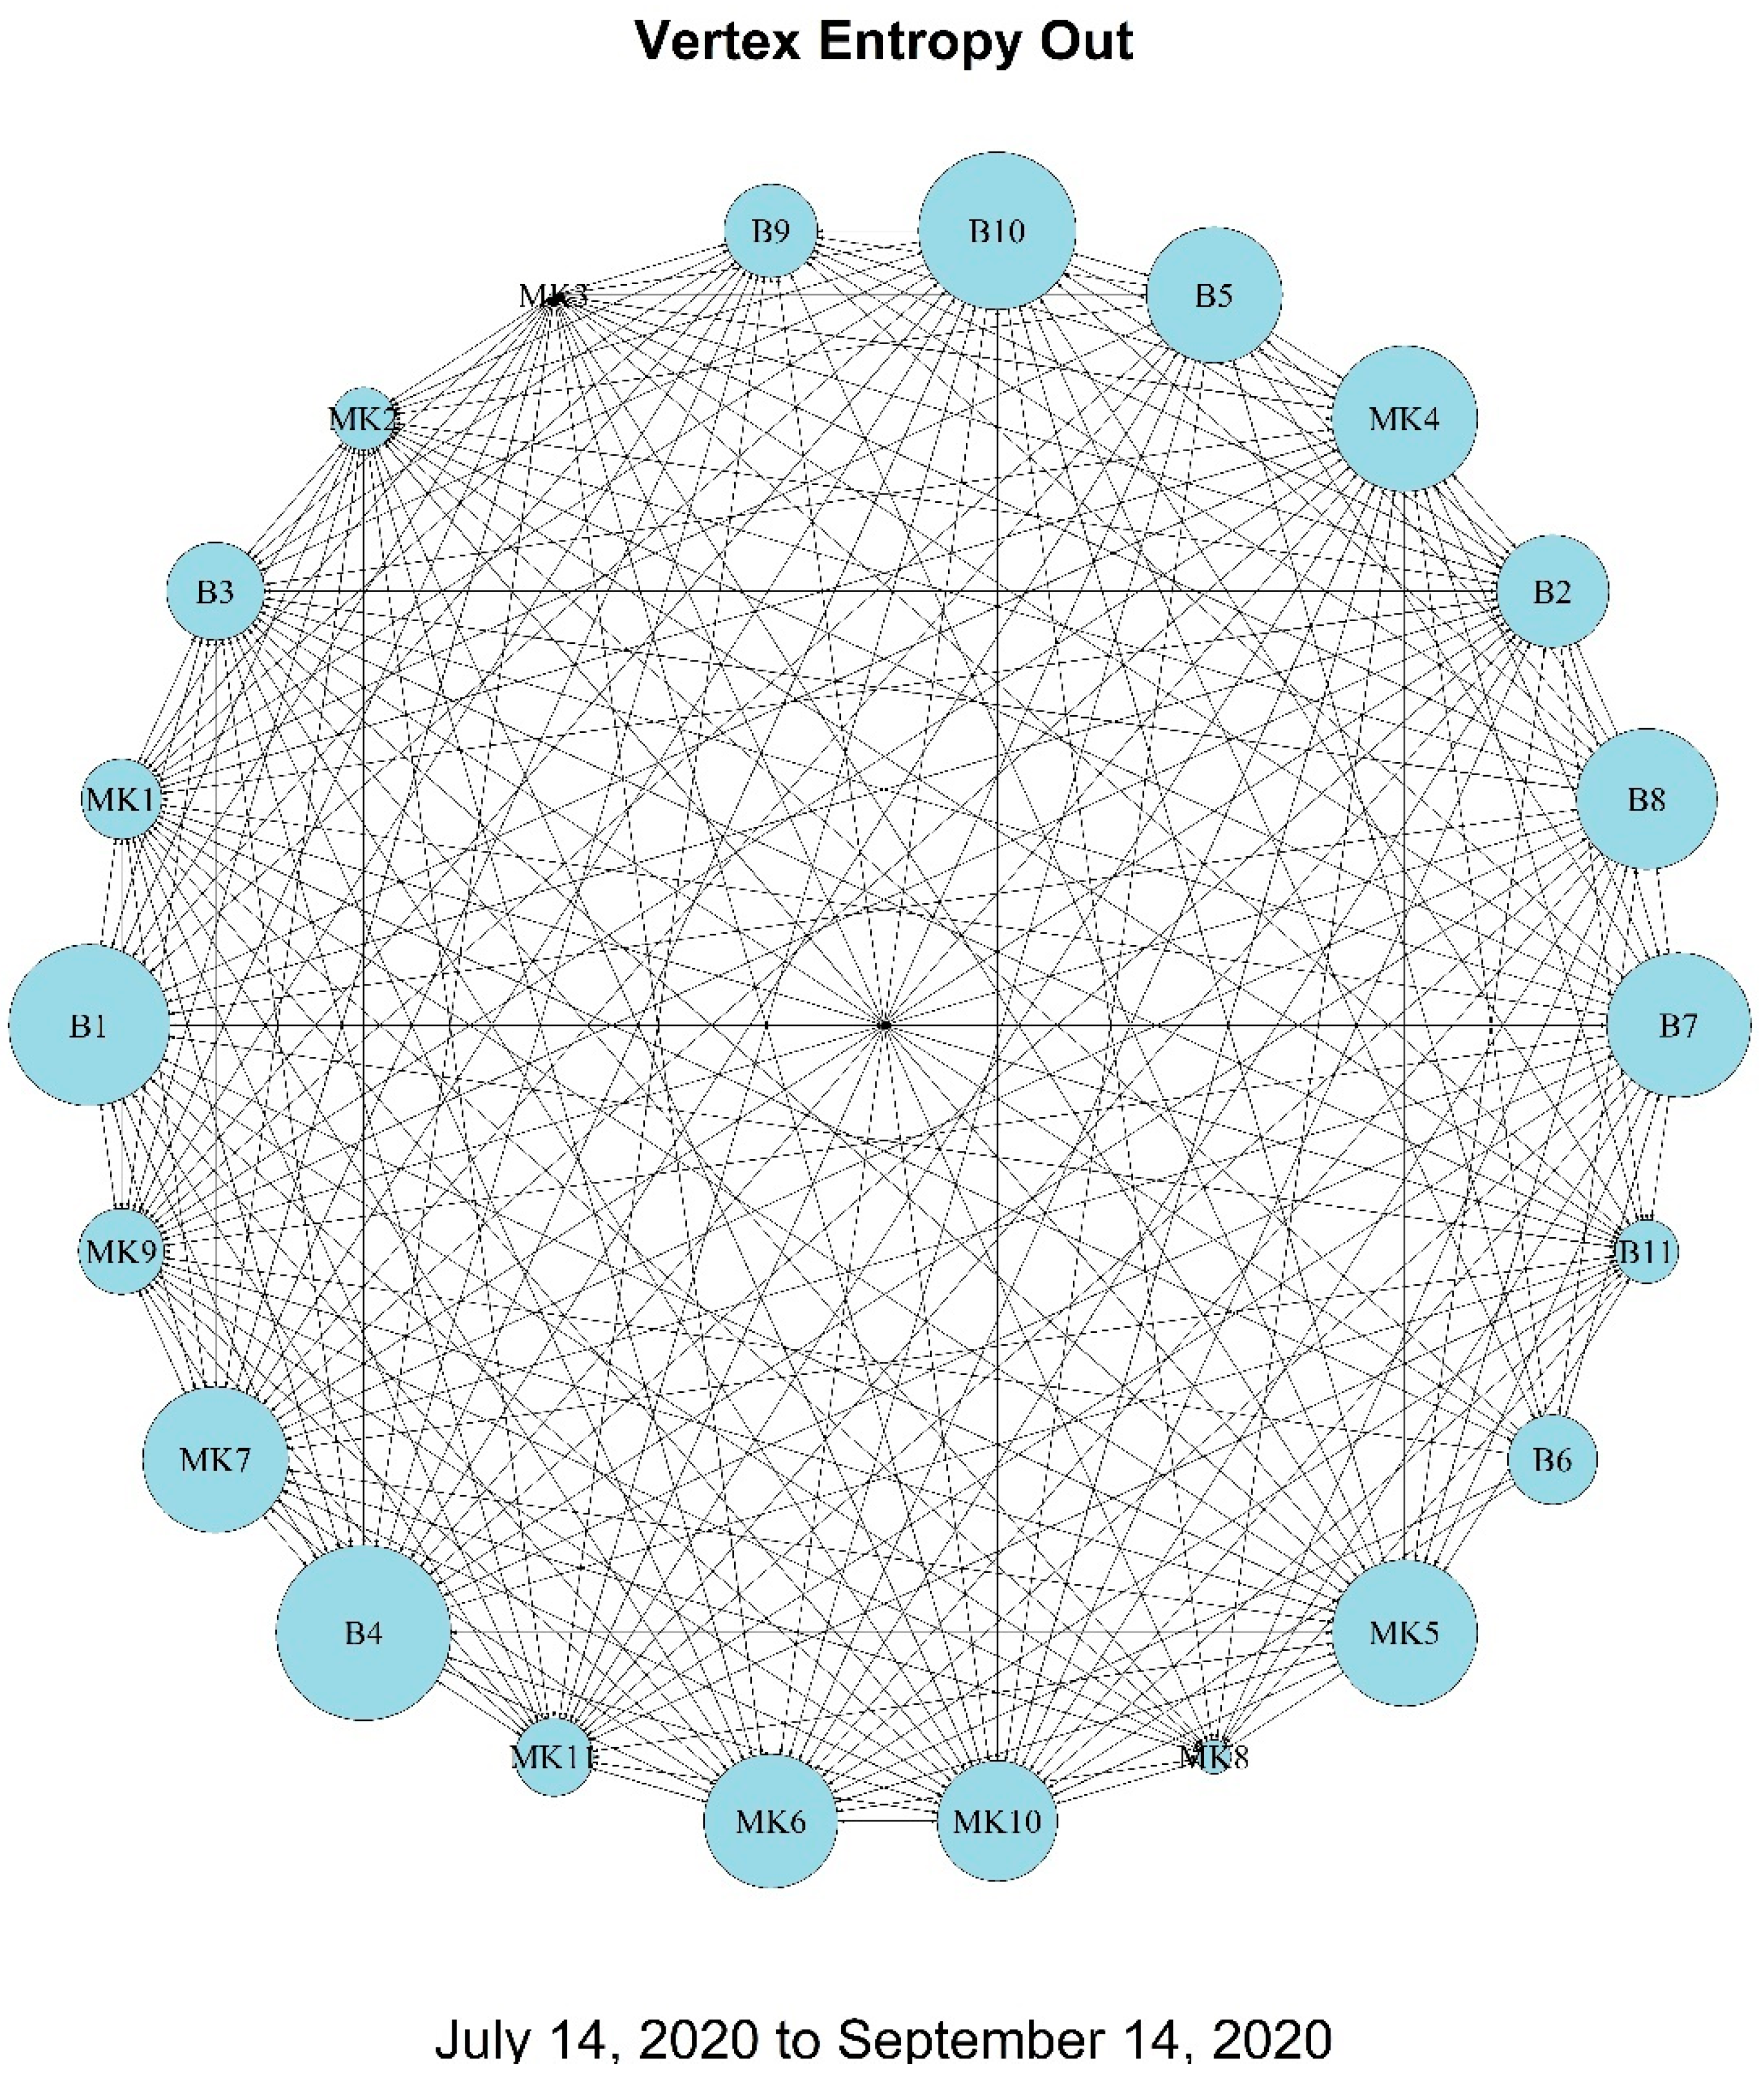
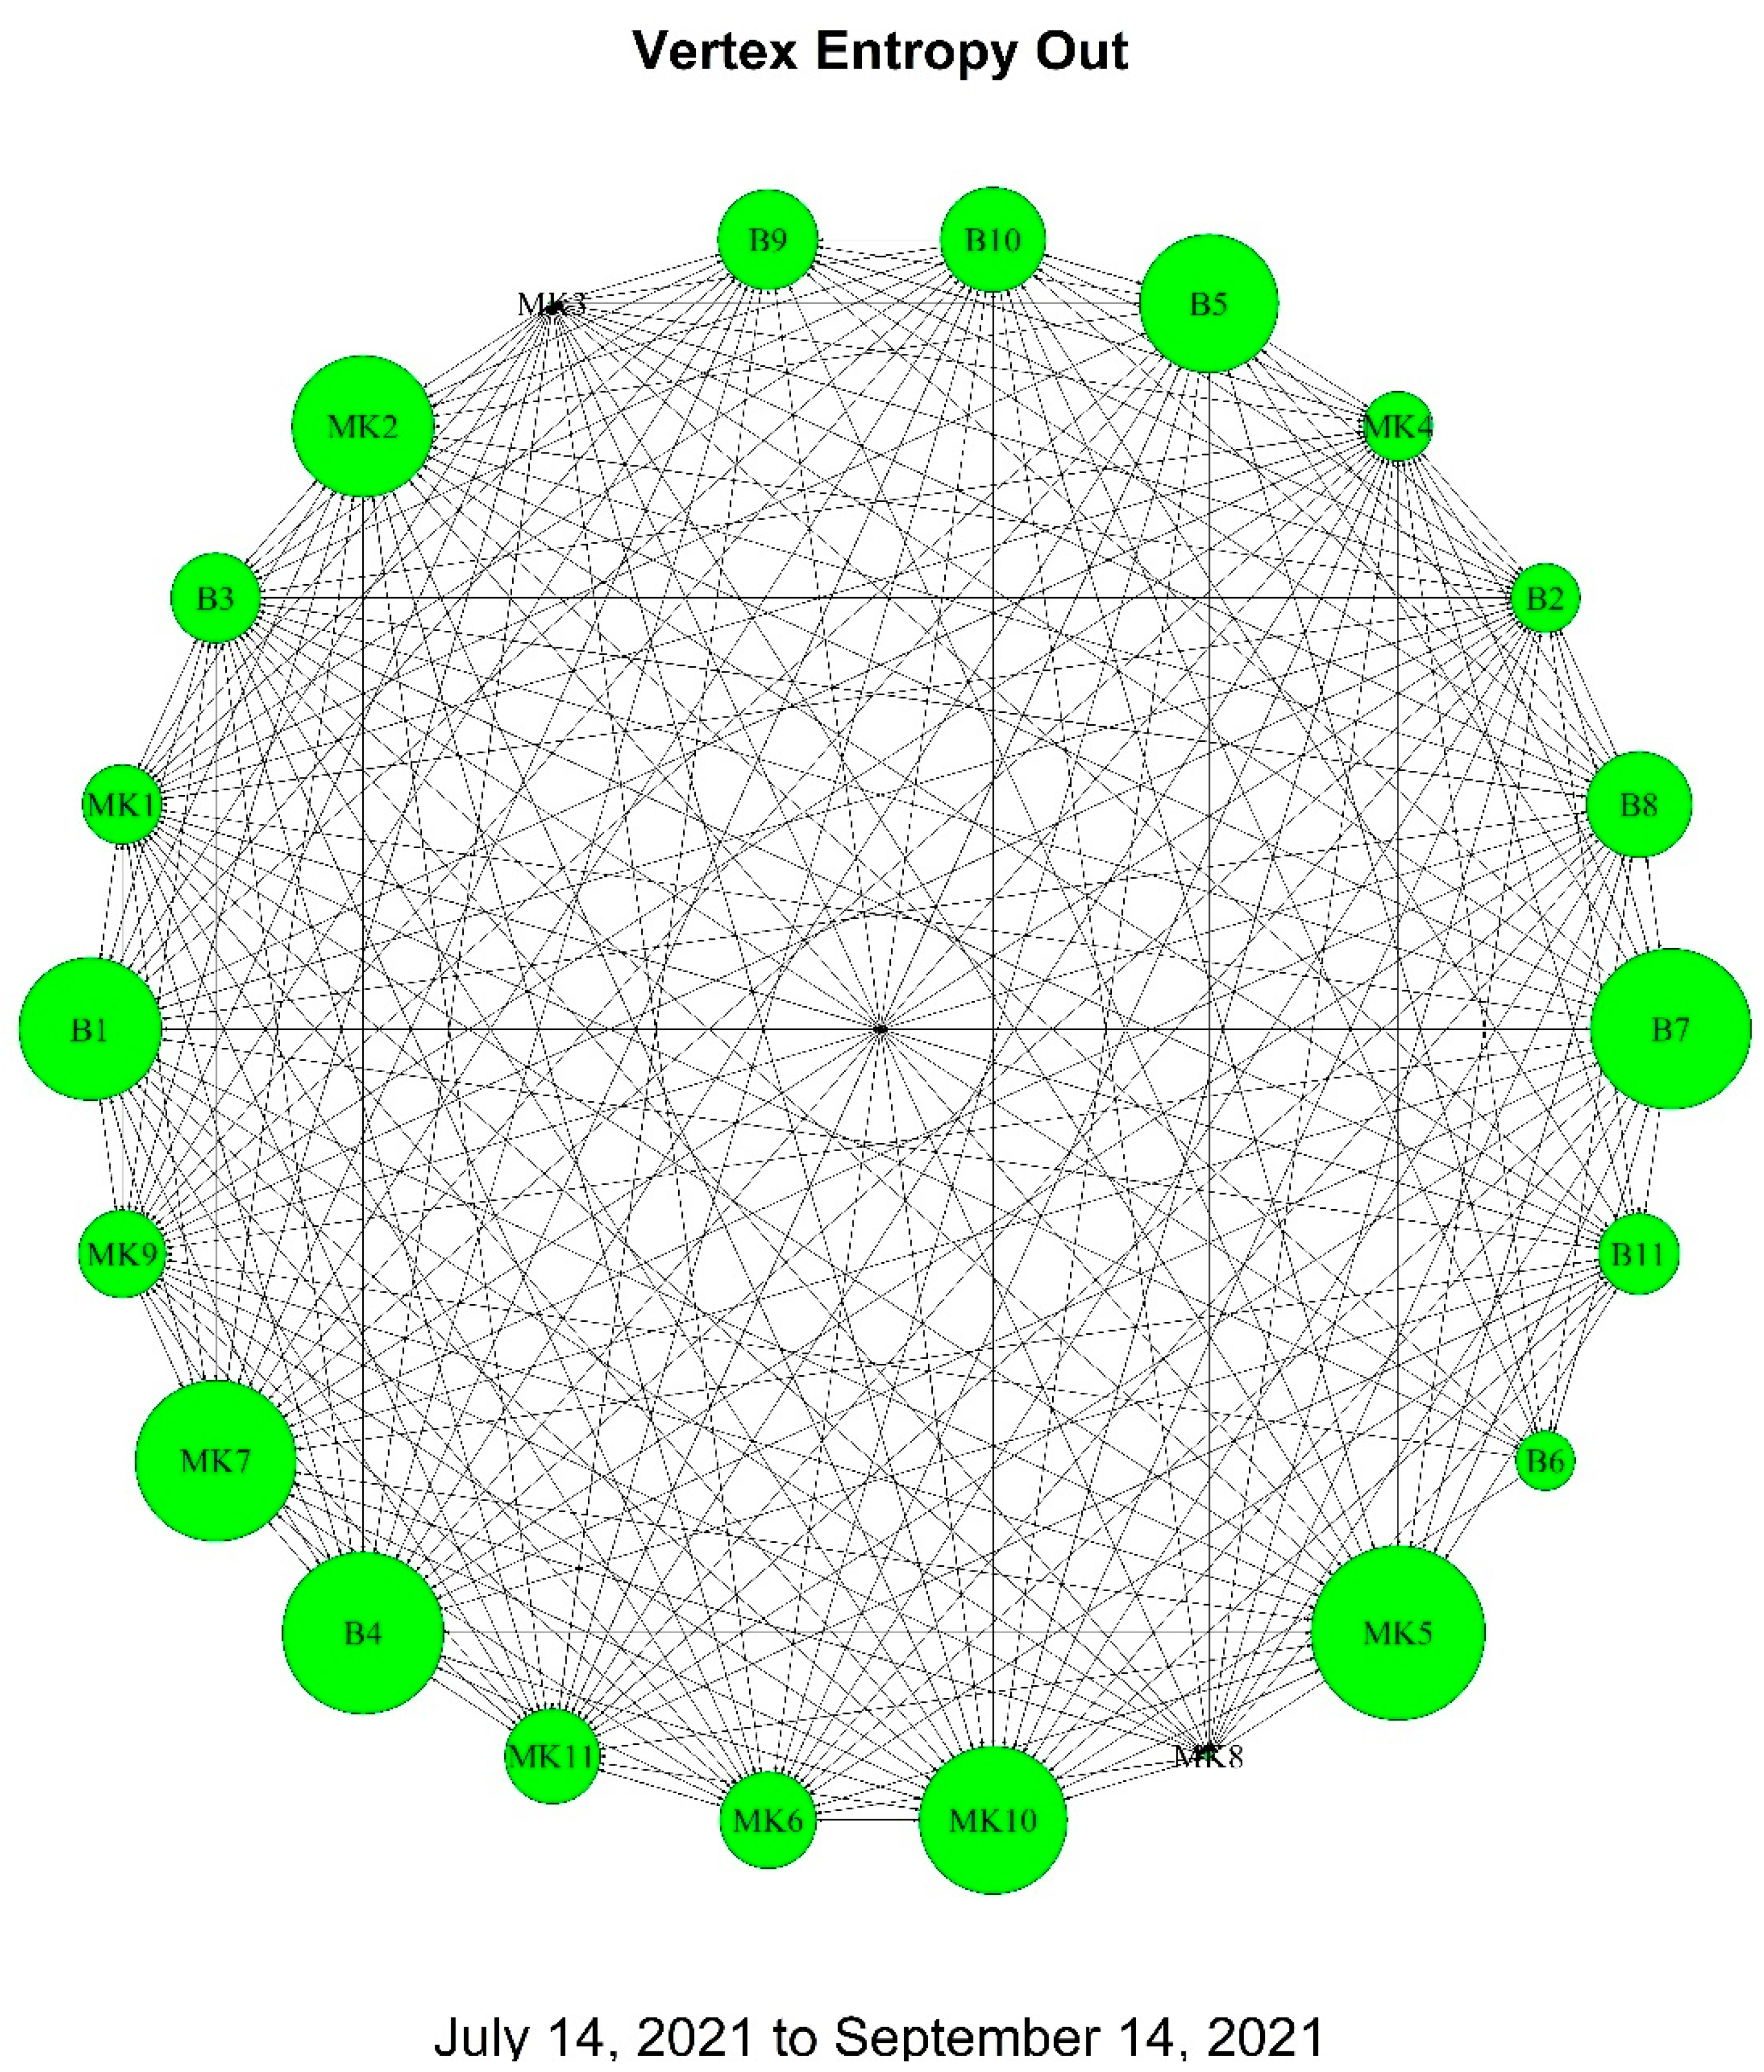
Out-Vertex Entropy: Assesses the diversity of a politician’s outgoing connections. Lower scores, like that of MK3, indicate more focused communication, whereas higher scores, such as B10’s, suggest a broader range of communication targets.
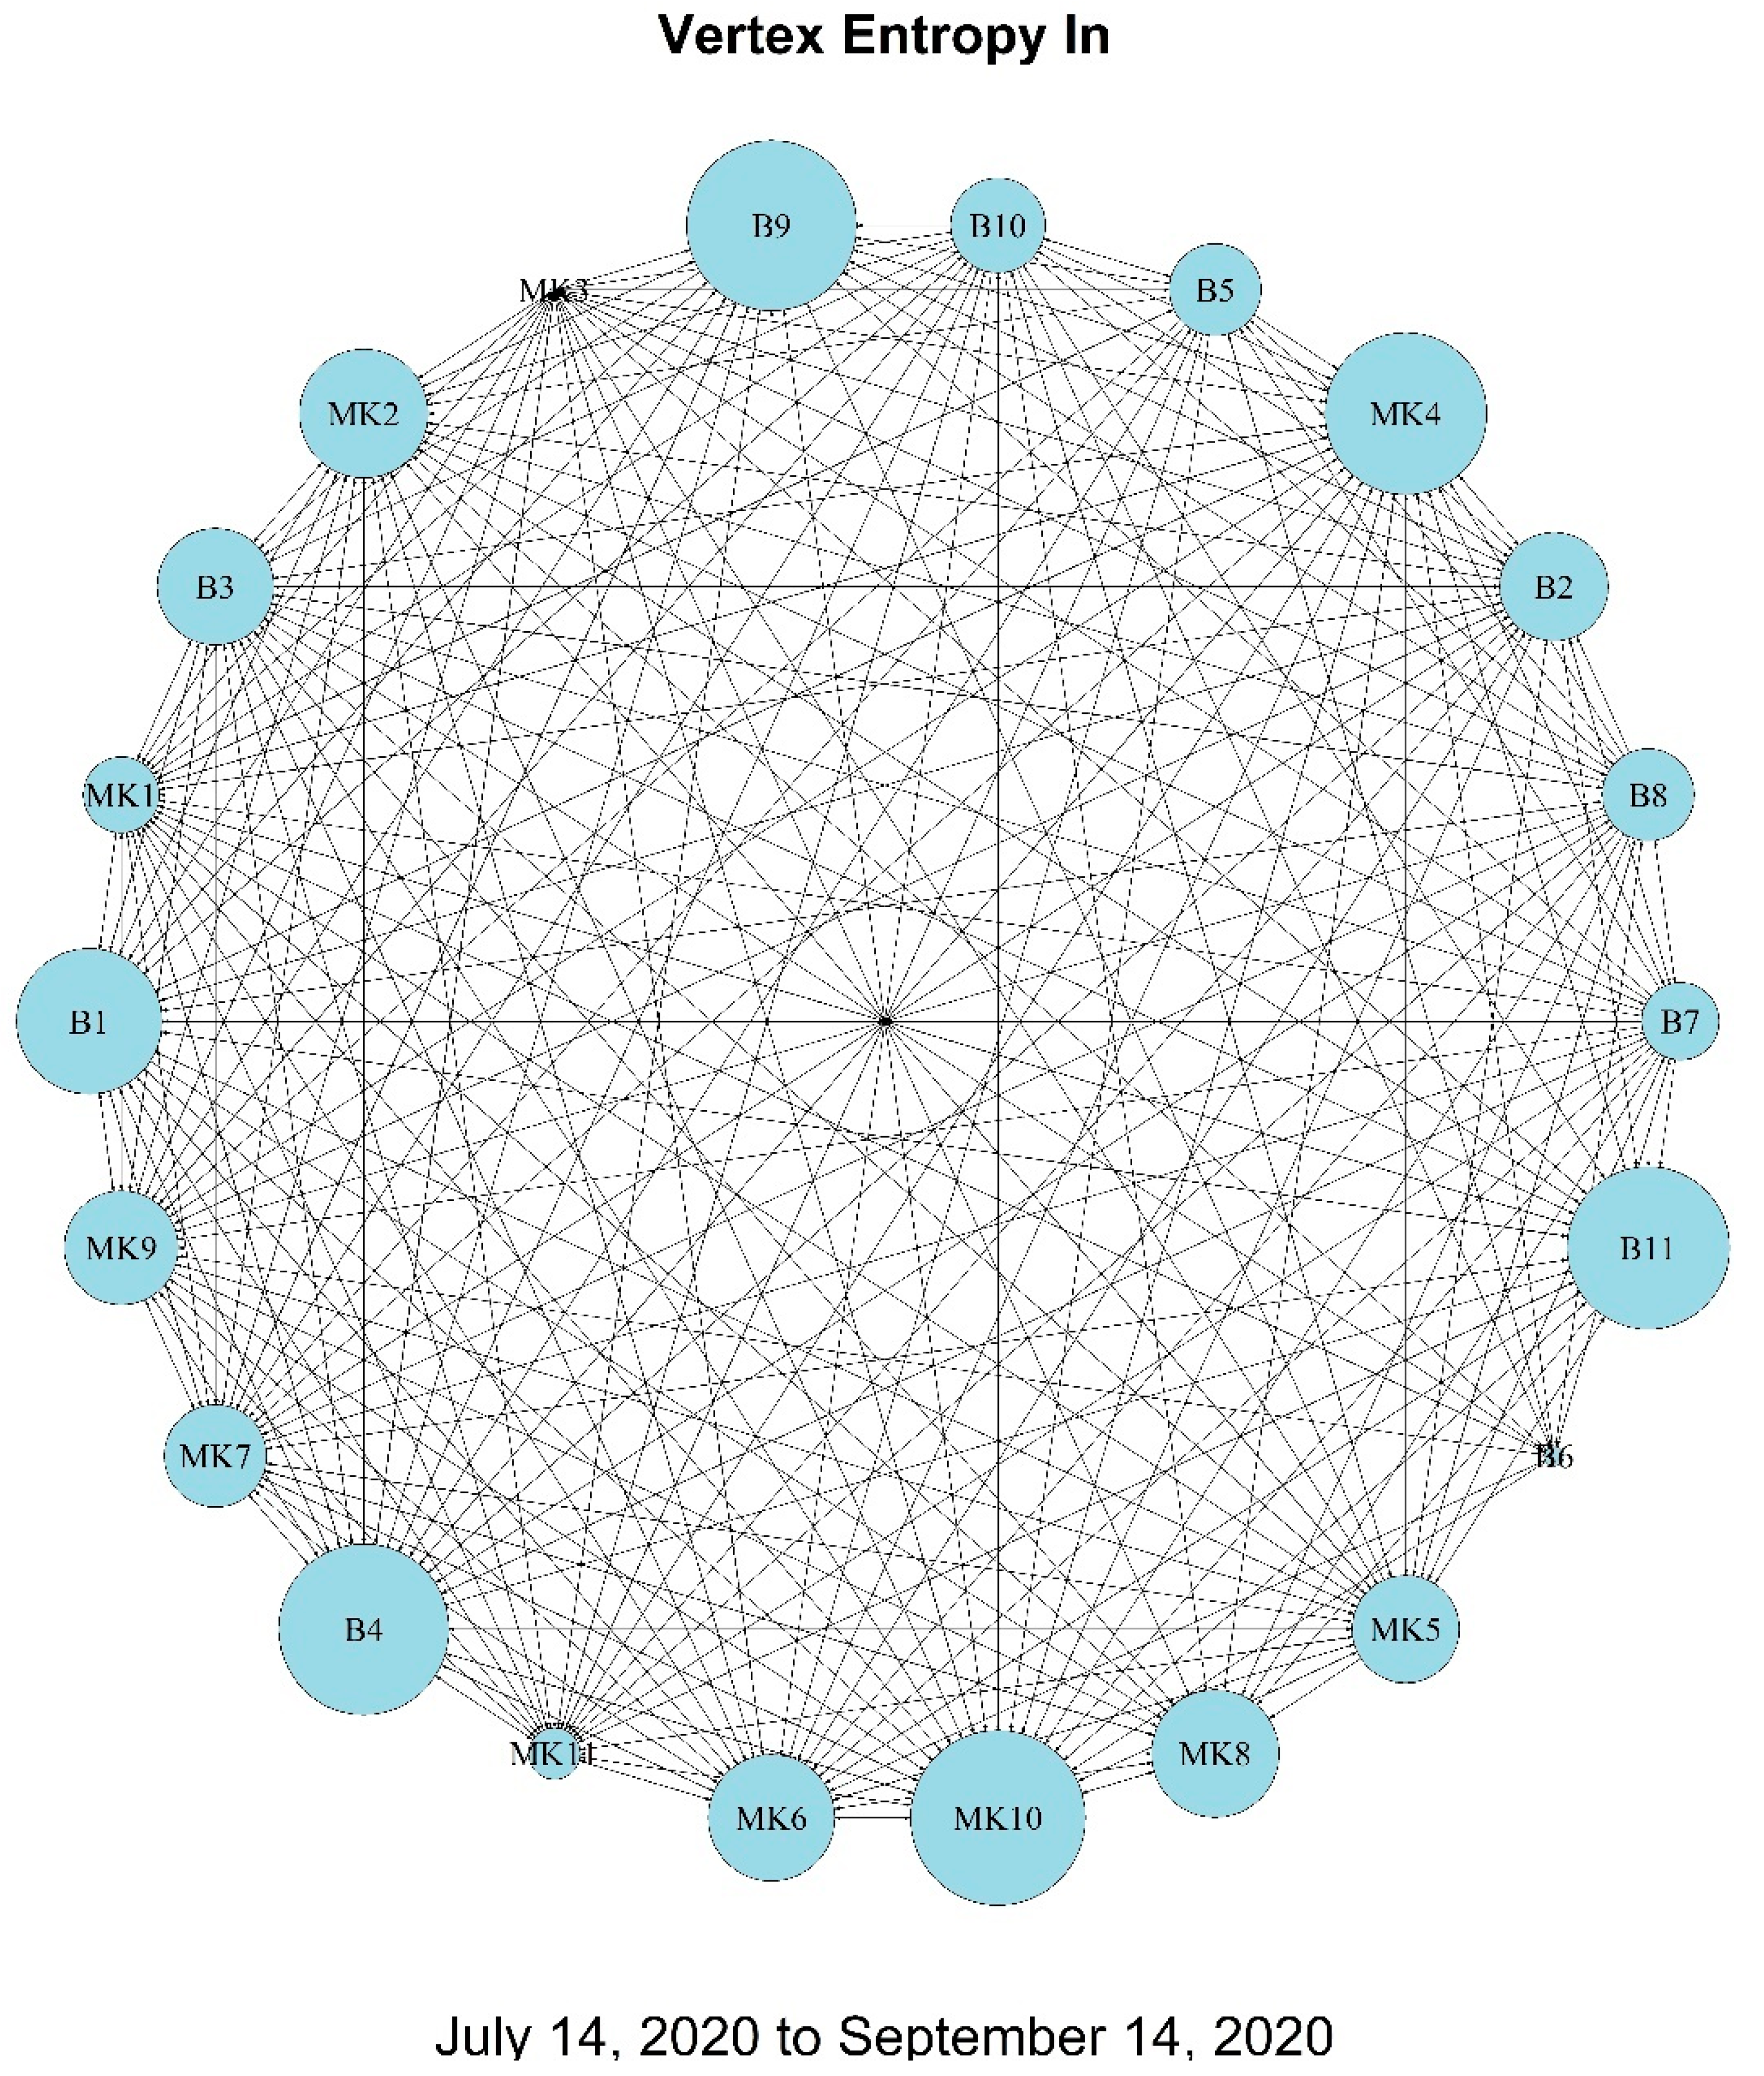
In-Vertex Entropy: Measures the diversity of incoming connections, reflecting varied sources of influence. Politicians like MK4 and B11, with high in-vertex entropy, likely receive input from a diverse array of connections.
The data illustrate a complex web of interactions, with certain individuals like MK1 and MK3 standing out due to their active engagement and centrality in the network. These metrics collectively provide insights into the political communication strategies and influence dynamics within the governing coalition during this critical period.
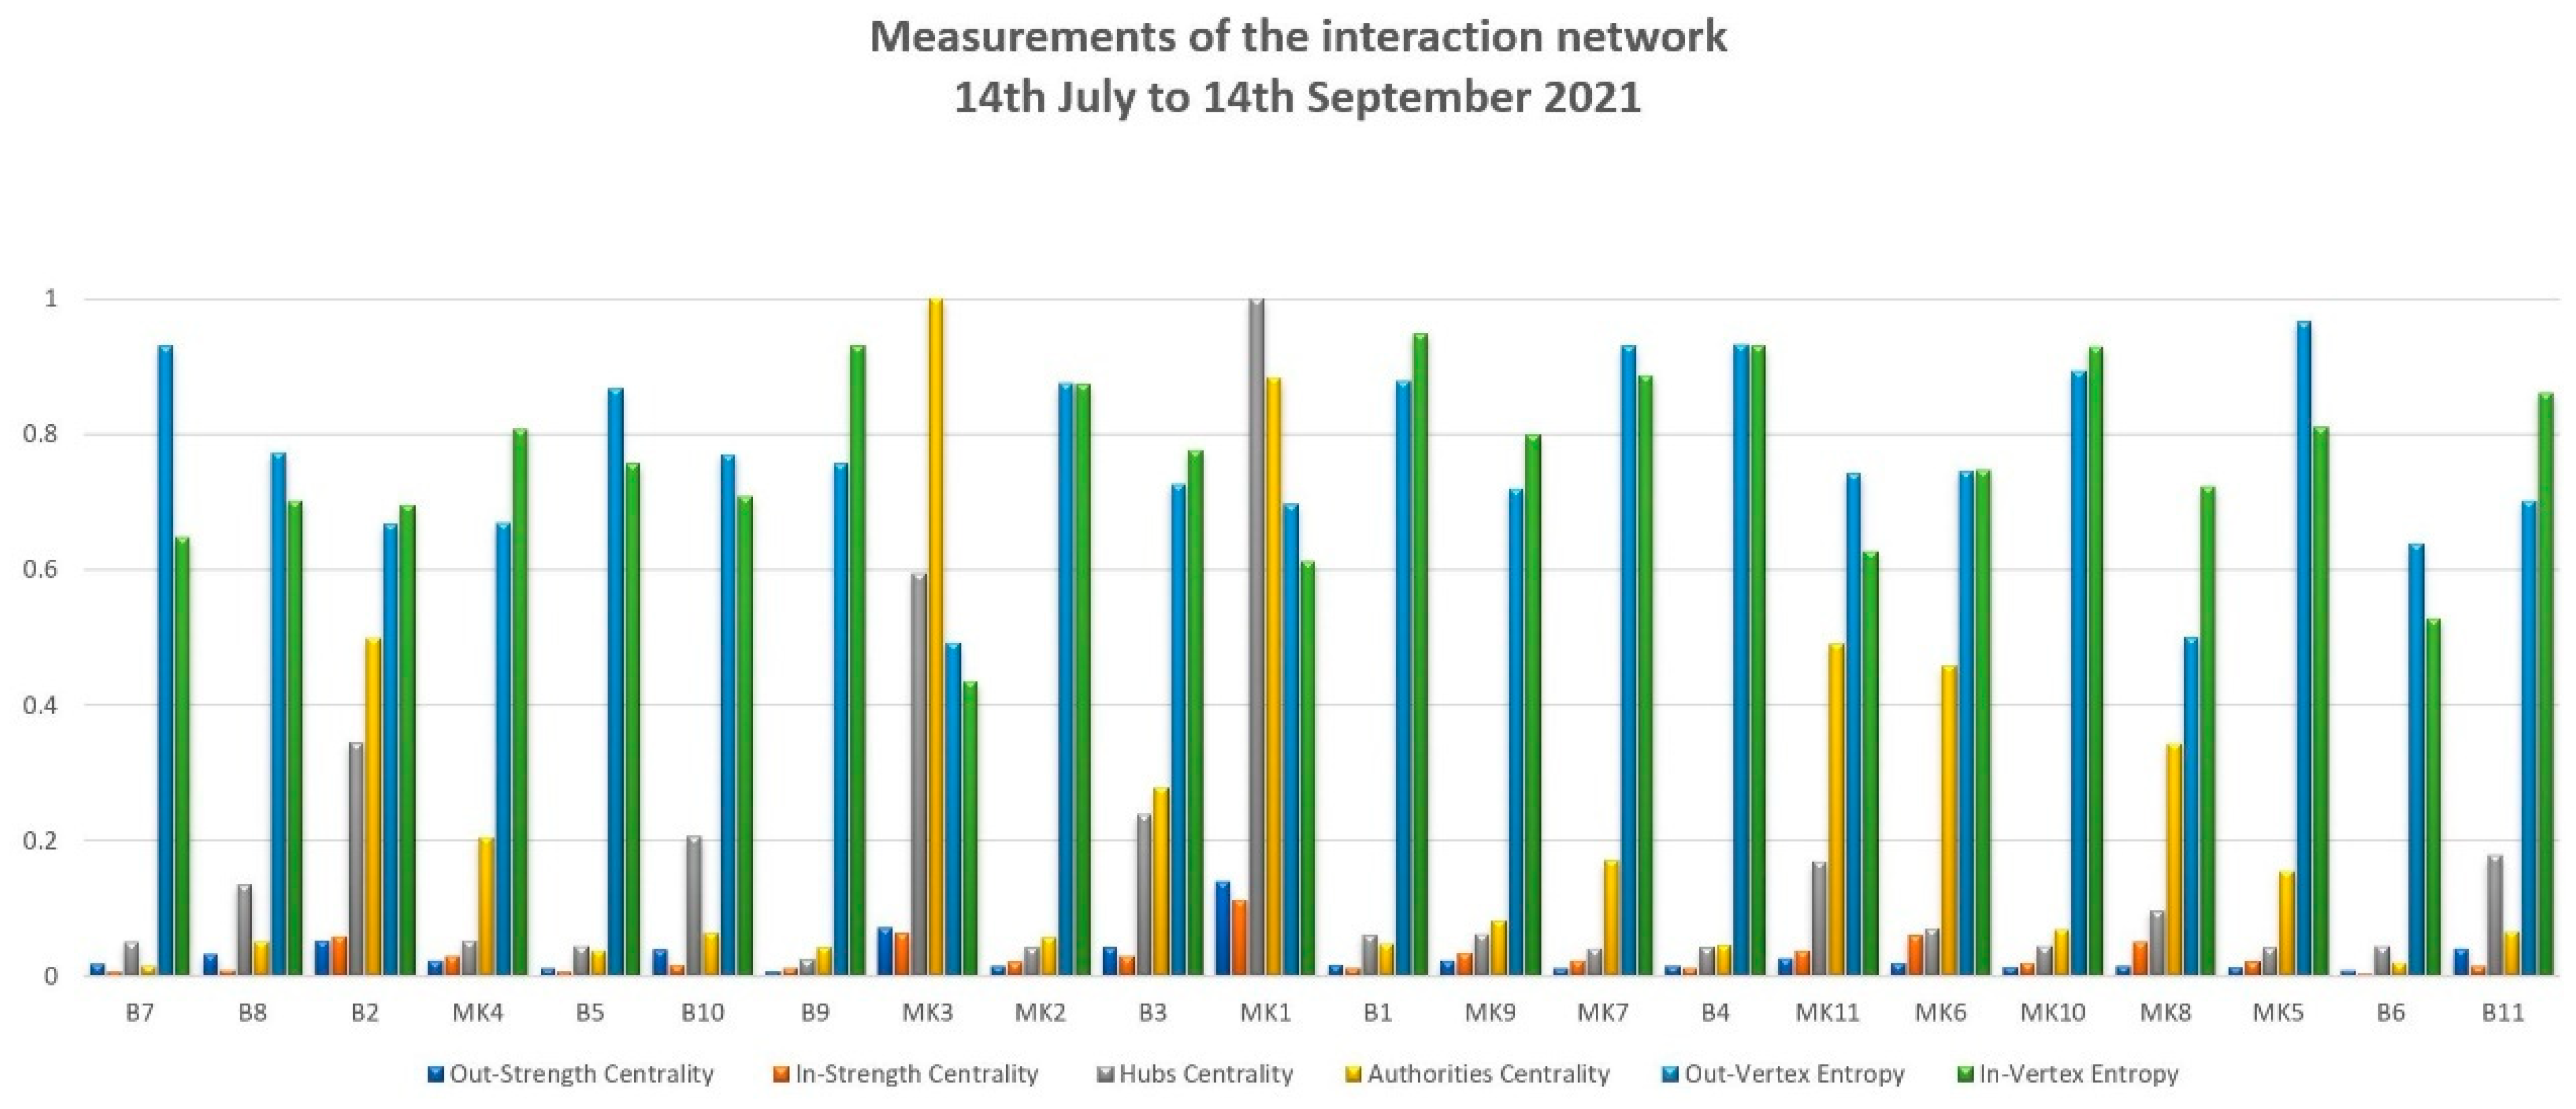
Table 2 and
Figure 4 provide an analysis of the interaction network on
among 22 political figures of the governing coalition in Greece, covering the period from 14 July to 14 September 2021. This analysis is key for understanding the evolution of political communication within the same group over a year.
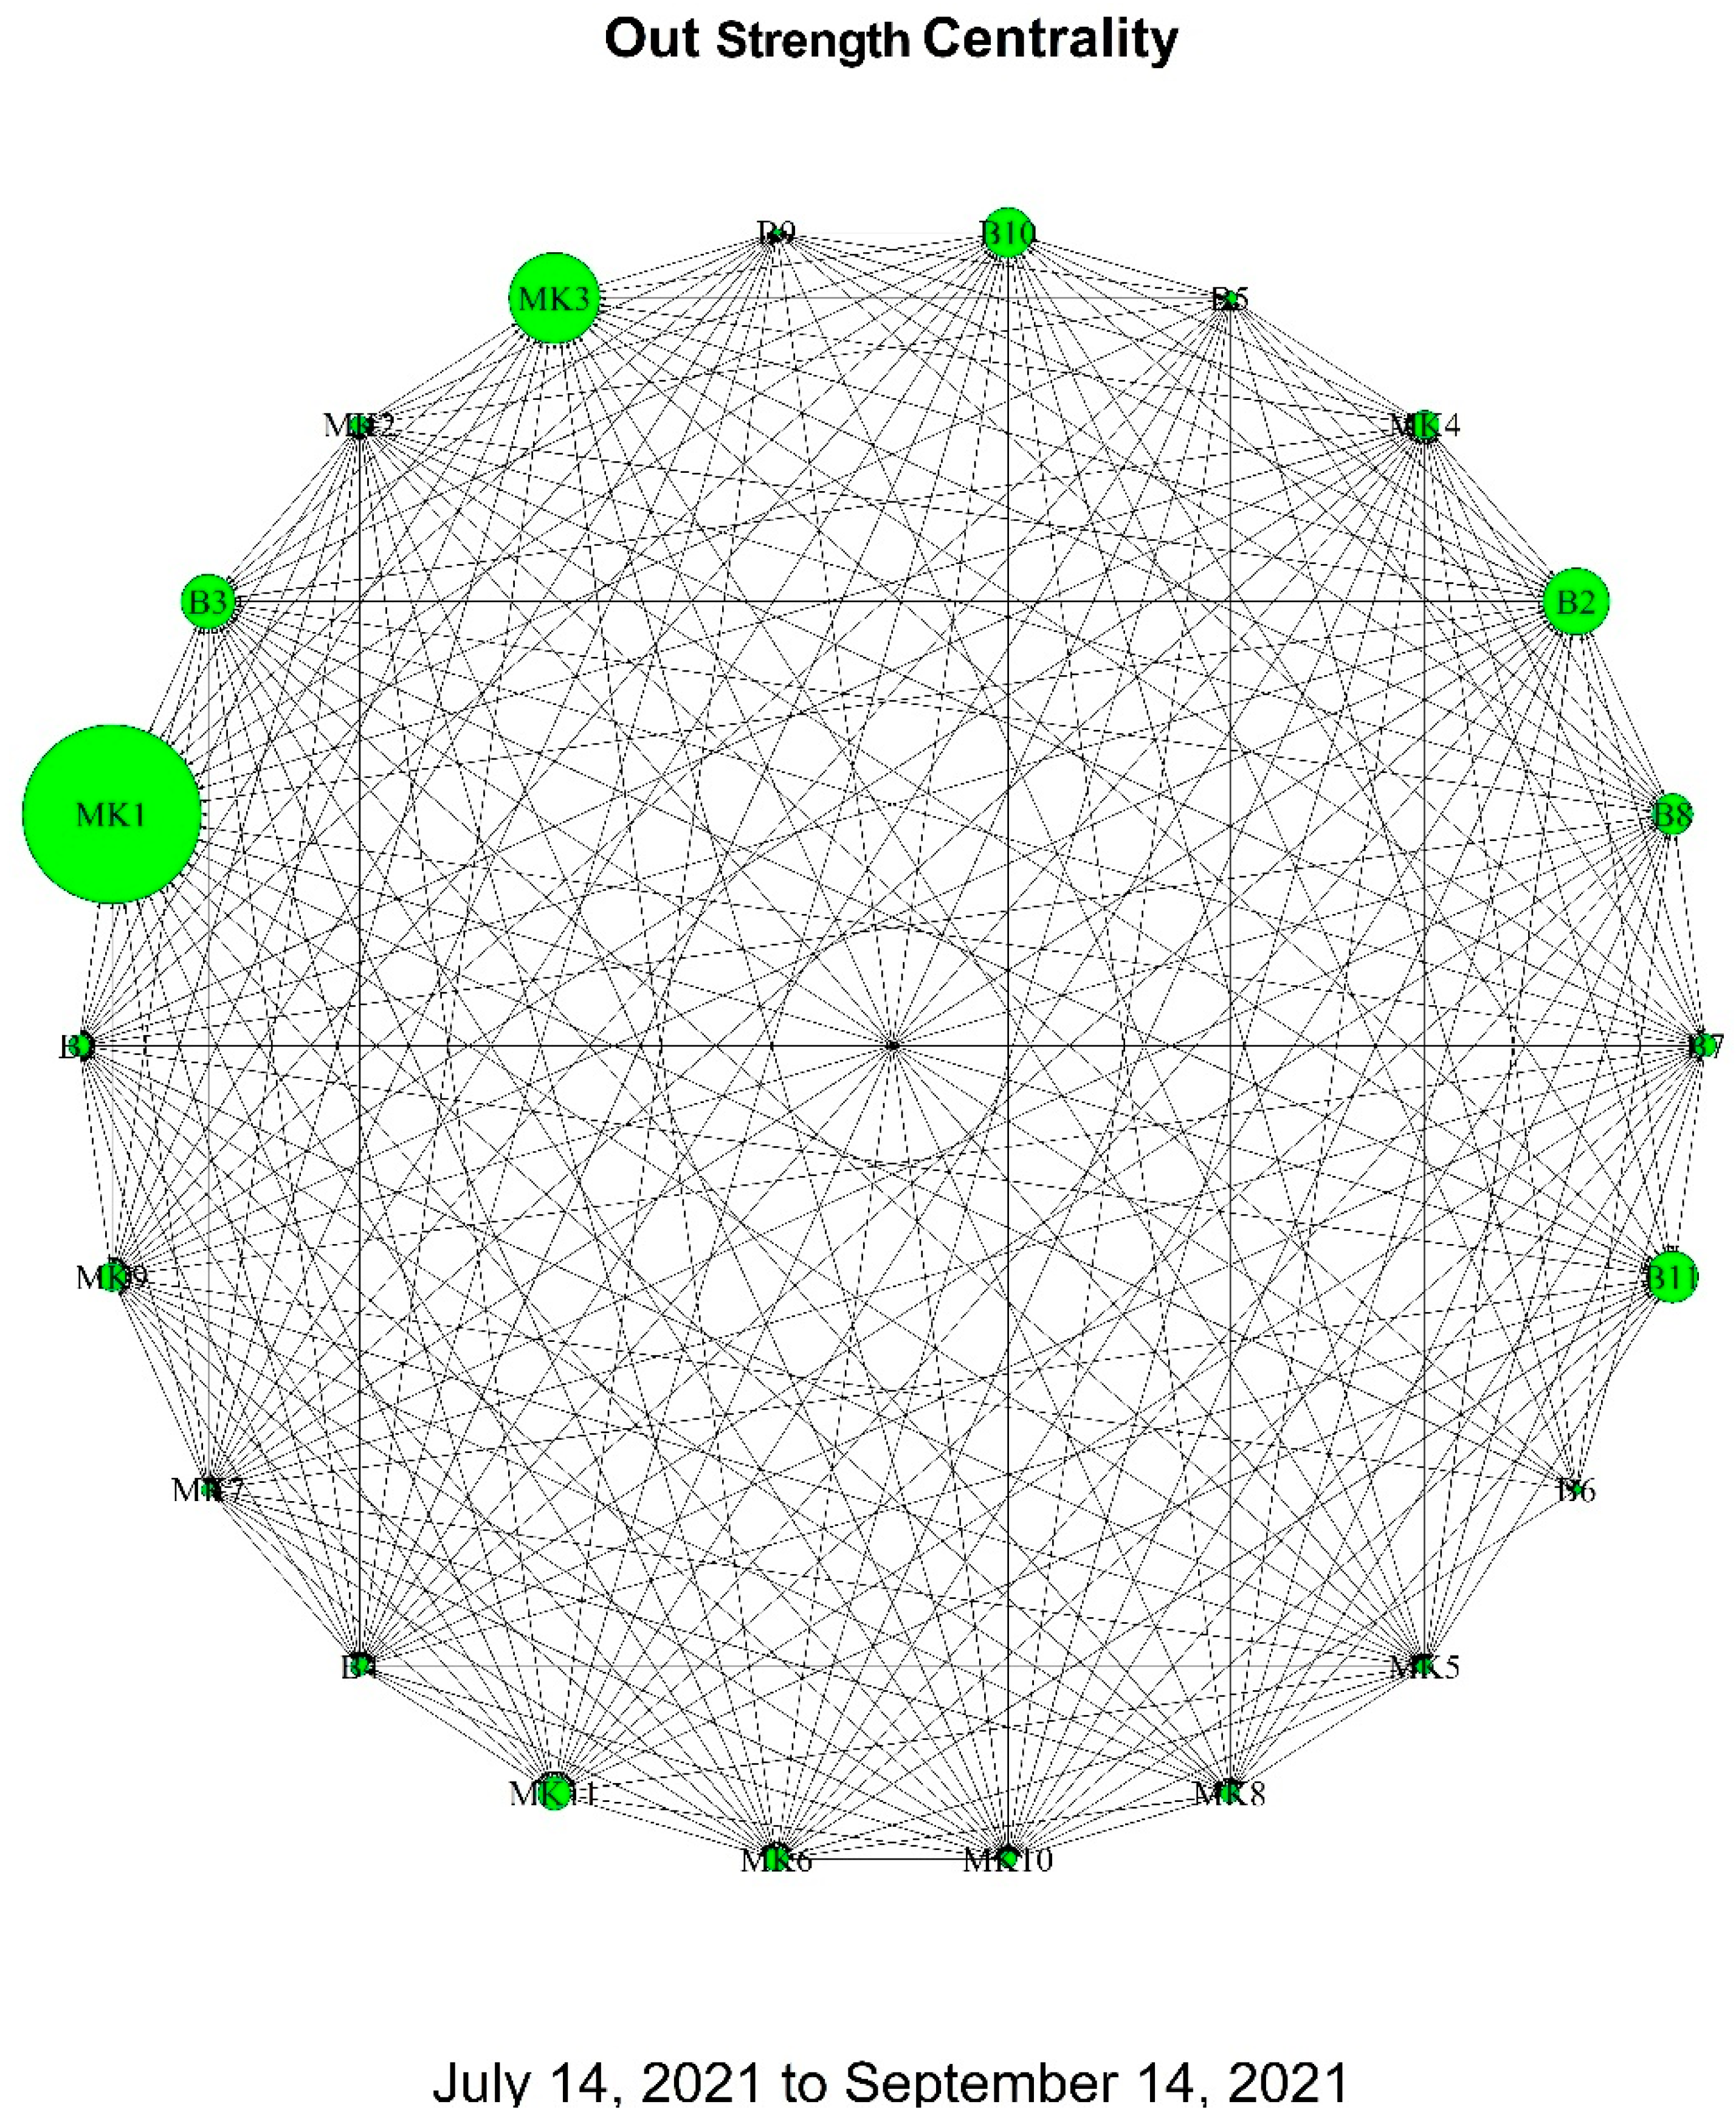
Out-Strength Centrality: Indicates the frequency and intensity with which politicians initiate interactions. MK1 stands out with the highest out-strength centrality, suggesting a leading role in initiating political communication.
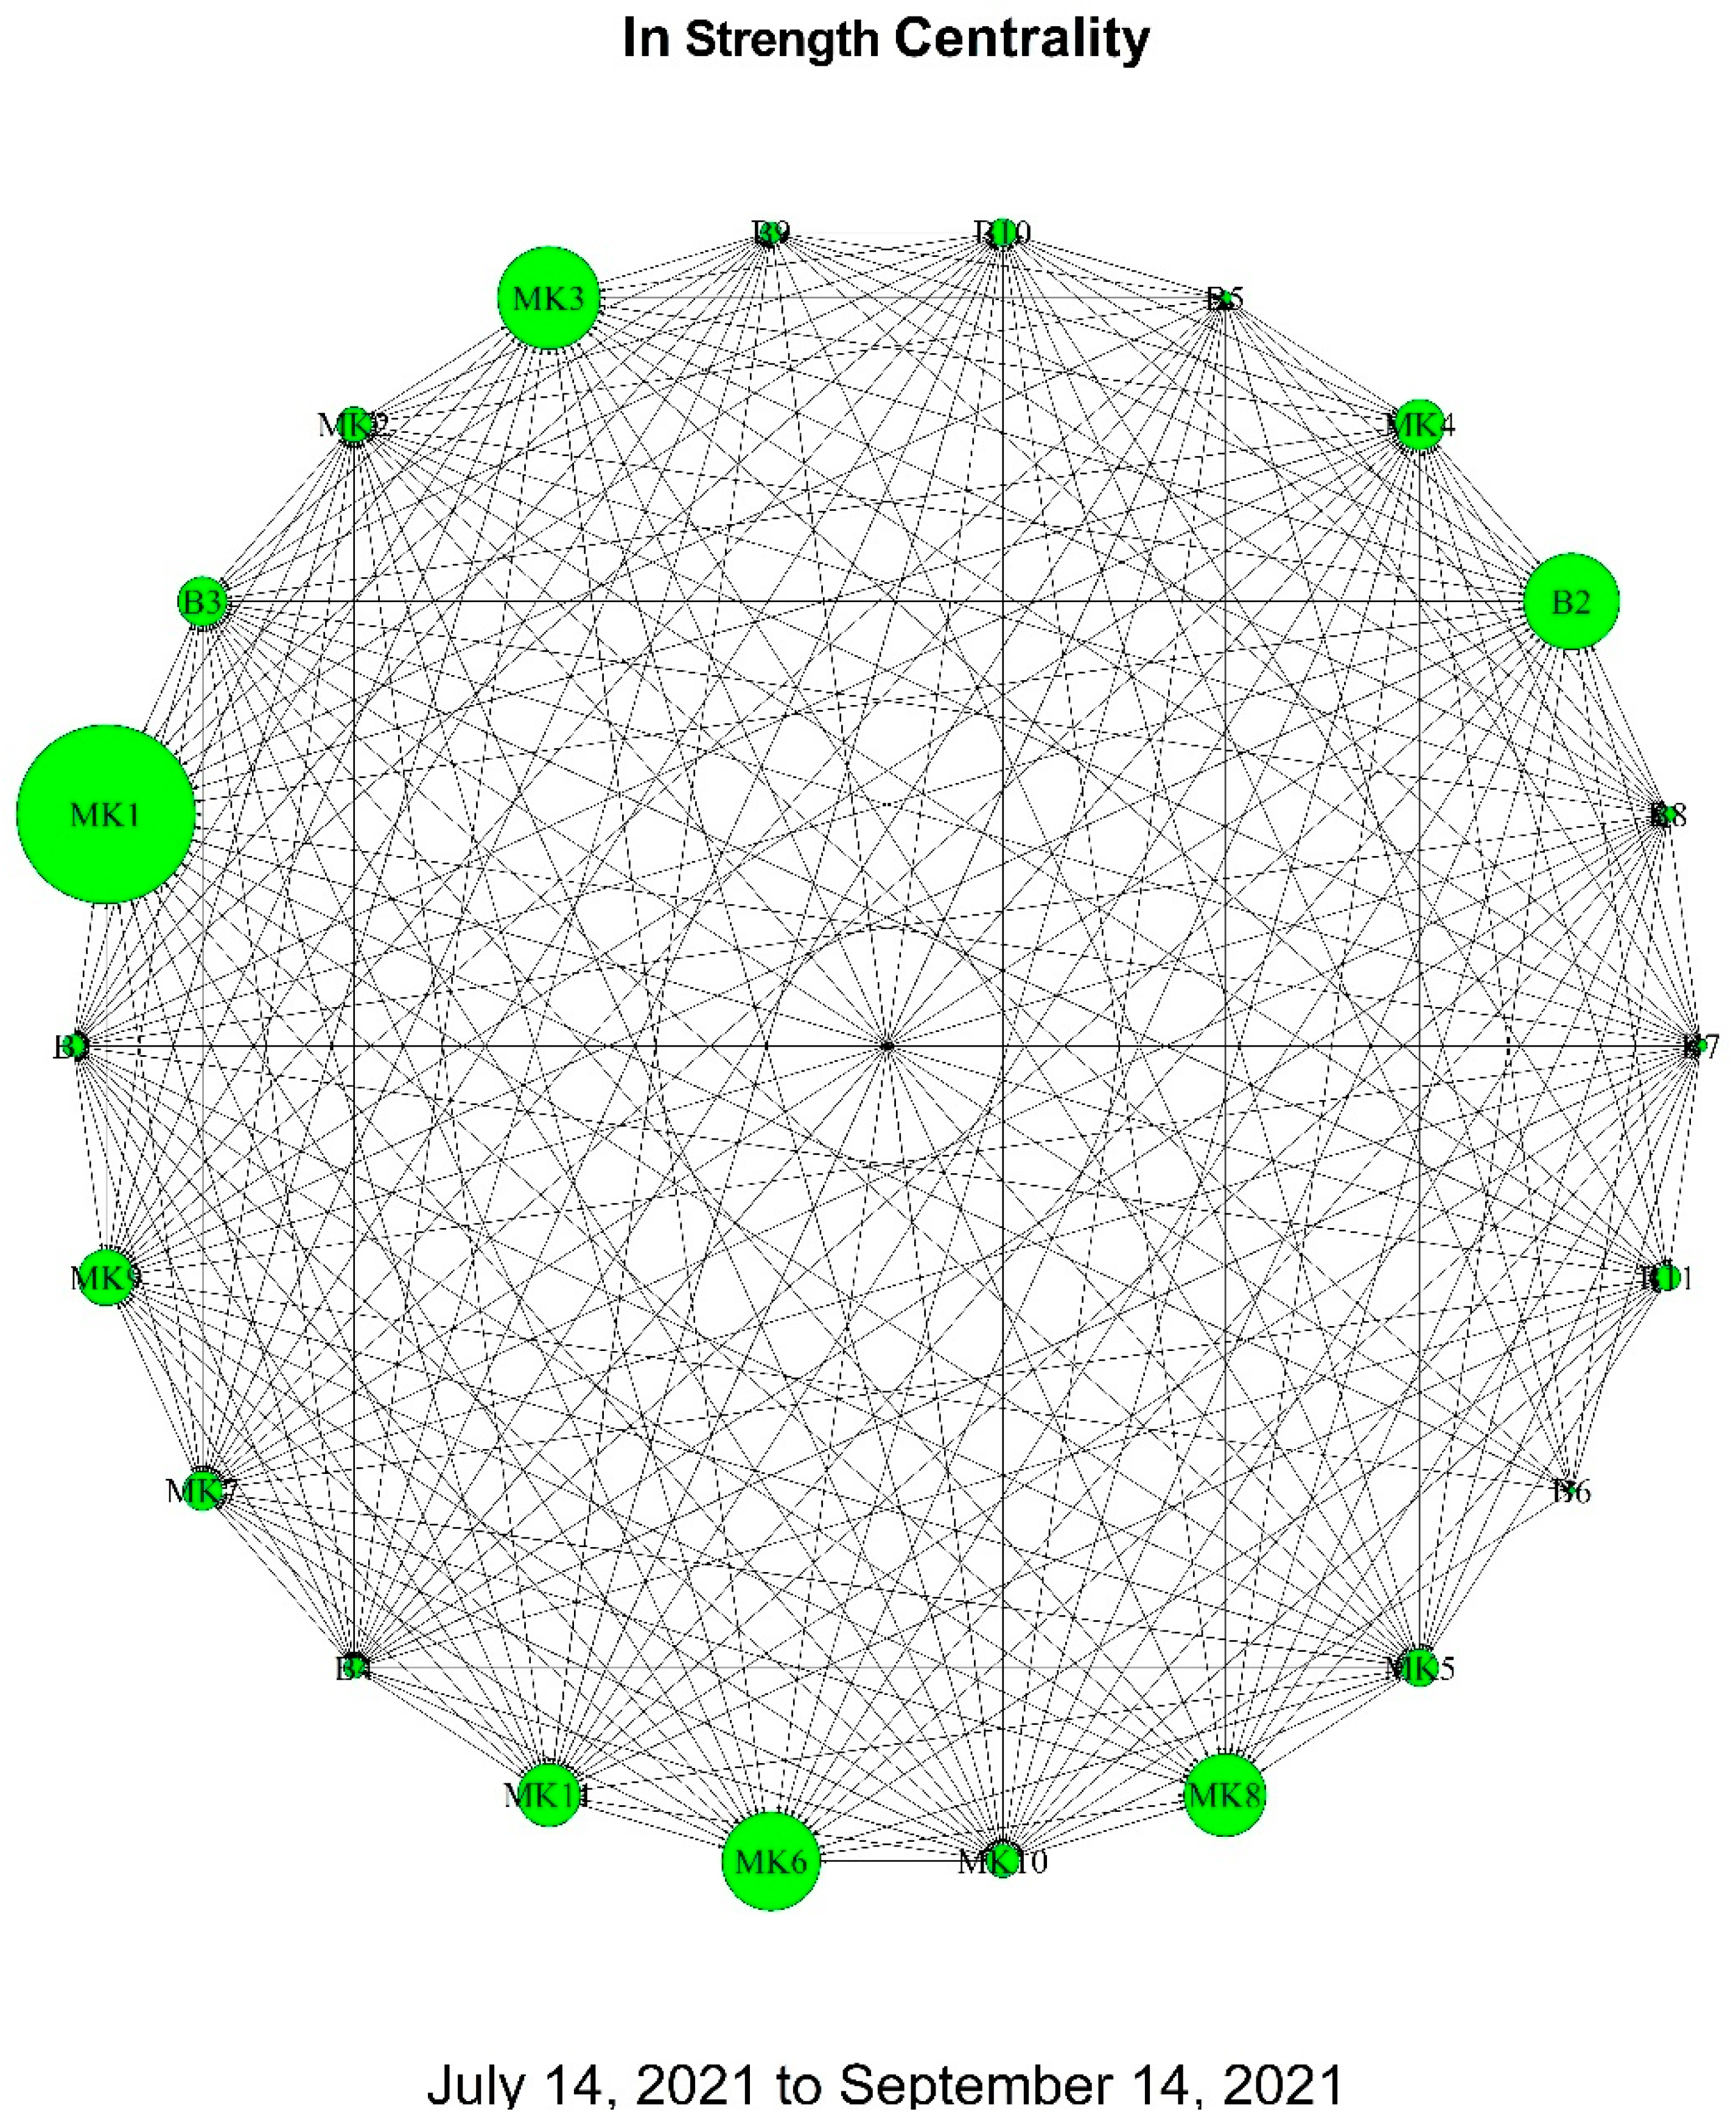
In-Strength Centrality: Reflects the frequency of being targeted in interactions, indicative of influence or importance. MK1 and MK3, with high in-strength centrality, appear to be focal points in the network.
Hubs Centrality: Represents the ability of nodes to act as connectors. MK1 and MK3, with the highest hubs centrality, are likely key in directing others to important nodes or information within the network.
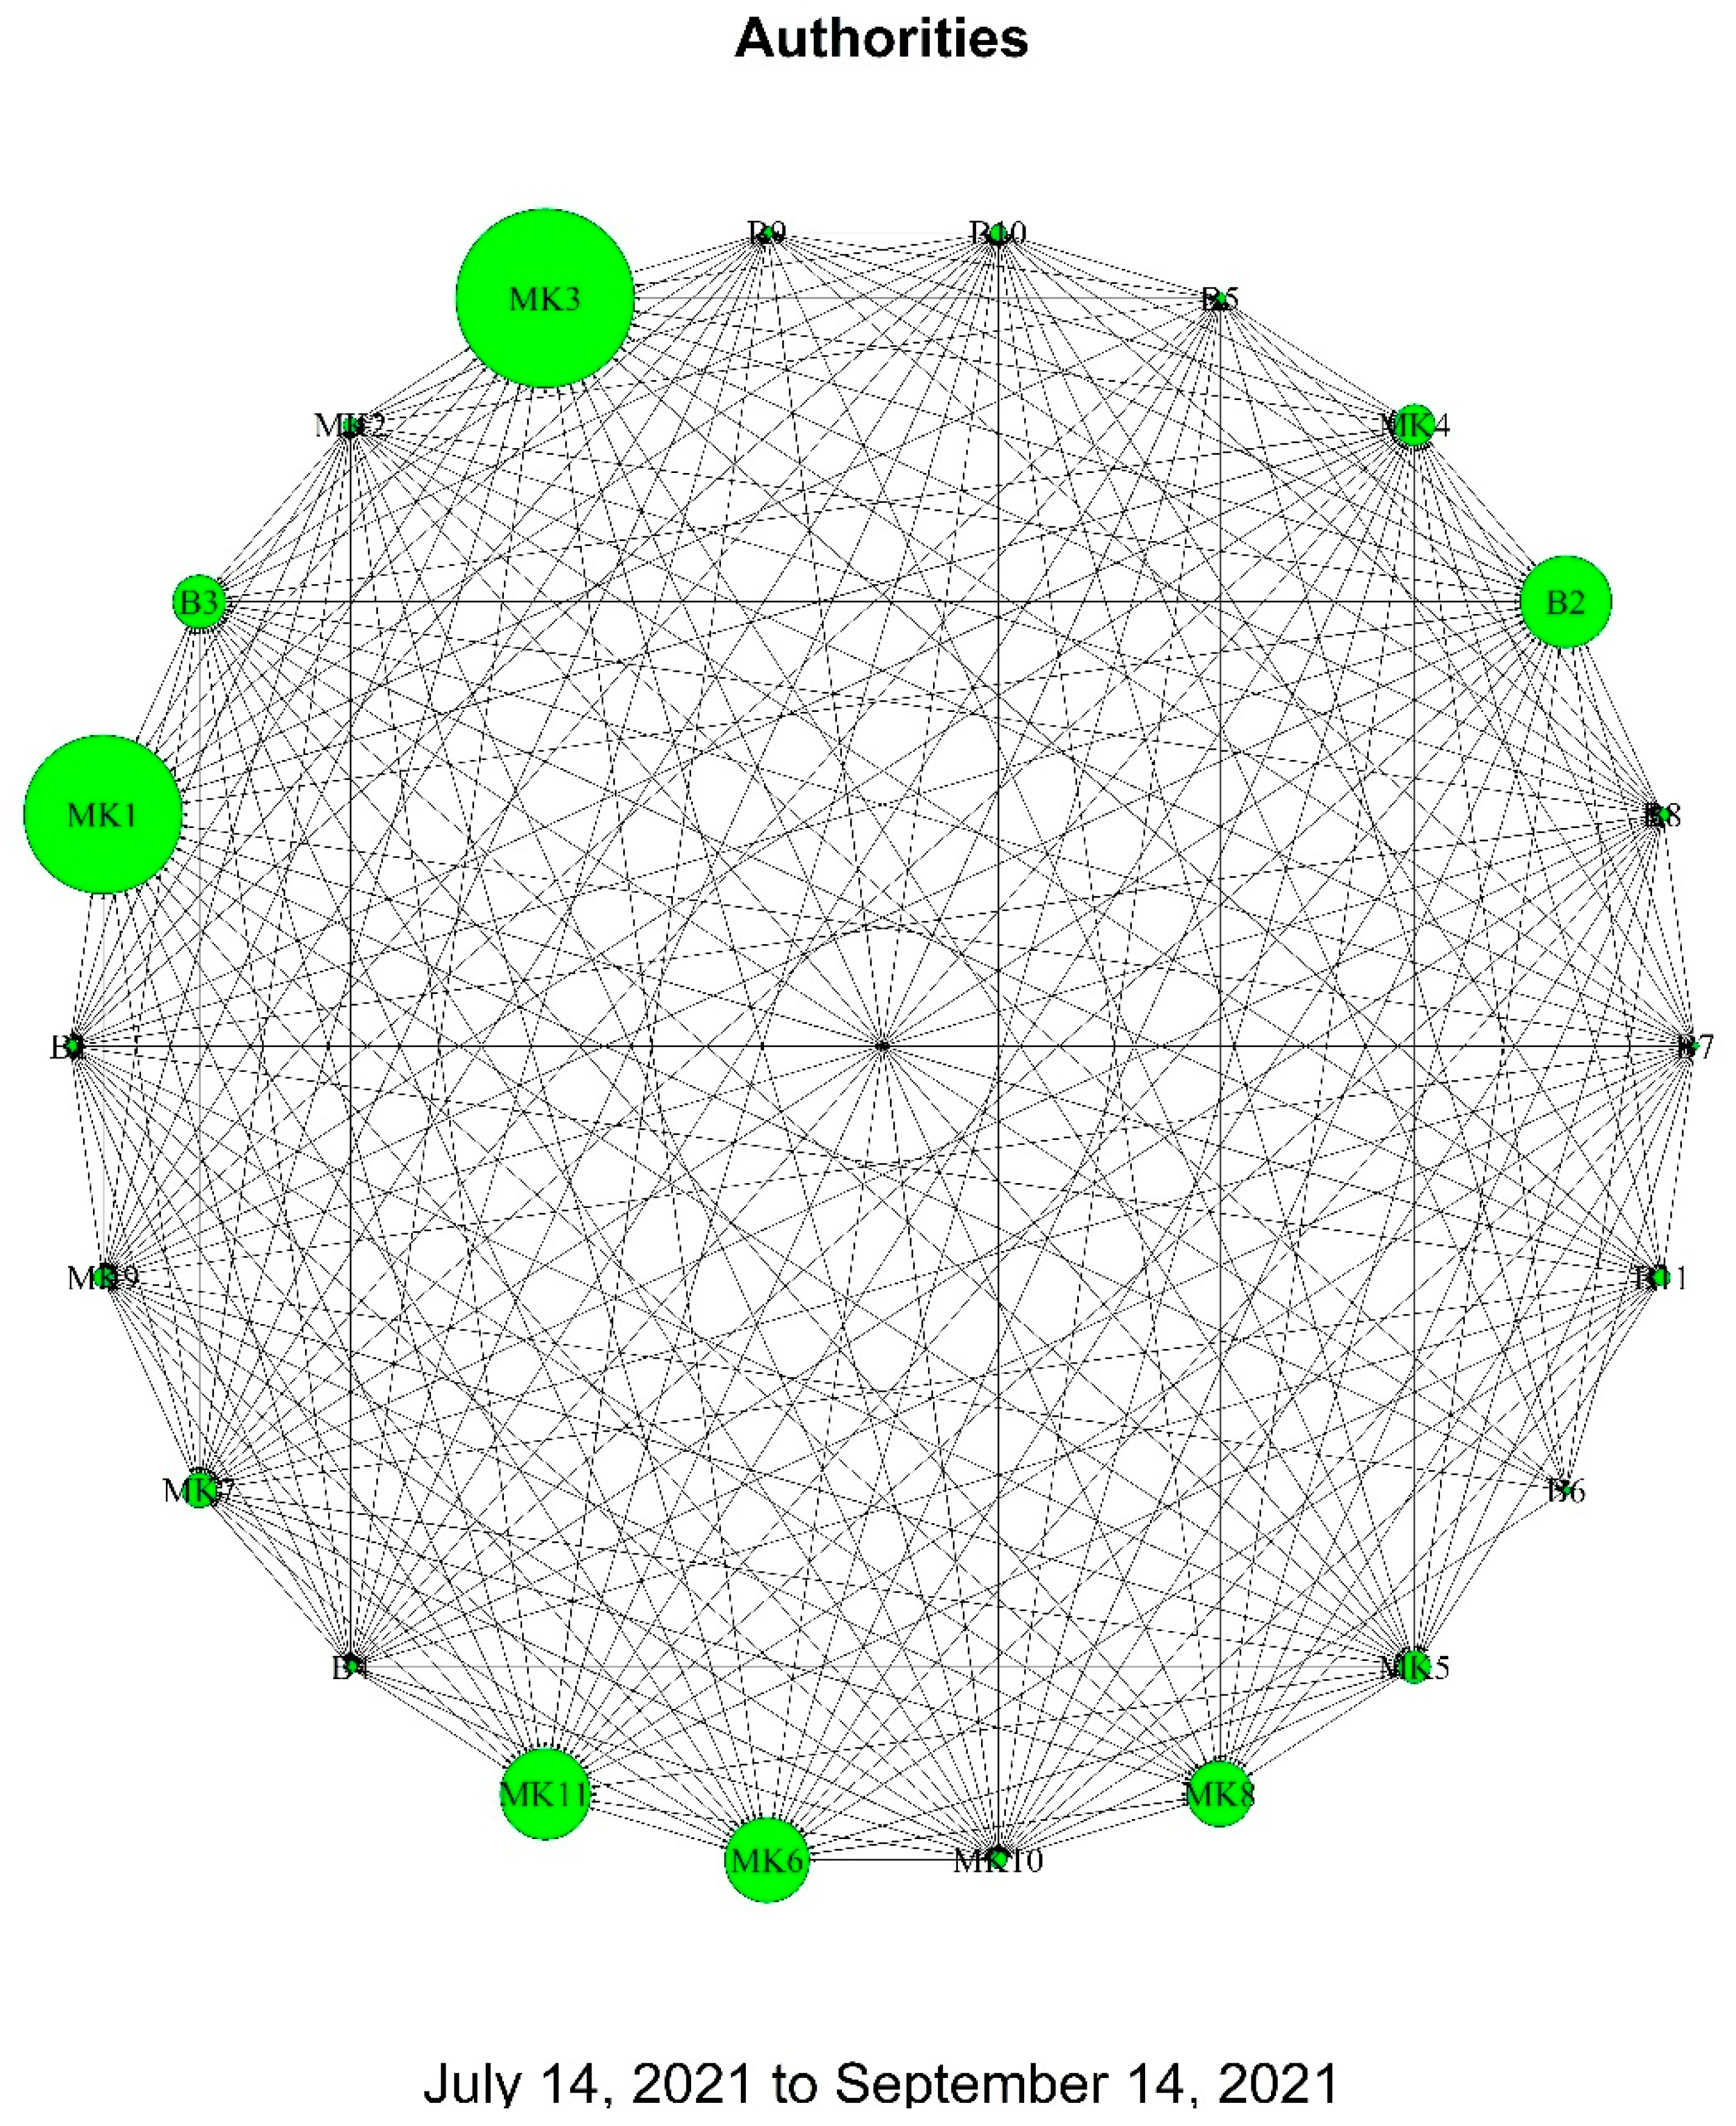
Authorities Centrality: Measures the perceived reliability or authority of a node. MK3, with the highest score, is likely considered a primary source of valuable information.
Out-Vertex Entropy: Assesses the diversity of outgoing connections. Lower values, such as MK3’s, suggest focused communication targets, while higher values, like B7’s, indicate a wider range of communication.
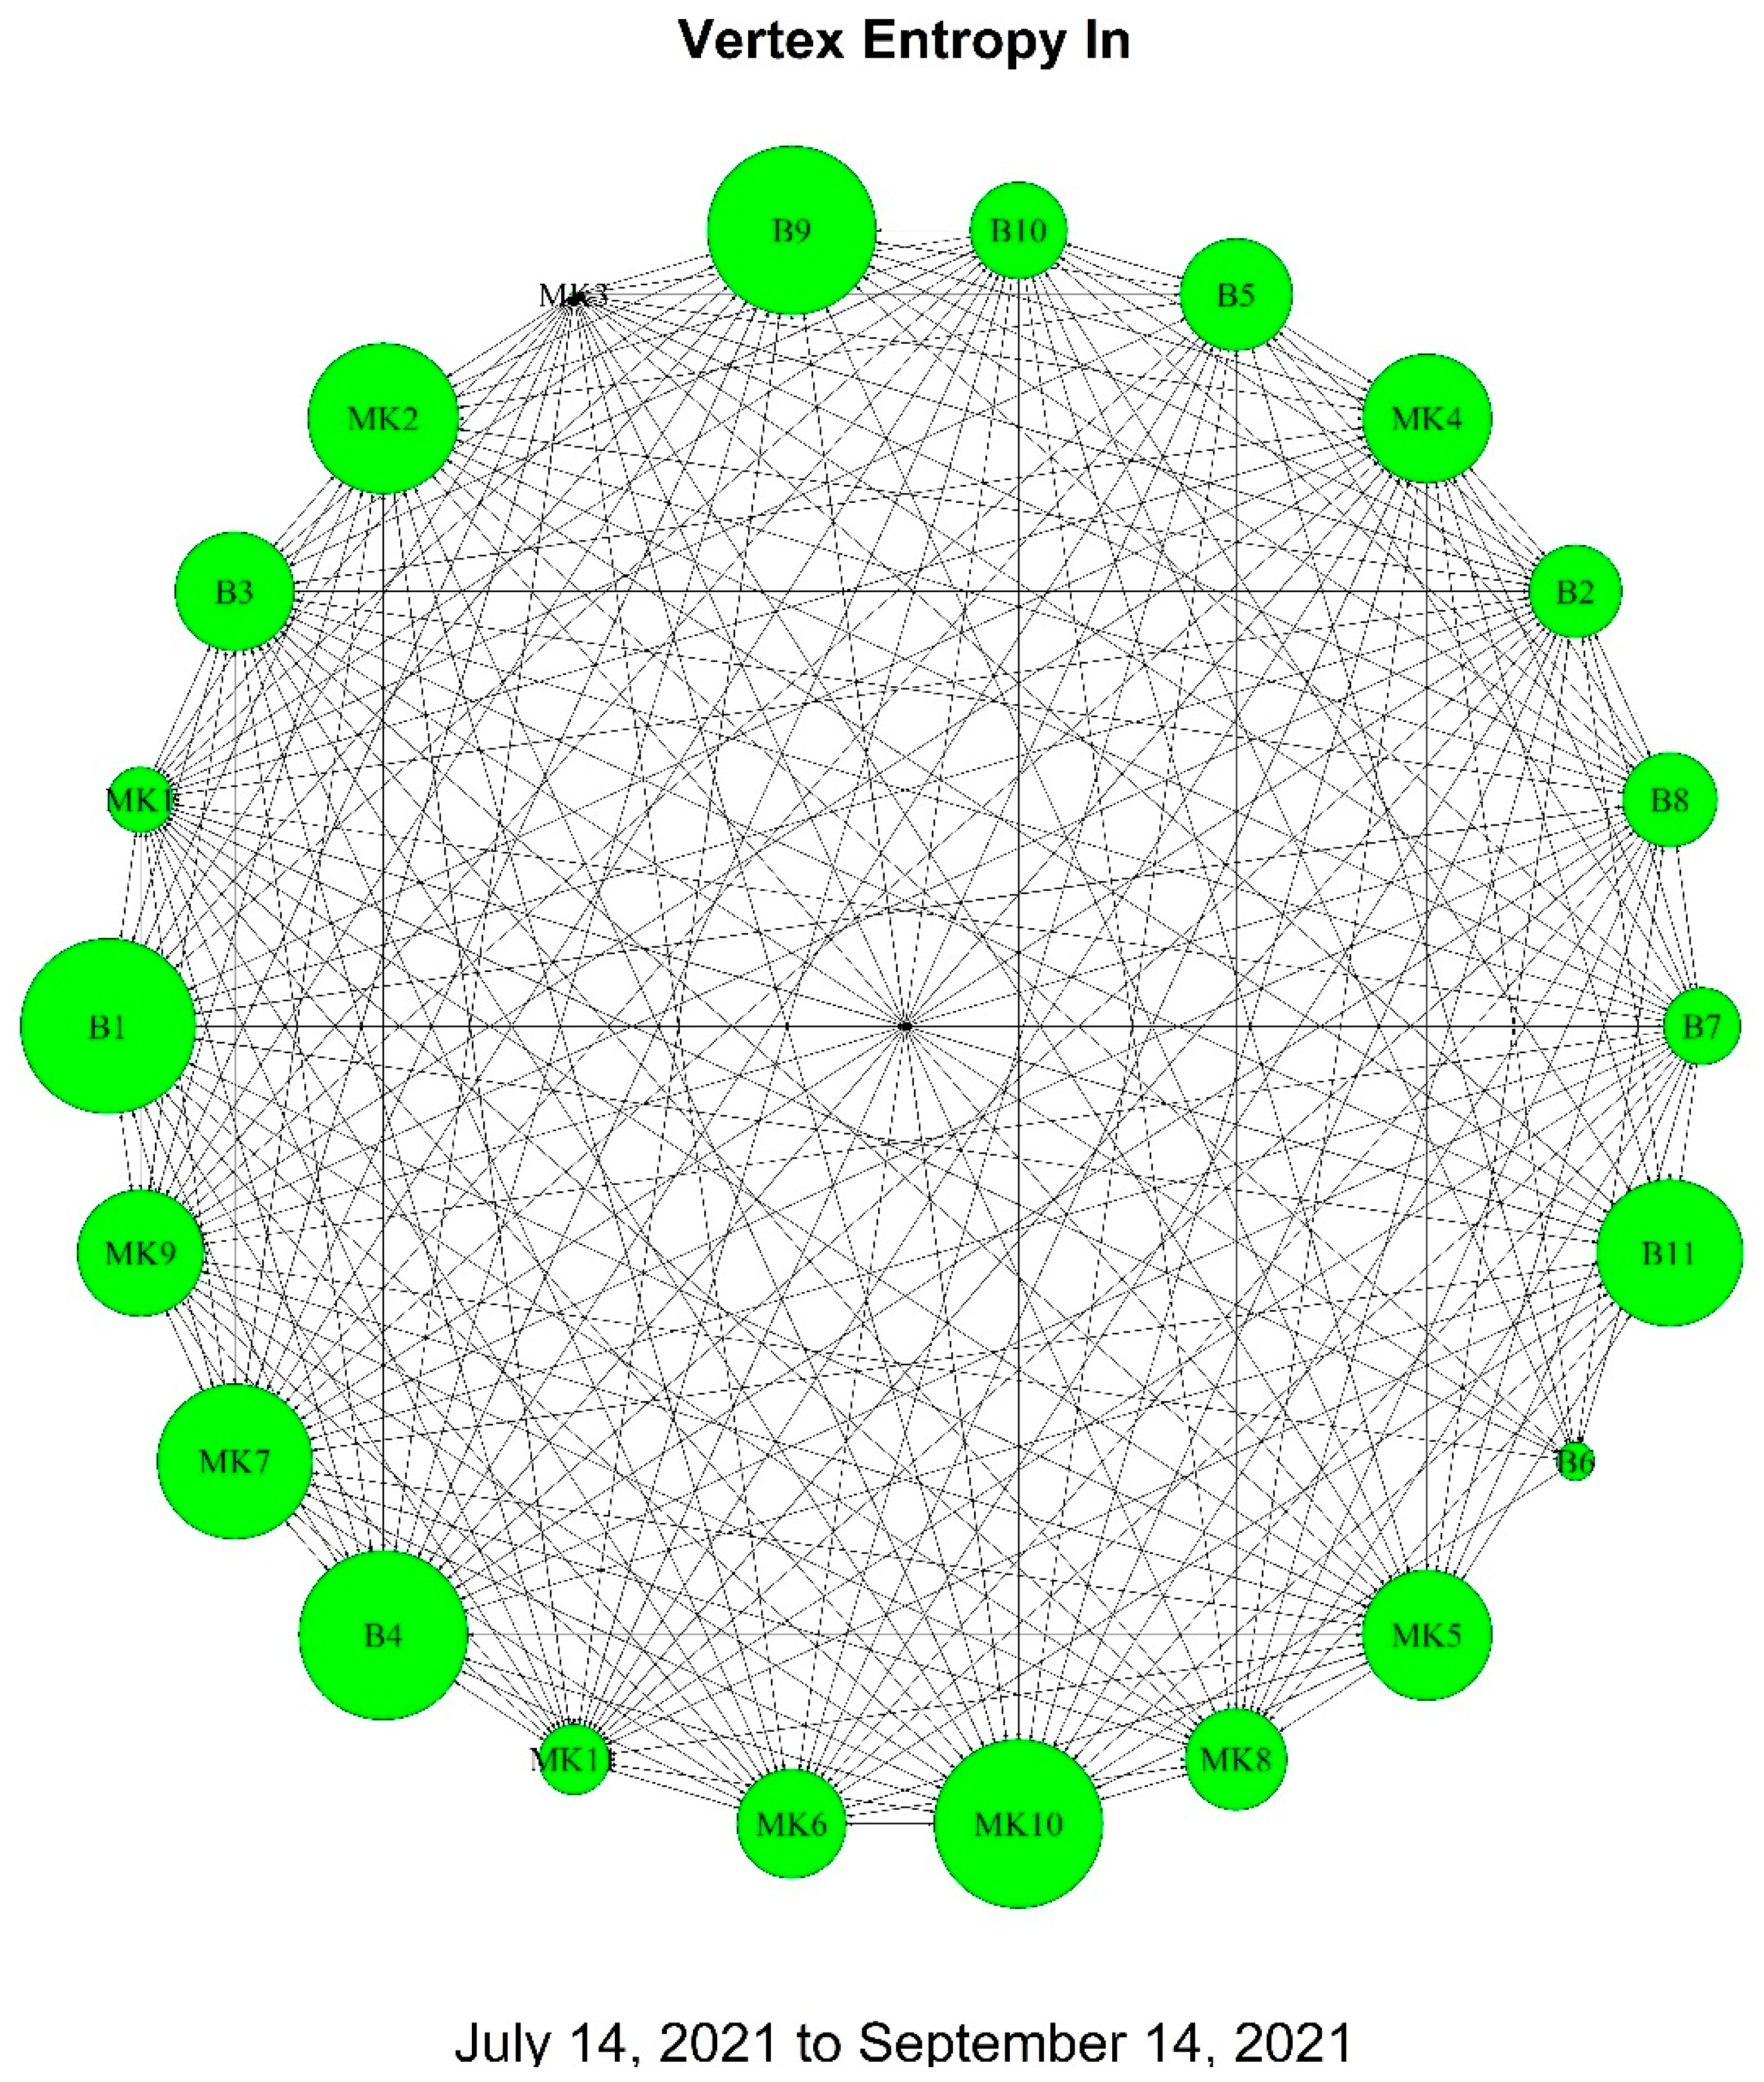
In-Vertex Entropy: Measures the diversity of incoming connections. High values, seen in B1 and B11, suggest these politicians are influenced by a diverse range of sources.
Comparing to the previous year, there are noticeable changes in the centrality measures and entropies, reflecting evolving communication strategies and influence patterns. Politicians like MK1 and MK3 maintain their central roles in the network, yet the dynamics around other nodes show a shift, indicating changes in political communication and influence within the coalition.
Figure 5: This figure presents a network graph that visually represents the Out Strength Centrality among 22 political figures within Greece’s governing coalition, spanning from 14 July 2020 to 14 September 2020. The graph’s design utilizes nodes and lines to denote individuals and their interactions, respectively. Notably, MK1 emerges as the most prominent node, indicative of the highest out-strength centrality and suggesting a significant role in initiating interactions within the network. The spatial arrangement and the dense web of connections imply a tightly interconnected group, highlighting robust communication patterns among the political figures during this period.
Figure 6: Similar to
Figure 5,
Figure 6 depicts Out Strength Centrality, but for the period from 14 July 2021 to 14 September 2021. MK1 maintains its position as the largest node, indicating continued high activity in initiating interactions. The circular node arrangement and dense connectivity illustrate robust communication ties, suggesting effective coordination among the members. Comparative analysis with the previous year’s data could reveal evolving interaction dynamics and influence within the network.
Figure 7: This graph illustrates the In Strength Centrality for the same period as
Figure 5. It focuses on the frequency of politicians being recipients of actions, reflective of their influence or prominence. MK3, followed by MK1, are the larger nodes, indicating their significant engagement by others within the network. The graph’s density underscores active engagement among the political figures, with no isolated nodes or distinct subgroups, suggesting cohesive communication dynamics.
Figure 8: Displaying In Strength Centrality for the period from 14 July 2021 to 14 September 2021, this graph mirrors the structure of
Figure 7, but for a different timeframe. MK1 and MK3 are again prominent, implying their continued influence within the network. The uniformity in node distribution and connectivity indicates active and widespread communication among the members, underlining the absence of isolated individuals or subgroups.
Figure 9: This figure showcases Hubs Centrality from 14 July 2020 to 14 September 2020, identifying key connectors within the network. MK1, as the largest node, is highlighted as a major hub, signifying its role in directing others to key information or nodes. The graph reveals the strategic communicators within the political landscape, with a focus on the infrastructure of the network and information spread.
Figure 10: Presenting Hubs Centrality for the subsequent year, this graph continues to highlight MK1 and MK3 as significant connectors. The even distribution of nodes and the density of connections suggest that while certain members are primary hubs, others also contribute to the network’s connectivity, indicating consistent roles in the political communication structure over time.
Figure 11: Illustrating Authorities Centrality from 14 July 2020, to 14 September 2020, this graph identifies nodes considered valuable sources of information. MK3 stands out as the principal authority, receiving significant references from other members. The decentralised network structure and dense interconnectivity point to a resilient communication structure with multiple influential figures.
Figure 12: Similar to
Figure 11 but for the year 2021, this graph highlights MK3 as a major authority within the network. The even distribution of nodes implies a network with multiple sources of influence, with MK3 and MK1 being particularly prominent. Comparative analysis with the previous year’s graph provides insights into shifts in perceived authority.
Figure 13: This network graph visualises Vertex Entropy Out from 14 July 2020 to 14 September 2020, measuring the diversity of a politician’s outgoing connections. The varied node sizes correspond to different levels of communication diversity, indicating strategies or targeted messaging by the politicians. This analysis helps identify key communicators and their approaches to political communication.
Figure 14: Displaying Vertex Entropy Out for 14 July 2021 to 14 September 2021, this graph quantifies the diversity of outgoing interactions. Larger nodes, such as B5, B7, B9, and B10, suggest communication with a broad spectrum of the network, reflecting varied communication strategies among politicians. Comparative analysis with the previous year reveals shifts in communication patterns.
Figure 15: Showcasing Vertex Entropy In for 14 July 2020 to 14 September 2020, this figure measures the diversity of incoming interactions to a politician. Larger nodes indicate engagement by a wider array of others within the network, highlighting differences in how information is directed to different politicians and understanding the complexity of influence within the network.
Figure 16: Finally,
Figure 16 presents Vertex Entropy In for the period from 14 July 2021 to 14 September 2021. It emphasises the diversity of incoming connections for each political figure, with larger nodes such as B1, B3, MK1, and MK7 suggesting a high degree of diversity in the sources of their interactions. This indicates their prominence within the network, with a wide variety of connections contributing to their political discourse. The graph’s dense interconnectivity and multiple larger nodes suggest that the network does not rely on a single source of influence, but rather benefits from multiple influential nodes. This visualisation aids in understanding the dynamics of political communication during this time, highlighting the variety of influences on key political figures.
Together,
Figure 5,
Figure 6,
Figure 7,
Figure 8,
Figure 9,
Figure 10,
Figure 11,
Figure 12,
Figure 13,
Figure 14,
Figure 15 and
Figure 16 offer a comprehensive view of the political communication landscape in Greece over the specified periods. They reveal the intricate dynamics of influence, connectivity, and communication strategies among political figures, providing valuable insights into the evolving nature of political interactions within the governing coalition. The use of Network Theory tools such as centrality measures, vertex entropy, and hubs and authorities analysis in these figures underlines the complexity and richness of political communication in the digital age, particularly on social media platforms like
. This approach not only enhances the understanding of individual roles within the network but also sheds light on the collective patterns and strategies that shape political discourse and decision-making processes.
4. Discussion
From the analysis of the results presented in
Section 3, a series of fascinating conclusions are derived regarding the examined networks. The following observations are made in the network containing the data for the two months between 14 July 2020 and 14 September 2020 (
Table 1,
Figure 3,
Figure 5,
Figure 7,
Figure 9,
Figure 11,
Figure 13 and
Figure 15):
Highly active nodes are identified as
MK1 and
MK11.
These nodes demonstrate Strong influence and activity, particularly visible in
MK1, with the highest out-strength centrality, hubs centrality, and maximum authority centrality of 1. The
central authority node is identified as
MK3, having the highest authorities centrality of 1, making it a central authority within the network.
Complex connections are exhibited by the nodes
B9,
MK10, and
MK5, which exhibit high vertex entropy in and out, indicating complex or uncertain relationships.
Low activity nodes are
B7,
B8,
B5, and
B6, mainly from the parliament members, showing lower out-strength centrality and in-strength centrality, signifying lesser engagement in the network.
Strong hub but lower authority is seen in nodes
MK7 and
MK6, which have noticeable hubs centrality but comparatively lower authorities centrality, suggesting a unique role in information distribution but less recognition as an authority.
Balanced nodes are identified as
MK2,
MK4,
B3,
B10,
MK9, and
MK8, demonstrating more balanced behaviour across different measures, not leaning excessively towards any characteristic.
Comparing the two different groups of nodes (government members and parliament members), the following is observed: A noticeable trend within the network is the generally higher centrality values among government members (MK), reflecting more active engagement and authority. Conversely, the centrality measures among parliament members (B) tend to be lower, suggesting lesser influence and activity. However, some exceptions and intricate behaviours have been noted, as detailed in the node analysis section.
The governmental nodes (MK) have developed or maintained the following characteristics: MK1: The highest out-strength centrality, in-strength centrality, hubs centrality, and authorities centrality in the MK group have been exhibited, indicating a highly connected node that influences many others, possibly indicative of a prominent government figure. MK3: Significant in-strength centrality and authorities centrality have been displayed, hinting at a prominent position within the government hierarchy. MK4, MK5, MK7, MK9, MK10, MK11: Moderate centrality levels in different measurements have been found, signifying active participation and influence but to a lesser degree/strength than MK1 and MK3. MK6, MK8: Noticeable in-strength centrality and authorities centrality are detected, implying strong influence from other nodes. MK2: Lower levels of centrality across the board are observed, signifying a less influential position within the government.
The nodes representing members of the governmental, parliamentary group (B) have developed or maintained the following characteristics: B2: Dominance in both in-strength centrality and out-strength centrality is seen, showing significant connections and influence among parliament members. B8, B10, B11: Moderate out-strength centrality and in-strength centrality levels are exhibited, indicating an active but not dominant role. B1, B3, B4, B5, B6, B7, B9: Lower in and out strength centrality measures are observed, representing less influential network roles.
Comparing the two groups of nodes during the second examined period, the following conclusions are drawn: Activity: MK nodes tend to have higher centrality measures, especially in authorities centrality, indicating more significant influence and authority within the network. Diversity: MK nodes demonstrate a more comprehensive range of influence and connections, as seen in MK1 and MK3, whereas B nodes are found to be more uniformly distributed in their impact. Connectivity: B2 is noted as an exception among B nodes, displaying similar connectivity to prominent MK nodes, hinting at a bridge or liaison between the government and parliament.
Comparing the results of the two different periods (
Table 1 and
Table 2,
Figure 3,
Figure 4,
Figure 5,
Figure 6,
Figure 7,
Figure 8,
Figure 9,
Figure 10,
Figure 11,
Figure 12,
Figure 13,
Figure 14,
Figure 15 and
Figure 16), the following conclusions are drawn: Node Size: The values of “out-strength centrality” and “in-strength centrality” are observed to have increased substantially for many nodes during the second bimonthly period. This may be indicative of a general increase in the network’s connectivity. Centrality: A decrease in the values of “out-strength centrality” and “in-strength centrality” for many nodes in the second bimonthly period is noted. In contrast, changes in “hubs centrality” and “authorities centrality” are found to be more mixed. Entropy: A decrease in “out-vertex entropy” has been identified in most instances, while the “in-vertex entropy” has remained relatively stable or increased. Such changes may reflect an alteration in the structure or behaviour of the network.
More pronounced differentiations are detected as follows: MK3: An increase in the node’s importance as a hub (from 0.2105 to 0.5948) and as an authority (1 to 0.5) has been witnessed. B2: A significant increase in the values of out-strength and in-strength, as well as in-vertex centrality, has been recorded. MK1: A very high increase in the values of Out-Strength and In-Strength has been identified, rendering the node much more significant.
The general picture illustrates an evolution of the network, with noteworthy changes in connectivity and the significance of the nodes. No completely stable node appears present, and considerable dynamism in the network structure is observed.
The extensive analysis and detailed observations presented in
Section 4 underline the data-centric approach that has characterised modern investigations in political networks. This study’s alignment with data journalism principles is evident in its rigorous examination of nodes, centralities, and entropies across different periods, reflecting techniques similar to those used in investigative journalism. The research mirrors data journalism’s emphasis on objectivity, precision, and depth by employing data analytics to scrutinise complex relationships and trends within the political sphere. Identifying active nodes, complex connections, and variations in influence and activity is analogous to how data journalism seeks to uncover hidden patterns and relationships within large datasets. The comparison of different periods, the meticulous study of governmental and parliamentary groups, and the insights drawn from the survey are representative of the application of data journalism methodologies in scientific research. This approach enriches the understanding of political dynamics. It offers a robust framework for future explorations, bridging the gap between academic inquiry and practical, real-world application.
5. Conclusions
Through a meticulous examination of political connections within Greece’s governing party, this study has revealed intricate patterns and dynamics that underline the evolution of these connections, influenced by specific recurring events and crises. Utilising a comprehensive network analysis, including metrics such as in and out-strength centrality, hubs and authorities centralities, and in and out-vertex entropy, the research has illuminated the complexity and the dynamism inherent within these structures.
The results encompass two distinct bimonthly periods, demonstrating discernible shifts in centrality and entropy across various nodes representing government and parliamentary members. Notably, a hierarchical structure of nodes was evident in the network between 14 July 2020 and 14 September 2020, reflecting different roles and influences within the network. Conversely, the subsequent period between 14 July 2021 and 14 September 2021 revealed an evolution in these roles, marked by substantial increases or decreases in different centrality measures.
Several intriguing observations were made, notably the significant influence and activity demonstrated by particular nodes, the complex connections exhibited by others, and the generally higher centrality values among government members compared to parliamentary members. The results also highlighted unique characteristics among specific nodes and captured the nuances of the network’s structure and behaviour.
In comparing the two different periods, it was determined that substantial changes occurred in the network’s connectivity, with increases and decreases in specific measures of centrality and entropy. These fluctuations were found to reflect alterations in the structure or behaviour of the network, potentially indicative of internal relationships, communication strategies, and influences from recurring events.
The insights gleaned from this study contribute to a novel understanding of political communication within social networks and demonstrate the applicative potential of Network Theory within the social sciences. The complex and dynamic structures revealed through the analysis may reflect the multifaceted nature of political connections and their responsiveness to events and crises.
The apparent absence of completely stable nodes, coupled with considerable dynamism in the network structure, further underscores these connections’ intricate and fluid nature. Such findings beckon further exploration into how these patterns might correlate with real-world political dynamics, policies, and decision-making processes within the governing party. Future studies might also seek to extend the analysis to additional periods or employ more diversified data sources to enrich the understanding of these political connections.
The integration of data journalism principles within this research accentuates the emerging paradigm in the analysis of political communication. By leveraging data-driven methodologies like those employed in data journalism, this study provides a granular examination of political interactions within Greece’s governing party. The application of metrics, akin to those used in contemporary journalistic practices, enables a rigorous and nuanced understanding of the underlying patterns and dynamics. This alignment with data journalism techniques underscores the research design’s sophistication and robustness and resonates with a broader trend towards empirical and computational social and political analysis approaches. In the context of this study, data journalism serves as an illustrative bridge between scientific inquiry and communicative interpretation, enriching the methodological foundation and enhancing the interpretative insights of the investigation. It demonstrates how synthesising mathematical rigour and journalistic insight can contribute to a multifaceted understanding of political networks and their evolution.
In conclusion, this research has provided a profound and nuanced glimpse into the evolving landscape of political connections within the governing party of Greece. The insights drawn underscore the complexity and adaptability of these connections, enriched by the application of Network Theory. This study is a valuable contribution to the broader discourse on political communication and offers a methodological framework for future inquiries into political networks.


 ,
, 


