1. Introduction
Lung cancer is the leading cause of cancer-related death, with an estimated 2.2 million new cases and 1.8 million deaths in 2020 worldwide [
1]. Approximately 50% of new cases and 58.3% of cancer-related mortality are in Asia [
2]. The incidence and mortality of lung cancer in Malaysia follows the global trend as one of the most common cancers, comprising 10.6% of all malignancies in 2020 [
3]. The heterogeneity of Malaysian inhabitants and etiologic factors, such as tobacco smoking, largely contribute to the asymmetric lung cancer risk and incidence found locally. The resident population is multi-ethnic, composed mainly of Malays but also encompassing large groups of Indians, Chinese and other indigenous groups. Chinese males have the highest lifetime risk for lung cancer (1/43). However, that risk decreases when considering the general Malaysian population: approximately 1/55 for males and 1/135 for females. Notably, the prevalence of smoking in Malaysia is high (projected prevalence for males ≥15 years in 2020 is 40.2%) [
4]. There are marked sex differences in smoking prevalence, with rates ~30 times higher in males than in females (1.4%) [
5]. It has been reported that the majority of female Malaysian lung cancer patients were non-smokers [
6,
7], or were all non-smokers in a subset of younger patients (<40 years) [
6].
Non-small cell lung cancer (NSCLC) is the most common type of lung cancer, and adenocarcinoma is the predominant histological subtype [
8]. In Malaysia, the histological distribution is comparable with global statistics, with small cell lung cancer on the decline [
9]. Most lung cancer patients in Malaysia are diagnosed at stages III or IV (75–88%) [
9], with a five-year observed survival rate of 9% [
10]. One study reported a median survival as low as 18 weeks from diagnosis [
11]. The majority NCLSC patients in Malaysia do not undergo surgical resection because of late presentation [
9,
10]. Equally, pharmacological- based therapeutic options are limited, and a limited number of cases undergo molecular profiling. Overall, this results in poor clinical outcomes for NSCLC patients. Increasing the local diagnostics capabilities while enabling appropriate biomarker testing is key to providing better therapeutic options for patients.
The guidelines for the National Comprehensive Cancer Network (NCCN), and the European Society for Medical Oncology (ESMO) for advanced NSCLC recommend molecular testing for clinically relevant biomarkers such as epidermal growth factor receptor (
EGFR), V-Raf murine sarcoma viral oncogene homolog B (
BRAF) and Kirsten rat sarcoma virus (
KRAS) mutations, ROS proto-oncogene 1 (
ROS1), anaplastic lymphoma kinase (
ALK), RET proto-oncogene (RET) and neurotrophic tyrosine receptor kinase (
NTRK1/2/3) fusions, MET Proto-Oncogene (
MET) exon 14 skipping mutations and programmed death-ligand 1 (PD-L1) expression [
12,
13]. Emerging biomarkers include
MET amplification and erb-b2 receptor tyrosine kinase 2 (
ERBB2)/(
HER2) mutations [
14]. A consensus statement from the College of Pathologists, Academy of Medicine Malaysia, the Malaysian Thoracic Society and the Malaysian Oncological Society [
15] follows similar guidelines. The biomarker selection scheme in Asian populations becomes highly relevant because of differences in mutation frequencies across geographic regions. The
EGFR mutation frequency is over three times higher than in Europe (~47% versus ~14%) [
16] and the generally mutually exclusive
KRAS mutations are less frequent than in Western countries [
17].
Advances in immunotherapy and precision medicine, with a growing list of first- and second-line targeted therapies for metastatic NSCLC has improved the overall survival of patients compared to chemotherapy [
8,
18]. Therefore, it is imperative that actionable mutations are identified on time to enable biomarker-driven treatment and to improve overall survival. Current methods for lung cancer molecular profiling might include immunohistochemistry (IHC), fluorescent in-situ hybridization (FISH), real time quantitative PCR (qPCR) and next-generation sequencing (NGS). Notably, among the main challenges for NSCLC molecular profiling is the limited availability of tissue along with the need to generate results with the fastest possible turnaround time (TAT). Employing NGS cancer panels that simultaneously target multiple key biomarkers is emerging as the most effective approach to maximize the usage of limited samples while reducing TAT and is currently endorsed by guidelines from multiple medical societies.
Support and strategic collaborations among the various key stakeholders are essential to address molecular profiling challenges and provide affordable NGS testing options for lung cancer patients in Malaysia. This collaborative effort involving NGS testing at a private tertiary referral medical centre, supported by key pharmaceutical and NGS technology industry partners, was initiated in 2019. Between October 2019 and December 2021, three iterations of the patient access programmes have been completed. These programmes improve access to NGS testing for a vast majority of lung cancer patients in Malaysia, and provide critical information on the mutation landscape of clinically relevant biomarkers. These findings, as well as concomitantly occurring genetic alterations in EGFR mutated cancers, are reported in this study.
2. Materials and Methods
2.1. Population and Tumor Sample Collection
This was a retrospective observational analysis of mutational data from 469 lung tumor samples accrued from October 2019 to August 2021 at the Subang Jaya Medical Centre (SJMC) laboratory, Malaysia. Lung cancer patients were diagnosed at several medical centers and hospitals in Malaysia where tumor biopsies were collected and then sent to SJMC laboratory for molecular profiling. The type of sample and tumor specimen obtained are listed in
Table 1.
The three iterations of the patient access programmes were Nexus 1, 2 and 3 (accelerating NEXt generation seqUencing technology in nSclc). The molecular profiling study was divided into two phases: a program validation phase, referred as Nexus 1 and a subsequent phase, referred as Nexus 2–3. Samples from the Nexus 1 cohort included 156 patients diagnosed from October 2019 to April 2020. Samples under the Nexus 1 were analysed using the Ion GeneStudio S5 Platform. The second cohort, collectively named Nexus 2–3, included 313 patient samples diagnosed from November 2020 to August 2021. This cohort comprised of samples enrolled under the Nexus 2 and 3 Programs, as well as samples received for routine NGS testing outside of the patient access programs. Samples under the Nexus 2–3 were analysed using the Ion Torrent Genexus Platform.
The Nexus Access programmes enrolled primarily patients with tyrosine kinase inhibitor naive, advanced stage lung cancer diagnosed in Malaysia. However, a small number of patients included in the analysis were early stage or had received first-line TKI.
Patients under the Nexus Programmes signed informed consent for enrollment into the programmes. All patients’ data have been deidentified before analysis.
2.2. Ethical Approval
Ethical approval for the analysis of the mutational profile was obtained from the internal review board (IRB) for the Nexus 1 (Ref: 201907.3) and Nexus 2–3 groups (Ref: 202109.3).
2.3. Sample Processing and Nucleic Acid Extraction
Biopsies or surgical specimen samples received at the laboratory as formalin-fixed, paraffin-embedded (FFPE) tissue unstained slide sections or blocks were first assessed by a consultant pathologist for adequacy of tumour tissue. An eligible tissue section was at least 5 mm2 in size with ≥30% tumour cellularity. Samples failing to meet the eligibility criteria were rejected and an alternative block, single gene sequential testing or liquid biopsy was recommended. Tumour enrichment by microdissection was not performed. Specimens meeting the inclusion criteria were deparaffinized with xylene and washed with ethanol before proceeding for nucleic acid extraction. DNA and RNA were extracted sequentially from the tissue sections using the RecoverAll™ Total Nucleic Acid Isolation Kit for FFPE (Thermo Fisher Scientific, Waltham, MA, USA) using a modified protocol. Briefly, the deparaffinized tissue was digested in protease at 55 °C for 1 h, followed by 90 °C for 1 h. The digested sample was then loaded onto a filter cartridge where DNA was bound to the filter column and RNA was collected from the flowthrough. RNA isolation was subsequently carried out using the appropriate filter column. After a series of washing steps, the DNA or RNA bound on the respective filter columns was eluted with nuclease free water, and quantitation was performed using Qubit Fluorometer (Thermo Fisher Scientific, Waltham, MA, USA).
2.4. Pre-NGS Assessment of EGFR Mutation Status
In the Nexus 1 cohort, the EGFR mutation status was characterized and validated with the real-time PCR commercial assay Cobas® EGFR Mutation Test (Roche). RT-PCR was performed using DNA extracts, according to the manufacturer’s instructions.
2.5. Next Generation Sequencing
2.5.1. Nexus 1
Samples received from October 2019 to December 2019 (n = 100): DNA was sequenced using the Ion AmpliSeq Colon and Lung Cancer Research Panel v2 (Thermo Fisher Scientific, Waltham, MA, USA) and RNA was sequenced using the Ion AmpliSeq RNA Fusion Lung Cancer Research Panel (Thermo Fisher Scientific, Waltham, MA, USA). Samples received from January 2020 to April 2020 (n = 56): DNA was sequenced using the Ion AmpliSeq Colon and Lung Cancer Research Panel v2 and RNA was sequenced using the Oncomine Focus Assay (Thermo Fisher Scientific, Waltham, MA, USA). The Ion AmpliSeq Colon and Lung Cancer Research Panel v2 combined with the Ion AmpliSeq RNA Fusion Lung Cancer Research Panel allows for the analysis of targeted regions in 22 genes, and over 70 fusion transcripts relevant for lung cancer research. The Oncomine Focus Assay (RNA) enables the detection of fusions in 23 genes relevant for solid tumors.
For the Ion AmpliSeq Colon and Lung Cancer Research Panel v2 combined with the Ion AmpliSeq RNA Fusion Lung Cancer Research Panel, libraries were generated using 10 ng of DNA and 10 ng RNA, according to manufacturer’s instructions. The final libraries were quantified by qPCR with the Ion Library TaqMan® Quantitation Kit (Thermo Fisher Scientific, Waltham, MA, USA) and used for template preparation performed using the Ion Chef (Thermo Fisher Scientific, Waltham, MA, USA). Loaded 520 chips were sequenced on the Ion GeneStudio S5 System (Thermo Fisher Scientific, Waltham, MA, USA). Data sequencing analysis was performed with the Ion Reporter software version 5.10 (Thermo Fisher Scientific, Waltham, MA, USA), and the Oncomine Reporter (Thermo Fisher Scientific, Waltham, MA, USA).
For the RNA portion of the Oncomine Focus Assay, library preparation, comprising reverse transcription, amplification and ligation steps was performed according to manufacturer’s instructions. The RNA input per sample was 10 ng as recommend by the protocol. Libraries were multiplexed for sequencing on an Ion GeneStudio S5 System (Thermo Fisher Scientific, Waltham, MA, USA) using 520 chips. Post sequencing analysis was performed with the Ion Reporter software version 5.10 and the Oncomine Reporter.
2.5.2. Nexus 2–3
Samples received from November 2020 to August 2021: DNA and RNA were sequenced using the Oncomine Precision Assay GX (Thermo Fisher Scientific, Waltham, MA, USA), designed to analyze mutations, copy number variants and fusion variants across 50 key genes. Sequencing was performed on the Ion Torrent Genexus System (Thermo Fisher Scientific, Waltham, MA, USA). The Oncomine Precision Assay, combined with the Ion Torrent Genexus System, is a fully automated system. The Oncomine Precision Assay GX was used for library preparation, as per manufacturer’s instructions, using a total input of 60 ng DNA and 60 ng RNA per sample, respectively. The analysis was performed using the Genexus software version 6.2 (Thermo Fisher Scientific, Waltham, MA, USA). The Torrent Browser from the Torrent Suite software version 6.2.1 (Thermo Fisher Scientific, Waltham, MA, USA) was used to perform initial QC, including chip loading density, median read length and number of mapped reads.
Variants which passed the threshold were reported for Nexus 1–3 cohorts: Allelic frequency (AF) ≥5%, variant read depth ≥ 800X, RNA molecular read count ≥150). Borderline variants were validated using orthogonal methods where available.
2.5.3. Turnaround Time (TAT)
TAT was calculated from the day the tissue block or slides were received at the Molecular Diagnostic Laboratory SJMC, and the number of working days taken before the NGS results were validated and the report released.
2.5.4. Statistical Analysis and Data Visualization
Statistical analysis was performed using GraphPad Prism version 9.3.0 (GraphPad Software LLC, San Diego, CA, USA) and IBM SPSS Statistics for Macintosh, Version 27.0 (IBM Corp, Armonk, NY, USA). Differences between patients’ demographic and clinical characteristics were assessed using a Pearson’s Chi-square test or exact Fisher’s test for categorical variables. An independent samples t-test or Mann–Whitney test were used for continuous variables, with equality of variances tested using Lavene’s test. A p-value < 0.05 was considered statistically significant.
Mutation profile figures (Figure 1A,B) and
EGFR mutation maps (Figure 3A,B) were obtained using the OncoPrinter and MutationMapper data visualization tools available at the cBioPortal for Cancer Genomics platform [
19,
20] (
https://www.cbioportal.org/visualize, accessed on 5 January 2022). To graphically represent the mutation profiles, seven genetic alteration categories were considered: single nucleotide variant (SNV), copy number variant (CNV), indel (insertion or deletion of one or more nucleotides), gene fusion, other (including
MET exon 14 skipping mutations), no classification (alteration not specified) and no alteration detected. The mutation profile figures were built considering the patients’ smoking status, tumor histology and tumor stage. The
EGFR mutation maps display the mutations on a linear protein and its domains, and the number of mutations identified in each cohort.
3. Results
3.1. Clinical Characteristics of Tested Lung Cancer Patients
This cohort included 469 lung cancer patients diagnosed at medical centers and hospitals in Malaysia (
Figure S1; Table S1). The tumor tissue biopsies were all sequenced at the SJMC, during two different phases of the study: Nexus 1 and Nexus 2–3, including
n = 156 and
n = 313 samples, respectively. The demographic and clinical characteristics of the study cohorts are summarised in
Table 1. Nexus 1 and Nexus 2–3 presented similar age (
p = 0.308) and sex distribution (
p = 0.095). The majority of patients were of Chinese origin, both in Nexus 1 (62.2%) and Nexus 2–3 (78.3%), followed by Malay patients (Nexus 1, 23.1% and Nexus 2–3, 13.7%).
In terms of smoking habits among patients with available smoking status in Nexus 1 and Nexus 2–3, almost half of the patients never smoked (47.4% and 42.2%, respectively); in both cohorts, the majority of current smokers combined with former smokers were male patients (84.2% and 71.0%, respectively,
Table S2). For Nexus 1 and 2–3, of patients whose clinical information was available, approximately 99% of all tumors were NSCLC, predominantly of the adenocarcinoma subtype, diagnosed mostly at stage III and IV in both cohorts (Nexus 1 = 95.9%; Nexus 2–3 = 97.0%). The majority of biopsies were performed by core-needle and collected from the lung.
3.2. Mutation Profile Generated by NGS
The spectrum of observed gene variants in the Nexus 1 and Nexus 2–3 cohorts is represented in
Figure 1A,B, respectively. The mutation profiles show the frequency of mutated genes and the genetic alterations detected by NGS. In Nexus 1, 19 genes were identified as having one or more mutations, and is listed here in descending order of frequency (and then alphabetical order):
TP53,
EGFR,
KRAS,
STK11,
PIK3CA,
CTNNB1,
ERBB2,
ROS1,
SMAD4,
ALK,
BRAF,
MET,
DDR2,
FGFR3,
ERBB4,
FBXW7,
NRAS,
PTEN and
RET. The five most frequently mutated genes were
TP53 (
n = 80, 51%),
EGFR (
n = 70, 45%),
KRAS (
n = 26, 17%), STK11 (
n = 23, 15%) and
PIK3CA (
n = 13, 8%). In Nexus 1,
KRAS actionable variant p.G12C was detected in seven (4.5%) patient samples, constituting 26.9% of all samples with
KRAS aberrations. One of the p.G12C patients had a concomitant
STK11 mutation. Ten genes presented mutations with a frequency below 2%. No mutations were detected in 10 (6.4%) patients.
In Nexus 2–3, 21 genes were reported as having one or more mutations, listed here as described above: EGFR, TP53, KRAS, MET, ERBB2, PIK3CA, ALK, FGFR1, ERBB3, CDKN2A, ROS1, FGFR3, CTNNB1, BRAF, PDL1, RAF1, RET, AR, AKT1, GNAS and NUTM1. The five most frequently mutated genes were EGFR (n = 148, 47%), TP53 (n = 96, 31%), KRAS (n = 41, 13%), MET (n = 29, 9%) and ERBB2 (n = 25, 8%). For Nexus 2–3, the KRAS p.G12C variant was found in nine (2.9%) of patient samples, accounting for 22% of samples with KRAS aberrations. The STK11 gene was not covered by the Nexus 2–3 NGS panel. Ten genes presented mutations with a frequency below 2%, although of these, only three (BRAF, FGFR3 and RET) were common between Nexus 1 and Nexus 2–3. No mutations were detected in 33 (10.6%) patients.
Overall, for the NEXUS 1/2/3 cohorts, the three most frequent mutations were EGFR (n = 218, 46.5%), TP53 (n = 176, 37.5%) and KRAS (n = 67, 14.3%). Actionable mutations or variants with approved drug targets for lung cancer were detected in 298 out of 469 (63.5%) patient samples from NEXUS 1/2/3.
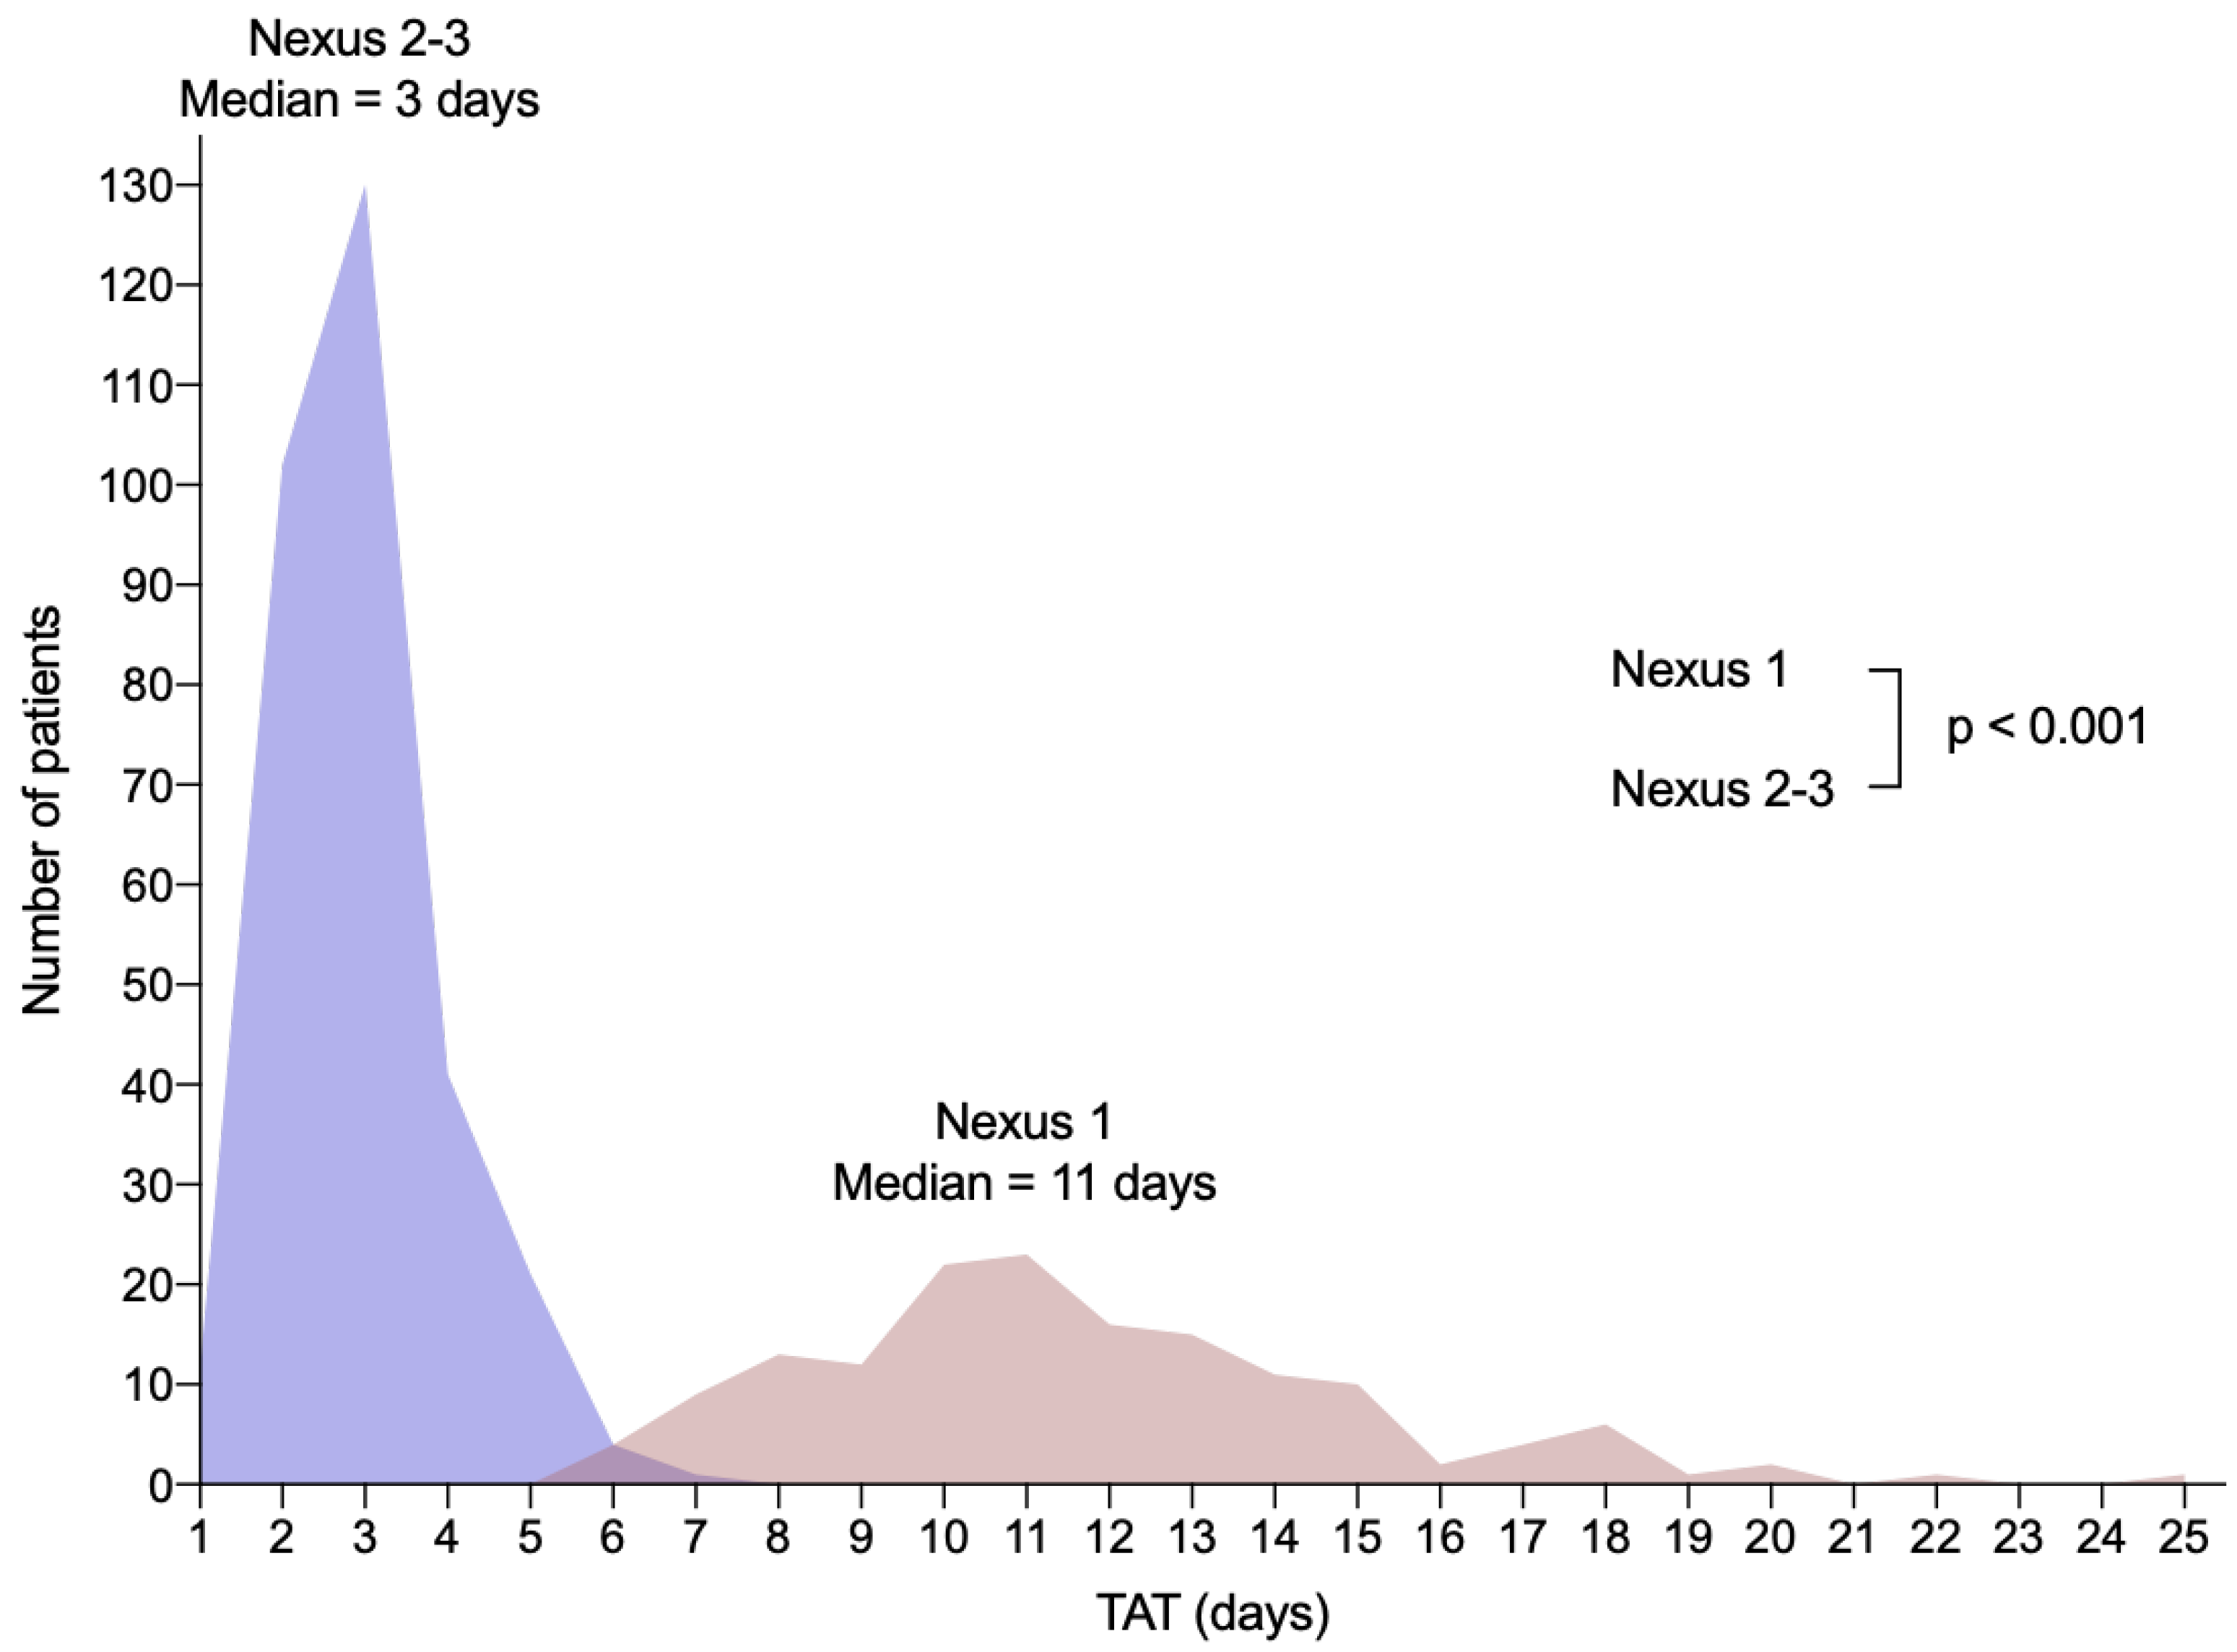
The median TAT in Nexus 2–3 was 3 working days (range 1–7 days), significantly lower than the median of 11 working days (range 6–25 days) in Nexus 1 (
p < 0.001,
Figure 2). In Nexus 2–3, 78.5% of the samples were processed in 1–3 working days.
3.3. EGFR Mutation Profile
EGFR mutations were present in 44.8% of the Nexus 1 cohort and 47.3% of the Nexus 2-3 cohort (
Figure 1A,B). All
EGFR mutations have been identified in sites corresponding to the tyrosine kinase domain of
EGFR, except one mutation in Nexus 2–3, which was identified in the growth factor receptor domain IV (p.G598 V) and five mutations in the exon 18 region upstream of the tyrosine kinase domain (p.E709 A/K/V site) (
Figure 3A,B;
Table S2). In both cohorts, the most common mutations were deletions in exon 19 [Nexus 1 = 28/156 (17.9%), Nexus 2–3 = 69/313 (22.0%)] and the
EGFR variant in exon 21, p.L858R [Nexus 1 = 33 (21.2%), Nexus 2–3 = 51 (16.3%)]. The remaining
EGFR mutations were detected at low frequencies, both in Nexus 1 (0.6–3.2%) and Nexus 2–3 (0.3–1.9%) (
Table S3).
EGFR exon 20 insertion was detected in five (3.2%) patients from Nexus 1 and 3 (1.0%) patients in Nexus 2–3. In nine patients of Nexus 1 (5.8%) and in 19 patients (6.1%) of Nexus 2–3, two concomitant
EGFR mutations were detected. In Nexus 2–3, in two patients (0.6%),three concomitant
EGFR mutations were detected. Overall for the NEXUS 1/2/3 cohorts, the most common concomitant mutations with
EGFR were aberrations in the
TP53 (38.1%),
PIK3CA (6.9%),
MET (6.4%) and
CTNNB1 (4.1%) genes.
In the subset of patients that received first-line therapy (Nexus 1,
n = 6; Nexus 2–3,
n = 33), the frequency of
EGFR mutations was 100% in Nexus 1 and 87.8% in Nexus 2–3 (
n = 29) (
Figures S2A,B and S3A,B and Table S3). As in the complete cohorts, the most common mutations were deletions in exon 19 [Nexus 1 = 4 (66.7%), Nexus 2–3 = 12 (36.4%)] and the p.L858R variant [Nexus 1 = 2 (33.3%), Nexus 2–3 = 12 (36.4%)]. At a high frequency, the resistance variants p.T790M were also detected in five patients (50.0%) of Nexus 1 and four patients (12.1%) of Nexus 2–3, and p.C797S was detected in five patients (15.2%) of Nexus 2–3.
3.4. RET and MET Alterations
Concerning
RET alterations, the
KIF5B-RET gene fusions have been detected, namely one in Nexus 1 and two in Nexus 2–3. Three
MET exon 14 skipping mutations were identified in Nexus 1 (1.9%) and 12 were identified in Nexus 2–3 (3.8%). Specifically, in Nexus 2–3, there were 17 samples (5.4%) with
MET amplification; additionally, two SNVs and one frameshift mutation were identified in
MET. The full
MET and
RET alteration profile is reported in
Table S4.
Sample Rejection and Failed NGS Rates
The sample rejection and failed NGS samples were documented for the NEXUS 2–3 cohort. Samples with than 5 mm2 in size with less than 30% tumour cellularity were rejected (4.7%) and did not proceed for extraction or processing. Samples that failed NGS (1.1%) did not meet the threshold for DNA and RNA mapped read counts and did not have detected variants which could be verified using an orthogonal method. Overall, 5.8% of the samples were rejected or failed the analysis.
4. Discussion
Lung cancer is a major cause of morbidity and mortality in Malaysia [
9,
10]. This study presents the results of patient cohorts from the NEXUS programmes, established to accelerate and support subsidized NGS testing for lung cancer in Malaysia, along with a minor subset of patients not enrolled under the access programmes. In the two phases of the analysis, a total of 469 lung cancer patients have been diagnosed and subsequently profiled with NGS cancer panels. In the first phase, Nexus 1, sequencing encompassed the utilization of two distinct NGS panels and the Ion GeneStudio S5 System for a cohort of 156 patients. In the second phase, Nexus 2–3, a mid-size targeted panel with clinically relevant biomarkers content combined with the Ion Torrent Genexus System, was used to profile 313 patients. Taken together, this large cohort of patient samples depicts the real-world NGS profiling data obtained from clinical samples.
Notably, there is a significant difference between the distribution of patients’ ethnicity in NEXUS and the general Malaysian population. Both Nexus 1 and Nexus 2–3 displayed an overrepresentation of Chinese patients. This discrepancy may be explained by the two-fold increased incidence of lung cancer among the Chinese versus non-Chinese population in the country [
9]. Equally, a combination of etiological factors such as smoking and genetic susceptibility may be partly responsible for this phenomenon. Likewise, it can also be argued that Chinese patients who reside in Malaysia are mostly living in large cities instead of rural or remote areas and have better access to medical care and healthcare insurance, and thus are more inclined to visit healthcare facilities, enabling diagnosis [
21].
The mutation profiles observed for the most commonly mutated genes in lung cancer globally (e.g.,
EGRF,
KRAS and
TP53) were concordant with those reported for Asian populations [
22,
23,
24] in both Nexus 1 and Nexus 2–3. Nonetheless, a few differences among the two cohorts were observed. Most of the disparities between cohorts can be explained by the different composition of their cases along with the differential gene content of the diverse NGS assays utilized for the study. Notably, the frequency of
MET exon 14 skipping mutations identified in Nexus 2–3 was higher than in Nexus 1. Although this could be explained by the cohort’s composition, it could also be linked to the enhanced ability of the Oncomine Precision Assay in detecting this type of genetic alteration. The number of gene fusions detected in Nexus 2–3 was also higher than in Nexus 1, possibly explained by the cohorts’ composition but also by the FusionSync detection incorporated in the NGS Assay, which enables fusion detection with higher sensitivity and specificity.
Overall, for all cases included in the analysis, actionable genetic variants or rearrangements for
EGFR,
ALK,
KRAS,
ROS1,
BRAF,
MET,
RET or
ERBB2 were detected in 63.5% of the tumour samples. This was comparable to the findings from other genetic profiling studies in lung cancer [
25,
26,
27]. The most common concomitant mutations among patients with
EGFR variants in this analysis cohort was
TP53 (38.1%). Studies have shown that
TP53 mutations are associated with a shorter response to
EGFR TKI although the exact mechanism of
TP53 conferring TKI resistance is still not fully elucidated [
28]. Evidence from in vitro investigations suggests that different
TP53 mutations can distinctly affect the response to
EGFR-TKI. For example, certain mutations are associated with primary resistance to
EGFR-TKIs, and some can modulate epithelial–mesenchymal transition (EMT) to cause acquired resistance [
28]. A total of 39 patients from the analysis cohort had their samples taken and profiled post progression after first-line treatment initiation. Thirty-five of these patients had
EGFR mutations, and the
EGFR-acquired resistance variants, T790M and C797S, were detected in a number of the samples. As the sample size was small, this may not be representative of the exact prevalence of
EGFR resistance mutations in the population of post-TKI progression patients. Additionally, majority of these samples did not have any known resistance mutations detected, and did not have baseline or longitudinal mutational data for comparison. This highlights the importance of mutational profiling and long-term monitoring in patients to better characterize the mechanisms of resistance to TKI.
Among the lung cancer tissue samples processed for NGS, the main challenge was samples with low nucleic acid extracts or sub-optimal RNA quality for sequencing, caused by pre-analytical factors such as small biopsies, insufficient tumour cells or over fixation of tissues. Optimally, samples for NGS analysis should have tumour cellularity of 30% or more, with a tumour tissue size of at least 0.5 cm
2. The sample rejection and failed NGS rates that were documented for the Nexus 2–3 cohort were 4.7% and 1.1%, respectively. This was comparable although slightly lower than the rates reported in a study by Moore et al., (2018) which also evaluated NSCLC NGS diagnostic specimens in a molecular laboratory [
29]. In the Moore et al. study, the sample rejection was 7.8% after histological evaluation and failed NGS was 5.1% [
29]. The 20% tumour fraction rejection cut-off compared to the 30% tumour fraction threshold in this analysis may have contributed to the higher NGS failure reported by Moore et al. It is important to note that the NGS panel and sequencer platform used was different from the current analysis, which could also be factor for the difference observed. Insufficient tumour tissue for analysis remains a challenge even for single sequential testing with PCR, IHC or FISH. For these patients, NGS liquid biopsy may present an option for biomarker testing. NGS testing is also subject to a turnaround time which typically takes 2–4 weeks. Given that the typical lung cancer patient presents late, significantly shortening the time to treatment is desirable. The current analysis presented a significant difference between the molecular profiling TAT for the Nexus 1 and Nexus 2–3 cohorts. The median TAT in Nexus 2–3 was 3 working days, with 78.5% of samples processed and genomic testing reported in 1–3 working days. The faster TAT was due to the use of a fully automated NGS system for the Nexus 2–3 samples. Library preparation for the Nexus 1 cohort was performed manually, which contributed to the longer TAT.

 ,
, 


