Article

The Impact of Exercise Serum on Selected Parameters of CD4+ T Cell Metabolism

1
Department of Exercise Physiology and Sports Therapy, Institute of Sports Science, Justus-Liebig University Giessen, 35394 Giessen, Germany
2
Institute of Animal Nutrition and Nutrition Physiology, Justus-Liebig University Giessen, 35392 Giessen, Germany
3
Regensburg Center for Interventional Immunology (RCI), 93053 Regensburg, Germany
*
Author to whom correspondence should be addressed.
Submission received: 18 May 2021 / Revised: 8 June 2021 / Accepted: 18 June 2021 / Published: 22 June 2021
(This article belongs to the Section Acquired Immunity)

Abstract

:
CD4+ T cells are sensitive to peripheral changes of cytokine levels and metabolic substrates such as glucose and lactate. This study aimed to analyze whether factors released after exercise alter parameters of human T cell metabolism, specifically glycolysis and oxidative phosphorylation. We used primary human CD4+ T cells activated in the presence of autologous serum, which was collected before (CO) and after a 30-min exercise intervention (EX). In the course of activation, cells and supernatants were analyzed for cell viability and diameter, real-time oxygen consumption by using PreSens Technology, mRNA expression of glycolytic enzymes and complexes of the electron transport chain by real-time PCR, glucose, and lactate levels in supernatants, and in vitro differentiation by flow cytometry. EX did not alter T cell phenotype, viability, or on-blast formation. Similarly, no difference between CO and EX were found for CD4+ T cell activation and cellular oxygen consumption. In contrast, higher levels of glucose were found after 48 h activation in EX conditions. T cells activated in autologous exercise serum expressed lower HK1 mRNA and higher IFN-γ receptor 1. We suggest that the exercise protocol used was not sufficient to destabilize the immune metabolism of T cells. Therefore, more intense and prolonged exercise should be used in future studies.

1. Introduction

Obesity, aging, and associated co-morbidities commonly lead to metabolic reprogramming of human cells [1]. It becomes more and more evident that metabolism tightly controls T cell effector function [2]. Therefore, targeting metabolic pathways of T cells is a promising therapeutic intervention [3]. The main focus lies on drugs that inhibit or enhance metabolic pathways to restore cellular homeostasis [4]. However, exercise interventions may be more economically and equally promising. First, exercise is known as an acute metabolic stressor for the human body that counteracts factors leading to metabolic reprogramming [5,6]. For instance, exercise regulates glycolysis by increasing insulin sensitivity and improves glucose control [7]. Second, exercise-induced changes such as increased production of reactive oxygen species or changes of the metabolic environment are also known to modulate immune cell function, in particular those of CD4+ T cell [8,9,10,11].
CD4+ T cells have a remarkable metabolic plasticity using six intertwined metabolic pathways: glycolysis, tricarboxylic acid (TCA) cycle, pentose phosphate pathway, fatty acid oxidation, fatty acid synthesis, and amino acid metabolism [12]. Antigen-activation by major histocompatibility complex-2 class antigens initiates metabolic reprogramming to support biosynthesis of phospholipids, nucleotides, nicotinamide adenine dinucleotide phosphate for proliferation, and provide adenosine triphosphate for energy demand [13,14]. Quiescent human CD4+ T cells increase glycolysis but also oxidative phosphorylation upon activation [15,16,17]. The increase in glycolysis is associated with the upregulation of substrate transporters and transcription factors as well as increased Akt activity [15]. Basal metabolism shifts to glucose metabolism fueling the pentose phosphate pathway, serine biosynthetic pathway, and pyruvate for the TCA by its intermediates and finally T cells can display the Warburg phenotype, converting glucose primarily into lactate. This way a proper proliferation is established [12]. Simultaneously, there is an increase in oxidative phosphorylation and, finally, metabolic reprogramming towards an increased fatty acid synthesis allowing proper T cell polarization [17].
Many studies have examined human peripheral lymphocyte proliferation after acute exercise using non-specific mitogen activation and showing inconsistent findings for different duration of aerobic exercise. A small tendency towards a reduced proliferative function after acute exercise intervention lasting longer duration exercise was found [18]. The question remains if these results account for proportional shifts of T cells within the circulatory system or exercise-induced suppression of certain T cell functions [19]. In contrast, data on the impact of exercise on metabolism of CD4+ T cells is scarce. Only a few studies have analyzed the activation of isolated CD4+ T cells so far. These studies suggest a higher activation status of CD4+ T cells after exercise [20,21]. It is known that many molecules including metabolites are affected by an acute bout of exercise [22] and T cells are sensitive to their microenvironment such as available substrates, e.g., glucose and amino acids [16,23]. To understand the effect of exercise on CD4+ immunometabolism, we need investigations on how CD4+ T cells react to the exercise-induced environment. Perry et al. found higher inflammatory Th17 cell numbers after lymphocyte incubation in exercise serum from trained athletes after a half marathon [24]. In contrast, Dorneles et al. found a higher number of immunosuppressive CD4+/CD25-/CD39+ T cells when incubating lymphocytes with serum after acute exhaustive exercise from obese men [25,26]. However, the metabolic function of CD4+ T cells after activation in the context of exercise remains unknown independent of exercise duration.
Our study aims to close this knowledge gap by studying the metabolic phenotype of CD4+ T cells cultured in autologous sera taken before and after an exercise intervention. The hypothesis of this study was that exercise serum suppresses various parameters of immunometabolism in CD4+ T cell following T cell receptor activation. We expected not just glycolysis and basal oxygen consumption to be reduced, but also a lower viability, reduced on blast-formation, and an altered T cell phenotype.

2. Materials and Methods

2.1. Participants

We recruited five males as cohort 1. All participants were preliminarily screened for health and cardiovascular fitness. Characteristics of these participants were young age (25.3 ± 3.3 years), health, and a normal body mass index (BMI, 22.3 ± 1.9 kg/m2). Their maximal oxygen consumption (VO2max) ranged from 45 to 64.1 mL·kg−1·min−1. The study protocol for cohort 1 was approved by the Ethics Commission of the Medical Chamber of Lower Saxony (Hannover, Germany, Bo/06/2018). For a second study arm, we recruited seven healthy, non-smoking voluntary males as cohort 2. They had a normal BMI (22.6 ± 2.5 kg/m2), were young (23.43 ± 2.0 years), and all passed the medical examination. VO2max ranged from 43.6 to 75 mL/kg/min (55.94 ± 10.4 mL·kg−1·min−1). None of the participants reported taking any performance-enhancing drugs and supplements, despite one participant who reported taking plant-based supplements on a regular basis. To assure no interference with infections throughout the whole study period participants logged their health status as described elsewhere [27]. All participants reported being free of any infection symptoms two weeks before each blood sampling. The study protocol of cohort 2 was approved by the local ethics committee of the University Giessen (Giessen, Germany, No. 2020-0007).

2.2. Exercise Intervention and Blood Sampling

At least one week after the screening, the exercise intervention took place including blood sampling for autologous sera before and after. Participants ran 30 min straight on the treadmill. For the first 25 min, the participants ran at an intensity corresponding to 70% of their VO2max. For the last 5 min, the intensity was increased up to 95% of VO2max to ensure exhaustion. At 10 min before and 10 min after exercise we sampled blood serum from the antecubital vein in a lying position. This protocol was feasible for trained and untrained subjects in our preliminary trials without an early termination due to exhaustion. A total of 30 mL of peripheral blood was collected in serum gel vacutainers (Sarstedt, Nuembrecht, Germany). Sera were processed after 30 min of clotting in an upright position. Vacutainers were then centrifuged at 2000× g for 10 min for serum separation. Serum before (for control condition) and after exercise was stored at −20 °C until further analysis or cell culture experiments. At least one week after, another blood sample was taken after overnight fasting for isolating T cells. For standardization of the blood sampling, participants refrained from caffeine, alcohol, high-intensity exercise within the past 48 h, and exercise in general within the past 24 h. The cohort 1 protocol differed slightly due to different logistics. Running intensity during the intervention was heart-rate guided using similar intensity and duration to perform the cell culture experiments with cells from fresh blood.

2.3. Isolation, Activation, and Cell Culture Experiments

To isolate lymphocytes, fresh peripheral blood was 1:1 diluted by PBS and layered onto Lymphoprep using SepMate 50 mL tubes. After 10 min of centrifugation at 1200× g the upper layer was poured off. Cells were washed and centrifuged for 8 min at 300× g. CD4+ T cells were isolated by magnetic beads via negative selection using EasySep™ magnetic particles following the manufacture’s protocol (all Stemcell Technologies, Vancouver, BC, Canada). Following five minutes of magnetic incubation, the supernatant containing CD4+ T cells was poured off. After washing, cells were resuspended in cell culture media. The culture medium consisted of RPMI 1640 medium with glutamine supplemented by essential and nonessential vitamins, pyruvate, β-mercaptoethanol, penicillin and streptomycin (all Gibco, Fisher Scientific™, Waltham, MA, USA), and 100 IU/mL recombinant human Interleukin-2 (IL-2, Immunotools, Friesoythe, Germany). Serum samples were thawed, and we seeded 106 cells/mL per well in cell culture medium 1:1 mixed with either serum before (control condition, CO) or serum after exercise (exercise condition, EX) from the same donor. We activated cells with anti-CD3/anti-CD28 tetramers (Stemcell Technologies, Vancouver, BC, Canada). Cells were cultured for 48 h at 37 °C, 5% CO2, and 95% humidity (ICOmed incubator, Memmert, Germany). Methods of cohort 1 were slightly different: Isolation was done by common density gradient centrifugation using Biocoll (Merck, Darmstadt, Germany), incubation lasted 72 h using a different cell culture hood (Midi 40, Thermo Fisher Scientific™, Waltham, MA, USA), RPMI1640 media with stable glutamine from a different manufacturer was used (Cellpure, Roth, Karlsruhe, Germany), and cells from the same donor cultured in pure medium without any stimulation (quiescent cells) were seeded.

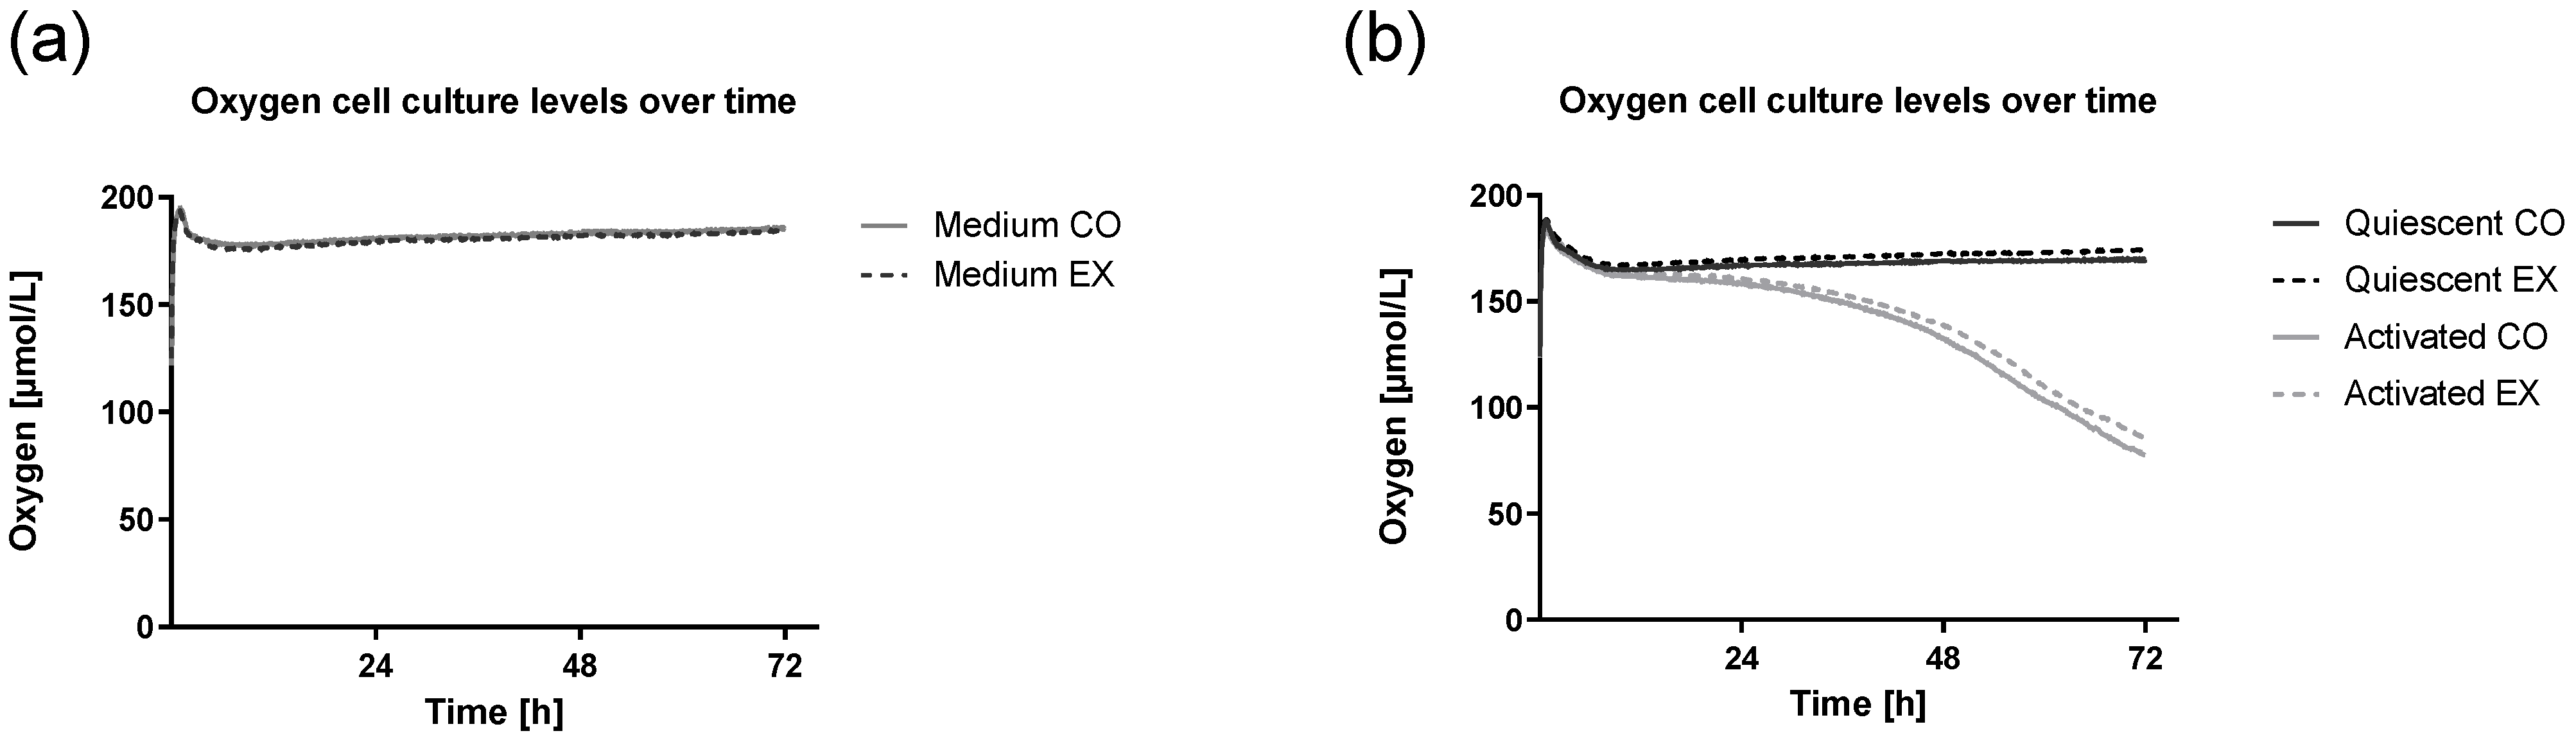
2.4. Real-Time Measurement of Oxygen Concentration

Real-time measurement of oxygen concentration was performed using the PreSens Technology (PreSens Precision Sensing GmbH, Regensburg, Germany) as described elsewhere [16]. We performed this analysis for cohort 1 over 72 h and for cohort 2 over 48 h. In more detail, cells were seeded onto OD24-plates and placed onto the Presens sensor dish reader (SDR v4, PreSens Precision Sensing GmbH, Regensburg, Germany) for the cell culture duration. The oxygen concentration in the culture medium was measured via oxygen sensors at the bottom of the 24-well plate. Data were collected every two minutes.

2.5. Analysis of Initial Cell Culture Condition and Supernatants

Supernatants from 48 h cultures (t48), were frozen and stored at −20 °C for later analysis. To analyze cell culture conditions before and after the experiments, the supernatants, as well as the aliquoted sera, were thawed and analyzed for glucose and lactate concentrations using enzymatic-amperometric sensor technology (BioSen C-line, EKF-diagnostic, Barleben, Germany). The concentration of glucose before the experiments was calculated taking into consideration that serum and cell culture medium were mixed 1:1. Cytokine concentration of TNF-α, IL-1β, IL-2, IL-4, IL-5, IL-6, IL-10, IL-13, IL-17A, IL21, IL-23, IL-27, and soluble receptor Interferon-γ Receptor 1 (IFN-γ R1) were determined by commercially available human 13-plex enzyme-linked immunosorbent assays (Human Magnetic Luminex Assay, Bio-techne Ltd., Abbingdon, Oxon, UK) in all serum supernatants at t48 and IFN-γ-R1 at t0 and t48. For analysis, we used the Luminex MAGPIX System (Luminex Corporation, Austin, TX, USA) and followed the manufacturer’s instructions.

2.6. RNA Extraction and Real-Time Reverse Transcription PCR

Immediately after cell culture at t48 and t72, CD4+ T cells were counted and centrifuged. For cohort 2, a pellet of 2 × 10⁶ cells was frozen until further analysis at −80 °C. Total RNA was isolated from CD4+ T cells using TRIzol reagent (Invitrogen, Karlsruhe, Germany) according to the manufacturer’s protocol and subsequently analyzed for quantity and quality using an Infinite 200 M microplate reader equipped with a NanoQuant plate (both from Tecan, Mainz, Germany). The cDNA was synthesized as described recently in detail [28]. The qPCR analysis of target and reference genes was carried out with a Rotor-Gene Q system (Qiagen, Hilden, Germany) using gene-specific primer pairs from Eurofins MWG Operon (Ebersberg, Germany) as described recently in detail [28]. Characteristics of primers for target (HK1, LDHA, ATP5J, COX4I1, NDUFA12, IDH1, ODGH, FOXP3, RPS6KB1, PRKAA1) and reference genes (SDHA, YWHAZ, ATP5B) designed using Primer3 and Basic Local Alignment Search Tool (BLAST) are shown in Table 1. All primer pairs were designed to span an exon–exon junction. Normalization of real-time PCR data was carried out by calculating a normalization factor based on geometric averaging of the three reference genes according to Vandesompele et al. [29]. The mean of the control condition cells was set to 1, and the mean and SEM of the treated cells were scaled proportionally.

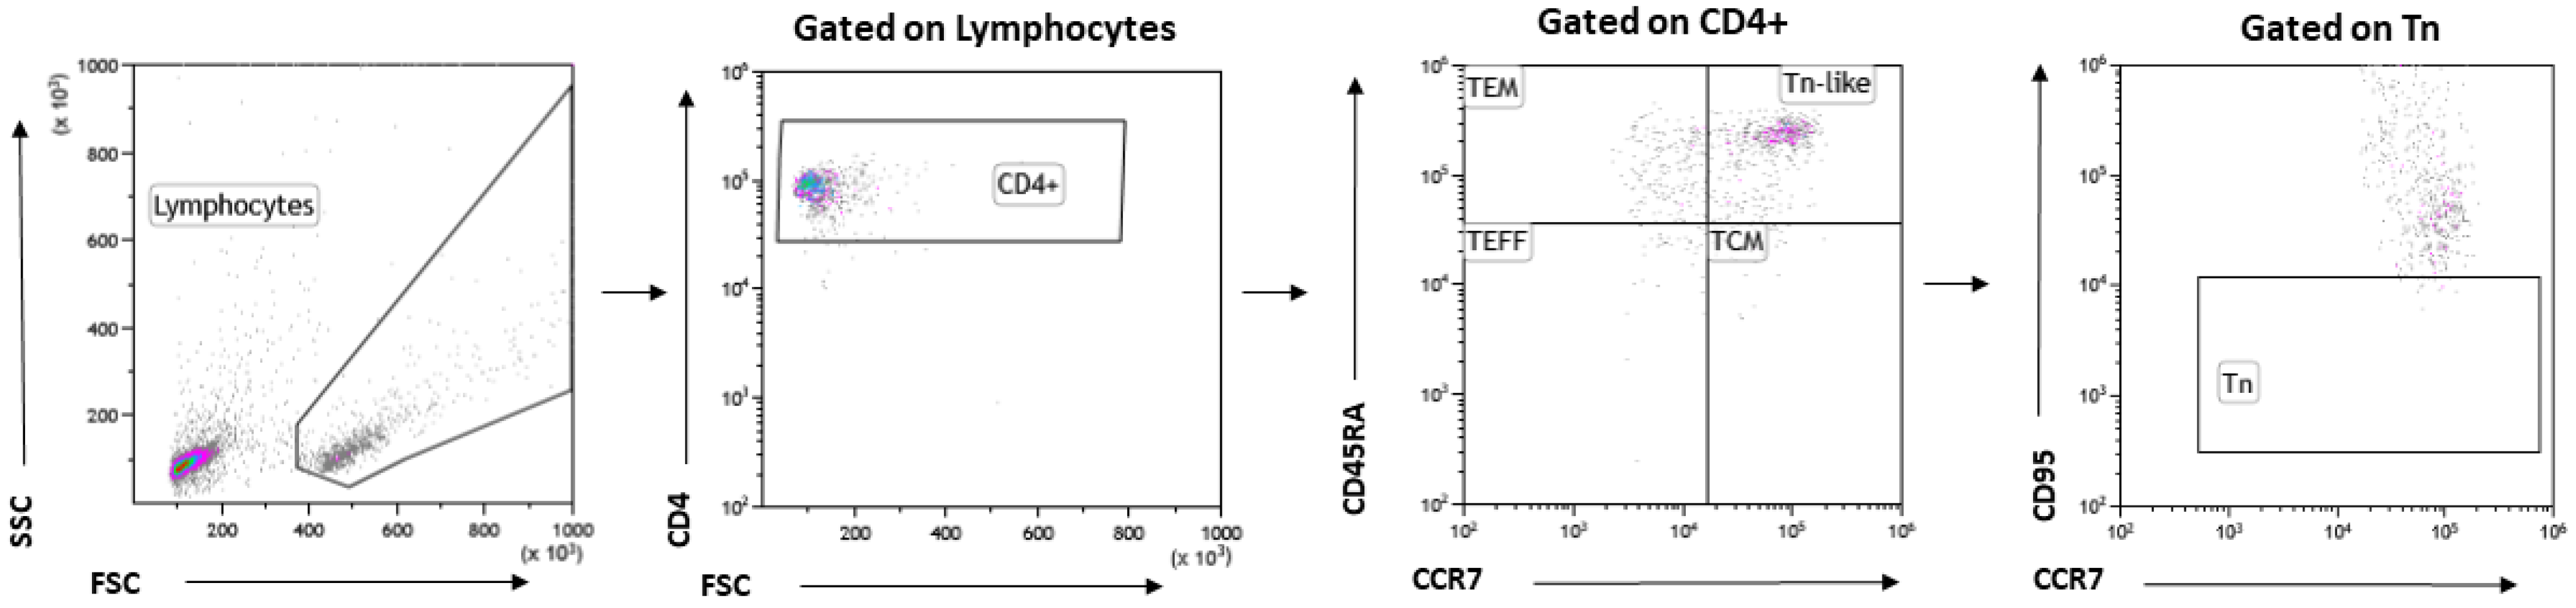
2.7. Cell Phenotyping by Flow Cytometry

After t48, 106 cells were centrifuged and resuspended with 1ml freezing medium (Bambanker, Nippon Genetics Europe, Dueren, Germany), and frozen at −80 °C for further analysis. To analyze T cell subsets, cells were thawed and prepared for evaluation by flow cytometry. Phenotyping included a live/dead-staining using Zombie aqua and measurement of purity of CD4+ cells (CD4+/alive of all lymphocytes). Briefly, cells were stained with monoclonal antibodies (all anti-human) for T cell subsets, 20% of the cells remained unstained, and 20% were stained as fluorescence minus CD95 of T cell subsets. Antibodies and vendors used are listed in Table 2. 10,000 events were acquired by 488 nm, 638 nm, and 408 nm lasers (Cytoflex, Beckman Coulter, Germany). To identify T cell subsets, naïve (CD4+/alive/CD45RA+/CCR7+/CD95−), central memory (CD4+/alive/CD45RA−/CCR7+/CD95+), effector memory (CD4+/alive/CD45RA−/CCR7−/CD95+), and stem memory T cells (CD4+/alive/CD45RA+/CCR7+/CD95+) CD4+ T cells were gated and proportions quantified using the Kaluza software (Beckman Coulter, Krefeld, Germany). A fluorescence minus one for CD95 was used to increase accuracy for gaiting naïve and stem memory T cells. We followed the flow cytometry guidelines of Mousset et al. for T cell subset differentiation [30]. The gating strategy is shown in Figure 1. The antibodies used are listed in Table 2.

2.8. Cell Count and Cell Growth

Cell number, viability, and diameter of isolated CD4+ T cells were measured before and after cell culture by CASY® Cell Counter via electric current exclusion method (OLS Omni Life Science, Bremen, Germany). Cell viability after cell culture was then calculated using the formula: Viability = (100 − viability before culture) + viability after cell culture.
Total cell count and viability of the preliminary experiments were counted using a two-chambered Neubauer hemocytometer and trypan blue dye for the exclusion of dead cells.

2.9. Statistical Analysis

Normality was tested using the Shapiro–Wilk test. We commonly determined significance by one-way ANOVA followed by Bonferroni posthoc comparison or mixed-effect analysis with Geisser–Greenhouse correction followed by multiple comparisons, except for supernatant and viability data. For all soluble factors, the Student’s t-test paired was used. Effects of activation (t0 and t48) and exercise serum (Control × Exercise) were analyzed for IFN-γR1, glucose, and lactate using a two-way ANOVA and Bonferroni posthoc comparison. Statistics and the visualization of data were done by using GraphPad Prism version 8 (San Diego, CA, USA). The significance level was set at p < 0.05.

3. Results

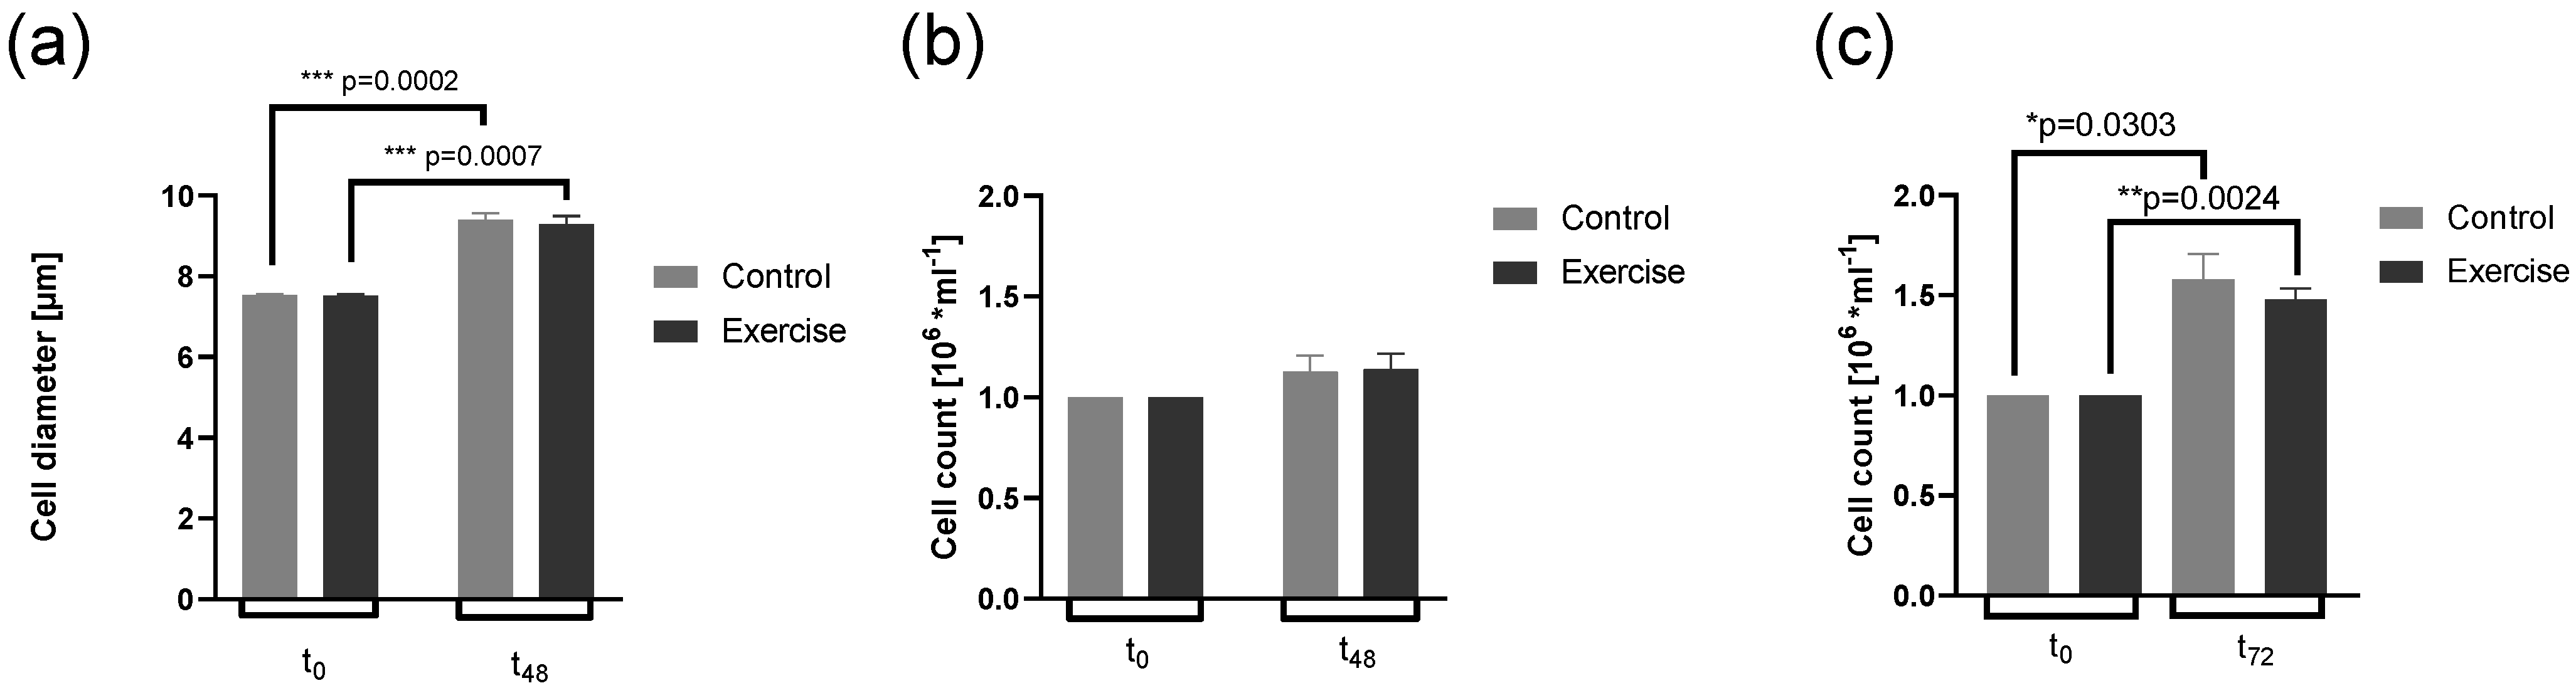
3.1. Cell Growth and Cell Counts Are Not Altered by Exercise Serum

First, we analyzed cell parameters before and after culture. Cell viability after cell culture was high (>95%) and not significantly different between control (CO) serum and exercise (EX) serum culture in all experimental conditions (data not shown). Cell diameter was increased at 48 h after activation (t48) compared to the untreated condition (t0), whereas cell diameter was not significantly different between the CO and EX groups at each time point (Figure 2a). Cell count did not vary between conditions, neither at t48 after activation of CD4+ T cells (p = 0.14) nor at 72 h after activation (t72, p = 0.14) (Figure 2b,c).

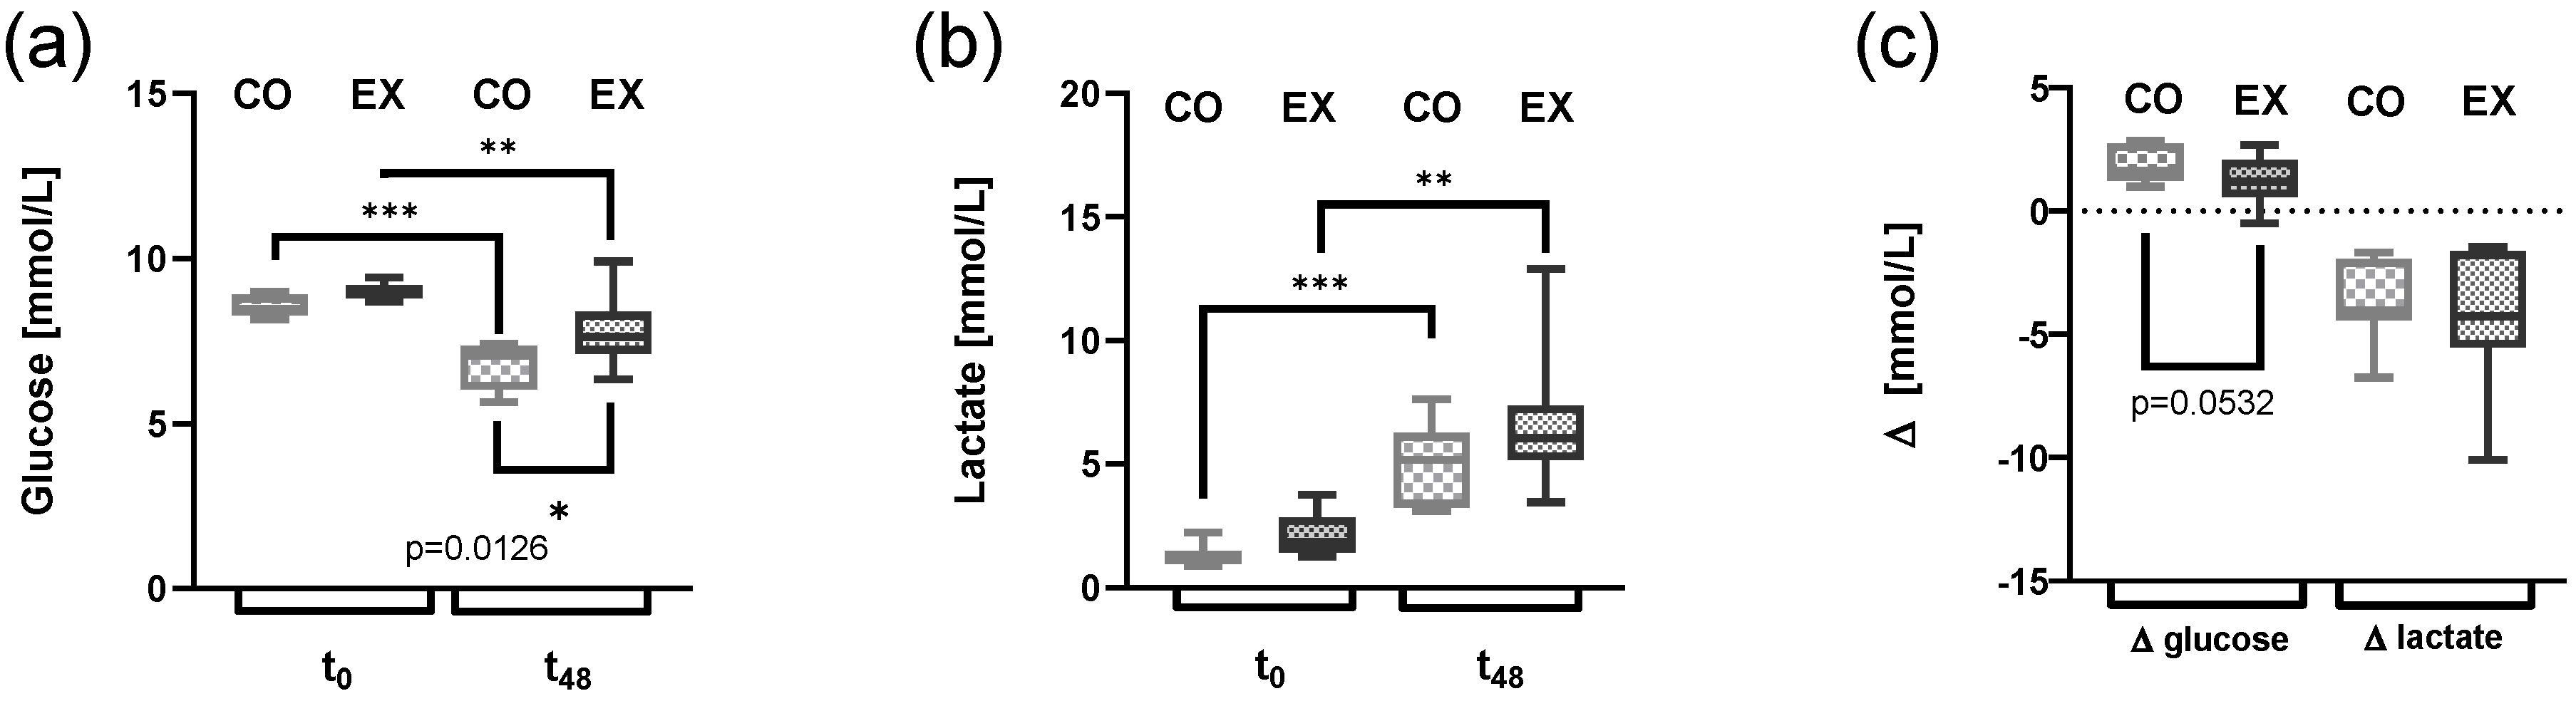
3.2. Glucose Consumption Is Altered by Exercise Serum

Solely looking at t0, we observed a trend for higher lactate levels (p = 0.061) and glucose levels (p = 0.073) in EX serum compared to CO serum. Lactate levels were at 1.4 ± 0.17 mmol/l in CO serum compared to 2.1 ± 0.33 mmol/L in EX serum. Glucose levels were at 8.5 ± 0.12 mmol/L at CO serum compared to 9.0 ± 0.092 mmol/L in EX serum. Beyond 48 h of culture, glucose levels significantly decreased, while lactate levels increased independent of the condition (Figure 3a,b). A significant difference between culture conditions was found at t48, glucose levels were significantly higher at t48 in EX serum (Figure 3a). However, the net change of glucose and lactate over the culture time was not statistically different, we only observed a trend (t-test, p = 0.053) for a higher reduction in glucose in EX serum (Figure 3c).

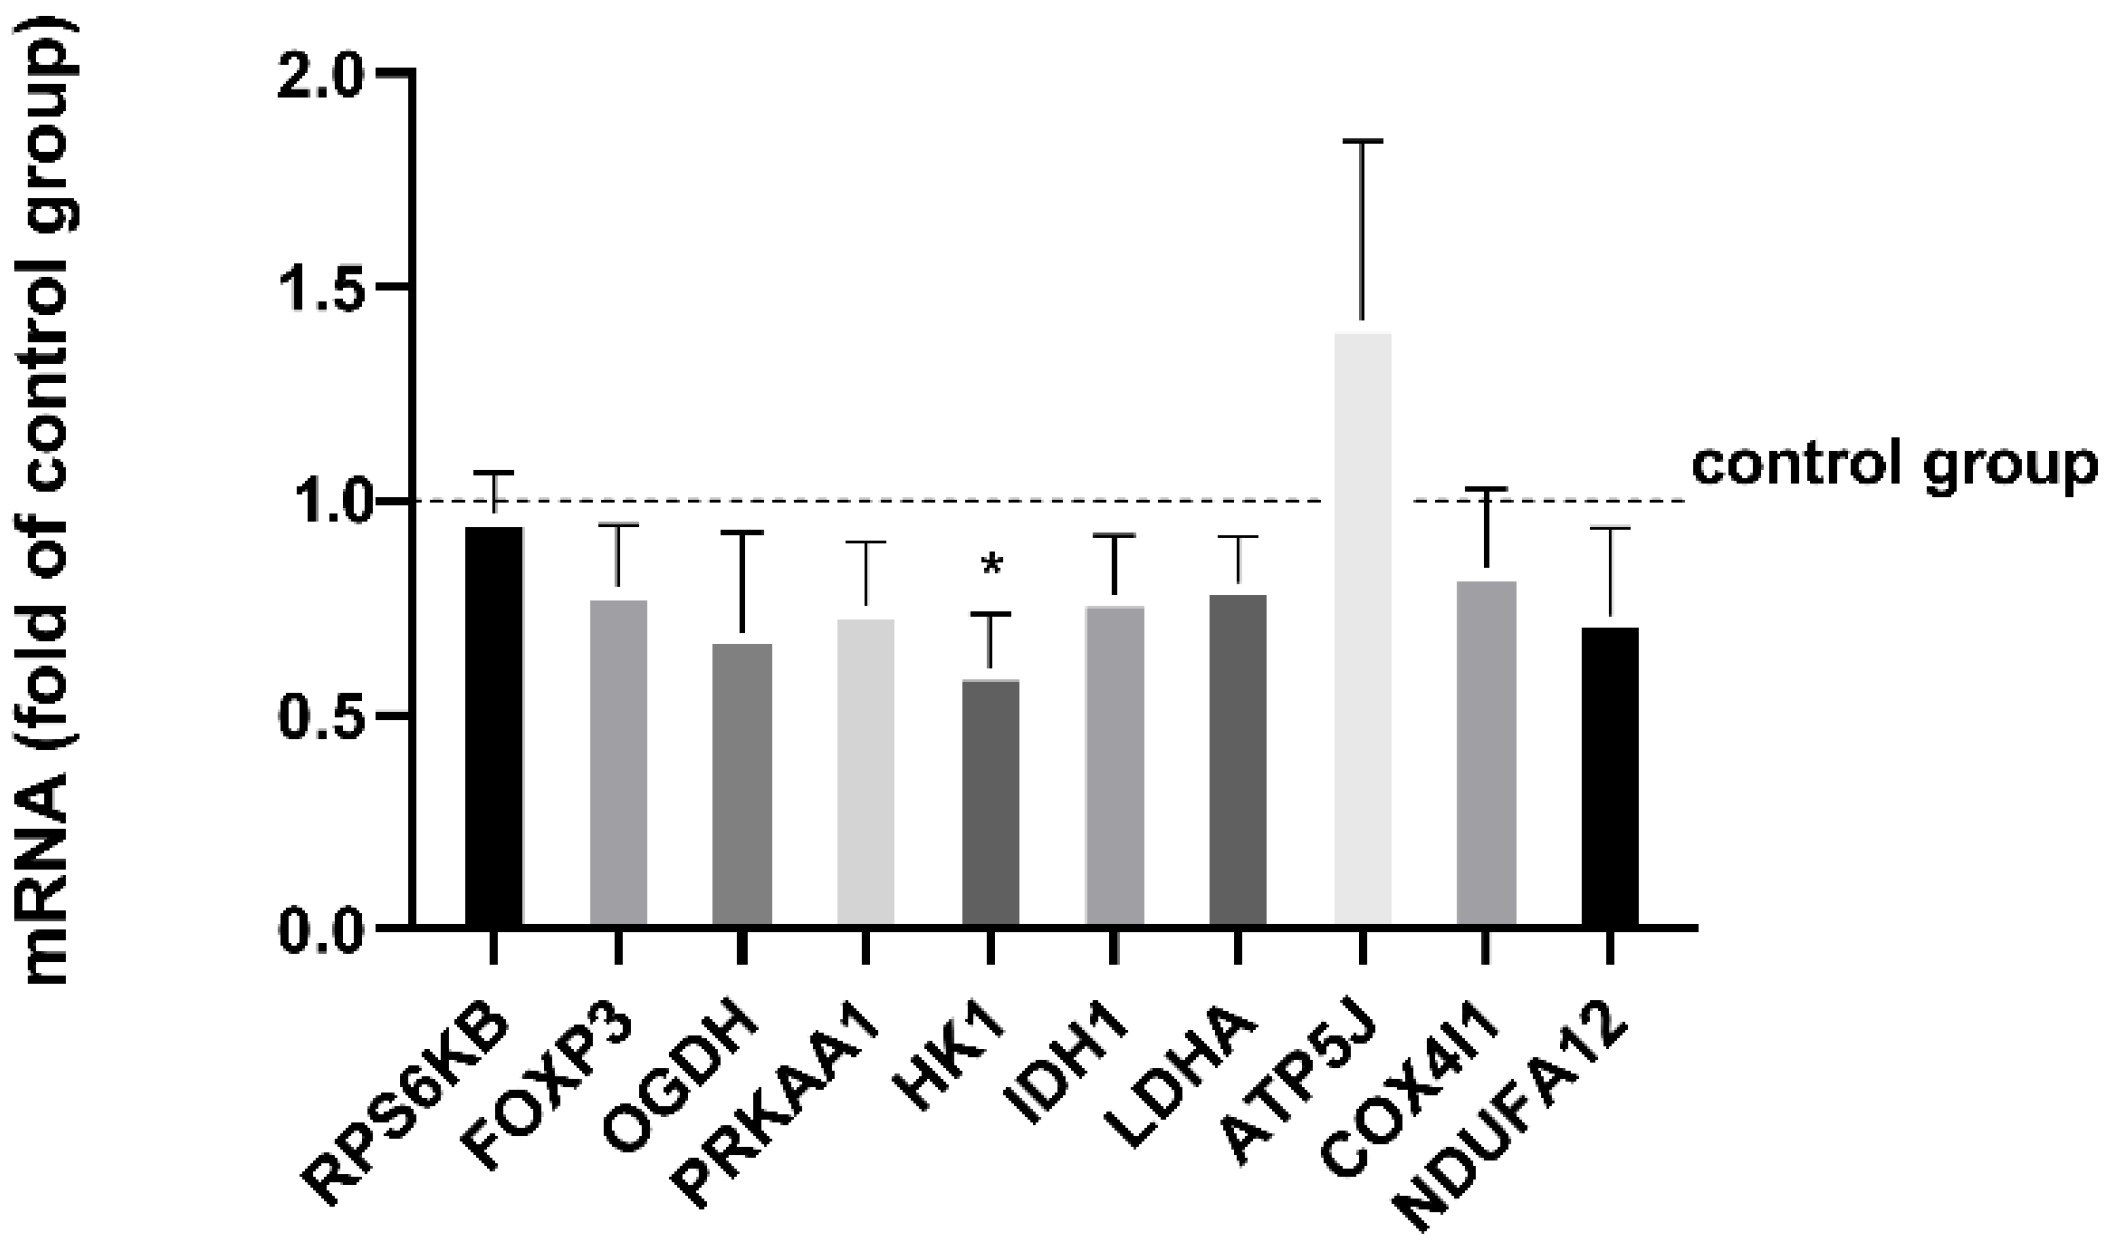
3.3. mRNA Expression of HK1 Is Reduced by Exercise Serum

Normalized mRNA levels of HK1 were significantly reduced after cell culture in EX compared to CO (p = 0.033). All other mRNA levels were not significantly affected by exercise serum, neither those encoding proteins of the electron transport chain (ATP5J, p = 0.48; COX4I1, p = 0.40; NDUFA12, p = 0.20), lactate dehydrogenase (LADH, p = 0.16) nor enzymes involved in the citric acid cycle (IDH1, p = 0.19; ODGH, p = 0.12) (Figure 4), activation marker FOXP3 (p = 0.19), ribosomal protein S6 kinase downstream the mammalian target of rapamycin mTOR (RPS6KB, p = 0.81), or 5′ AMP-activated protein kinase catalytic subunit alpha-2 of 5′ AMP-activated protein kinase (PRKAA, p = 0.21). The fold change of the control group is displayed in Figure 4.

3.4. Cell Culture Oxygen Levels Following Activation Are Not Altered by Exercise Serum

We found no significant difference between CO and EX cell culture conditions 24 h, 48 h, or 72 h after activation with regard to oxygen consumption independent of the culture condition (Figure 5). Over time, the oxygen level of culture with quiescent CD4+ T cells remained stable. Shortly after activation, oxygen levels were continuously reduced.

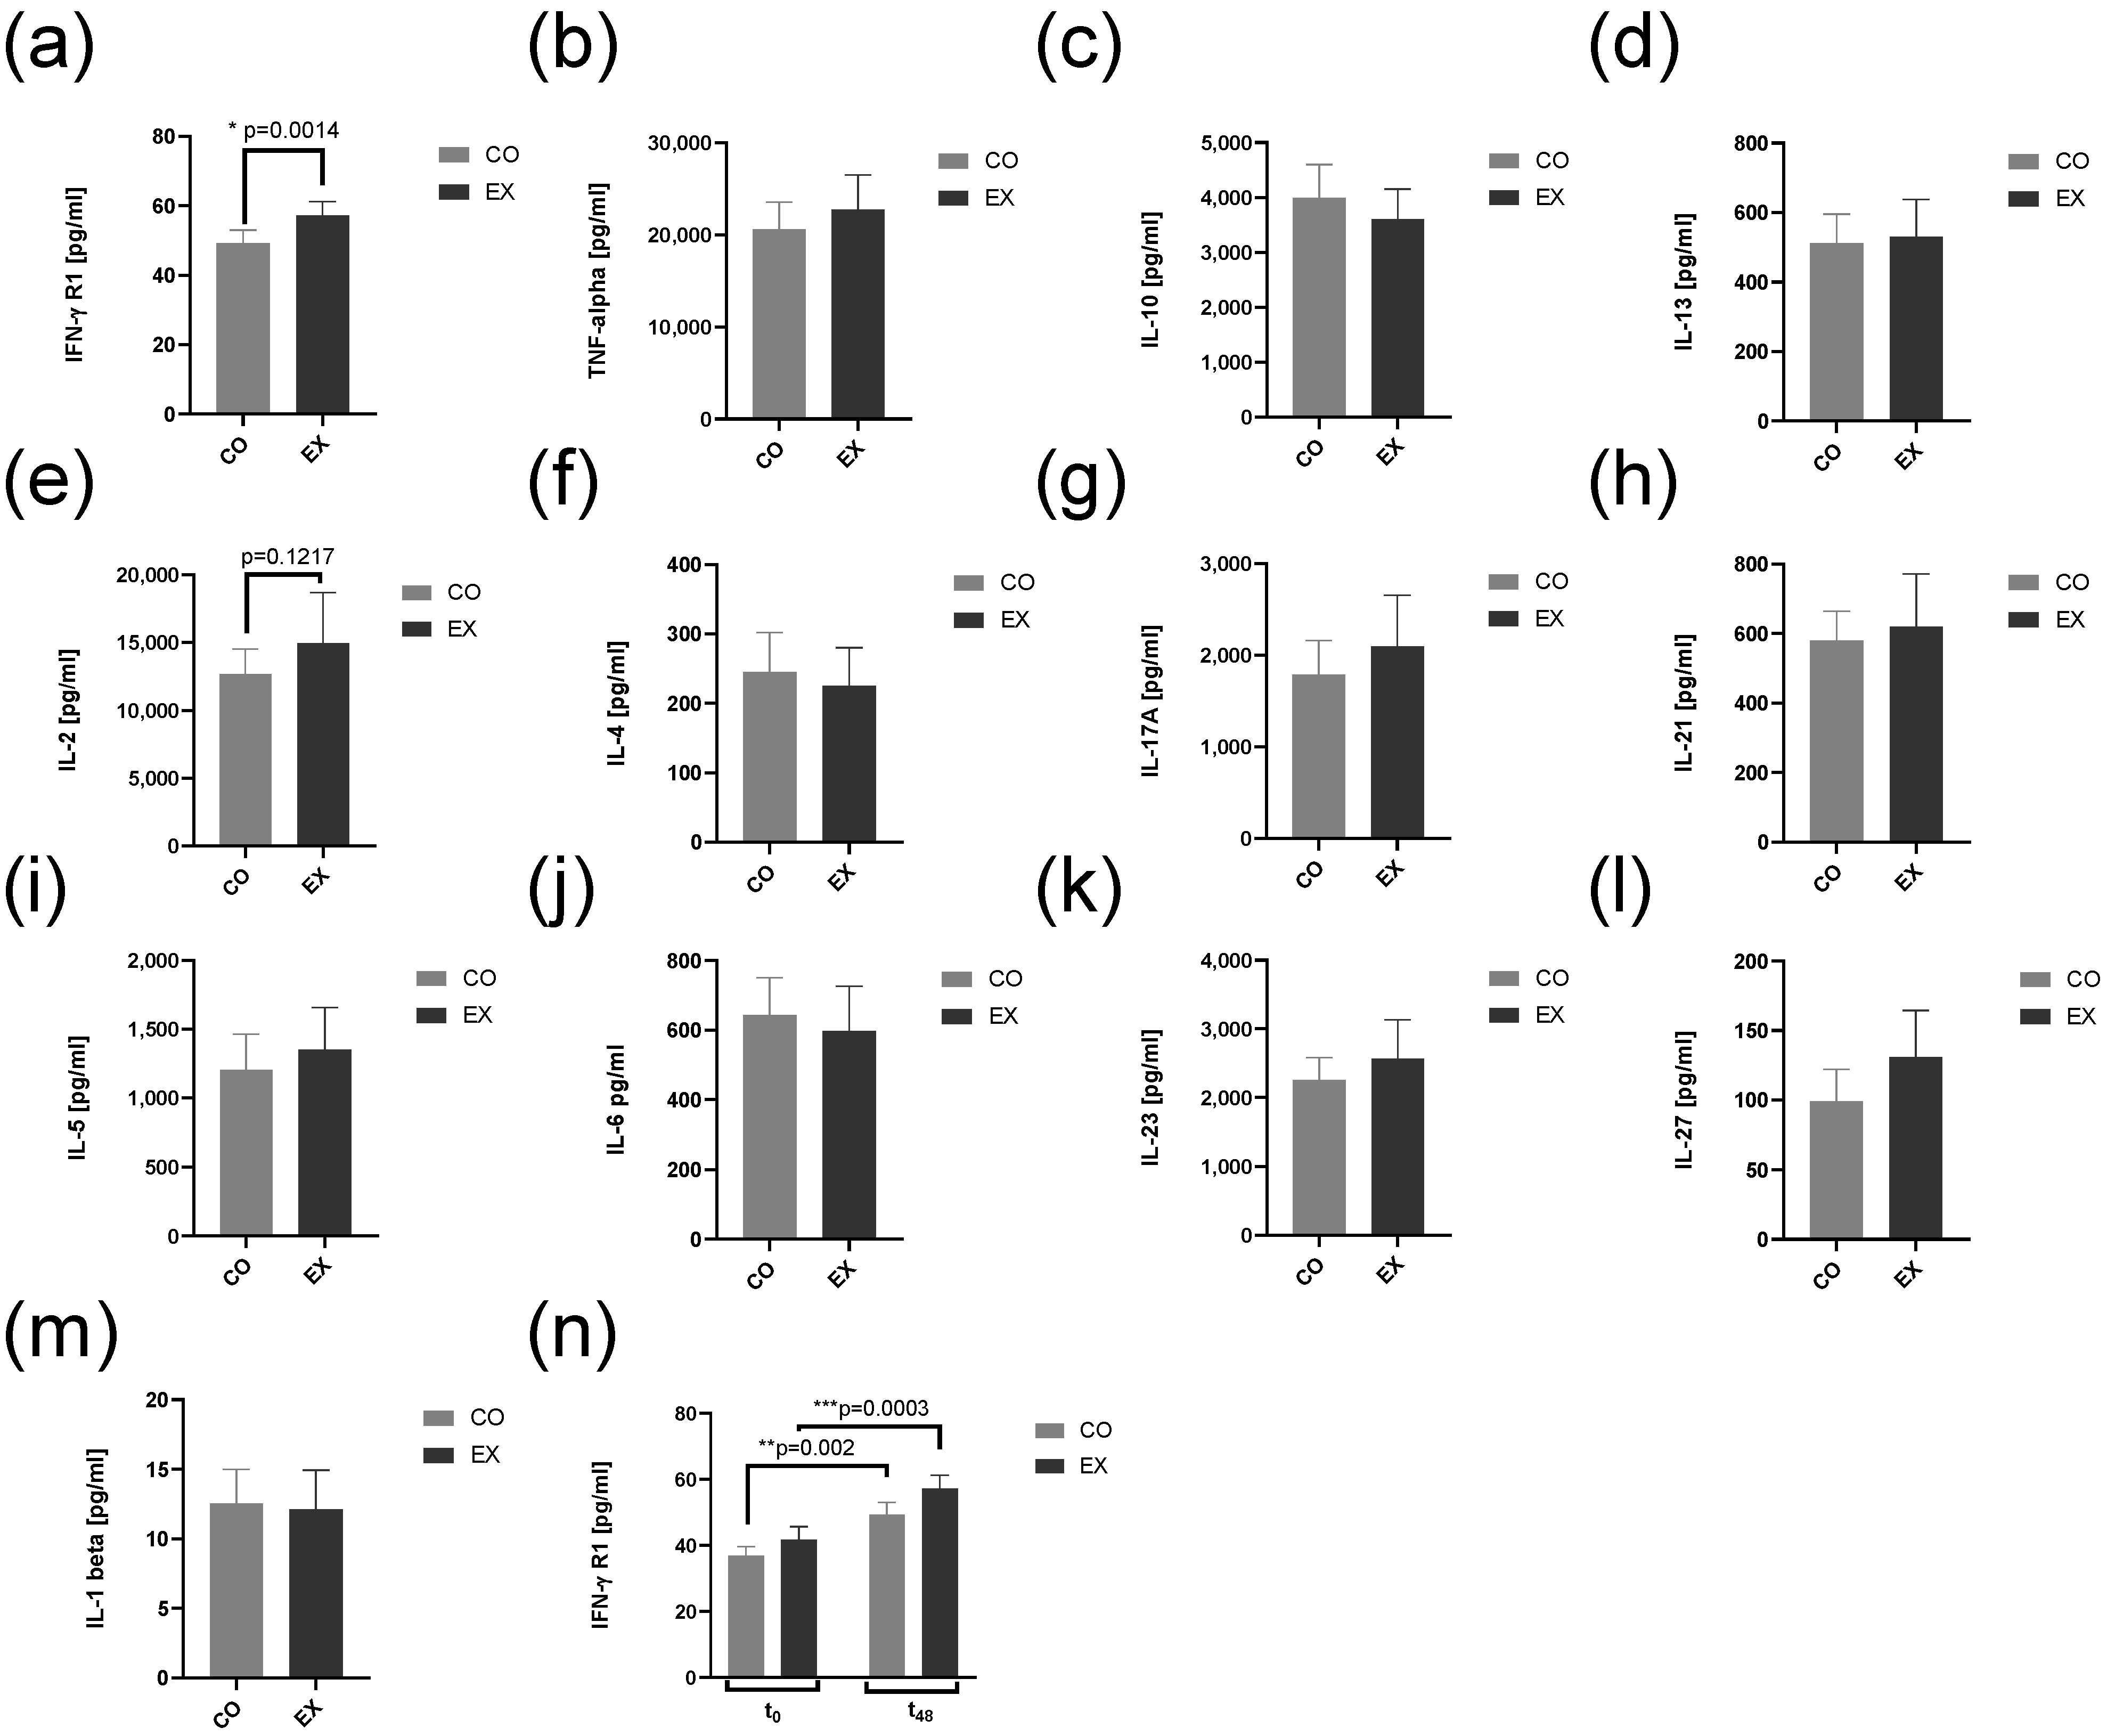
3.5. IFN-Gamma-R1 Levels Are Increased by Exercise Condition

The results on cytokine levels at t48 for relevant T cell cytokines and IFN-γ R1 are shown in Figure 6a–m. All cytokines determined either influencing CD4+ T cell differentiation or known as signature cytokines expressed by CD4+ were not affected by EX serum. The only significant finding was higher IFN-γ R1 levels in EX compared to CO. After analysis of mRNA IFN-γ R1 levels at t48 compared to t0 the difference was influenced by culture conditions at t0 (Figure 6n).

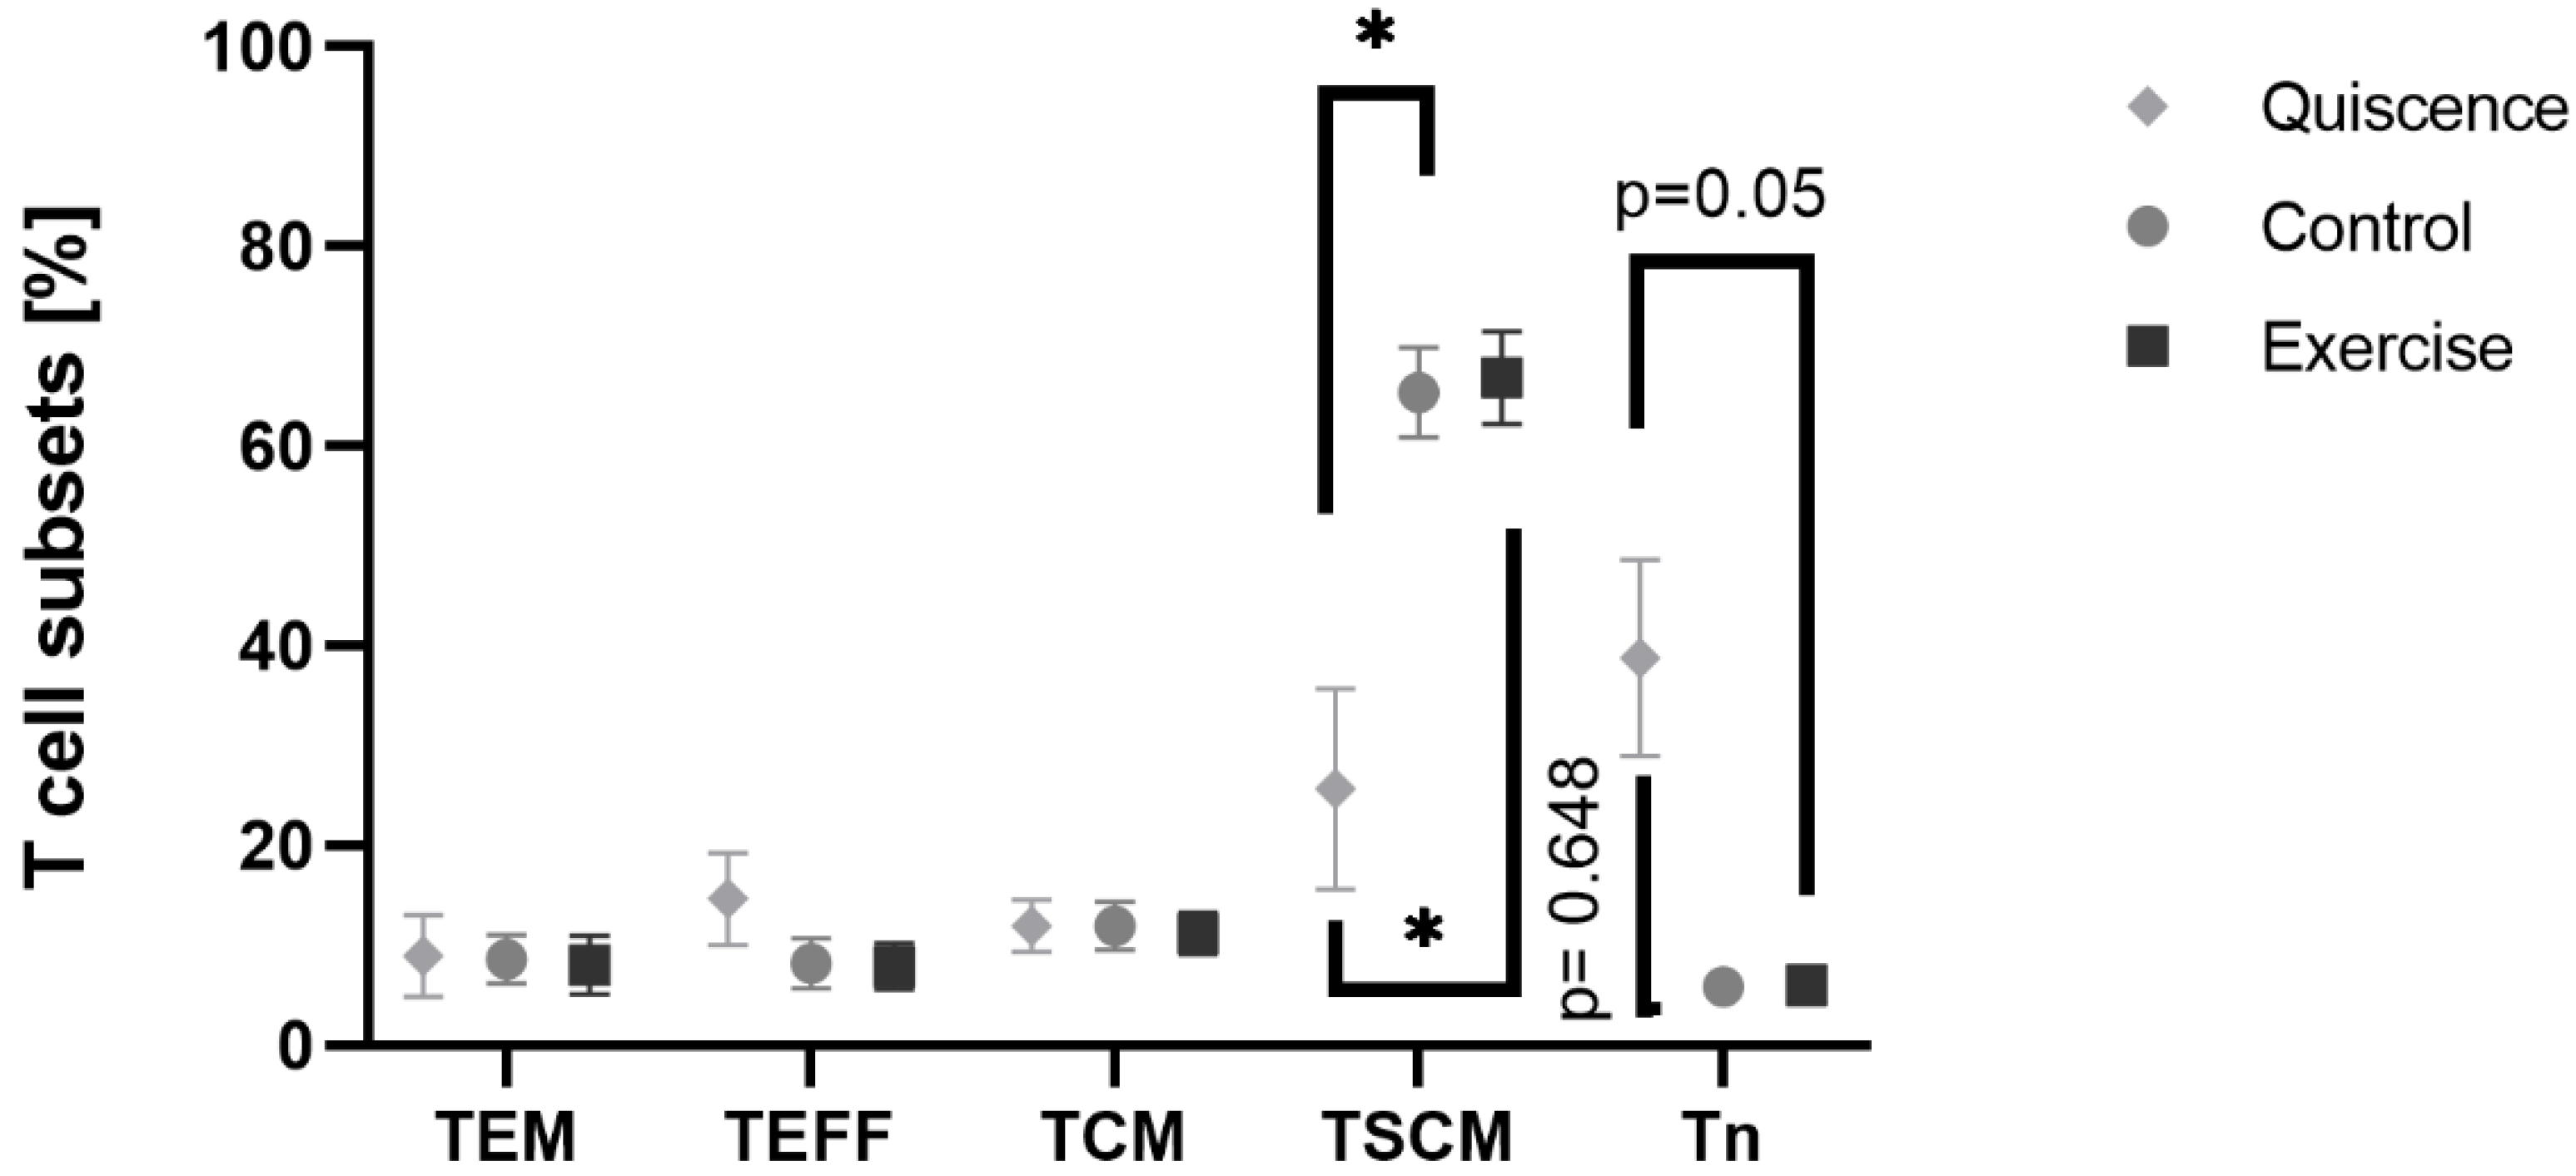
3.6. Exercise Serum Does Not Influence T Cell Phenotype and Activation Markers

The analysis of T cell subsets by flow cytometry did not reveal any significant differences between CO and EX cell culture. A significant effect due to anti-CD3/anti-CD28 activation was found. The percentage of stem cell-like memory T cells (TSCM) significantly increased (Mixed-effect analysis, p = 0.0019) at CO (Tukey’s multiple comparison, p = 0.01) and EX (Tukey’s multiple comparison, p = 0.01). The number of naïve T cells (Tn) was significantly different (Mixed-effect analysis, p = 0.01) but Tukey’s multiple comparison test revealed a non-significantly reduction at t48 compared to t0 (Figure 7). The increase in TSCM cells was associated with the higher percentage of CD95+, a marker for activation induced cell death.

4. Discussion

We had to withdraw our hypothesis that exercise serum suppresses the selected parameters of CD4+ T cell metabolism following T cell receptor activation, although existing literature on lymphocytes has shown some evidence for a reduced function of T cells after acute exercise interventions [18]. Meanwhile a reduced metabolism is underlying a suppressed proliferative capacity [12]. However, one can hardly eliminate the side-effects of T cell redistribution in these studies as fresh CD4+ T cells are sampled immediately after exercise. To ensure shifts in T-cell proportions after exercise did not influence our results, subjects were well-rested at the day fresh blood for CD4+ T cell isolation was drawn. Similar to our study, few in vitro studies incubated T cells with exercise serum [24,25]. To our knowledge, no study has investigated the effects of exercise serum on the immunometabolism of CD4+ T cells so far.
No significant effect of exercise serum on CD4+ T cell viability and phenotype was found, irrespectively of the culture condition. CD4+ T cells left the G0-phase initiating on-blast formation towards a cell diameter as described by earlier published studies [16]. Viability, cell count, T cell growth factor IL-2, and phenotype after activation were not significantly different from resting conditions. Both glycolysis and basal oxygen consumption were only marginally affected by EX serum. Glucose flux and lactate accumulation are not significantly different in EX serum compared to CO serum when acknowledging the net change of glucose and lactate from t0 to t48. However, the trend for a lower glucose consumption of CD4+ T cells and expression of mRNA of HK1 in EX serum indicates substrate phosphorylation of CD4+ T cell was downregulated by EX post-activation. A potential hexokinase 1 reduction, which represents the first rate-limiting enzyme of glycolysis, might indicate a temporary suppression of T cell metabolism after exercise, which does not reach the dimension of a real impairment of the cell function in parameters we measured. Other in vitro studies using activated CD4+ from healthy donors found an increased mRNA level of HK1 48 h after activation as a sign of the metabolic shift towards Warburg metabolism [16]. Reduced HK1 mRNA may indicate a less pronounced activation, signal transduction, or the ability for glucose uptake of CD4+ T cells triggered by EX. Future studies may measure these parameters, e.g., the ability of CD4+ T-cell for glucose uptake measuring the expression of glucose transporters 1 and 3 or utilizing fluorescent analogues of 2-deoxyglucose to unravel if glucose uptake is reduced by EX [31].
For basal oxygen consumption, we have seen a non-significant higher oxygen concentration in EX serum compared to CO serum. Similarly, our PCR-analysis did not find any significant differences in mRNA levels linked to the electron transport chain. However, the method we have used will likely not detect the full changes in basal oxygen consumption that might be relevant to induce exercise adaptation. New oxygen will gradually resolve in culture media when oxygen levels fall [32]. Other methods, such as high-resolution respirometry could be used in future studies to measure mitochondrial respiration [16].
In line with our findings for metabolic changes, we did not find any significant differences for cytokine levels after cell incubation. Other exercise studies using a similar exercise duration found a suppressive effect of 10% exercise serum on IL-2 and TNF-alpha production. However, these results come from experiments using Jurkat T cells, and not from primary isolated T cells [33]. Beyond cytokines, soluble IFN-γ R1 level was significantly higher in EX serum compared to CO serum. Increased levels of soluble IFN-γ R1 might indicate an increased T cell activation during EX conditions. T cells are known to transiently lose IFN-γ R1 after TCR engagement as the sole result of T-cell-receptor activation [34]. However, this assumption has to be verified by the additional measurement of cellular activation markers. Skrenta et al. proposed this mechanism to be a self-protective strategy of CD4+ to protect themself from apoptosis and negative effects on proliferation [34]. Studies analyzing peripheral blood or CD4+ T cells immediately after exercise have found increased activation markers of T cells and higher signals downstream the T cell receptor, such as increased levels of Zap70 after exercise [20,35]. These findings may result from dissimilar levels between exercise and control media at t0.
There are some limitations of our in vitro study. First, we diluted factors released by exercise with 50% cell culture media. We recommend future studies that supplement some factors defining exercise microenvironment to mimic in vivo conditions better and do not mask changes by the content of media. One of those factors could be lactate as it is known as a metabolic signal for T cells and contributes to fatigue and acidosis in exercise [36,37]. Second, 30 min endurance exercise, despite its subjectively exhaustive properties for the subjects, likely does not suppress the immune metabolism of CD4 cells significantly. Future studies examining T cells in the context of exercise should investigate immunometabolism after aerobic exercise lasting longer duration, as the effect on cytokines level, such as IL-6, is greater when muscle glycogen levels are low [38].

5. Conclusions

Overall, the selected parameters of CD4+ metabolism are marginally affected by incubation in exercise serum. We found no difference in on-blast formation, T cell phenotype, glycolysis, and respiration. Only HK1 mRNA levels of CD4+ T cells were significantly reduced after activation in EX serum. Differences were found only at the level of mRNA expression, glucose uptake, and IFN-γ R1 concentration. We assume the duration and intensity of the exercise protocol were not sufficient to affect the immune metabolism of CD4+ T cell significantly. Future studies are needed to verify whether alteration of HK1 mRNA causes any adaptation in immunometabolism of CD4+ T cells after repetitive exercise bouts, following re-stimulation, and longer-duration exercise interventions.

Author Contributions

Conceptualization, J.P. and K.K.; investigation, J.P., K.G., T.R., T.F., R.R., and K.E.; formal analysis, J.P., T.R., K.G., and R.R.; writing—original draft preparation, J.P. and K.K.; writing—review and editing, J.P., T.R., R.R., K.E., K.R.-S., and K.K.; visualization, J.P.; supervision, K.K.; project administration, J.P. and K.K. All authors have read and agreed to the published version of the manuscript.

Funding

This research received no external funding.

Institutional Review Board Statement

The study was conducted according to the guidelines of the Declaration of Helsinki, and approved by the approved by the local ethics committee of the University Giessen (Giessen, Germany, No. 2020-0007, 21 April 2020) and the Ethics Commission of the Medical Chamber of Lower Saxony (Hannover, Germany, Bo/06/2018, 23 March 2018).

Informed Consent Statement

Informed consent was obtained from all subjects involved in the study. Written informed consent has been obtained from the patient(s) to publish this paper.

Data Availability Statement

The data presented in this study are available on request from the corresponding author.

Acknowledgments

We thank all participants who took part in the T cell immunometabolism studies. We thank Rosalie Hausner, Narcisse Nagale, Rike Paulmann, Sina Rilling, and Gerald Schneider for their technical assistance.

Conflicts of Interest

The authors declare no conflict of interest.

References

  1. Mobasheri, A.; Rayman, M.P.; Gualillo, O.; Sellam, J.; van der Kraan, P.; Fearon, U. The role of metabolism in the pathogenesis of osteoarthritis. Nat. Rev. Rheumatol. 2017, 13, 302–311. [Google Scholar] [CrossRef] [PubMed]
  2. Kolan, S.S.; Li, G.; Wik, J.A.; Malachin, G.; Guo, S.; Kolan, P.; Skålhegg, B.S. Cellular metabolism dictates T cell effector function in health and disease. Scand. J. Immunol. 2020, 92, e12956. [Google Scholar] [CrossRef] [PubMed]
  3. Bantug, G.R.; Galluzzi, L.; Kroemer, G.; Hess, C. The spectrum of T cell metabolism in health and disease. Nat. Rev. Immunol. 2018, 18, 19–34. [Google Scholar] [CrossRef] [PubMed]
  4. Patel, C.H.; Leone, R.D.; Horton, M.R.; Powell, J.D. Targeting metabolism to regulate immune responses in autoimmunity and cancer. Nat. Rev. Drug Discov. 2019, 18, 669–688. [Google Scholar] [CrossRef]
  5. Coyle, E.F. Physical activity as a metabolic stressor. Am. J. Clin. Nutr. 2000, 72, 512s–520s. [Google Scholar] [CrossRef]
  6. Pedersen, B.K.; Saltin, B. Exercise as medicine—Evidence for prescribing exercise as therapy in 26 different chronic diseases. Scand. J. Med. Sci. Sports 2015, 25, 1–72. [Google Scholar] [CrossRef] [Green Version]
  7. Thompson, P.D.; Crouse, S.F.; Goodpaster, B.; Kelley, D.; Moyna, N.; Pescatello, L. The acute versus the chronic response to exercise. Med. Sci. Sports Exerc. 2001, 33, S438–S445. [Google Scholar] [CrossRef]
  8. Phan, A.T.; Goldrath, A.W. Hypoxia-inducible factors regulate T cell metabolism and function. Mol. Immunol. 2015, 68, 527–535. [Google Scholar] [CrossRef] [Green Version]
  9. Pucino, V.; Certo, M.; Bulusu, V.; Cucchi, D.; Goldmann, K.; Pontarini, E.; Haas, R.; Smith, J.; Headland, S.E.; Blighe, K.; et al. Lactate Buildup at the Site of Chronic Inflammation Promotes Disease by Inducing CD4(+) T Cell Metabolic Rewiring. Cell Metab. 2019, 30, 1055–1074.e8. [Google Scholar] [CrossRef] [Green Version]
  10. Thirupathi, A.; Pinho, R.A.; Ugbolue, U.C.; He, Y.; Meng, Y.; Gu, Y. Effect of Running Exercise on Oxidative Stress Biomarkers: A Systematic Review. Front. Physiol. 2020, 11, 610112. [Google Scholar] [CrossRef]
  11. Nalbandian, M.; Takeda, M. Lactate as a Signaling Molecule That Regulates Exercise-Induced Adaptations. Biology 2016, 5, 38. [Google Scholar] [CrossRef] [PubMed] [Green Version]
  12. O’Neill, L.A.; Kishton, R.J.; Rathmell, J. A guide to immunometabolism for immunologists. Nat. Rev. Immunol. 2016, 16, 553–565. [Google Scholar] [CrossRef] [Green Version]
  13. Pearce, E.L.; Poffenberger, M.C.; Chang, C.H.; Jones, R.G. Fueling immunity: Insights into metabolism and lymphocyte function. Science 2013, 342, 1242454. [Google Scholar] [CrossRef] [PubMed] [Green Version]
  14. Cretenet, G.; Clerc, I.; Matias, M.; Loisel, S.; Craveiro, M.; Oburoglu, L.; Kinet, S.; Mongellaz, C.; Dardalhon, V.; Taylor, N. Cell surface Glut1 levels distinguish human CD4 and CD8 T lymphocyte subsets with distinct effector functions. Sci. Rep. 2016, 6, 24129. [Google Scholar] [CrossRef]
  15. Jones, N.; Vincent, E.E.; Cronin, J.G.; Panetti, S.; Chambers, M.; Holm, S.R.; Owens, S.E.; Francis, N.J.; Finlay, D.K.; Thornton, C.A. Akt and STAT5 mediate naïve human CD4+ T-cell early metabolic response to TCR stimulation. Nat. Commun. 2019, 10, 2042. [Google Scholar] [CrossRef] [Green Version]
  16. Renner, K.; Geiselhöringer, A.-L.; Fante, M.; Bruss, C.; Färber, S.; Schönhammer, G.; Peter, K.; Singer, K.; Andreesen, R.; Hoffmann, P.; et al. Metabolic plasticity of human T cells: Preserved cytokine production under glucose deprivation or mitochondrial restriction, but 2-deoxy-glucose affects effector functions. Eur. J. Immunol. 2015, 45, 2504–2516. [Google Scholar] [CrossRef]
  17. Ricciardi, S.; Manfrini, N.; Alfieri, R.; Calamita, P.; Crosti, M.C.; Gallo, S.; Müller, R.; Pagani, M.; Abrignani, S.; Biffo, S. The Translational Machinery of Human CD4(+) T Cells Is Poised for Activation and Controls the Switch from Quiescence to Metabolic Remodeling. Cell Metab. 2018, 28, 895–906.e5. [Google Scholar] [CrossRef] [Green Version]
  18. Siedlik, J.A.; Benedict, S.H.; Landes, E.J.; Weir, J.P.; Vardiman, J.P.; Gallagher, P.M. Acute bouts of exercise induce a suppressive effect on lymphocyte proliferation in human subjects: A meta-analysis. Brain Behav. Immun. 2016, 56, 343–351. [Google Scholar] [CrossRef] [Green Version]
  19. Simpson, R.J.; Campbell, J.P.; Gleeson, M.; Krüger, K.; Nieman, D.C.; Pyne, D.B.; Turner, J.E.; Walsh, N.P. Can exercise affect immune function to increase susceptibility to infection? Exerc. Immunol. Rev. 2020, 26, 8–22. [Google Scholar] [PubMed]
  20. Siedlik, J.A.; Deckert, J.A.; Benedict, S.H.; Bhatta, A.; Dunbar, A.J.; Vardiman, J.P.; Gallagher, P.M. T cell activation and proliferation following acute exercise in human subjects is altered by storage conditions and mitogen selection. J. Immunol. Methods 2017, 446, 7–14. [Google Scholar] [CrossRef] [PubMed]
  21. Holbrook, A.K.; Peterson, H.D.; Bianchi, S.A.; Macdonald, B.W.; Bredahl, E.C.; Belshan, M.; Siedlik, J.A. CD4(+) T cell activation and associated susceptibility to HIV-1 infection in vitro increased following acute resistance exercise in human subjects. Physiol. Rep. 2019, 7, e14234. [Google Scholar] [CrossRef] [PubMed] [Green Version]
  22. Contrepois, K.; Wu, S.; Moneghetti, K.J.; Hornburg, D.; Ahadi, S.; Tsai, M.S.; Metwally, A.A.; Wei, E.; Lee-McMullen, B.; Quijada, J.V.; et al. Molecular Choreography of Acute Exercise. Cell 2020, 181, 1112–1130. [Google Scholar] [CrossRef] [PubMed]
  23. Renner, K.; Singer, K.; Koehl, G.E.; Geissler, E.K.; Peter, K.; Siska, P.J.; Kreutz, M. Metabolic Hallmarks of Tumor and Immune Cells in the Tumor Microenvironment. Front. Immunol. 2017, 8, 248. [Google Scholar] [CrossRef] [Green Version]
  24. Perry, C.; Pick, M.; Bdolach, N.; Hazan-Halevi, I.; Kay, S.; Berr, I.; Reches, A.; Harishanu, Y.; Grisaru, D. Endurance exercise diverts the balance between Th17 cells and regulatory T cells. PLoS ONE 2013, 8, e74722. [Google Scholar] [CrossRef] [PubMed] [Green Version]
  25. Dorneles, G.P.; da Silva, I.M.; Santos, M.A.; Elsner, V.R.; Fonseca, S.G.; Peres, A.; Romão, P.R.T. Immunoregulation induced by autologous serum collected after acute exercise in obese men: A randomized cross-over trial. Sci. Rep. 2020, 10, 21735. [Google Scholar] [CrossRef]
  26. Takenaka, M.C.; Robson, S.; Quintana, F.J. Regulation of the T Cell Response by CD39. Trend. Immunol. 2016, 37, 427–439. [Google Scholar] [CrossRef] [PubMed] [Green Version]
  27. Nieman, D.C.; Henson, D.A.; Gross, S.J.; Jenkins, D.P.; Davis, J.M.; Murphy, E.A.; Carmichael, M.D.; Dumke, C.L.; Utter, A.C.; McAnulty, S.R.; et al. Quercetin reduces illness but not immune perturbations after intensive exercise. Med. Sci. Sports Exerc. 2007, 39, 1561–1569. [Google Scholar] [CrossRef] [Green Version]
  28. Chiappisi, E.; Ringseis, R.; Eder, K.; Gessner, D.K. Effect of endoplasmic reticulum stress on metabolic and stress signaling and kidney-specific functions in Madin-Darby bovine kidney cells. J. Dairy Sci. 2017, 100, 6689–6706. [Google Scholar] [CrossRef]
  29. Vandesompele, J.; De Preter, K.; Pattyn, F.; Poppe, B.; Van Roy, N.; De Paepe, A.; Speleman, F. Accurate normalization of real-time quantitative RT-PCR data by geometric averaging of multiple internal control genes. Genome Biol. 2002, 3, Research0034. [Google Scholar] [CrossRef] [Green Version]
  30. Mousset, C.M.; Hobo, W.; Woestenenk, R.; Preijers, F.; Dolstra, H.; van der Waart, A.B. Comprehensive Phenotyping of T Cells Using Flow Cytometry. Cytometry A 2019, 95, 647–654. [Google Scholar] [CrossRef]
  31. Sinclair, L.V.; Barthelemy, C.; Cantrell, D.A. Single Cell Glucose Uptake Assays: A Cautionary Tale. Immunometabolism 2020, 2, e200029. [Google Scholar] [CrossRef] [PubMed]
  32. Al-Ani, A.; Toms, D.; Kondro, D.; Thundathil, J.; Yu, Y.; Ungrin, M. Oxygenation in cell culture: Critical parameters for reproducibility are routinely not reported. PLoS ONE 2018, 13, e0204269. [Google Scholar] [CrossRef] [PubMed] [Green Version]
  33. Radom-Aizik, S.; Leu, S.Y.; Cooper, D.M.; Zaldivar, F., Jr. Serum from exercising humans suppresses t-cell cytokine production. Cytokine 2007, 40, 75–81. [Google Scholar] [CrossRef] [PubMed] [Green Version]
  34. Skrenta, H.; Yang, Y.; Pestka, S.; Fathman, C.G. Ligand-independent down-regulation of IFN-gamma receptor 1 following TCR engagement. J. Immunol. 2000, 164, 3506–3511. [Google Scholar] [CrossRef] [PubMed] [Green Version]
  35. Alack, K.; Weiss, A.; Krüger, K.; Höret, M.; Schermuly, R.; Frech, T.; Eggert, M.; Mooren, F.C. Profiling of human lymphocytes reveals a specific network of protein kinases modulated by endurance training status. Sci. Rep. 2020, 10, 888. [Google Scholar] [CrossRef] [PubMed] [Green Version]
  36. Haas, R.; Cucchi, D.; Smith, J.; Pucino, V.; Macdougall, C.E.; Mauro, C. Intermediates of Metabolism: From Bystanders to Signalling Molecules. Trends Biochem. Sci. 2016, 41, 460–471. [Google Scholar] [CrossRef]
  37. Hall, M.M.; Rajasekaran, S.; Thomsen, T.W.; Peterson, A.R. Lactate: Friend or Foe. PM R 2016, 8, S8–S15. [Google Scholar] [CrossRef]
  38. Pedersen, B.K.; Steensberg, A.; Fischer, C.; Keller, C.; Keller, P.; Plomgaard, P.; Wolsk-Petersen, E.; Febbraio, M. The metabolic role of IL-6 produced during exercise: Is IL-6 an exercise factor? Proc. Nutr. Soc. 2004, 63, 263–267. [Google Scholar] [CrossRef] [Green Version]
Figure 1. Gating strategy for T cell phenotyping. Subsets were gated based on CCR7 and CD45RA expression. In the next step Tn-like cells were differentiated by gating and the percentage of stem cell like memory cells was calculated. TEM: effector T memory cells, TEFF: T effector cells, TCM: central T memory cells, Tn: naive T cells, SSC: side scatter, FSC: Forward sideward scatter.
Immuno 01 00008 g001
Figure 2. Effects of control and exercise serum on cell parameters. Cell diameter at the beginning (t0) and after 48 h cell culture (t48, a, n = 7) from cohort 2, cell count at t0 and t48, (b, n = 7), and cell count at t0 and 72 h after cell culture from cohort 1 (t72, c, n = 5) are shown with mean and ± SEM. We used one-way ANOVA with Geisser–Greenhouse correction followed by Bonferroni’s post hoc; * p < 0.5, ** p < 0.01, *** p < 0.001). ANOVA: analysis of the variance.
Immuno 01 00008 g002
Figure 3. Changes in lactate and glucose levels after 48 h of cell culture following incubation of CD4+ T cells from cohort 2 with 50% control serum (CO) or exercise serum (EX). T cells were activated with anti-CD3/anti-CD28. Glucose level (a), lactate level (b), and changes (∆) before to after cell culture (c) are shown as box and whiskers min to max (n = 7 per group), (a,b) two-way ANOVA followed by multiple comparisons; (c) Student’s t-test * p < 0.05, ** p < 0.01, *** p < 0.001. ANOVA: analysis of the variance.
Immuno 01 00008 g003
Figure 4. Normalized mRNA levels of CD4+ T cells from cohort 2 after 48 h in the exercise cell culture measured by real-time PCR are displayed as fold of the control group (=1.0). Human CD4+ T cells were activated in culture with 50% serum before exercise (control group) or after exercise. Both were activated with anti-CD3/anti-CD28. mRNA levels were normalized using the geometric mean of expression data of the reference genes SDHA, YWHAZ, and ATP5B. Data are shown with mean ± SEM (n = 5). Significance was determined by two-tailed Student’s t-test using the normalized mRNA data. * p < 0.05.
Immuno 01 00008 g004
Figure 5. Oxygen cell culture levels of culture medium, non-activated quiescent T cells, and activated T cells over time. Human CD4+ T cells from cohort 1 were activated supplemented by serum before exercise (CO) or after exercise (EX) and activated with anti-CD3/anti-CD28. Oxygen concentration during 72 h of cell culture measured by PreSens oxygen reader (SDR v4, PreSens Precision Sensing GmbH, Regensburg, Germany) is shown by the mean of n = 5. CO: control condition, EX: exercise condition. Mean oxygen levels of the culture medium including serum before or after exercise (Medium) overlap (a), while mean oxygen levels of quiescent and activated cells are higher when serum after exercise was supplemented (b).
Immuno 01 00008 g005
Figure 6. Interferon-γ receptor 1 (a) and cytokine (bm) levels in supernatants after 48 h cell culture. Human CD4+ T cells from cohort 2 were activated supplemented by serum taken at resting conditions (CO) or after exercise (EX) and activated with anti-CD3/anti-CD28. IFN-γ R1 (a) and T cell interleukins TNF-α, IL-10, IL-13, IL-2, IL-4, IL-17A, IL-21, IL-5, IL-6, IL-23, IL-27, and IL-1β were measured by commercial multiplex ELISA assays after 48 h cell culture for CO and EX condition. Beyond, IFN-γ R1 (n) was measured before and after 48 h of cell culture. All data are shown with mean ± SEM (n = 7). Significance was determined by Student’s t-test for a-m. Significance was determined by two-way ANOVA followed by multiple comparison tests for n. * p < 0.05, ** p < 0.01, *** p < 0.001. ANOVA: analysis of the variance. CO: control group, EX: Exercise group, IL: Interleukin, IFN-γ R1: Interferon-γ Receptor 1, TNF-α: tumor necrosis factor-α.
Immuno 01 00008 g006
Figure 7. Percentage change in T effector memory cells, T effector cells, T central memory cells, stem cell-like memory T cells, and naive T cells with SEM before activation, at quiescence, and after activation at control and exercise condition. Human CD4+ T cells from cohort 2 were activated in serum before exercise (CO) or after exercise (EX) with anti-CD3/anti-CD28. Quiescent cells remained non-activated. Data are shown with mean ± SEM (Control N = 6, Exercise N = 6, Quiescence N = 4). Significance was determined by Mixed-effect analysis and Tukey’s multiple comparisons. * p < 0.05. TEM: T effector memory cells, TEFF: T effector cells, TCM: T central memory cells, TSCM: stem cell-like memory T cells (TSCM), Tn: naive T cells.
Immuno 01 00008 g007
Table 1. Characteristics of gene-specific primer pairs used for qPCR.
GeneForward Primer (from 5′ to 3′)
Reverse Primer (from 5′ to 3′)
PCR Product Size (bp)NCBI GenBank
Accession Number
Primer
Efficiency
Reference genes
ATP5BTCGCGTGCCATTGCTGAGCT
CGTGCACGGGACACGGTCAA
218NM_0016861.72
SDHACCAAGCCCATCCAGGGGCAAC
TCCAGAGTGACCTTCCCAGTGCCAA
100NM_0041681.91
YWHAZTGGGGACTACGACGTCCCTCAA
CATATCGCTCAGCCTGCTCGG
115NM_0034062.01
Target genes
ATP5JTCGGGACTGAGTGCAAGAAT
AACACCAATGTTCCTCCGCA
105NM_0010037031.89
COX4I1GTGGCGGCAGAATGTTGG
GGCAGACAGGTGCTTGACAT
182NM_0018612.05
FOXP3CACTTACAGGCACTCCTCCA
CAGCCGAAAGGGTGCTGTC
286NM_0140091.78
HK1GCCTATTACTTCACGGAGCTGA
TGAAATCTCCCTTTTCAGAGCCA
220NM_0001881.95
IDH1TACTTCAGAAGCGGAGGCAC
GTAGTTTATCGCCTGCCGGG
129NM_0058962.04
LDHAACGTGCATTCCCGATTCCTT
GGAAAAGGCTGCCATGTTGG
251NM_0055662.07
NDUFA12TAGTGCAGGTCCTGAAACGC
CCATCGGTGACGGCCAAAAA
176NM_0188382.12
ODGHCTGTGCTTGGCTGGAAAACC
CATGGTGCCCTCGTATCTGA
245NM_0025412.36
PRKAA1CGGCAAAGTGAAGGTTGGC
CTGTTGGAACAGACGCCGA
286NM_0062511.98
RPS6KB1CTGAGGACATGGCAGGAGTG
ACAATGTTCCATGCCAAGTTCA
146NM_0031611.93
Table 2. Antibodies used for flow cytometry to phenotype T cell subsets. PE: Phycoerythrin, APC: Allophycocyanin, BV: Brilliant violet.
AntibodyFluorochromeVendor/Cat. No./CloneIsotype
CD95PEBiolegend/305608/DX2Mouse IgG1, κ
CD45RAAPCBiolegend/304111/HI100Mouse IgG2b, κ
CD197/CCR7BV421Biolegend/353207/G043H7Mouse IgG2a, κ
CD4Alexa Fluor 700Biolegend/344621/SK3Mouse IgG1, κ
Live/DeadZombie AquaBiolegend/423101/--
Publisher’s Note: MDPI stays neutral with regard to jurisdictional claims in published maps and institutional affiliations.

