Effects of Pressurizing Cryogenic Treatments on Physical and Mechanical Properties of Shale Core Samples—An Experimental Study


1
Department of Petroleum Geology and Sedimentology, Faculty of Earth Sciences, King Abdulaziz University, Jeddah 21589, Saudi Arabia
2
Bob L. Herd Department of Petroleum Engineering, Texas Tech University, Lubbock, TX 79409, USA
*
Author to whom correspondence should be addressed.
Gases 2021, 1(1), 33-50; https://0-doi-org.brum.beds.ac.uk/10.3390/gases1010003
Submission received: 14 December 2020
/
Revised: 4 January 2021
/
Accepted: 16 January 2021
/
Published: 20 January 2021
(This article belongs to the Section Natural Gas)
Abstract
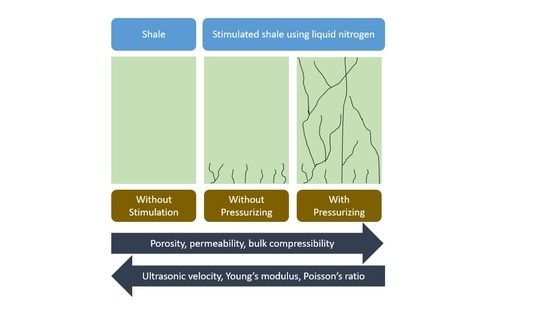
:The technique of cryogenic treatments requires injecting extremely cold fluids such as liquid nitrogen (LN2) into formations to create fractures in addition to connecting pre-existing fracture networks. This study investigated the effects of implementing and pressurizing cryogenic treatment on the physical (porosity and permeability) and mechanical properties (Young’s modulus, Poisson’s ratio, and bulk compressibility) of the Marcellus shale samples. Ten Marcellus core samples were inserted in a core holder and heated to 66 °C using an oven. Then, LN2 (−177 °C) was injected into the samples at approximately 0.14 MPa. Nitrogen was used to pressurize nine samples at injection pressures of 1.38, 2.76, and 4.14 MPa while the tenth core sample was not pressurized. Using a cryogenic pressure transducer and a T-type thermocouple, the pressure and temperature of the core holder were monitored and recorded during the test. The core samples were scanned using a computed tomography (CT) scanner, and their porosities, permeability, and ultrasonic velocities were measured both before and after conducting the cryogenic treatments. The analyses of CT scan results illustrated that conducting cryogenic treatments created new cracks inside all the samples. These cracks increased the pore volume, and as a result, the porosity, permeability, and bulk compressibility of the core samples increased. The creations of the new cracks also resulted in reductions in the compressional and shear velocities of the samples, and as a result, decreasing the Young’s modulus and Poisson’s ratio. Moreover, the results revealed that pressurizing the injected LN2 increased the alterations of aforementioned properties.
1. Introduction
According to Energy Information Administration (EIA) [1], the USA oil and gas production from unconventional reservoirs, which have ultra-low permeability (nano-Darcy (nD) to micro-Darcy (µD)), have been considerably improved since 2007. Even though horizontal drilling and multistage-hydraulic fracturing are necessary to produce with economical rates from such reservoirs [2,3,4,5], the oil and gas production rates significantly decrease by 90% in the first two to three years of production [5]. Despite implementing horizontal drilling and multi-stage hydraulic fracturing, unconventional hydrocarbon recovery factors are still low, with 10% in oil reservoirs and 25% in gas reservoirs [5,6]. Implementing hydraulic fracturing treatments requires a substantial amount of water, which puts additional stress on local water resources.
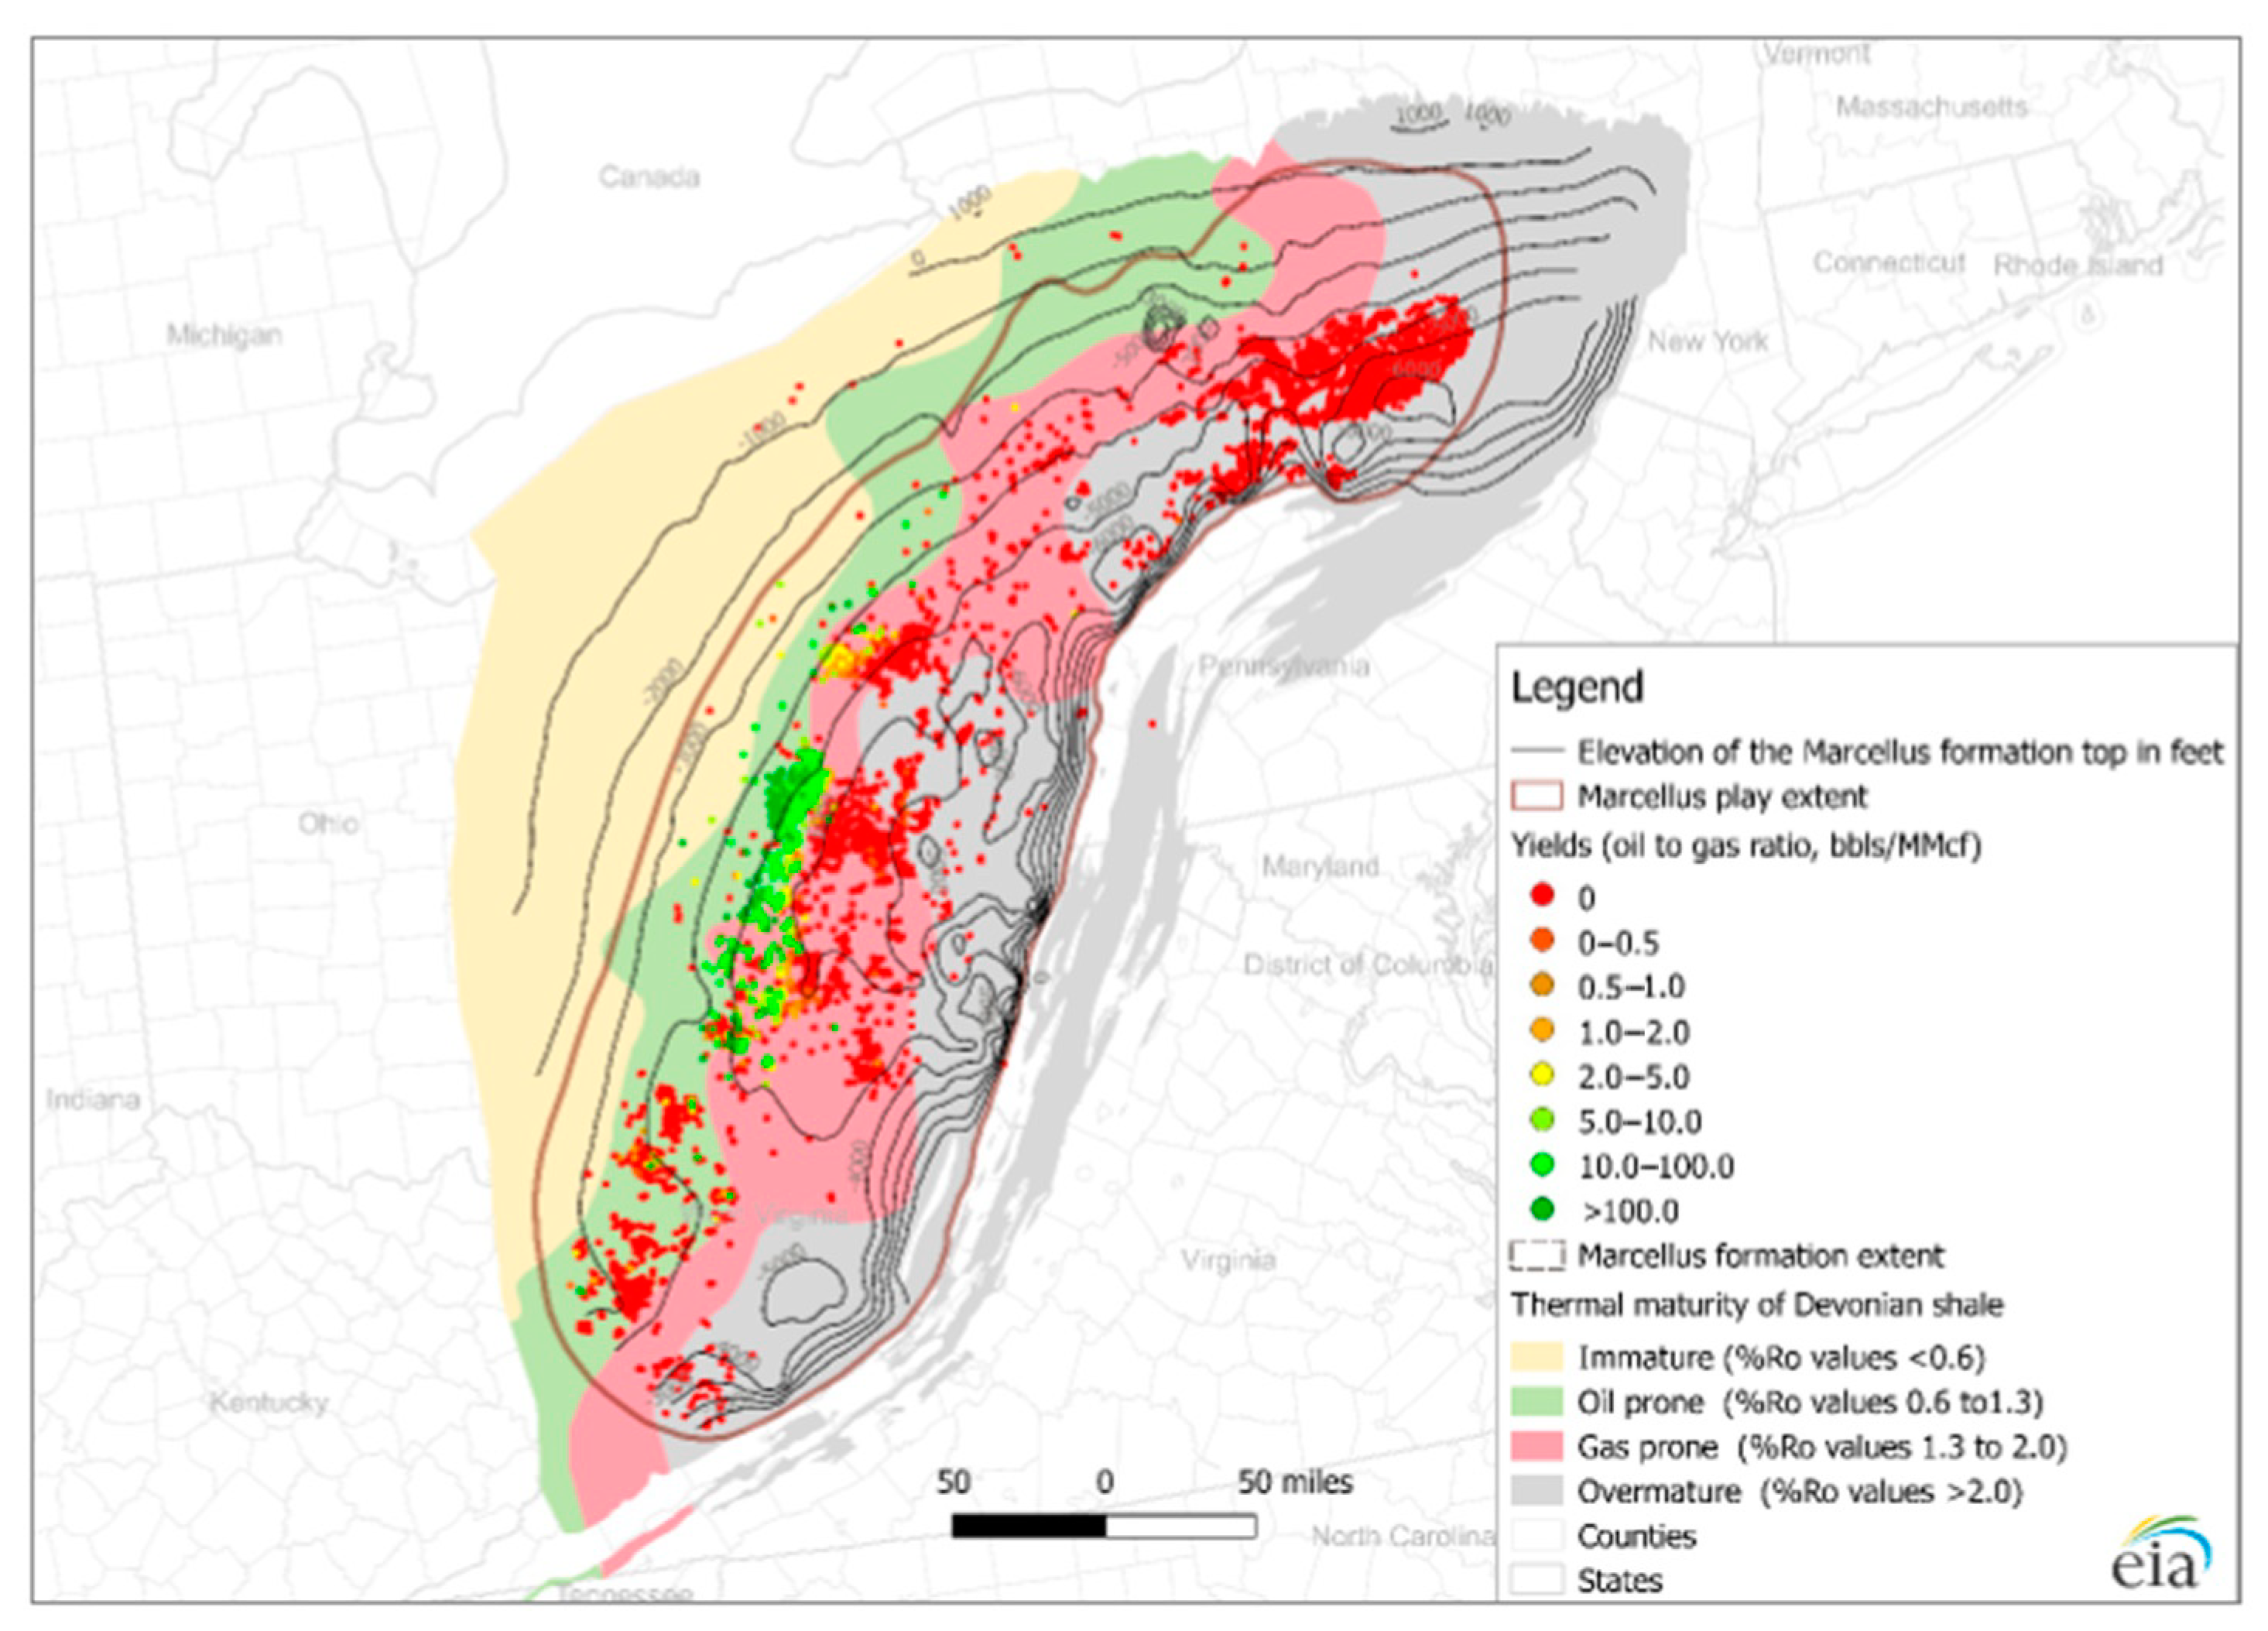
One of the USA’s most prominent shale plays is Marcellus, which has been drawing much attention over the last years, and it has become one of the hottest plays in the Appalachian Basin and the USA [7]. It covers approximately 95,000 sq. miles of the Appalachian Basin [7] across the US Eastern part. According to EIA [7], the Marcellus formation is set under six states: Pennsylvania (35.35%), West Virginia (21.33%), New York (20.06%), Ohio (18.19%), Virginia (3.85%), and Maryland (1.09%). The Marcellus shale was deposited during Middle Devonian time in oxygen-inadequate marine environments, making the Marcellus an organic-rich shale formation. The Marcellus formation is well-known as shale gas formation. Additionally, it has 410.3 Trillion cubic feet (Tcf) and 55% of the total recoverable shale gas resources, which can be considered the most recoverable gas resources in the US. However, most of its resources (57%) are still undeveloped [8]. Figure 1 shows the sweet spots and thermal maturity characteristics in the Marcellus play, wherein most of the play’s eastern area, dry gas wells are located, and liquid-rich wells are mainly in the Marcellus’ western area play. According to Higley, et al. [9], the Marcellus formation can be geologically divided to six continuous assessment units. The Northern Interior Marcellus Shale Gas AU contains the highest estimated ultimate recovery per well (EUR) of (3.125 billion cubic feet of gas) while the Western Margin Marcellus Shale Gas AU contains the highest potential production area of 43,524 km2 (10,755,000 acres).
The depth of the Marcellus formation varies between 1219 m and 2591 m (4000 ft and 8500 ft) and its thickness ranges from 15 m to 61 m (50 ft to 200 ft) [7,8,10]. In general, shale formations are well-known for their heterogeneity. Shale properties vary from one zone to another. Typically, the Marcellus shale is black shale, but it may have some mixed-layer limestone and some pyrite depending on the location. The upper section of the Marcellus formation is mainly composed of mixed-layer of clay minerals (9–35%); the formation base is mainly composed of quartz (10–60%,), pyrite (5–13%), and feldspar (0–10%), while the lower section is composed of calcite (3–48%) and dolomite (0–10%) [11,12,13,14,15]. However, some of the Marcellus shale rocks, especially the outcrop ones, could have lost their organic carbon substances due to the weathering process, where the color of the rocks turns from black to dark or light gray [16]. The results of X-ray diffraction (XRD) tests conducted by Gupta and Mishra [17] and Piane et al. [18] revealed that Marcellus core samples contain 75% and 80–90% calcite, respectively. Additionally, Crandall, et al. [19] scanned the Marcellus formation (Tippens 6HS Well) using a computerized tomography (CT) scanner and claimed that the Marcellus reservoir has several calcareous sections, calcite veins, and calcite clasts. They also demonstrated that the formation has more than 40% calcite in some sections. Moreover, the matrix pores in the Marcellus are poorly linked, creating gas trapped in shale that cannot easily move [20]. Some of the Marcellus’s average general properties were estimated, such as depth (2057 m), thickness (38 m), porosity (8%), and Total Organic Content (TOC) (12% wt.) [7]. The permeability varies between 10 nD and 10 µD [8,10].
Since 2007, oil and gas production from unconventional resources (extremely low permeability formations) started to significantly increase [1]. Economical production from such resources requires drilling horizontally as well as implementing multistage hydraulic fracture treatments [2,3,4,5,21,22]. Wang et al. [23] stated that more than 90% of gas wells and 70% of oil wells are hydraulically fractured worldwide. Hydrocarbon production rate decreases by 90% in the first 2–3 years even after applying horizontal drilling and multistage hydraulic fracturing [5]. Additionally, even after conducting horizontal drilling and multistage fracturing, oil and gas recovery factors from unconventional resources are low (10% from oil resources and 25% from gas resources) [5,6].
The technique of cryogenic treatments requires injecting extremely cold fluids such as liquid nitrogen (LN2) into a formation to create fractures in addition to connecting pre-existing fracture networks. Due to the instant difference in the temperatures, a rapid increase in the tensile stress occurs and as a result, new cracks are created [24]. When injecting LN2 into reservoirs, it vaporizes at a liquid-to-gas expansion ratio of 1:694 (at atmospheric pressure and 20 °C), which pressurizes the formation, propagates the fractures deeper, and connects pre-existing fractures networks [25].
Several field studies have investigated the effects of cryogenic treatments on hydrocarbon production rates. McDaniel et al. [26] stimulated one tight sandstone and four coalbed methane wells by safely injecting LN2 (−196 to −147 °C) through free-hanging fiberglass pipes without any casing damage and as a result, they gained 43% of gas production increment. Grundmann et al. [27] cryogenically treated a Devonian shale well in Knott, Kentucky, using LN2, and as a result, hydrocarbon production improved by 8%. Rassenfoss [28] reported that production from wells that were fractured using natural gas liquids (NGL) in Texas is 77% higher than hydraulically fractured wells.
Also, the thermal shock concept has been experimentally addressed using different samples including sandstone, granite, shale, and coal. Kim and Kemeny [29] investigated the thermal shock efficacy on Quartzite, Granite, Diabase, and Cretaceous Volcanic Sediments. They rapidly cooled the core samples after heating them to 100 °C. They claimed that slow heating the core samples heals some of the pre-existing cracks while the rapid cooling creates new cracks inside the samples, which increases their porosity and decreases their compressional and shear velocities.
Cha et al. [30] investigated the effects of implementing cryogenic treatments on sandstone and concrete blocks using CT scan and acoustic velocity measurements. Their results revealed that conducting cryogenic treatments created new cracks in the block samples that altered the acoustic velocities of the samples. Repeating the cryogenic treatments created more cracks and widened the pre-existing cracks. Additionally, cryogenic treatments resulted in the formation of invisible cracks in the sandstone sample that could be proven by the reduction of the acoustic velocities of the samples.
Alqatahni et al. [31] applied cryogenic treatments on sandstone, shale, and concrete. They found that the effect of the cryogenic treatments is a function of treatment duration, fluid injection pressure, number of cycling, stress conditions, and rock properties. They also claimed that such treatments enhanced the permeability of the samples (pressure decay tests) and lowered the breakdown pressure of the samples by 40%, all of which are indications of crack creations. Also, Wang et al. [22] cryogenically treated tight sandstone, Niobrara shale, and concrete samples using liquid nitrogen at an injection pressure of 3.10 MPa. As a result of the cryogenic treatments, the breakdown pressure significantly reduced while the permeability of the samples was enhanced.
Jiang et al. [32] submerged shale samples from the Longmaxi formation, China, in liquid nitrogen for twenty minutes. Their results illustrated that the compressional velocity of the core samples reduced by up to 16%, the permeability improved by up to 74%, while the compressive strength decreased by up to 34%. Their results proved that cryogenic treatments caused the formation of new cracks inside the core samples.
Elwegaa et al. [33] heated two samples (a gas shale formation and Eagle Ford formation) to 82 °C for 60 min. Then, they injected cold nitrogen (−18 °C) for 15 min at an injection pressure of 6.89 MPa. Their results showed the thermal shock technique created new fractures and propagated existing ones resulting in changes in the Young’s modulus and Poisson’s ratio of the samples. Khalil and Emadi [34] investigated the cryogenic treatment effects on shale samples using liquid nitrogen. They stated that cryogenic treatments created new cracks in the core samples, which increased the porosity and permeability of the samples while it reduced the compressional and shear velocities of the core samples.
Yang et al. [35] implemented fracturing experiments on tight sandstone samples using water, nitrogen (N2), liquid carbon dioxide (L-CO2), and supercritical carbon dioxide (SC-CO2). Compared to water, they proved that CO2-based fluids have stronger fracturing capacity and produce more complexity.
This comprehensive study investigates the effect of implementing and pressurizing cryogenic treatments on the physical (porosity and permeability) and mechanical properties (Young’s modulus, Poisson’s ratio, and bulk compressibility) of Marcellus core samples.
2. Materials and Methods
Ten core samples with a diameter of 3.81 cm and length of 5.08 cm from an outcrop Marcellus shale formation, cut parallel to the bedding, were used in this study. To assure flat edge core samples, the end-faces of all core samples were polished (capped), and the dimensions of the samples were measured using a digital caliper. After completing all the tests (porosity, permeability, and ultrasonic velocities), X-Ray Diffraction (XRD) tests were implemented on the samples to investigate their mineralogical compositions. The technique of computed tomography (CT) scanning is a medical non-destructive diagnostic imaging process that applies X-ray technology as well as mathematical reconstruction algorithms to show cross-sectional images of core samples. More than 20 years ago, the oil and gas industry started to use the CT scan technique [36]. CT-images can be an excellent method to demonstrate fractures inside samples [37]. In this research, a CT-scanner was used to detect cracks inside the core samples before and after conducting cryogenic treatments. It has a 7-mA current and 140 kV voltage. A full rotation of the CT scan imaging takes six seconds, which produces eight slices of 1.25 mm spacing between the slices.
Because the pore throats of shale core samples are very tight, implementing the methods of the conventional porosity measurement might lead to erroneous results. Khalil et al. [38] experimentally investigated the effect of injection pressure on porosity measurements of shale core samples using helium at injection pressures of 0.69, 1.38, 2.07, and 2.76 MPa. They claimed that 1.38 MPa is the optimal injection pressure to measure the porosity of shale core samples without damaging the samples, and increasing the pressure above that does not promise significant changes in the porosity measurements. Hence, the porosities of the core samples were measured using helium at an injection pressure of 1.38 MPa.
Another important parameter to evaluate the efficacy of cryogenic treatments on the core samples is permeability, which was measured using New England Research (NER) AutoLab 1500. NER developed a pressure decay method (complex transient method) to measure the extremely low permeability of unconventional core samples. Rapidly applying confining pressure may create new cracks inside the samples. To avoid crack forming, several researchers recommend applying confining pressure at rates of 0.05 to 0.1 MPa/s [39,40,41,42,43,44]. A rate of 0.017 MPa/s was used in this research to reach 5.17 MPa confining pressure. After that, using helium, a pore pressure of 1.73 MPa was applied into the samples until the downstream and upstream sides reached a pressure equilibrium (up to 48 h), which is a function of the permeability of the core samples. The pore pressure reduced by 0.86 MPa and stayed constant for eight minutes, then it elevated to 2.59 MPa and stayed for another eight minutes, and finally, it went back to 1.73 MPa. The permeability of the core samples was calculated based on the pressure responses of the downstream.
Additionally, NER AutoLab 1500 was used to measure the ultrasonic velocity of the core samples at two confining pressure cycles. At the ramp-up cycle (first cycle), an increment of 5.17 MPa confining pressures increased from 5.17 MPa to the Marcellus average reservoir pressure of 29.33 MPa. The same confining pressures were used, but in the opposite direction at the ramp-down cycle (second cycle). At each confining pressure, one compressional wave and two orthogonally shear waves were captured. By determining the arrival time of each wave, the compressional and shear velocities of the core samples can be calculated. The Young’s modulus and Poisson’s ratio can be calculated using Equations (1) and (2) [45,46,47,48,49].
where is the dynamic Young’s modulus in Pascal, is the rock density in kg/m3, is the shear velocity in m/s, is the compressional velocity in m/s, and is the dynamic Poisson’s ratio (dimensionless). Moreover, the core samples bulk compressibility (), which is the change in the core samples bulk volume due to applying confining pressure, can be calculated using Equation (3).
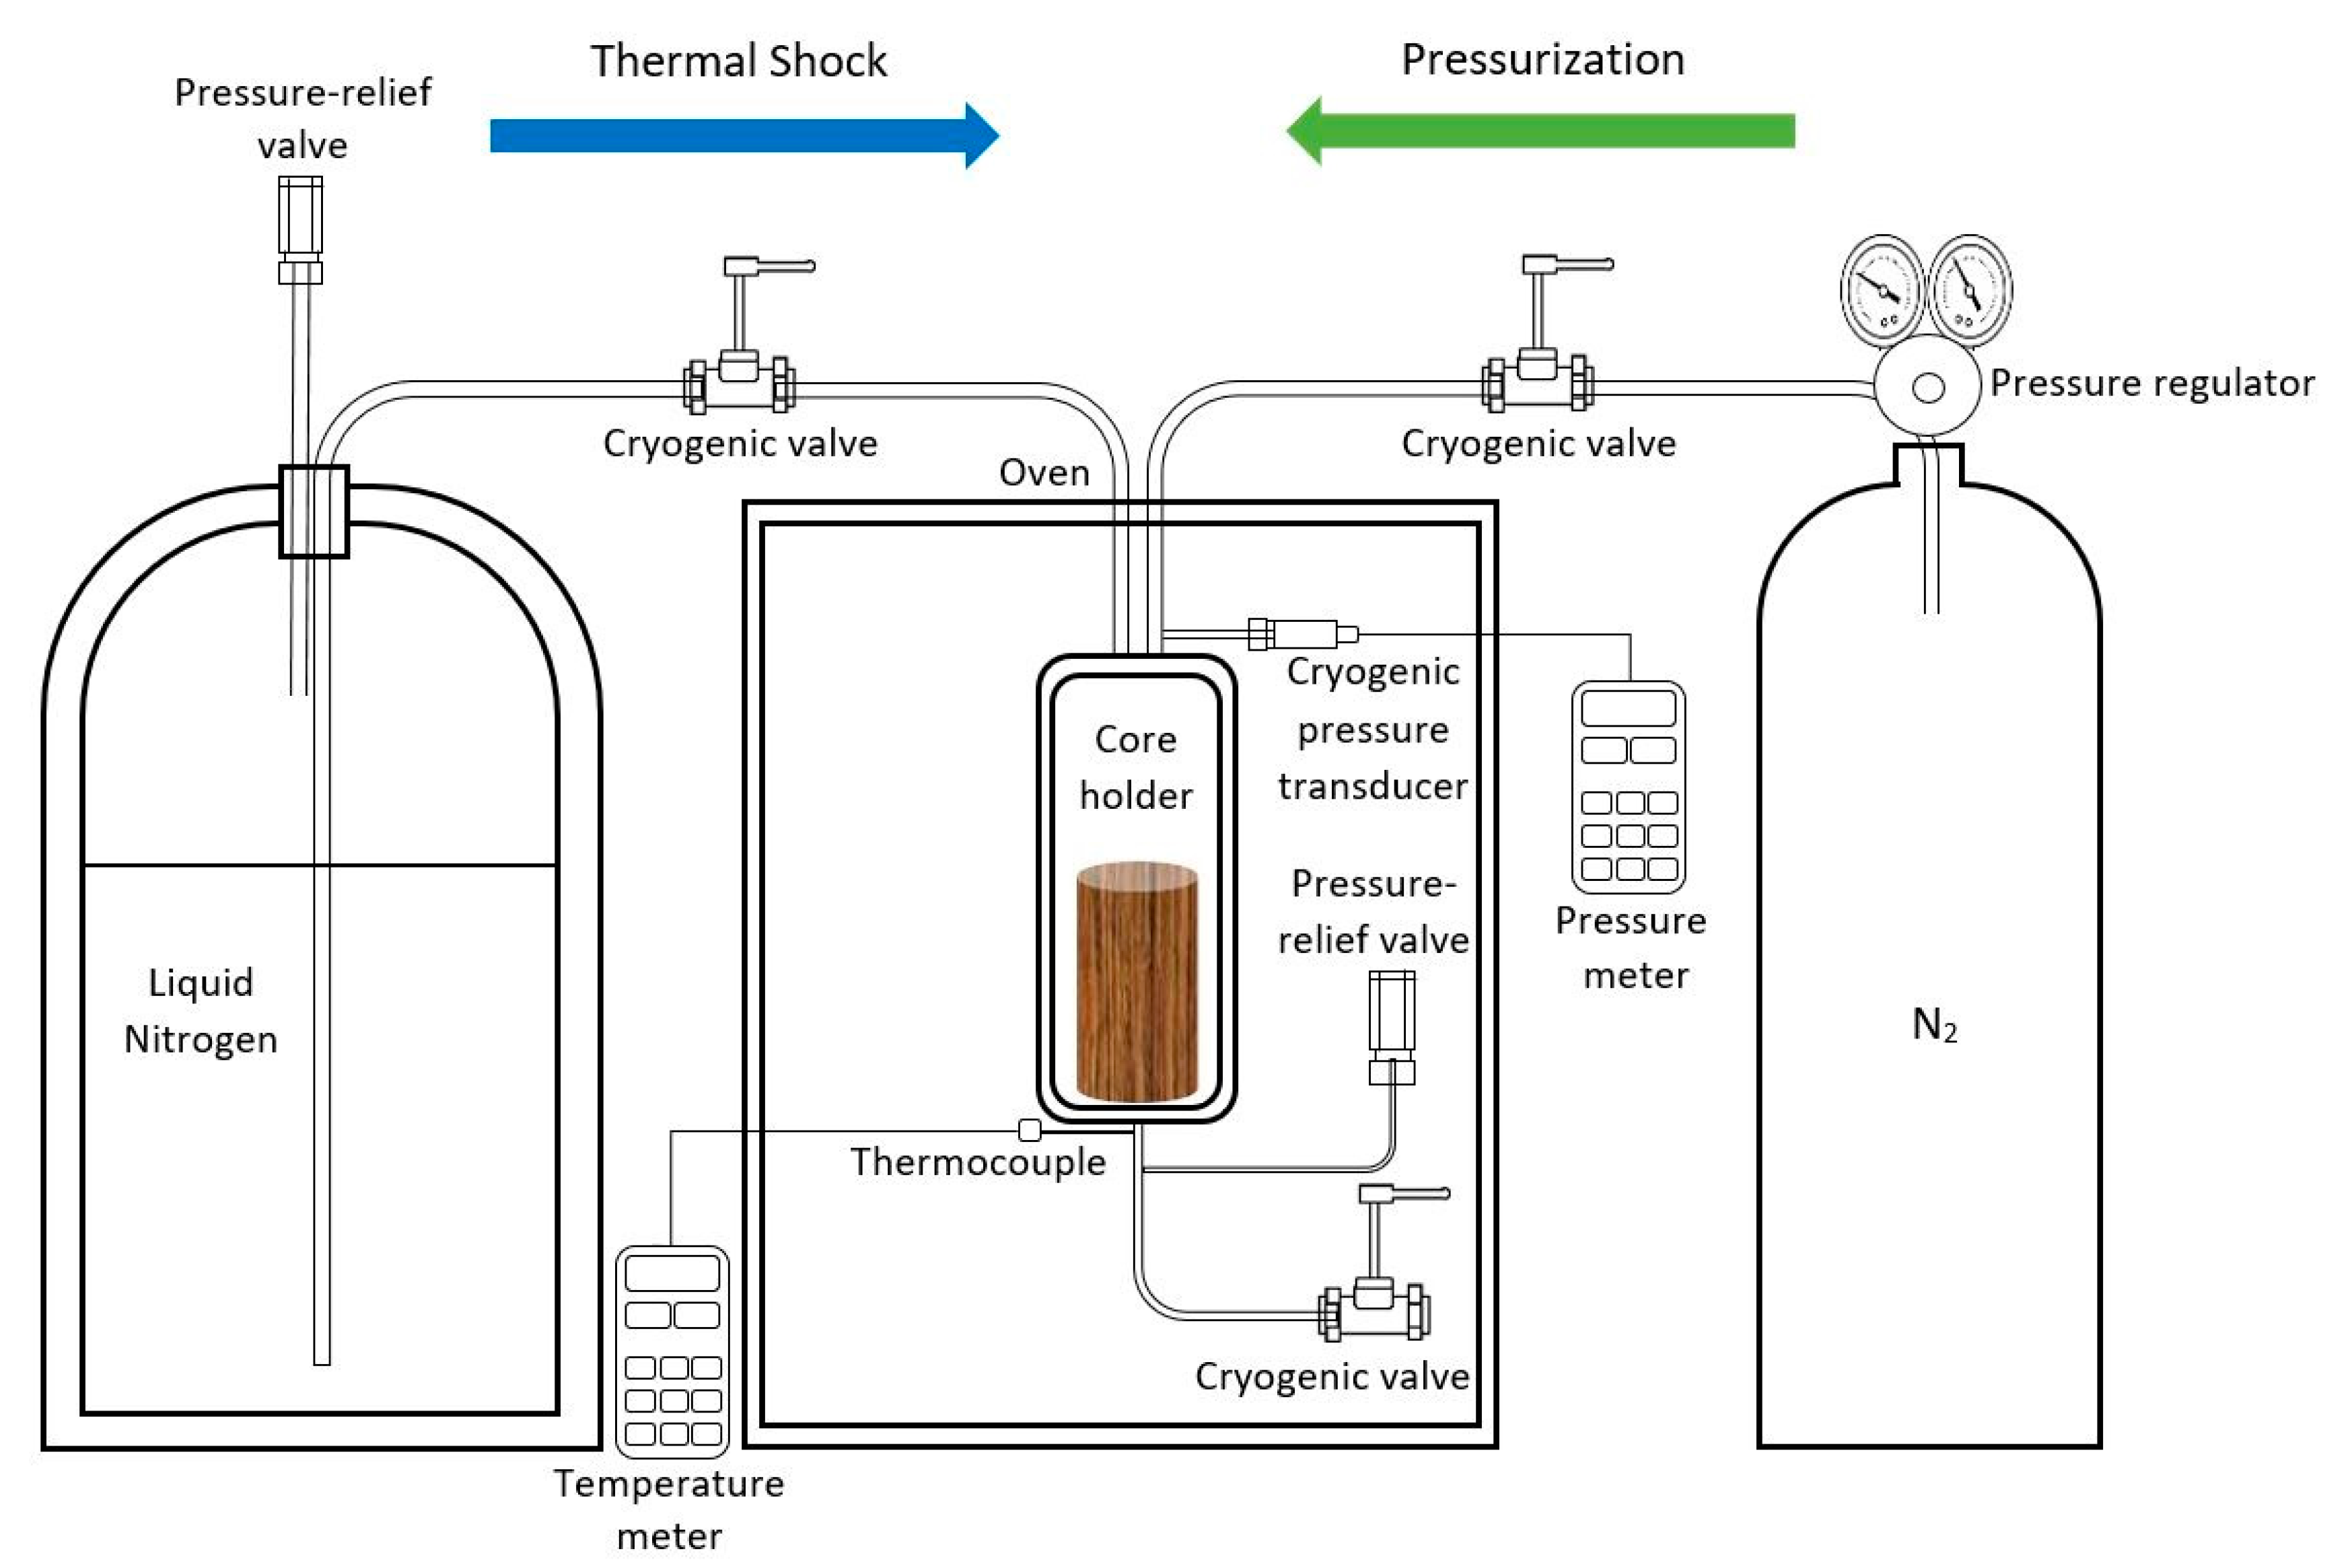
Figure 2 illustrates the setup of the cryogenic treatment that contains a Vertical Gas-Liquid Cylinder (VGL) to inject LN2 at 0.14 MPa, a nitrogen gas cylinder to pressurize the samples, a regulator to control the gas injection pressure, a core holder to contain the samples, a laboratory oven to apply the Marcellus average reservoir temperature of 66 °C, a cryogenic pressure transducer to record the core holder pressure, a T-type thermocouple to record the core holder temperature, pressure and temperature meters to record the pressure and temperature during the tests, cryogenic valves to open and close the setup, and relief-valves to relieve any extra pressure in the setup. All fittings, valves, tubing, thermocouples, and pressure transducers were capable to withstand cryogenic temperature (−177 °C) for safety purposes. It is worth noting that the maximum safe injection pressure that could be applied to the setup was 4.14 MPa due to the pressure limitation of the cryogenic pressure transducer.
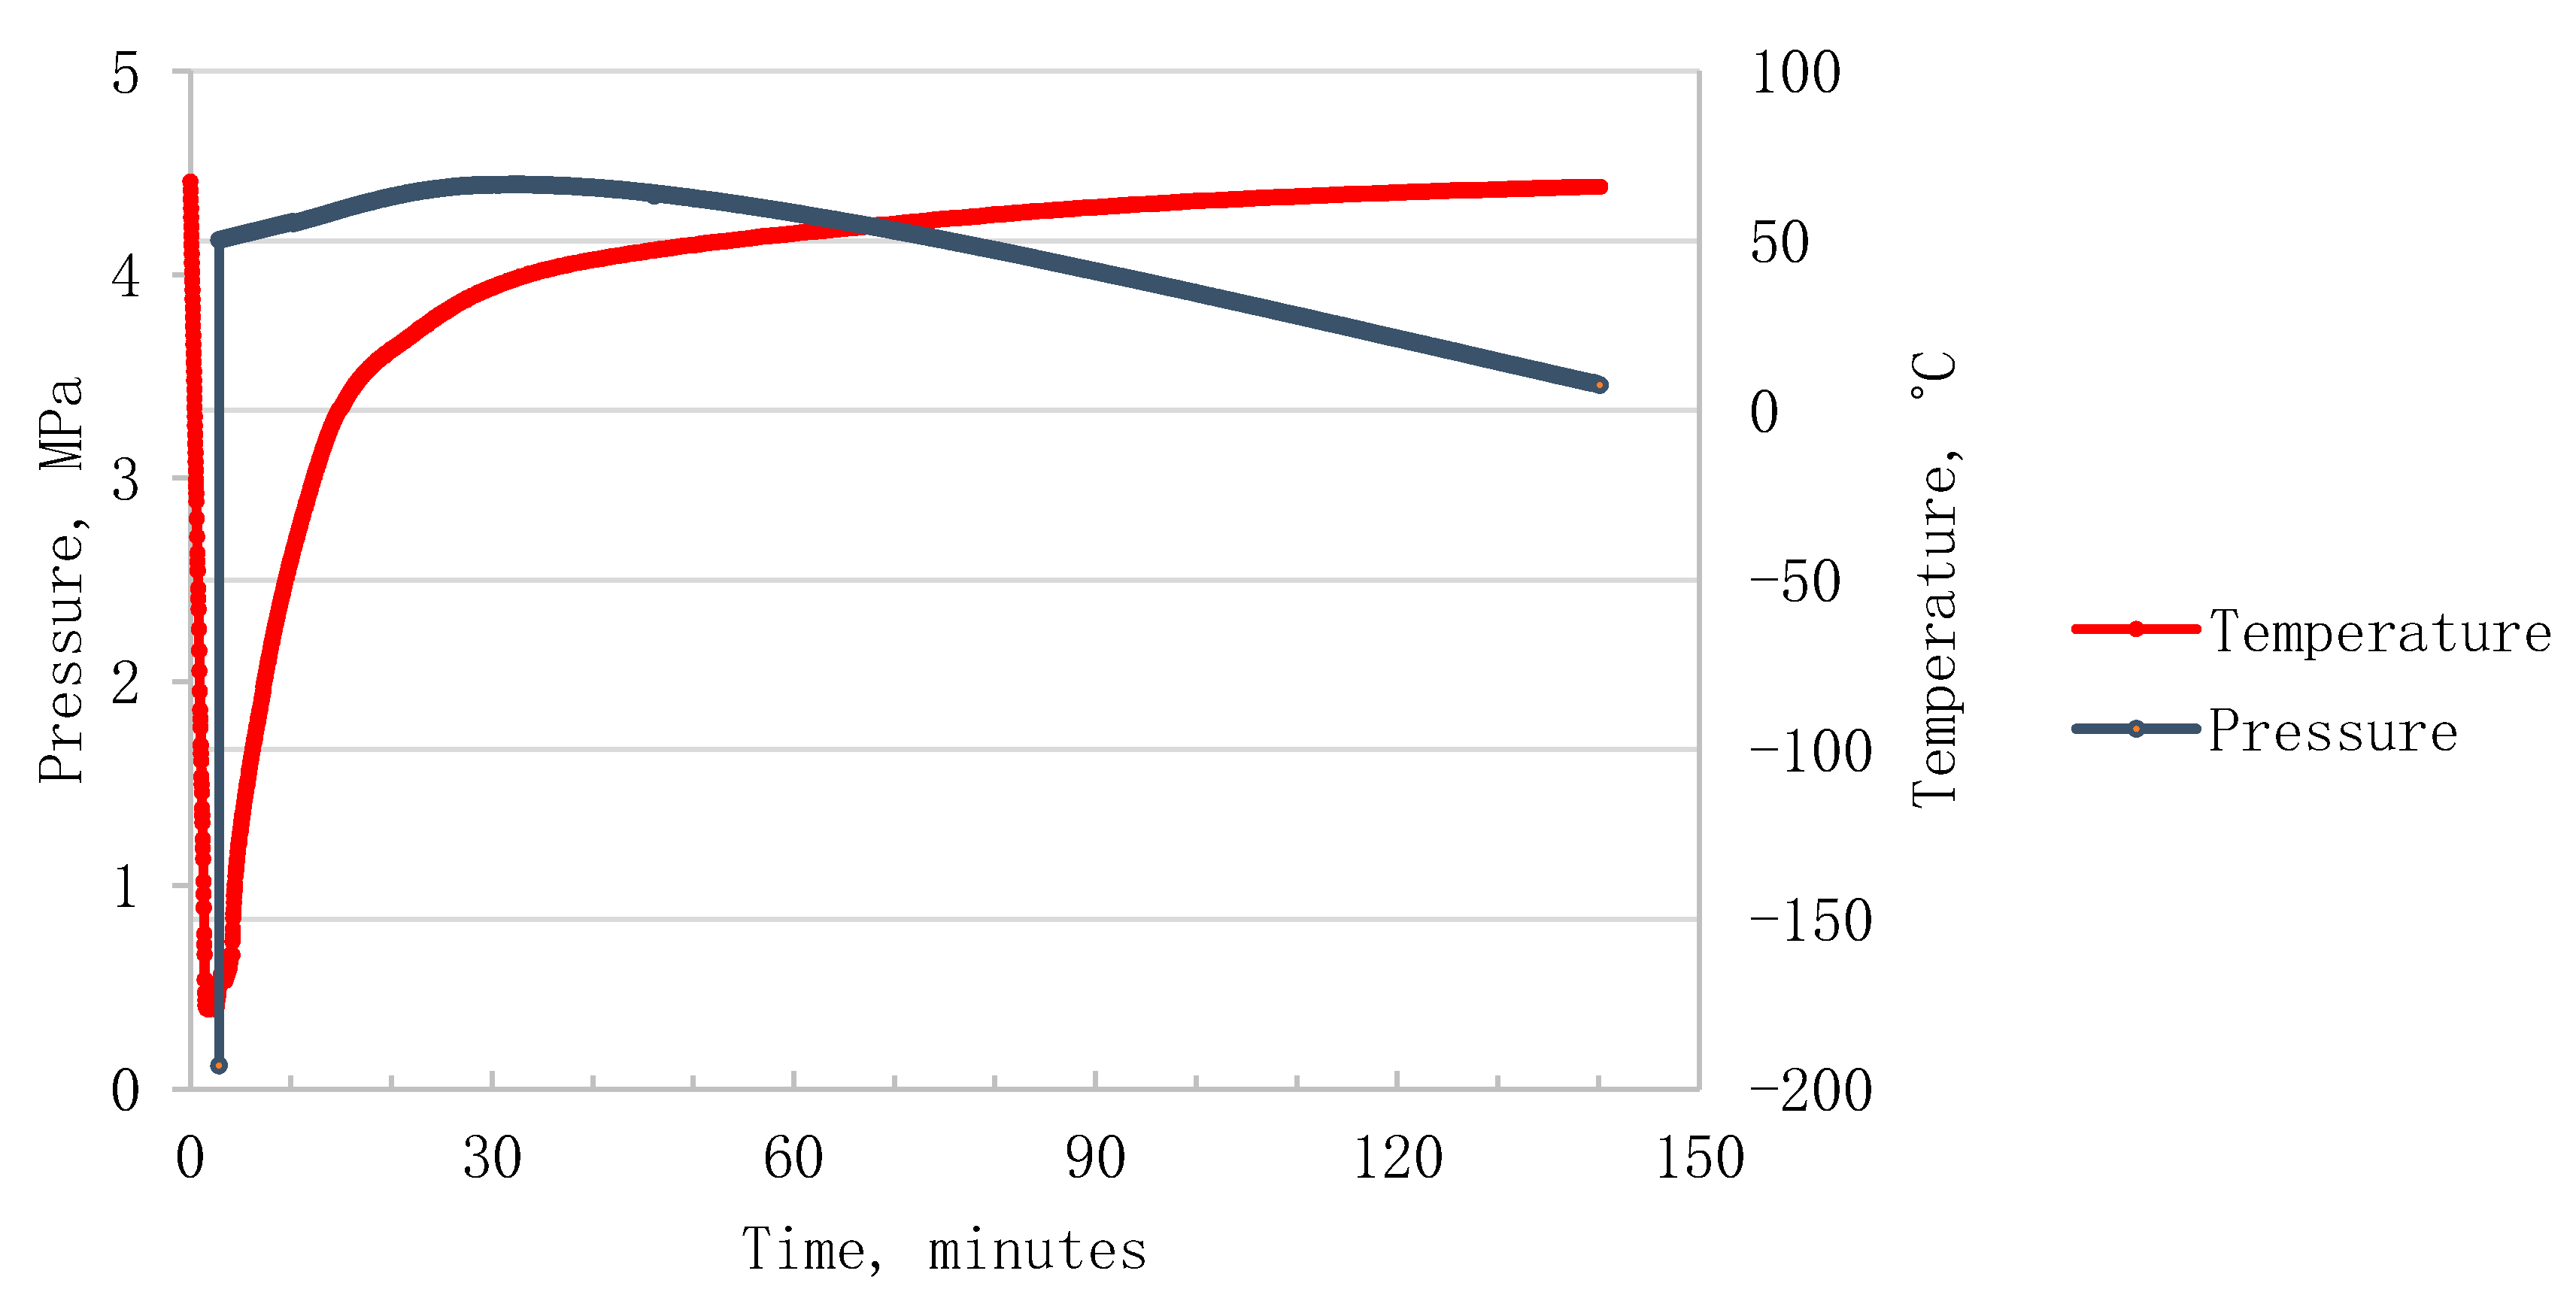
Polytetrafluoroethylene (PTFE) Teflon (heat-shrinking sleeve) was applied on ten Marcellus core samples to prevent the samples from breaking apart during cryogenic treatments and to avoid oil contaminations during permeability and velocity tests. The temperature operating range of PTFE sleeves is between 260 °C and −270 °C. After heating the core samples to 66 °C, the average reservoir temperature, sixty cubic centimeters of LN2 (as low as −177 °C) were injected into the setup including the core samples, thermal shock process, at 0.14 MPa. Then, using nitrogen, nine samples were pressurized at 1.38, 2.76, and 4.14 MPa (each pressure was applied on three core samples) while the tenth was not pressurized at all. During each cryogenic treatment, the temperature and pressure of the setup were recorded using a T-type thermocouple and a cryogenic pressure transducer. Figure 3 demonstrates the real-time pressure and temperature responses at the 4.14 MPa injection pressure. When LN2 was injected into the setup, the temperature rapidly decreased to −177 °C. Within 138 min, the setup temperature increased again to 66 °C using the laboratory oven, and as a result, the pressure was supposed to increase as well. However, the pressure was approximately maintained at injection pressures of 1.38, 2.76, and 4.14 MPa by automatically opening the cryogenic pressure-relief valves.
3. Results and Discussion
The core samples mineralogical compositions were determined using X-ray diffraction (XRD) tests. Figure 4 shows the average core samples mineralogical compositions as 69.8% calcite, 28.5% quartz, 1.2% dolomite, and 0.5% pyrite. The XRD test did not demonstrate any response at a diffraction angle lower than 20°2θ (Figure 5) revealing the absence of clay minerals. Since the samples were from the outcrop, the clay minerals had been most likely weathered away.
Injecting cryogenic fluids into the core samples creates time-dependent tensile stress due to the thermal stress [49] that results in crack initiation inside the samples [24,27]. Then, the temperature of the cryogenic fluids starts to increase when contacting the warm core samples, which turns these fluids into a gaseous phase with an expansion ratio of 1:694 [31]. This expansion increases the pressure, and as a result, the cracks propagate deeper into the samples.
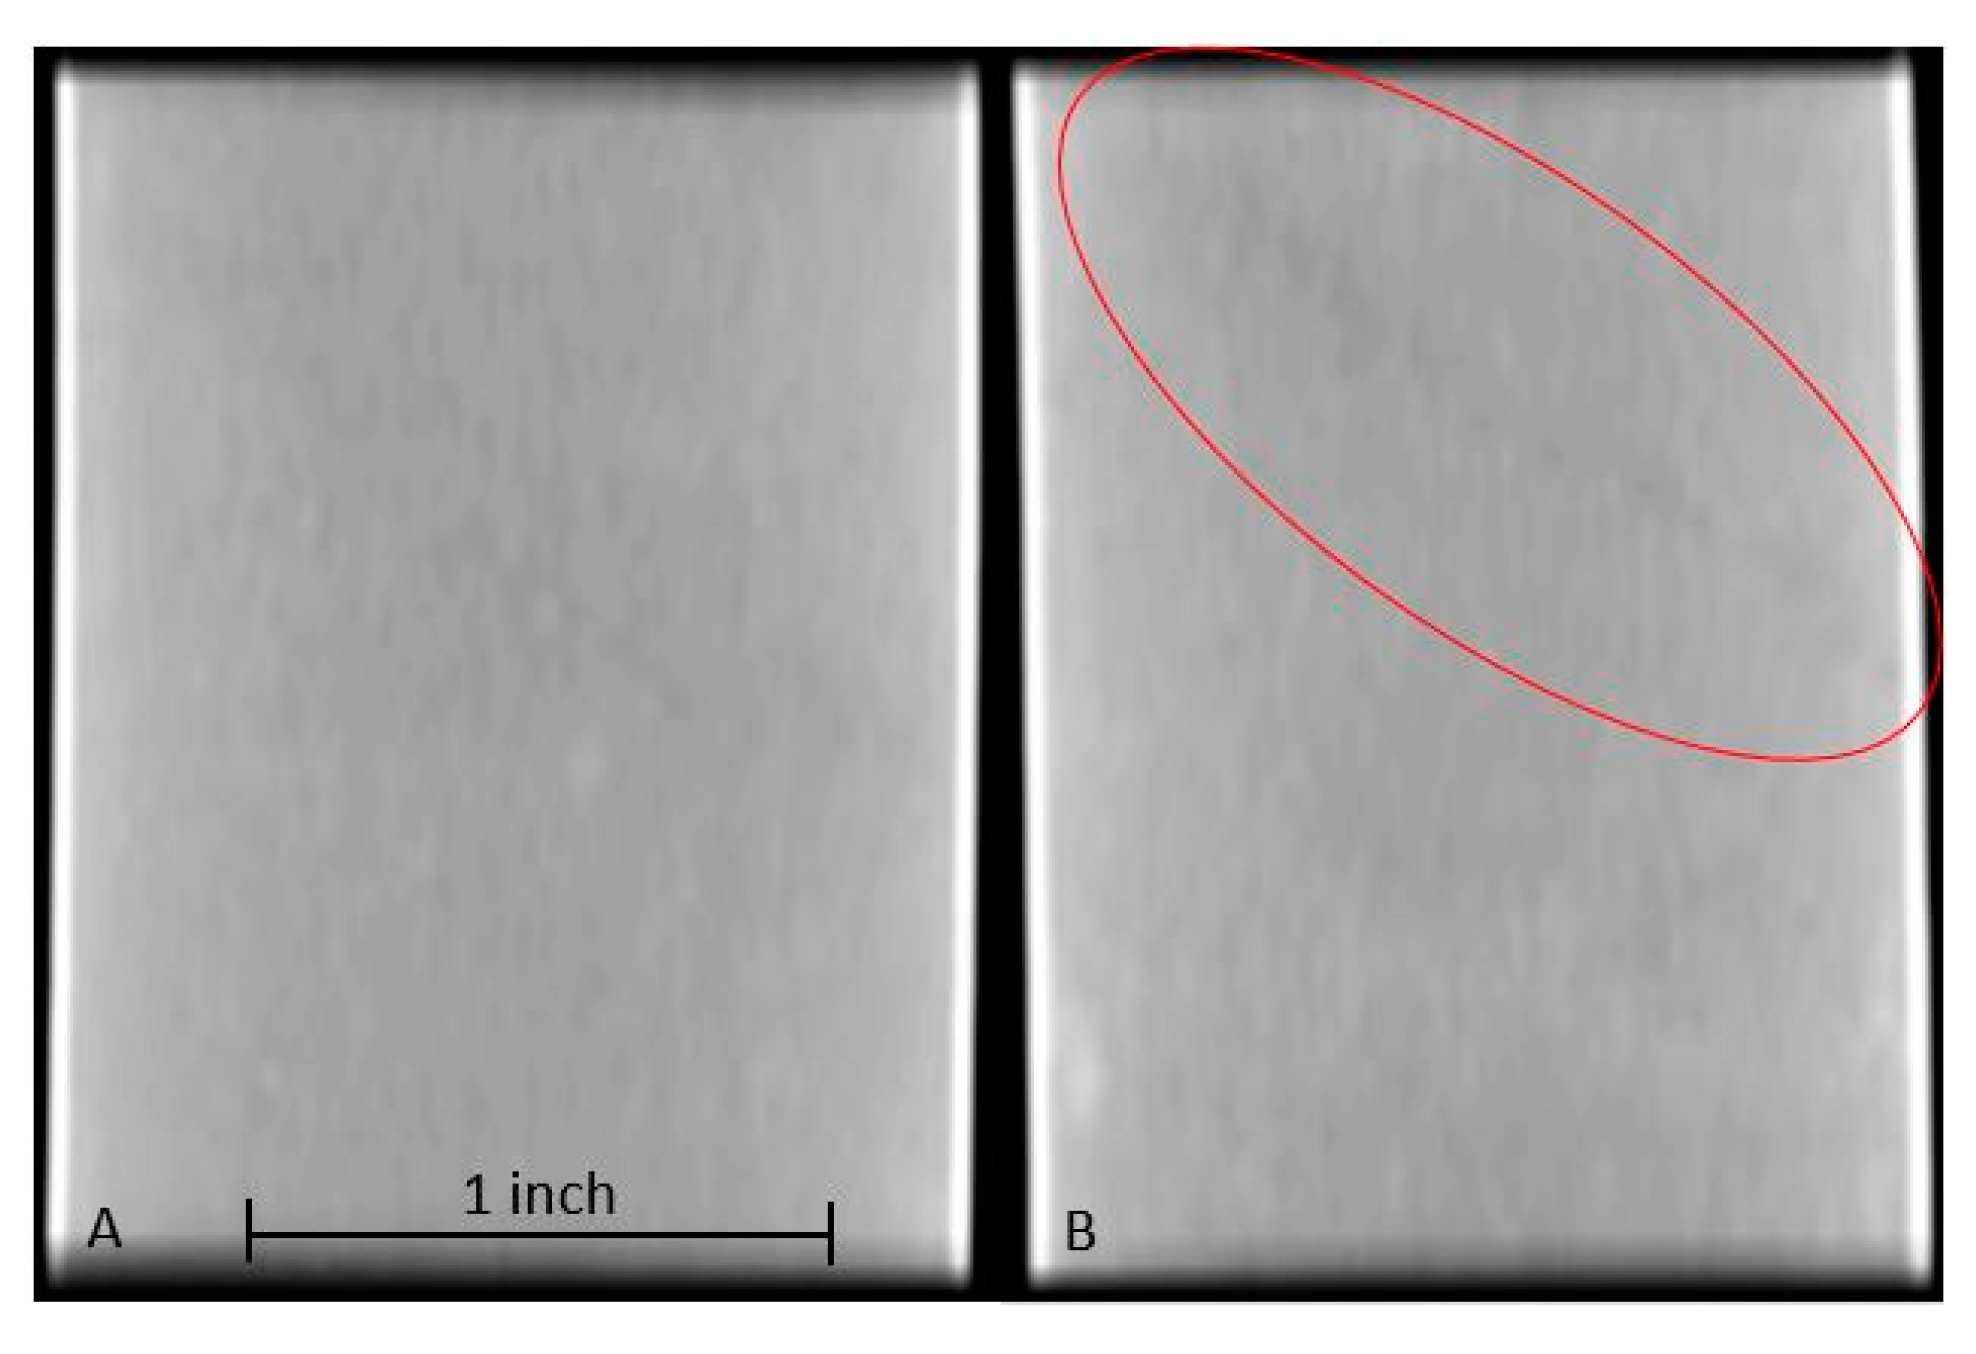
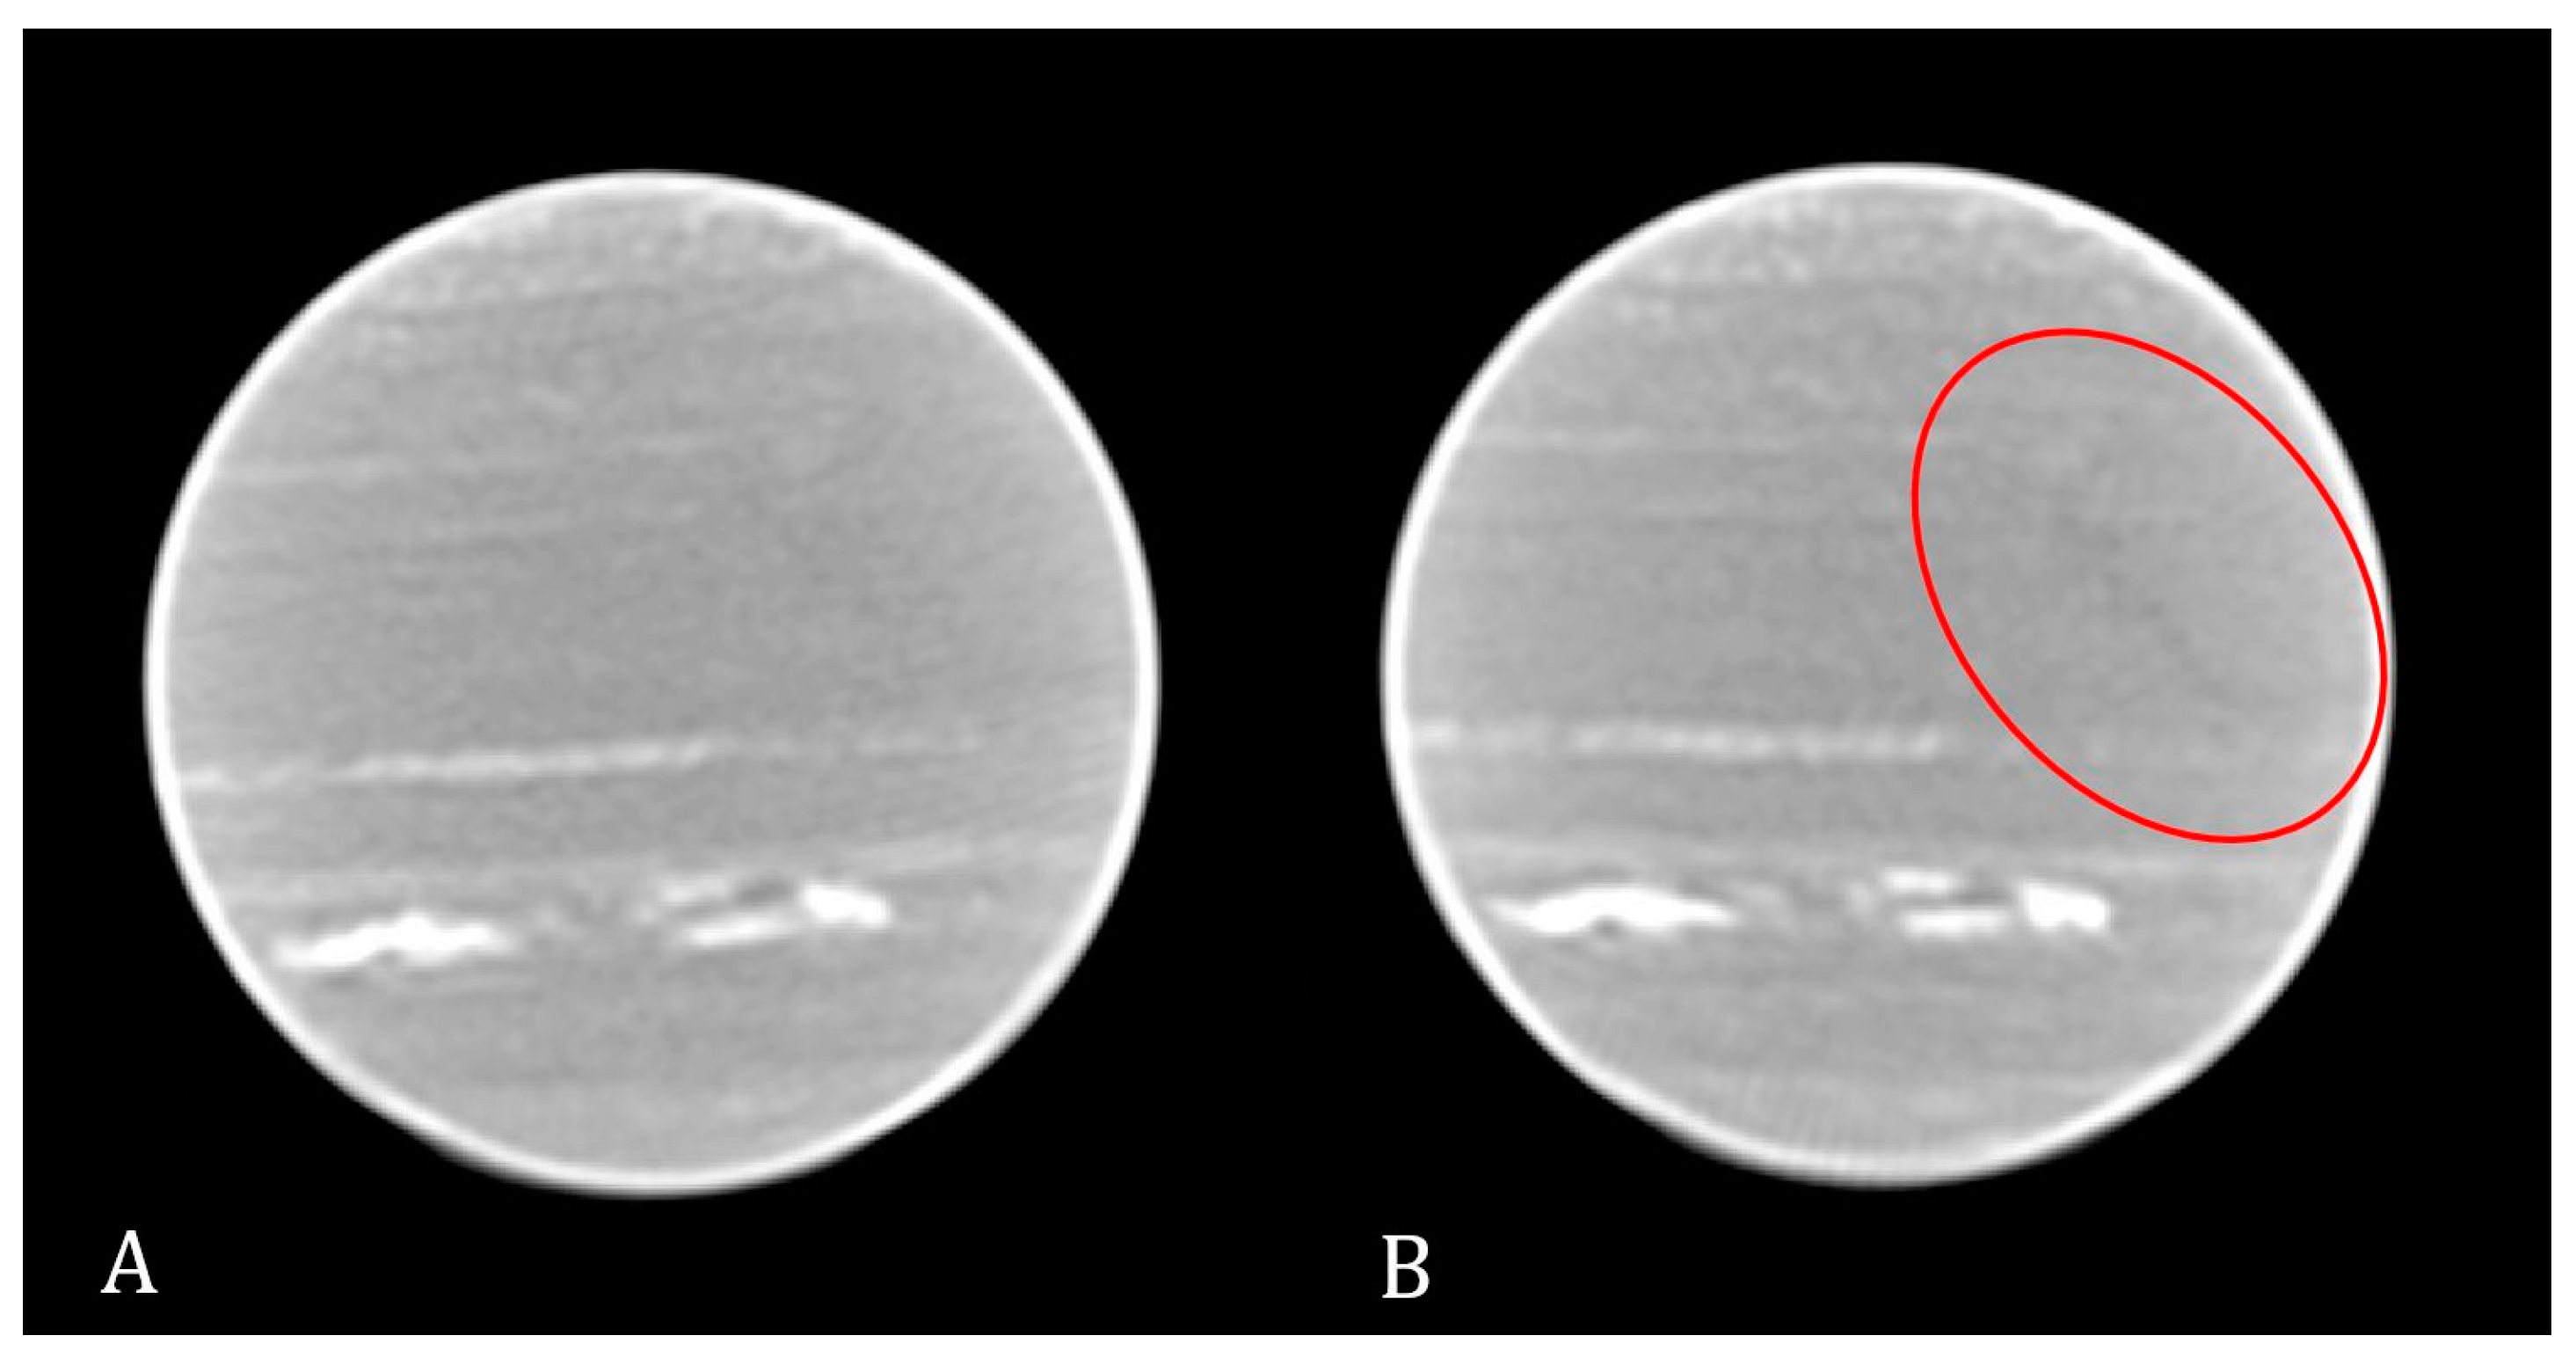
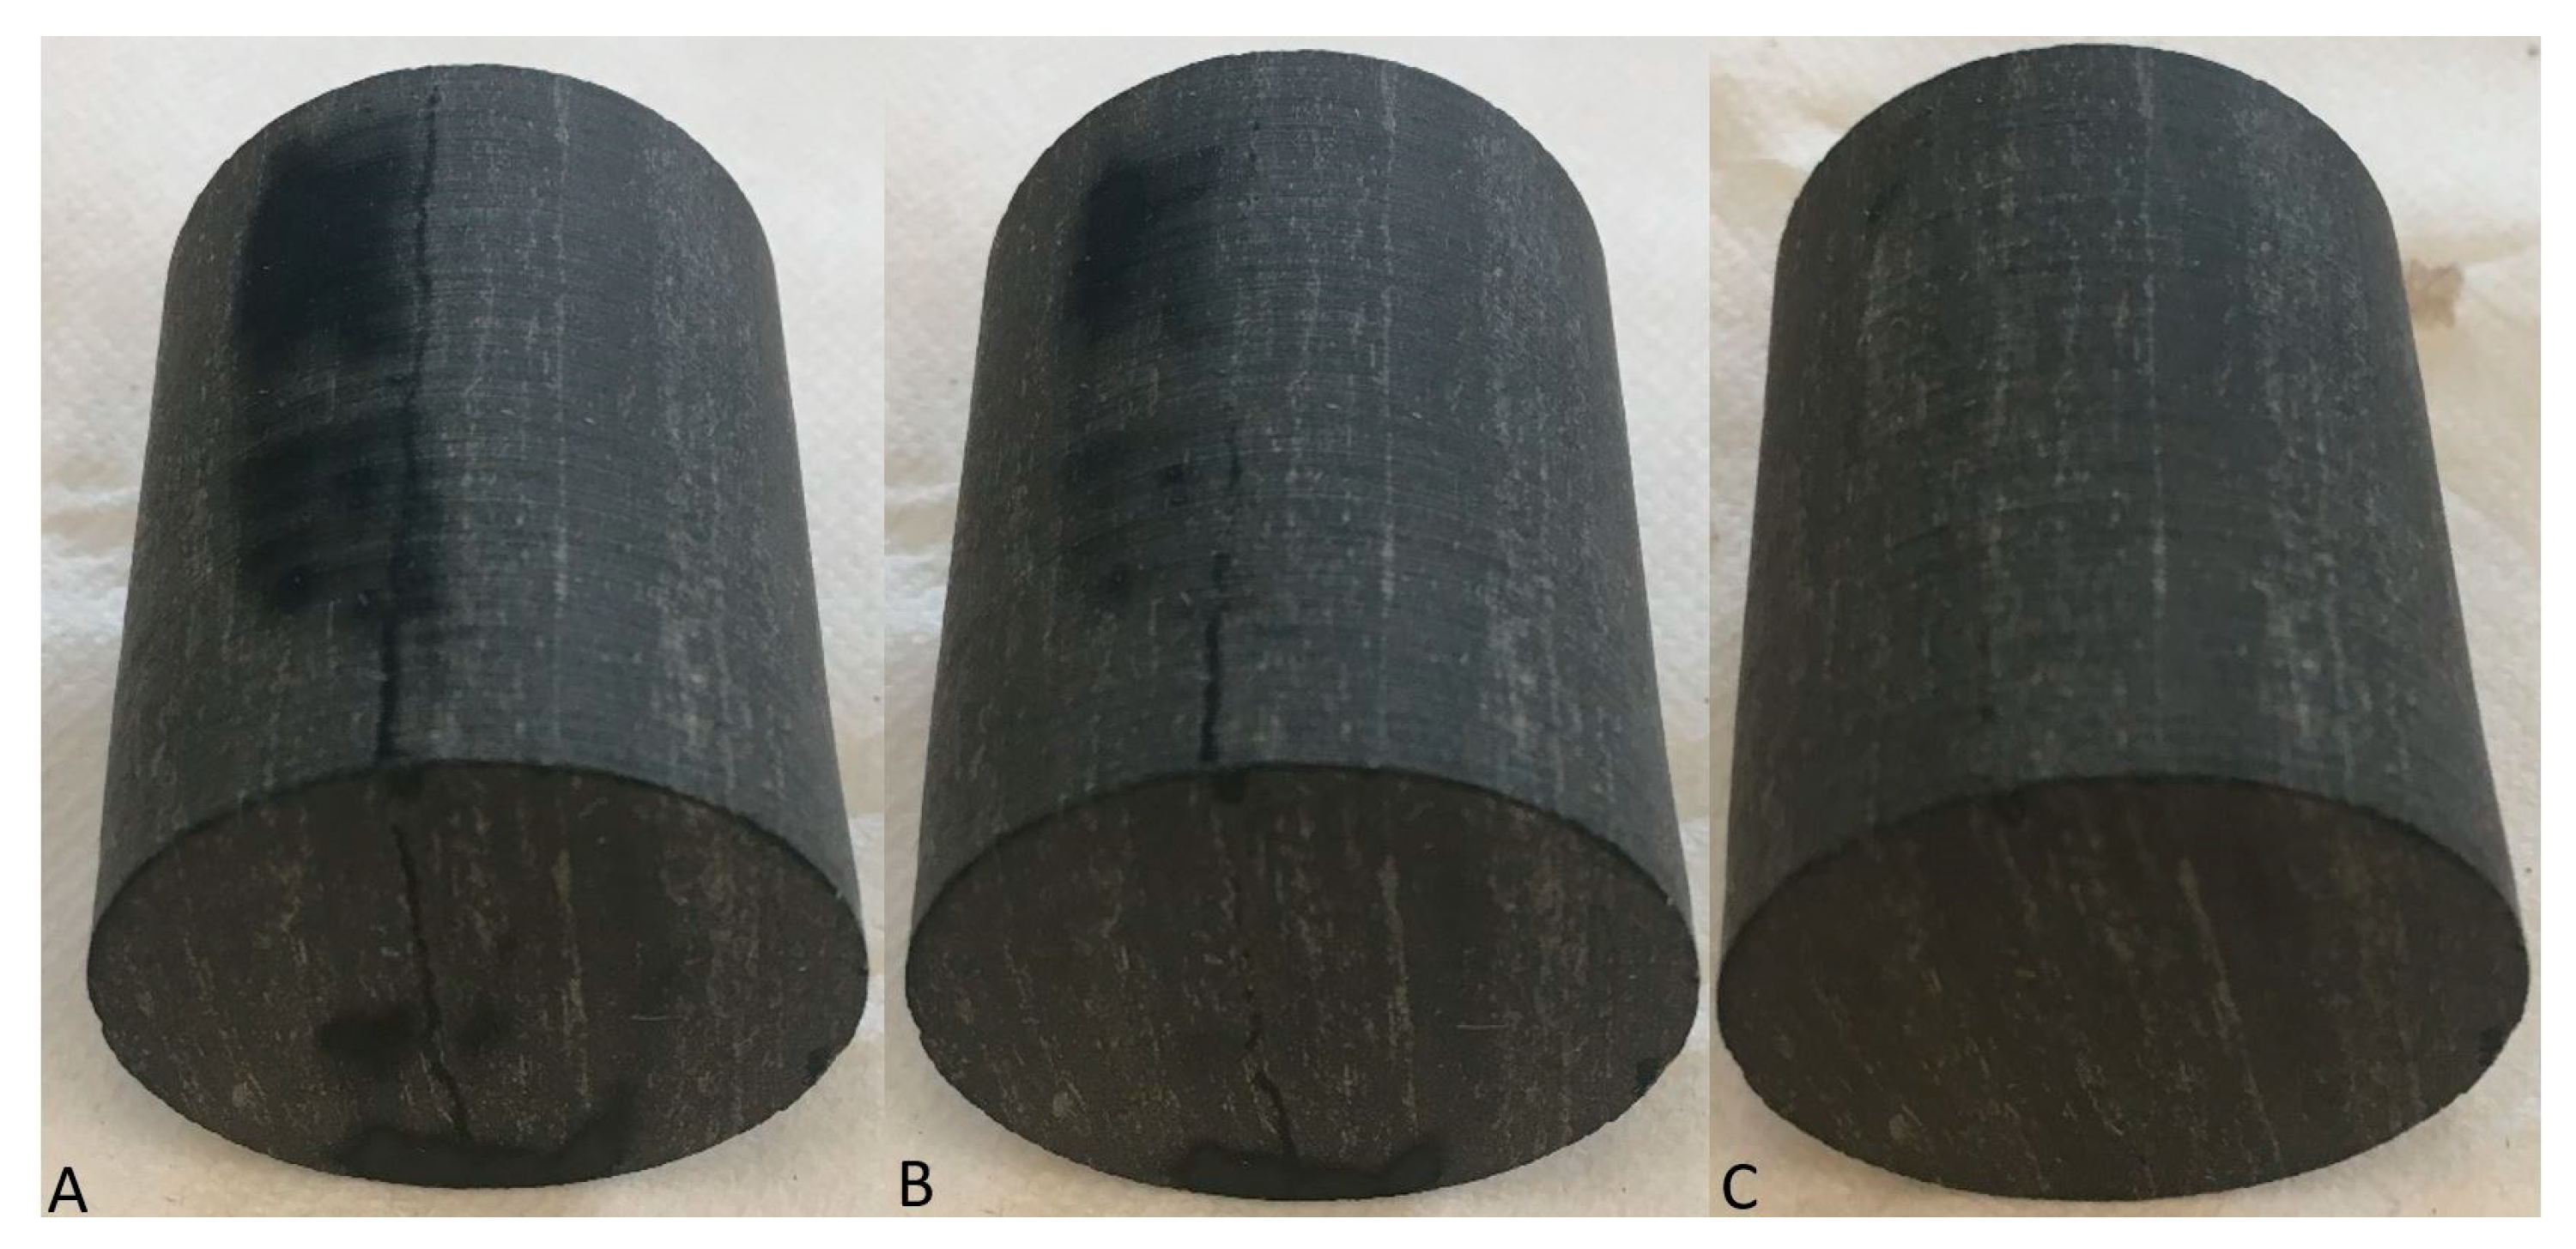
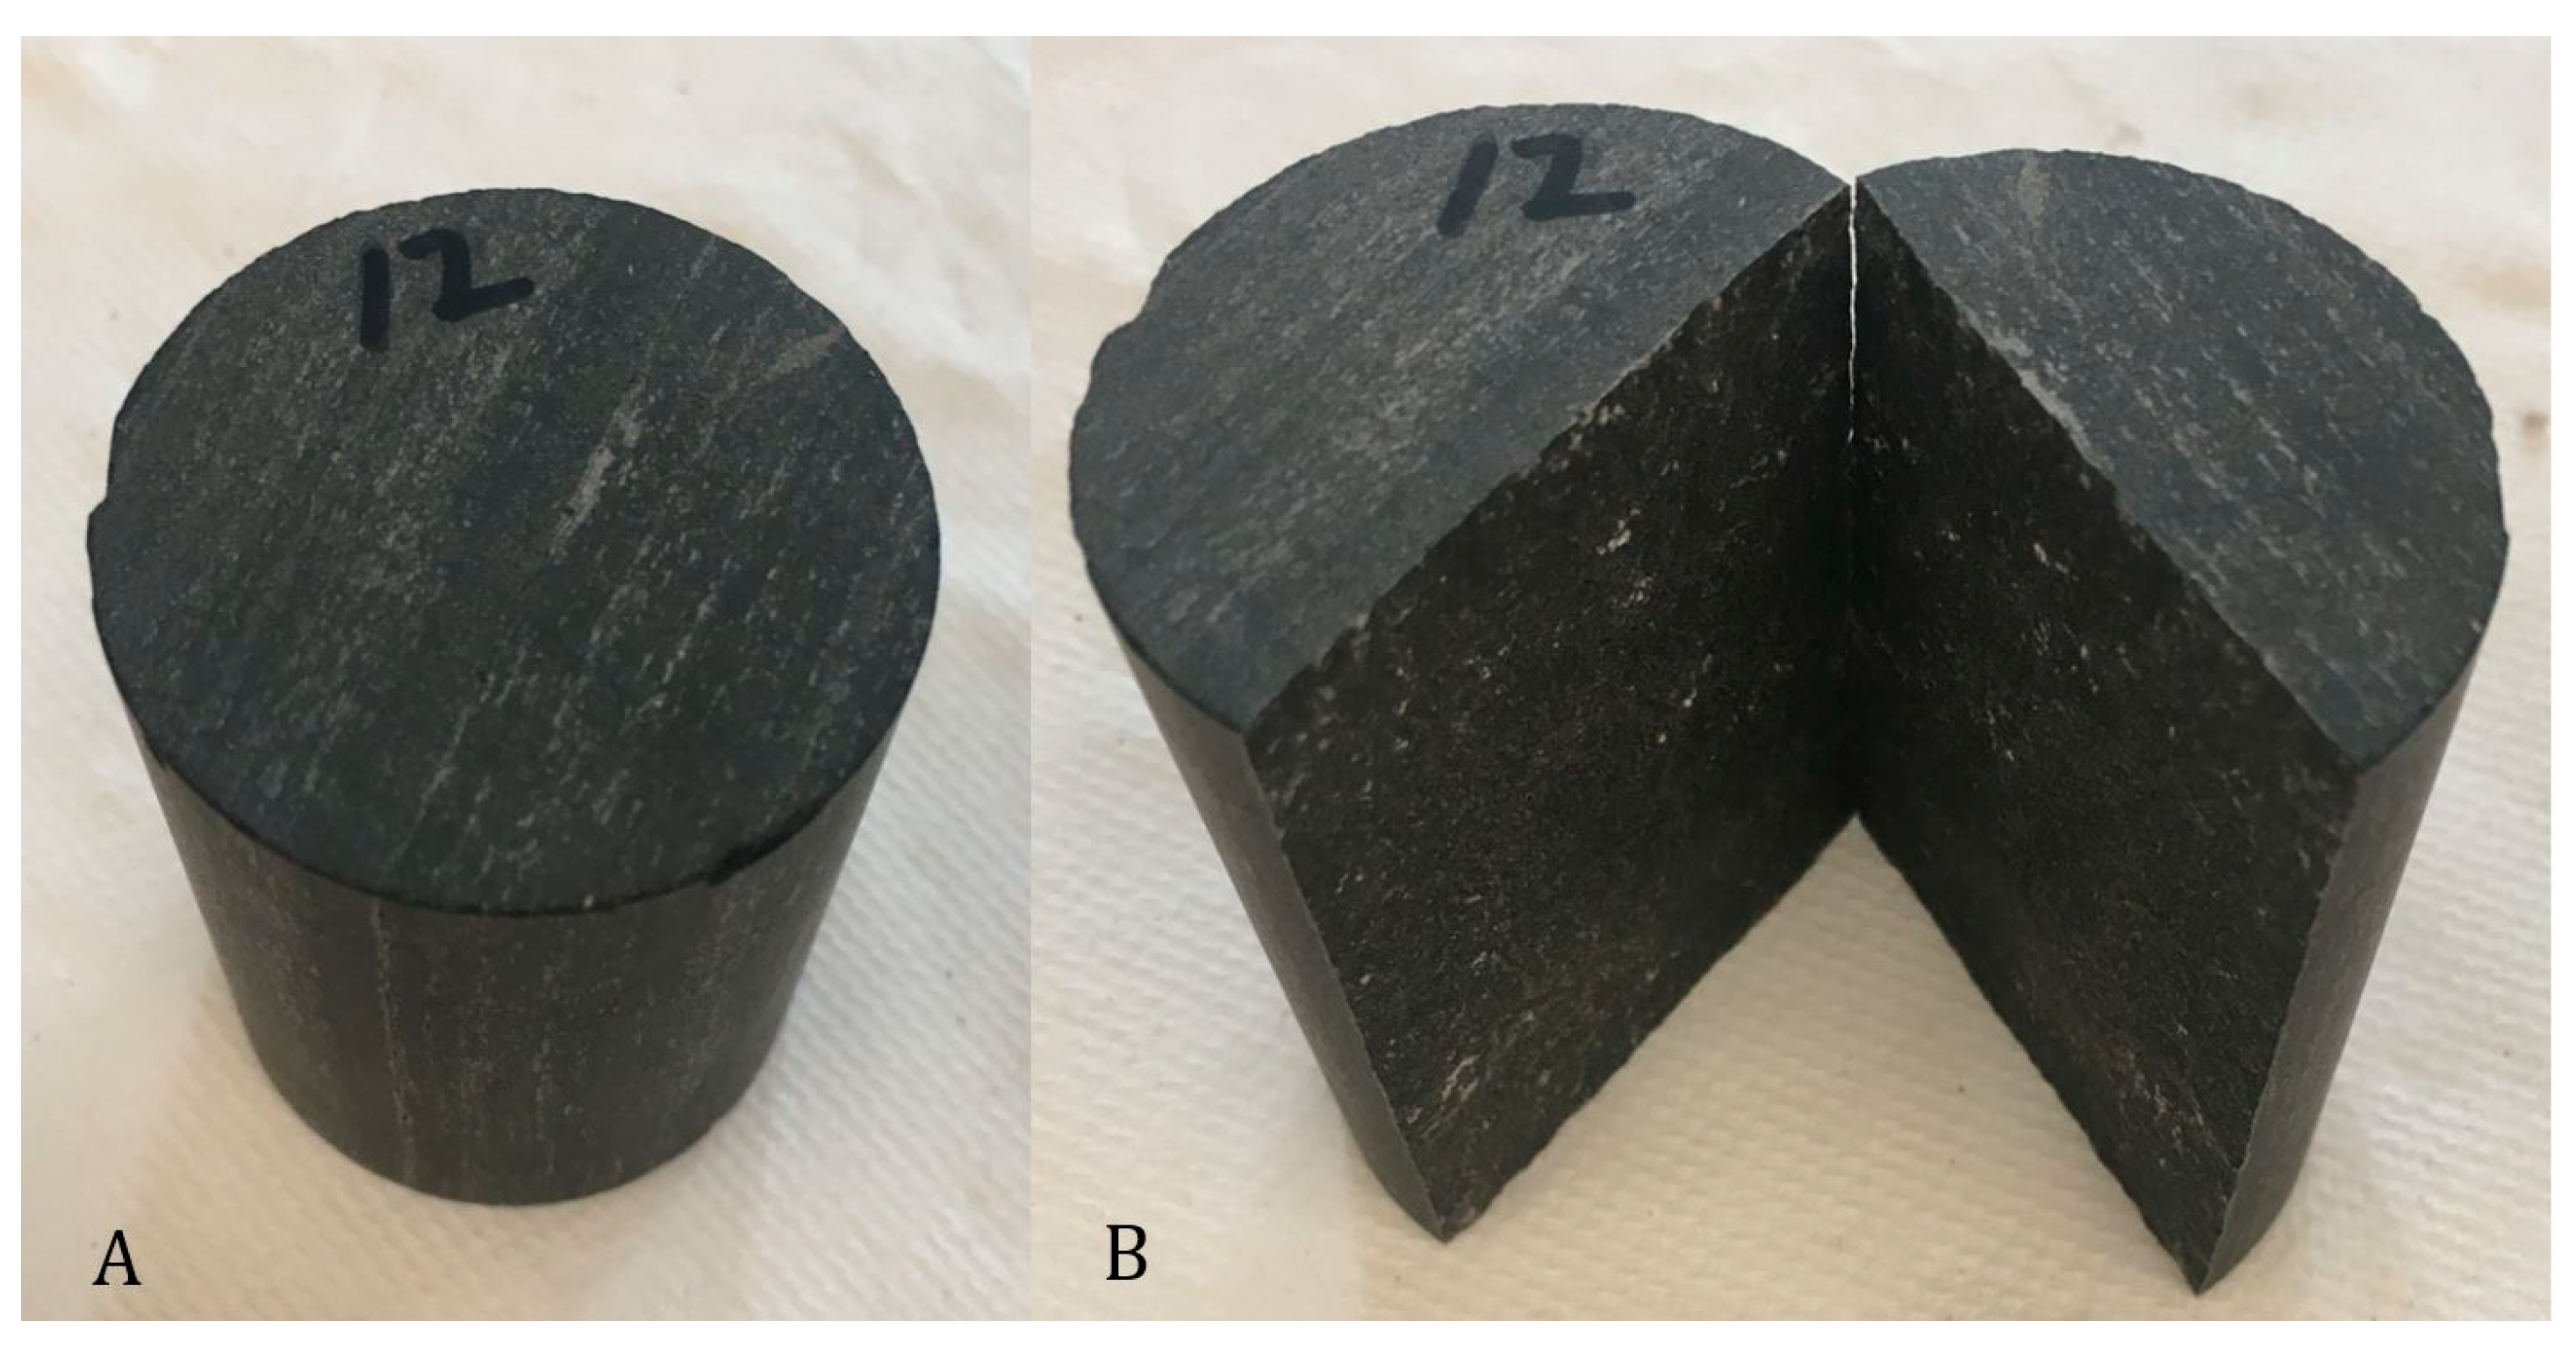
Regardless of the magnitude of the cryogenic treatment pressure, the CT-scan and ultrasonic measurement results demonstrated that conducting such treatments on the samples resulted in the forming of new cracks in every core sample. Figure 6 shows CT scan images of the sample M6 parallel to the sample beddings prior to and after implementing the cryogenic treatment. The top part of Figure 6B shows a fracture that did not exist before the treatment. Also, Figure 7A shows CT scan images of the sample M20 that is perpendicular to the bedding before the cryogenic treatment while Figure 7B shows a CT-scan image after the treatment depicting the existence of a crack. Additionally, the core samples were wiped with toluene to better observe the fractures. Whenever a sample has a fracture, the toluene on the fracture face evaporated lastly, showing the fracture shape (Figure 8). One core sample (M12), cryogenically treated at 4.14 MPa, was fractured into two halves (Figure 9).
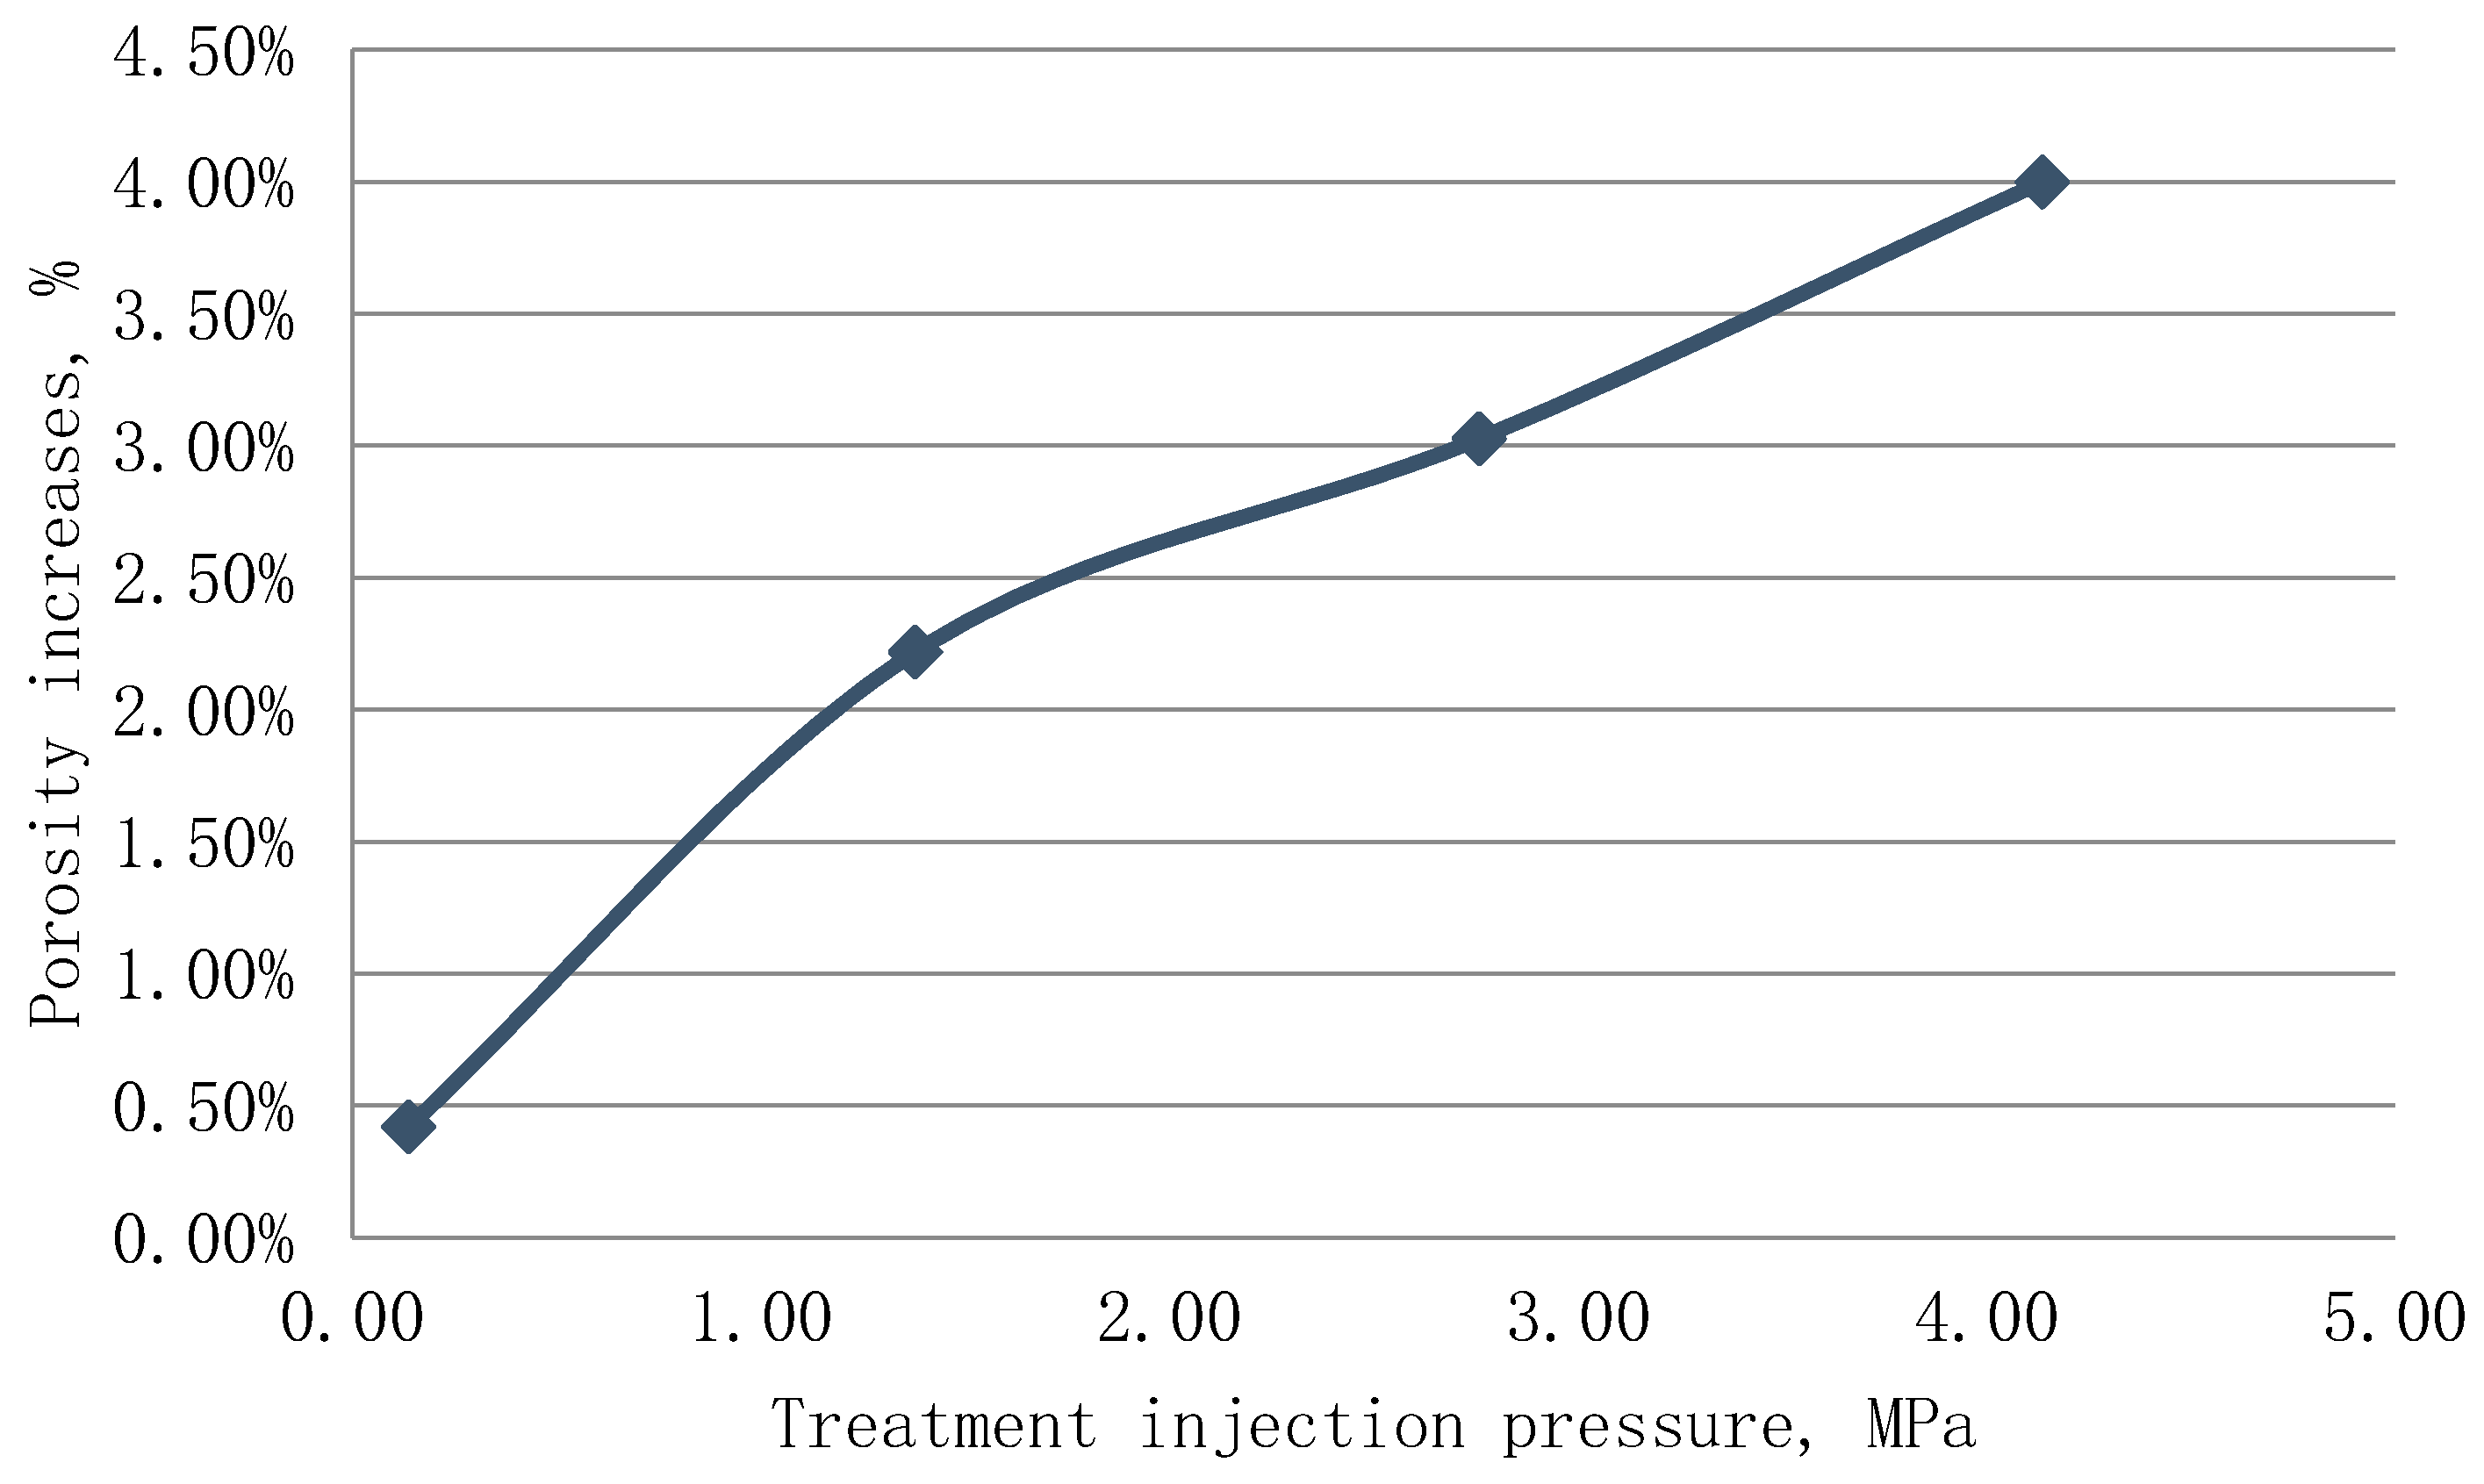
As previously shown, conducting cryogenic treatments on the samples resulted in the formation of new fractures inside the samples leading to porosity and permeability enhancements. Figure 10 and Figure 11 demonstrate a direct relationship between the magnitude of the cryogenic treatment pressurizing and the enhancement of the core samples porosity and permeability. Implementing the cryogenic treatment results in applying high tensile strength on the core samples leading to the initiation of new fractures inside the samples. Then, liquid nitrogen rapidly heats up and turns to a gaseous phase, which increases the pressure inside the created cracks, and as a result, the cracks propagate deeper inside the sample. Hence, increasing the cryogenic treatment pressure results in longer and deeper cracks inside the core samples.
Table 1 demonstrates that the average initial porosities of the sample groups A, B, C, and D were 13.71%, 8.88%, 9.64%, and 8.04%, respectively, and the core samples initial permeabilities were 49.50, 12.93, 13.41, and 9.37 nano-Darcy (nD), respectively. As a result of forming new cracks in the samples due to the cryogenic treatment implementation, the results revealed that the core samples gained extra pore volume of 0.42%, 2.22%, 3.03%, and 4.00% when the samples were cryogenically treated at 0.14, 1.38, 2.76, and 4.14 MPa, respectively. The initial permeability of the core samples is matrix permeability because the CT scan results did not detect any fracture inside the samples and the initial permeability of the core samples was very low (15.7 nD). However, conducting cryogenic treatments on the samples formed new cracks providing new permeable channels inside the core samples and as a result, helium travels fast resulting in significant permeability increments of 21, 439, 1315, and 14,030 folds of increase over the initial permeability at the treatment pressures of 0.14, 1.38, 2.76, and 4.14 MPa, respectively.
It is worth noting that the volumes of the created fractures were significantly smaller than the core samples bulk volume. Hence, the porosity enhancement was not nearly as noticeable as the permeability enhancement. The permeabilities of the core samples after implementing the cryogenic treatments were substantially higher than the initial permeability. Most likely, the permeability of the core samples after conducting such treatments represents the fracture permeability.
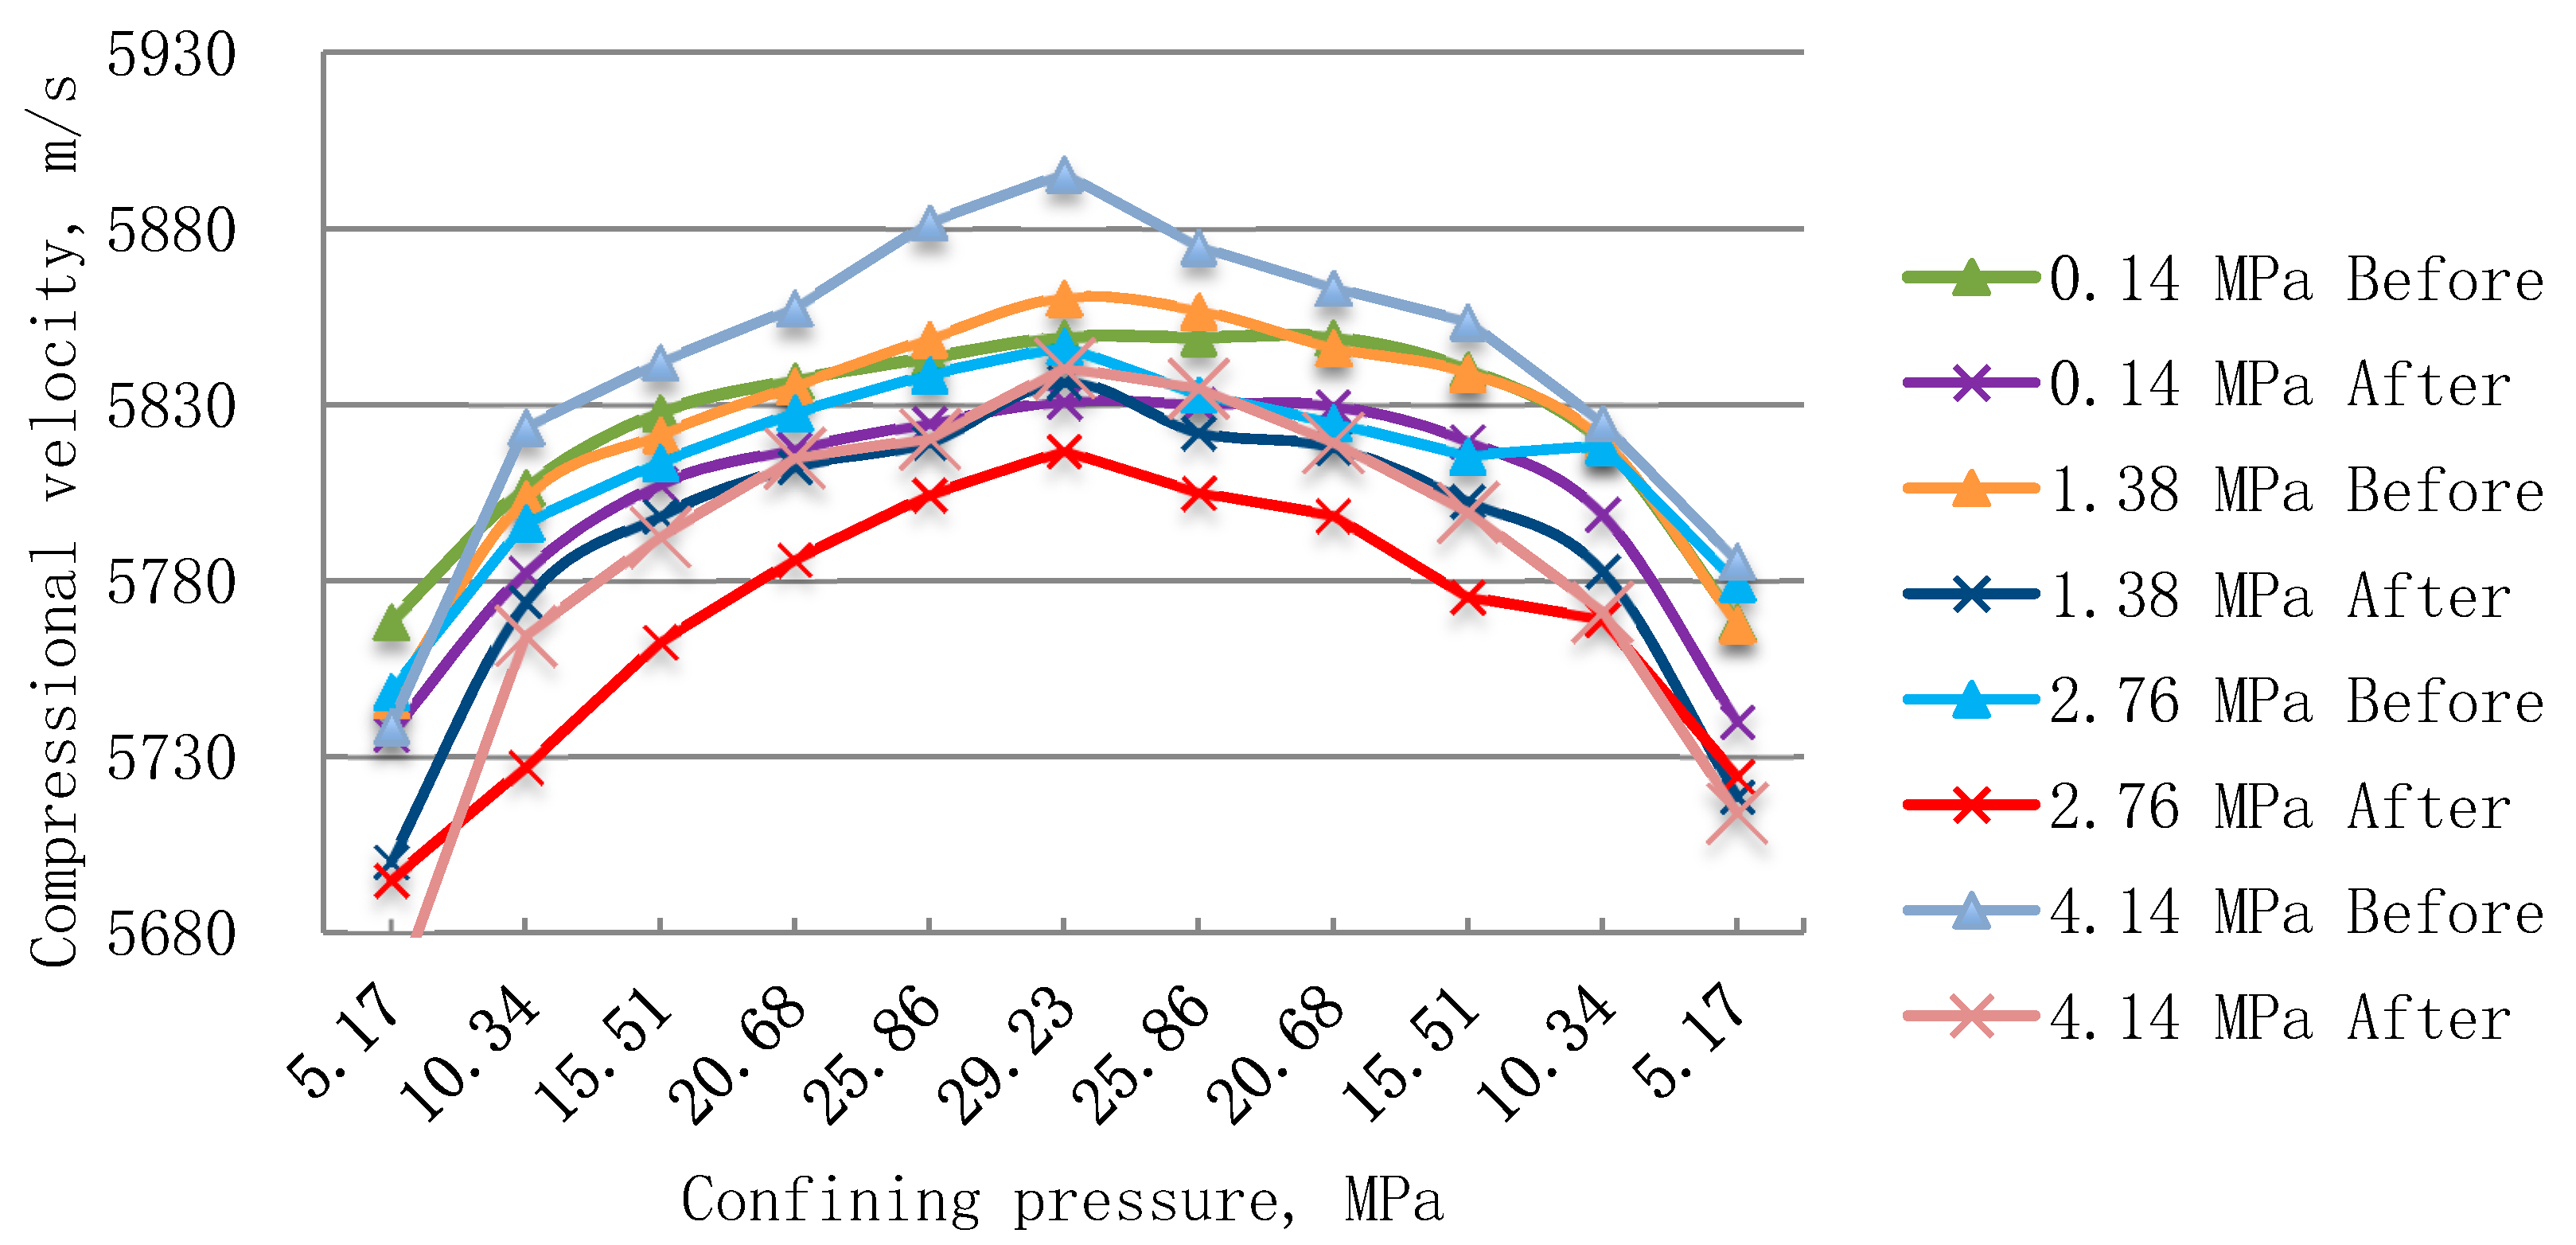
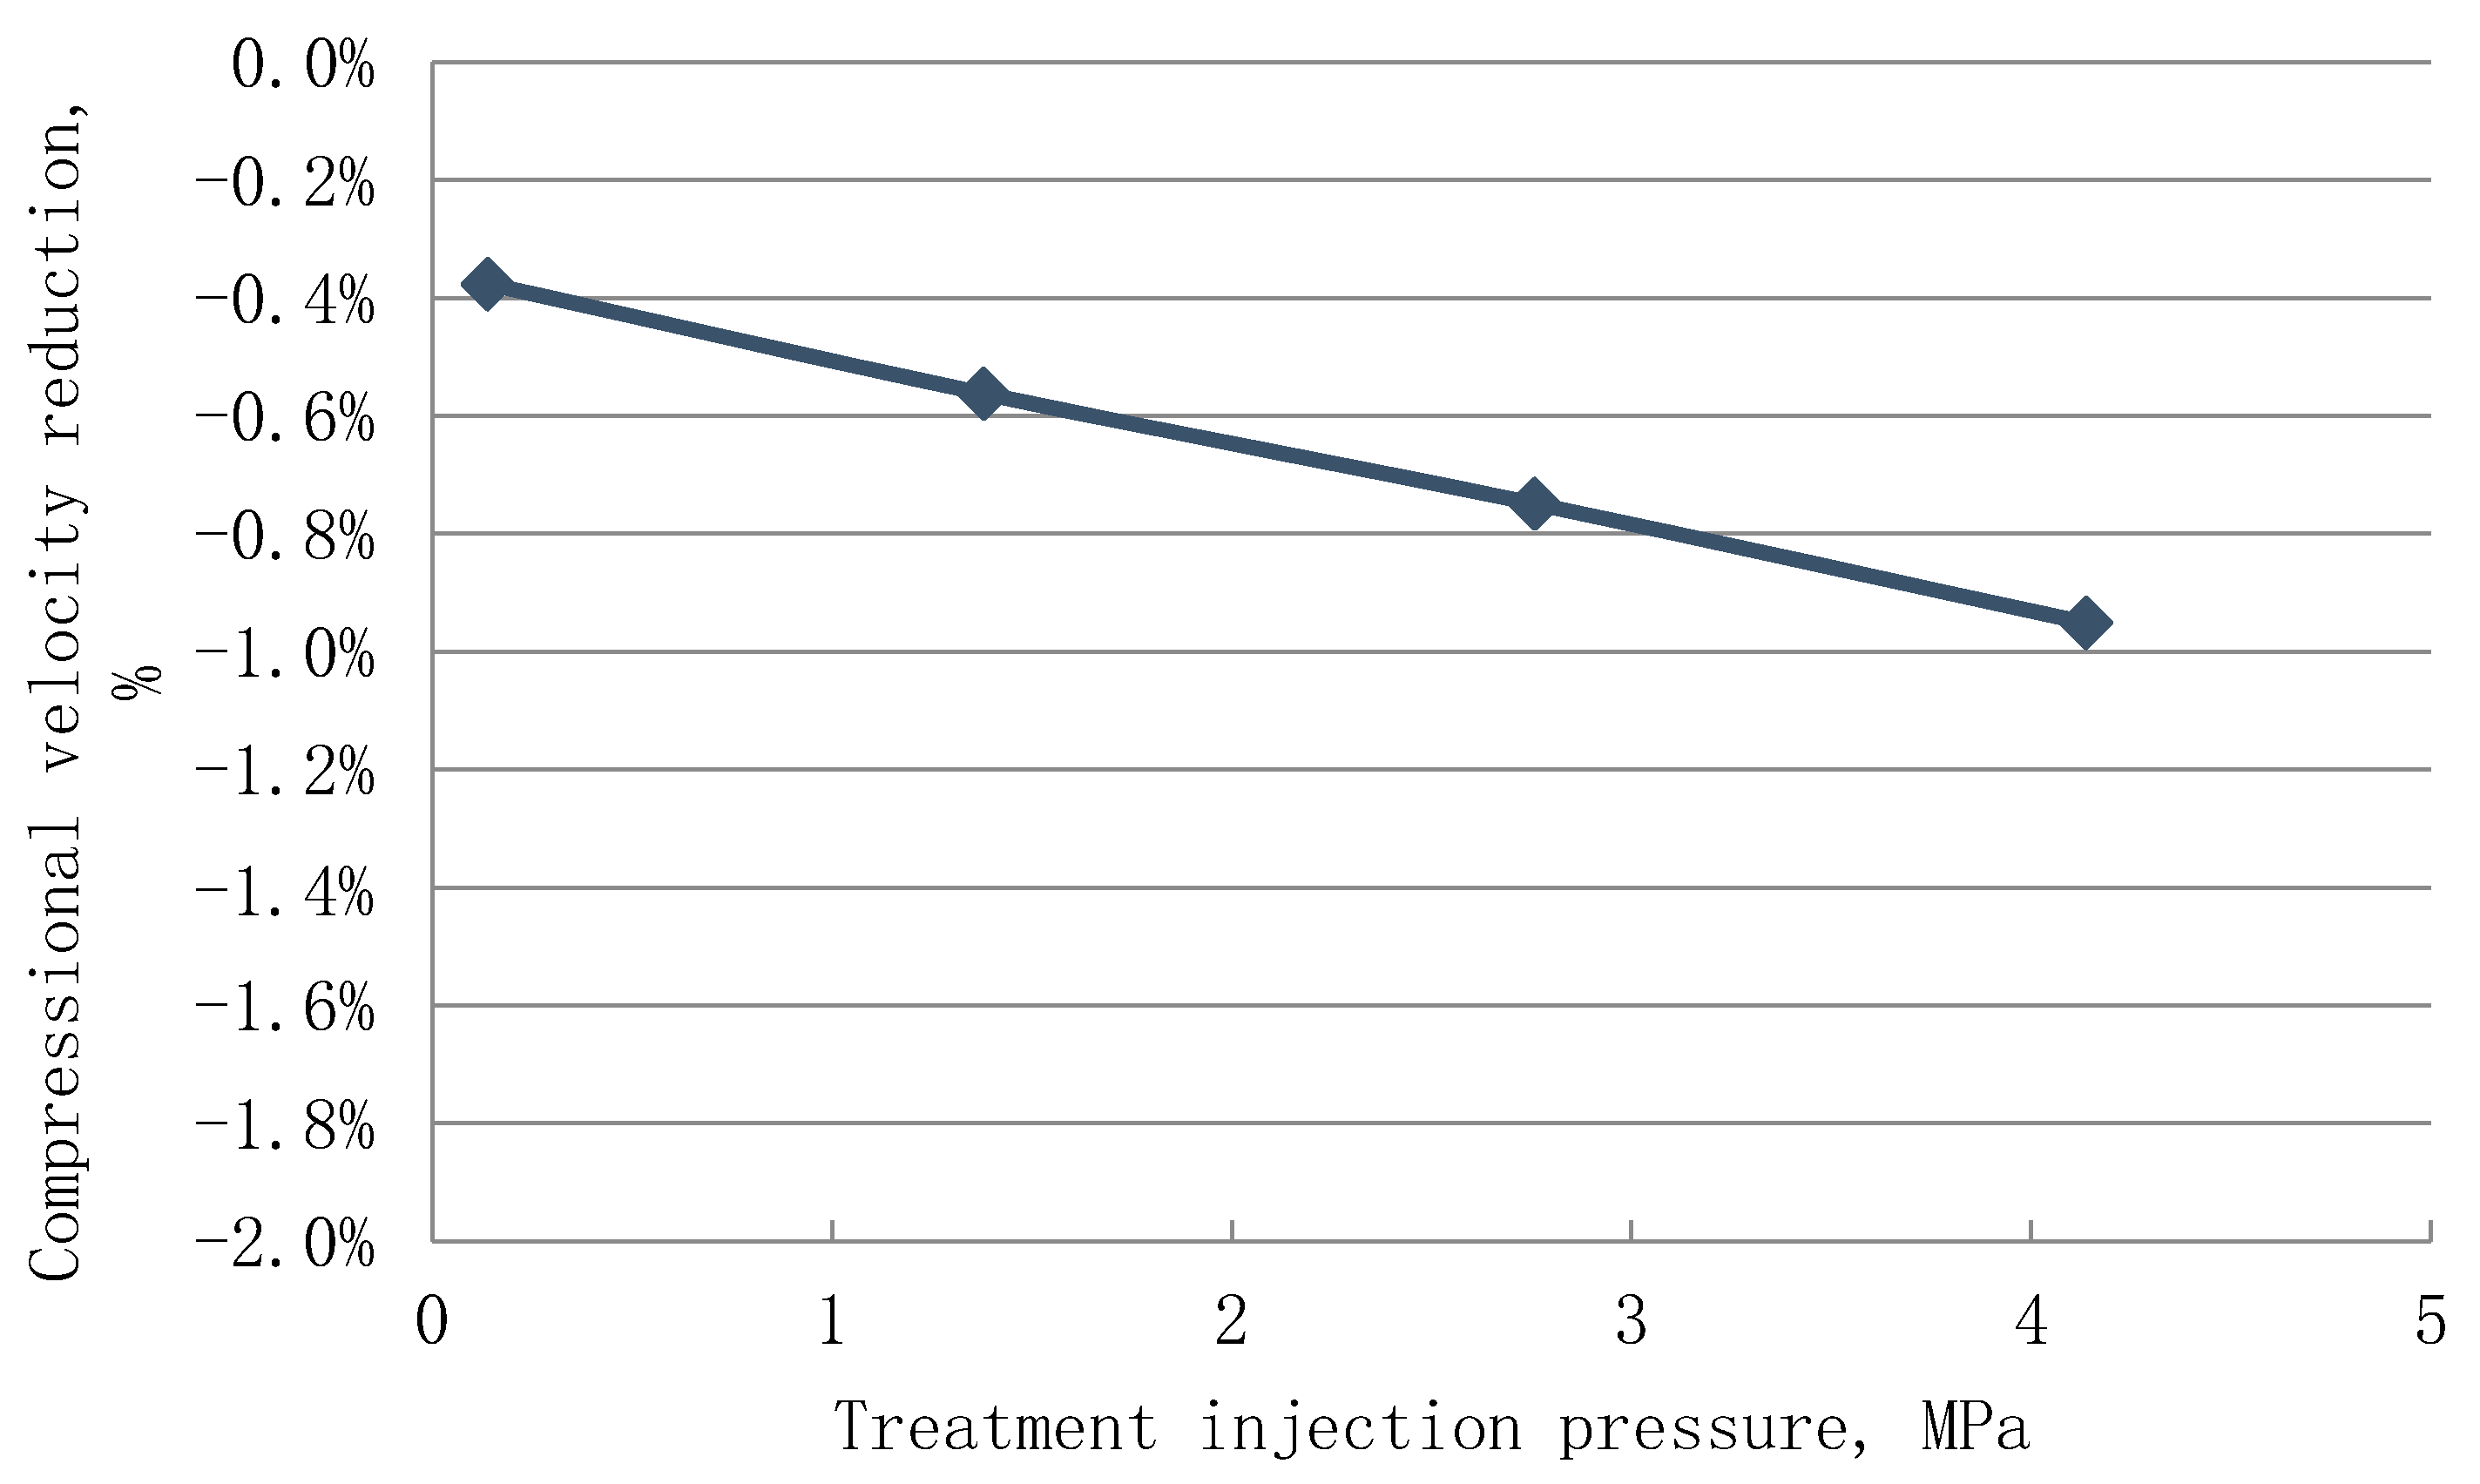
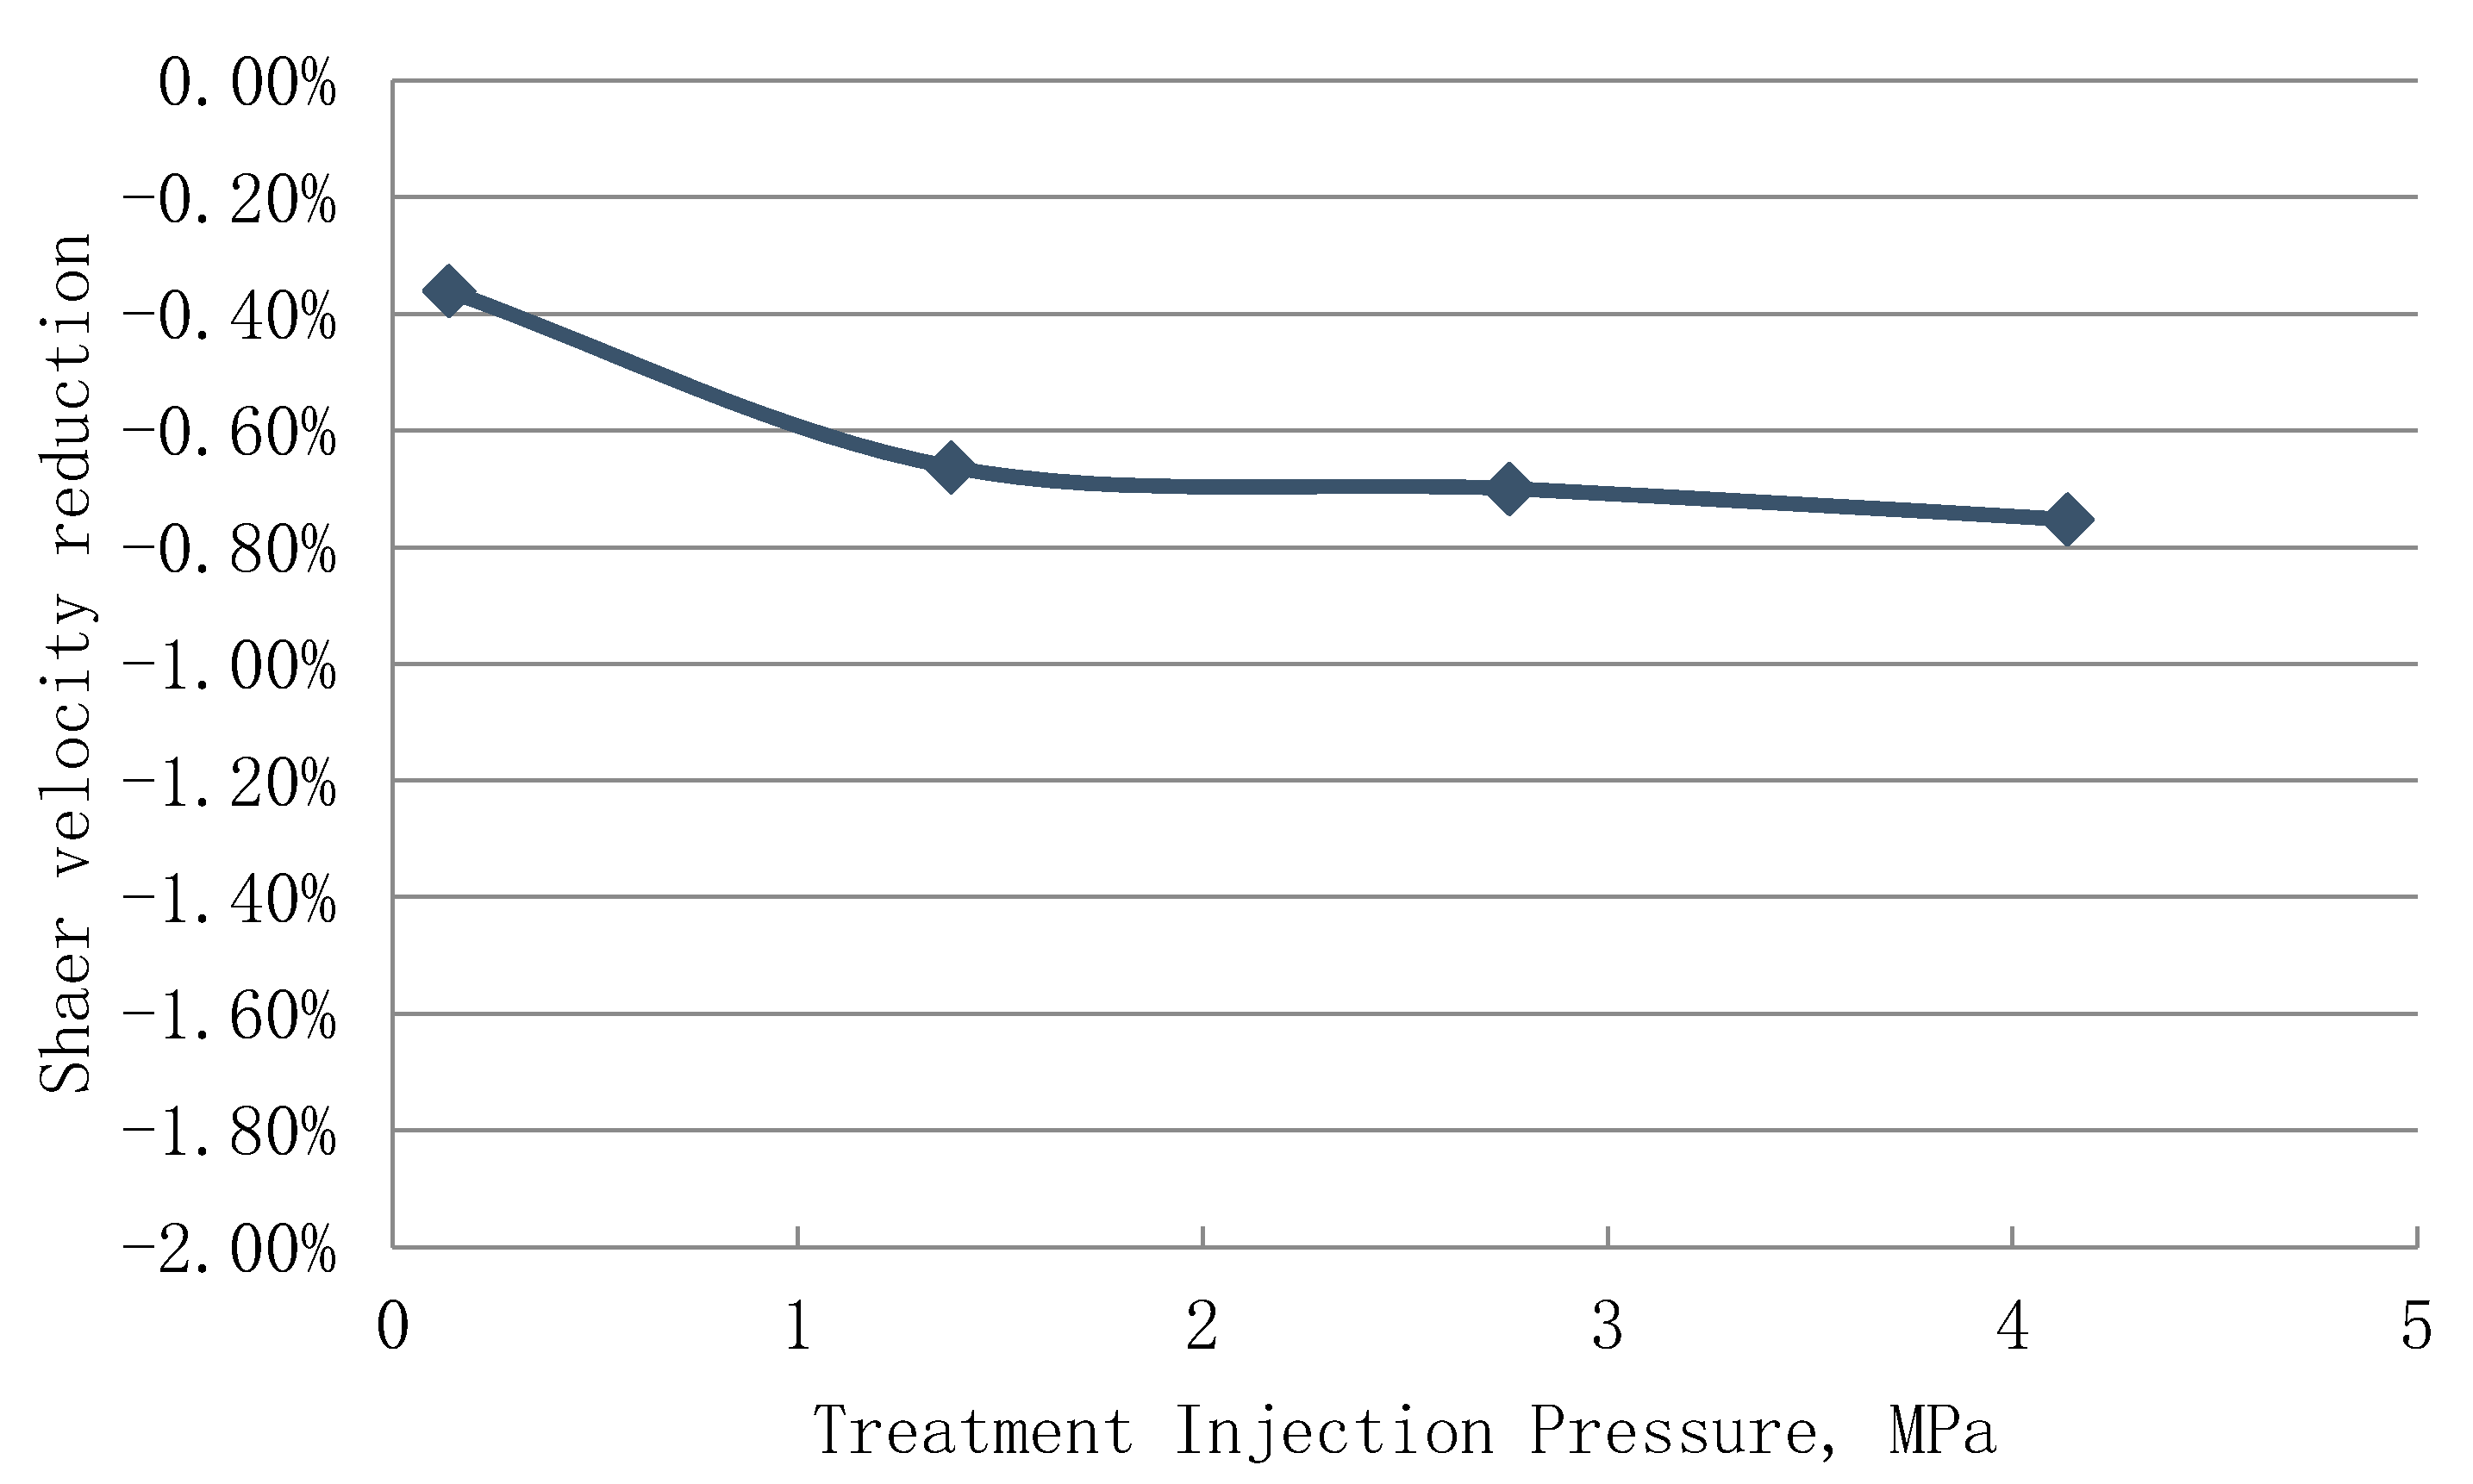
Increasing the confining pressure on the core samples increases the compressional and shear velocities [50,51] due to compaction on the core samples and the reduction of the pore volume in the samples. Figure 12 and Figure 13 illustrate a direct relationship between the confining pressure and both the compressional and shear velocities. Since ultrasonic velocity travels faster through the matrix and slower through pore spaces, the creation of new cracks must result in reductions in such velocities (at the same testing conditions). The results revealed that pressurizing the samples at higher injection pressure after implementing cryogenic treatments caused greater reductions in compressional and shear velocities verifying the forming of new cracks inside the samples. The alterations in the compressional and shear velocities are much lower than the permeability alteration because the extra pore volume due to the crack creation is small comparing to the bulk volume of the core samples, while it significantly affected the results of the core samples permeability. Figure 12, Figure 13, Figure 14 and Figure 15 demonstrate that conducting cryogenic treatments at 0.14, 1.38, 2.76, and 4.14 MPa caused a reduction in core samples compressional velocities by 0.38%, 0.56%, 0.75%, and 0.95%, while it decreased the shear velocities by 0.36%, 0.66%, 0.70%, and 0.75%, respectively. It is worth noting that the highest decreases in the velocities were observed at the highest treatment pressure (4.14 MPa) owing to the creation of longer and wider cracks leading to the highest porosity and permeability enhancements.
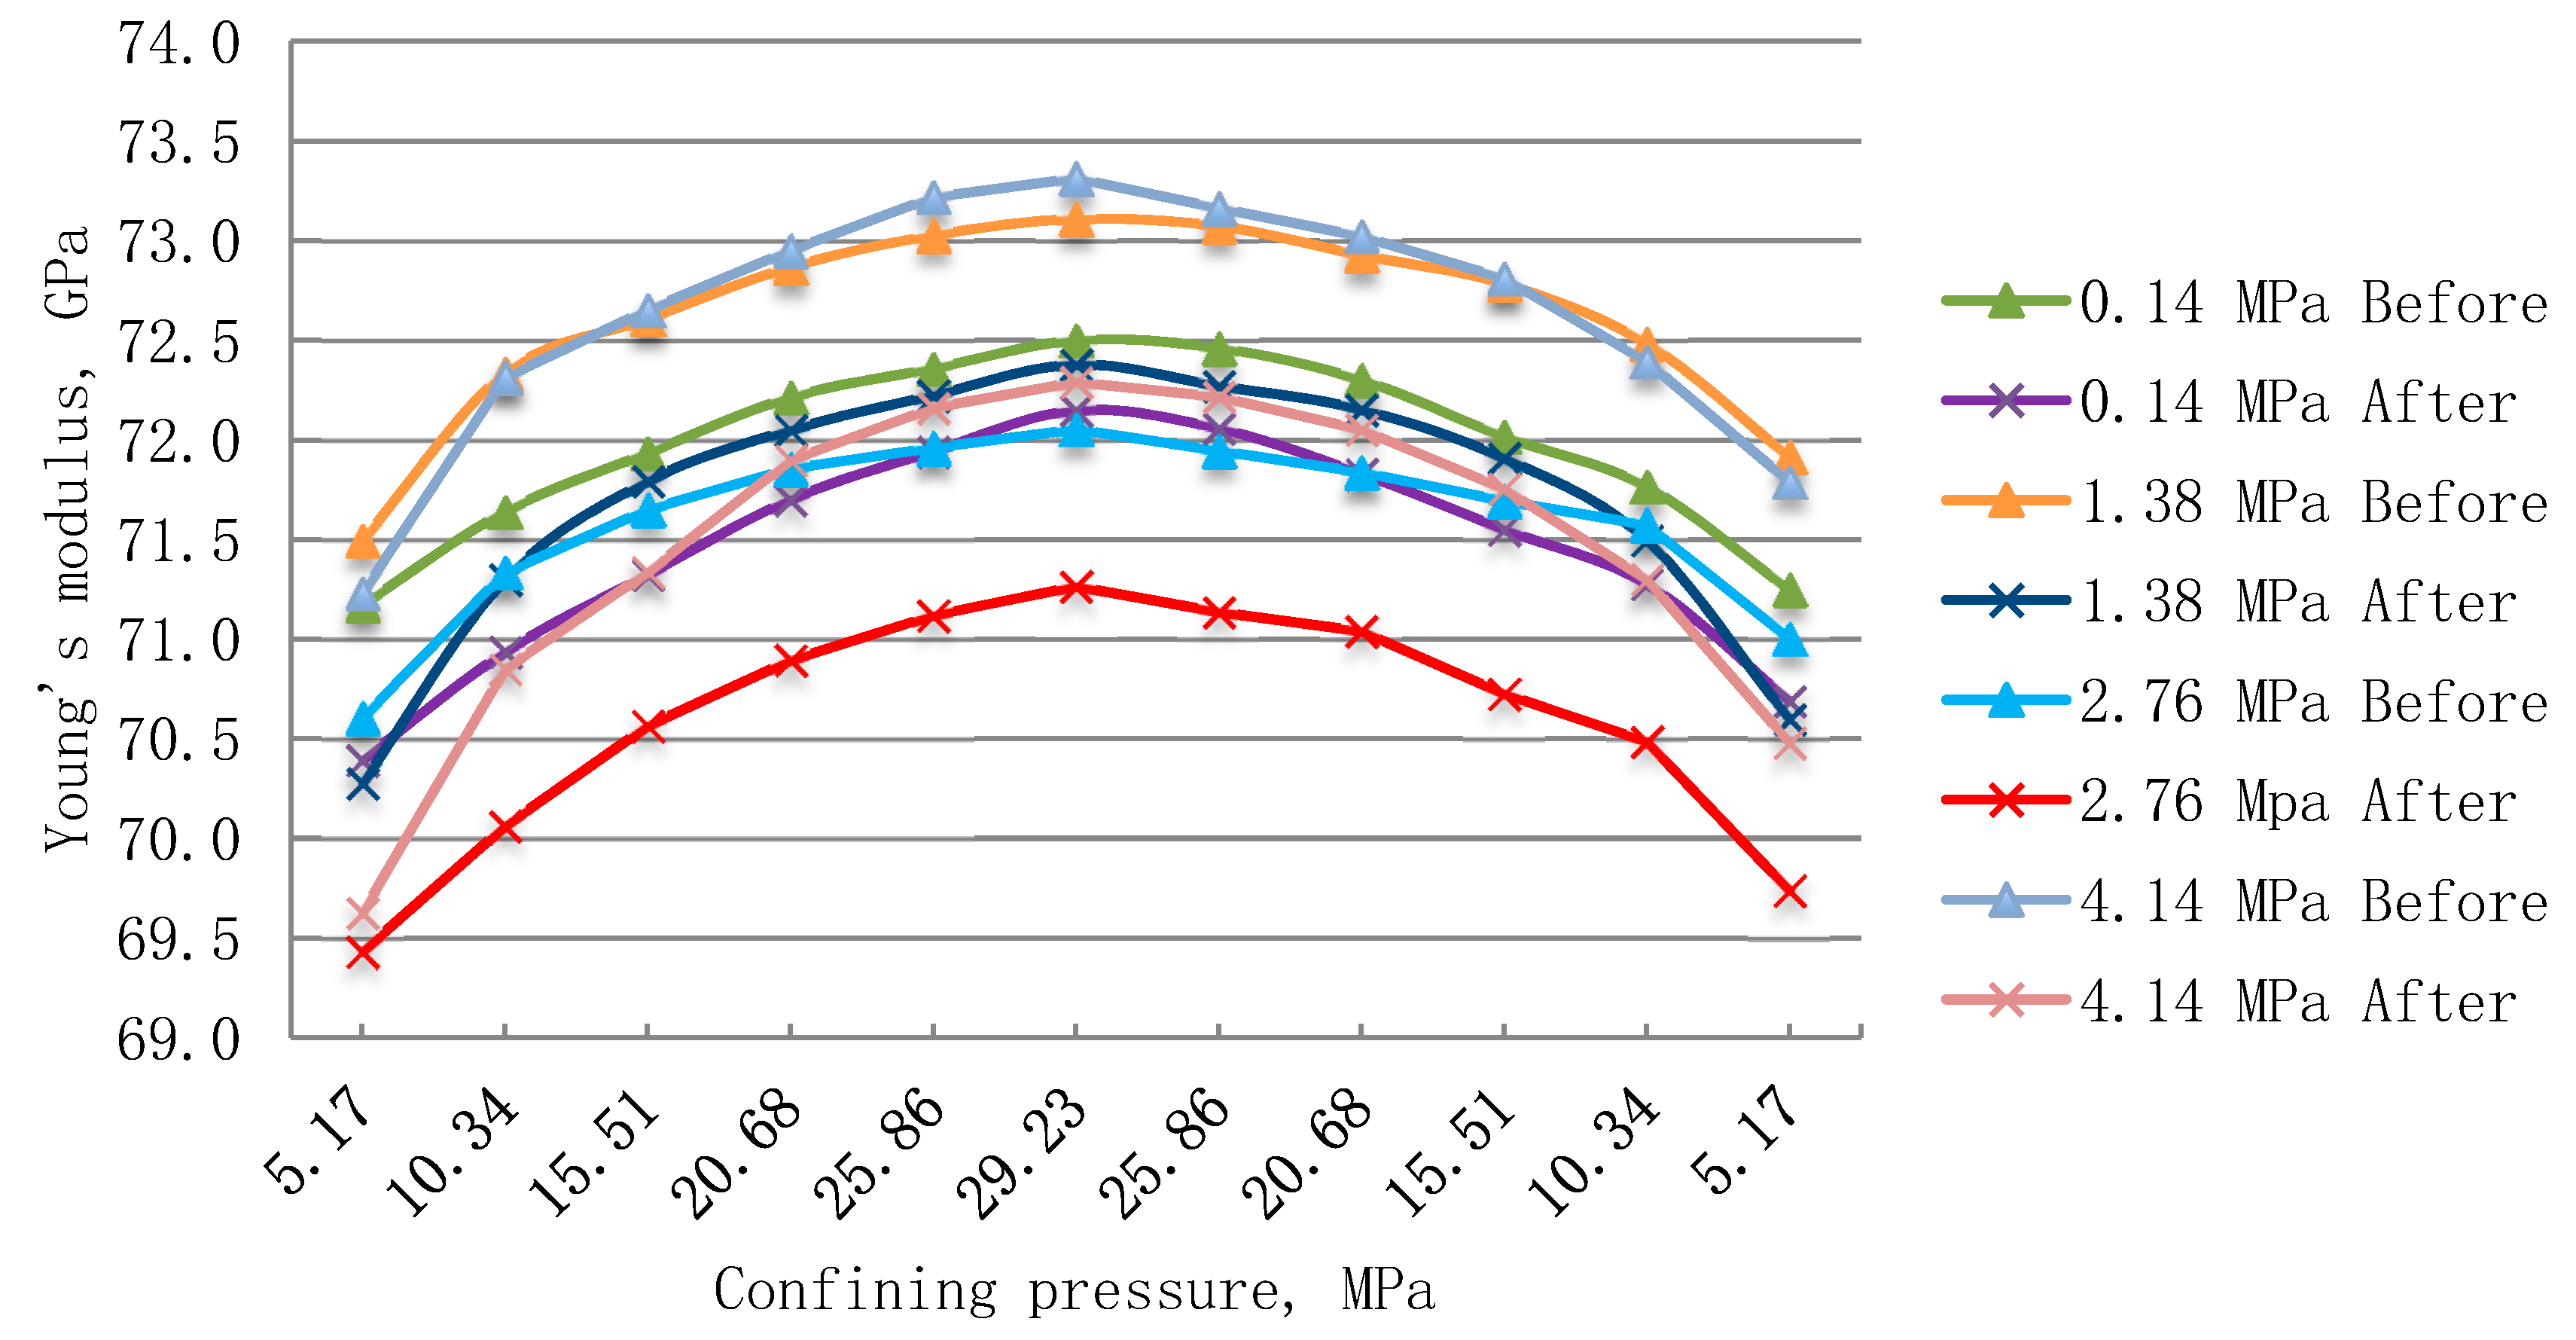
The mechanical properties of the samples are functions of the compressional and shear velocities as shown in Equations (1)–(3). Thus, changes in ultrasonic velocities cause changes in the core samples dynamic mechanical properties (Young’s modulus, Poisson’s ratio, and bulk compressibility). Additionally, the results demonstrated that conducting cryogenic treatments on the samples reduces both Young’s modulus and Poisson’s ratio.
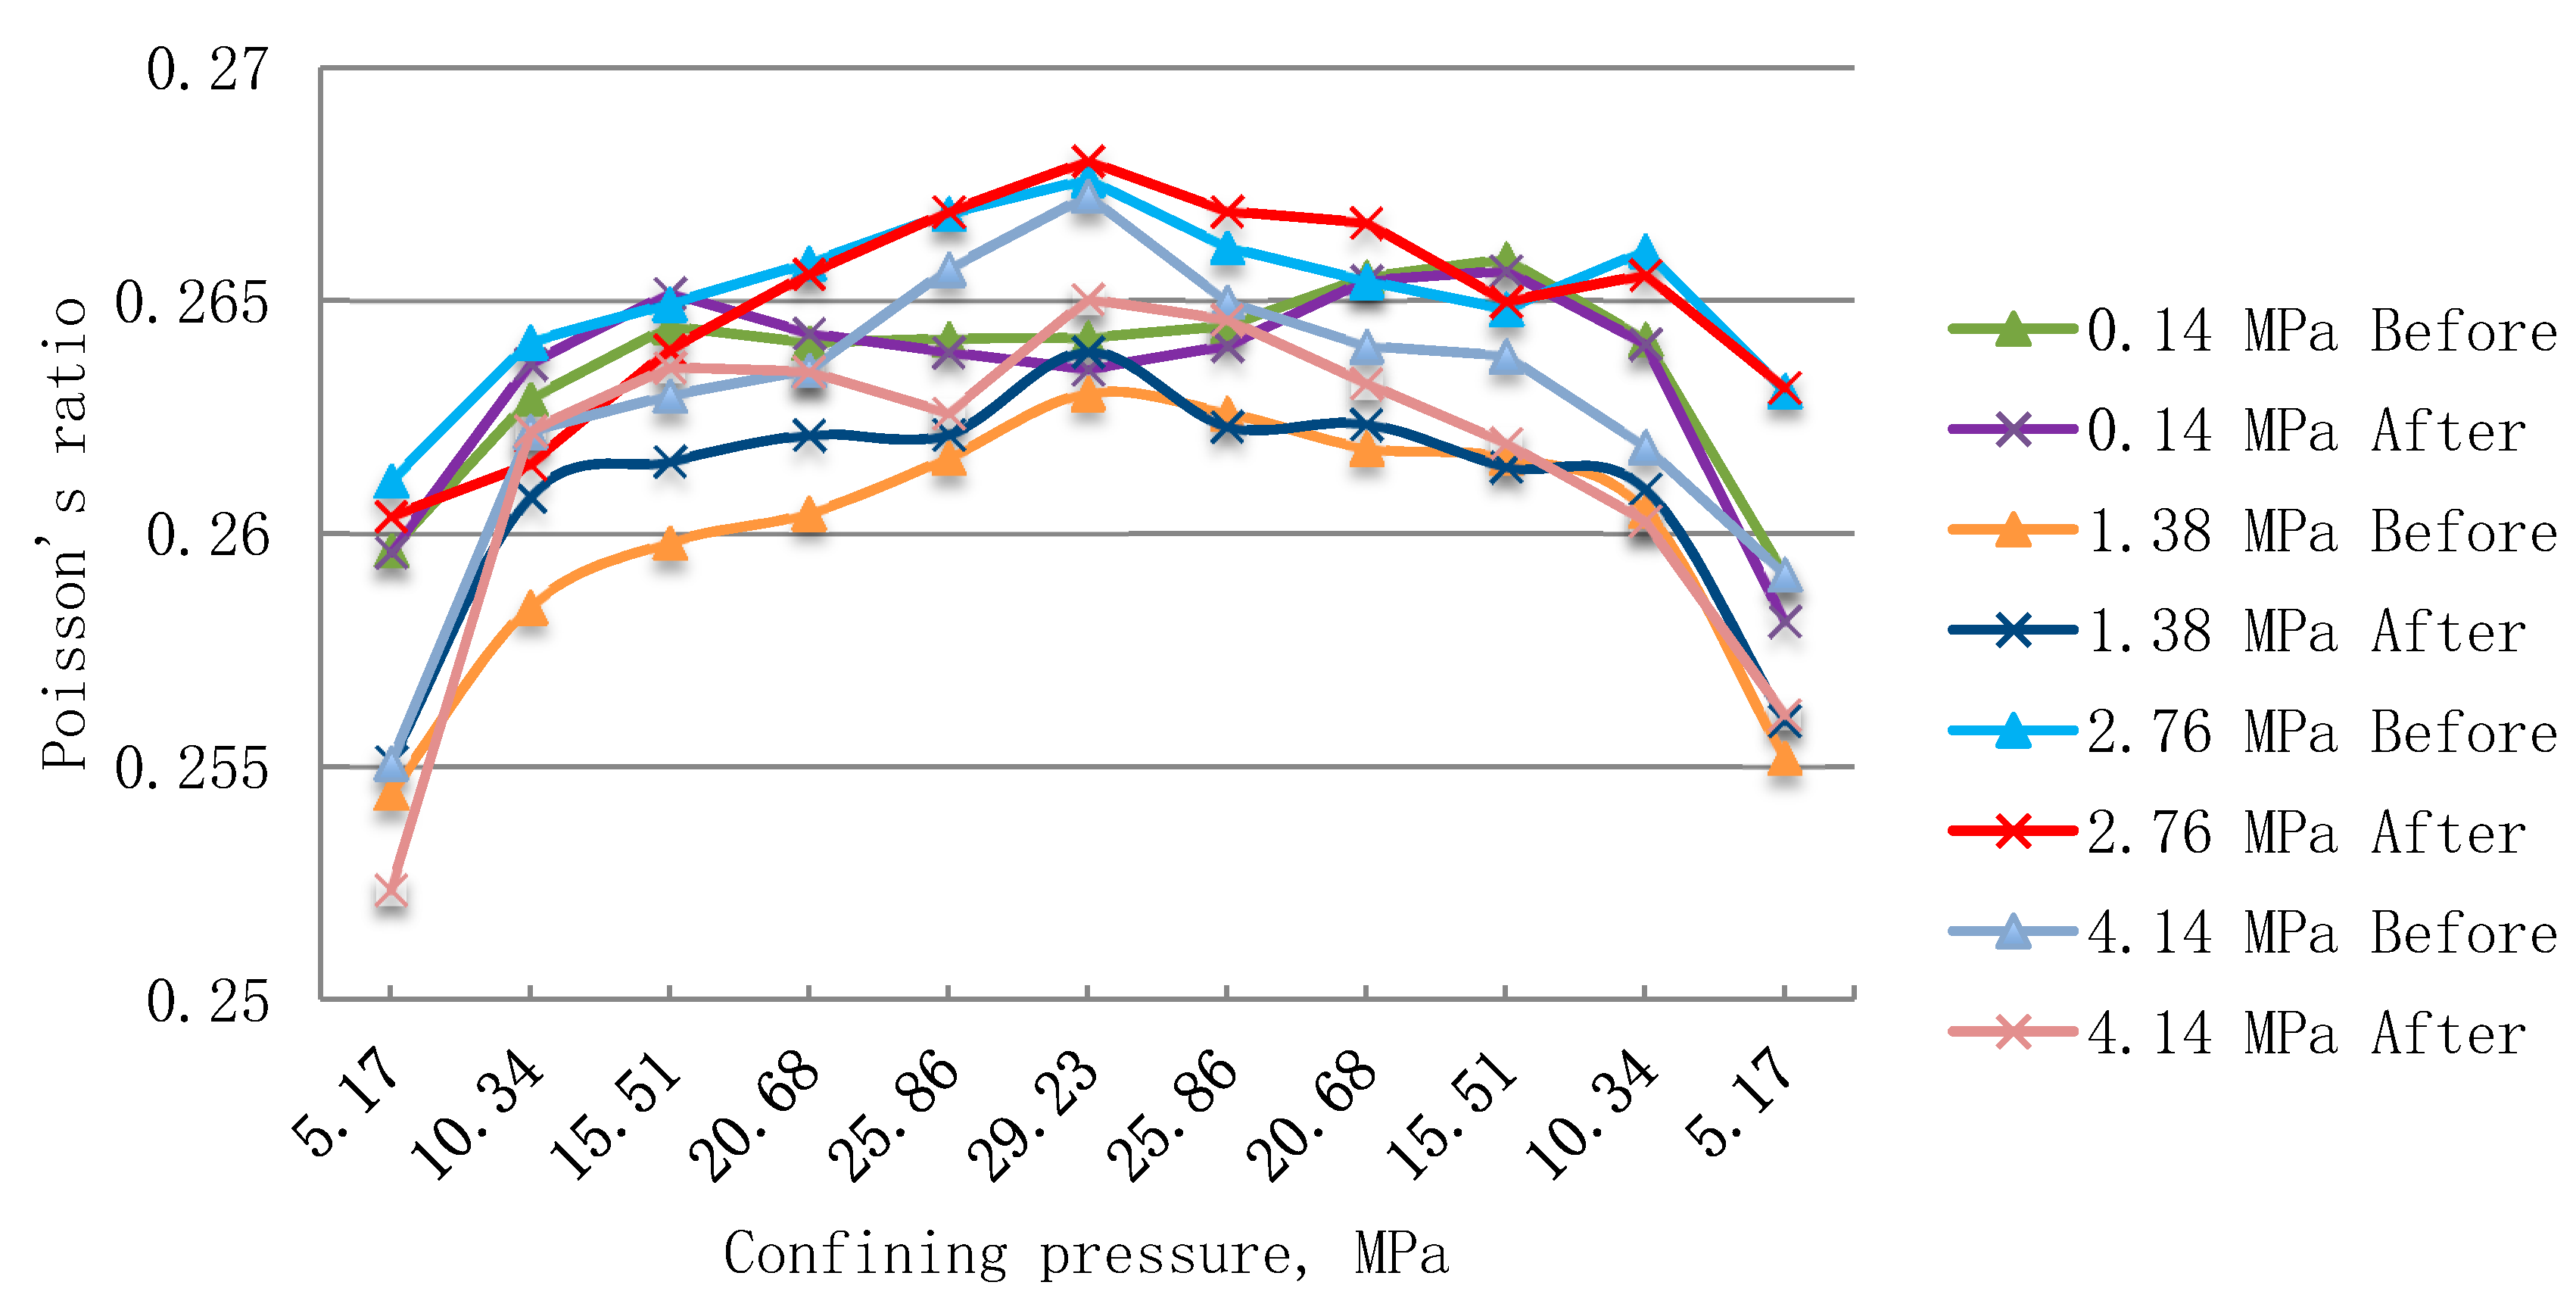
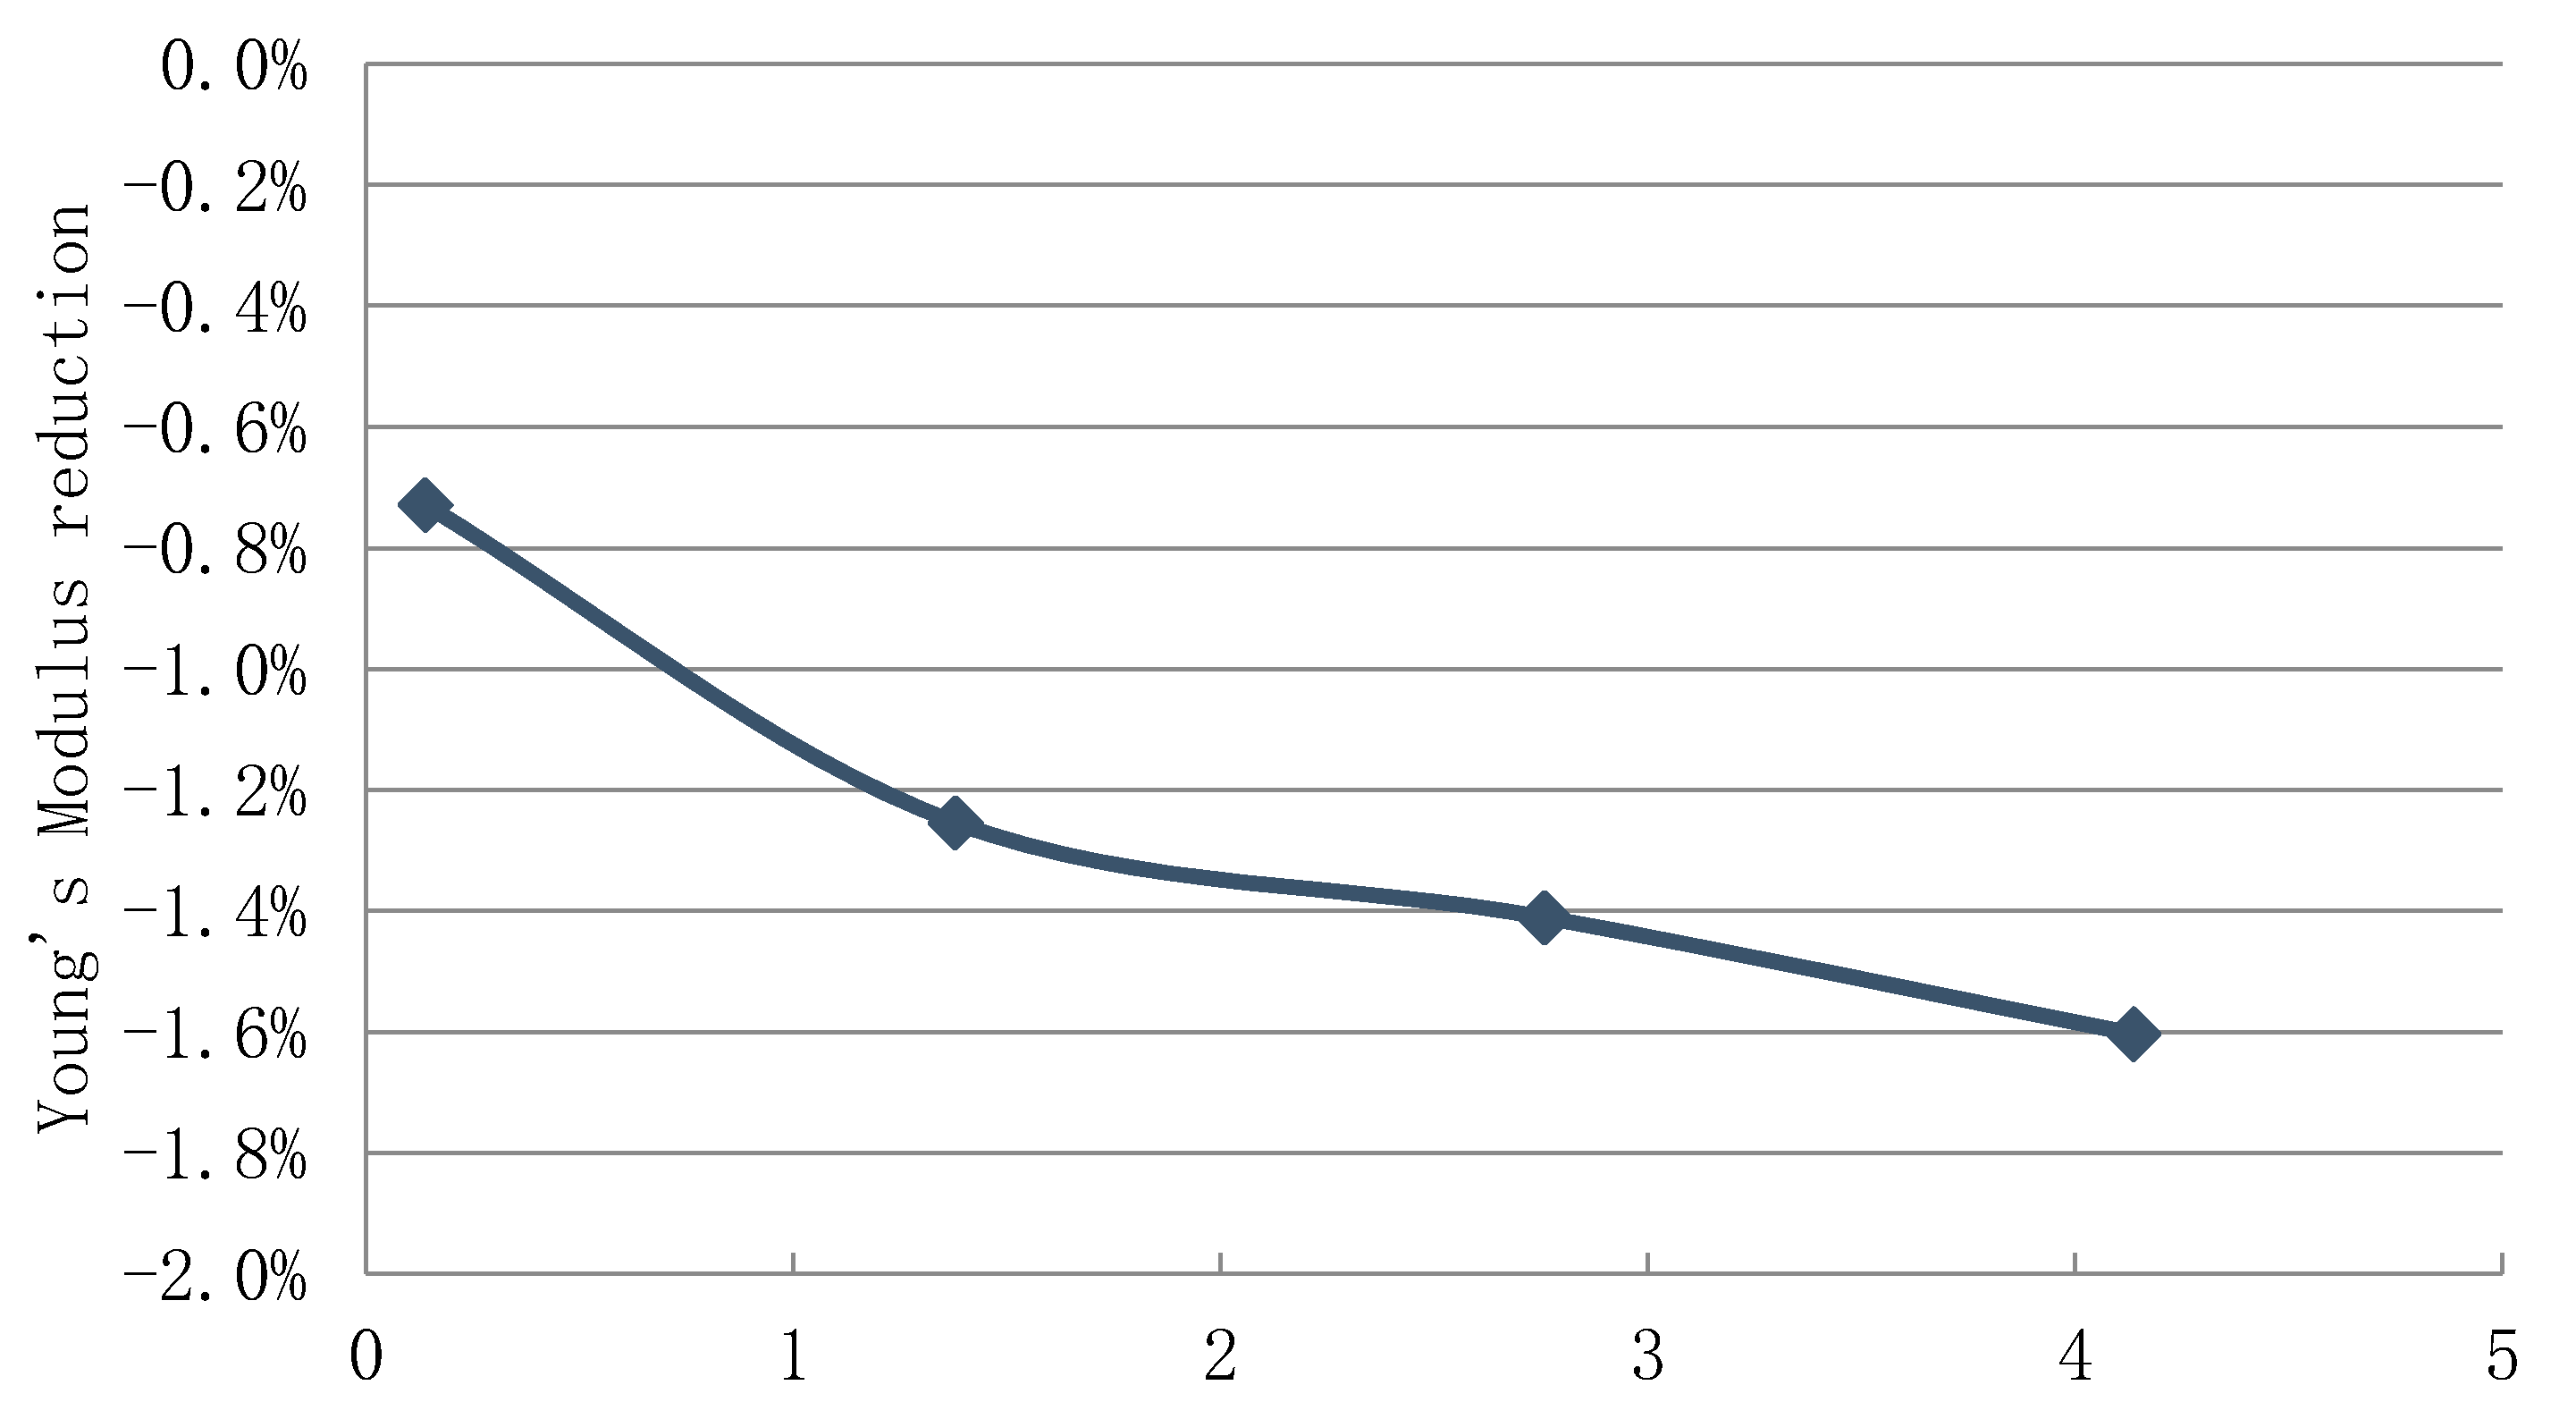
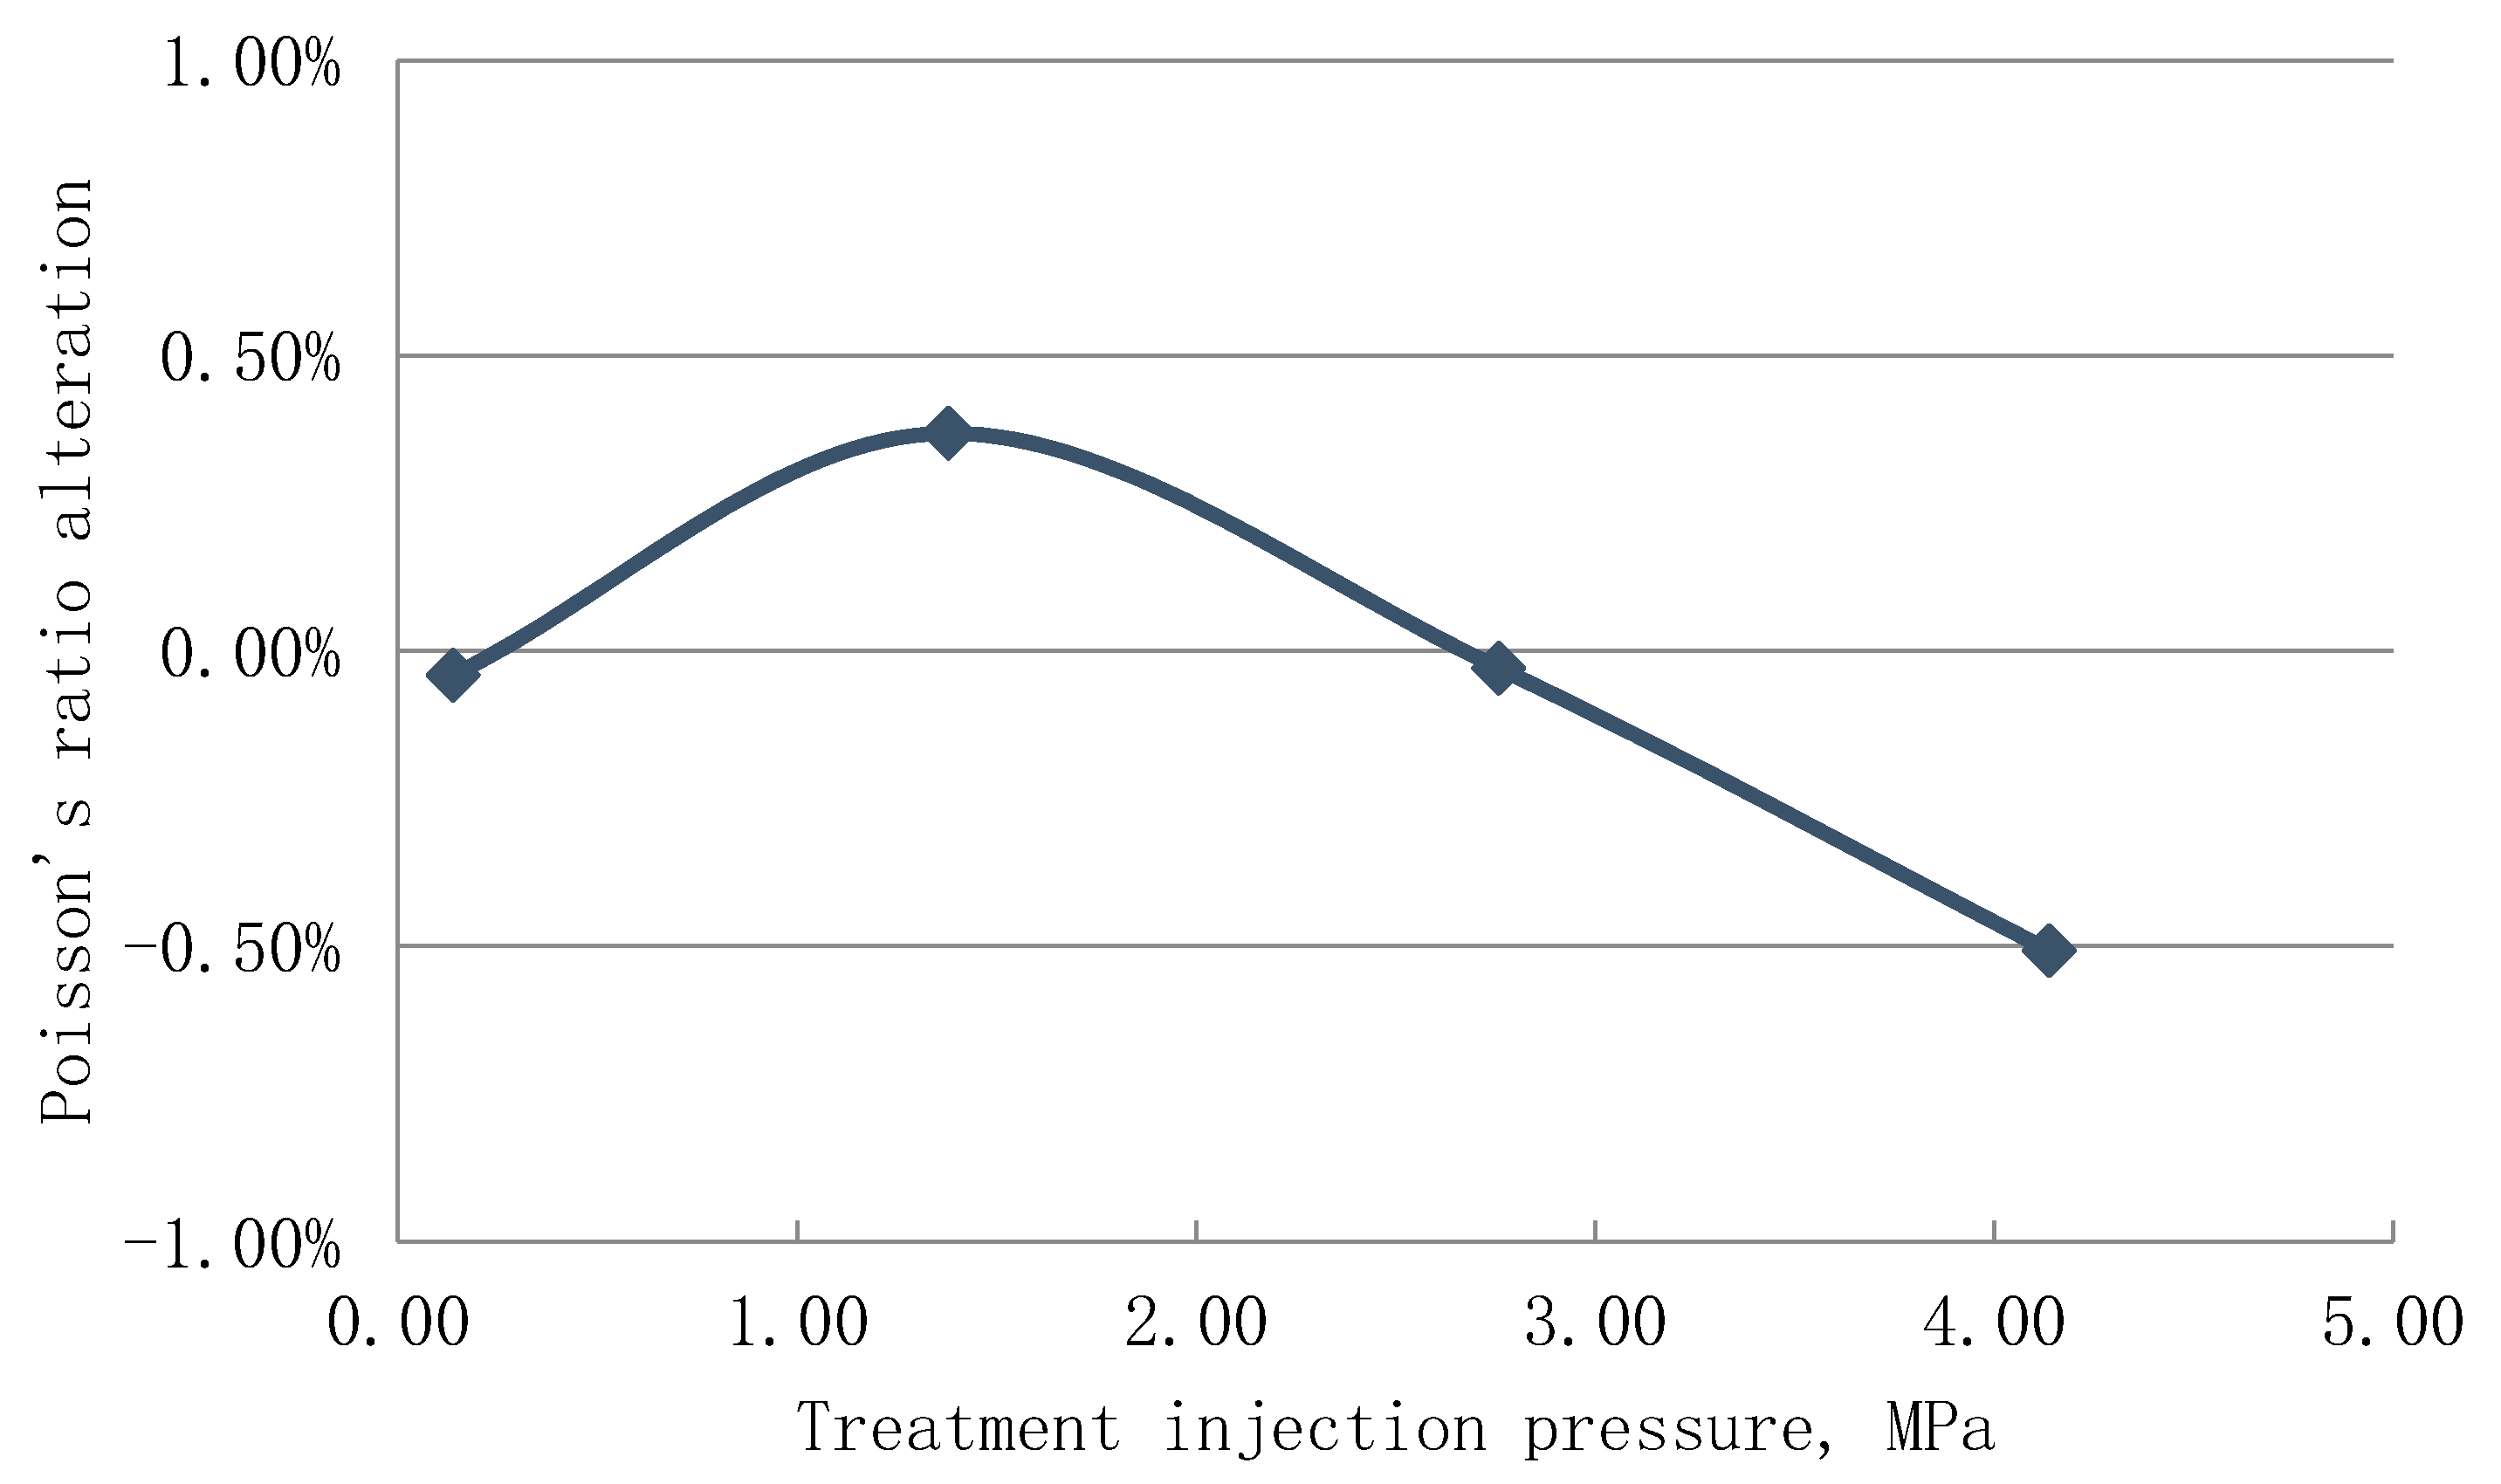
There were small reductions in the compressional (0.95%) and shear velocities (0.75%) after conducting the cryogenic treatment since the volume of the created fractures were significantly smaller than the core samples bulk volume. As a result of the reductions in ultrasonic velocities, the Young’s modulus and Poisson’s ratio got altered. Figure 16 and Figure 18 illustrate that implementing cryogenic treatments at injection pressures of 0.14, 1.38, 2.76, and 4.14 MPa reduced the core samples Young’s modulus by 0.73%, 1.25%, 1.41%, and 1.60%, respectively. The results of Poisson’s ratio were sensitive to the magnitude of the change in both compressional and shear velocities. Since dynamic Poisson’s ratio is a function of measured compressional and shear velocities (Equation ((2)), any change in the compressional and shear velocities results in a change in Poisson’s ratio as well. If the changes in the velocities are close, the change in Poisson’s ratio is insignificant. Otherwise, depending on which change is dominant, Poisson’s ratio may increase or decrease. Figure 17 and Figure 19 demonstrate that the Poisson’s ratio increased by 0.37% at the treatment pressure of 1.38 MPa, it dropped by 0.51% at the treatment pressure of 4.14 MPa, and there was an insignificant reduction (0.04% and 0.03%) at treatment pressures of 0.14 and 2.76 MPa.
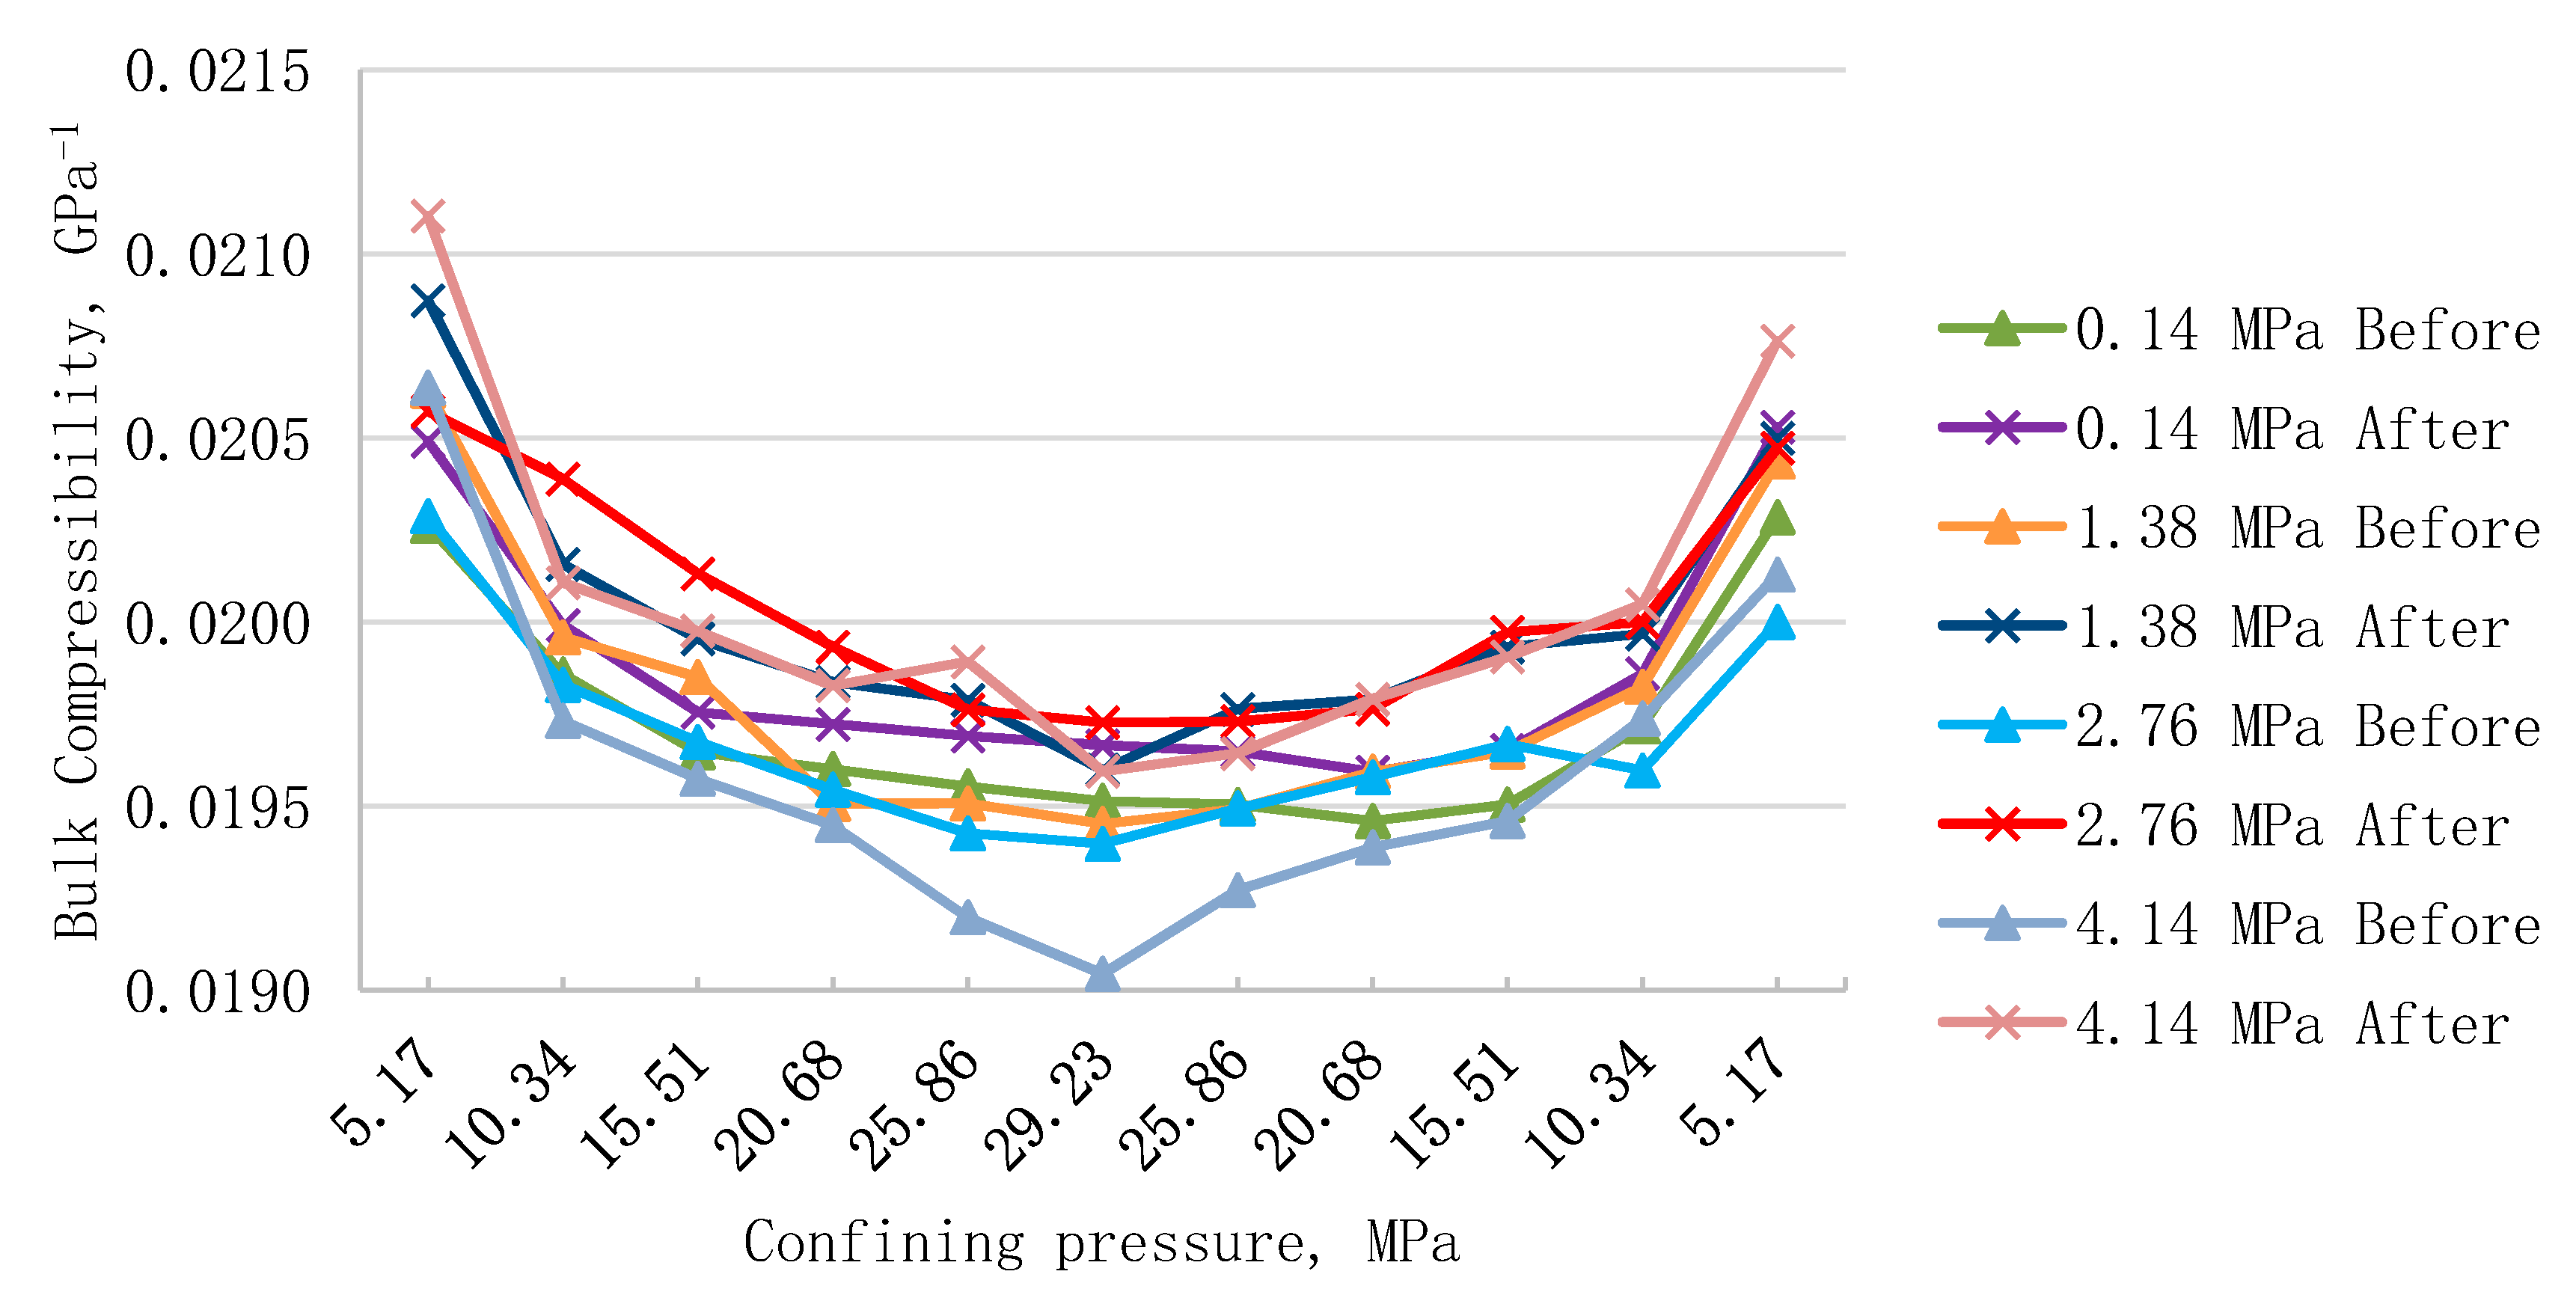
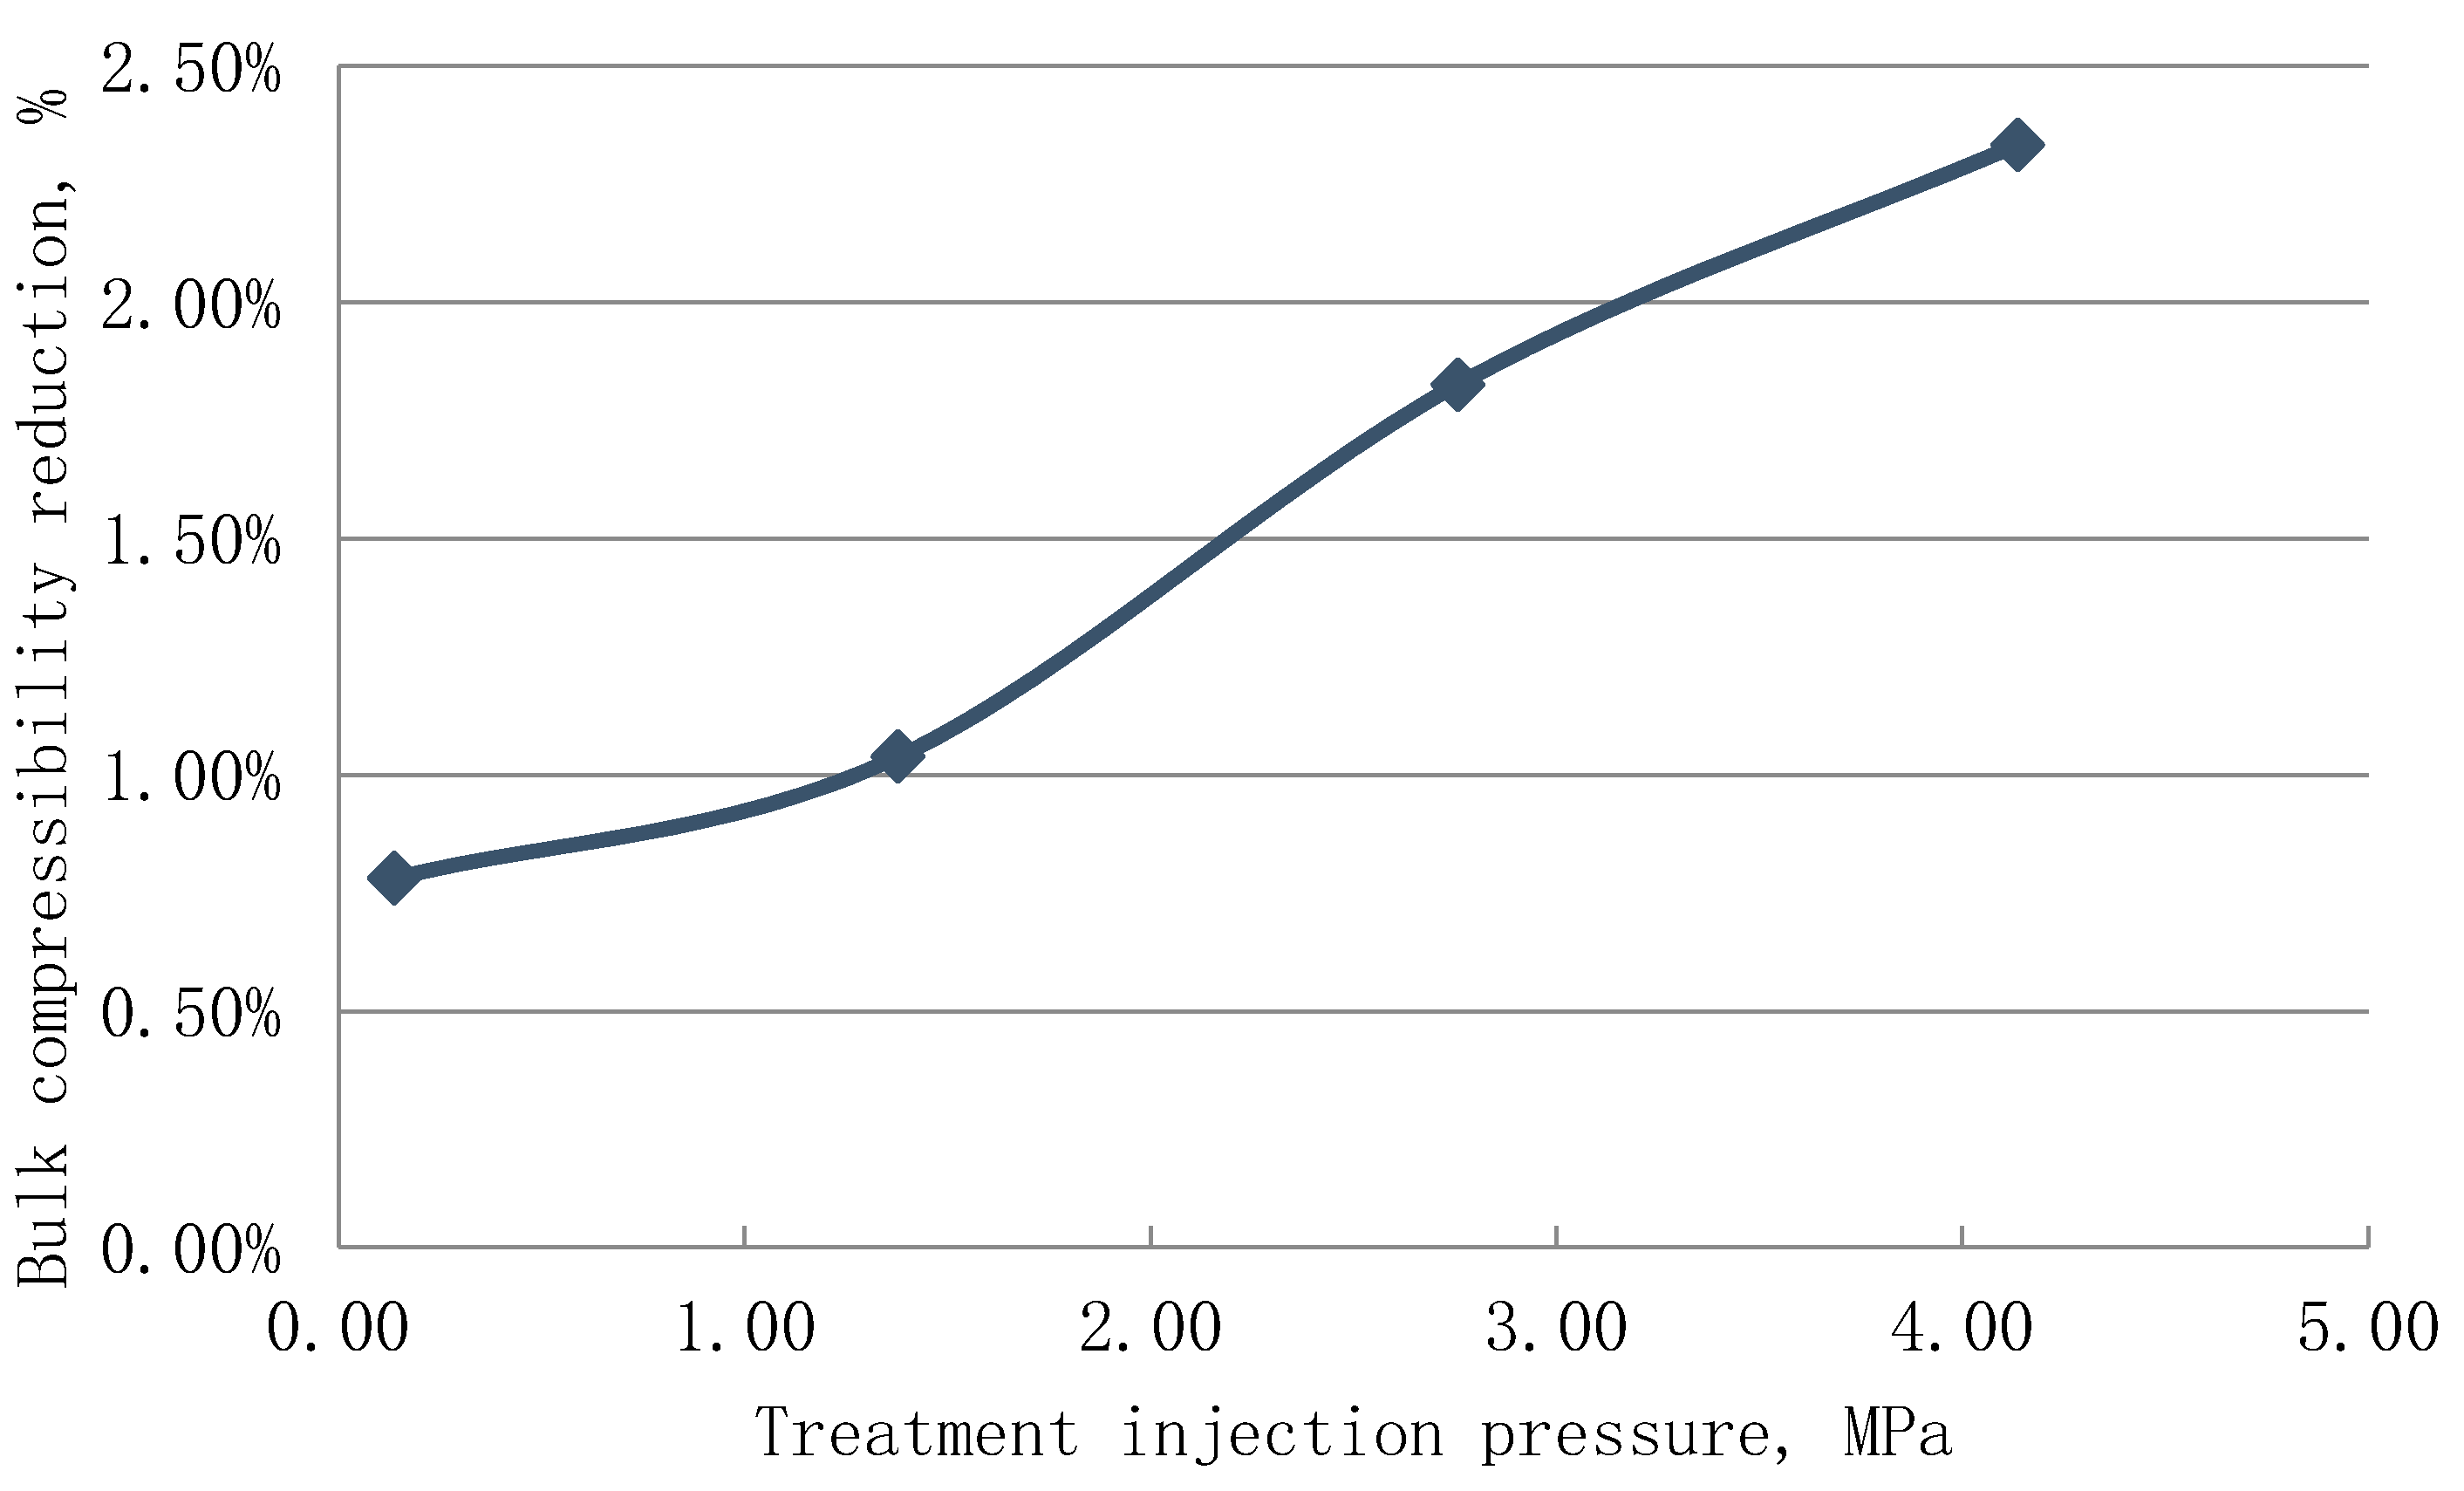
The bulk compressibility of the samples represents the change in the bulk volume due to the increase in the applied pressure on the core samples (Equation (3)). Figure 20 illustrates that increasing the confining pressure reduced the core samples bulk compressibility due to the reduction of the pore volume resulting from squeezing the pore spaces. The results also revealed that conducting cryogenic treatments on the samples increased the core samples bulk compressibility due to the creation of the new cracks inside the samples. Figure 21 demonstrates that the core samples bulk compressibility improved by 0.78%, 1.04%, 1.83%, and 2.33% when they were stimulated at pressures of 0.14, 1.38, 2.76, and 4.14 MPa, respectively. It is worth noting that the highest increase in the bulk compressibility transpired at 4.14 MPa treatment pressure at which the longest and widest cracks were created.
4. Conclusions
This is one of the first research efforts that investigated the efficacy of pressurizing cryogenic treatments on the core samples porosity, permeability, and mechanical properties of shale core samples (Marcellus formation). Ten core samples have been cryogenically treated in this study. The cryogenic treatment comprised of two parts: thermal shock (injecting LN2) and pressurizing the injected LN2 with N2. The thermal shock technique was applied on one core sample (M4) at the LN2 injection of approximately 0.14 MPa (without pressurizing it), while the other nine core samples were thermally shocked using LN2, and then pressurized with N2 at 1.38, 2.76, and 4.14 MPa (three core samples at each pressure).
The results of the CT-scan, porosity, permeability, and bulk compressibility of the samples proved that fractures were formed in all core samples. The results revealed that conducting the cryogenic treatment on the samples (without pressurizing) increased the porosity and bulk compressibility of the samples by 0.42% and 0.78%, respectively, while the permeability increased by 21 folds over the initial (matrix) permeability. Also, the results illustrated that increasing the cryogenic treatment pressure caused a further increase in the mentioned properties owing to the creation of longer and wider cracks. At 4.14 MPa injection pressure, for example, the porosity and bulk compressibility increased by 4.00% and 2.33%, respectively, and the permeability increased by 14,030 folds of increase over the initial (matrix) permeability.
The compressional and shear velocities have an inverse relationship with the success of cryogenic treatments. Implementing the cryogenic treatment without pressurizing resulted in decreasing the compressional and shear velocities by 0.38 and 0.36%, respectively. Furthermore, when LN2 was injected and then pressurized, the reductions in the compressional and shear velocities were 0.95% and 0.75%, respectively. Like the ultrasonic velocities, Young’s modulus of the core sample decreased after completing the cryogenic treatment.
Author Contributions
Conceptualization, R.K.; Formal analysis, R.K.; Investigation, R.K.; Methodology, R.K.; Project administration, H.E.; Supervision, H.E.; Validation, F.A.; Writing—original draft, R.K.; Writing—review & editing, F.A. All authors have read and agreed to the published version of the manuscript.
Funding
The authors declare no funding for this research.
Conflicts of Interest
The authors declare no conflict of interest.
References
- U.S. EIA. Drilling Productivity Report, for Key Tight Oil and Shale Gas Regions; U.S. Energy Information Administration: Washington, DC, USA, 2015.
- King, H. Hydraulic Fracturing of Oil & Gas Wells Drilled in Shale. 2011. Available online: https://geology.com/articles/hydraulic-fracturing/ (accessed on 14 November 2020).
- Mohanty, K.K.; Tong, S.; Miller, C.; Zeng, T.; Honarpour, M.M.; Turek, E.; Peck, D.D. Improved hydrocarbon recovery using mixtures of energizing chemicals in unconventional reservoirs. SPE Reserv. Eval. Eng. 2019, 22, 1436–1448. [Google Scholar] [CrossRef]
- Warpinski, N.R.; Mayerhofer, M.J.; Vincent, M.C.; Cipolla, C.L.; Lolon, E. Stimulating unconventional reservoirs: Maximizing network growth while optimizing fracture conductivity. J. Can. Pet. Technol. 2009, 48, 39–51. [Google Scholar] [CrossRef]
- Zoback, M.D.; Kohli, A.H. Unconventional Reservoir Geomechanics; Cambridge University Press: Cambridge, UK, 2019. [Google Scholar]
- Teklu, T.W.; Park, D.; Jung, H.; Amini, K.; Abass, H. Effect of Dilute Acid on Hydraulic Fracturing of Carbonate-Rich Shales: Experimental Study. SPE Prod. Oper. 2019, 34, 170–184. [Google Scholar] [CrossRef]
- EIA. Review of Emerging Resources: U.S. Shale Gas and Shale Oil Plays; U.S. Energy Information Administration: Washington, DC, USA, 2011.
- Zammerilli, A. Projecting the Economic Impact of Marcellus Shale Gas Development in West Virginia: A Preliminary Analysis Using Publicly Available Data; DOE/NETL Final Report; Department of Energy National Energy technology Laboratory: Morgantown, WV, USA, 2010; 37p.
- Higley, D.K.; Enomoto, C.E.; Leathers-Miller, H.M.; Ellis, G.S.; Mercier, T.J.; Schenk, C.J.; Trippi, M.H.; Le, P.A.; Brownfield, M.E.; Woodall, C.A. Assessment of Undiscovered Gas Resources in the Middle Devonian Marcellus Shale of the Appalachian Basin Province, 2019; Fact Sheet 2327-6932; US Geological Survey: Reston, VA, USA, 2019.
- Zhou, Q.; Dilmore, R.; Kleit, A.; Wang, J.Y. Evaluating fracture-fluid flowback in Marcellus using data-mining technologies. SPE Prod. Oper. 2016, 31, 133–146. [Google Scholar] [CrossRef]
- Avary, K.; Lewis, J. New Interest in Cores Taken Thirty Years Ago: The Devonian Marcellus Shale in Northern West Virginia. In Proceedings of the AAPG Eastern Section Meeting, Pittsburgh, PA, USA, 11–15 October 2008. [Google Scholar]
- Boyce, M.L.; Carr, T.R. Lithostratigraphy and petrophysics of the Devonian Marcellus interval in West Virginia and southwestern Pennsylvania. GCSSEPM Proc. 2009, 10, 254–281. [Google Scholar]
- Roen, J.B. Geology of the Devonian black shales of the Appalachian Basin. Org. Geochem. 1984, 5, 241–254. [Google Scholar] [CrossRef]
- Wrightstone, G.; Shale, M. Regional overview from an industry perspective (abs.). In Proceedings of the AAPG Eastern Section Meeting, Pittsburgh, PA, USA, 11–15 October 2008. [Google Scholar]
- Zielinski, R.E.; McIver, R.D. Resource and Exploration Assessment of the Oil and Gas Potential in the Devonian Gas Shales of the Appalachian Basin; Monsanto Research Corp.: Miamisburg, OH, USA, 1981. [Google Scholar]
- Peucker-Ehrenbrink, B. Dating Weathering of Organic-rich Shales with U-Series Disequilibrium. In Proceedings of the Eleventh Annual VM Goldschmidt Conference, Hot Springs, VA, USA, 20–24 May 2001. [Google Scholar]
- Gupta, N.; Mishra, B. Creep Characterization of Marcellus Shale. In Proceedings of the 51st US Rock Mechanics/Geomechanics Symposium, San Francisco, CA, USA, 25–28 June 2017. [Google Scholar]
- Piane, C.D.; Josh, M.; Dautriat, J.; Sarout, J.; Giwelli, A.; Luzin, V.; Clennell, B.; Dewhurst, D. Contrasting anisotropy of velocity and electric/dielectric response in the Marcellus and Utica Shales. In SEG Technical Program Expanded Abstracts 2018; Society of Exploration Geophysicists: Houston, TX, USA, 2018; pp. 3608–3612. [Google Scholar]
- Crandall, D.; Paronish, T.; Brown, S.; Martin, K.; Moore, J.; Carr, T.R.; Panetta, B. CT Scanning and Geophysical Measurements of the Marcellus Formation from the Tippens 6HS Well; National Energy Technology Lab. (NETL): Morgantown, WV, USA, 2018.
- Morsy, S.; Gomaa, A.; Sheng, J. Imbibition characteristics of Marcellus shale formation. In Proceedings of the SPE Improved Oil Recovery Symposium, Tulsa, OK, USA, 12–16 April 2014. [Google Scholar]
- Janszen, M.; Bakker, T.; Zitha, P. Hydraulic Fracturing in the Dutch Posedonia Shale. In Proceedings of the SPE European Formation Damage Conference and Exhibition, Budapest, Hungary, 3–5 June 2015. [Google Scholar]
- Kolawole, O.; Ispas, I. Interaction between hydraulic fractures and natural fractures: Current status and prospective directions. J. Pet. Explor. Prod. Technol. 2020, 10, 1613–1634. [Google Scholar] [CrossRef] [Green Version]
- Wang, L.; Yao, B.; Cha, M.; Alqahtani, N.B.; Patterson, T.W.; Kneafsey, T.J.; Miskimins, J.L.; Yin, X.; Wu, Y.-S. Waterless fracturing technologies for unconventional reservoirs-opportunities for liquid nitrogen. J. Nat. Gas Sci. Eng. 2016, 35, 160–174. [Google Scholar] [CrossRef] [Green Version]
- Vardar, Ö.; Finnie, I. The prediction of fracture in brittle solids subjected to very short duration tensile stresses. Int. J. Fract. 1977, 13, 115–131. [Google Scholar] [CrossRef]
- Cha, M.; Alqahtani, N.B.; Yao, B.; Yin, X.; Kneafsey, T.J.; Wang, L.; Wu, Y.-S.; Miskimins, J.L. Cryogenic fracturing of wellbores under true triaxial-confining stresses: Experimental investigation. SPE J. 2018, 23, 1271–1289. [Google Scholar] [CrossRef] [Green Version]
- McDaniel, B.; Grundmann, S.R.; Kendrick, W.D.; Wilson, D.R.; Jordan, S.W. Field applications of cryogenic nitrogen as a hydraulic fracturing fluid. In Proceedings of the SPE Annual Technical Conference and Exhibition, San Antonio, TX, USA, 5–8 October 1997. [Google Scholar]
- Grundmann, S.; Rodvelt, G.; Dials, G.; Allen, R. Cryogenic Nitrogen As a Hydraulic Fracturing Fluid in the Devonian Shale, SPE Eastern Regional Meeting; Society of Petroleum Engineers: Pittsburgh, PA, USA, 1998. [Google Scholar]
- Rassenfoss, S. In search of the waterless fracture. J. Pet. Technol. 2013, 65, 46–54. [Google Scholar] [CrossRef]
- Kim, K.; Kemeny, J. Effect of thermal shock and rapid unloading on mechanical rock properties. In Proceedings of the 43rd US Rock Mechanics Symposium & 4th US-Canada Rock Mechanics Symposium, Asheville, NC, USA, 28 June–1 July 2009. [Google Scholar]
- Cha, M.; Yin, X.; Kneafsey, T.; Johanson, B.; Alqahtani, N.; Miskimins, J.; Patterson, T.; Wu, Y.-S. Cryogenic fracturing for reservoir stimulation–Laboratory studies. J. Pet. Sci. Eng. 2014, 124, 436–450. [Google Scholar] [CrossRef] [Green Version]
- Alqatahni, N.B.; Cha, M.; Yao, B.; Yin, X.; Kneafsey, T.J.; Wang, L.; Wu, Y.-S.; Miskimins, J.L. Experimental investigation of cryogenic fracturing of rock specimens under true triaxial confining stresses. In Proceedings of the SPE Europec featured at 78th EAGE conference and exhibition, Vienna, Austria, 30 May–2 June 2016. [Google Scholar]
- Jiang, L.; Cheng, Y.; Han, Z.; Gao, Q.; Yan, C.; Wang, G.; Wang, H.; Fu, L. Experimental Investigation on Pore Characteristics and Carrying Capacity of Longmaxi Shale Under Liquid Nitrogen Freezing and Thawing. In Proceedings of the IADC/SPE Asia Pacific Drilling Technology Conference and Exhibition, Bangkok, Thailand, 27–29 August 2018. [Google Scholar]
- Elwegaa, K.; Emadi, H.; Ramezanian, M. Investigating Effects of Thermal Shock Technique on Unconventional Reservoir Rock Mechanical Properties. In Proceedings of the 53rd US Rock Mechanics/Geomechanics Symposium, New York, NY, USA, 23–26 June 2019. [Google Scholar]
- Khalil, R.; Emadi, H. An experimental investigation of cryogenic treatments effects on porosity, permeability, and mechanical properties of Marcellus downhole core samples. J. Nat. Gas Sci. Eng. 2020, 81, 103422. [Google Scholar] [CrossRef]
- Yang, B.; Wang, H.; Wang, B.; Shen, Z.; Zheng, Y.; Jia, Z.; Yan, W. Digital quantification of fracture in full-scale rock using micro-CT images: A fracturing experiment with N2 and CO2. J. Pet. Sci. Eng. 2021, 196, 107682. [Google Scholar] [CrossRef]
- Siddiqui, S.; Khamees, A.A. Dual-energy CT-scanning applications in rock characterization. In Proceedings of the SPE annual technical conference and exhibition, Houston, TX, USA, 26–29 September 2004. [Google Scholar]
- Al Shafloot, T.; Kim, T.W.; Kovscek, A. Investigating Fracture Propagation Characteristics in Shale Using sc-CO2 and Water with the Aid of X-ray Computed Tomography. J. Nat. Gas Sci. Eng. 2020, 103736. [Google Scholar] [CrossRef]
- Khalil, R.; Emadi, H.; Elwegaa, K. Investigation of rock properties of the Marcellus formation—An experimental study. In Proceedings of the SPE Eastern Regional Meeting, Charleston, WV, USA, 15–17 October 2019. [Google Scholar]
- Eloranta, P. Drill Hole KFM01A: Indirect Tensile Strength Test (HUT); SKB P04171; Svensk Kärnbränslehantering AB: Stockholm, Sweden, 2004. [Google Scholar]
- Guo, Y.; Wang, L.; Chang, X. Study on the damage characteristics of gas-bearing shale under different unloading stress paths. PLoS ONE 2019, 14, e0224654. [Google Scholar] [CrossRef] [PubMed]
- He, J.; Lin, C.; Li, X.; Wan, X. Experimental investigation of crack extension patterns in hydraulic fracturing with shale, sandstone and granite cores. Energies 2016, 9, 1018. [Google Scholar] [CrossRef] [Green Version]
- Ko, T.; Kemeny, J. Effect of confining stress and loading rate on fracture toughness of rocks. In Proceedings of the 1st Canada-US Rock Mechanics Symposium, Vancouver, BC, Canada, 27–31 May 2007. [Google Scholar]
- Lin, C.; He, J.; Li, X.; Wan, X.; Zheng, B. An experimental investigation into the effects of the anisotropy of shale on hydraulic fracture propagation. Rock Mech. Rock Eng. 2017, 50, 543–554. [Google Scholar] [CrossRef]
- Zhang, Y.; He, J.; Li, X.; Lin, C. Experimental study on the supercritical CO2 fracturing of shale considering anisotropic effects. J. Pet. Sci. Eng. 2019, 173, 932–940. [Google Scholar] [CrossRef]
- Kate, J. Influence of saturation on dynamic elastic constants of sandstones. In Proceedings of the ISRM International Symposium-EUROCK 2012, Stockholm, Sweden, 28–30 May 2012. [Google Scholar]
- Lai, B.; Li, H.; Zhang, J.; Jacobi, D.; Georgi, D. Water-content effects on dynamic elastic properties of organic-rich shale. SPE J. 2016, 21, 635–647. [Google Scholar] [CrossRef]
- Olsen, C.; Fabricius, I.L. Static and dynamic Young’s modulus of North Sea chalk. In SEG Technical Program Expanded Abstracts 2006; Society of Exploration Geophysicists: Houston, TX, USA, 2006; pp. 1918–1922. [Google Scholar]
- Saxena, V.; Krief, M.; Adam, L. Handbook of Borehole Acoustics and Rock Physics for Reservoir Characterization; Elsevier: Amsterdam, The Netherlands, 2018. [Google Scholar]
- Zoback, M.D. Reservoir Geomechanics; Cambridge University Press: Cambridge, UK, 2010. [Google Scholar]
- Freund, D. Ultrasonic compressional and shear velocities in dry clastic rocks as a function of porosity, clay content, and confining pressure. Geophys. J. Int. 1992, 108, 125–135. [Google Scholar] [CrossRef] [Green Version]
- Yu, H.; Zhang, Y.; Lebedev, M.; Wang, Z.; Li, X.; Squelch, A.; Verrall, M.; Iglauer, S. X-ray micro-computed tomography and ultrasonic velocity analysis of fractured shale as a function of effective stress. Mar. Pet. Geol. 2019, 110, 472–482. [Google Scholar] [CrossRef]
Figure 1.
Marcellus wells initial yields.

Figure 2.
Schematic of the lab cryogenic treatments.

Figure 3.
Temperature and pressure of a cryogenic treatment at 4.14 MPa.

Figure 4.
Mineralogical compositions of the core samples.

Figure 5.
X-ray diffraction (XRD) angle of core samples.

Figure 6.
Computerized tomography (CT)-scan images (sample M6) parallel to the beddings (A) before the cryogenic treatment and (B) after the cryogenic treatment.
Figure 6.
Computerized tomography (CT)-scan images (sample M6) parallel to the beddings (A) before the cryogenic treatment and (B) after the cryogenic treatment.

Figure 7.
CT-scan images (sample M20) perpendicular to the beddings (A) before thermal shock and (B) after thermal shock.
Figure 7.
CT-scan images (sample M20) perpendicular to the beddings (A) before thermal shock and (B) after thermal shock.

Figure 8.
Sample M19 wiped with Toluene. (A) Toluene shows fracture face; (B) some Toluene dried; (C) all Toluene dried.
Figure 8.
Sample M19 wiped with Toluene. (A) Toluene shows fracture face; (B) some Toluene dried; (C) all Toluene dried.

Figure 9.
Sample M12 (4.14 MPa) (A) before the cryogenic treatment and (B) after the cryogenic treatment.
Figure 9.
Sample M12 (4.14 MPa) (A) before the cryogenic treatment and (B) after the cryogenic treatment.

Figure 10.
Porosity increment of the core samples due to cryogenic treatments.

Figure 11.
Permeability increment of the core samples due to cryogenic treatments.

Figure 12.
Compressional velocities before and after cryogenic treatments.

Figure 13.
Shear velocities before and after cryogenic treatments.

Figure 14.
Average reductions in compressional velocities due to the cryogenic treatments.

Figure 15.
Average reductions in shear velocities due to the cryogenic treatments.

Figure 16.
Young’s modulus before and after cryogenic treatments.

Figure 17.
Poisson’s ratio before and after cryogenic treatments.

Figure 18.
Reduction on Young’s modulus due to the cryogenic treatments.

Figure 19.
Change of Poisson’s ratio due to the cryogenic treatments.

Figure 20.
Bulk compressibility before and after cryogenic treatments.

Figure 21.
Increase of the bulk compressibility of the core samples due to cryogenic treatments.


Table 1.
Physical properties of the core samples before and after cryogenic treatments using LN2.
| Group A | Group B | Group C | Group D | |||||||
|---|---|---|---|---|---|---|---|---|---|---|
| Sample # | M4 | M8 | M11 | M16 | M15 | M19 | M20 | M6 | M9 | M12 |
| Density, kg/m3 | 2615 | 2622 | 2615 | 2627 | 2620 | 2622 | 2623 | 2618 | 2618 | 2625 |
| Average, kg/m3 | 2615 | 2621 | 2622 | 2620 | ||||||
| Treatment pressure | 0.14 MPa | 1.38 MPa | 2.76 MPa | 4.14 MPa | ||||||
| Porosity Before LN2 | 13.71% | 10.99% | 7.14% | 8.51% | 8.74% | 10.66% | 9.51% | 6.43% | 9.03% | 8.66% |
| Average | 13.71% | 8.88% | 9.64% | 8.04% | ||||||
| Porosity after LN2 | 14.13% | 12.29% | 9.58% | 11.44% | 12.47% | 13.55% | 11.97% | 10.89% | 11.90% | 13.33% |
| Average | 14.13% | 11.10% | 12.66% | 12.04% | ||||||
| Porosity Increase | 0.42% | 2.22% | 3.03% | 4.00% | ||||||
| Perm Before LN2, nD | 49.50 | 11.00 | 4.69 | 23.10 | 13.20 | 9.53 | 17.50 | 15.80 | 5.50 | 6.80 |
| Average, nD | 49.50 | 12.93 | 13.41 | 9.37 | ||||||
| Perm After LN2, nD | 1060 | 1470 | 2075 | 13,500 | 14,500 | 10,500 | 27,900 | 168,667 | 14,600 | 211,000 |
| Average, nD | 1060 | 5682 | 17,633 | 131,422 | ||||||
| Perm Increase, folds of increase over matrix permeability | 21 | 439 | 1315 | 14,031 | ||||||
Publisher’s Note: MDPI stays neutral with regard to jurisdictional claims in published maps and institutional affiliations. |
© 2021 by the authors. Licensee MDPI, Basel, Switzerland. This article is an open access article distributed under the terms and conditions of the Creative Commons Attribution (CC BY) license (http://creativecommons.org/licenses/by/4.0/).
Share and Cite
MDPI and ACS Style
Khalil, R.; Emadi, H.; Altawati, F. Effects of Pressurizing Cryogenic Treatments on Physical and Mechanical Properties of Shale Core Samples—An Experimental Study. Gases 2021, 1, 33-50. https://0-doi-org.brum.beds.ac.uk/10.3390/gases1010003
AMA Style
Khalil R, Emadi H, Altawati F. Effects of Pressurizing Cryogenic Treatments on Physical and Mechanical Properties of Shale Core Samples—An Experimental Study. Gases. 2021; 1(1):33-50. https://0-doi-org.brum.beds.ac.uk/10.3390/gases1010003
Chicago/Turabian StyleKhalil, Rayan, Hossein Emadi, and Faisal Altawati. 2021. "Effects of Pressurizing Cryogenic Treatments on Physical and Mechanical Properties of Shale Core Samples—An Experimental Study" Gases 1, no. 1: 33-50. https://0-doi-org.brum.beds.ac.uk/10.3390/gases1010003