
Tourism Endowments, Institution Quality, and Inbound Tourists: A Panel Analysis of ASEAN


Graduate School of International Development, Nagoya University, Nagoya 464-8601, Japan
Tour. Hosp. 2021, 2(2), 218-232; https://0-doi-org.brum.beds.ac.uk/10.3390/tourhosp2020013
Submission received: 23 April 2021
/
Revised: 16 May 2021
/
Accepted: 17 May 2021
/
Published: 19 May 2021
Abstract
:This study empirically examines the impact of the tourism endowments, institution quality, and its sub-components on inbound tourists in the Association of Southeast Asia Nation (ASEAN) member states using the fixed-effect model and panel data set from 2007–2017. The results show that the tourism endowment index and institution quality are essential factors that encourage inbound tourists to visit individual ASEAN member states. I further examine inbound tourists’ responses to each sub-component of institution quality. I corroborate that most of the sub-components of institution quality play an essential role in promoting inbound tourism in individual ASEAN member states. Other variables, such as China’s GDP per capita, foreign direct investment (FDIs), and single-entry visa schemes, show positive and significant impacts on inbound tourists in individual ASEAN member states. Therefore, these results aid the government and the policymakers in ASEAN member states to provide additional, appropriate tourism strategic development plans and policies.
1. Introduction
In recent years, tourism has emerged as a critical instrument in economic development and poverty alleviation in many countries, including ASEAN member states. ASEAN member states have committed to promoting tourism, as a single tourism destination, and increasing the number of inbound tourists. However, the percentage share of inbound tourists in individual ASEAN member states to the total of ASEAN’s inbound tourists has shown a big gap. Indonesia, Malaysia, Singapore, Thailand, and Vietnam captured a combined percentage share of inbound tourists, about 84%, while the rest of ASEAN member states captured only 16% in 2018 [1]. This large inequality share may be on account of many reasons, but two prominent reasons among them are having less collaboration for promoting tourism endowments among ASEAN member states and a lack of institution quality.
Tourism endowments are an important catalyst for tourism development because tourism is an endowment-based industry. ASEAN member states have significant tourism endowments for tourism potential, namely Cultural and Natural World Heritage Sites (CNWHS), Intangible Cultural World Heritage (ICWH), Memories of World Heritage (MHS), and tentatively-Inscribed State Property Heritage Sites (TWHS). The United Nations Educational, Scientific, and Cultural Organization (UNESCO) has inscribed these heritages for conservation and preservation. Inscription as World Heritage has led a strong power for tourism attractions and has been expected to increase inbound tourists [2]. World Heritage status is a reliable way to promote inbound tourism because it is a top global brand with a competitive advantage over competing, non-inscribed destinations [3]. Moreover, the TWHS offers indirect impact, as a promotional and marketing tool, for tourism growth [4]. Besides, inbound tourists aim to explore and learn the culture, history, art, and customs through art performance events (e.g., traditional music, theatre, dance, and rituals) in destination countries [2]. This suggests an underlying positive relationship between World Heritage and inbound tourism. However, there has not yet been a consensus in the literature that World Heritage promotes inbound tourism. Some evidence shows that World Heritage increases inbound tourists [5,6], while other evidence does not support this effect [7].
The importance of institution quality is an ongoing debate in tourism studies. North [8] states that institution quality is a prominent part of a country’s soft infrastructure. Low institution quality leads to more uncertainty and higher transaction costs for local and foreign firms that offer tourism products [9]. Furthermore, institution quality reflects a destination’s image, giving a signal of safety, security, and stability. This signal influences inbound tourists’ decision-making in choosing tourism destinations. In addition, inbound tourists tend to avoid visits to poor institution quality destinations and select destinations that are, otherwise, less attractive for tourists but have better institution quality [10]. Kaufmann et al. [11] propose that institution quality has six sub-components: government effectiveness (GEF), regulatory quality (RQ), the rule of law (RL), control of corruption (COC), political stability (PS), and voice and accountability (VA). These, furthermore, have two critical aspects. Governance-oriented aspects (GEF, RQ, and RL) reflect a country’s capacity to deliver quality private and civil services, support policy formulation, and design and promulgate regulations and policies that nurture the private sector’s development and growth. They also reflect people’s trust and acceptance of laws, regulations, property rights, and contract enforcement. Politics-oriented aspects (PS, COC, and VA) reflect a country’s stability and control of corruption and its people’s freedom. In the literature, studies examine the impact of politics-oriented aspects on inbound tourists, including corruption [12], political and economic freedom [13], political instability and terrorism [14], and political stability [15]. However, the impact of governance-oriented aspects on inbound tourists has limited study. According to Khan [16], the positive impact of governance-oriented aspects arise, essentially, from two sources. First, it curtails transaction costs, permitting markets to work sufficiently. Second, the improvement of governance-oriented aspects grants markets the ability to “overcome entrenched market failures in allocating assets, acquiring productivity-enhancing technologies, and maintaining political stability in the context of rapid social transformation” (p. 3). Hence, governance-oriented aspects influence both market and non-market activities, influencing tourists’ decision-making in selecting a destination to visit. None of the studies have focused on tourism endowments and governance-oriented aspects in the individual ASEAN member states to the best of the author’s knowledge. For the first time, I will compute the tourism endowment index (TED) that contains NCWHS, ICWH, MWH, and TWHS and then incorporate it, together, with governance-oriented aspects in a quantitative analysis.
Therefore, this study examines the impact of the Tourism Endowment Index (TED), institution quality, and its sub-components (politics-oriented and governance-oriented aspects) on inbound tourists in individual ASEAN member states. The estimation result shows that better institution quality, better sub-components of institution quality, and having more tourism endowments (NCWHS, ICWH, MWH, and TWHS) promotes inbound tourism in individual ASEAN member states. This study makes two main contributions to the field: first, it extends the existing literature on the impact of governance-oriented aspects on inbound tourists, which influences both market and non-market activities leading to discouraging inbound tourists from visiting destinations; second, it provides new findings on the impact of TED, on inbound tourists, in individual ASEAN member states. The findings may give the policymakers insightful evidence to assess tourism-led growth policies’ viability. More crucially, the present study will propose appropriate and complementary policies to promote inbound tourism in ASEAN member states for tourism destinations, focusing on NCWHS, ICWH, MWH, and TWHS.
The remainder of this paper is organized as follows: Section 2 describes inbound tourists and institution quality in ASEAN member states. Section 3 provides a review of current literature on tourism determinants. Section 4 presents the research method and data. Section 5 presents empirical result and discussion. Finally, Section 6 concludes the findings of the study with policy recommendations.
2. Inbound Tourists and Institution Quality in the ASEAN Member States
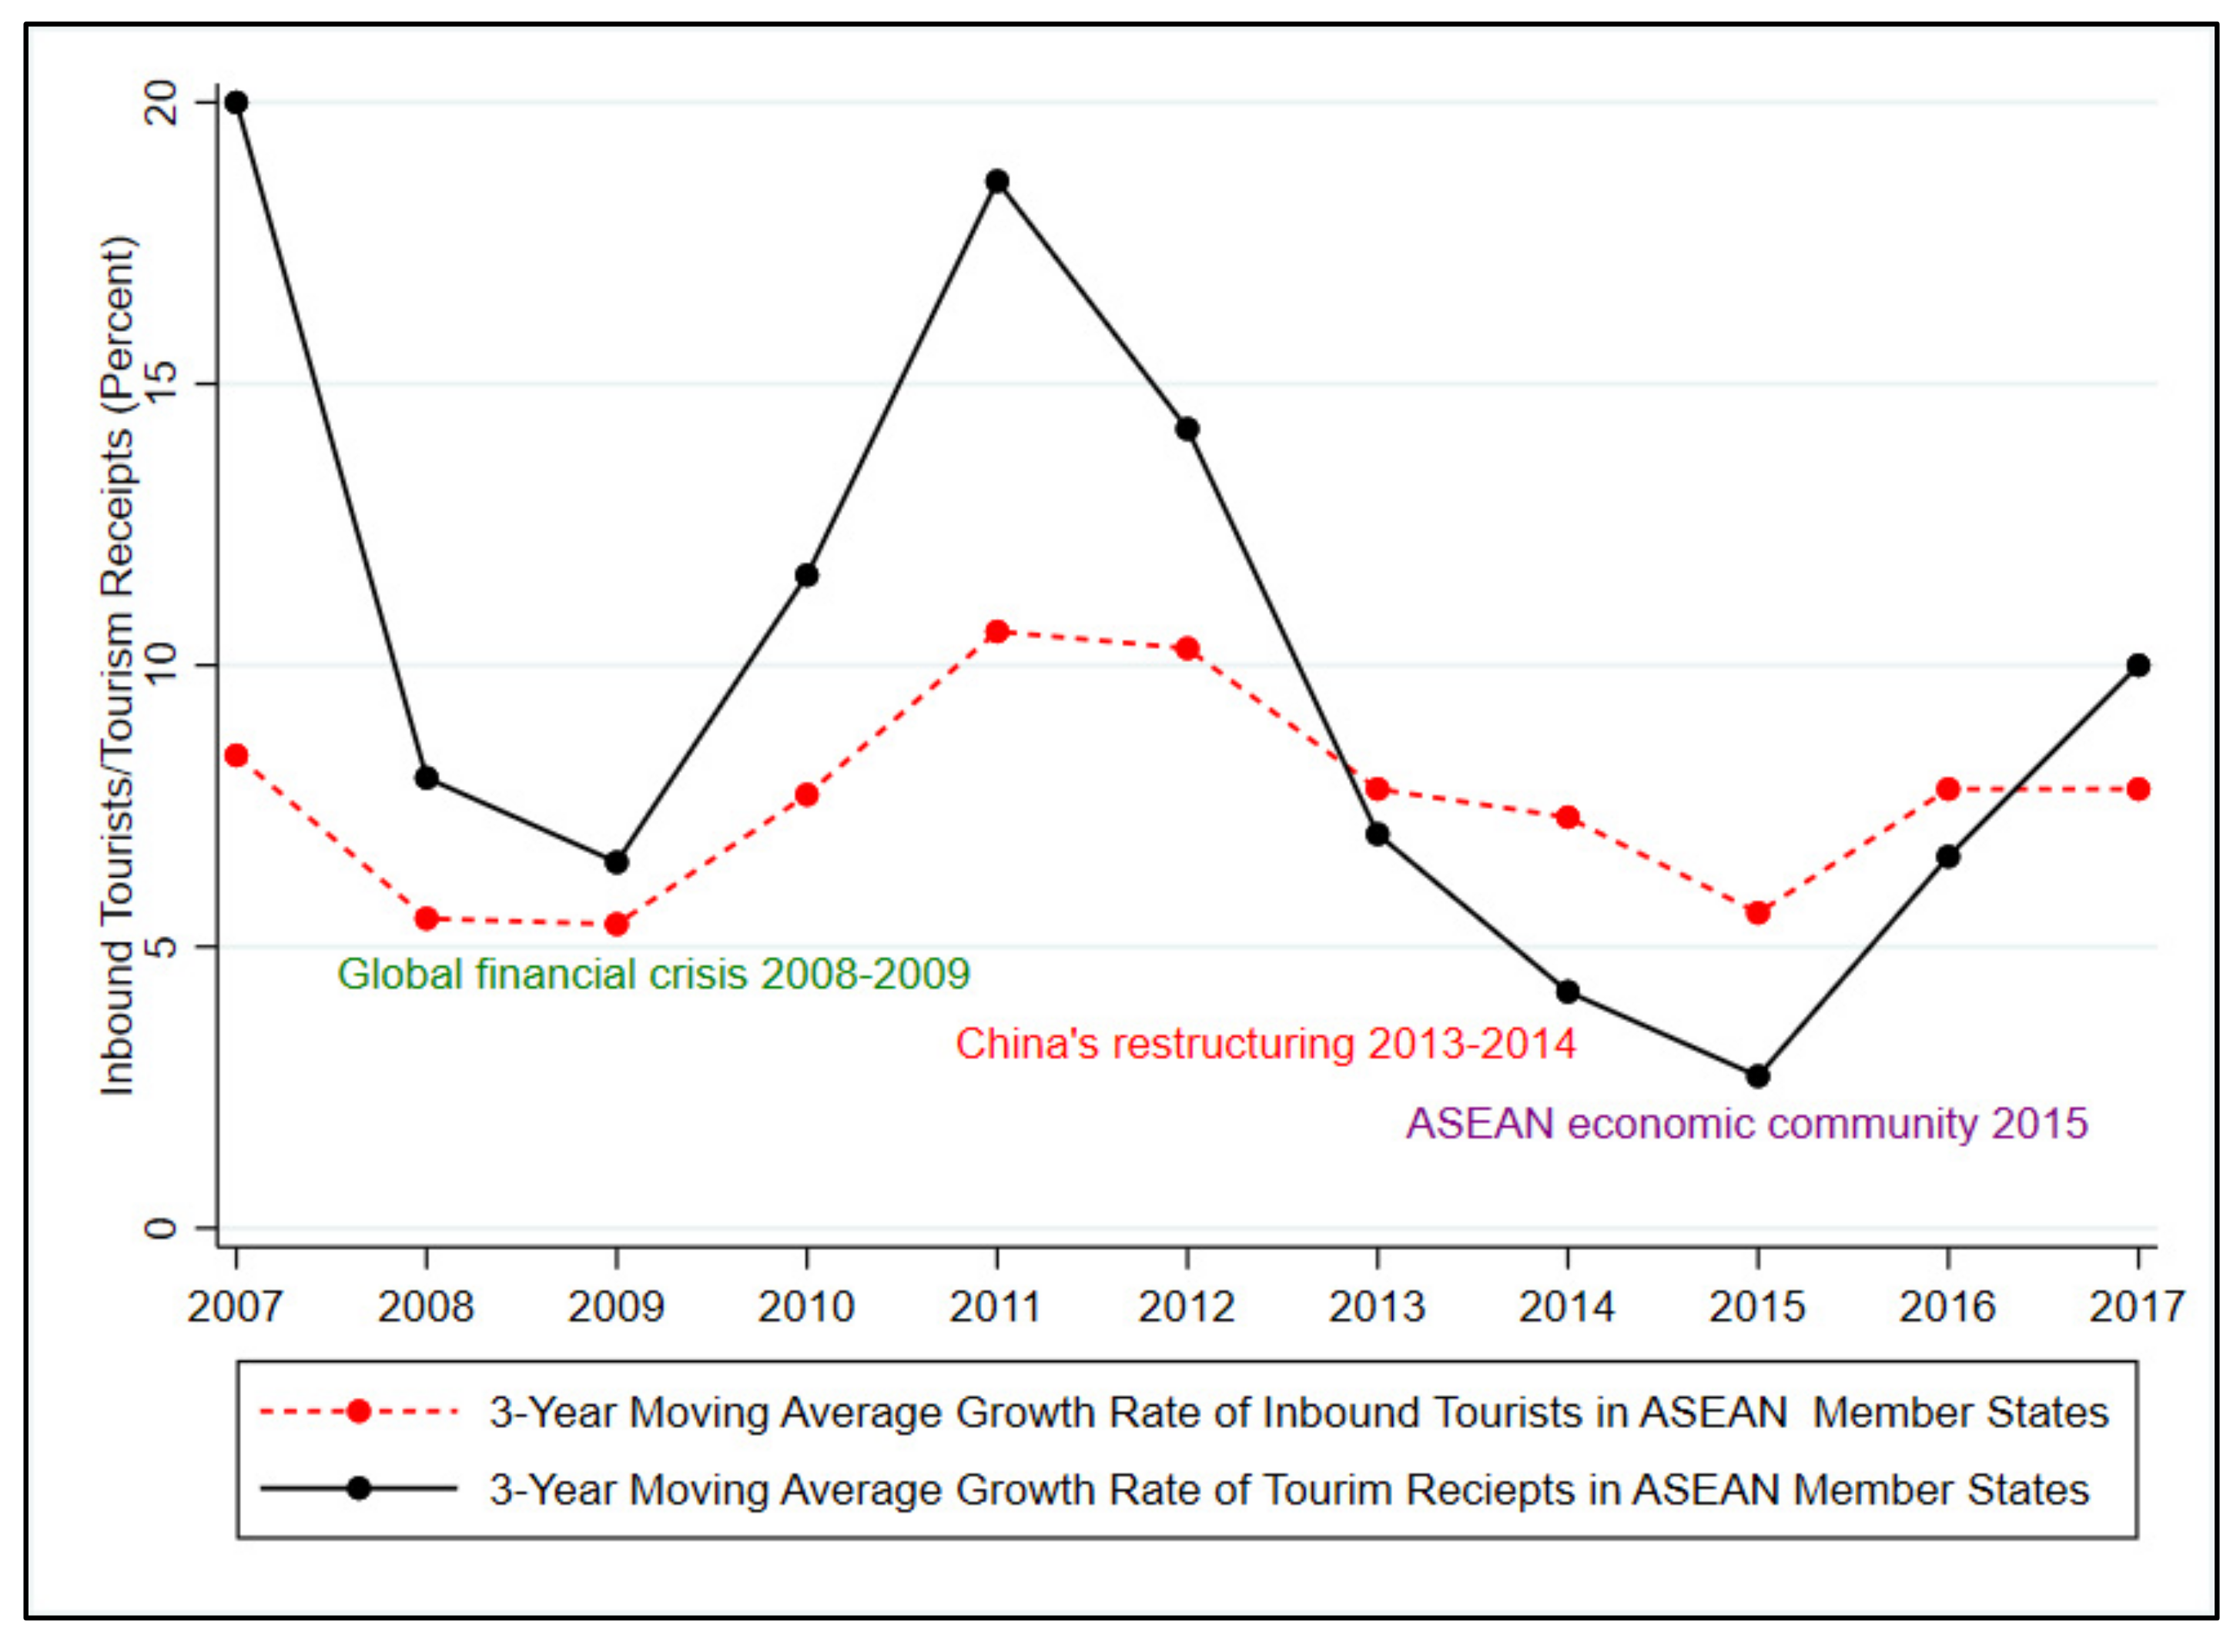
The ASEAN member states have many stunning cultural and natural endowments that make themselves a key tourism destination. ASEAN member states attracted 9.2% of total global inbound tourists, giving it the seventh-highest share globally and the second-highest share in the Asia Pacific region in 2018 [17]. The tourism industry in ASEAN member states accounted for 12% of its GDP and 13% of its total employment in 2019 [17]. Remarkably, inbound tourists in ASEAN member states increased more than two-fold between 2007 and 2017: from 62 million to 126 million. However, it should be noted that inbound tourists, and tourism receipts, in ASEAN member states were affected by the global financial crisis from 2008 to 2009. Although they quickly recovered in 2010, they again began to decline during China’s restructuring from 2013 to 2014. The annual growth rate of inbound tourists, and tourism receipts, in ASEAN member states decreased from 2011 to 2017. The annual growth rate of inbound tourists fell from 10.6% in 2011 to 7.8% in 2017. The annual growth rate of tourism receipts decreased sharply, by nearly two digits, in the same period (see Figure 1). Nevertheless, in 2015, ASEAN member states became a single economic community; thus, the annual growth rate of inbound tourists and tourism receipts substantially increased until 2017.
Although the tourism sector in ASEAN member states has expanded significantly over the past few decades, inbound tourists’ annual growth rate has seen a fluctuation in growth. This fluctuation has made ASEAN’s critical vision, to promote themselves as a single tourism destination, become a significant challenge. This challenge is also because some countries compete for tourism destinations while other countries complement each other. For example, Cambodia competes for tourists with Brunei Darussalam, Malaysia, and Singapore, while as a tourism destination, it complements Lao PDR, Myanmar, Thailand, and Vietnam. It neither complements, nor is a substitute destination, for Indonesia or the Philippines (Table 1).
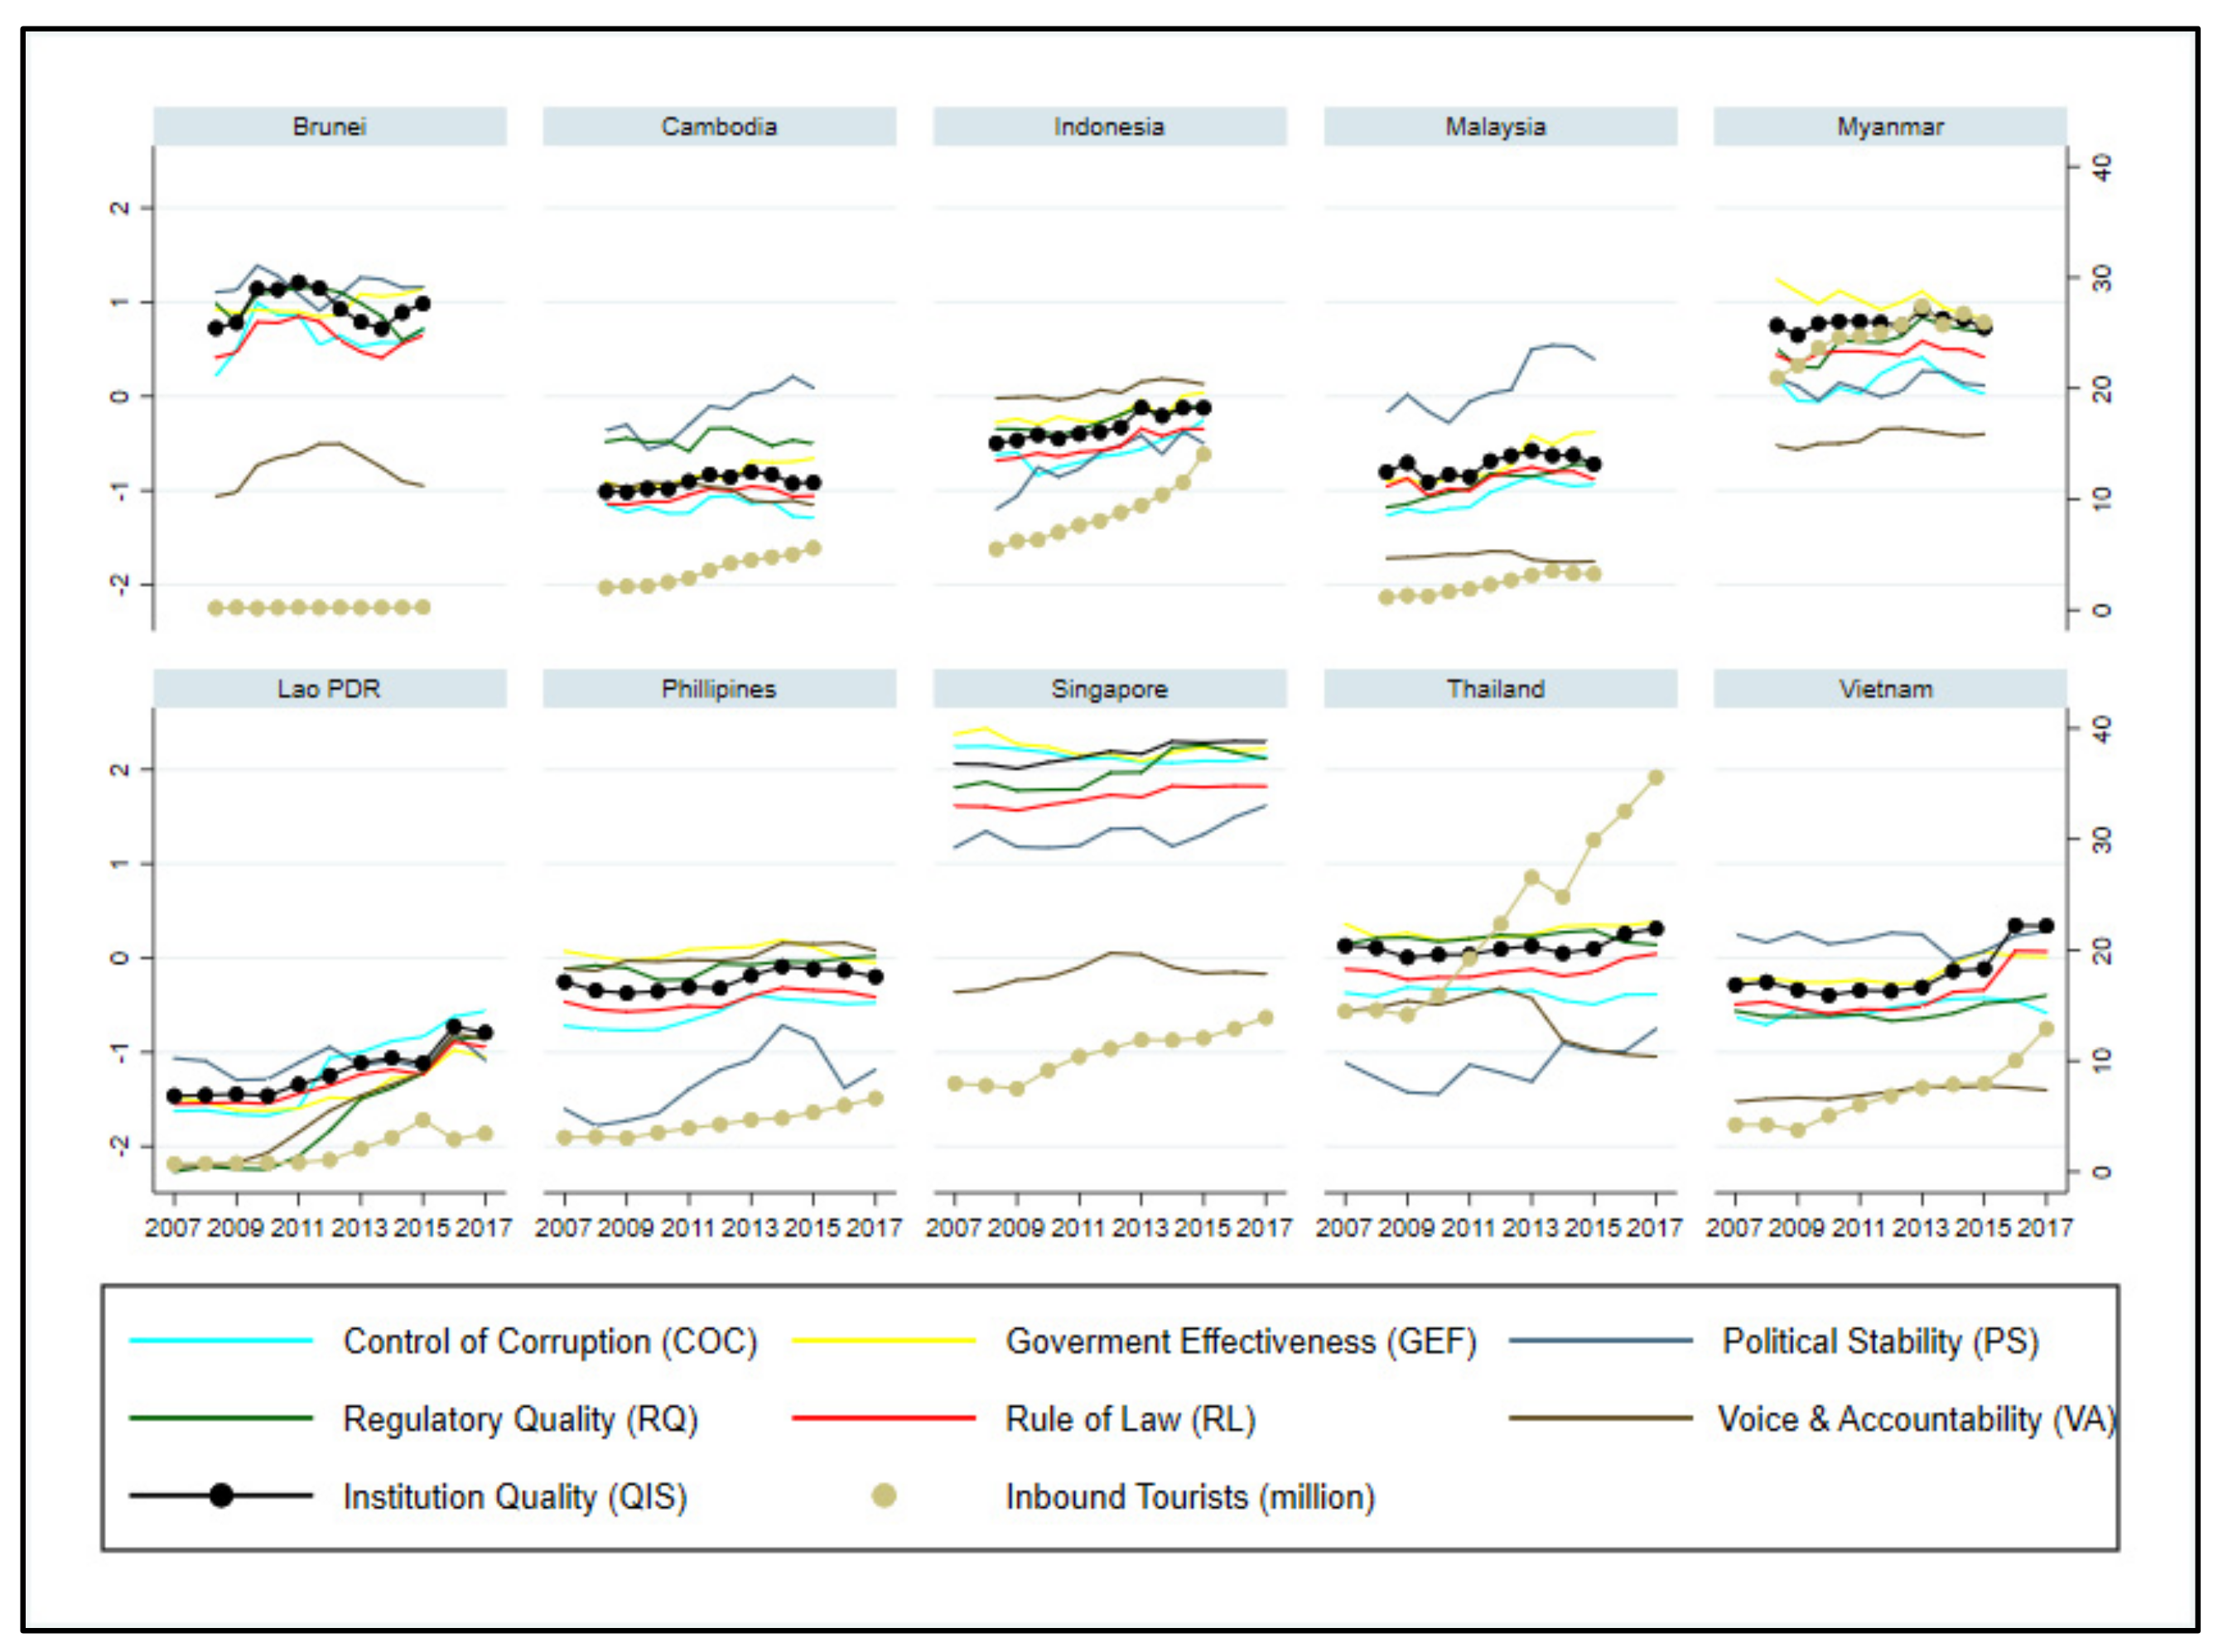
According to the situation outline above, this study considers factors that cause fluctuations in the growth of inbound tourists in individual ASEAN member states, focusing on institution quality. Figure 2 below displays data on institution quality and inbound tourists in ASEAN member states. From 2007 to 2017, Singapore and Brunei had the highest score for all sub-components of institution quality, indicating strong institutional systems in these countries. Cambodia, Indonesia, and Lao PDR had more PS than Malaysia, the Philippines, Vietnam, and Thailand. Indonesia and Malaysia had better COC than in Cambodia, Lao PDR, Myanmar, the Philippines, Vietnam, and Thailand. The GEF in Cambodia, Indonesia, and Malaysia grew, while in Thailand, Vietnam, and the Philippines, it remained stagnant. The RQ remained stable in Cambodia, the Philippines, Thailand, and Vietnam but increased in Indonesia, Lao PDR, and Myanmar. RL in Cambodia, Lao PDR, Myanmar, the Philippines, and Thailand improved less than that in Indonesia, Malaysia, and Vietnam. Except for Indonesia, VA showed a decreasing trend in most ASEAN member states, indicating that these countries had less freedom of speech, expression, and media. As shown in Figure 2, in Indonesia, Malaysia, and Singapore, inbound tourists and the sub-components of institution quality all developed roughly similar trends from 2007 to 2017. The development of sub-components of institution quality and inbound tourists in Brunei, Cambodia, Myanmar, the Philippines, Thailand, and Vietnam appear to differ from these trends.
3. Literature Review of Tourism Determinants
A large and growing body of literature has examined various determinant factors (e.g., GDP per capita, tourism price, exchange rate, hotel rooms, visa policy, transportation cost, and cultural preference) impacting inbound tourists (see [12,14,18,19]). Wu et al. [20] review the literature and summarize the tourism demand theory, concluding that income and price are the most explained variables on tourism demand. Huang et al. [7] show that tourism is affected by luxurious goods; hence inbound tourists are sensitive to income changes. Contrary to this, Naudé and Saayman [21] find inbound tourists are not especially responsive to income changes. As far as the tourism price is concerned, Demir and Gozgor [12] confirm that higher tourism prices reduce the number of inbound tourists. On the contrary, Onafowora and Owoye [22] fail to show this effect in the Caribbean. Ghaderi et al. [23] show that depreciation of domestic currency, per US$, increases inbound tourists, but Balli et al. [24] find that real exchange rate discourages inbound tourists from visiting destination countries.
A strand of literature has extended the tourism demand theory (income and price as determinant factors) by focusing on tourism endowments. World Heritage Sites (WHS), which are inscribed as the outstanding universal value of human activities, have become the most predominant tourism endowments for many countries to attract inbound tourists. The inscription indicates the admission of the, excellent and recognized, global existence of WHS that tourists should visit [25]. However, some studies show that WHS promote inbound tourism in some particular countries, such as China [6], Italy [25], and England [5], while a related study shows the opposite finding for Macau [7]. Recently, Io [2] studied the relationship between ICWH and inbound tourism. Like the majority of the aforementioned studies, he finds that ICWH promotes inbound tourism. This is because inbound tourists also prefer to explore and experience the history, culture, and customs of the destination.
Another strand of literature has focused on the impact of institution quality, on inbound tourists, with a litany of mixed results. Institution quality consists of formal and informal norms that incite how people interact with one another [26]. Good institution quality stimulates economic growth and development because they cultivate trust and cooperation, foster investment, and free movement. In contrast, poor institution quality causes economic stagnation, corruption, and political instability. There is ample evidence that institution quality is one of the predominant determinants (if not the main factor) of various countries’ economic development [27,28]. Whether institution quality should have any impact on the tourism-dependent countries’ economy is less obvious. Inbound tourists, especially those who visit less-developed countries, typically only visit specific destinations, stay for a relatively short time, and involve only simple economic exchanges with residents and the business sector. Furthermore, countries that treat their citizens with a poor institution quality can, nevertheless, successfully attract inbound tourists from the adverse effects of poor institution quality and ensure access to all modern convenience [10]. The small, but growing, empirical tourism studies examine the impact of institution quality on inbound tourists. Ghalia et al. [10] argue that institution quality influences inbound tourists. For example, the impact of corruption on inbound tourists varies but is not always negative [19]. Saha and Yap [29], for example, show an insignificant impact of corruption on inbound tourists in countries enriched by NCWHS because experienced inbound tourists expect to pay bribes to authorities, for a travel visa or permits, to visit tourism destinations. Das and Dirienzo [30] show the negative relationship between corruption and inbound tourists. While Lv and Xu [31] show a nonlinear relationship between corruption and inbound tourists, corruption increases inbound tourists at a low level, but corruption reduces inbound tourists after a certain threshold level of 7.7. Saha et al. [13] analyze the impact of PS and political freedom on inbound tourists, suggesting that destinations with higher PS and political freedom increase inbound tourists. Moreover, inbound tourists are sensitive to political instability, social unrest, human rights violation, and terrorism [15].
In summary, most studies, and an emerging strand of literature, have highlighted traditional determinant factors (e.g., income, tourism price, and exchange rate), tourism endowments (e.g., world heritage sites), and politics-oriented aspects (PS, COC, and VA) as determinant factors of inbound tourists. However, other aspects of tourism endowments (e.g., ICWH, MWH, and TWHS) and governance-oriented aspects (e.g., RL, RQ, and GEF) have been ignored in general, and particularly in individual ASEAN member states. The tourists may expect to learn authentic history, arts, culture, and customs through festival and art performance events besides heritage sites. In terms of governance-oriented aspects (e.g., RL, RQ, and GEF), Kim et al. [32] state that countries with low governance-oriented aspects are distinguished by higher transaction costs, inefficient and unreliable hospitality service, corrupt bureaucracies, biased courts, and unregulated opportunistic tourism-related business activities. Taken together, these aspects may encourage inbound tourists, including business tourists, to reduce their length of stay in such countries or avoid them altogether. Therefore, the impact of the TED (CNWHS, ICWH, MWH, and TWHS), institution quality, and its sub-components (politics-oriented and governance-oriented aspects), on inbound tourists needs to be confirmed comprehensively and validated, in particular, in ASEAN member states.
4. Research Method and Data
4.1. Research Method
This study utilizes the fixed-effect method to examine the impact of the TED, institution quality, and its sub-components (politics-oriented and governance-oriented aspects), on inbound tourists in individual ASEAN member states for two reasons. First, the model allows us to control omitted variables by removing an unobserved country from random error. Second, the model allows us to control the country-fixed effect of geographical characteristics and climate, including variables that change over time but not across countries. Following [19], this study uses the total number of inbound tourists in individual ASEAN member states as a dependent variable. Tourism receipts (TRC), which are another crucial indicator of tourism development, are used to check for robustness [9].
Followed [24] and [9], the estimation model is expressed as Equation (1):
where is the constant term; is the fixed-country effect, which is a time-invariant variable that impacts the dependent variable; is the coefficient of TED; (k = 1 … 7) is the coefficient of institution quality and sub-components of institution quality (. , , and are the logarithm of the total number of inbound tourists, the tourism endowment index, and the institution quality in the individual ASEAN member states j = 1, …, and 10 and during period t = 2007, …, and 2017, respectively. is a group of control variables, and is the coefficient of a set of control variable. c denotes the number of control variables.
4.2. Data
This study utilizes panel data that cover the 11 years of 2007–2017. These data are obtained from several sources, including World Development Indicators, the UNESCO database, UNCTAD Stat, and the World Governance Indicators [33]. Except for the TED, institution quality, and its sub-components, crime, and dummy variables, all variables are transformed into a natural logarithm. The dependent variable is the total number of inbound tourists (ITA) in individual member states (Brunei Darussalam, Cambodia, Indonesia, Lao PDR, Malaysia, Myanmar, Philippines, Singapore, Thailand, and Vietnam).
The independent variables are divided into two groups: interest variables (denoted by and and control variables (denoted by ). The TED is regarded as an independent interest variable. Because ASEAN member states feature significant CNWHS, ICWH, MWH, and TWHS, these WHS might be the primary driver that attracts inbound tourists to individual ASEAN member states. Institution quality is also a crucial variable in this study because it represents a destination country’s image. We have observed that a better institution quality signals safety, security, and stability, all of which encourage inbound tourists. The institution quality and TED are the indexes created using the principal component analysis (PCA). This index has been constructed by following [34]. The QIS ranged from −2.5 (weak) to +2.5 (strong). Furthermore, the sub-components of institution quality have also been incorporated into this study, as described in Table 2.
In addition to the variables of interest, I control some variables that influence inbound tourists. I choose the control variables, based on data availability and variables that have presented persistent results, that impact inbound tourists in the literature. These control variables include tourism price, exchange rate, crime rate, hotel rooms, and global financial crises (GFC) [10,35]. Other control variables have also been considered for their possible impact on inbound tourists; namely, foreign direct investment in stock (FDIs), China’s GDP per capita, single-entry visa scheme (SVS) policy (for Cambodia, Loa PDR, Myanmar, Thailand, and Vietnam), and the ASEAN economic community (AEC). Foreign direct investors seek business opportunities and more information than is, often, publicly available. The investors may aim to develop tourism-related and other industries that the host country lacks [26]. In this sense, FDIs bring more foreign direct investors, their staff, and fellows to destination countries, leading to increased business travelers. China’s GDP per capita is included in this study. Because Chinese tourists in ASEAN member states have sharply increased over time, in 2018, they accounted for more than 21% of all foreign tourists, constituting ASEAN’s largest market source. Thus, China’s higher GDP per capita may increase inbound tourists in individual ASEAN member states. This study also incorporates a few crucial dummy variables: AEC, GFC, and SVS. The AEC, which came into being in 2015, allows for a free flow of labor, and investments, among ASEAN member states. This integration could make the region more competitive, collaborative, and connected, reducing transportation costs, which would decrease the cost of traveling and entry barriers. The GFC of 2008–2009 led to a reduction in inbound tourists in individual ASEAN member states. The SVS policy implemented in 2012 allows tourists to visit five countries by using a single visa. It will reduce tourists’ travel costs, making it more affordable to visit multiple countries in ASEAN member states. A detailed description of descriptive statistics is provided in Table 3.
5. Result and Discussions
This section first estimates the impact of TED, and institution quality, on inbound tourists in individual ASEAN member states by incorporating various control variables to obtain the robustness and magnitude of variables of interest across different specifications; it also tests whether the newly introduced variables mediate some of the impacts. Second, I include all control variables, except for China’s GDP per capita, due to its high correlation with AEC and SVS, to estimate the impact of sub-components of institution quality on inbound tourists in individual ASEAN member states. Table 4 displays the bivariate correlations of all variables used in the present study.
Column 1 of Table 5 shows that institution quality and TED positively, and significantly, impact inbound tourists in individual ASEAN member states. This result indicates that countries with a higher institution quality and more tourism endowments (e.g., NCWHS, ICWH, MWH, and TWHS) increase inbound tourists. This result remains significant, and in the same direction, across Columns 2 to 4 when controlling for tourism price, exchange rate, crime rate, SVS, and introducing new variables (e.g., FDIs, GDPPC_CH, AEC, and GEF).
Recognizing that institution quality has impacts on inbound tourists, I further examined the impact, of sub-components of institution quality, on inbound tourists in individual ASEAN member states. Columns 1 to 6 of Table 6 show that all sub-components of institution quality (i.e., COC, PS, RQ, RL, GEF, and VA) have a positive and statistically significant impact on inbound tourists. Limiting to politics-oriented aspects, the COC positively, and significantly, impacts inbound tourists, implying that achieving greater COC will increase inbound tourists in individual ASEAN member states. The reason could be that better COC could reduce administrative insufficiency and bureaucratic ineffectiveness regarding travel facilitation and visa postponements, reducing the spread of negative information about destinations on social media and travel-review webpages. The PS and VA have positive, and significant, impacts on inbound tourists. This result is supported by [13] and [15], who confirm that inbound tourists prefer to visit destinations where security, safety, political stability exist, and citizens have fundamental rights, such as freedom of speech, expression, and media. Interestingly, the governance-oriented aspects (e.g., RQ, RL, and GEF) positively, and significantly, impact inbound tourists in individual ASEAN member states, suggesting that inbound tourists prefer countries with effective, regulatory quality well-constructed rule of law, having a better quality of public services. The reason could be that better governance-oriented aspects reduce transaction costs, due to inefficient and unreliable hospitality services, corrupt bureaucracies, biased courts, and unregulated opportunistic tourism-related business activities.
Control variables showed the expected signs. Specifically, tourism price positively and significantly impacts inbound tourists, implying that inbound tourists do not become sensitive to increased tourism prices in individual ASEAN member states. The sign of tourism price relatively violates the law of demand, indicating that the tourism price sign should be negative. However, according to [7], its sign could be positive if the tourists perceive tourism consumption to be prestigious in the destination country. The exchange rate has a positive and significant impact on inbound tourists in individual ASEAN member states, indicating that the depreciation of individual ASEAN member states’ currency, against the US dollar, has led to more inbound tourists. Because several ASEAN member states are highly dollarized countries, such as Cambodia, Loa PDR, Myanmar, and Vietnam, inbound tourists may benefit from using the US dollar currency in this region. The crime rate has a negative and significant impact on inbound tourists, implying that a higher crime rate discourages inbound tourists from visiting individual ASEAN member states. This result corroborates with [36], who finds that tourists prefer not to visit countries with a high crime rate record; hence, they chose substitution destinations that are safe and secure. Another factor that has positively, and significantly, impacted inbound tourists is the 2012–2017 SVS instituted in five countries (Cambodia, Lao PDR, Myanmar, Thailand, and Vietnam). It can be inferred that tourists benefit from an SVS policy because tourists who visit ASEAN member states travel to multiple countries during a single trip in the region. Hotel rooms significantly and positively impact inbound tourists in individual ASEAN member states. China’s GDP per capita has a positive and significant influence on inbound tourists, implying that a higher Chinese income has encouraged inbound Chinese tourists to visit individual ASEAN member states. This result is consistent with the Chinese middle class’s rapid growth, increasing global tourism demands. This growth has benefited individual ASEAN member states, which have attracted inbound Chinese tourists, comprising about 21.7% of total tourists annually from 2012 to 2017, thus making ASEAN member states a top destination for Chinese tourists [37]. FDIs show a positive and significant impact on inbound tourists in individual ASEAN member states. The reason could be that FDIs are mainly generated by multinational companies associated with developing various sectors, including the tourism sector, by providing capital, knowledge, and technological transfer. Through these activities, foreign investors, staff, and associates travel to the destination country regularly [38]. Therefore, FDIs may increase inbound, business-oriented tourists in individual ASEAN member states. The AEC has a positive, and significant, impact on inbound tourists in individual ASEAN member states, implying that inbound tourists may benefit from regional integration. This regional integration has boosted ASEAN inbound tourists to travel among ASEAN member states. The integration also enhances tourism service liberalization and reduces transportation costs and entry barriers [39].
I confirm the above findings’ robustness using tourism receipts, commonly proxy for measuring tourism demand, as a dependent variable [19]. I use the same variables and method of estimation shown in Table 5 and Table 6. The results are reported in Columns 1 to 4 of Table 7 and Columns 1 to 6 of Table 8. The institution quality and its sub-components show a robust result with the new dependent variable. However, the TED coefficient has inconsistently positive and significant effects on tourism receipts across all Columns, meaning that the TED is not robust when using a new dependent variable (see Table 7; Table 8). Concerning control variables, FDIs, tourism price, and China’s GDP per capita remain positive and significantly affect tourism receipts. However, other control variables have an inconsistently significant effect on tourism receipts (see AEC, Crime, ER, Rooms, and SVS in Table 7; Table 8). Therefore, these control variables are not robust when we use tourism receipts as the new dependent variable.
6. Conclusions and Policy Recommendations
ASEAN member states have diverse and irreplaceable endowments, incredible CNWHS, ICWH, MWH, and TWHS. This study identified that having more tourism endowments such as CNWHS, ICWH, MWH, and TWHS increases inbound tourists in individual ASEAN member states because tourism is still an endowment-dependent industry. These findings stress that these world heritage sites increase media attention, raise international awareness and reputation, and appeal to inbound tourists who have limited information about tourism destinations.
This study found prominent factors beyond the tourism demand theory (which uses income and price as determinant factors). The institution quality, and its sub-components (politics-oriented and governance-oriented aspects), are the predominant factors in determining the number of inbound tourists in individual ASEAN member states. More interestingly, note that in the sub-components of institution quality, all governance-oriented aspects (RL, RQ, and GEF) and politics-oriented aspects (COC) have a more significant impact on inbound tourists than other politics-oriented aspects (PS and VA). This finding implies that better RL and COC create a sense of security in tourists’ minds and reduce tourists’ traveling costs and negative image of the tourism destination. Higher GEF and RQ can produce quality public goods and services and build a sound regulatory framework that fosters the private sector to develop and improve quality tourism products. Hence, destinations with these potentials will produce tourism products that tourists expect to consume in the visiting countries. The results further confirmed that inbound tourists prefer to visit countries with more political stability, security, safety, and freedom of speech, expression, and media. Meanwhile, control variables, especially China’s GDP per capita, FDIs, and SVS, reveal potential influences on inbound tourists in individual ASEAN member states. The results of the variables of interest are, mostly, robust after controlling for various potentially confounding variables and using tourism receipts in individual ASEAN member states as an alternative dependent variable.
From the findings, we can draw important policy implications. First, more significant efforts are needed to ensure a high institution quality, which is conducive for creating positive image of the countries for pure tourists. In particular, the government and the policymakers should work on strengthen high quality of governance-oriented aspects (especially RQ) and politics-oriented aspects (especially COC). Second, the government should promote CNWHS, ICWH, MWH, and TWHS by encouraging collaboration among ASEAN member states, tourism authorities across ASEAN member states, and ASEAN sub-regional initiatives to create a network of UNESCO tourism sites available within the ASEAN economic community. This can coordinate inbound tourist movements across multiple countries, especially for countries that complement tourism destinations (e.g., Cambodia, Thailand, Lao PRD, and Vietnam). By creating this networking effect, we can increase the stocks of tourism endowments available for the countries and increase the perceived tourism endowments for potential inbound tourists. This initiative will enlarge the ASEAN heritage connection, coalition, and visibility of ASEAN World Heritage. Third, there is a need for a tourism policy to attract more inbound Chinese tourists.
This study has some limitations due to the unavailability of data. The study uses the total number of inbound tourists (pure, business, and others) as the dependent variable, which is limited to providing information on which sub-components of institution quality are more favorable for certain types of inbound tourists. Additionally, the study has not integrated recreational endowments that are another essential element of tourism endowments. Therefore, future research should use disaggregated inbound tourists (holiday and business tourists) and incorporate recreational endowments.
Funding
No external funding was received for this study.
Institutional Review Board Statement
Not applicable.
Informed Consent Statement
Not applicable.
Data Availability Statement
Not applicable.
Conflicts of Interest
The author declares no conflict of interest.
References
- World Development Indicators. 2021. Available online: https://datacatalog.worldbank.org/dataset/world-development-indicator (accessed on 1 March 2021).
- Io, M.U. Understanding the core attractiveness of performing arts heritage to international tourists. Tour. Geogr. 2019, 21, 687–705. [Google Scholar] [CrossRef]
- Buckley, R. The effects of world heritage listing on tourism to Australian national parks. J. Sustain. Tour. 2004, 12, 70–84. [Google Scholar] [CrossRef] [Green Version]
- Ryan, J.; Silvanto, S. A study of the key strategic drivers of the use of the world heritage site designation as a destination brand. J. Travel Tour. Mark. 2014, 31, 327–343. [Google Scholar] [CrossRef]
- Herbert, D. Literary places, tourism, and the heritage experience. Ann. Tour. Res. 2001, 28, 312–333. [Google Scholar] [CrossRef]
- Yang, C.H.; Lin, H.L.; Han, C.C. Analysis of international tourist arrivals in China: The role of world heritage sites. Tour. Manag. 2010, 31, 827–837. [Google Scholar] [CrossRef] [PubMed]
- Huang, C.H.; Tsaur, J.R.; Yang, C.H. Does world heritage list really induce more tourists? Evidence from Macau. Tour. Manag. 2012, 33, 1450–1457. [Google Scholar] [CrossRef] [PubMed]
- North, D.C. The Institution, Institutional Change, and Economic Performance; Cambridge University Press: Cambridge, UK, 1990. [Google Scholar]
- Gozgor, G.; Lau, C.; Zeng, Y.; Lin, Z. The effectiveness of the legal system and inbound tourism. Ann. Tour. Res. 2019, 76, 24–35. [Google Scholar] [CrossRef]
- Ghalia, T.; Fidrmuc, J.; Samargandi, N.; Sohag, K. Institutional quality, political risk, and tourism. Tour. Manag. Perspect. 2019, 32, 1–10. [Google Scholar] [CrossRef]
- Kaufmann, D.; Kraay, A.; Mastruzzi, M. The Worldwide Governance Indicators: Methodology and Analytical Issues. Available online: https://openknowledge.worldbank.org/handle/10986/3913 (accessed on 12 December 2020).
- Demir, E.; Gozgor, G. What about relative corruption? The impact of the relative corruption on the inbound tourism to Turkey. Int. J. Tour. Res. 2017, 19, 358–366. [Google Scholar]
- Saha, S.; Su, J.J.; Campbell, N. Does political and economic freedom matter for inbound tourism? a cross-national panel data estimation. J. Travel Res. 2016, 56, 221–234. [Google Scholar] [CrossRef] [Green Version]
- Chung, M.; Herzberger, A.; Frank, K.; Liu, J. International tourism dynamics in a globalized world: A social network analysis approach. J. Travel Res. 2020, 59, 387–403. [Google Scholar] [CrossRef]
- Adeola, O.; Boso, N.; Evans, O. Drivers of international tourism demand in Africa. Bus. Econ. 2018, 53, 25–36. [Google Scholar] [CrossRef]
- Khan, M.H. Governance, Economic Growth, and Development Since the 1960s; DESA Working Paper; The United Nations: New York, NY, USA, 2007. [Google Scholar]
- World Tourism Organization. 2019. Available online: https://www.e-unwto.org/doi/pdf/10.18111/9789284421152 (accessed on 22 January 2021).
- Gozgor, G.; Ender, D.; Bilgin, M.H. The effects of the military in politics on the inbound tourism: Evidence from Turkey. Asia Pac. J. Tour. Res. 2017, 22, 885–893. [Google Scholar] [CrossRef]
- Khan, A.; Bibi, S.; Lorenzo, A.; Lyu, J.; Babar, Z. Tourism and development in developing economies: A policy implication perspective. Sustainability 2020, 12, 1618. [Google Scholar] [CrossRef] [Green Version]
- Wu, D.; Song, H.; Shen, S. New developments in tourism and hotel demand modeling and forecasting. Int. J. Contemp. Hosp. Manag. 2017, 29, 507–529. [Google Scholar] [CrossRef]
- Naudé, W.A.; Saayman, A. Determinants of tourist arrivals in Africa: A panel data regression analysis. Tour. Econ. 2005, 11, 365–391. [Google Scholar] [CrossRef] [Green Version]
- Onafowora, O.A.; Oluwole, O. Modelling international tourism demand for the Caribbean. Tour. Econ. 2012, 18, 159–180. [Google Scholar] [CrossRef]
- Ghaderi, Z.; Saboori, B.; Khoshkam, M. Does security matter in tourism demand? Curr. Issues. Tour. 2017, 20, 552–565. [Google Scholar] [CrossRef]
- Balli, F.; Hatice, O.B.; Louis, R.J. The impacts of immigrants and institutions on bilateral tourism flows. Tour. Manag. 2016, 52, 221–229. [Google Scholar] [CrossRef]
- Canale, R.R.; Simone, E.D.; Maio, A.D.; Parenti, B. UNESCO world heritage sites and tourism attractiveness. Land Use Policy 2019, 85, 114–120. [Google Scholar] [CrossRef]
- Menyari, Y.E. Effect of tourism FDI and international tourism to the economic growth in Morocco: Evidence from ARDL bound testing approach. J. Poli. Res. Tour. Leis. Eve. 2020, 1–21. [Google Scholar] [CrossRef]
- Acemoglu, D.; Johnson, S.; Robinson, J.A. Reversal of fortune: Geography and institutions in the making of the modern world income distribution. Q. J. Econ. 2002, 118, 1213–1294. [Google Scholar] [CrossRef] [Green Version]
- Hall, R.E.; Jones, C.I. Why do some countries produce so much more output per worker than others? Q. J. Econ. 1999, 114, 83–116. [Google Scholar] [CrossRef]
- Saha, S.; Yap, G. Corruption and tourism: An empirical investigation in a nonlinear framework. Int. J. Tour. Res 2015, 17, 272–281. [Google Scholar] [CrossRef]
- Das, J.; DiRienzo, C. Global tourism competitiveness and freedom of the press: A nonlinear relationship. J. Travel Res. 2010, 47, 470–479. [Google Scholar] [CrossRef]
- Lv, Z.; Xu, T. A panel data quantile regression analysis of the impact of corruption on tourism. Curr. Issues. Tour. 2016, 20, 603–616. [Google Scholar] [CrossRef]
- Kim, Y.R.; Saha, S.; Vertinsky, I.; Park, C. The impact of national institutional quality on international tourism inflows: A cross-country evidence. Tour. Anal. 2018, 23, 533–551. [Google Scholar] [CrossRef]
- Worldwide Governance Indicators. 2021. Available online: https://info.worldbank.org/governance/wgi/#home (accessed on 2 March 2021).
- Sabir, S.; Rafique, A.; Abbas, K. Institutions and fdi: Evidence from developed and developing countries. Financ. Innov. 2019, 5, 1–20. [Google Scholar] [CrossRef] [Green Version]
- Saha, S.; Yap, G. The moderation effects of political instability and terrorism on tourism development: A cross-country panel analysis. J. Travel Res. 2013, 53, 509–521. [Google Scholar] [CrossRef]
- Ryan, C. Crime, violence, terrorism, and tourism: An accidental or intrinsic relationship? Tour. Manag. 1993, 14, 173–183. [Google Scholar] [CrossRef]
- World Bank-Taking Stock: Recent Economic Developments of Vietnam—Special Focus: Vietnam’s Tourism Developments-Stepping Back from the Tipping Point-Vietnam’s Tourism Trends, Challenges, and Policy Priorities. Available online: https://documents.worldbank.org/en/publication/documents-reports/documentdetail/821801561652657954/taking-stock-recent-economic-developments-of-vietnam-special-focus-vietnams-tourism-developments-stepping-back-from-the-tipping-point-vietnams-tourism-trends-challenges-and-policy-priorities (accessed on 20 March 2021).
- Haley, U.C.; Haley, G.T. When the tourists flew in: Strategic implications of foreign direct investment in Vietnam’s tourism tndustry. Manag. Decis. 1997, 35, 595–604. [Google Scholar] [CrossRef] [Green Version]
- Koh, S.; Kwok, A. ASEAN beyond talk shop: A rejoinder to regional tourism. Curr. Issues. Tour. 2017, 21, 1–6. [Google Scholar] [CrossRef]
Figure 1.
Annual Growth Rate of Inbound Tourists and Tourism Receipts in the ASEAN Member States (2007–2017). Source: Author’s calculation using World Development Indicators (2021).
Figure 1.
Annual Growth Rate of Inbound Tourists and Tourism Receipts in the ASEAN Member States (2007–2017). Source: Author’s calculation using World Development Indicators (2021).

Figure 2.
Inbound tourists and institution quality in the ASEAN member states (2007–2017). Source: Author’s calculation using World Governance Indicators and World Development Indicators (2021). Note: The vertical axis’s left-hand side is the composite institution quality and sub-components of institution quality score (−2.5 and +2.5). The right-hand side of the vertical axis is the total number of inbound tourists in ASEAN member states (million people).


Table 1.
Correlation matrix of inbound tourists in the ASEAN member states (2007–2017).
| Variables | (1) | (2) | (3) | (4) | (5) | (6) | (7) | (8) | (9) | (10) |
|---|---|---|---|---|---|---|---|---|---|---|
| (1) Cambodia | 1.000 | |||||||||
| (2) Brunei | −0.856 *** | 1.000 | ||||||||
| (3) Indonesia | 0.318 | −0.297 | 1.000 | |||||||
| (4) Lao PDR | 0.920 *** | −0.752 *** | 0.125 | 1.000 | ||||||
| (5) Malaysia | −0.926 *** | 0.755 *** | −0.488 | −0.799 *** | 1.000 | |||||
| (6) Myanmar | 0.809 *** | −0.751 *** | 0.300 | 0.852 *** | −0.770 *** | 1.000 | ||||
| (7) Philippine | 0.456 | −0.359 | 0.644 ** | 0.274 | −0.729 ** | 0.387 | 1.000 | |||
| (8) Singapore | −0.576 * | 0.667 ** | −0.681 ** | −0.473 | 0.593 * | −0.745 *** | −0.450 | 1.000 | ||
| (9) Thailand | 0.883 *** | −0.746 *** | 0.383 | 0.742 *** | −0.967 *** | 0.723 ** | 0.696 ** | −0.577 * | 1.000 | |
| (10) Vietnam | 0.745 *** | −0.559 * | 0.642 ** | 0.516 * | −0.883 *** | 0.452 | 0.830 *** | −0.416 | 0.804 *** | 1.000 |
Note: ***, **, * indicate a significance level of 1%, 5%, and 10%, respectively. Source: Author’s calculation using World Development Indicators (2021).
Table 2.
Description of variables.
| Code | Variables | Definition | Sources |
|---|---|---|---|
| ITA | Inbound tourists in individual ASEAN member states | Total number of inbound tourists in individual ASEAN member states | WDI |
| TRC | Tourism Receipts | Total amount of tourism receipts in individual ASEAN member states | WDI |
| TED | Tourism endowment index | The total number of cultural and natural world heritage sites (CNWHS), intangible cultural world heritage (ICWH), memories of world heritage (MWH), and tentatively-inscribed state property heritage sites (TWHS) | UNESCO |
| QIS | Institution quality | The institution quality contains six sub-components (control of corruption (COC), rule of law (RL), government effectiveness (GEF), regulatory quality (RQ), political stability (PS), voice and accountability (VA)). The QIS value and its sub-components have a value range from −2.5 (weak) to 2.5 (strong). The QIS is computed by using principal component analysis (CPA). | WGI |
| TP | Tourism price | Tourism price in individual ASEAN member states, which is measured by using consumer price index (CPI) of individual ASEAN member states divided by average CPI of ASEAN member states | WDI |
| ER | Exchange rate | The exchange rate in individual ASEAN member states, which is the nominal exchange rate of individual ASEAN member states’ currency per USD | WDI |
| Crime | Crime rate | Intentional homicide per 100,000 people | WDI |
| Rooms | Rooms | The total number of hotel rooms | WDI |
| GDPPC_CH | GDP per capita of China | The GDP per capita of China (international dollars at a constant price in 2011) is calculated using purchasing power parity (PPP) | WDI |
| FDIs | FDI in stock | The foreign direct investment in a stock at current prices in US$ million | UNCTADSTAT |
| AEC | ASEAN economic community | Dummy variable of ASEAN economic community: AEC =1 from 2015 to 2017, otherwise AEC = 0 | |
| SVS | Single-entry visa scheme | Dummy variable of the single-entry visa scheme (Cambodia, Lao PDR, Myanmar, Thailand, and Vietnam): SVS = 1 from 2012 to 2017, otherwise SVS = 0 | |
| GFC | Global financial crisis | Dummy variable of the global financial crisis: GFC = 1 from 2008 to 2009, otherwise GFC = 0 |
Table 3.
Descriptive Statistics.
| Variable | n | Mean | Std. Dev. | Min | Max |
|---|---|---|---|---|---|
| Ln ITA | 110 | 15.303 | 1.385 | 11.964 | 17.388 |
| TED | 110 | 0.000 | 1.000 | −1.363 | 2.164 |
| QIS | 110 | 0.000 | 1.000 | −1.294 | 2.274 |
| COC | 110 | −0.261 | 0.992 | −1.673 | 2.248 |
| GEF | 110 | 0.130 | 1.016 | −1.618 | 2.437 |
| PS | 110 | −0.152 | 0.905 | −1.778 | 1.615 |
| RQ | 110 | −0.026 | 1.004 | −2.268 | 2.260 |
| RL | 110 | −0.196 | 0.875 | −1.548 | 1.825 |
| VA | 110 | −0.769 | 0.660 | −2.214 | 0.185 |
| Ln TP | 110 | −0.003 | 0.083 | −0.246 | 0.213 |
| Ln ER | 110 | 4.642 | 3.534 | 0.223 | 9.564 |
| AEC | 110 | 0.273 | 0.447 | 0.000 | 1.000 |
| GFC | 110 | 0.182 | 0.387 | 0.000 | 1.000 |
| SVS | 110 | 0.545 | 0.500 | 0.000 | 1.000 |
| Crime | 110 | 2.160 | 2.740 | −1.270 | 11.000 |
| Ln GDPPC_CH | 110 | 8.556 | 0.237 | 8.155 | 8.897 |
| Ln FDIs | 110 | 10.619 | 1.735 | 7.083 | 14.147 |
| Ln Rooms | 110 | 8.547 | 3.682 | 0.156 | 13.519 |
ITA: inbound tourists in individual ASEAN member states; TED: tourism endowment index; QIS: institution quality; COC: control of corruption; GEF: government effectiveness; RQ: regulatory quality; RL: rule of law; VA: voice and accountability; TP: tourism price; ER: exchange rate; AEC: ASEAN Economic Community; SVS: single-entry visa scheme; GFC: global financial crisis; GDPPC_CH: GDP per capita in China; FDIs: foreign direct investments in stock; Crime: crime rate; Rooms: number of hotel rooms. Source: Author’s calculation.
Table 4.
Correlation matrix analysis of all study variables.
| Variables | (1) | (2) | (3) | (4) | (5) | (6) | (7) | ||
|---|---|---|---|---|---|---|---|---|---|
| (1) TED | 1.000 | ||||||||
| (2) QIS | −0.606 *** | 1.000 | |||||||
| (3) COC | −0.442 *** | 0.887 *** | 1.000 | ||||||
| (4) GEF | −0.335 *** | 0.848 *** | 0.947 *** | 1.000 | |||||
| (5) PS | −0.584 *** | 0.930 *** | 0.697 *** | 0.637 *** | 1.000 | ||||
| (6) RQ | −0.337 *** | 0.813 *** | 0.926 *** | 0.959 *** | 0.626 *** | 1.000 | |||
| (7) RL | −0.396 *** | 0.888 *** | 0.973 *** | 0.982 *** | 0.687 *** | 0.953 *** | 1.000 | ||
| (8) VA | 0.289 *** | 0.152 | 0.507 *** | 0.579 *** | −0.028 | 0.652 *** | 0.525 *** | ||
| (9) LnTP | 0.338 *** | −0.139 | −0.145 | −0.174 * | −0.091 | −0.203 ** | −0.158 * | ||
| (10) LnER | 0.307 *** | −0.247 *** | −0.315 *** | −0.256 *** | −0.055 | −0.230 ** | −0.310 *** | ||
| (11) AEC | 0.086 | 0.089 | 0.054 | 0.063 | 0.108 | 0.077 | 0.075 | ||
| (12) SVS | 0.104 | 0.095 | 0.085 | 0.054 | 0.133 | 0.106 | 0.084 | ||
| (13) GFC | −0.058 | −0.051 | −0.047 | −0.033 | −0.074 | −0.062 | −0.050 | ||
| (14) Crime | 0.385 *** | −0.451 *** | −0.172 * | −0.063 | −0.625 *** | −0.042 | −0.139 | ||
| (15) Ln GDPPC_CH | 0.118 | 0.098 | 0.083 | 0.059 | 0.135 | 0.106 | 0.093 | ||
| (16) Ln FDIs | 0.306 *** | 0.284 *** | 0.551 *** | 0.582 *** | 0.053 | 0.531 *** | 0.563 *** | ||
| (17) Ln Rooms | 0.615 *** | −0.512 *** | −0.603 *** | −0.483 *** | −0.404 *** | −0.431 *** | −0.514 *** | ||
| Variables | (9) | (10) | (11) | (12) | (13) | (14) | (15) | (16 | (17) |
| (9) LnTP | 1.000 | ||||||||
| (10) LnER | 0.244 ** | 1.000 | |||||||
| (11) AEC | −0.026 | −0.067 | 1.000 | ||||||
| (12) SVS | −0.021 | −0.089 | 0.559 *** | 1.000 | |||||
| (13) GFC | 0.016 | 0.041 | −0.289 *** | −0.516 *** | 1.000 | ||||
| (14) Crime | −0.069 | −0.173 * | −0.015 | −0.004 | 0.003 | 1.000 | |||
| (15) Ln GDPPC_CH | −0.021 | −0.070 | 0.731 *** | 0.870 *** | −0.543 *** | −0.011 | 1.000 | ||
| (16) Ln FDIs | 0.088 | −0.120 | 0.162 * | 0.213 ** | −0.148 | 0.145 | 0.241 ** | 1.000 | |
| (17) Ln Rooms | 0.173 * | 0.048 | 0.064 | 0.065 | −0.033 | 0.065 | 0.075 | −0.125 | 1.000 |
Note: ***, **, * indicate a significance level at 1%, 5%, and 10%, respectively. TED: tourism endowment index; QIS: institution quality; COC: control of corruption; GEF: government effectiveness; RQ: regulatory quality; RL: rule of law; VA: voice and accountability; TP: tourism price; ER: exchange rate; AEC: ASEAN Economic Community; SVS: single-entry visa scheme; GFC: global financial crisis; GDPPC_CH: GDP per capita in China; FDIs: foreign direct investments in stock; Crime: crime rate; Rooms: number of hotel rooms. Source: Author’s calculation.
Table 5.
Estimated results from the fixed effect model, using inbound tourists in individual the ASEAN member states as the dependent variable.
Table 5.
Estimated results from the fixed effect model, using inbound tourists in individual the ASEAN member states as the dependent variable.
| Variables | Column 1 | Column 2 | Column 3 | Column 4 |
|---|---|---|---|---|
| TED | 0.389 *** (0.121) | 0.399 *** (0.118) | 0.270 ** (0.121) | 0.400 *** (0.119) |
| QIS | 0.261 * (0.148) | 0.248 * (0.146) | 0.337 ** (0.135) | 0.256 * (0.148) |
| Ln TP | 0.756 *** (0.266) | 0.729 *** (0.263) | 1.014 *** (0.258) | 0.922 *** (0.265) |
| Ln ER | 0.038 *** (0.014) | 0.021 (0.013) | 0.023 * (0.013) | 0.033 ** (0.014) |
| SVS | 0.293 *** (0.054) | 0.201 *** (0.064) | 0.291 *** (0.054) | |
| Crime | −0.077 ** (0.032) | −0.0544 * (0.031) | −0.045 * (0.030) | −0.057 * (0.031) |
| Ln Rooms | 0.288 *** (0.075) | |||
| Ln FDIs | 0.300 *** (0.071) | |||
| Ln GDPPC_CH | 0.993 *** (0.109) | |||
| AEC | 0.184 *** (0.050) | |||
| GFC | −0.113 ** (0.051) | |||
| Constant | 12.67 *** (0.638) | 12.02 *** (0.736) | 6.802 *** (0.945) | 15.09 *** (0.094) |
| Observations | 110 | 110 | 110 | 110 |
| R-squared | 0.783 | 0.789 | 0.800 | 0.790 |
| # countries | 10 | 10 | 10 | 10 |
TED: tourism endowment index; QIS: institution quality; TP: tourism price; ER: exchange rate; SVS: single-entry visa scheme; GDPPC_CH: GDP per capita of China; AEC: ASEAN economic community; GFC: global financial crisis; FDIs: foreign direct investment in stock; crime: crime rate; rooms: number of hotel rooms. Note: ***, **, * indicate a significance level at 1%, 5%, and 10%, respectively. The value in the parentheses is the Standard errors. Source: Author’s calculation.
Table 6.
Estimated results from the fixed effect model, using inbound tourists in individual the ASEAN member states as the dependent variable.
Table 6.
Estimated results from the fixed effect model, using inbound tourists in individual the ASEAN member states as the dependent variable.
| Variables | Column 1 | Column 2 | Column 3 | Column 4 | Column 5 | Column 6 |
|---|---|---|---|---|---|---|
| TED | 0.174 * (0.105) | 0.311 *** (0.110) | 0.119 * (0.100) | 0.141 * (0.102) | 0.270 ** (0.110) | 0.205 * (0.112) |
| Ln TP | 0.607 *** (0.226) | 0.630 ** (0.249) | 0.573 *** (0.197) | 0.566 ** (0.219) | 0.597 ** (0.249) | 0.689 *** (0.239) |
| Ln ER | 0.040 *** (0.011) | 0.026 ** (0.013) | 0.027 *** (0.010) | 0.044 *** (0.011) | 0.033 *** (0.012) | 0.041 *** (0.012) |
| SVS | 0.141 ** (0.054) | 0.174 *** (0.058) | 0.088 * (0.048) | 0.137 *** (0.052) | 0.160 *** (0.058) | 0.165 *** (0.057) |
| AEC | 0.136 *** (0.045) | 0.078 (0.051) | 0.139 *** (0.039) | 0.114 ** (0.043) | 0.098 ** (0.049) | 0.151 *** (0.049) |
| GFC | −0.062 (0.045) | −0.070 (0.049) | −0.057 (0.040) | −0.057 (0.044) | −0.064 (0.049) | −0.056 (0.048) |
| Ln Rooms | 0.095 (0.071) | 0.164 ** (0.075) | 0.075 (0.061) | 0.128 * (0.067) | 0.132 * (0.075) | 0.128 * (0.074) |
| Ln FDIs | 0.215 *** (0.066) | 0.167 ** (0.072) | 0.266 *** (0.058) | 0.202 *** (0.064) | 0.182 ** (0.071) | 0.208 *** (0.070) |
| Crime | −0.102 *** (0.027) | −0.064 ** (0.028) | −0.099 *** (0.023) | −0.089 *** (0.025) | −0.069 ** (0.028) | −0.112 *** (0.030) |
| COC | 0.521 *** (0.104) | |||||
| GEF | 0.431 *** (0.152) | |||||
| PS | 0.204 *** (0.026) | |||||
| RQ | 0.505 *** (0.087) | |||||
| RL | 0.481 *** (0.156) | |||||
| VA | 0.335 *** (0.097) | |||||
| Constant | 12.28 *** (0.756) | 12.00 *** (0.818) | 11.17 *** (0.653) | 11.96 *** (0.722) | 12.23 *** (0.825) | 12.19 *** (0.809) |
| Observations | 110 | 110 | 110 | 110 | 110 | 110 |
| R-squared | 0.857 | 0.832 | 0.891 | 0.867 | 0.835 | 0.839 |
| # countries | 10 | 10 | 10 | 10 | 10 | 10 |
TED: tourism endowment index; QIS: institution quality; COC: control of corruption; GEF: government effectiveness; RQ: regulatory quality; RL: rule of law; VA: voice and accountability; TP: tourism price; ER: exchange rate; AEC: ASEAN Economic Community; SVS: single-entry visa scheme; GFC: global financial crisis; GDPPC_CH: GDP per capita in China; FDIs: foreign direct investments in stock; Crime: crime rate; Rooms: number of hotel rooms. Note: ***, **, * indicate a significance level at 1%, 5%, and 10%, respectively. The value in the parentheses is the Standard errors. Source: Author’s calculation.
Table 7.
Estimated results using the fixed effect model, using tourism receipts in individual ASEAN member states a dependent variable.
Table 7.
Estimated results using the fixed effect model, using tourism receipts in individual ASEAN member states a dependent variable.
| Variables | Column 1 | Column 2 | Column 3 | Column 4 |
|---|---|---|---|---|
| TED | 0.634 ** (0.262) | 0.685 ** (0.264) | 0.567 ** (0.275) | 0.718 *** (0.265) |
| QIS | 0.562 * (0.322) | 0.617 * (0.326) | 0.698 ** (0.307) | 0.702 ** (0.330) |
| Ln TP | 1.865 *** (0.578) | 1.855 *** (0.586) | 2.133 *** (0.587) | 2.012 *** (0.591) |
| Ln ER | 0.028 (0.030) | 0.006 (0.030) | 0.009 (0.029) | 0.014 (0.030) |
| SVS | 0.207 * (0.117) | 0.142 (0.141) | 0.217 * (0.121) | |
| Crime | −0.071 (0.070) | −0.040 (0.070) | −0.034 (0.068) | −0.043 (0.070) |
| Ln Rooms | 0.399 ** (0.162) | |||
| Ln FDIs | 0.303 * (0.158) | |||
| Ln GDPPC_CH | 0.880 *** (0.248) | |||
| AEC | 0.105 (0.112) | |||
| GFC | −0.196 * (0.114) | |||
| Constant | 18.45 *** (1.384) | 18.72 *** (1.384) | 14.46 *** (2.153) | 21.87 *** (0.209) |
| Observations | 110 | 110 | 110 | 110 |
| R-squared | 0.571 | 0.560 | 0.564 | 0.561 |
| # countries | 10 | 10 | 10 | 10 |
TED: tourism endowment index; QIS: institution quality; TP: tourism price; ER: exchange rate; SVS: single-entry visa scheme; GDPPC_CH: GDP per capita of China; AEC: ASEAN economic community; GFC: global financial crisis; FDIs: foreign direct investment in stock; Crime: crime rate; Rooms: number of hotel rooms. Note: ***, **, * indicate a significance level at 1%, 5%, and 10%, respectively. The value in the parentheses is the Standard errors. Source: Author’s calculation.
Table 8.
Estimated results using fixed effect model, using tourism receipts in individual the ASEAN member states as the dependent variable.
Table 8.
Estimated results using fixed effect model, using tourism receipts in individual the ASEAN member states as the dependent variable.
| Variables | Column 1 | Column 2 | Column 3 | Column 4 | Column 5 | Column 6 |
|---|---|---|---|---|---|---|
| TED | 0.170 (0.224) | 0.588 ** (0.262) | 0.0307 (0.176) | 0.115(0.223) | 0.480 * (0.256) | 0.234 (0.247) |
| Ln TP | 1.281 *** (0.482) | 1.567 ** (0.596) | 1.207 *** (0.376) | 1.217 ** (0.477) | 1.356 ** (0.580) | 1.494 *** (0.525) |
| Ln ER | 0.044 * (0.024) | 0.016 (0.031) | 0.008 (0.019) | 0.055 ** (0.024) | 0.027 (0.028) | 0.048 * (0.026) |
| SVS | −0.007 (0.115) | 0.102 (0.138) | −0.152 (0.092) | −0.007 (0.113) | 0.061 (0.134) | 0.062 (0.125) |
| AEC | 0.082 (0.096) | −0.045 (0.121) | 0.087 (0.075) | 0.016 (0.095) | −0.025 (0.114) | 0.136 (0.107) |
| GFC | −0.132 (0.097) | −0.161 (0.118) | −0.120 (0.076) | −0.123 (0.096) | −0.144 (0.114) | −0.110 (0.106) |
| Ln Rooms | 0.162 (0.151) | 0.384 ** (0.178) | 0.115 (0.118) | 0.274 * (0.146) | 0.296 * (0.176) | 0.248 (0.163) |
| Ln FDIs | 0.243 * (0.141) | 0.128 (0.172) | 0.387 *** (0.112) | 0.203 (0.139) | 0.149 (0.165) | 0.226 (0.154) |
| Crime | −0.177 *** (0.060) | −0.073 (0.068) | −0.165 *** (0.044) | −0.133 ** (0.055) | −0.080 (0.066) | −0.218 *** (0.066) |
| COC | 1.556 *** (0.221) | |||||
| GEF | 0.763 ** (0.364) | |||||
| PS | 0.585 *** (0.050) | |||||
| RQ | 1.384 *** (0.190) | |||||
| RL | 1.201 *** (0.364) | |||||
| VA | 1.092 *** (0.213) | |||||
| Constant | 18.57 *** (1.612) | 17.27 *** (1.956) | 15.30 *** (1.250) | 17.55 *** (1.574) | 18.12 *** (1.923) | 18.47 *** (1.777) |
| Observations | 110 | 110 | 110 | 110 | 110 | 110 |
| R-squared | 0.727 | 0.597 | 0.832 | 0.734 | 0.623 | 0.673 |
| # countries | 10 | 10 | 10 | 10 | 10 | 10 |
TED: tourism endowment index; QIS: institution quality; COC: control of corruption; GEF: government effectiveness; RQ: regulatory quality; RL: rule of law; VA: voice and accountability; TP: tourism price; ER: exchange rate; AEC: ASEAN Economic Community; SVS: single-entry visa scheme; GFC: global financial crisis; GDPPC_CH: GDP per capita in China; FDIs: foreign direct investments in stock; Crime: crime rate; Rooms: number of hotel rooms. Note: ***, **, * indicate a significance level at 1%, 5%, and 10%, respectively. The value in the parentheses is the Standard errors. Source: Author’s calculation.
Publisher’s Note: MDPI stays neutral with regard to jurisdictional claims in published maps and institutional affiliations. |
© 2021 by the author. Licensee MDPI, Basel, Switzerland. This article is an open access article distributed under the terms and conditions of the Creative Commons Attribution (CC BY) license (https://creativecommons.org/licenses/by/4.0/).
Share and Cite
MDPI and ACS Style
Hor, C. Tourism Endowments, Institution Quality, and Inbound Tourists: A Panel Analysis of ASEAN. Tour. Hosp. 2021, 2, 218-232. https://0-doi-org.brum.beds.ac.uk/10.3390/tourhosp2020013
AMA Style
Hor C. Tourism Endowments, Institution Quality, and Inbound Tourists: A Panel Analysis of ASEAN. Tourism and Hospitality. 2021; 2(2):218-232. https://0-doi-org.brum.beds.ac.uk/10.3390/tourhosp2020013
Chicago/Turabian StyleHor, Chantha. 2021. "Tourism Endowments, Institution Quality, and Inbound Tourists: A Panel Analysis of ASEAN" Tourism and Hospitality 2, no. 2: 218-232. https://0-doi-org.brum.beds.ac.uk/10.3390/tourhosp2020013