Article

Scale Construction and Validation of Uses and Gratifications Motivations for Smartphone Use by Tourists: A Multilevel Approach

1
School of Hospitality and Tourism Management, University of South Florida, Sarasota, FL 34243, USA
2
Department of Tourism, Hospitality and Event Management, University of Florida, Gainesville, FL 32611, USA
*
Author to whom correspondence should be addressed.
Submission received: 13 December 2021 / Revised: 7 January 2022 / Accepted: 14 January 2022 / Published: 20 January 2022

Abstract

:
This study introduces and applies the uses and gratifications theory to travel and tourism, resulting in a classification of U & G motivations (extant items) for this field. Uses and gratifications motivations are important for understanding e-tourist satisfaction. However, a measurement model for examining them has not been developed in the field of travel and tourism. To address this gap, this study develops valid and reliable scales for uses and gratifications motivations for smartphone use by tourists. Multilevel linear modeling (MLM) was used to avoid biases caused by common traits and features within a tourist group and to measure group effects. The scales conceptualized motivations for smartphone use by travelers, i.e., the U & G motivations, as a four-dimensional construct: social interaction, information, entertainment, and convenience. All scales demonstrate the appropriate psychometric properties for evaluating U & G motivations. The scales developed here can serve as an effective tool for future empirical research to better understand the motivations for smartphone use by travelers and to identify the relationships among U & G motivations, attitude, and e-tourist satisfactions in travel and tourism.

1. Introduction

Smartphones allow travelers to reserve a hotel and manage the services they need. Moreover, making trip decisions on-site has become both plausible and flexible [1,2], highlighting how smartphones have affected the travel experience. Their increasing use has substantially influenced tourist behavior and decision-making processes [3,4,5]. Despite the previous smartphone research in the context of travel and tourism, there is limited research based on a strong theoretical background that seeks to understand how tourists are motivated via smartphone use. This study introduces and applies the uses and gratifications theory to the travel and tourism system, and it proposes to develop a classification of U & G motivations (motivations for using smartphone by tourists) for this field. Ko et al. [6] suggested the classification of U & G motivations, and Luo [7], Ko et al. [6], and Logan [8] developed motivation items based on it for the communication field. However, this scale is not appropriate for testing the U & G motivations in the field of travel and tourism because it has been tested and proven in the communication and advertising area. Therefore, this study proposes to develop a classification of U & G motivations for use of a smartphone while traveling to enhance the understanding of e-tourists’ motivations, behaviors and e-tourist satisfactions.
Recently, Moon [9] highlighted U & G motivations to understand why tourists use their smartphones during the trips and emphasized the need for development of a U & G motivation scale specific to the context of travel and tourism. It is the goal of this study to develop a scale related to the needs of e-tourism communication and the tourism industry. Moreover, in the travel and tourism field, there has not been a scale assessment considering the group effects and the biases caused by the shared common traits and features within a tourist group. To address this need, this study employs a multilevel analysis (multilevel linear modeling), an effective tool for examining hierarchically structured data [10,11,12] such as that found in the travel and tourism research. Hierarchically structured data need to be analyzed utilizing multilevel analysis because the single level approach may create biased statistical results due to the shared common characteristics within groups [13,14,15].
This study develops a classification of U & G motivations in travel and tourism, then based on this classification, it develops scale items for the four motivations of the conceptual model and conducted multilevel CFA (Confirmatory Factor Analysis) analyses to develop a U & G motivations scale for the use of smartphones while traveling. It examines the validity and reliability of the scale through this process. Consequently, this work offers a theoretically and conceptually supported U & G motivations scale by comparing the classification of U & G motivations and the findings from the measurement model. The scale for uses and gratifications motivations developed in this study contributes to an increased understanding of e-tourist satisfaction and tourist behavior, extending the domain of uses and gratifications theory to experiential aspects of e-tourism. More specifically, this study analyzes the multiple dimensions of U & G motivations in the context of travel and tourism, providing tourism researchers with a rigorously validated scale for use in e-tourism communication and in tourism organizations and businesses.

2. Literature Review

2.1. Mobile Technology and Its Impact on Travel and Tourism

Mobile technologies change the way travelers decide on destinations and attractions, not only during the pre-trip stage but also during the on-site stage because of the ease with which travelers can receive travel-related information using mobile technologies [16,17]. Specifically, by using mobile technologies, travelers can arrange and modify their travel itineraries with attractions they plan to visit and can obtain travel tips from other tourists as well as update their trip agenda for their friends and families instantly [18].
Mobile technologies can help travelers modify their decision-making process depending on the circumstances, leading to behavioral changes [3]. The tourist decision-making process is stratified in nature, including several different kinds of decisions [19,20]. Specifically, destination-related decisions are the core while other decisions (i.e., local events and attractions) are considered secondary components in this hierarchy. A prior study has indicated that both individual and group travelers prefer making secondary decisions (i.e., attractions, restaurants, local events) on site due to their access to mobile technologies [21]. In addition, by using smartphones, tourists are able to obtain such knowledge regarding the destination they are visiting such as social customs and local culture [17,22], a finding that confirms tourists’ preference for making secondary decisions while they are at their destination.
By using smartphones, travelers can receive real-time information regardless of where they currently are [2]. Specifically, smartphones enable travelers to gain information and schedule services at tourism and hospitality businesses while they are visiting the destinations [1]. Through the advancement and use of these technologies, tourists can not only have a more enjoyable travel experience but also change their travel plans freely [23]. Smartphones can make reservations for travelers’ accommodations, keep track of their appointments and make their travel plans and decisions more viable and flexible [24]. As a result, smartphones substantially influence the overall tourist experience, especially the process of tourist decision-making and satisfaction [5,25].
As smartphones function as a handy communication channel in virtual travel societies, which generate and strengthen instant social interactions with other tourists as well as influence overall tourist experience [24,26], understanding their uses has become one of the important research streams in travel and tourism [4]. For example, Lee et al. [27] examined the concept of presence and its relationship with travel experience and tourist satisfaction on the use of smartphone apps in a heritage site in Korea. Their results indicated that social presence, the extent to which a tourist feels connected with other travelers in a virtual context, significantly affected the escape and entertainment aspect of the traveler experience. In addition, the researchers found that by using smartphone apps, the educational and entertainment aspect of the tourist experience influenced tourist satisfaction.
However, the scholars pointed out that research concerning the use of smartphones in the travel and tourism arena need further study, indicating that there is much more to examine on the influences of smartphones in tourism [5,27,28]. A proper theory to deeply understand the impact of smartphones in the travel and tourism is the uses and gratifications theory. There are some recent tourism research using uses and gratifications theory. Erawan [29] examined tourist behavior concerning changes in privacy issues and the use of information technology using uses and gratifications theory. Hur et al. [30] investigated the factors affecting social media continuance and information sharing with a lens of uses and gratifications theory in the travel and tourism. Gamage et al. [31] also investigated gratifications obtained by Chinese tourists while utilizing WeChat system in making hotel selection decisions based on the uses and gratifications theory. The reported studies above mainly examined different information technology. Yet, the uses of smartphones by tourists have not been explored using the uses and gratifications theory. To address this research need, this study applied the uses and gratifications theory to explore tourists’ motivations for utilizing smartphones.

2.2. Uses and Gratifications Theory and Its Applications to Travel and Tourism

The uses and gratifications (U & G) theory is useful for exploring social media as the fundamental reasons for their use involve an individual’s social and psychological needs as well as how mass media satisfy users’ desires and motives to communicate [32]. This theory argues that multiple media draw users’ attention, and what they choose gratifies their needs for social interaction, entertainment, convenience, and information [9,33]. This theory describes why and how individuals utilize media to satisfy their needs as well as the disparate patterns of media use and consumption [32,34]. The uses and gratifications theory has examined various types of social media and how they have been applied, including the Internet [6,7], user-generated media [35], online games [36], MP3 players [37], Facebook usage [38,39], Twitter [33,40], and smartphone advertising [8]. U & G is especially appropriate for smartphone research as smartphones provide the potential for interactivity and interpersonal communication [41], and this theory focuses on what people do with media, not what media do for people [42].
U & G assumes (1) that people actively participate in the media communication surroundings; in the travel and tourism setting, tourists actively use their smartphones to attain their desires (social interaction, entertainment, convenience, and information), gaining gratifications while they are on-site; (2) that media users are goal-directed, purposeful, and motivated because, in the traditional media context, people enjoy watching television or videos unconsciously and without thinking, and on the other hand, tourists (new media users) are purposive and motivated to use their smartphones for their needs and desire; (3) that audiences (travelers) tend to be interactive with their media, that is, the interactivity provided by smartphones blurs the boundary between sender and receiver, a phenomenon particularly applicable and crucial in tourism today; (4) that individuals take the initiative to choose a specific media that best suits them. Applied to the tourism areas, travelers recognize their needs (social interaction, entertainment, convenience and information) and select smartphones to satisfy them. This theory also assumes that individuals choose a specific medium as it is valuable and significant, that this particular medium satisfies their desires and needs, and that mass media do not influence those who do not utilize it [8,9,32,34].
Previous studies have discovered multiple dimensions explaining the reasons for media use, and this study employs the four constructs of information (convenience, social interaction, and entertainment) based on past advertising and journalism studies since those are most applicable to smartphone research in the context of tourism [6,7,8,43,44,45,46,47] (Figure 1).

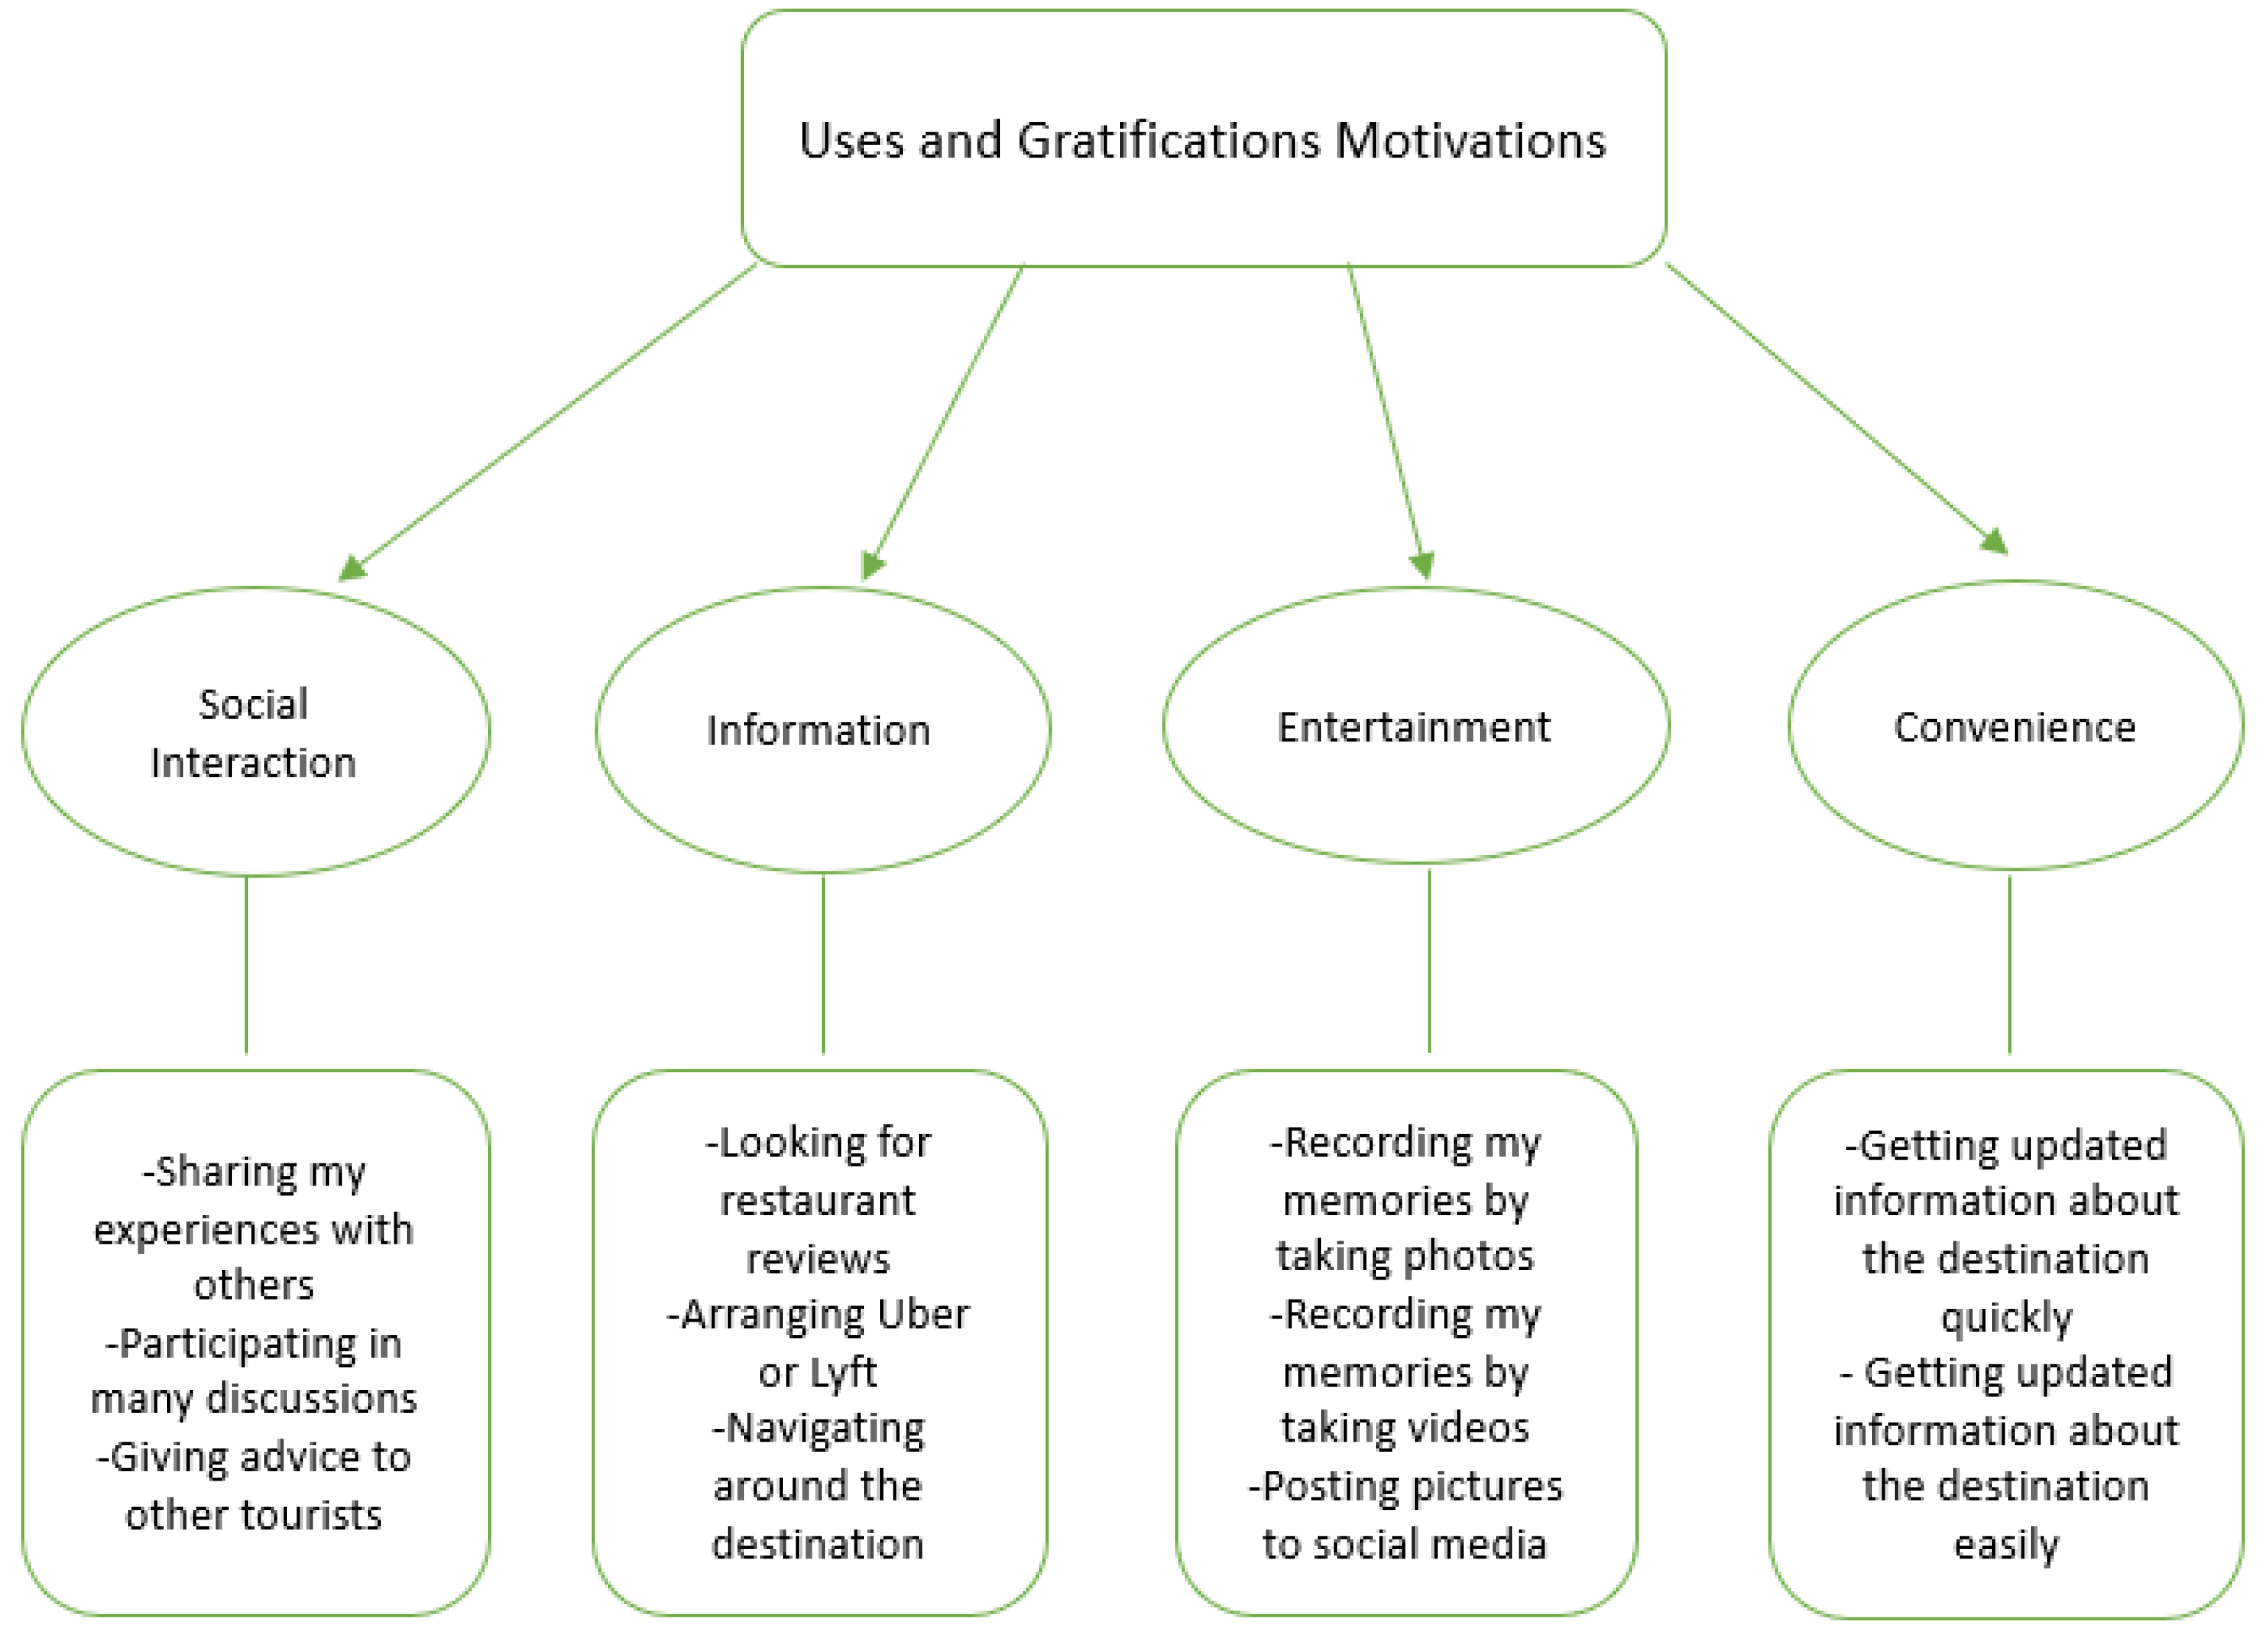
2.3. Four Constructs

2.3.1. Information

The information motivation in the U & G setting involves the search for and the process of consuming information, with previous literature in social media settings confirming this motivation [48,49]. Considering the nature of tourism, tourists at times use the Internet to search for information to aid them in making an informed decision [50]. According to Lamsfus et al. [3] and Tussyadiah [26], the increase in the use of social media and mobile technology has significantly affected how tourists seek information in the field of travel and tourism. While people are traveling, travelers use smartphones to look for information regarding tourist attractions, restaurants, hotel lodgings and transportation [51,52]. In most situations, travelers can access the Internet using their smartphones while they are searching for trip-related information [20].

2.3.2. Convenience

The convenience motivation in U & G has been considered one of the apparent advantages of mobile communication, as mobile technology is portable and immediately accessible [9,53]. Mobile technology such as smartphones allows media users to be informed regardless of time and space, providing media users with anytime-anywhere advantages. The traits and features of mobile services offering these advantages are directly concerned with information access [5]. This mobility allows tourists to gain information quickly and easily, meaning they can obtain easy access to information via mobile convenience when they are traveling. Mobile technologies function as an information platform, making planning a trip more flexible as tourists travel from their homes to tourist destinations [4,45]. Specifically, by using smartphones, tourists are able to gain more destination-related information, thus facilitating their ability to adjust their travel itineraries quickly and optimize their tourist experiences as some of this information is not found in traditional travel guides and on travel websites [52]. This flexibility has added a new dimension to the context of travel by allowing for changing plans based on up-to-date information rather than static information needed for comprehensive trip planning [5,50].

2.3.3. Social Interaction

Social interaction from the perspective of U & G includes the motive and the efforts to build and maintain social relationships, thus communicating with others. When people communicate and interact with others, they feel a sense of belonging. According to Green [44] and Dias [54], tourists may interact and communicate with other people, and then based on this information, they decide on the desired activities and sites they want to include in their trip. In most cases, tourists consider smartphones a helpful communication tool because they are able to stay connected with other people through texting, calling, emailing, and using social networks. For example, travelers can handle work-related requests even when they are traveling [51,55]. Moreover, tourists can also stay connected with their family or friends while traveling; since family members worry when others are on a trip and cannot be reached, posting trip experiences on social network websites (i.e., Facebook) not only keeps the family updated on their family members’ safety but also lets travelers share their trip details with the family [26].

2.3.4. Entertainment

The entertainment motivation in the context of U & G represents how media help people escape the boredom or the routine of their daily lives, pass time, and be entertained. Entertainment includes listening to music and sharing photos, videos, news, and online postings [56]. Using smartphones can add to tourists’ enjoyment, supporting their travel motivation of escaping from their daily lives [5,45]. For instance, Disneyworld tourists can share their memories and nostalgic feelings about the theme park with others in an online community. In this case, the web community functions not only as a discussion board for information exchanged among tourists but also as a platform for gaining an integrative and enjoyable experience of a trip [25,26]. Moreover, travelers can use smartphones to listen to music, play online games, and read e-magazines and Internet news when they do not have any specific plans or if they are waiting for a particular event [57].

3. Methods

3.1. Pilot Studies

To select a comprehensive and representative set of smartphone use among tourists, the first pilot study was conducted using a sample of 57 undergraduate students (56% female, mean age = 20.4) enrolled in two different tourism courses at a large southern university in the United States. All students were given extra credit points as study participants. An initial version of the instrument was developed, with 27 questionnaire items being adapted from the literature review to elaborate on the U & G four motivations (motivations for using smartphone by tourists). The participants were asked to rate the use of their smartphone during the trips on 5-point Likert scales (1 = Strongly Disagree, 5 = Strongly Agree). Skewness values were found to be between −2 and 2, which is statistically acceptable.
Correlations, means, and standard deviations were checked. Standard deviations for most items were around 1 or less, indicating a restricted range of scores, meaning that most respondents chose 4 (agree) or 5 (strongly agree) on the 5-point Likert scales. Standard deviations should be 1.5 for a 5-point Likert scales. Second, mean scores of most items were approximately 4 or more for the 5-point Likert scales, indicating a ceiling effect. These values indicate that many respondents selected 4 (agree) or 5 (strongly agree) on the Likert scales and answered in a very positive way. Simply put, the mean scores were too high. Therefore, the researcher decided to change to 7-point Likert scales and to make stronger statements for the measurement items. Additionally, the researcher updated the technology-related statements as this study explores a cutting-edge topic.
The second pilot study was conducted with a sample of 47 undergraduate students taking the same classes as in the first pilot study. Twenty-two items were revised and adopted from the first pilot study, with the participants being asked to rate uses of smartphones during trips on 7-point Likert scales. The researcher found one outlier, who was deleted, and the analyses were run again. The standard deviations for the scores of most of the items fell between 1.25 and 1.40, indicating an improved distribution of scores. Skewness was within ±1, indicating a reasonably normal distribution. The results showed that the information construct has two dimensions. Thus, the researcher selected only one dimension for the purpose of his study.
The third pilot study was conducted using a sample of 58 graduate students enrolled in a graduate research seminar at a large southern university in the United States. All students were voluntary participants. The instrument from the second pilot study was revised, with the number of questionnaire items being reduced from 22 to 20. The standard deviations of most items were around 1.5, an acceptable range. Moreover, the researcher updated the technology-related statements from the perspective of communication and information technology because this study explores a cutting-edge topic. The researcher also found that the information construct still had two dimensions.
Thus, a fourth pilot study only on the information construct was conducted using a sample of 48 undergraduate students enrolled in a spring semester class at a large southern university in the United States. Three items were deleted from the information construct because of low loadings, and two items were added to make this construct have one factor. Finally, the number of questionnaire items was reduced from 20 to 19.
Throughout the four pilot studies, an expert panel of researchers was asked to review and analyze each item and construct of the item pools to further contribute to content validity. This panel of experts comprised seven professors, three from tourism, one from leisure and recreation, one from communication, one from advertising, and one from statistics. After their review, seven items were reworded or modified, and three items were deleted because the meanings of the questions overlapped and contained ambiguous adjective and noun phrases. The resulting pool containing 19 items was retained and employed for the main study in which all U & G motivation scale items were measured on a 7-point Likert-type scale, ranging from 1 = strongly disagree to 7 = strongly agree. The model has been checked and tested for reliability and dimensionality, with the four pilot studies and expert reviews being employed to enhance instrument validity and offer more crucial information on the conceptual model. Throughout the pilot tests and expert review processes, the Statistical Package for the Social Science (SPSS 22.0) was utilized to analyze the data, including descriptive statistics, exploratory factor analysis (EFA), and reliability tests.
In summary, this study conducted four pilot tests and expert reviews. From the results of the previous pilot studies and expert panel reviews, this study found nineteen items for U & G motivations. All constructs showed acceptable reliability and validity. However, the sample size of previous pilot studies was small. Therefore, convergent validity and discriminant validity were reexamined with a large sample in the main study.

3.2. A Multilevel Approach

Confirmatory factory analysis (CFA) was conducted on four constructs employing EQS 6.3 to evaluate each measurement model in the main data analysis, and multilevel CFA was used to investigate the effects of the group. Since single-level CFA cannot explain group effects, multilevel CFA needs to be conducted to examine group effects. Since most tourists travel with family members or friends rather than alone, they share common traits or features with the members of their group or team. This can be seen as a hierarchical structure because each person is likely to be nested or dependent within the group.
This hierarchically structured data need to be analyzed utilizing multilevel linear modeling (MLM) because the single level approach may create biased statistical results due to the shared common traits and features within groups [13,14,15]. To avoid statistical biases and measure group effect, multilevel CFA is used to consider differences among tourist groups and differences among individual tourists. That is, there are two observed variables: group tourists (travel group) and individual tourists (individual observation) [15].
To analyze multilevel CFA, an intraclass correlation coefficient (ICC) needs to be investigated to verify if multilevel CFA is required. The ICC is the result when the between group variances are divided by the total variances (sum of the between group variances and the within group variances) [58,59] using the equation below:
I C C = σ B 2 σ B 2 + σ W 2
where:
  • σ B 2 = between group variances
  • σ w 2 = within group variances
Multilevel analysis is required if the ICC values are larger than 0.1. In addition, an ICC value of 0.05 is considered small; one of 0.10 is regarded as a medium value, and an ICC value of 0.20 is regarded as large [60,61].
The CFA for model estimation was conducted utilizing EQS 6.3 with robust maximum likelihood estimation. Absolute fit and comparative fit indices will be employed to assess goodness of fit. First, the chi-square ( x 2 ) statistic, which is evaluated to examine overall model fit for the absolute fit, is affected by sample size. It can be concluded that the observed and hypothesized model stay the same when the chi-square values accept the null hypothesis (p > 0.05). This research employed the root mean square error of approximation (RMSEA) and the standardized root mean squared residual (SRMR). Hu and Bentler [62] suggested that RMSEA values of less than 0.06 could be considered a good fit, while Browne and Cudeck [63] (1992) indicated that for a reasonable fit, the RMSEA value should be less than 0.08, and Hu and Bentler [62] suggested the good fit of an SRMR value is less than 0.08. Second, non-normed fit indices (NNFI) and a comparative fit index (CFI) were employed for the comparative fit indices in this study. According to Marsh and Hau [64], NNFI and CFI values larger than 0.9 indicate an acceptable model fit.
This research conducted reliability and validity tests for multilevel CFA, assessing convergent validity and discriminant validity. Convergent validity is defined as “the extent to which indicators of a specific construct converge or share a high proportion of variance in common” [65] (p. 771). This research used AVE values and each indicator’s coefficient on each construct to examine convergent validity. Discriminant validity is defined as “the extent to which a construct is truly distinct from other constructs” [65] (p. 771). AVEs of each construct and the squared correlations among each factor were used here to examine discriminant validity.

4. Results

4.1. Characteristics of the Sample Data and Data Screening

The research team collected 687 responses from individuals traveling alone and in groups from 24 locations in the United States for a response rate of 84.5%. As it is difficult for one individual to represent an entire group, the research team attempted to collect data from more than one person in a group. Of the 304 groups surveyed, 97 were represented by one member and 207 by more than one person in the travel party (group). Of 687 responses collected, 38 were not complete and, thus, were not used in the data analysis; neither were the seven responses determined to be extreme outliers based on the results of Mahalanobis distance analysis. The remaining 642 responses were examined to test the research models. The group size refers to the number of people (tourists) in the group when the researchers approached them at a specific location.

4.2. Population

Of the 642 respondents, 47.5% were male and 52.5% were female. The ages ranged from 18 to 20 (23.5%), 21 to 30 (23.0%), 31 to 40 (18.4%), 41 to 50 (17.8%), 51 to 60 (11.9%), 61 to 70 (4.05%), 71 to 80 (1.2%), and over 80 (0%). Based on the purpose of the trip, leisure and recreational travelers comprised 77.4%, business tourists 12.0%, and tourists with multiple purposes 9.9% as seen in Table 1.

4.3. Multilevel Analysis

To conduct multilevel CFA, model-based intraclass correlation (ICC) values are examined to identify significant nesting at the group level and to detect the interdependency of group responses [66,67]. Table 2, which lists the results for the model-based intraclass correlations, shows that the ICC values of most variables are larger than 0.1, indicating substantial group nesting [60]. Thus, the data in the model need to be analyzed at both the individual (Level 1) and group level (Level 2). The ICC value of ENT 2 is relatively low while the ICC values of SOI2, SOI3, and SOI4 are very high, meaning that the group marginally affected the individual responses to ENT 2, whereas the group substantially influenced the individual responses to SOI2, SOI3, and SOI4.
A multilevel CFA was conducted to check and verify model fit indices. The multilevel CFA model demonstrated acceptable and satisfactory model fit for the data: x2 (df) = 786.75 (390), RMSEA = 0.038, SRMR = 0.041, NNFI = 0.951, CFI = 0.953. Furthermore, convergent validity, discriminant validity and internal consistency of both Level 1 and Level 2 were evaluated. The factor loadings, the Cronbach’s α and composite reliability (Rho) and the AVEs of both Level 1 and Level 2 models are shown in Table 3.
This study tested the convergent validity, discriminant validity, and internal consistency at both Level 1 and Level 2, with the result indicating that all factor loadings are statistically significant as can be seen in Table 3, which displays the model’s factor loadings, α coefficients, Rho values, and average variances extracted (AVEs). Cronbach’s α values ranged from 0.831 for SOI to 0.901 for ENT at Level 1 and from 0.906 for ENT to 0.974 for CON at Level 2, indicating satisfactory internal consistency for all factors (α > 0.70) [65,68]. Moreover, the Rho coefficients remain the same or were similar to the Cronbach’s α. Cronbach’s alpha relies on the average loading between the latent construct and the items, assuming all load the same, unlike composite reliability (Rho), which does not assume loading equality [65]. The AVE values ranged from 0.555 for SOI to 0.650 for ENT at Level 1 and from 0.666 for ENT to 0.881 for CON at Level 2. All AVEs for factors at Level 1 and Level 2 were higher than 0.5, and most AVEs at both levels were higher than 0.630, indicating satisfactory convergent validity [65,68]. All values for Cronbach’s α and Composite Reliability (Rho) at Level 2 were higher than those at Level 1.
To assess convergent validity and discriminant validity, the AVEs for each factor were calculated at both the individual and the group level (Table 4 and Table 5). Comparing the diagonal elements in the Level 1 model with those in the Level 2 indicates that the variables in the Level 2 (the group level) were more correlated with one another than those in the Level 1 (individual level). Even though the variables at Level 1 exhibited good convergent validity, the variables at Level 2 exhibited better convergent validity (diagonal elements) (See Table 4 and Table 5). Table 4 and Table 5 show that the AVEs of all factors are larger than 0.5, indicating satisfactory convergent validity and that the correlations among factors were less than the square root of the AVEs in both the Level 1 and Level 2 models, indicating satisfactory discriminant validity.

5. Discussion

The purpose of this study was to develop a reliable and valid uses and gratifications (U & G) motivations scale in the context of travel and tourism. This study developed U & G motivations items based on a previous review of literature and subsequently conducted expert reviews, EFAs in four pilot studies and finally multilevel CFA in the main study. The initial four pilot studies were important because as Dillman et al. [69] maintained, a pilot study helps to test a “survey population in an attempt to identify problems with the questionnaire and related implementation procedures. The goal is to determine whether the proposed questionnaire and procedures are adequate for the large study” (p. 228).
As Hair et al. [65] and Mertler and Reinhart [70] pointed out, the primary goal of EFA is to identify dimensions of a construct (concept) and to reduce the data. Based on the results of the EFA from the pilot studies, the main study found four subfactors (U & G motivations) for the travel and tourism domain: information, convenience, social interaction, and entertainment. The first subfactor, the information construct, suggests that tourists use smartphones to find helpful information. The second, convenience, which comprises effort, time, and space, represents the capability of smartphones to enable tourists to find this information easily and quickly without the constraint of time or location. It focuses on the ease of the ability of smartphones to facilitate finding information. The third, social interaction, emphasizes tourists’ comfort level and feelings of connectedness during interpersonal communication. The fourth, the entertainment construct, refers to the enjoyment and relaxation smartphones affords to tourists.
After conducting EFAs, this study conducted multilevel CFA in the main study to specify models and to investigate the effects of the group. Since single-level CFA cannot explain group effects, multilevel CFA is required to examine group effects. Since most tourists travel with family members or friends rather than alone, they share common traits or features with the members of their group or team. These relationships can be seen as a hierarchical structure because each person is likely to be nested or dependent within the group. These hierarchically structured data need to be analyzed utilizing multilevel linear modeling (MLM) because the single level approach may create biased statistical results due to the shared common traits and features within groups [13,14,15]. To avoid statistical biases, multilevel CFA is used to consider differences both among tourist groups and among individual tourists. That is, there are two observed variables: group tourists (travel group) and individual tourists (individual observation). To determine if multilevel CFA is appropriate requires verification by determining the intraclass correlation coefficient (ICC), the result obtained by dividing the between group variances divided by the total variances (sum of the between group variances and the within group variances) [58,59]. The results of multilevel CFA found that the model fit was statistically acceptable and that all scales had satisfactory reliability, convergent validity, and discriminant validity, thus indicating that the final scale has the appropriate psychometric properties. First, a comprehensive review of the literature and expert reviews of scholars established the content validity of the scale. Second, reliability coefficients such as Cronbach’s α and Rho values indicated satisfactory internal consistency for all factors (α > 0.70). Third, AVEs for factors at Level 1 and Level 2 were higher than 0.5, indicating satisfactory convergent validity. Fourth, the correlations among factors were less than the square root of the AVEs in both the Level 1 and Level 2 models, demonstrating satisfactory discriminant validity. Thus, the final scaled items showed significant psychometric attributes and characteristics.

6. Conclusions

Research attention is needed in the e-tourism field to investigate the motivations of tourists for using smartphones (referred to uses and gratifications motivations in this study). To address this research need, this study introduced and applied the uses and gratifications theory to the travel and tourism, and it developed a classification of U & G motivations (motivations for using smartphone by tourists) for this field. Ko et al. [6] suggested the classification of U & G motivations, and Luo [7], Ko et al. [6], and Logan [8] developed motivations items based on it for the communication field. However, this scale was not appropriate for testing the U & G motivations in the field of travel and tourism because it has been tested and proved in the communication and advertising area. Therefore, this study developed a classification of U & G motivations for use of a smartphone while traveling to enhance the understanding of e-tourists’ motivations, behaviors and e-tourist satisfactions. And then this study developed valid and reliable scales for uses and gratifications motivations for smartphone use by tourists.
This study developed the U & G motivations scale utilizing the most appropriate practices in scale construction and validation. It substantiated content validity, convergent validity, discriminant validity, and internal consistency, suggesting that it is an effective tool for measuring U & G motivations in the context of e-tourism. The scale developed in this study makes theoretical and practical contributions to our increasing knowledge of the U & G motivations and their classifications in the e-tourism setting. From a theoretical perspective, this paper contributes a measurement scale and model that had not been tested and developed in the travel and tourism domain. Therefore, future research can apply the U & G motivations scale in various empirical studies of the uses and gratifications theory and tourism to investigate and measure the attitudes of tourists toward and satisfaction with the use of smartphones. From a practical perspective, after further evaluations of external validity, tourism practitioners and marketers can use the U & G motivations scale to examine both the communication and economic impact of media consumers (referred to e-tourists here) resulting from the U & G motivations. As these perspectives suggest, this study increases the growing body of research being conducted on the uses and gratifications theory in the travel and tourism domain.

Author Contributions

J.-W.M.: conceptualization, writing most literature review, research design, statistical analysis, conclusions Y.A.: writing some literature reviews, data collection aid, review and editing. All authors have read and agreed to the published version of the manuscript.

Funding

This project receives no external funding.

Institutional Review Board Statement

Not applicable.

Informed Consent Statement

Informed consent was obtained from all subjects involved in the study.

Data Availability Statement

The data presented in the study are available on request from the corresponding author. The data are not publicly available due to privacy.

Conflicts of Interest

The authors declare no conflict of interests.

Appendix A

Table A1. Survey Instrument.
Social interaction
(During this trip, I use my smartphone…)
SOI1To share my experiences with others while I am in Greenville
SOI2To give advice to other tourists while in Greenville
SOI3To give my comments to others
SOI4To participate in many discussions about Greenville
Information
(I use my smartphone during this trip…)
INF1To look for restaurant reviews from Yelp and Eater
INF2To arrange transportation (Uber and Lyft)
INF3To look for interesting attractions to visit using TripAdvisor
INF4To navigate around Greenville using Google map
INF5To keep up with events in Greenville
Entertainment
(I use my smartphone during this trip because…)
ENT1I want to post pictures to social media
ENT2I want to record my memories by taking photos
ENT3I want to record my memories by taking videos
ENT4I want to share my trip photos
ENT5I want to share videos of my trip
Convenience
(During this trip, I use my smartphone…)
CON1To access information about the next destinations
CON2To obtain updated information about Greenville quickly
CON3To obtain updated information about Greenville easily
CON4To help facilitate changing travel plans fairly quickly in response to a given situation
CON5To have the flexibility to change travel plans fairly quickly

References

  1. Liu, Y.; Law, R. The Adoption of Smartphone Applications by Airlines. In Proceedings of the Information and Communication Technologies in Tourism 2013, Innsbruck, Austria, 22–25 January 2014; Cantoni, L., Xiang, Z., Eds.; Springer: Berlin/Heidelberg, Gemany, 2013; pp. 47–57. [Google Scholar]
  2. Kim, H.H.; Law, R. Smartphones in Tourism and Hospitality Marketing: A Literature Review. J. Travel Tour. Mark. 2015, 32, 692–711. [Google Scholar] [CrossRef]
  3. Lamsfus, C.; Wang, D.; Alzua-Sorzabal, A.; Xiang, Z. Going Mobile: Defining Context for On-the-Go Travelers. J. Travel Res. 2014, 54, 691–701. [Google Scholar] [CrossRef]
  4. Tussyadiah, I.P.; Wang, D. Tourists’ Attitudes toward Proactive Smartphone Systems. J. Travel Res. 2014, 55, 493–508. [Google Scholar] [CrossRef]
  5. Yu, X.; Anaya, G.J.; Miao, L.; Lehto, X.; Wong, I.A. The Impact of Smartphones on the Family Vacation Experience. J. Travel Res. 2017, 57, 579–596. [Google Scholar] [CrossRef]
  6. Ko, H.; Cho, C.-H.; Roberts, M.S. Internet Uses and Gratifications: A Structural Equation Model of Interactive Advertising. J. Advert. 2005, 34, 57–70. [Google Scholar] [CrossRef]
  7. Luo, X. Uses and Gratifications Theory and E-Consumer Behaviors. J. Interact. Advert. 2002, 2, 34–41. [Google Scholar] [CrossRef]
  8. Logan, K. Attitudes towards In-App Advertising: A Uses and Gratifications Perspective. Int. J. Mob. Commun. 2017, 15, 26–48. [Google Scholar] [CrossRef]
  9. Moon, J.W. An Investigation of the Applicability of the Uses and Gratifications Theory for Providing Insight into E-Tourists’ Uses of Smartphones, Unpublished. Ph.D. Dissertation, Clemson University, Clemson, SC, USA, 2020. [Google Scholar]
  10. Julian, M.W. The Consequences of Ignoring Multilevel Data Structures in Nonhierarchical Covariance Modeling. Struct. Equ. Modeling 2001, 8, 325–352. [Google Scholar] [CrossRef]
  11. Raudenbush, S.W.; Bryk, A.S. Hierarchical Linear Models: Applications and Data Analysis Methods; SAGE Publications: Thousand Oaks, CA, USA, 2002. [Google Scholar]
  12. DeVellis, R.F. Scale Developemnt: Theory and Applications, 4th ed.; SAGE Publications: Thousand Oaks, CA, USA, 2016. [Google Scholar]
  13. Bryne, B.M. Structural Equation Modeling with EQS: Basic Concepts, Applications, and Programming, 2nd ed.; Lawrence Erlbaum Associates: Mahwah, NJ, USA, 2006. [Google Scholar]
  14. Bickel, R. Multilevel Analysis for Applied Research: It’s Just Regression; Guilford Press: New York, NY, USA, 2012. [Google Scholar]
  15. Tabachnick, B.G.; Fidel, L.S. Using Multivariate Statistics, 7th ed.; Pearson: London, UK, 2019. [Google Scholar]
  16. Zhu, W.; Morosan, C. An Empirical Examination of Guests’ Adoption of Interactive Mobile Technologies in Hotels: Revisiting Cognitive Absorption, Playfulness, and Security. J. Hosp. Tour. Technol. 2014, 5, 78–94. [Google Scholar] [CrossRef]
  17. Morosan, C. Understanding the Benefit of Purchasing Ancillary Air Travel Services Via Mobile Phones. J. Travel Tour. Mark. 2015, 32, 227–240. [Google Scholar] [CrossRef]
  18. Im, J.Y.; Hancer, M. Shaping Travelers’ Attitude toward Travel Mobile Applications. J. Hosp. Tour. Technol. 2014, 5, 177–193. [Google Scholar] [CrossRef]
  19. Vallespín, M.; Molinillo, S.; Muñoz-Leiva, F. Segmentation and Explanation of Smartphone Use for Travel Planning Based on Socio-Demographic and Behavioral Variables. Ind. Manag. Data Syst. 2017, 117, 605–619. [Google Scholar] [CrossRef]
  20. Wong, J.W.C.; Lai, I.K.W.; Tao, Z. Sharing Memorable Tourism Experiences on Mobile Social Media and How It Influences Further Travel Decisions. Curr. Issues Tour. 2020, 23, 1773–1787. [Google Scholar] [CrossRef]
  21. Tan, W.K.; Chen, Y.C. Tourists’ Work-Related Smartphone Use at the Tourist Destination: Making an Otherwise Impossible Trip Possible. Curr. Issues Tour. 2021, 24, 1526–1541. [Google Scholar] [CrossRef]
  22. Lin, H.F.; Chen, C.H. Combining the Technology Acceptance Model and Uses and Gratifications Theory to Examine the Usage Behavior of an Augmented Reality Tour-Sharing Application. Symmetry 2017, 9, 113. [Google Scholar] [CrossRef] [Green Version]
  23. Palos-Sanchez, P.; Saura, J.R.; Velicia-Martin, F.; Cepeda-Carrion, G. A Business Model Adoption Based on Tourism Innovation: Applying a Gratification Theory to Mobile Applications. Eur. Res. Manag. Bus. Econ. 2021, 27, 100149. [Google Scholar] [CrossRef]
  24. Kirova, V.; Vo Thanh, T. Smartphone Use during the Leisure Theme Park Visit Experience: The Role of Contextual Factors. Inf. Manag. 2019, 56, 742–753. [Google Scholar] [CrossRef]
  25. Chen, C.C.; Huang, W.J.; Gao, J.; Petrick, J.F. Antecedents and Consequences of Work-Related Smartphone Use on Vacation: An Exploratory Study of Taiwanese Tourists. J. Travel Res. 2018, 57, 743–756. [Google Scholar] [CrossRef]
  26. Tussyadiah, I.P. The Influence of Innovativeness on On-Site Smartphone Use Among American Travelers: Implications for Context-Based Push Marketing. J. Travel Tour. Mark. 2015, 33, 806–823. [Google Scholar] [CrossRef]
  27. Lee, K.; Lee, H.R.; Ham, S. The Effects of Presence Induced by Smartphone Applications on Tourism: Application to Cultural Heritage Attractions BT. In Proceedings of the Information and Communication Technologies in Tourism 2014, Dublin, Ireland, 21–24 January 2014; Xiang, Z., Tussyadiah, I., Eds.; Springer: Berlin/Heidelberg, Germany, 2013; pp. 59–72. [Google Scholar]
  28. Kang, S.; Jodice, L.W.; Norman, W.C. How Do Tourists Search for Tourism Information via Smartphone before and during Their Trip? Tour. Recreat. Res. 2020, 45, 57–68. [Google Scholar] [CrossRef]
  29. Erawan, T. Tourists’ Intention to Give Permission via Mobile Technology in Thailand. J. Hosp. Tour. Technol. 2016, 7, 330–346. [Google Scholar] [CrossRef]
  30. Hur, K.; Kim, T.T.; Karatepe, O.M.; Lee, G. An Exploration of the Factors Influencing Social Media Continuance Usage and Information Sharing Intentions among Korean Travellers. Tour. Manag. 2017, 63, 170–178. [Google Scholar] [CrossRef]
  31. Gamage, T.C.; Tajeddini, K.; Tajeddini, O. Why Chinese Travelers Use WeChat to Make Hotel Choice Decisions: A Uses and Gratifications Theory Perspective. J. Glob. Sch. Mark. Sci. 2021. [Google Scholar] [CrossRef]
  32. Papacharissi, Z.; Rubin, A.M. Predictors of Internet Use. J. Broadcasting Electron. Media 2010, 44, 175–196. [Google Scholar] [CrossRef]
  33. Chen, G.M. Tweet This: A Uses and Gratifications Perspective on How Active Twitter Use Gratifies a Need to Connect with Others. Comput. Hum. Behav. 2011, 27, 755–762. [Google Scholar] [CrossRef]
  34. Katz, E.; Blumler, J.G.; Gurevitch, M. Utilization of Mass Communication by the Individual. In The Uses of Mass Communications: Current Perspectives on Gratification Research; Blumler, J., Katz, E., Eds.; SAGE Publications: Thousand Oaks, CA, USA, 1974; pp. 19–32. [Google Scholar]
  35. Shao, G. Understanding the Appeal of User-Generated Media: A Uses and Gratification Perspective. Internet Res. 2009, 19, 7–25. [Google Scholar] [CrossRef]
  36. Wu, J.H.; Wang, S.C.; Tsai, H.H. Falling in Love with Online Games: The Uses and Gratifications Perspective. Comput. Hum. Behav. 2010, 26, 1862–1871. [Google Scholar] [CrossRef]
  37. Zeng, L. More than Audio on the Go: Uses and Gratifications of MP3 Players. Commun. Res. Rep. 2011, 28, 97–108. [Google Scholar] [CrossRef]
  38. Park, N.; Lee, S. Facebook Use and Psychological Outcomes. J. Broadcasting Electron. Media 2014, 58, 601–620. [Google Scholar] [CrossRef]
  39. Dhir, A.; Chen, G.M.; Chen, S. Why Do We Tag Photographs on Facebook? Proposing a New Gratifications Scale. New Media Soc. 2015, 19, 502–521. [Google Scholar] [CrossRef]
  40. Lee, E.-J.; Oh, S.Y. Seek and You Shall Find? How Need for Orientation Moderates Knowledge Gain from Twitter Use. J. Commun. 2013, 63, 745–765. [Google Scholar] [CrossRef]
  41. Johnson, P.R.; Yang, S. Uses and Gratifications of Twitter: An Examination of User Motives and Satisfaction of Twitter Use. In Proceedings of the Communication Technology Division of the Annual Convention of the Association for Education in Journalism and Mass Communication, Boston, MA, USA, 5–8 August 2009. [Google Scholar]
  42. Swanson, D.L. Political Communication Research and the Uses and Gratifications Model: A Critique. Commun. Res. 1979, 6, 37–53. [Google Scholar] [CrossRef] [Green Version]
  43. Foregger, S.K. Uses and Gratification of Facebook.com. In Proceedings of the NCA 95th Annual Convention, Chicago, IL, USA, 12–15 November 2009. [Google Scholar]
  44. Green, J.D. Investigation Uses and Gratification Motivations, Individual Differences, and Psychological Outcomes Associated with Media Multitasking during TV-Viewing Contexts. Ph.D. Thesis, Texas Tech University, Lubbock, TX, USA, 2014. [Google Scholar]
  45. Ha, Y.W.; Kim, J.; Libaque-Saenz, C.F.; Chang, Y.; Park, M.C. Use and Gratifications of Mobile SNSs: Facebook and KakaoTalk in Korea. Telemat. Inform. 2015, 32, 425–438. [Google Scholar] [CrossRef]
  46. Logan, K. Uses and Gratification That Drive Young Adults’ Smartphone Use and the Implications for Advertising Effectiveness. In Proceedings of the Annual Meeting of the Association for Education in Journalism and Mass Communication, Montreal, QC, Canada, 6–9 August 2014. [Google Scholar]
  47. Mahmoud, A. Uses and Gratification of Online Advertising: A Comparative Study between Germany and Egypt. Ph.D. Thesis, Ilmenau University of Technology, Ilmenau, Germany, 2010. [Google Scholar]
  48. Kim, J.W. Scan and Click: The Uses and Gratifications of Social Recommendation Systems. Comput. Hum. Behav. 2014, 33, 184–191. [Google Scholar] [CrossRef]
  49. Oh, S.; Syn, S.Y. Motivations for Sharing Information and Social Support in Social Media: A Comparative Analysis of Facebook, Twitter, Delicious, YouTube, and Flickr. J. Assoc. Inf. Sci. Technol. 2015, 66, 2045–2060. [Google Scholar] [CrossRef]
  50. Dickinson, J.E.; Ghali, K.; Cherrett, T.; Speed, C.; Davies, N.; Norgate, S. Tourism and the Smartphone App: Capabilities, Emerging Practice and Scope in the Travel Domain. Curr. Issues Tour. 2014, 17, 84–101. [Google Scholar] [CrossRef]
  51. Wang, D.; Fesenmaier, D.R. Transforming the Travel Experience: The Use of Smartphones for Travel. In Information and Communication Technologies in Tourism 2013; Springer: Berlin/Heidelberg, Germany, 2013; pp. 58–69. [Google Scholar]
  52. Dolan, R.; Conduit, J.; Fahy, J.; Goodman, S. Social Media Engagement Behaviour: A Uses and Gratifications Perspective. J. Strateg. Mark. 2016, 24, 261–277. [Google Scholar] [CrossRef] [Green Version]
  53. Sharma, S.; Gutiérrez, J.A. An Evaluation Framework for Viable Business Models for M-Commerce in the Information Technology Sector. Electron. Mark. 2010, 20, 33–52. [Google Scholar] [CrossRef]
  54. Dias, S.F.; Afonso, V.A. Innovative Business Models in Tourism and Hospitality: Going Mobile? In Strategic Business Models to Support Demand, Supply, and Destination Management in the Tourism and Hospitality Industry; IGIGlobal: Hershey, PA, USA, 2020; pp. 164–184. [Google Scholar]
  55. Plume, C.J.; Slade, E.L. Sharing of Sponsored Advertisements on Social Media: A Uses and Gratifications Perspective. Inf. Syst. Front. 2018, 20, 471–483. [Google Scholar] [CrossRef] [Green Version]
  56. Malik, A.; Hiekkanen, K.; Dhir, A.; Nieminen, M. Impact of Privacy, Trust and User Activity on Intentions to Share Facebook Photos. J. Inf. Commun. Ethics Soc. 2016, 14, 364–382. [Google Scholar] [CrossRef]
  57. Choi, E.K.; Fowler, D.; Goh, B.; Yuan, J. Social Media Marketing: Applying the Uses and Gratifications Theory in the Hotel Industry. J. Hosp. Mark. Manag. 2016, 25, 771–796. [Google Scholar] [CrossRef]
  58. Muthén, B.O. Latent Variable Modeling in Heterogeneous Populations. Psychometrika 1989, 54, 557–585. [Google Scholar] [CrossRef]
  59. Muthén, B.O. Multilevel Factor Analysis of Class and Student Achievement Components. J. Educ. Meas. 1991, 28, 338–354. [Google Scholar] [CrossRef] [Green Version]
  60. Muthén, B. 10. Latent Variable Modeling of Longitudinal and Multilevel Data. Sociol. Methodol. 1997, 27, 453–480. [Google Scholar] [CrossRef]
  61. Preacher, K.J.; Zhang, Z.; Zyphur, M.J. Structural Equation Modeling Alternative Methods for Assessing Mediation in Multilevel Data: The Advantages of Multilevel SEM. Struct. Equ. Modeling 2011, 18, 161–182. [Google Scholar] [CrossRef]
  62. Hu, L.T.; Bentler, P.M. Cutoff Criteria for Fit Indexes in Covariance Structure Analysis: Conventional Criteria versus New Alternatives. Struct. Equ. Modeling 1999, 6, 1–55. [Google Scholar] [CrossRef]
  63. Browne, M.; Cudeck, R. Alternative Ways of Assessing Model Fit. Sociol. Methods Res. 1992, 21, 230–258. [Google Scholar] [CrossRef]
  64. Marsh, H.W.; Hau, K.-T. Assessing Goodness of Fit. J. Exp. Educ. 2014, 64, 364–390. [Google Scholar] [CrossRef]
  65. Hair, J.F.; Black, W.C.; Babin, B.J.; Anderson, R.E. Multivariate Data Analysis, 7th ed.; Pearson: London, UK, 2009. [Google Scholar]
  66. Kashy, D.A.; Kenny, D.A. The Analysis of Data from Dyads and Groups. In Handbook of Research Methods in Social and Personality Psychology; Reis, H.T., Judd, C.M., Eds.; Cambridge University Press: New York, NY, USA, 2000; pp. 451–477, ISBN 0-521-55128-5 (Hardcover); 0-521-55903-0 (Paperback). [Google Scholar]
  67. Kenny, D.A.; Kashy, D.A.; Cook, W.L. Dyadic Data Analysis; Guilford Press: New York, NY, USA, 2006. [Google Scholar]
  68. Fornell, C.; Larcker, D.F. Evaluating Structural Equation Models with Unobservable Variables and Measurement Error. J. Mark. Res. 1981, 18, 39. [Google Scholar] [CrossRef]
  69. Dillman, J.E.; Smyth, J.; Christian, L. Internet, Mail, and Mixed-Mode Surveys: The Tailored Design Method, 3rd ed.; John Wiley & Sons, Ltd.: Hoboken, NJ, USA, 2009. [Google Scholar]
  70. Mertler, C.A.; Reinhart, R.V. Advanced and Multivariate Statistical Methods: Practical Application and Interpretation; Pyrczak Publishing: Glendale, CA, USA, 2016. [Google Scholar]
Figure 1. A conceptual model of uses and gratification motivations in the context of e-tourism.
Tourismhosp 03 00007 g001
Table 1. Demographic Factor.
VariableCategoryN (= 642)Percentage (%)
GenderMale30547.5
Female33752.5
Age18–2015023.5
21–3014723.0
31–4011718.4
41–5011417.8
51–607711.9
61–70264.0
Above 7081.2
No response30.3
Purpose of tripLeisure vacation/recreation49477.4
Business trip8012.0
Combination639.9
No response50.7
Table 2. Interclass Correlation Values of Variables.
SOIICCINFICCENTICCCONICC
SOI10.122INF10.195ENT10.128CON10.223
SOI20.319INF20.257ENT20.093CON20.131
SOI30.288INF30.182ENT30.162CON30.192
SOI40.335INF40.137ENT40.144CON40.187
INF50.179ENT50.202CON50.226
Note. SOI: Social Interaction; INF: Information; ENT: Entertainment; CON: Convenience.
Table 3. Factor Loadings, Reliability Coefficients and AVEs of Modified Multilevel Model.
Level 1Level 2
LoadingAlphaRhoAVELoadingAlphaRhoAVE
Social InteractionSOI10.8270.8310.8320.5550.6440.9250.9300.773
SOI20.6600.927
SOI30.7620.962
SOI40.7200.943
InformationINF10.8060.8860.8870.6110.9250.9380.9390.757
INF20.8200.927
INF30.8340.895
INF40.7380.734
INF50.7030.855
EntertainmentENT10.7560.9010.9020.6500.7020.9060.9080.666
ENT20.8260.713
ENT30.7040.848
ENT40.9230.829
ENT50.8050.962
ConvenienceCON10.7410.8940.8960.6370.9170.9740.9740.881
CON20.9180.910
CON30.9040.951
CON40.7110.959
CON50.6840.956
Note: See Appendix A.
Table 4. Correlations among All Constructs: Level 1 Model.
AVEF1F2F3F4
F1. Social Interaction0.5550.745
F2. Information0.6110.4830.782
F3. Entertainment0.6500.6420.4480.806
F4. Convenience0.6370.3110.6350.3140.798
Table 5. Correlations among All Constructs: Level 2 Model.
AVEF1F2F3F4
F1. Social Interaction0.7730.879
F2. Information0.7570.3170.870
F3. Entertainment0.6660.6540.4620.816
F4. Convenience0.8810.2120.8130.4980.939
Note. F1: SOI: social interaction; F2: INF: information; F3: ENT: entertainment; F4: CON: convenience. “F” indicates latent factor. See Appendix A.
Publisher’s Note: MDPI stays neutral with regard to jurisdictional claims in published maps and institutional affiliations.

