
Uses and Gratifications Motivations and Their Effects on Attitude and e-Tourist Satisfaction: A Multilevel Approach


1
School of Hospitality and Tourism Management, University of South Florida, Sarasota, FL 34243, USA
2
Department of Tourism, Hospitality and Event Management, University of Florida, Gainesville, FL 32611, USA
*
Author to whom correspondence should be addressed.
Tour. Hosp. 2022, 3(1), 116-136; https://0-doi-org.brum.beds.ac.uk/10.3390/tourhosp3010009
Submission received: 30 December 2021
/
Revised: 26 January 2022
/
Accepted: 26 January 2022
/
Published: 29 January 2022
Abstract
:This study employed the Uses and Gratifications Theory to explore the motivations for utilizing a smartphone during trips and satisfactions with travel experience. This study adopted multilevel SEM to explore how U&G motivations affect e-tourist satisfaction when attitude toward smartphone use by tourists serves as a mediator. To this end, data collected from tourists travelling in the US were analyzed using a multilevel approach. The findings are: (1) U&G motivations (social interaction, entertainment, information, and convenience) are determined, (2) valid and reliable scales for all constructs are developed, (3) U&G motivations have a significant effect on tourists’ attitude toward smartphone use, which, in turn, significantly affects e-tourist satisfaction (hedonic, utilitarian, and overall) at the individual level. The results from this study provide practical and theoretical implications for e-tourism communication and tourism marketing.
1. Introduction
The tourism industry and its associated businesses have relied on Information and Communication Technology (ICT), specifically smartphones, to communicate with tourists, with research in this field centering on tourists’ use of this technology [1,2]. Most previous research has focused on developing a conceptual foundation for ICT and social media use in the context of tourism research. However, there is a research need based on theoretical frameworks with their corresponding appropriate constructs. These constructs and models are needed because they help systematically investigating the nature of the research body in a scientific manner. Some tourism scholars have pointed to the need for more smartphone and tourism research focused on measuring constructs in relation to the tourism experience based on a theoretical framework [3,4,5,6]. To address this need, the research proposed here employs the Uses and Gratifications Theory to explore the motivations for utilizing a smartphone and satisfactions with this experience.
Moreover, the previous studies identified several critical weaknesses in the research conducted on smartphone use in the travel and tourism field [3,4,7,8], primarily stemming from the researchers’ reliance on qualitative research methods, the method typically used in this field. Although this research contributed to the literature base by identifying concepts related to smartphone use by travelers, the generalizability of these results is limited, in part because of the small sample sizes. To address this research gap, quantitative research is the next step in smartphone research in the travel and tourism context as such research will allow for the causal relationships among concepts and variables to be tested to measure the effectiveness of the theoretically informed research. The goal of this study is to build on past research and address some of the limitations of the previous studies.
More specifically, the purpose of this study is to develop a conceptual framework of the Uses and Gratifications Theory and to investigate the causal relations among its four motivations (i.e., social interaction, entertainment, information, and convenience) for using smartphones and determine how gratified (satisfied) tourists are with the use of this platform (smartphone) in the travel and tourism context. This theory serves as the theoretical framework for this study because of its importance in representing human behavioral dimensions related to mediated communication [9,10,11]. As such, the Uses and Gratifications Theory may offer tourism researchers an insightful lens into tourist behavior, although few studies have applied it in this context. This study adopts Multilevel Linear Modeling (MLM; Individual Level vs. Group Level) as an appropriate statistical method because it examines smartphone use by tourists as a group while also considering the influence of each of its members with respect to the travel behavior and travel decision-making process. Social media and IT including smartphones tend to be individualized in the communication context. Therefore, their use in the travel and tourism context needs to be investigated for group effects.
2. Literature Review
2.1. Mobile Technology and Its Impact on Travel and Tourism
Due to the prevalent use of mobile technologies, travelers are able to purchase products and services when they are traveling since they have instant access to the internet as well as have increased chances to connect with other tourists [12,13,14]. Hence, tourists can make more flexible decisions [15]. In addition, timing or promptness in tourists’ decision making plays a key role in influencing their travel motivation and purchasing behavior [16,17]. Due to the complex nature of travelers’ decision-making process, tourists have different timelines when making trip-related decisions. Specifically, in the before-trip stage, it takes several months for travelers to make a decision on the destination they plan to visit. In contrast, tourists tend to make decisions voluntarily and immediately while they are on site. As a consequence, mobile devices can be considered a convenient and practical instrument to help tourists smooth the decision-making process [18,19].
Furthermore, the impact of smartphones on travelers’ decision-making processes and travel behavior is increasing [8,20] because of the complex pieces of information a smartphone can provide. Specifically, the complicated information obtained through smartphone use can positively affect the overall tourist experience, especially in the psychological and behavioral aspects [1,21]. Moreover, smartphones provide tourists with immediate information sources since travelers can take their smartphones out of their pockets and search for information regarding their trips (i.e., lodging, local businesses, and local festivals). Such immediate information is customized to individual travelers, assisting them in planning and adjusting their itineraries [22]. In addition, smartphones can help travelers build and maintain connections with their friends and family members as they are able to update their trip details and experiences for their family and friends while traveling [7]. Moreover, smartphones reconstruct the travel experience by using geospatial technologies to prepare for individualized trip-related information [3,23]. For example, before travelers begin their vacation, they are provided with actual transportation and weather information about their destination [24]. As this example suggests, smartphones enable tourists to make instant decisions based on the information they receive [3].
Other than requiring information for immediate and practical decisions, tourists also have the need to connect with other tourists visiting the same tourist destination through web communities [2,25]. In this way, smartphones assist travelers in constructing and strengthening their social networks. In the context of travel and tourism, smartphone use consists of two elements: satisfying the tourists’ need for (1) information and communication with others and (2) their decision making and overall experience [21,25]. Consequently, smartphones act as a practical and powerful platform for social interaction with other tourists [26,27].
However, the researchers indicated that research regarding the use of smartphones in the tourism domain lacks systematic investigation, suggesting that there is much more to investigate on the influences of smartphones in tourism research [28]. To address this research need, this study applied the uses and gratifications theory to determine tourists’ motivations for using smartphones.
2.2. Uses and Gratifications Theory and Its Applications to Travel and Tourism
The Uses and Gratifications Theory (U&G), which was developed in the 1940s to explore relationships between mass media and individual users [29], focuses on “what people do with media,” not “what media do to people” [30] (p. 4). The primary goal of this theory is to describe individual’s social and psychological reasons and motivations for utilizing a specific media and how the media fulfills their intrinsic needs and wants [11]. The Uses and Gratifications Theory assumes that (1) every individual is an active audience in the media circumstances; in the context of tourism, travelers are seen as active smartphone users to fulfil their needs (social interaction, entertainment, convenience, and information), obtaining satisfaction when they are on the move; (2) people are goal directed and highly motivated; in other words, unlike traditional media users watching TV and listening to the radio unconsciously, travelers (media audiences) are purposeful and highly motivated to utilize smartphones for their needs (information, convenience, social interaction, and entertainment); (3) media users (tourists) interact with media communication; that is, smartphones are innately interactive so the boundary between the sender and receiver is faint; (4) users recognize their own needs and then choose a specific media to gratify them [31,32]; in the tourism context, travelers recognize their needs (referred to as the four motivations below) and select their smartphones to satisfy them. U&G is particularly suitable for smartphones studies because smartphones are highly interactive and interpersonal [33,34].
While past literature has found different dimensions describing the reasons for media use, the study reported here uses the four constructs of information, convenience, social interaction, and entertainment based on previous mass media and communications research because these are most applicable to smartphone research in the travel and tourism setting [11,31,34,35,36,37,38,39].
2.3. Motivations for Smartphone Use (Four Constructs)
2.3.1. Information
The information construct represents the degree to which a website on the Internet offers beneficial and valuable information. Websites can provide media users with useful information, which is consumed in an online communication setting [37,40]. By using smartphone apps, users can receive the necessary and useful information [24]. Thus, in the context of tourism, travelers can obtain customized information [41] using their smartphones. Smartphones are considered useful tools for searching for information relevant to trips (i.e., hotel lodgings, air-tickets, restaurants, Lyft and Uber, and tourist attractions). While tourists are on the move, smartphone use can decrease their stress level and lead to integrated travel itineraries [1]. For example, using a smartphone makes it easy for travelers to find and choose a local restaurant since they can find location, average cost of a meal, and detailed information about the menu the restaurant offers beforehand [8,42].
2.3.2. Entertainment
The entertainment construct refers to the degree to which people perceive media use as entertaining and enjoyable [37,43]. As Hausman and Siekpe [44] pointed out, the entertainment motivation can strongly influence both the attitude toward and the satisfaction with a website. In some cases, tourists use smartphones for video streaming to relieve boredom during a trip, such as during flight layovers [21]. In addition, using their smartphones, tourists can take pictures and record videos to capture highlights during their trip so that their travel memories can be saved and posted on social media sites such as Facebook and Instagram [27,45]. As these studies suggest, smartphone use can enhance the tourist experience by making a trip more pleasant and memorable as it facilitates recording memories over the entire travel experience [5].
2.3.3. Social Interaction
The social interaction motivation can be defined as the degree to which people can communicate with others, be associated with other people, and share their opinions utilizing websites [46]. According to Pentina et al. [47] and Choi et al. [45], individuals use mobile technology to build relationships with others who share similar opinions and thoughts. Although people want to escape from their daily lives during their trips, they also want to remain close to their social circles and local communities where they feel they belong. Even though tourists are away from their homes geographically, they still want to be closely connected with their local communities and social circles emotionally [24,36]. By using smartphones, travelers can feel the sense of belonging that generates emotional proximity for travelers while visiting tourist destinations [32]. Moreover, along with this sense of belonging, tourists feel secure using smartphones [6,31].
2.3.4. Convenience
The convenience motivation in U&G refers to the agility, accessibility, and availability of mobile services in the context of social media without time and space constraints. Mobile technology supplies people with anytime-anywhere benefits. The advantage of anytime-anywhere communication is associated with information acquisition [5,41]. Therefore, convenience in the context of smartphone use decreases the time and effort needed to find information [2]. This mobility helps travelers obtain information quickly, meaning media users have easy access to information via mobile convenience while on the move. Smartphones facilitate quick access to information, providing enhanced convenience for tourists [36]. Specifically, tourists can obtain access to information wherever they are [26]. For instance, by using smartphones, tourists are able to get trip-relevant information without being limited by location or time and can adjust their travel itineraries instantly [6]. In addition, smartphones can help tourists book hotels and air tickets, track their flight status, look for local events and tourist attractions, and check local weather and safety concerns at tourist destinations immediately [32,39]. Moreover, tourists are able to reschedule their reservations for certain activities, providing increased travel flexibility [2,26]. Because smartphones are small and easy to carry, they are convenient for tourists to use to check information quickly and effortlessly without spatial and temporal constraints.
2.4. Relationships among U&G Motivations, Attitude, and e-Tourist Satisfaction
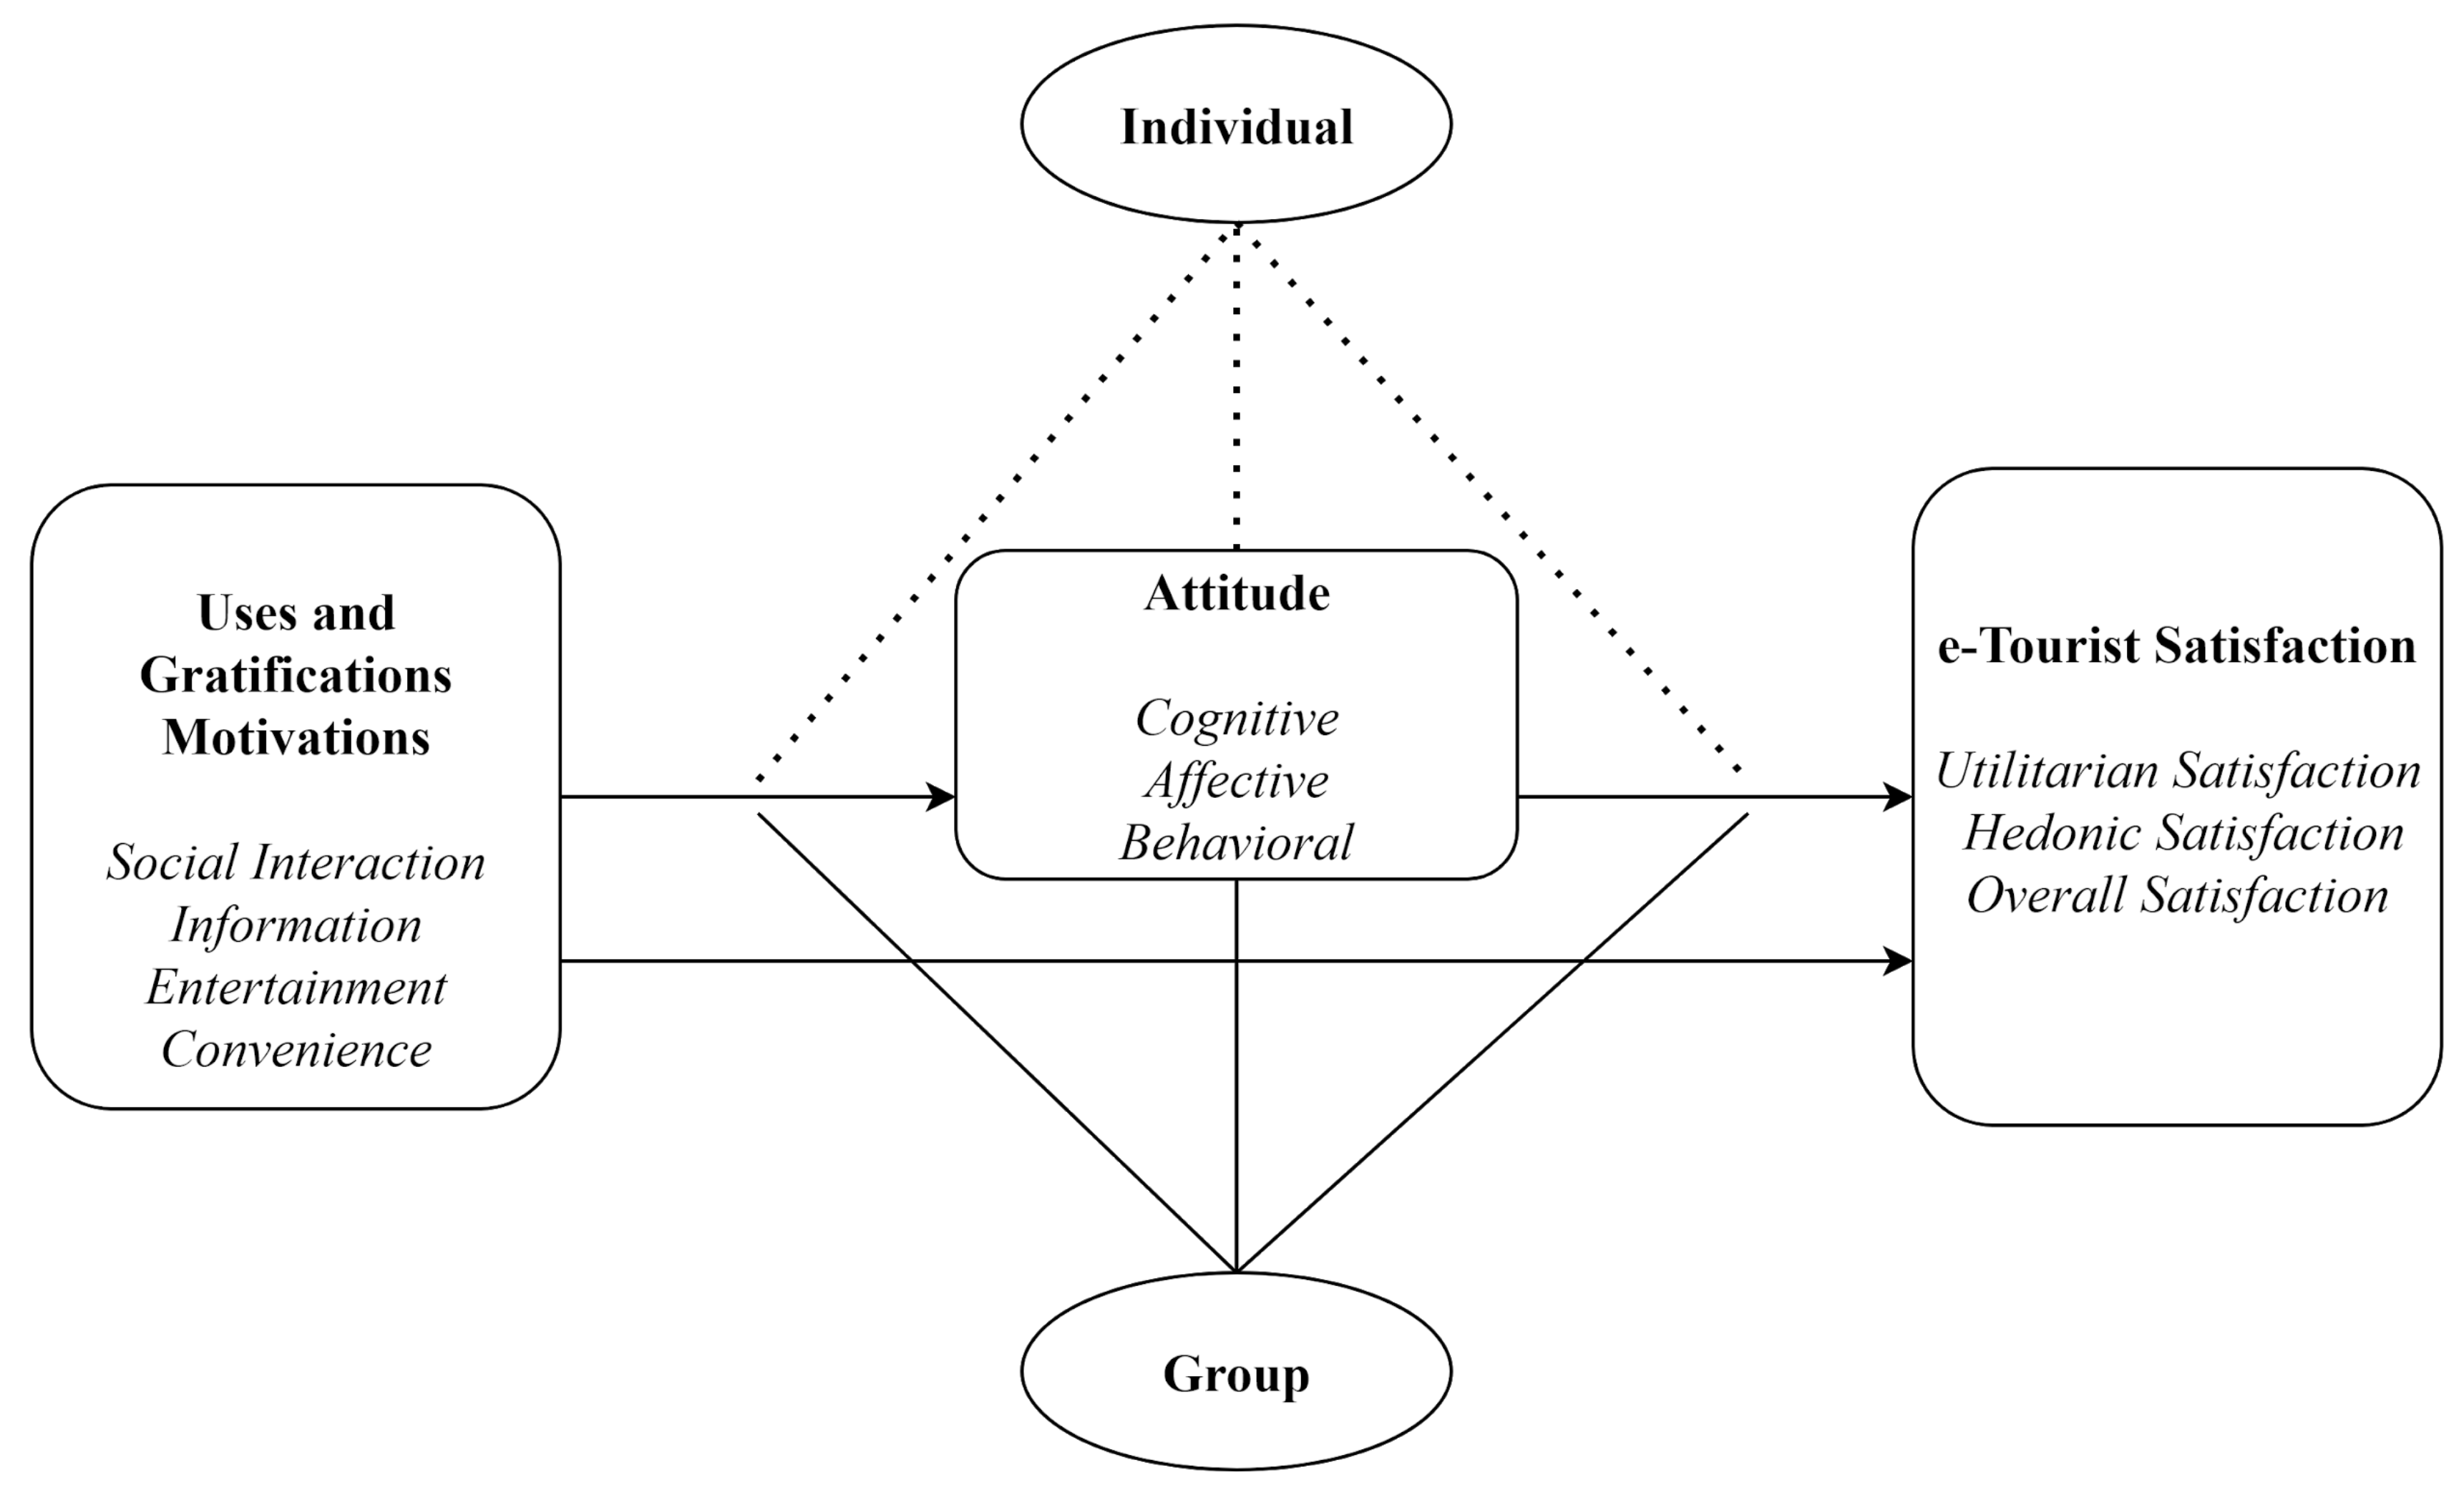
Uses and Gratifications (U&G) motivations represent motivations of using smartphone by tourists; attitudes involve attitudes towards smartphone use by tourists; e-tourist satisfaction refers to satisfaction with smartphone use by tourists. As this Figure 1 shows, the U&G motivations, for using a smartphone by tourists consist of four constructs (independent variables), social interaction, information, entertainment, and convenience. This study proposed here adopts Buhalis and Jun’s [48] e-Tourism concept by defining “e-Tourists” as those who use ICT (specifically smartphone) to fulfill their needs for information, convenience, social interaction, and entertainment. Attitude toward smartphone use by tourists, which comprises affective, cognitive, and behavioral attitude (mediating variables), is defined as “the level to which an individual has a favorable or unfavorable appraisal or evaluation of a certain behavior” [49] (p. 188). E-tourist satisfaction (dependent variables), satisfaction with smartphone use by tourists, is classified into three components: utilitarian satisfaction, hedonic satisfaction, and overall satisfaction, the satisfaction of this need being referred to as gratification [31,34,50].
According to Fishbein and Ajzen [51], as the antecedent, motivation has the potential to affect attitude. This study explores the relationship among the four U&G motivations of social interaction, information, entertainment, and convenience by investigating smartphone use by tourists and their attitude toward it. This study also explores the relationship between attitude toward the smartphone use by tourists and their satisfaction with its use. Their attitude, which include affective, cognitive, and behavioral components, serves as the precursor of their satisfaction with this technology. Therefore, as Chon [52] recommended, this study extends the Uses and Gratifications Theory to the travel and tourism area and this field needs to deal with these relationships.
Attitude has been affected by motivations and satisfactions have been influenced by attitude in previous research [11,37,53,54,55,56]. Thus, attitude serves as a mediator between motivations and satisfactions in this study and then needs to be tested whether it is significant.
Conceptual Framework of Interactive e-Tourism Communication using the Uses and Gratifications Theory is presented in Figure 1.
Specifically, this study addresses the following research questions derived from the Uses and Gratification Theory (UGT).
- How are U&G Motivations and Attitudes related in the travel and tourism context?
- What is the relationship between Attitudes and e-Tourist Satisfaction in the travel and tourism context?
- What is the role of Attitudes in the relationship between U&G Motivations and e-Tourist Satisfaction in the context of travel and tourism?
- Which factors of U&G Motivations have significant relationships via Attitude with e-Tourist Satisfaction?
This analysis utilizes multilevel SEM to demonstrate how U&G motivations influence other constructs and mediating variables as well as dependent variables in both Individual Level and Group Level models. Multilevel linear modeling (MLM) is an effective tool for examining hierarchically structured data [57,58] such as that found in the travel and tourism research. For instance, most tourists travel in a group, not individually, taking trips with family members, friends, an organization, or a combination. As travelers in groups may share common traits or features with their members, a situation can be seen as the hierarchical structure because each person is probably nested or dependent within the group, and such hierarchically structured data should be analyzed utilizing MLM because the single level approach may create biased statistical results due to the shared common traits and features within groups [59,60,61].
Based on the conceptual framework and research questions forming this study, the following hypotheses are posited:
Hypothesis 1a (H1a).
U&G Motivations have a positive effect on Attitude toward the smartphone use in the Individual Level (Level 1).
Hypothesis 1b (H1b).
U&G Motivations have a positive effect on Attitude toward the smartphone use in the Group Level (Level 2).
Hypothesis 2a (H2a).
Attitude toward the smartphone use has a positive effect on e-Tourist Satisfaction in the Individual Level (Level 1).
Hypothesis 2b (H2b).
Attitude toward the smartphone use has a positive effect on e-Tourist Satisfaction in the Group Level (Level 2).
Hypothesis 3a (H3a).
Attitudes toward the smartphone use positively mediate the relationship between U&G Motivations and e-Tourist Satisfaction in the Individual Level (Level 1).
Hypothesis 3b (H3b).
Attitudes toward the smartphone use positively mediate the relationship between U&G Motivations and e-Tourist Satisfaction in the Group Level (Level 2).
Hypothesis 4a (H4a).
Each factor of U&G Motivations has a positive relation via Attitude toward the smartphone use with e-Tourist Satisfaction in the Individual Level (Level 1).
Hypothesis 4b (H4b).
Each factor of U&G Motivations has a positive relation via Attitude toward the smartphone use with e-Tourist Satisfaction in the Group Level (Level 2).
3. Methods
3.1. Survey Instrument
Respondents answered questions regarding general travel experiences (e.g., purpose of trip, travel group, length of stay in the area, group size, demographic information), motivations for using smartphone by tourists (U&G motivations), attitudes towards smartphone use by tourists, and satisfaction with smartphone use by tourists (e-tourist satisfaction). As measured by communications, advertising, marketing and tourism literature, the scale of U&G motivations comprises 19 items across the 4 dimensions of social interaction (4 items), information (5 items), entertainment (5 items), and convenience (5 items). The scale of attitudes toward smartphone use by tourists, measured by communications, advertising, marketing, and tourism literature, includes 14 items across the 3 dimensions of affective (4 items), cognitive (6 items), and behavioral (4 items), and the scale of satisfaction with smartphone use by tourists (e-tourist satisfaction) is composed of 12 items across the 3 dimensions of utilitarian satisfaction (4 items), hedonic satisfaction (4 items), and overall satisfaction (4 items) as measured by communications, advertising, marketing, and tourism literature. To measure all these constructs of interest, this study used a seven-point Likert scale, ranging from 1 = strongly disagree to 7 = strongly agree.
3.2. Study Site, Sampling Method, and Data Collection
The respondents of the main survey questionnaire were tourists in Greenville, South Carolina and in Charleston, South Carolina, who indicated that they experienced using smartphones on their trips. In this study, an intercept survey method was used to collect data. An intercept survey is a survey method which is employed to obtain on-site feedback from respondents and is conducted in public places. Researchers approached potential respondents to ask them about their experiences at the specific location. The respondents could fill out the survey, a questionnaire, on paper or on a laptop [62,63].
A research team intercepted people in downtown Greenville and in downtown Charleston, asking four questions: (1) Are you visiting downtown Greenville/downtown Charleston? (2) Are you using a smartphone during your trip? (3) Are you over 18 years old? (4) Will you please complete my questionnaire for this study? Individuals who answered “yes” to these four questions were invited to complete the questionnaire and if they agreed, the team members briefly explained the content of the study to each respondent. The response rate was calculated based on the responses that the research team received on the four screening questions. In case a tourist group has non-smartphone users, or a tourist group stays with residents, the research team did not distribute questionnaires to the group because non-smartphone users and residents could obstruct the measurement of group effect in a tourist group and then they could not be respondents for this study.
The research team collected 687 responses for 5 weeks from individuals travelling alone and in groups from 24 locations over different time periods in Greenville and in Charleston for a response rate of 84.5%. As it is difficult for one individual to represent an entire group, the research team attempted to collect data from more than one person in a group. Of the 304 groups surveyed, 97 were represented by 1 member and 207 by more than 1 person in the travel party. The group size refers to the number of people (tourists) in the group when the researchers approached them at a specific location. Of 687 responses collected, 38 were not complete and, thus, were not used in the data analysis; neither were the 7 responses determined to be extreme outliers based on the results of Mahalanobis distance analysis. The remaining 642 responses were examined to test the research models.
The data collected from the respondents are classified by the number of people in their groups. Of the 304 groups, 97 were comprised of 1 person (11.3%), 134 of 2 people (42.7%), 40 of 3 people (19.7%), 21 of 4 people (14.1%), 8 of 5 people (6.23%), 3 of 6 people (2.8%) and 1 of 15 people (2.34%). As a result, the data collected were employed for multilevel confirmatory factor analysis (CFA) and multilevel structural equation modeling (SEM).
3.3. Data Analysis
This study tested the hypotheses using following three steps: (a) data screening, (b) multilevel CFA, and (c) multilevel SEM in SPSS 25.0 and EQS 6.3. This study employed a multilevel approach to distinguish between group and individual perspectives of the uses and gratifications motivations, attitudes, and e-tourist satisfaction. In other words, all constructs in the hypotheses were defined at both the individual (i.e., Level 1) and group (i.e., Level 2) levels because they were influenced by hierarchically structured data [57,58]. Therefore, each response from each participant was analyzed twice, once from the individual perspective and a second from the group. Because the single level approach may create biased statistical results due to the shared common traits and features within groups, hierarchically structured data should be analyzed utilizing multilevel analysis [59,60,61]. To conduct multilevel CFA, Model-based Intraclass correlations (ICC) values are examined to identify significant nesting at the group level and to detect the interdependency of group responses [64,65]. The ICC is the result when the between group variances are divided by the total variances (sum of the between group variances and the within group variances) [66,67]. Multilevel linear modeling is required if the ICC values are larger than 0.1. Moreover, an ICC value of 0.05 is considered small; one of 0.10 is regarded as a medium value, and an ICC value of 0.20 is regarded as large [68,69].
Data analysis for the main study is generally categorized into two parts: the measurement model and the structural model. Before analyzing these models, data screening is conducted to eliminate statistical outliers using Mahalanobis’ Distance. Moreover, normality is assessed by verifying the z-score of skewness and kurtosis utilizing the Statistical Package for Social Science 25.0. This study checked multivariate normality using Mardia’s coeffient, and Satorra-Bentler scaled statistic (S-B 𝑥𝑥2) and robust standard errors are helpful and effective for addressing non-normality in large samples [70]. Thus, they can be employed to construe the results of data analyses [71] when normal distribution is violated.
The multilevel CFA for model estimation was conducted utilizing EQS 6.3 with robust maximum likelihood estimation. This study examined the root mean square error of approximation (RMSEA) and the standardized root mean squared residual (SRMR) for an absolute model fit, while examining non-normed fit index (NNFI) and comparative fit index (CFI) for a comparative model fit. Composite reliability (Rho), Cronbach alpha, correlation (r), and average variance explained (AVE) were examined to determine the reliability and the validity of the multilevel CFA.
In the multilevel SEM phase, attitude functioned as a mediator between the uses and gratifications motivations and e-tourist satisfaction. The Sobel test, which assumes a normal distribution, was employed to test the mediation [72]. Both individual (Level 1) and group (Level 2) models were checked and tested concurrently, with two sets of results [69]: one for individual differences regarding group means (individual level) and the second for differences between-group means (group level).
4. Results
4.1. Overview of the Sample
The sample consisted of slightly more females (52.5%) than males (47.5%), and while the single largest age group was the 21-to 30-year-old group (23.5%), the average age was slighter higher at 32.5 years. As for race, White/Caucasian reported the highest percentage (79.5%), followed by Black/African American (13.4%), Asian (2.8%) and Hispanic/Latino (2.3%). Based on the purpose of the trip, leisure and recreational travelers comprised 77.0%, business tourists 12.4%, and tourists with multiple purposes 9.8%. Most respondents who participated in the survey were traveling in groups, such as family (33.0%), friends (26.1%), family and friends (20.4%), and others (4.9%), while 15.5% of respondents made the trip alone.
4.2. Multilevel CFA
Before conducting multilevel CFA, this study checked ICC values. The ICC is the result when the between group variances are divided by the total variances (sum of the between group variances and the within group variances) [67,68]. A total of 39 out of 45 items scored an ICC > 0.1, and 10 items were an ICC of 0.2 or higher. This means that more than 10% of the variance of these items was caused by the respondents’ group effects or experiences. Therefore, multilevel linear modeling was needed to analyze the hierarchical structure of the data.
Results of the initial multilevel CFA to check model fit indices, the goodness of fit statistics for the initial CFA model (Table 1) indicated a good fit (i.e., RMSEA = 0.057, SRMR = 0.042, CFI = 0.932, NNFI = 0.925). Lagrange Multiplier (LM) tests were used to identify and address misfit in the model, with the LM test statistics indicating that the researcher needed to add four error covariances in the initial model because they were more correlated than what the factors reflected and then reduced the model fit because of their extra relationships. The four error covariances included CON5 and CON4, CA6 and CA5, ENT5 and ENT3, and ENT3 and ENT2. The model was modified accordingly, and the review of the goodness of fit statistics of the modified CFA model (Table 1) demonstrated a better fit (i.e., RMSEA = 0.041, SRMR = 0.041, CFI = 0.965, NNFI = 0.961).
This study tested the convergent validity, discriminant validity, and internal consistency at both Level 1 and Level 2, the results indicating that all factor loadings are statistically significant as can be seen in Table 2, which displays the model’s factor loadings, α coefficients, Rho values, and Average Variances Extracted (AVEs). Cronbach’s α values range from 0.831 for SOI to 0.981 for CA at Level 1 and from 0.906 for ENT to 0.993 for CA at Level 2, indicating satisfactory internal consistency for all factors (α > 0.70) [72,73]. Moreover, the Rho coefficients remain the same or are similar to the Cronbach’s α. Cronbach’s alpha relies on the average loading between the latent construct and the items, assuming all load the same, unlike composite reliability (Rho), which does not assume loading equality. The AVE values range from 0.555 for SOI to 0.895 for CA at Level 1 and from 0.666 for ENT to 0.962 for CA at Level 2. All AVEs for factors at Level 1 and Level 2 are higher than 0.5, and most AVEs at both levels are higher than 0.65, indicating satisfactory convergent validity [72,73].
To assess convergent validity and discriminant validity, the AVEs for each factor were calculated at both the individual and the group level (Table 3 and Table 4). Comparing the diagonal elements in the Level 1 model with those in the Level 2 indicates that the variables in the Level 2 (the group level) are more highly correlated with one another than those in the Level 1 (individual level). Even though the variables at Level 1 exhibit good convergent validity, the variables at Level 2 exhibit better convergent validity (diagonal elements). Table 3 and Table 4 show that the correlations among factors are less than the square root of the AVEs in both the Level 1 and Level 2 models, indicating satisfactory discriminant validity.
4.3. Multilevel SEM
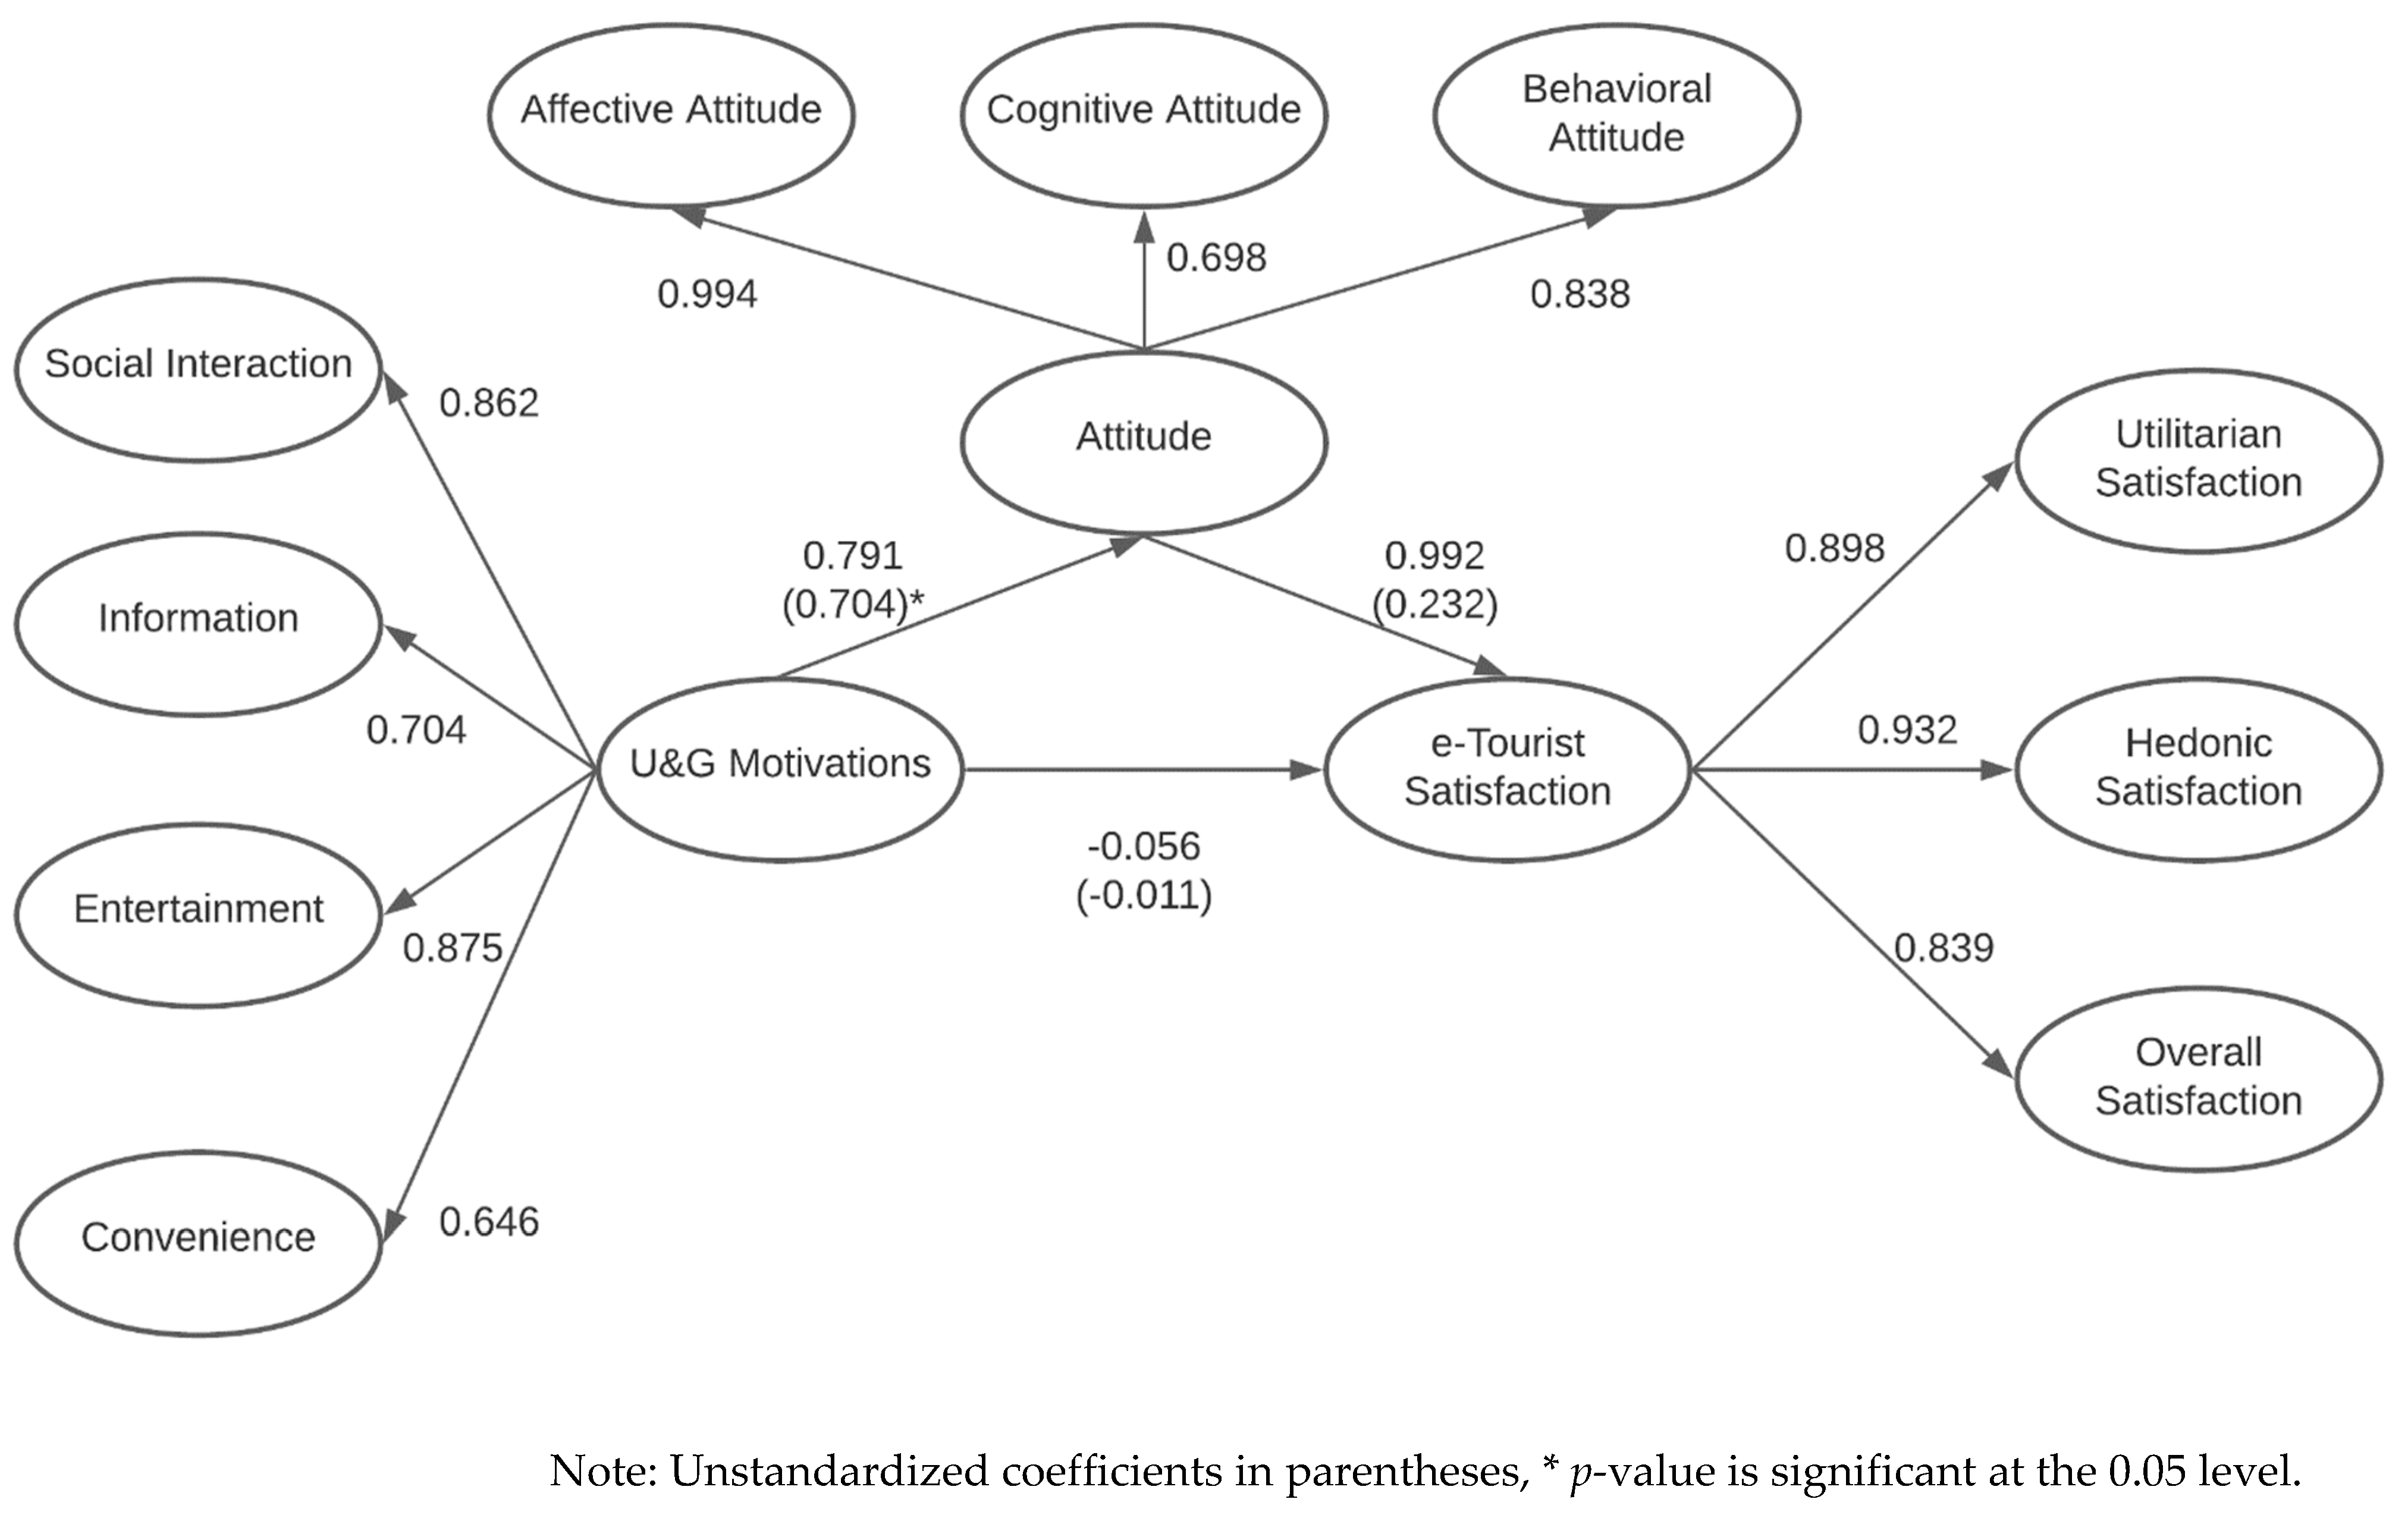
The hypothesized model was tested using the multilevel structural equation model, simultaneously measured at the Individual Level (Level 1) and Group Level (Level 2) as depicted in Figure 2 and Figure 3, respectively. The model has good fit: x2 (df) = 2065. 815 (1530), RMSEA = 0.046, SRMR = 0.052, CFI = 0.956, NNFI = 0.952. An examination of the z-statistics was conducted to determine if the hypotheses could be accepted or rejected (Table 5). First, the results from the regression and mediation in the Level 1 model demonstrate that the standardized path coefficient from the second order factor U&G Motivations to the second order factor Attitude is significant (β = 0.380, z = 6.003), supporting H1a. The second order factor Attitude positively affects the second order factor e-Tourist Satisfaction (β = 0.486, z = 6.037), supporting H2a. The results from the indirect effect of the Level 1 mediation model demonstrate that the second order factor U&G Motivations has an indirect effect on the second order factor e-Tourist Satisfaction (β = 0.185, z = 4.266), supporting H3a.
An examination of the z-statistics was conducted to determine if H1b, H2b, and H3b could be accepted or rejected in the Level 2 regression and mediation model (Table 5). First, the results from regression and mediation in the Level 2 model demonstrate that the second order factor U&G Motivations has a positive effect on the second order factor Attitude. The standardized path coefficient from U&G Motivations to Attitude is significant (β = 0.791, z = 5.049). The value of the z-score is larger than the critical z-score of 1.96, indicating a significant relationship between the second order factor U&G Motivations and the second order factor Attitude, supporting H1b. Second, the second order factor Attitude was not found to affect the second order factor e-Tourist Satisfaction at the group level (β = 0.992, z = 1.248), rejecting H2b. In terms of indirect effects, Attitude was hypothesized to mediate the relationship between U&G Motivations and e-Tourist Satisfaction at the group level. The results of the indirect effect of the Level 2 mediation model demonstrate that the second order factor U&G Motivations does not have an indirect effect on the second order factor e-Tourist Satisfaction (β = 0.785, z = 1.211), rejecting H3b.
For the Level 1 model, this study also examined the indirect relationship (three path relationship) among each sub-component of U&G Motivations and e-Tourist Satisfaction via Attitude in the Level 1 mediation model. U&G Motivation for a Social Interaction (β = 0.1117, z = 3.96), U&G Motivation for an Information (β = 0.1603, z = 4.37), U&G Motivation for an Entertainment (β = 0.1173, z = 2.92), and U&G Motivation for a Convenience (β = 0.1422, z = 2.98) have a significant effect on e-Tourist Satisfaction, exhibiting a value larger than the cutoff criterion (z-value > 1.96), thus supporting H4a. These results mean that there are significant relationships among four sub-components of U&G Motivations and e-Tourist Satisfaction via Attitude in the Level 1 model (Table 6).
This study also tested the indirect relationship (three path relationship) between each sub-component of U&G Motivations and e-Tourist Satisfaction via Attitude for the level 2 mediation model. U&G Motivation for a Social Interaction (β = 0.668, z = 1.16), U&G Motivation for an Information (β = 0.474, z = 0.98), U&G Motivation for an Entertainment (β = 0.678, z = 1.18), and U&G Motivation for a Convenience (β = 0.452, z = 0.98) exhibit z-score values smaller than the critical z-score of 1.96. These results mean that there are no significant relationships between these four sub-components of U&G Motivations and e-Tourist Satisfaction via Attitude, rejecting H4b (Table 6).
5. Conclusions
5.1. Hypotheses and Discussion
Using multilevel structural equation modeling, the purpose of this study was to investigate the research questions proposed earlier. To address the first question, this study analyzed the relationship among U&G motivations and attitude. Based on the results, the hypotheses at both levels were supported. This study supports Fishbein’s [74] definition of attitude, in which he defined attitude as “learned predispositions to respond to an object or class of objects in a favorable or unfavorable way” (p. 257). The results from this study found that U&G motivations have a positive relationship with attitude, results consistent with previous research, meaning that U&G motivations positively influenced attitude [11,75,76]. In other words, tourists who seek information, convenience, entertainment, and social interaction have favorable attitudes toward smartphone use while traveling at Level 1 and 2.
Second, this study measured the relationship between attitude and e-tourist satisfaction. The hypothesis was supported at Level 1, but the one at Level 2 was rejected. Luo [37] found that satisfaction was influenced by attitude toward the Internet in the UGT context. Moreover, Park and Lee [56] found that satisfaction with campus life was influenced by attitude toward Facebook use in the UGT context as well. In addition, Moutinho and Smith [53] and Wu and Chang [77] argued that customer satisfaction was affected by brand attitude and risk attitude. The study reported here found similar results to those from previous research exploring the relationship between attitude and satisfaction. Based on the results from this study, a favorable attitude toward smartphone use can lead to utilitarian satisfaction, hedonic satisfaction, and overall satisfaction during trips at Level 1; On the other hand, attitude was not found to influence e-tourist satisfaction while traveling at Level 2. That is, there was no group effect found between attitude toward smartphone use and e-tourist satisfaction. Tourists’ attitude toward smartphone use is likely to be individualized by their media usage, meaning their attitude toward it tends to influence individual satisfaction, not group satisfaction. Thus, tourists’ individual smartphone choices do not affect the group satisfaction of travelers.
The third question addresses the indirect effect in the relationship between U&G motivations, attitude, and e-tourist satisfaction in the mediation model. Based on the results, the hypothesis was supported at Level 1, but the one at Level 2 was rejected. Attitude significantly mediated an indirect effect of U&G motivations on e-tourist satisfactions at Level 1 but not at Level 2. The results from this study are consistent with Luo [37] and Lee’s [55] models which examined motivations, attitude, and satisfactions. Luo [37] examined the impact of the three motivations on a variety of consumer behaviors, including attitude toward Internet usage and customer satisfaction using the UGT. Luo’s model explained that U&G motivations directly affect attitude, and attitude significantly influences satisfaction. Lee [55] also investigated a conceptual model of tourism utilizing the variables of destination image, attitude, motivation, satisfaction, and future travel behavior. This study confirmed that motivation directly affects attitude, which, in turn, directly influences tourist satisfaction, meaning motivation indirectly influences tourist satisfaction.
Similarly, Park and Lee [56] also found that U&G motivations had an indirect effect on satisfaction with campus life through the attitudes towards Facebook. To summarize, tourists who desired social interaction, information, entertainment, and convenience during their trips had favorable attitudes toward smartphone use and this attitude toward it influenced their utilitarian satisfaction, hedonic satisfaction, and overall satisfaction at Level 1. On the other hand, the group motivations of tourists did not influence group attitude, which, in turn, did not affect the group satisfaction of tourists. Tourists’ motivations for using smartphones are likely to be socially and psychologically individualized by their media usage and these motivations influence the attitude toward smartphone use of individual tourists (not group of tourists), which in turn, influences the utilitarian satisfaction, hedonic satisfaction, and overall satisfaction of individual tourists. These phenomena originate in the personalized and customized traits of social media and IT including the smartphone.
Fourth, to clarify which sub-factors of U&G motivations via attitude influence e-tourist satisfaction, this study also analyzed three path relationships (each sub-factor of U&G motivations, attitude, and e-tourist satisfaction) in the mediation model. At Level 1, U&G motivation measured as information and U&G motivation measured as convenience via attitude showed a substantial impact on e-tourist satisfaction, followed by U&G motivation measured as entertainment and U&G motivation measured as social interaction. U&G motivations, measured as information, convenience, entertainment, and social interaction, via attitude had a significant impact on e-tourist satisfaction in the individual level, meaning that tourists seeking these factors had a favorable attitude toward smartphone use, which, in turn, led to satisfaction with smartphone use by tourists during their trips at Level 1. At the group level, however, each sub-factor of U&G motivations via attitude did not have a significant relationship with e-tourist satisfaction. These specific motivations, attitudes and the resulting satisfaction are caused by individual socio-psychological attributes, not the group unit. This study supports previous research examining the relationship among the three U&G motivations, attitude toward the Internet and customer satisfaction [37]. In Luo’s [37] research, Internet users who saw the web as entertaining and informative tended to demonstrate a positive attitude toward it, while those who regarded it as irritating reported a negative attitude, meaning the former tended to search the Internet and felt satisfied with their searches.
The results indicate that that smartphone issues in the travel and tourism context were more important at the individual level than at the group level. This finding is consistent with the assumptions and crucial concepts of Uses and Gratifications Theory, which focus on individual motivations and individual use when actively selecting specific media choices and features. This theory assumes that users actively participate in the media environment and that they are goal-directed in their media usage. More critically, media users (tourists are referred to as media users here) seek specific gratifications (satisfactions) to fulfill their individual needs and wants (referred to as the four U&G motivations here). These needs and gratifications stem from individual psychological and sociological characteristics and traits [78,79].
5.2. Conceptual and Theoretical Implications
Despite the previous smartphone research in the context of travel and tourism, there is limited research based on a strong theoretical background that seeks to understand how tourists are motivated and satisfied via smartphone use. This study extends previous studies by systematically investigating and quantitatively measuring how and to what extent tourists are gratified (satisfied) using smartphones during their trips based on the Uses and Gratifications Theory. This study provides several theoretical contributions. It found four motivations for using smartphones by tourists, referred to U&G motivations, specifically social interaction, information, entertainment, and convenience. The results suggest that these four motivations have a significant effect on tourists’ attitude toward smartphone use, which, in turn, significantly affects e-tourist satisfaction at the individual level.
This result demonstrates that the Uses and Gratifications Theory can serve as a useful and effective conceptual framework for aiding tourism researchers in gaining a better understanding of tourism phenomena. It can also lead us to a fuller understanding of the application of this theory to the new media and tourism, offering the possibility of investigating the issues of social media and IT in travel and tourism through the lens of this theory. This study also confirmed the relationships among U&G motivations, attitude toward the smartphone use by tourists and e-tourist satisfactions, as predicted. Although these relationships have been explored in advertising, communications, marketing, and management areas using Uses and Gratifications Theory, this study further extends the extant literature to the smartphone in travel and tourism including examining whether these relationships are valid in this context.
In addition, this study provides a classification of U&G motivations and a conceptual model of interactive e-tourism communication. This study represents the first development of a classification and conceptual model of Uses and Gratifications Theory in the field of travel and tourism. Thus, this study introduced and applied the Uses and Gratifications Theory to the travel and tourism area in addition to developing a classification of U&G motivations for this field. While Ko et al. [11] suggested the classification of U&G motivations and Luo [37], Ko et al. [11], and Logan [34] developed motivations items based on it for the communication field, this scale was not suitable for testing the U&G motivations in the field of travel and tourism because it had been applied only to the new media and communications fields. The classification of U&G motivations for the use of a smartphone while traveling and the new scale for measuring e-tourist satisfaction and experiences to enhance the understanding of e-tourists’ motivations, the behaviors and satisfaction proposed here consist of four constructs: social interaction, information, entertainment, and convenience motivations. E-tourist satisfactions are classified into three categories: utilitarian satisfactions, hedonic satisfactions, and overall satisfactions.
This study also extended the theoretical framework of Uses and Gratifications Theory by examining the causal relations among its four motivations and smartphone use while traveling and the level of satisfaction of tourists experienced using this platform in the tourism context. Moreover, this study created a new concept of e-Tourist and e-Tourist Satisfactions based on the extant tourism literature. Based on the unique characteristics of communication, this study explored conceptual knowledge by considering communication, consumer behavior and tourism within the e-tourism context. The development of the classification of U&G motivations and the conceptual model of e-tourism communication provides tourism researchers with a deeper understanding of the reasons why tourists use smartphones during their trips and the construct of U&G motivations and e-Tourist Satisfaction.
While previous scholars have investigated U&G motivations and satisfactions in the field of new media and communications [11,31,34,35,36,37,38,80], there is little empirical investigation of the relationships between U&G motivations and other constructs in the e-tourism area. This study empirically tested relationships among U&G motivations, attitude toward the smartphone use by tourists and e-tourist satisfaction, analyzing how the motivations influenced attitude toward it and e-tourists’ satisfaction. More specifically, this study found that each U&G motivation factor serves as a significant predictor of e-tourist satisfactions at the individual level. The empirical findings from this study contribute to our knowledge of how gratified (satisfied) tourists are with the use of this platform (smartphone) in the travel and tourism context.
5.3. Methodological and Statistical Implications
The scale of U&G motivations, attitude and e-tourist satisfaction was developed from the perspective of the unique features and traits of e-tourism communication to provide a theoretical basis through expert review, an extensive literature review and four pilot studies. This scale demonstrated content validity, convergent validity, discriminant validity, and internal consistency through expert review, four pilot studies and multilevel confirmatory factor analysis. As a result, the scale items developed in this study are expected to contribute to future research applying the Uses and Gratifications Theory to tourism.
Previous research on smartphones and tourism has primarily depended on qualitative research; however, this study is a quantitative one using Multilevel SEM. The Multilevel SEM adopted for this study aids the researchers in testing and measuring causal relationships among concepts and variables in measuring group effects by examining hierarchically structured data.
This study differentiates itself from previous research because it collected data only from tourists travelling in groups and analyzing the data by considering the interdependency of their responses. Consequently, using MLM in this study was an effective method for analyzing these data and to test if there were groups effects among travel groups.
5.4. Practical and Managerial Implications
Tourism marketers can enhance the information motivation for using smartphones by travelers by disseminating up-to-date and useful information concerning tourism destinations. For example, some information on restaurant reviews from Yelp and Eater can generate positive eWOM for specific tourism destinations and providing information on transportation such as Uber and Lyft or navigating around the destination using Google maps can also trigger value co-creation [27,81]. Information on interesting attractions or special events at the destinations can attract more travelers, and tourism practitioners can improve the social interaction motivation for using smartphones by connecting tourists with travelers at the destination. These interactions are enhanced because mobile phones and the Internet have transformed the ease and convenience of social interactions and communication [8]. For instance, Destination Marketing Organizations (DMOs) and smartphone companies can join to develop a platform hosting discussion about destinations. Sharing of travel experiences and providing tips and comments to other tourists can fulfill the social interaction motivations of travelers.
Tourism marketing practitioners can trigger the entertainment motivation of travelers for using smartphones by offering various smartphone applications that can generate a positive attitude toward smartphone use, leading to a high level of entertainment and satisfaction at destinations. For example, travelers use smartphones to record their memories by taking photos and videos and sharing them with friends, both those at home and those with them at the destination, via social media such as Twitter and Facebook [2,24]. Tourism marketers can increase the convenience motivation of using smartphones by travelers via rapid and easy access to information. Thus, they can help tourists efficiently check for updated tourist information while on the move. Doing so makes travel easier and more enjoyable because of the minimal effort required to transcend time and space. One managerial implication from this study is the need for DMOs and tourist attractions to integrate customized and effective Social Networking Services (SNS)s strategies into their marketing communication mix. Currently, many travelers depend on the information provided in smartphones applications, and this type of promotional effort can generate a favorable image of a destination.
As a new communication channel for travel-related products and services, smartphones can serve as an effective tool to satisfy tourists’ information motivation regarding travel activities as well as to enhance their convenience motivation. Tourists who have been satisfied with the use of smartphones are expected to utilize them in their next travel plans. Thus, DMOs (Destination Marketing or Management Organizations) are to supply tourists with customized and updated information for flexibility and immediacy at a specific location and time. Recently, smartphones have enabled tourists to be more involved and innovative in creating or savoring their own travel experiences [21,24]. In addition, these new media offer DMOs the tools that satisfy, or gratify, the U&G motivations of tourists so that DMOs can successfully address the changing interests of travelers.
5.5. Study Limitations and Recommendations for Future Research
Despite the contributions of this study, it has several limitations that can offer opportunities for future research. This study did not use moderating variables such as gender and age. It would be more meaningful to measure and explain e-tourist satisfactions if future research can address this issue. The results demonstrate that smartphone use by tourists is dynamic, meaning the nature of this technology use can substantially change during trips. This finding substantiates the affordances of smartphone, and since the nature of the tourism experience may change and differ across the three stages (pre-trip, on-site trip, and post-trip) of the trip experience, further research is needed to address three different stages individually. Moreover, 46.5% of the respondents in this study were members of the younger generation (under 30 years old), and they used their smartphones during this trip, meaning they are generally more open to adopting a new media technology to acquire a wide range of information channels during their trips. Thus, DMOs and tourism marketers are advised to target and customize their offerings to younger tourists who bring and use smartphones when they travel, and then they need to segment by generation.
Author Contributions
J.-W.M.: Conceptualization, Writing most literature review, Research design, Statistical analysis and Conclusion; Y.A.: Writing some literature review, Data collection aid, Critical review and Editing. All authors have read and agreed to the published version of the manuscript.
Funding
This project receives no external funding.
Institutional Review Board Statement
Not applicable.
Informed Consent Statement
Informed consent was obtained from all subjects involved in the study.
Data Availability Statement
The data presented in the study are available on request from the corresponding author. The data are not publicly available due to privacy.
Conflicts of Interest
The authors declare no conflict of interests.
Appendix A. Latent Factors and Items
| Latent Factors and Item Labels | Item Descriptions | |
| Social Interaction (F1) | SOI1 | During this trip, I use my smartphone to share my experiences with others while I am in Greenville. |
| SOI2 | During this trip, I use my smartphone to give advice to other tourists while in Greenville. | |
| SOI3 | During this trip, I use my smartphone to give comments to others. | |
| SOI4 | During this trip, I use my smartphone to participate in many discussions about Greenville. | |
| Information (F2) | INF1 | I use my smartphone during this trip to look for restaurant reviews on Yelp and Eater. |
| INF2 | I use my smartphone during this trip to arrange transportation (Uber and Lyft). | |
| INF3 | I use my smartphone during this trip to look for interesting attractions to visit using TripAdvisor. | |
| INF4 | I use my smartphone during this trip to navigate around Greenville using Google Maps. | |
| INF5 | I use my smartphone during this trip to keep up with events in Greenville. | |
| Entertainment (F3) | ENT1 | I use my smartphone during this trip because I want to post pictures to social media. |
| ENT2 | I use my smartphone during this trip because I want to record my memories by taking photos. | |
| ENT3 | I use my smartphone during this trip because I want to record my memories by taking videos. | |
| ENT4 | I use my smartphone during this trip because I want to share my trip photos. | |
| ENT5 | I use my smartphone during this trip because I want to share videos of my trip. | |
| Convenience (F4) | CON1 | During this trip, I use my smartphone to access information about my next destinations. |
| CON2 | During this trip, I use my smartphone to obtain updated information about Greenville quickly. | |
| CON3 | During this trip, I use my smartphone to obtain updated information about Greenville easily. | |
| CON4 | During this trip, I use my smartphone to help facilitate changing travel plans fairly quickly in response to a given situation. | |
| CON5 | During this trip, I use my smartphone to have the flexibility to change travel plans fairly quickly. | |
| Affective Attitude (F5) | AA1 | I think that using my smartphone during this trip is entertaining. |
| AA2 | I think that using my smartphone during this trip is pleasant. | |
| AA3 | I think that using my smartphone during this trip is enjoyable. | |
| AA4 | I think that using my smartphone during this trip is appealing. | |
| Cognitive Attitude (F6) | CA1 | I think that using my smartphone during this trip is valuable. |
| CA2 | I think that using my smartphone during this trip is effective. | |
| CA3 | I think that using my smartphone during this trip is practical. | |
| CA4 | I think that using my smartphone during this trip is beneficial. | |
| CA5 | I think that using my smartphone during this trip is helpful. | |
| CA6 | I think that using my smartphone during this trip is informative. | |
| Behavioral Attitude (F7) | BA1 | I recommend smartphone use during this trip to other people. |
| BA2 | I expect to use my smartphone during this trip. | |
| BA3 | I intend to use my smartphone during this trip. | |
| BA4 | I plan to use my smartphone during this trip. | |
| Utilitarian Satisfaction (F8) | UTIL1 | During this trip, I am satisfied with the convenience to look for information on my smartphone. |
| UTIL2 | I am sure that using a smartphone during this trip fits my travel style. | |
| UTIL3 | During this trip, I am satisfied with the easy access to a wide selection of travel information via my smartphone. | |
| UTIL4 | During this trip, I made the correct decision to use my smartphone to get information whenever I want. | |
| Hedonic Satisfaction (F9) | HED1 | I have fun with my smartphone during this trip. |
| HED2 | I find using my smartphone during this trip to be enjoyable. | |
| HED3 | I find using my smartphone during this trip to be exciting. | |
| HED4 | I feel comfortable using my smartphone during this trip. | |
| Overall Satisfaction (F10) | SAT1 | Using smartphones during this trip was an excellent idea. |
| SAT2 | I feel very good about the information and communication technology service on my smartphone. | |
| SAT3 | Using a smartphone for this trip is very helpful. | |
| SAT4 | Overall, I was pleased with my smartphone use during this trip. | |
References
- Tussyadiah, I.P. The Influence of Innovativeness on On-Site Smartphone Use Among American Travelers: Implications for Context-Based Push Marketing. J. Travel Tour. Mark. 2015, 33, 806–823. [Google Scholar] [CrossRef]
- Palos-Sanchez, P.; Saura, J.R.; Velicia-Martin, F.; Cepeda-Carrion, G. A Business Model Adoption Based on Tourism Innovation: Applying a Gratification Theory to Mobile Applications. Eur. Res. Manag. Bus. Econ. 2021, 27, 100149. [Google Scholar] [CrossRef]
- Kim, H.H.; Law, R. Smartphones in Tourism and Hospitality Marketing: A Literature Review. J. Travel Tour. Mark. 2015, 32, 692–711. [Google Scholar] [CrossRef]
- Wang, D.; Xiang, Z.; Fesenmaier, D.R. Smartphone Use in Everyday Life and Travel. J. Travel Res. 2016, 55, 52–63. [Google Scholar] [CrossRef]
- Yu, X.; Anaya, G.J.; Miao, L.; Lehto, X.; Wong, I.A. The Impact of Smartphones on the Family Vacation Experience. J. Travel Res. 2017, 57, 579–596. [Google Scholar] [CrossRef]
- Dias, S.F.; Afonso, V.A. Innovative Business Models in Tourism and Hospitality: Going Mobile? In Strategic Business Models to Support Demand, Supply, and Destination Management in the Tourism and Hospitality Industry; IGI Global: Hershey, PA, USA, 2020; pp. 164–184. [Google Scholar]
- Wang, D.; Fesenmaier, D.R. Transforming the Travel Experience: The Use of Smartphones for Travel. In Information and Communication Technologies in Tourism 2013; Springer: Berlin/Heidelberg, Germany, 2013; pp. 58–69. [Google Scholar]
- Wong, J.W.C.; Lai, I.K.W.; Tao, Z. Sharing Memorable Tourism Experiences on Mobile Social Media and How It Influences Further Travel Decisions. Curr. Issues Tour. 2020, 23, 1773–1787. [Google Scholar] [CrossRef]
- Lin, C.A. Looking Back: The Contribution of Blumler and Katz’s Uses of Mass Communication to Communication Research. J. Broadcast. Electron. Media 1996, 40, 574–581. [Google Scholar] [CrossRef]
- Ruggiero, T.E. Uses and Gratifications Theory in the 21st Century. Mass Commun. Soc. 2000, 3, 3–37. [Google Scholar] [CrossRef] [Green Version]
- Ko, H.; Cho, C.-H.; Roberts, M.S. Internet uses and gratifications: A Structural Equation Model of Interactive Advertising. J. Advert. 2005, 34, 57–70. [Google Scholar] [CrossRef]
- Molz, J.G. Travel Connections: Tourism, Technology and Togetherness in a Mobile World, 1st ed.; Routledge: London, UK, 2012; ISBN 9780203123096. [Google Scholar]
- Gretzel, U. Intelligent Systems in Tourism: A Social Science Perspective. Ann. Tour. Res. 2011, 38, 757–779. [Google Scholar] [CrossRef]
- Hwang, Y.H.; Fesenmaier, D.R. Unplanned Tourist Attraction Visits by Travellers. Tour. Geogr. 2011, 13, 398–416. [Google Scholar] [CrossRef]
- Lamsfus, C.; Wang, D.; Alzua-Sorzabal, A.; Xiang, Z. Going Mobile: Defining Context for On-the-Go Travelers. J. Travel Res. 2014, 54, 691–701. [Google Scholar] [CrossRef]
- Perdue, R.R. Segmenting State Travel Information Inquirers by Timing of the Destination Decision and Previous Experience. J. Travel Res. 1985, 23, 6–11. [Google Scholar] [CrossRef]
- Iverson, T.J. Japanese Visitors to Guam: Lessons from Experience. J. Travel Tour. Mark. 1997, 6, 41–54. [Google Scholar] [CrossRef]
- Hwang, Y.-H. A Theory of Unplanned Travel Decisions: Implications for Modeling On-the-Go Travelers. Inf. Technol. Tour. 2010, 12, 283–296. [Google Scholar] [CrossRef]
- Morosan, C. Understanding the Benefit of Purchasing Ancillary Air Travel Services Via Mobile Phones. J. Travel Tour. Mark. 2015, 32, 227–240. [Google Scholar] [CrossRef]
- Wang, D.; Park, S.; Fesenmaier, D.R. The Role of Smartphones in Mediating the Touristic Experience. J. Travel Res. 2011, 51, 371–387. [Google Scholar] [CrossRef] [Green Version]
- Kirova, V.; Vo Thanh, T. Smartphone Use during the Leisure Theme Park Visit Experience: The Role of Contextual Factors. Inf. Manag. 2019, 56, 742–753. [Google Scholar] [CrossRef]
- Dickinson, J.E.; Ghali, K.; Cherrett, T.; Speed, C.; Davies, N.; Norgate, S. Tourism and the Smartphone App: Capabilities, Emerging Practice and Scope in the Travel Domain. Curr. Issues Tour. 2014, 17, 84–101. [Google Scholar] [CrossRef]
- Portolan, A.; Milicevic, M.; Zubrinic, K. Concept of Mobile Device Integration in Current Travel and Tourism Industry. In Proceedings of the 10th WSEAS International Conference on Recent Researches in Applied Computer and Applied Computation and Science, Venice, Italy, 8–10 March 2011; pp. 154–159. [Google Scholar]
- Tan, W.K.; Chen, Y.C. Tourists’ Work-Related Smartphone Use at the Tourist Destination: Making an Otherwise Impossible Trip Possible. Curr. Issues Tour. 2021, 24, 1526–1541. [Google Scholar] [CrossRef]
- Lamsfus, C.; Xiang, Z.; Alzua-Sorzabal, A.; Martín, D. Conceptualizing Context in an Intelligent Mobile Environment in Travel and Tourism. In Information and Communication Technologies in Tourism 2013, Proceedings of the International Conference, Innsbruck, Austria, 22–25 January 2013; Cantoni, L., Zheng, X., Eds.; Springer: Berlin/Heidelberg, Germany, 2013; pp. 1–11. [Google Scholar]
- Tussyadiah, I.P.; Wang, D. Tourists’ Attitudes toward Proactive Smartphone Systems. J. Travel Res. 2014, 55, 493–508. [Google Scholar] [CrossRef]
- Chen, C.C.; Huang, W.J.; Gao, J.; Petrick, J.F. Antecedents and Consequences of Work-Related Smartphone Use on Vacation: An Exploratory Study of Taiwanese Tourists. J. Travel Res. 2018, 57, 743–756. [Google Scholar] [CrossRef]
- Lee, B.; Lee, C.-K.; Lee, J. Dynamic Nature of Destination Image and Influence of Tourist Overall Satisfaction on Image Modification. J. Travel Res. 2013, 53, 239–251. [Google Scholar] [CrossRef]
- Quan-Haase, A. Is the Uses and Gratifications Approach Still Relevant in a Digital Society? Theoretical and Methodological Applications to Social Media. J. Mass Commun. J. 2012, 2, 1–4. [Google Scholar] [CrossRef] [Green Version]
- Katz, E. Mass Communications Research and the Study of Popular Culture: An Editorial Note on a Possible Future for This Journal. Stud. Public Commun. 1959, 2, 1–6. [Google Scholar]
- Green, J.D. Investigation Uses and Gratification Motivations, Individual Differences, and Psychological Outcomes Associated with Media Multitasking during TV-Viewing Contexts. Ph.D. Thesis, Texas Tech University, Lubbock, TX, USA, 2014. [Google Scholar]
- Plume, C.J.; Slade, E.L. Sharing of Sponsored Advertisements on Social Media: A Uses and Gratifications Perspective. Inf. Syst. Front. 2018, 20, 471–483. [Google Scholar] [CrossRef] [Green Version]
- Johnson, P.R.; Yang, S. Uses and Gratifications of Twitter: An Examination of User Motives and Satisfaction of Twitter Use. In Proceedings of the Association for Education in Journalism and Mass Communication, Boston, MA, USA, 5–8 August 2009. [Google Scholar]
- Logan, K. Attitudes towards In-App Advertising: A Uses and Gratifications Perspective. Int. J. Mob. Commun. 2017, 15, 26–48. [Google Scholar] [CrossRef]
- Foregger, S.K. Uses and Gratification of Facebook.Com. In In Proceedings of the NCA 95th Annual Convention on Discourses of Stability and Change, Chicago, IL, USA, 12–15 November 2009. [Google Scholar]
- Ha, Y.W.; Kim, J.; Libaque-Saenz, C.F.; Chang, Y.; Park, M.C. Use and Gratifications of Mobile SNSs: Facebook and KakaoTalk in Korea. Telemat. Inform. 2015, 32, 425–438. [Google Scholar] [CrossRef]
- Luo, X. Uses and Gratifications Theory and E-Consumer Behaviors. J. Interact. Advert. 2002, 2, 34–41. [Google Scholar] [CrossRef]
- Mahmoud, A. Uses and Gratification of Online Advertising:A Comparative Study between Germany and Egypt. Ph.D. Thesis, Ilmenau University of Technology, Ilmenau, Germany, 2010. [Google Scholar]
- Moon, J.W. An Investigation of the Applicability of the Uses and Gratifications Theory for Providing Insight into e-Tourists’ Use of Smartphones. Unpublished. Ph.D. Thesis, Clemson University, Clemson, SC, USA, 2020. [Google Scholar]
- Chen, Q.; Wells, W.D. Attitude toward the Site. J. Advert. Res. 1999, 39, 27–38. [Google Scholar]
- Dolan, R.; Conduit, J.; Fahy, J.; Goodman, S. Social Media Engagement Behaviour: A Uses and Gratifications Perspective. J. Strateg. Mark. 2016, 24, 261–277. [Google Scholar] [CrossRef] [Green Version]
- Xiang, Z.; Wang, D.; O’Leary, J.T.; Fesenmaier, D.R. Adapting to the Internet: Trends in Travelers’ Use of the Web for Trip Planning. J. Travel Res. 2015, 54, 511–527. [Google Scholar] [CrossRef]
- Eighmey, J.; McCord, L. Adding Value in the Information Age: Uses and Gratifications of Sites on the World Wide Web. J. Bus. Res. 1998, 41, 187–194. [Google Scholar] [CrossRef]
- Hausman, A.v.; Siekpe, J.S. The Effect of Web Interface Features on Consumer Online Purchase Intentions. J. Bus. Res. 2009, 62, 5–13. [Google Scholar] [CrossRef]
- Choi, E.K.; Fowler, D.; Goh, B.; Yuan, J. Social Media Marketing: Applying the Uses and Gratifications Theory in the Hotel Industry. J. Hosp. Mark. Manag. 2016, 25, 771–796. [Google Scholar] [CrossRef]
- Papacharissi, Z.; Rubin, A.M. Predictors of Internet Use. J. Broadcast. Electron. Media 2010, 44, 175–196. [Google Scholar] [CrossRef]
- Pentina, I. The Role of Virtual Communities as Shopping Reference Groups. J. Electron. Commer. Res. 2008, 9, 114–136. [Google Scholar]
- Buhalis, D.; Jun, S.H. E-Tourism. In Contemporary Tourism Reviews; Cooper, C., Ed.; Goodfellow Publishers: Oxford, UK, 2011; pp. 1–38. ISBN 9780750686679. [Google Scholar]
- Ajzen, I. The Theory of Planned Behavior. Organ. Behav. Hum. Decis. Process. 1991, 50, 179–211. [Google Scholar] [CrossRef]
- Stacks, D.W.; Salwen, M.B.; Eichhorn, K.C. An Integrated Approach to Communication Theory and Research, 3rd ed.; Routledge: London, UK, 2009; ISBN 9781351358712. [Google Scholar]
- Fishbein, M.A.; Ajzen, I. Belief, Attitude, Intention and Behaviour: An Introduction to Theory and Research; Addison-Wesley: Reading, MA, USA, 1975. [Google Scholar]
- Chon, K. Understanding Recreational Traveler’s Motivation, Attitude and Satisfaction. Tour. Rev. 1989, 44, 3–7. [Google Scholar] [CrossRef]
- Moutinho, L.; Smith, A. Modelling Bank Customer Satisfaction through Mediation of Attitudes towards Human and Automated Banking. Int. J. Bank Mark. 2000, 18, 124–134. [Google Scholar] [CrossRef]
- Ko, W.-H.; Chiu, C.P. The Relationships Between Brand Attitude, Customers’ Satisfaction and Revisiting Intentions of the University Students—A Case Study of Coffee Chain Stores in Taiwan. J. Foodserv. Bus. Res. 2008, 11, 79–95. [Google Scholar] [CrossRef]
- Lee, T.H. A Structural Model to Examine How Destination Image, Attitude, and Motivation Affect the Future Behavior of Tourists. Leis. Sci. 2009, 31, 215–236. [Google Scholar] [CrossRef]
- Park, N.; Lee, S. College Students’ Motivations for Facebook Use and Psychological Outcomes. J. Broadcast. Electron. Media 2014, 58, 601–620. [Google Scholar] [CrossRef]
- Julian, M.W. The Consequences of Ignoring Multilevel Data Structures in Nonhierarchical Covariance Modeling. Struct. Equ. Model. Multidiscip. J. 2001, 8, 325–352. [Google Scholar] [CrossRef]
- Raudenbush, S.W.; Bryk, A.S. Hierarchical Linear Models: Applications and Data Analysis Methods; SAGE Publications: Thousand Oaks, CA, USA, 2002. [Google Scholar]
- Bryne, B.M. Structural Equation Modeling with EQS: Basic Concepts, Applications, and Programming, 2nd ed.; Lawrence Erlbaum Associates: Mahwah, NJ, USA, 2006. [Google Scholar]
- Bickel, R. Multilevel Analysis for Applied Research: It’s Just Regression; Guilford Press: New York, NY, USA, 2012. [Google Scholar]
- Tabachnick, B.G.; Fidel, L.S. Using Multivariate Statistics, 7th ed.; Pearson: London, UK, 2019. [Google Scholar]
- Dillman, J.E.; Smyth, J.; Christian, L. Internet, Mail, and Mixed-Mode Surveys: The Tailored Design Method, 3rd ed.; John Wiley & Sons, Ltd.: Hoboken, NJ, USA, 2009. [Google Scholar]
- Wimmer, R.D.; Dominick, J.R. Mass Media Research, 4th ed.; Wadsworth Publishing Company: Belmont, CA, USA, 2006. [Google Scholar]
- Kashy, D.A.; Kenny, D.A. The Analysis of Data from Dyads and Groups. In Handbook of Research Methods in Social and Personality Psychology; Reis, H.T., Judd, C.M., Eds.; Cambridge University Press: New York, NY, USA, 2000; pp. 451–477. ISBN1 0-521-55128-5. (Hardcover); ISBN2 0-521-55128-5. (Paperback). [Google Scholar]
- Kenny, D.A.; Kashy, D.A.; Cook, W.L. Dyadic Data Analysis; Guilford: New York, NY, USA, 2006. [Google Scholar]
- Muthén, B.O. Latent Variable Modeling in Heterogeneous Populations. Psychometrika 1989, 54, 557–585. [Google Scholar] [CrossRef]
- Muthén, B.O. Multilevel Factor Analysis of Class and Student Achievement Components. J. Educ. Meas. 1991, 28, 338–354. [Google Scholar] [CrossRef] [Green Version]
- Muthén, B. 10. Latent Variable Modeling of Longitudinal and Multilevel Data. Sociol. Methodol. 1997, 27, 453–480. [Google Scholar] [CrossRef]
- Preacher, K.J.; Zhang, Z.; Zyphur, M.J. Alternative Methods for Assessing Mediation in Multilevel Data: The Advantages of Multilevel SEM. Struct. Equ. Model. Multidiscip. J. 2011, 18, 161–182. [Google Scholar] [CrossRef]
- Bentler, P.M.; Wu, E.J.C. EQS 6.1 for Windows User’s Guide; Multivariate Software, Inc: Encino, CA, USA, 2002; ISBN 1885898045. [Google Scholar]
- Satorra, A.; Bentler, P.M. Corrections to Test Statistics and Standard Errors in Covariance Structure Analysis. In Latent Variables Analysis: Applications for Developmental Research; von Eye, A., Clogg, C.C., Eds.; SAGE Publications, Inc.: Thousand Oaks, CA, USA, 1994; pp. 399–419. [Google Scholar]
- Hair, J.F.; Black, W.C.; Babin, B.J.; Anderson, R.E. Multivariate Data Analysis, 7th ed.; Pearson: London, UK, 2009. [Google Scholar]
- Fornell, C.; Larcker, D.F. Evaluating Structural Equation Models with Unobservable Variables and Measurement Error. J. Mark. Res. 1981, 18, 39–50. [Google Scholar] [CrossRef]
- Fishbein, M. A Behavior Theory Approach to the Relations between Beliefs about an Object and the Attitude toward the Object. In Readings in Attitude Theory and Measurement; Fishbein, M., Ed.; John Wiley & Sons: New York, NY, USA, 1967; pp. 389–400. [Google Scholar]
- Huang, C.Y.; Shen, Y.Z.; Lin, H.X.; Chang, S.S. Bloggers’ Motivations and Behaviors: A Model. J. Advert. Res. 2007, 47, 472–484. [Google Scholar] [CrossRef] [Green Version]
- Curras-Perez, R.; Ruiz-Mafe, C.; Sanz-Blas, S. Determinants of User Behaviour and Recommendation in Social Networks: An Integrative Approach from the Uses and Gratifications Perspective. Ind. Manag. Data Syst. 2014, 114, 1477–1498. [Google Scholar] [CrossRef]
- Wu, W.Y.; Chang, M.L. The Role of Risk Attitude on Online Shopping: Experience, Customer Satisfaction, and Repurchase Intention. Soc. Behav. Personal. 2007, 35, 453–468. [Google Scholar] [CrossRef]
- Katz, E.; Blumler, J.G.; Gurevitch, M. Utilization of Mass Communication by the Individual. In The Uses of Mass Communications: Current Perspectives on Gratification Research; SAGE Publications: Beverly Hills, CA, USA, 1974; pp. 19–32. [Google Scholar]
- Orchard, L.J.; Fullwood, C.; Galbraith, N.; Morris, N. Individual Differences as Predictors of Social Networking. J. Comput.-Mediat. Commun. 2014, 19, 388–402. [Google Scholar] [CrossRef] [Green Version]
- Logan, K. Uses and Gratification That Drive Young Adults’ Smartphone Use and the Implications for Advertising Effectiveness. In Proceedings of the Annual Meeting of the Association for Education in Journalism and Mass Communication, Montreal, QC, Canada, 6–9 August 2014. [Google Scholar]
- Bae, S.J.; Lee, H.; Suh, E.K.; Suh, K.S. Shared Experience in Pretrip and Experience Sharing in Posttrip: A Survey of Airbnb Users. Inf. Manag. 2017, 54, 714–727. [Google Scholar] [CrossRef]
Figure 1.
Conceptual Framework of Interactive e-Tourism Communication.

Figure 2.
Standardized and Unstandardized Coefficients of the Level 1 SEM.

Figure 3.
Standardized and Unstandardized Coefficients of the Level 2 SEM.


Table 1.
Initial and Modified Models Fit Indices of Multilevel Confirmatory Factor Analyses.
| Models | Fit Indices | ||||
|---|---|---|---|---|---|
| x2 (df) | RMSEA | SRMR | CFI | NNFI | |
| Initial Model Value | 2746.758 (1800) | 0.057 | 0.042 | 0.932 | 0.925 |
| Modified Model Value | 2286.358 (1796) | 0.041 | 0.041 | 0.965 | 0.961 |
Table 2.
Factor Loadings, Reliability Coefficients, and AVEs of Modified Multilevel Model.
| Factors and Items | Level 1 | Level 2 | |||||||
|---|---|---|---|---|---|---|---|---|---|
| Loading | Alpha | Rho | AVE | Loading | Alpha | Rho | AVE | ||
| Social Interaction | SOI1 | 0.827 | 0.831 | 0.832 | 0.555 | 0.644 | 0.925 | 0.930 | 0.773 |
| SOI2 | 0.660 | 0.927 | |||||||
| SOI3 | 0.762 | 0.962 | |||||||
| SOI4 | 0.720 | 0.943 | |||||||
| Information | INF1 | 0.806 | 0.886 | 0.887 | 0.611 | 0.925 | 0.938 | 0.939 | 0.757 |
| INF2 | 0.820 | 0.927 | |||||||
| INF3 | 0.834 | 0.895 | |||||||
| INF4 | 0.738 | 0.734 | |||||||
| INF5 | 0.703 | 0.855 | |||||||
| Entertainment | ENT1 | 0.756 | 0.901 | 0.902 | 0.650 | 0.702 | 0.906 | 0.908 | 0.666 |
| ENT2 | 0.826 | 0.713 | |||||||
| ENT3 | 0.704 | 0.848 | |||||||
| ENT4 | 0.923 | 0.829 | |||||||
| ENT5 | 0.805 | 0.962 | |||||||
| Convenience | CON1 | 0.741 | 0.894 | 0.896 | 0.637 | 0.917 | 0.974 | 0.974 | 0.881 |
| CON2 | 0.918 | 0.910 | |||||||
| CON3 | 0.904 | 0.951 | |||||||
| CON4 | 0.711 | 0.959 | |||||||
| CON5 | 0.684 | 0.956 | |||||||
| Affective Attitude | AA1 | 0.814 | 0.942 | 0.942 | 0.804 | 0.960 | 0.989 | 0.989 | 0.949 |
| AA2 | 0.924 | 0.974 | |||||||
| AA3 | 0.953 | 0.989 | |||||||
| AA4 | 0.890 | 0.973 | |||||||
| Cognitive Attitude | CA1 | 0.912 | 0.981 | 0.981 | 0.895 | 0.971 | 0.993 | 0.993 | 0.962 |
| CA2 | 0.962 | 0.968 | |||||||
| CA3 | 0.937 | 0.977 | |||||||
| CA4 | 0.983 | 0.988 | |||||||
| CA5 | 0.955 | 0.994 | |||||||
| CA6 | 0.928 | 0.987 | |||||||
| BehavioralAttitude | BA1 | 0.699 | 0.933 | 0.936 | 0.789 | 0.930 | 0.978 | 0.978 | 0.918 |
| BA2 | 0.889 | 0.939 | |||||||
| BA3 | 0.966 | 0.982 | |||||||
| BA4 | 0.972 | 0.981 | |||||||
| Utilitarian Satisfaction | UTIL1 | 0.725 | 0.863 | 0.864 | 0.614 | 0.886 | 0.964 | 0.964 | 0.871 |
| UTIL2 | 0.759 | 0.979 | |||||||
| UTIL3 | 0.873 | 0.932 | |||||||
| UTIL4 | 0.770 | 0.933 | |||||||
| Hedonic Satisfaction | HED1 | 0.876 | 0.894 | 0.896 | 0.686 | 0.963 | 0.970 | 0.970 | 0.890 |
| HED2 | 0.918 | 0.995 | |||||||
| HED3 | 0.815 | 0.936 | |||||||
| HED4 | 0.684 | 0.877 | |||||||
| Overall Satisfaction | SAT1 | 0.816 | 0.903 | 0.904 | 0.703 | 0.951 | 0.972 | 0.972 | 0.897 |
| SAT2 | 0.769 | 0.935 | |||||||
| SAT3 | 0.914 | 0.921 | |||||||
| SAT4 | 0.847 | 0.981 | |||||||
(See Appendix A).
Table 3.
Correlations Among All Constructs: Level 1 Model.
| AVE | F1 | F2 | F3 | F4 | F5 | F6 | F7 | F8 | F9 | F10 | |
|---|---|---|---|---|---|---|---|---|---|---|---|
| F1 | 0.555 | 0.745 | |||||||||
| F2 | 0.611 | 0.483 | 0.782 | ||||||||
| F3 | 0.650 | 0.642 | 0.448 | 0.806 | |||||||
| F4 | 0.637 | 0.311 | 0.635 | 0.314 | 0.798 | ||||||
| F5 | 0.804 | 0.377 | 0.180 | 0.400 | 0.178 | 0.897 | |||||
| F6 | 0.895 | 0.223 | 0.264 | 0.223 | 0.226 | 0.590 | 0.946 | ||||
| F7 | 0.789 | 0.300 | 0.240 | 0.347 | 0.255 | 0.336 | 0.281 | 0.888 | |||
| F8 | 0.614 | 0.308 | 0.309 | 0.359 | 0.290 | 0.388 | 0.303 | 0.633 | 0.784 | ||
| F9 | 0.686 | 0.485 | 0.201 | 0.490 | 0.204 | 0.598 | 0.273 | 0.543 | 0.618 | 0.828 | |
| F10 | 0.703 | 0.344 | 0.332 | 0.372 | 0.350 | 0.433 | 0.349 | 0.548 | 0.677 | 0.643 | 0.838 |
Table 4.
Correlations Among All Constructs: Level 2 Model.
| AVE | F1 | F2 | F3 | F4 | F5 | F6 | F7 | F8 | F9 | F10 | |
|---|---|---|---|---|---|---|---|---|---|---|---|
| F1 | 0.773 | 0.879 | |||||||||
| F2 | 0.757 | 0.317 | 0.870 | ||||||||
| F3 | 0.666 | 0.654 | 0.462 | 0.816 | |||||||
| F4 | 0.881 | 0.212 | 0.813 | 0.498 | 0.939 | ||||||
| F5 | 0.949 | 0.534 | 0.451 | 0.541 | 0.456 | 0.974 | |||||
| F6 | 0.962 | 0.196 | 0.066 | 0.101 | 0.269 | 0.648 | 0.981 | ||||
| F7 | 0.918 | 0.036 | 0.208 | 0.198 | 0.453 | 0.682 | 0.751 | 0.958 | |||
| F8 | 0.871 | 0.091 | 0.474 | 0.275 | 0.630 | 0.751 | 0.737 | 0.886 | 0.933 | ||
| F9 | 0.890 | 0.384 | 0.419 | 0.452 | 0.436 | 0.833 | 0.512 | 0.644 | 0.698 | 0.943 | |
| F10 | 0.897 | 0.171 | 0.517 | 0.419 | 0.605 | 0.709 | 0.603 | 0.753 | 0.807 | 0.693 | 0.947 |
Note. F1: SOI: Social Interaction; F2: INF: Information; F3: ENT: Entertainment; F4: CON: Convenience; F5: AA: Affective Attitude; F6: CA: Cognitive Affective; F7: BA: Behavioral Attitude; F8: UTIL: Utilitarian Satisfaction; F9: HED: Hedonic Satisfaction; F10: SAT: Overall Satisfaction; “F” indicates Latent Factor.
Table 5.
Results from the Regression and Mediation Analyses for the Level 1 and Level 2 Model.
| Path | Level 1 | Level 2 | ||
|---|---|---|---|---|
| Std Reg. Coeff | z-Value | Std Reg.Coeff | z-Value | |
| Path 1: U&G Motivations (IV) → Attitude (DV) | 0.380 | 6.003 * | 0.791 | 5.049 * |
| Path 2: Attitude (IV) → e-Tourist Satisfaction (DV) | 0.486 | 6.037 * | 0.992 | 1.248 |
| Path 3: U&G Motivations (IV) → Attitude (MV) → e-Tourist Satisfaction (DV) | 0.185 | 4.266 * | 0.785 | 1.211 |
| Path 4: U&G Motivations (IV) → e-Tourist Satisfaction (DV) | 0.369 | 5.945 * | −0.056 | −0.089 |
Note. IV: Independent Variable; DV: Dependent Variable; MV: Mediating Variable. * p-value is significant at the 0.05 level (2-tailed).
Table 6.
Results from the Three Path Relations for the Level 1 and Level 2 Mediation Model.
| Path | Level 1 | Level 2 | ||
|---|---|---|---|---|
| Std Reg. Coeff | z-Value | Std Reg. Coeff | z-Value | |
| Path 1: Social Interaction─ U&G Motivations→Attitude→e-Tourist Satisfaction | 0.1117 | 3.96 * | 0.668 | 1.16 |
| Path 2: Information─ U&G Motivations→Attitude→e-Tourist Satisfaction | 0.1603 | 4.37 * | 0.474 | 0.98 |
| Path 3: Entertainment─ U&G Motivations→Attitude→e-Tourist Satisfaction | 0.1173 | 2.92 * | 0.678 | 1.18 |
| Path 4: Convenience─ U&G Motivations→Attitude→e-Tourist Satisfaction | 0.1422 | 2.98 * | 0.452 | 0.98 |
Note. * p-value is significant at the 0.05 level.
Publisher’s Note: MDPI stays neutral with regard to jurisdictional claims in published maps and institutional affiliations. |
© 2022 by the authors. Licensee MDPI, Basel, Switzerland. This article is an open access article distributed under the terms and conditions of the Creative Commons Attribution (CC BY) license (https://creativecommons.org/licenses/by/4.0/).
Share and Cite
MDPI and ACS Style
Moon, J.-W.; An, Y. Uses and Gratifications Motivations and Their Effects on Attitude and e-Tourist Satisfaction: A Multilevel Approach. Tour. Hosp. 2022, 3, 116-136. https://0-doi-org.brum.beds.ac.uk/10.3390/tourhosp3010009
AMA Style
Moon J-W, An Y. Uses and Gratifications Motivations and Their Effects on Attitude and e-Tourist Satisfaction: A Multilevel Approach. Tourism and Hospitality. 2022; 3(1):116-136. https://0-doi-org.brum.beds.ac.uk/10.3390/tourhosp3010009
Chicago/Turabian StyleMoon, Jang-Won, and Yuting An. 2022. "Uses and Gratifications Motivations and Their Effects on Attitude and e-Tourist Satisfaction: A Multilevel Approach" Tourism and Hospitality 3, no. 1: 116-136. https://0-doi-org.brum.beds.ac.uk/10.3390/tourhosp3010009