Communication

The Granular Size Concept in Avian Ecology: A Critical Analysis of eBird Data Bias Using the Bird Rank Abundance Distribution

1
Department of Economics, Federal University of Santa Catarina, Florianopolis 88049-970, SC, Brazil
2
Department of Statistics, University of Brasilia, Brasilia 70910-900, DF, Brazil
*
Author to whom correspondence should be addressed.
Submission received: 31 October 2023 / Revised: 22 November 2023 / Accepted: 23 November 2023 / Published: 27 November 2023

Abstract

:

Simple Summary

Using eBird citizen science data, researchers identified power law patterns in bird abundance rankings. This study examines the concept of “granular size” related to these patterns, and determined 13 specific species to be the granular size. The granular size of the bird rank abundance distribution might have something to do with the number of species, which, like big businesses in an economy, have a disproportionately big effect on their environment. However, keep in mind that these species may be considered special simply because they were all discovered in cities.

Abstract

In previous studies using eBird citizen data, bird abundance rankings followed a power law distribution. Our research delves into the “granular size” concept within these power laws, likening birds to firms. We identified 13 bird species as being the granular size, representing species with significant ecosystem impact, akin to major corporations in an economy. In particular, these species are urban, raising concerns about the eBird database’s sampling bias. Using the economic concept of granular size, we argue that the eBird database may be inherently unreliable.

1. Introduction

Birds play a pivotal role in our ecosystems, offering insights into broader ecological dynamics and health. With the advent of modern technology, citizen science data, like the eBird app, have revolutionized the way we study and understand avian populations [1,2,3,4,5,6,7,8,9,10]. Although recent studies have tapped into this wealth of data to estimate the abundance of nearly 92% of all avian populations [11], questions persist about the accuracy and representativeness of such databases [12,13,14].
While the extensive eBird dataset has shed light on the abundance and distribution of several bird species [11,15], its inherent bias towards urban environments raises concerns [5]. The predilection of bird enthusiasts to document sightings primarily in urban areas might obscure the true picture of avian diversity and the impacts of urbanization. Such biases may have far-reaching implications, especially when considering species with more restricted distributions outside urban zones or outside the Americas, like the Ring-billed Gull (Larus delawarensis).
The power laws identified in rank abundance distribution from these datasets [15] further underline the need for a critical examination. While power laws can emerge even in scattered datasets [15], it is essential to evaluate the validity and reliability of eBird’s data. Our study dives deep into these concerns, probing the quality of the eBird database, especially with the intriguing concept of granular size [16].
One recent study in particular [11] harnessed the latest influx of citizen science data to estimate the abundance of 9700 bird species, encompassing approximately 92% of all avian populations. By amalgamating data from the eBird app and 724 well-studied species, the authors employed an algorithm to extrapolate sample estimates. Their findings unveiled numerous species with limited populations confined to niche habitats, along with a select few species distributed across vast areas. Within the rank abundance distribution, three separate power laws were identified using the same dataset: one for the top four species, another for abundant species beyond the top four, and a third for rare species [15].
The objective of this paper is to assess the accuracy and biases of the eBird database, particularly focusing on the impact of granular size on bird species representation. Based on existing literature [5], we hypothesize that the eBird database has urban-biased misrepresentations, affecting accurate estimates of bird species abundance. Datasets from eBird and similar large-scale volunteer projects [10] often face challenges like spatial bias, varying effort, and species-reporting bias [5]. Building on this, we present a strong case that the eBird database is flawed, drawing on the granular size concept from economics.

2. Materials and Methods

A power law describes a situation where the probability of a certain value is inversely related to that value raised to a specific power. In simple terms, if one quantity changes, the other changes in a predictable proportion, no matter the starting point. On a log–log graph, a power law shows as a straight line. The steepness of this line, or its slope, is termed the Pareto exponent [17]. Most distributions do not follow a power law across their whole range. Instead, a power law typically applies within specific limits: from a minimum to a maximum value. This leads to what is known as a power law tail in the distribution [18]. The Pareto exponent is a key measure in this context. It is an index that gauges the “heaviness” or thickness of the distribution’s right tail. The lower the Pareto exponent, the heavier the tail [19].
Da Silva and Matsushita [15] have previously studied the change in Pareto exponents as the x most abundant species are progressively removed. Their diagram of this, shown in their Figure 2, shows the shift in exponents after removing the top two (x = 2), three (x = 3), and so forth [15]. The exercise was designed to assess the effect of the Pareto exponent α on the remaining top four species. They discovered that these exponents alternate between light-tailed ( α > 2 ) and heavy-tailed distributions ( α < 2 ). The Gaussian distribution is represented by α = 2 .
What is the Pareto exponent value when we do not limit our view to just the remaining top four species? Figure 1 depicts the scenario from the aforementioned paper [15] with K = 4 largest grains, along with two other cases for K = 7 and K = 13. We determined the correct K for analysis, defined below as the granular size.
For K values between 4 and 12, some Pareto exponents exceed 2. But from K = 13 onward, all Pareto exponents are below 2, indicating no variance. Could K = 13 be the granular size?
We draw a parallel between economics’ concept of granularity and a comparison of firms to birds. The granular hypothesis suggests that a few large companies impact the economy alongside many smaller ones, countering the notion that individual firm effects average out [20]. This mirrors firm size distributions following a power law [21]. The “granular residual” aggregates shocks from the largest firms, weighted by size. Failing to adjust for the correct number of large firms can misrepresent this residual [16].
One method used to determine the granular size contrasts a weighted curve of uneven firm rankings with a curve assuming all firms are of equal size [16]. Similarly, for bird rank abundance distributions following power laws [15], we introduce a method. This method calculates the granular size by comparing uneven bird species rankings to a simulated Gaussian curve that represents an even distribution of species.

3. Analysis, Results, and Discussion

Figure 2 plots the natural log of bird species abundance against the natural log of bird species rank, with ln(13) distinctly highlighted by a horizontal line. This suggests that K = 13 bird species is the granular size for the abundance distribution.
Table 1 displays the special 13 bird species and their decay rates of abundance. In a hypothetical Gaussian distribution with equally abundant bird species, decay rates would center around zero. This contrasts with the observed power law distribution.
To determine the granular size, we use the following steps: (1) Simulate 50 series, each with 10,000 values (akin to the number of bird species in our sample) from a standardized normal distribution. (2) Rank these simulated values. (3) Calculate the decay rate between successive grain ranks (e.g., rank 1 to rank 2, rank 2 to rank 3) as shown in Table 1. (4) Compute the mean and standard deviation of these decay rates across all 50 series. (5) For each average decay rate between positions n and n + 1, determine a range: one standard deviation above and below. (6) Assess the decay rate based on bird rank.
Figure 3 presents the results: the x-axis represents the largest grains K and the y-axis shows the decay rates. The blue line shows the decay rate of abundance, while the black and red lines represent the upper and lower boundaries of the standard deviation, respectively.
We anticipate the granular size to be where the decay rate aligns with a Gaussian distribution. This means the decay rate consistently stays within the range set by the standardized normal distribution for a given rank. Figure 3 indicates this occurs between the fourteenth and fifteenth largest grains. Thus, the granular size is 13, as from K = 14 onwards, the decay rate follows a Gaussian-like distribution.
Species abundance is shaped by various ecological processes [22]. The weight of the tail in the rank abundance distribution can signal an ecosystem’s health and shed light on species interactions [15]. Therefore, it is vital to evaluate the data suggesting a granular size of 13 bird species.
In economics, the granular hypothesis suggests that a few large companies have a significant impact on the economy. This idea counters the traditional belief that individual firm effects will average out. This distribution of firm sizes, where a few large firms have disproportionate influence, follows a power law distribution. In this context, the granular residual is a way of aggregating shocks from the largest firms, with the effects weighted by their size. If we do not account for the correct number of influential firms, this residual might be misrepresented.
Drawing a parallel to the bird abundance distribution, the fact that K = 13 bird species is the granular size for the rank abundance distribution can be interpreted in a similar manner. Here, these 13 bird species might have a disproportionately large impact on the ecosystem compared to others, in the same way that a few large firms can have a disproportionate effect on the economy. Just as failing to adjust for the correct number of influential firms can misrepresent the granular residual, not accounting for these 13 key bird species might misrepresent certain ecological metrics or effects within the bird abundance distribution. Our study shows that when K ≥ 13, all Pareto exponents are below 2, which means there is no variance. This underscores the significant impact of the special 13.
In essence, the granular size in the bird rank abundance distribution, in connection with the ecology literature, could refer to the number of species that, like influential firms in an economy, have a disproportionately large impact on their ecosystem.
To verify the robustness of our findings, we provided ChatGPT with the special 13 species to identify shared characteristics. We then did the same with the next 13 species. Finally, we asked ChatGPT to differentiate between the two groups based on a unique characteristic. The result: the first group mainly inhabits urban and suburban areas, whereas the second group occupies diverse habitats such as wetlands, forests, grasslands, and coasts. This indicates greater ecological diversity and adaptability in the second group compared to the urban-centric first group. This finding suggests that the special 13 may be more artifact than fact, potentially due to sampling bias favoring urban bird sightings.
Our findings highlight biases in the eBird database, primarily due to its urban-centric data collection. This aligns with concerns raised by those who noted the potential for skewed data in citizen science projects due to uneven geographic coverage and participant effort [5]. To mitigate these biases, several strategies could be employed: (1) Integrating data from multiple citizen science platforms and professional surveys can provide a more balanced view [14]. This approach could reduce the urban bias evident in eBird data. (2) Encouraging more rural data collection can help balance the urban-heavy data. Incentivizing birdwatchers to document species in less-populated areas could be a practical approach. (3) Sophisticated analytical methods could be used to correct for known biases in citizen science data. Machine learning algorithms and statistical models that account for sampling effort and geographic biases could refine the data quality [13,23,24]. (4) Aligning citizen science data with ongoing ecological research [11] could ensure that data collection is more targeted and scientifically valuable. This collaboration can guide data collection efforts to fill gaps in current knowledge. (5) Providing training and educational resources to citizen scientists [12,14] can improve the accuracy and reliability of the data collected. This includes training in species identification and data recording standards. (6) Periodic reviews and quality checks of the database [4] can help identify and correct biases. This ongoing process ensures the reliability and validity of the data. Interestingly, the advice to use a hierarchical modeling framework to explicitly characterize the sampling process and account for bias [13] was exactly what our work did.

4. Conclusions

The bird species’ rank abundance distribution adheres to power laws, deviating from a Gaussian distribution. This was determined using combined data from the eBird app and established species studies. While power laws appear even in incomplete datasets, the related idea of granular size brings the data’s reliability into question. The granular size concept, borrowed from economics, substitutes firms with birds in this analysis.
In this dataset, the granular size for rank abundance distribution is 13 bird species. The granular size could relate to the number of species that, like influential corporations in an economy, have a disproportionately big impact on their ecosystem. However, this special 13 could be an artifact, possibly influenced by a sampling bias towards urban bird sightings.

Author Contributions

Conceptualization, S.D.S.; methodology, S.D.S., R.M. and L.E.; software, R.M. and L.E.; validation, S.D.S.; formal analysis, R.M. and L.E.; investigation, S.D.S., R.M. and L.E.; resources, S.D.S. and R.M.; data curation, S.D.S.; writing—original draft preparation, S.D.S.; writing—review and editing, S.D.S.; visualization, R.M. and L.E.; supervision, R.M.; project administration, S.D.S.; funding acquisition, S.D.S., R.M. and L.E. All authors have read and agreed to the published version of the manuscript.

Funding

This work is supported by the CNPq [Grant number: PQ 2 301523/2019 3]; Capes [Grant number: PPG 001]; and FAP DF [Grant number: 1229/2016].

Institutional Review Board Statement

Not applicable.

Data Availability Statement

Conflicts of Interest

The authors declare no conflict of interest. The funders had no role in the design of the study, in the collection, analyses, or interpretation of data, in the writing of the manuscript, or in the decision to publish the results.

References

  1. Horns, J.J.; Adler, F.R.; Sekercioglu, C.H. Using opportunistic citizen science data to estimate avian population trends. Biol. Conserv. 2018, 221, 151–159. [Google Scholar] [CrossRef]
  2. Neate-Clegg, M.H.C.; Horns, J.J.; Adler, F.R.; Aytekin, M.C.K.; Sekercioglu, C.H. Monitoring the world’s bird populations with community science data. Biol. Conserv. 2020, 248, 108653. [Google Scholar] [CrossRef]
  3. Walker, J.; Taylor, P.D. Using eBird data to model population change of migratory bird species. Avian Conserv. Ecol. 2017, 12, 4. [Google Scholar] [CrossRef]
  4. Fink, D.; Auer, T.; Johnston, A.; Ruiz-Gutierrez, V.; Hochachka, W.M.; Kelling, S. Modeling avian full annual cycle distribution and population trends with citizen science data. Ecol. Appl. 2020, 30, e02056. [Google Scholar] [CrossRef]
  5. Johnston, A.; Hochachka, W.M.; Strimas-Mackey, M.E.; Ruiz Gutierrez, V.; Robinson, O.J.; Miller, E.T.; Auer, T.; Kelling, S.T.; Fink, D. Analytical guidelines to increase the value of community science data: An example using eBird data to estimate species distributions. Divers. Distrib. 2021, 27, 1265–1277. [Google Scholar] [CrossRef]
  6. Sullivan, B.L.; Wood, C.L.; Iliff, M.J.; Bonney, R.E.; Fink, D.; Kelling, S. eBird: A citizen-based bird observation network in the biological sciences. Biol. Conserv. 2009, 142, 2282–2292. [Google Scholar] [CrossRef]
  7. Walker, J.; Taylor, P.D. Evaluating the efficacy of eBird data for modeling historical population trajectories of North American birds and for monitoring populations of boreal and Arctic breeding species. Avian Conserv. Ecol. 2020, 15, 10. [Google Scholar] [CrossRef]
  8. Sullivan, B.L.; Aycrigg, J.L.; Barry, J.H.; Bonney, R.E.; Bruns, N.; Cooper, C.B.; Damoulas, T.; Dhondt, A.A.; Dietterich, T.; Farnsworth, A.; et al. The eBird enterprise: An integrated approach to development and application of citizen science. Biol. Conserv. 2014, 169, 31–40. [Google Scholar] [CrossRef]
  9. Schubert, S.C.; Manica, L.T.; Guaraldo, A.D.C. Revealing the potential of a huge citizen-science platform to study bird migration. Emu 2019, 119, 364–373. [Google Scholar] [CrossRef]
  10. Tubelis, D.P. Spatiotemporal distribution of photographic records of Brazilian birds available in the WikiAves citizen science database. Birds 2023, 4, 28–45. [Google Scholar] [CrossRef]
  11. Callaghan, C.T.; Nakagawa, S.; Cornwell, W.K. Global abundance estimates for 9700 bird species. Proc. Natl. Acad. Sci. USA 2021, 118, e2023170118. [Google Scholar] [CrossRef] [PubMed]
  12. Hochachka, W.M.; Fink, D.; Hutchinson, R.A.; Sheldon, D.; Wong, W.K.; Kelling, S. Data-intensive science applied to broad-scale citizen science. Trends Ecol. Evol. 2012, 27, 130–137. [Google Scholar] [CrossRef] [PubMed]
  13. Bird, T.J.; Bates, A.E.; Lefcheck, J.S.; Hill, N.A.; Thomson, R.J.; Edgar, G.J.; Stuart-Smith, R.D.; Wotherspoon, S.; Krkosek, M.; Stuart-Smith, J.F.; et al. Statistical solutions for error and bias in global citizen science datasets. Biol. Conserv. 2014, 173, 144–154. [Google Scholar] [CrossRef]
  14. Kelling, S.; Johnston, A.; Bonn, A.; Fink, D.; Ruiz-Gutierrez, V.; Bonney, R.; Fernandez, M.; Hochachka, W.M.; Julliard, R.; Kraemer, R.; et al. Using semistructured surveys to improve citizen science data for monitoring biodiversity. Bioscience 2019, 69, 170–179. [Google Scholar] [CrossRef] [PubMed]
  15. Da Silva, S.; Matsushita, R. Power laws govern the abundance distribution of birds by rank. Birds 2023, 4, 171–178. [Google Scholar] [CrossRef]
  16. Blanco-Arroyo, O.; Ruiz-Buforn, A.; Vidal-Tomas, D.; Alfarano, S. On the determination of the granular size of the economy. Econ. Lett. 2018, 173, 35–38. [Google Scholar] [CrossRef]
  17. Clauset, A.; Shalizi, C.R.; Newman, M.E. Power-law distributions in empirical data. SIAM Rev. 2009, 51, 661–703. [Google Scholar] [CrossRef]
  18. Newman, M.E.J. Power laws, Pareto distributions and Zipf’s law. Contemp. Phys. 2005, 46, 323–351. [Google Scholar] [CrossRef]
  19. Jenkins, S.P. Pareto models, top incomes and recent trends in UK income inequality. Economica 2017, 84, 261–289. [Google Scholar] [CrossRef]
  20. Gabaix, X. The granular origins of aggregate fluctuations. Econometrica 2011, 79, 733–772. [Google Scholar]
  21. Esquierro, L.; Da Silva, S. Granular inflation spillovers. J. Econ. Stud. 2023, 50, 1226–1244. [Google Scholar] [CrossRef]
  22. McGill, B.J.; Etienne, R.S.; Gray, J.S.; Alonso, D.; Anderson, M.J.; Benecha, H.K.; Dornelas, M.; Enquist, B.J.; Green, J.L.; He, F.; et al. Species abundance distributions: Moving beyond single prediction theories to integration within an ecological framework. Ecol. Lett. 2007, 10, 995–1015. [Google Scholar] [CrossRef] [PubMed]
  23. Schneider, S.; Taylor, G.W.; Kremer, S.C. Deep learning object detection methods for ecological camera trap data. In Proceedings of the 2018 15th Conference on Computer and Robot Vision (CRV), Toronto, ON, Canada, 8–10 May 2018; Volume 1, pp. 1–8. [Google Scholar]
  24. Zhang, S.; Zhao, Z.; Xu, Z.; Bellisario, K.; Pijanowski, B.C. Automatic bird vocalization identification based on fusion of spectral pattern and texture features. In Proceedings of the 2018 IEEE International Conference on Acoustics, Speech and Signal Processing (ICASSP), Calgary, AB, Canada, 15–20 April 2018. [Google Scholar]
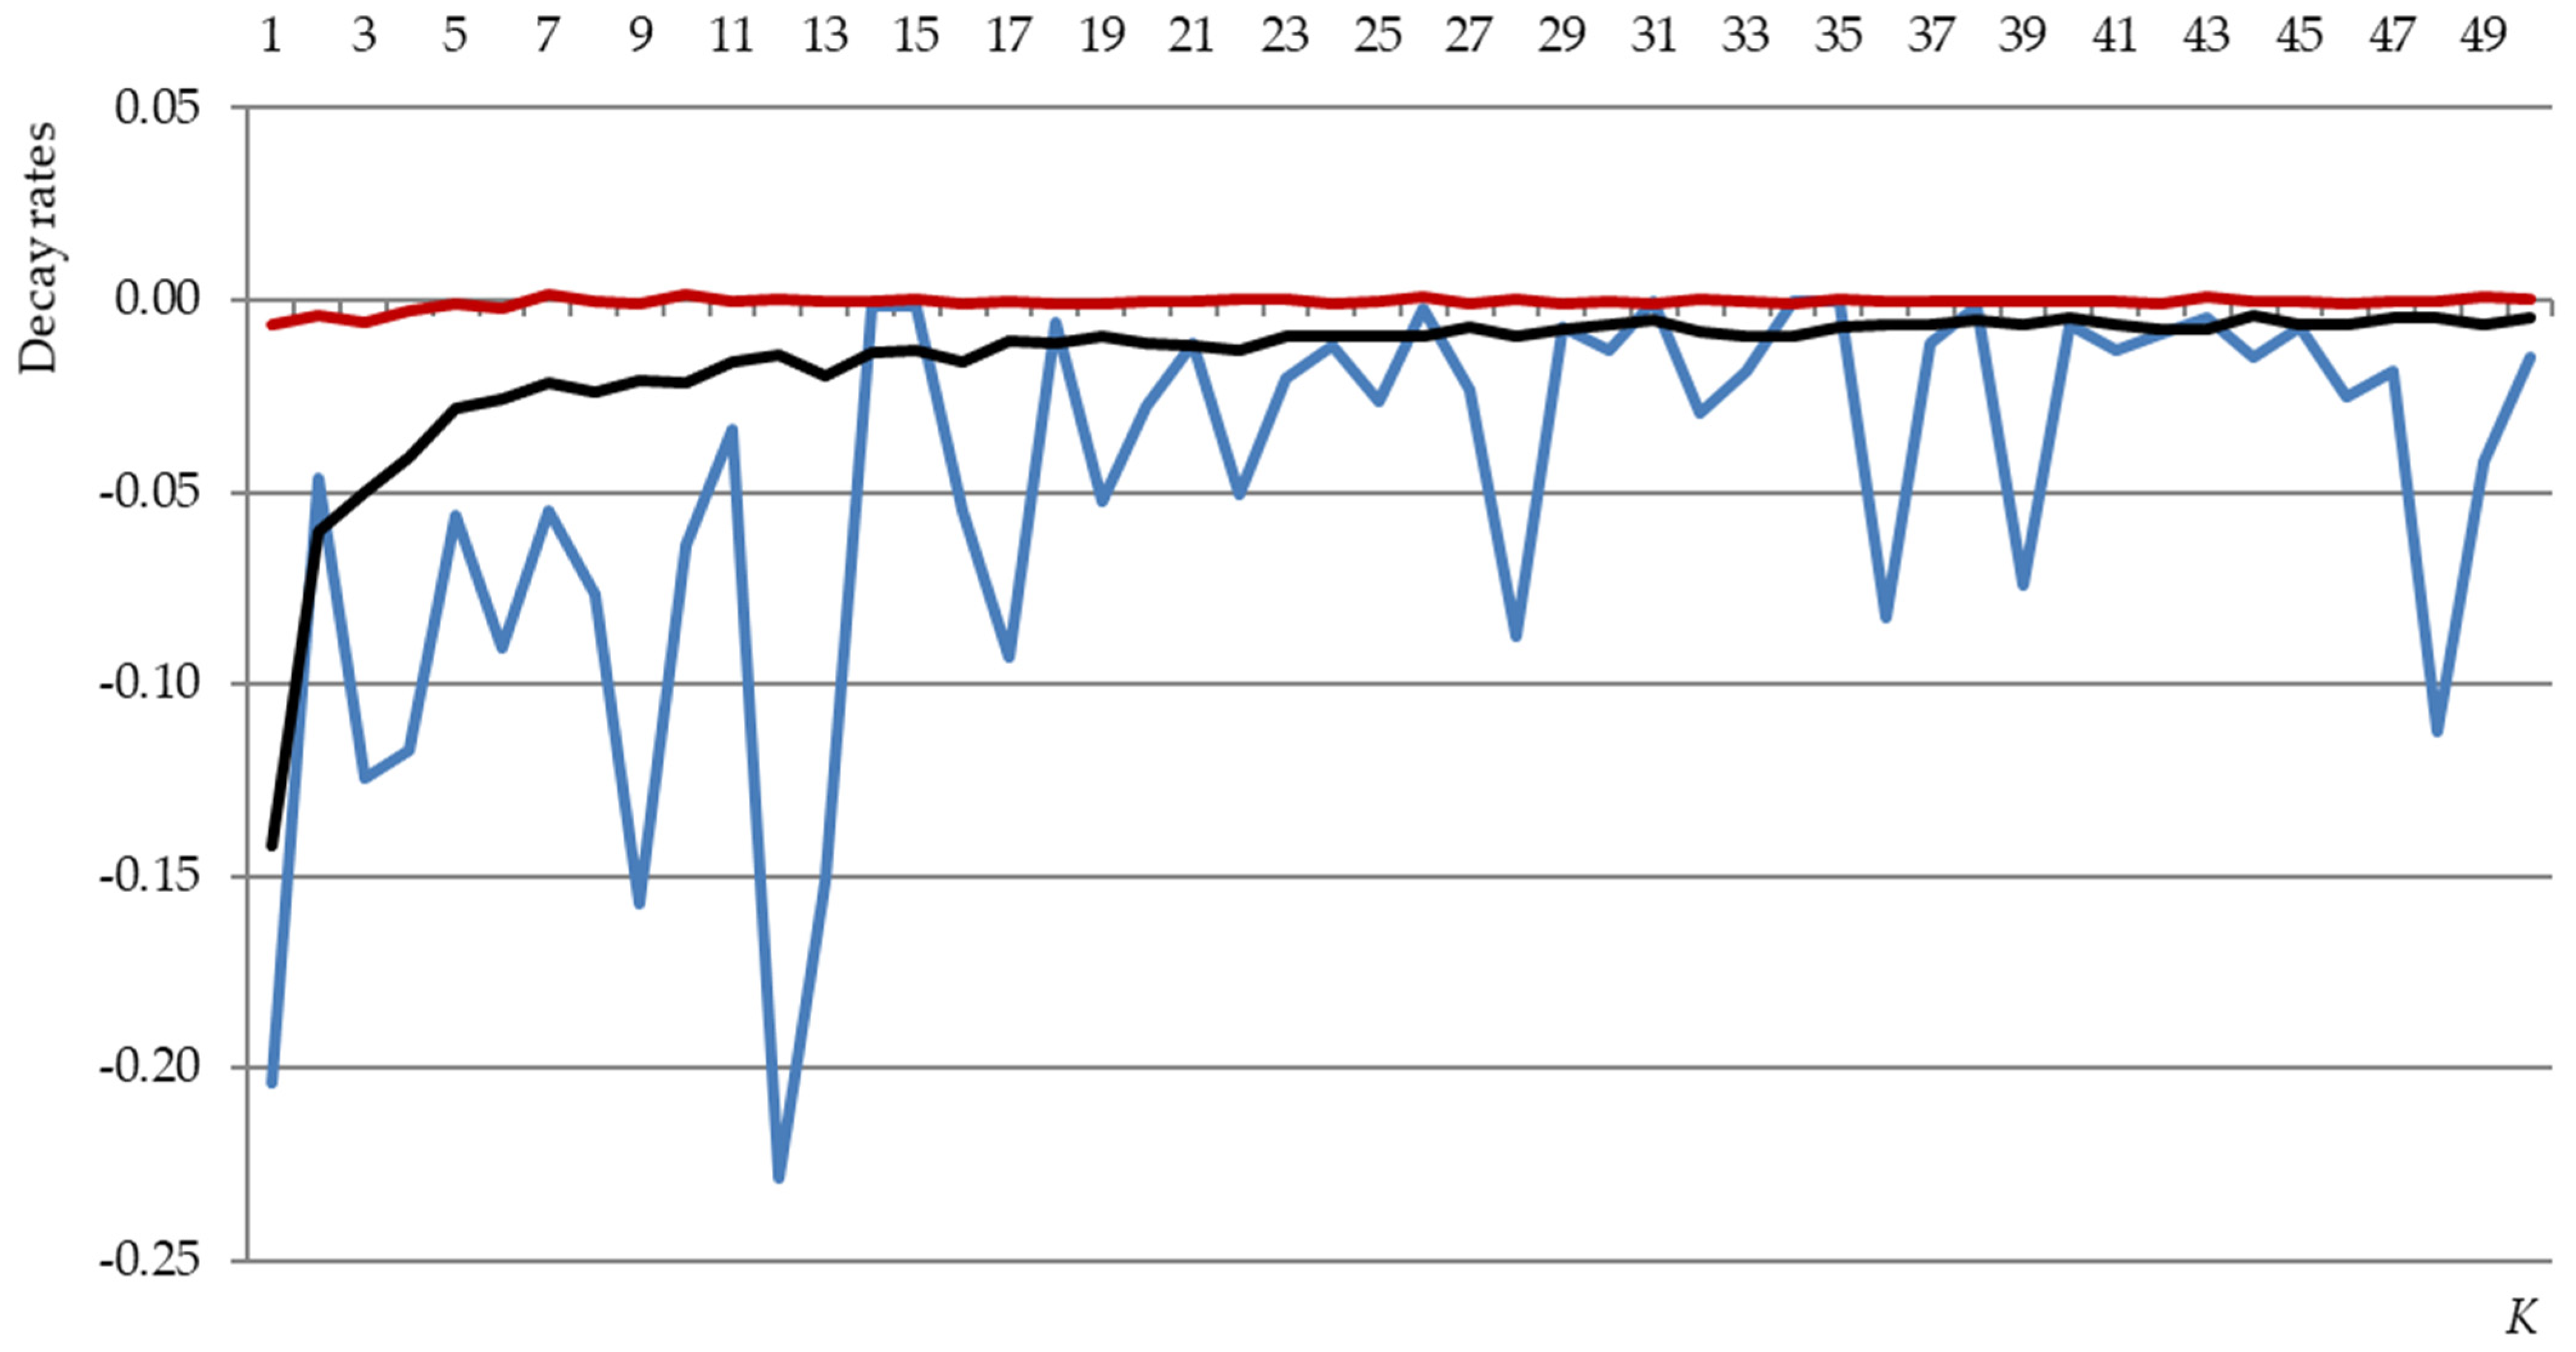
Figure 1. Pareto exponent α values (vertical axis) for different large grains K (horizontal axis).
Birds 04 00028 g001
Figure 2. This figure shows the natural log of bird species abundance plotted against the natural log of bird species rank. A horizontal line highlights ln(13), making the special 13 bird species distinctly visible.
Birds 04 00028 g002
Figure 3. This figure plots various largest grains K on the horizontal axis against decay rates on the vertical axis. The blue line represents the decay rate of abundance, while the black and red lines mark the upper and lower limits of standard deviations, respectively.
Birds 04 00028 g003
Table 1. Abundance and decay rates of the special 13 bird species.
RankThe Special 13AbundanceDecay Rate
1House Sparrow1,618,744,682-
2European Starling1,288,846,040−0.2038
3Ring-Billed Gull1,229,072,620−0.0464
4Barn Swallow1,076,122,004−0.1244
5Glaucous Gull949,879,030−0.1173
6Alder Flycatcher896,919,155−0.0557
7Black-Legged Kittiwake815,654,031−0.0906
8Horned Lark770,962,832−0.0548
9Sooty Tern711,704,137−0.0769
10Savannah Sparrow599,661,514−0.1574
11American Robin561,290,332−0.0640
12Blue-Gray Gnatcatcher542,518,652−0.0334
13Red-Winged Blackbird418,284,484−0.2290
Note: The decay rate column is calculated by comparing the abundance of each bird species to the species ranked immediately higher, as shown in the abundance column. In a scenario where all bird species have equal abundance, a normal distribution with decay rates around zero is expected. However, the nonzero decay rates we observe indicate a power law distribution instead.
Disclaimer/Publisher’s Note: The statements, opinions and data contained in all publications are solely those of the individual author(s) and contributor(s) and not of MDPI and/or the editor(s). MDPI and/or the editor(s) disclaim responsibility for any injury to people or property resulting from any ideas, methods, instructions or products referred to in the content.

