Article

The Clinical and Biological Effects of PD-1 Expression on Tumor Cells in Diffuse Large B-Cell Lymphoma

1
Division of Hematology, Department of Internal Medicine, School of Medicine, Aichi Medical University, 1-1, Karimata, Yazako, Nagakute 480-1195, Japan
2
Research Creation Support Center, Aichi Medical University, 1-1, Karimata, Yazako, Nagakute 480-1195, Japan
3
Department of Tumor Immunology, School of Medicine, Aichi Medical University, 1-1, Karimata, Yazako, Nagakute 480-1195, Japan
4
Department of Biochemistry, School of Medicine, Aichi Medical University, 1-1, Karimata, Yazako, Nagakute 480-1195, Japan
5
Department of Surgical Pathology, School of Medicine, Aichi Medical University, 1-1, Karimata, Yazako, Nagakute 480-1195, Japan
6
Department of Nephrology and Rheumatology, School of Medicine, Aichi Medical University, 1-1, Karimata, Yazako, Nagakute 480-1195, Japan
7
Department of Pharmacy, Aichi Medical University Hospital, 1-1, Karimata, Yazako, Nagakute 480-1195, Japan
*
Author to whom correspondence should be addressed.
Submission received: 8 May 2021 / Revised: 22 May 2021 / Accepted: 3 June 2021 / Published: 7 June 2021
(This article belongs to the Section Lymphomas)

Abstract

:
The clinical and biological significance of programmed death-1 (PD-1) expression by B-lymphoma cells is largely unknown. Here, using multicolor immunofluorescent staining (MC-IF), we investigated PD-1 and PD-L1 expression in PAX5+ (B-lymphoma), CD68+ (macrophage), or CD3+ (T-cell) cells in formalin-fixed, paraffin-embedded samples of 32 consecutive patients with de novo diffuse large B-cell lymphoma (DLBCL) treated with rituximab plus chemotherapy. PD-1- and PD-L1-expressing PAX5+ cells were observed in 59% and 3% of the patients, respectively. PD-1-expressing CD3+ lymphocytes and PD-L1-expressing CD68+ macrophages were observed in 89% and 86% of the patients, respectively. PD-L1 expression on PAX5+ lymphoma cells or CD68+ macrophages and PD-1 expression on CD3+ lymphocytes were not correlated with prognosis. However, patients with PD-1 expression on lymphoma cells showed shorter progression-free survival than those lacking PD-1-expressing lymphoma cells (p = 0.033). Furthermore, genetically modified PD-1-knockout human B-lymphoma VAL cells showed reduced cell growth and migration, and decreased S6 kinase phosphorylation than VAL/mock cells. Our data suggest that PD-1 expression on DLBCL cells detected by MC-IF was associated with poor prognosis and cell-intrinsic PD-1 signaling was related with cell growth and migration in a subpopulation of B-cell lymphoma. These findings may allow the development of distinct DLBCL subtypes affecting prognosis.

Graphical Abstract

1. Introduction

The programmed death-1 (PD-1) is an immune checkpoint (IC) molecule and a cell surface receptor expressed mainly on immune cells, such as activated T-cells [1,2]. PD-1 binds its ligands, PD-L1 and/or PD-L2, and transduces an immunosuppressive signal in activated T-cells. The immune-inhibitory function of PD-1 is involved in the development of immune tolerance, thereby reducing the possibility of self-attack on tumor cells expressing PD-L1 and/or PD-L2 via host cytotoxic T-cells (CTLs) expressing PD-1 [2]. Meanwhile, recent studies have reported that PD-1 is expressed on the surface of tumor cells, and its intrinsic tumor cell signal may enhance cell growth in melanoma and lung cancer [3,4]. In diffuse large B-cell lymphoma (DLBCL), PD1 and PD-L1 are occasionally expressed by lymphoma cells and infiltrating immune cells, respectively [5,6]. However, information regarding the clinical and biological significance of PD-1 expression on lymphoma cells in DLBCL is limited [6,7,8].
DLBCL is the most common type of lymphoma and is biologically and clinically heterogeneous. More than 60% of patients with DLBCL survive for more than 5 years after treatment with standard immunochemotherapies such as rituximab, doxorubicin, cyclophosphamide, vincristine, and prednisone (R-CHOP). The remaining patients show poor prognosis, leading to the investigation of new treatment strategies such as IC blockage. Recent clinical trials examining the effect of anti-PD-1 antibody (nivolumab) in patients with relapsed/refractory DLBCL have shown a response rate of approximately 10% [9]. The reasons for the lower efficacy of PD-1 blockage therapies in DLBCL are largely unknown.
Nonetheless, PD-1 blockage therapy has substantially improved patient response rate and survival in several cancers compared to conventional chemotherapy. However, the therapeutic response differs among cancers, and accurate predictive biomarkers for this response are not available [10]. In addition, some patients have shown rapid disease progression upon receiving IC blockade therapies [11,12]. Investigation of the relationship between the treatment outcomes of PD-1 blockage therapy and the precise expression pattern of IC molecules in tumor and immune cells in the tumor microenvironment (TME) may resolve these issues, ideally by using patient tissue samples.
Multicolor immunofluorescent staining (MC-IF) is used for determining the co-expression of multiple antigens in the same tissue sample [13,14,15]. In particular, in DLBCL, PD-1 and PD-L1 can be expressed by lymphoma cells and infiltrating immune cells in the TME, respectively. MC-IF can easily distinguish cell lineage-specific expression of these IC molecules.
Many studies have investigated PD-1 expression detected via conventional immunohistochemistry (IHC) based on a chromogenic reaction in DLBCL patient samples. However, most studies have focused on PD-1 expression in the TME rather than on lymphoma cells. Some studies reported that PD-1 was weakly or infrequently expressed by lymphoma cells in DLBCL [16,17]. The prevalence and clinical function of PD-1 expression on lymphoma and immune cells in the TME is still controversial [5,6,7,18] Furthermore, to the best of our knowledge, the effect of PD-1 expression on cell function and comprehensive gene expression in human B-cell lymphoma cells has not been reported.
In this study, using MC-IF, we investigated PD-1 and PD-L1 expression in lymphoma cells and infiltrating immune cells in formalin-fixed, paraffin-embedded (FFPE) de novo DLBCL patient samples. Furthermore, using genome editing with the CRISPR-Cas9 system, we investigated the effect of PD-1 expression on cell growth, migration, cellular signaling, gene expression profiling, and effects of an anti-PD-1 antibody, nivolumab, in a human B-lymphoma cell line. Our study is expected to provide novel insights into the pathology of de novo DLBCL and assist with the development of potential biomarkers for future treatments involving optimal IC blockage.

2. Results

2.1. Patient Characteristics

The characteristics of 32 patients with de novo DLBCL enrolled in this study are summarized in Table 1. None of the patients had previously received chemotherapy, radiation therapy, immunotherapy, or immunosuppressive therapy, and none had positive results for human immunodeficiency virus infection. Eighty-four percent of the patients were over 60 years of age, 63% were males, 59% were patients at an advanced clinical stage, and 66% were non-germinal center type patients. The clinical parameters of the study participants were similar to those found in the standard profile of patients with de novo DLBCL.

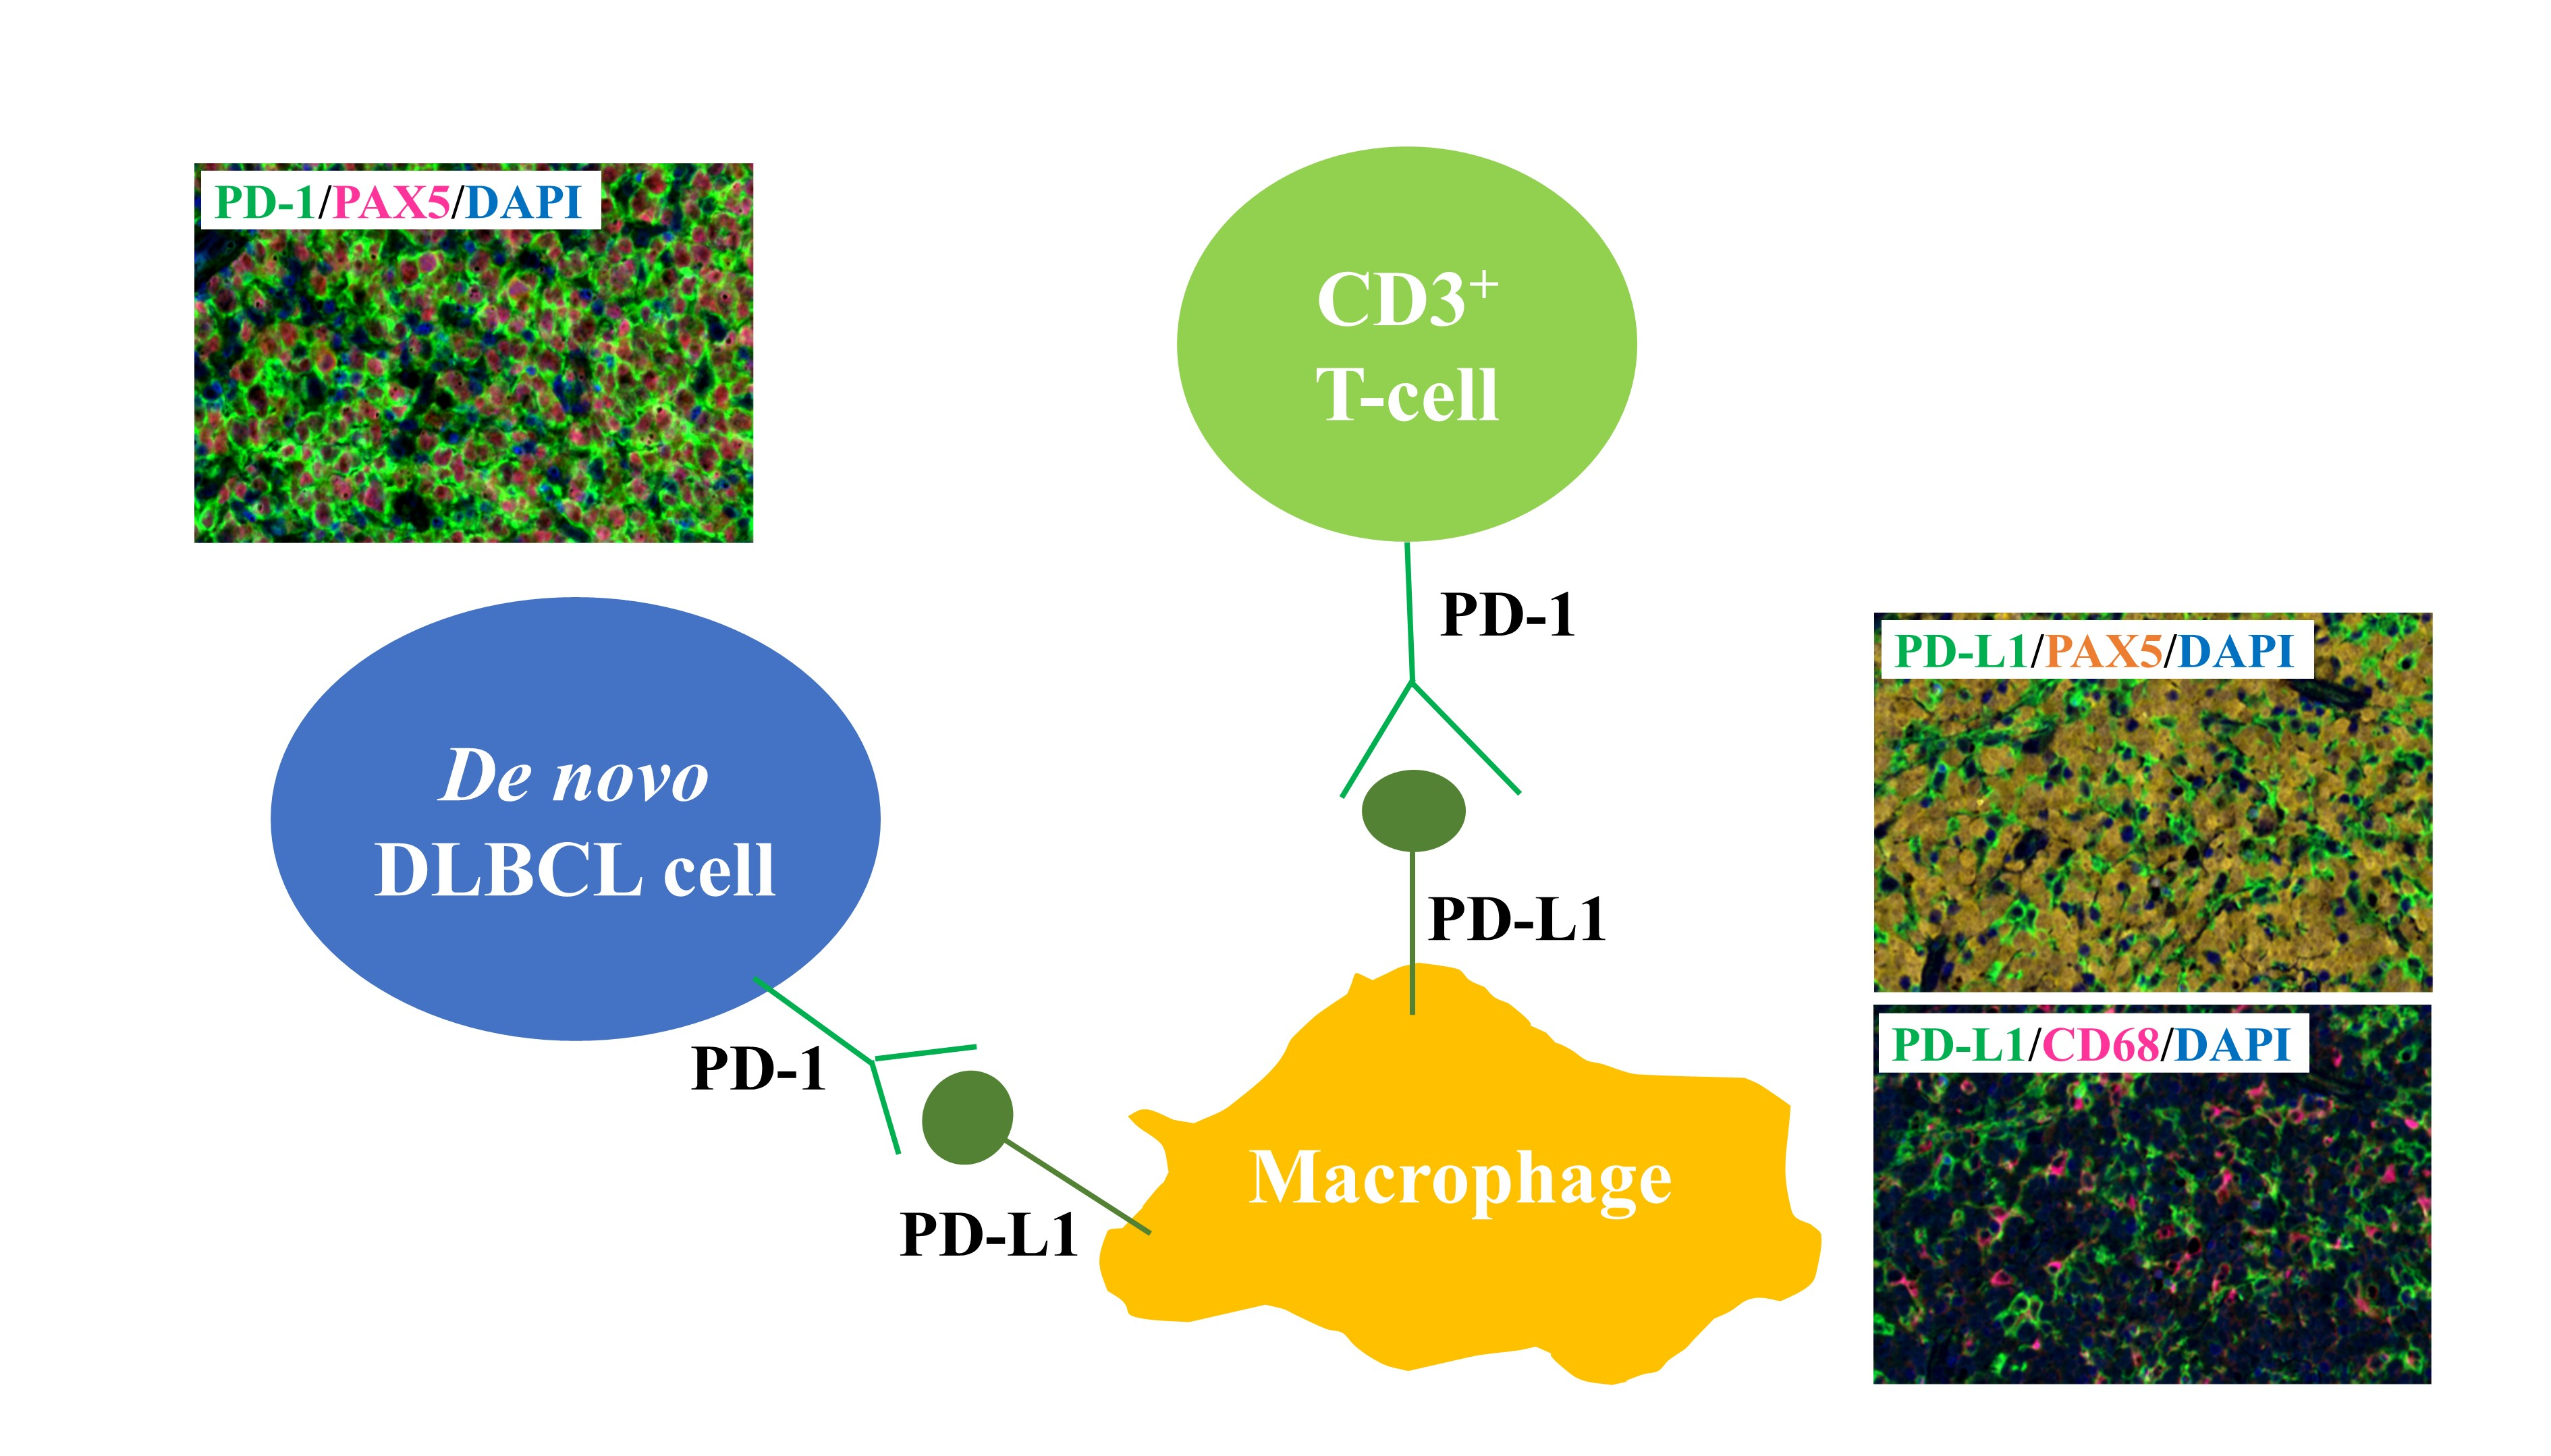
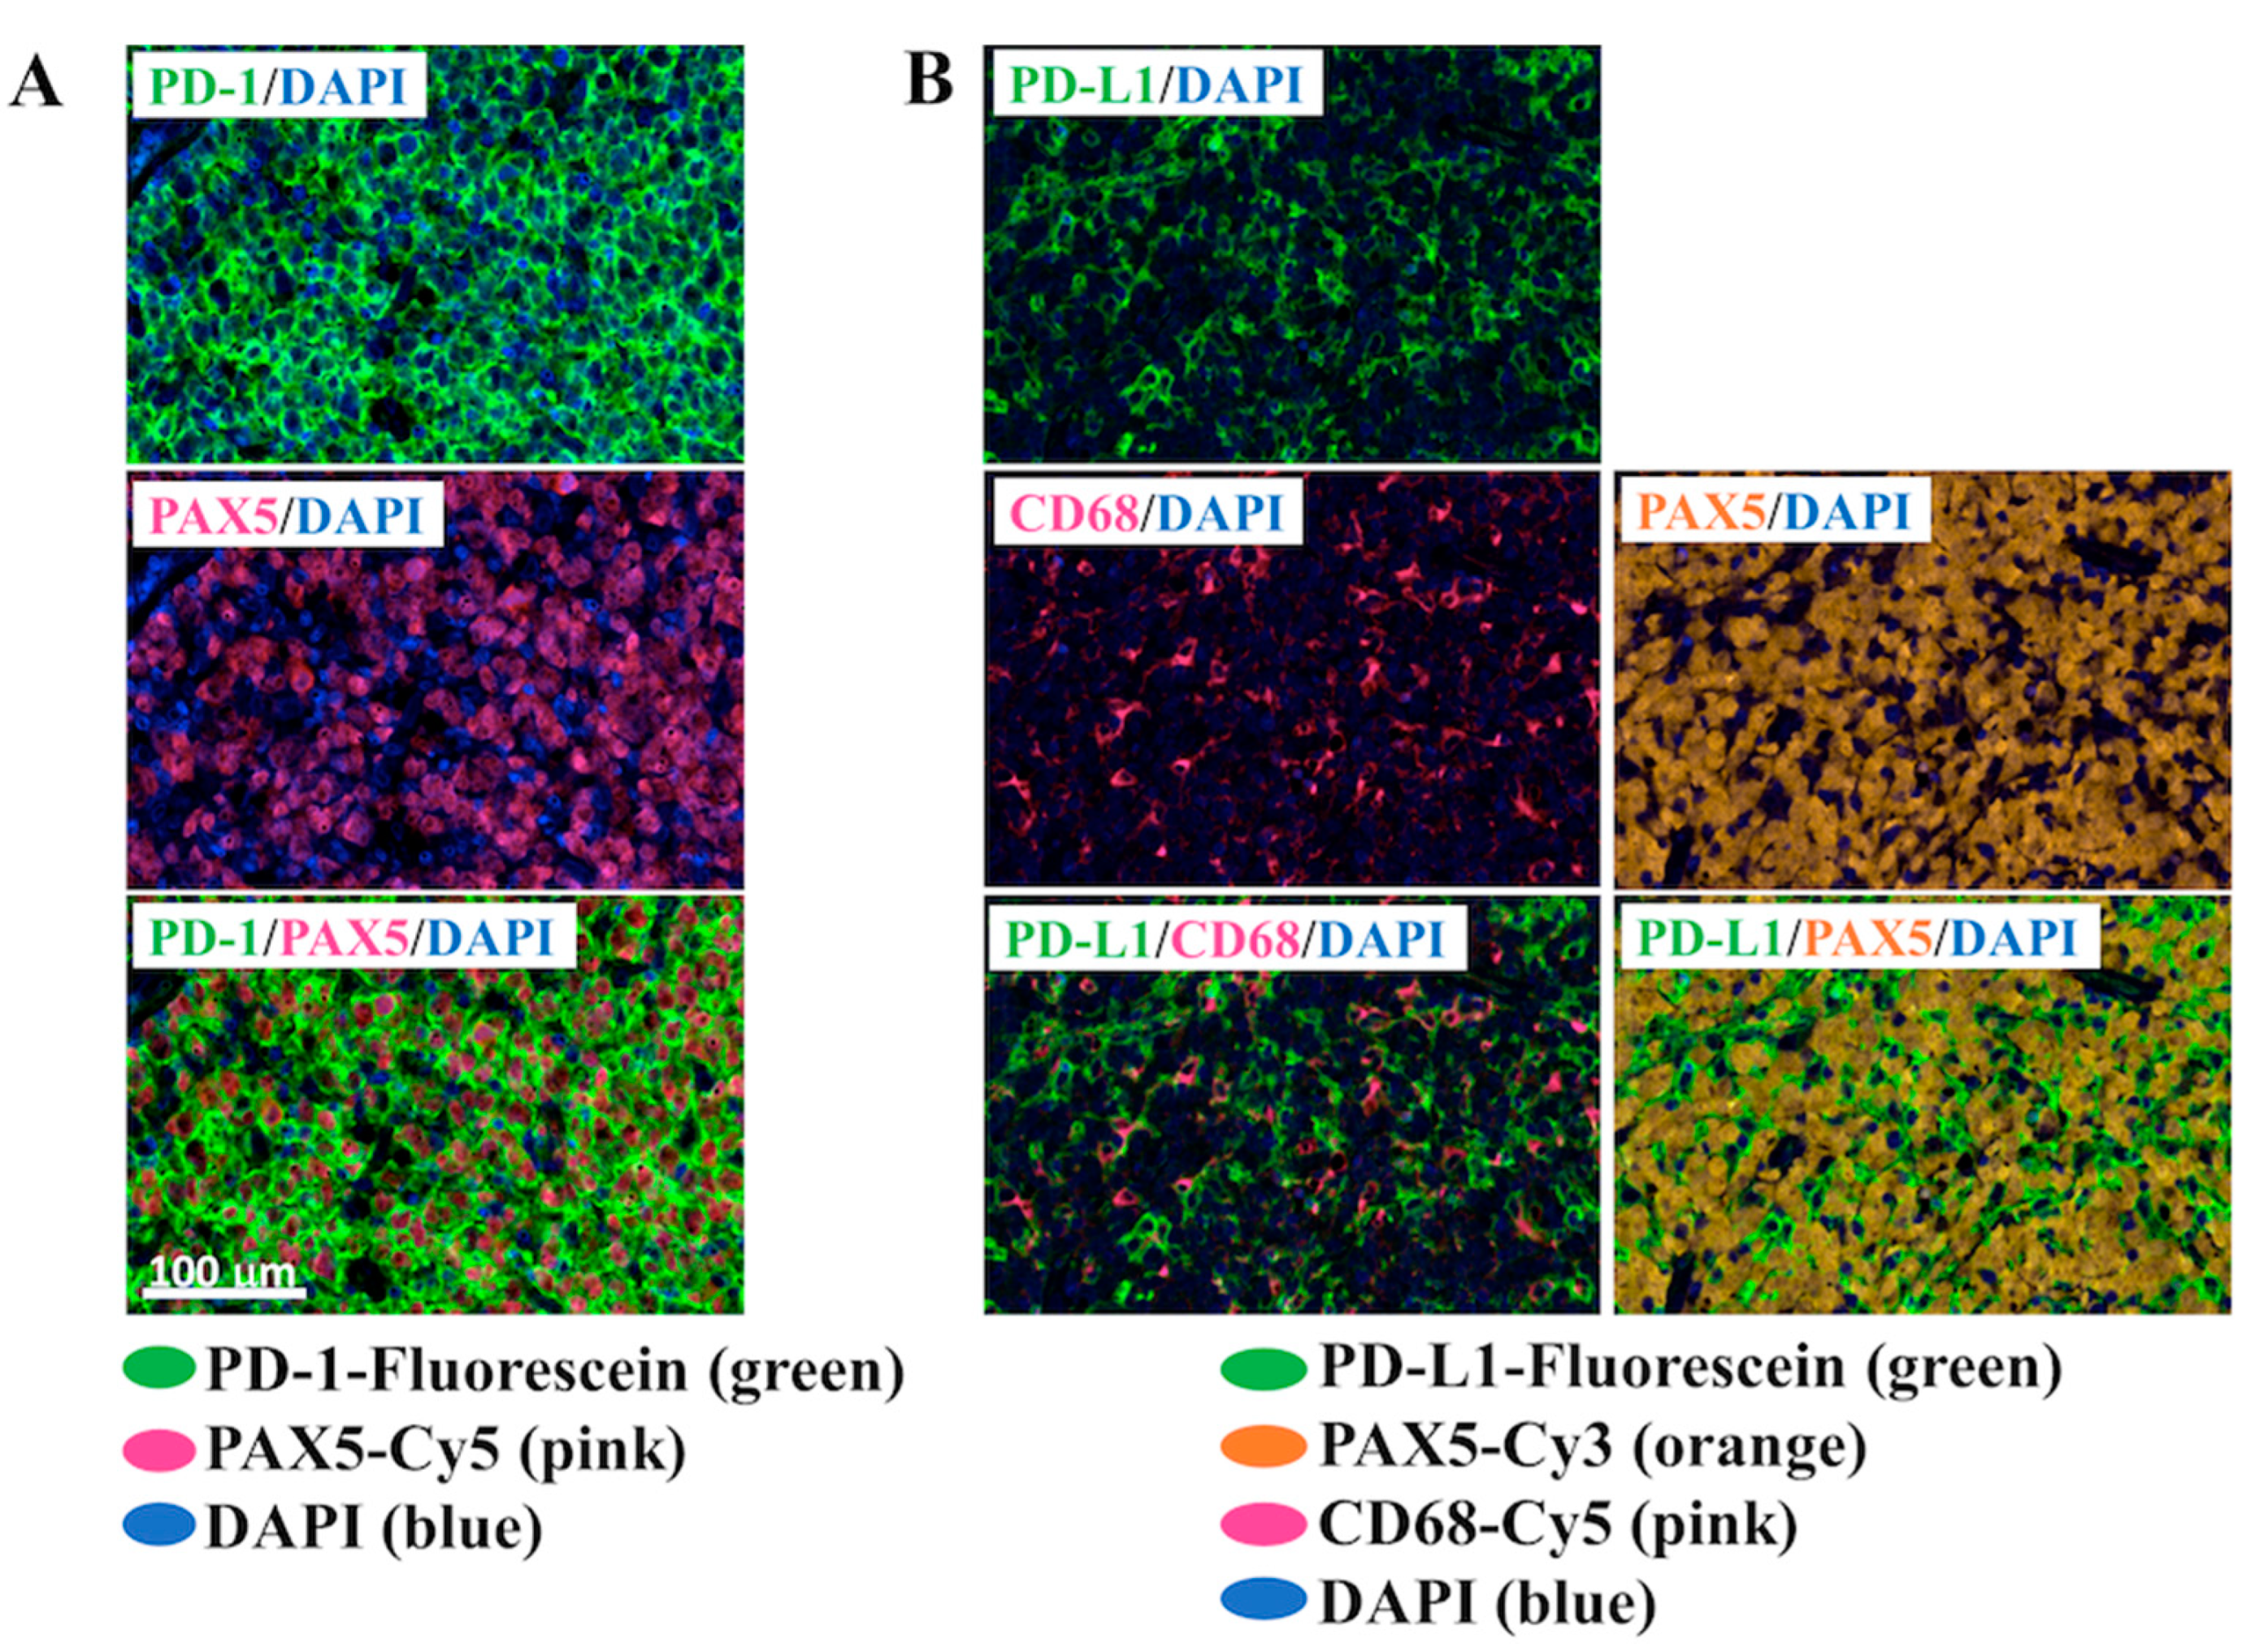
2.2. PD-1 and PD-L1 Expression Detected Using MC-IF

PD-1 and PD-L1 were expressed in 59% (19/32) and 3% (1/30) of PAX5+ cells (B-lymphoma cells), respectively (Figure 1A; Table 2). The ratio of PD-1+ cells in PAX5+ cells of patients was as follows: <20% in 41% of the patients (13/32); 20−50% in 15% of the patients (5/32); and >50% in 44% of the patients (14/32) (Table S5). PD-L1 was expressed in >90% of PAX5+ cells in one patient with PD-L1 expression on lymphoma cells. We next analyzed PD-1 and PD-L1 expression on infiltrating immune cells in the TME. CD68+ macrophages expressed PD-L1 in 86% of the patients (24/28) (Figure 1B), and CD3+ lymphocytes expressed PD-1 in 89% of the patients (24/27) (Figure S1). The proportion of PD-L1+ cells in CD68+ macrophages of patients was as follows: <20% in 14% of the patients (4/28); 20−50% in 18% of the patients (5/28); and >50% in 68% of the patients (19/28). The proportion of PD-1+ cells in CD3+ cells (T-cells) was as follows: <20% in 11% of the patients (3/27); 20−50% in 44% of the patients (12/27); and >50% in 44% of the patients (12/27).

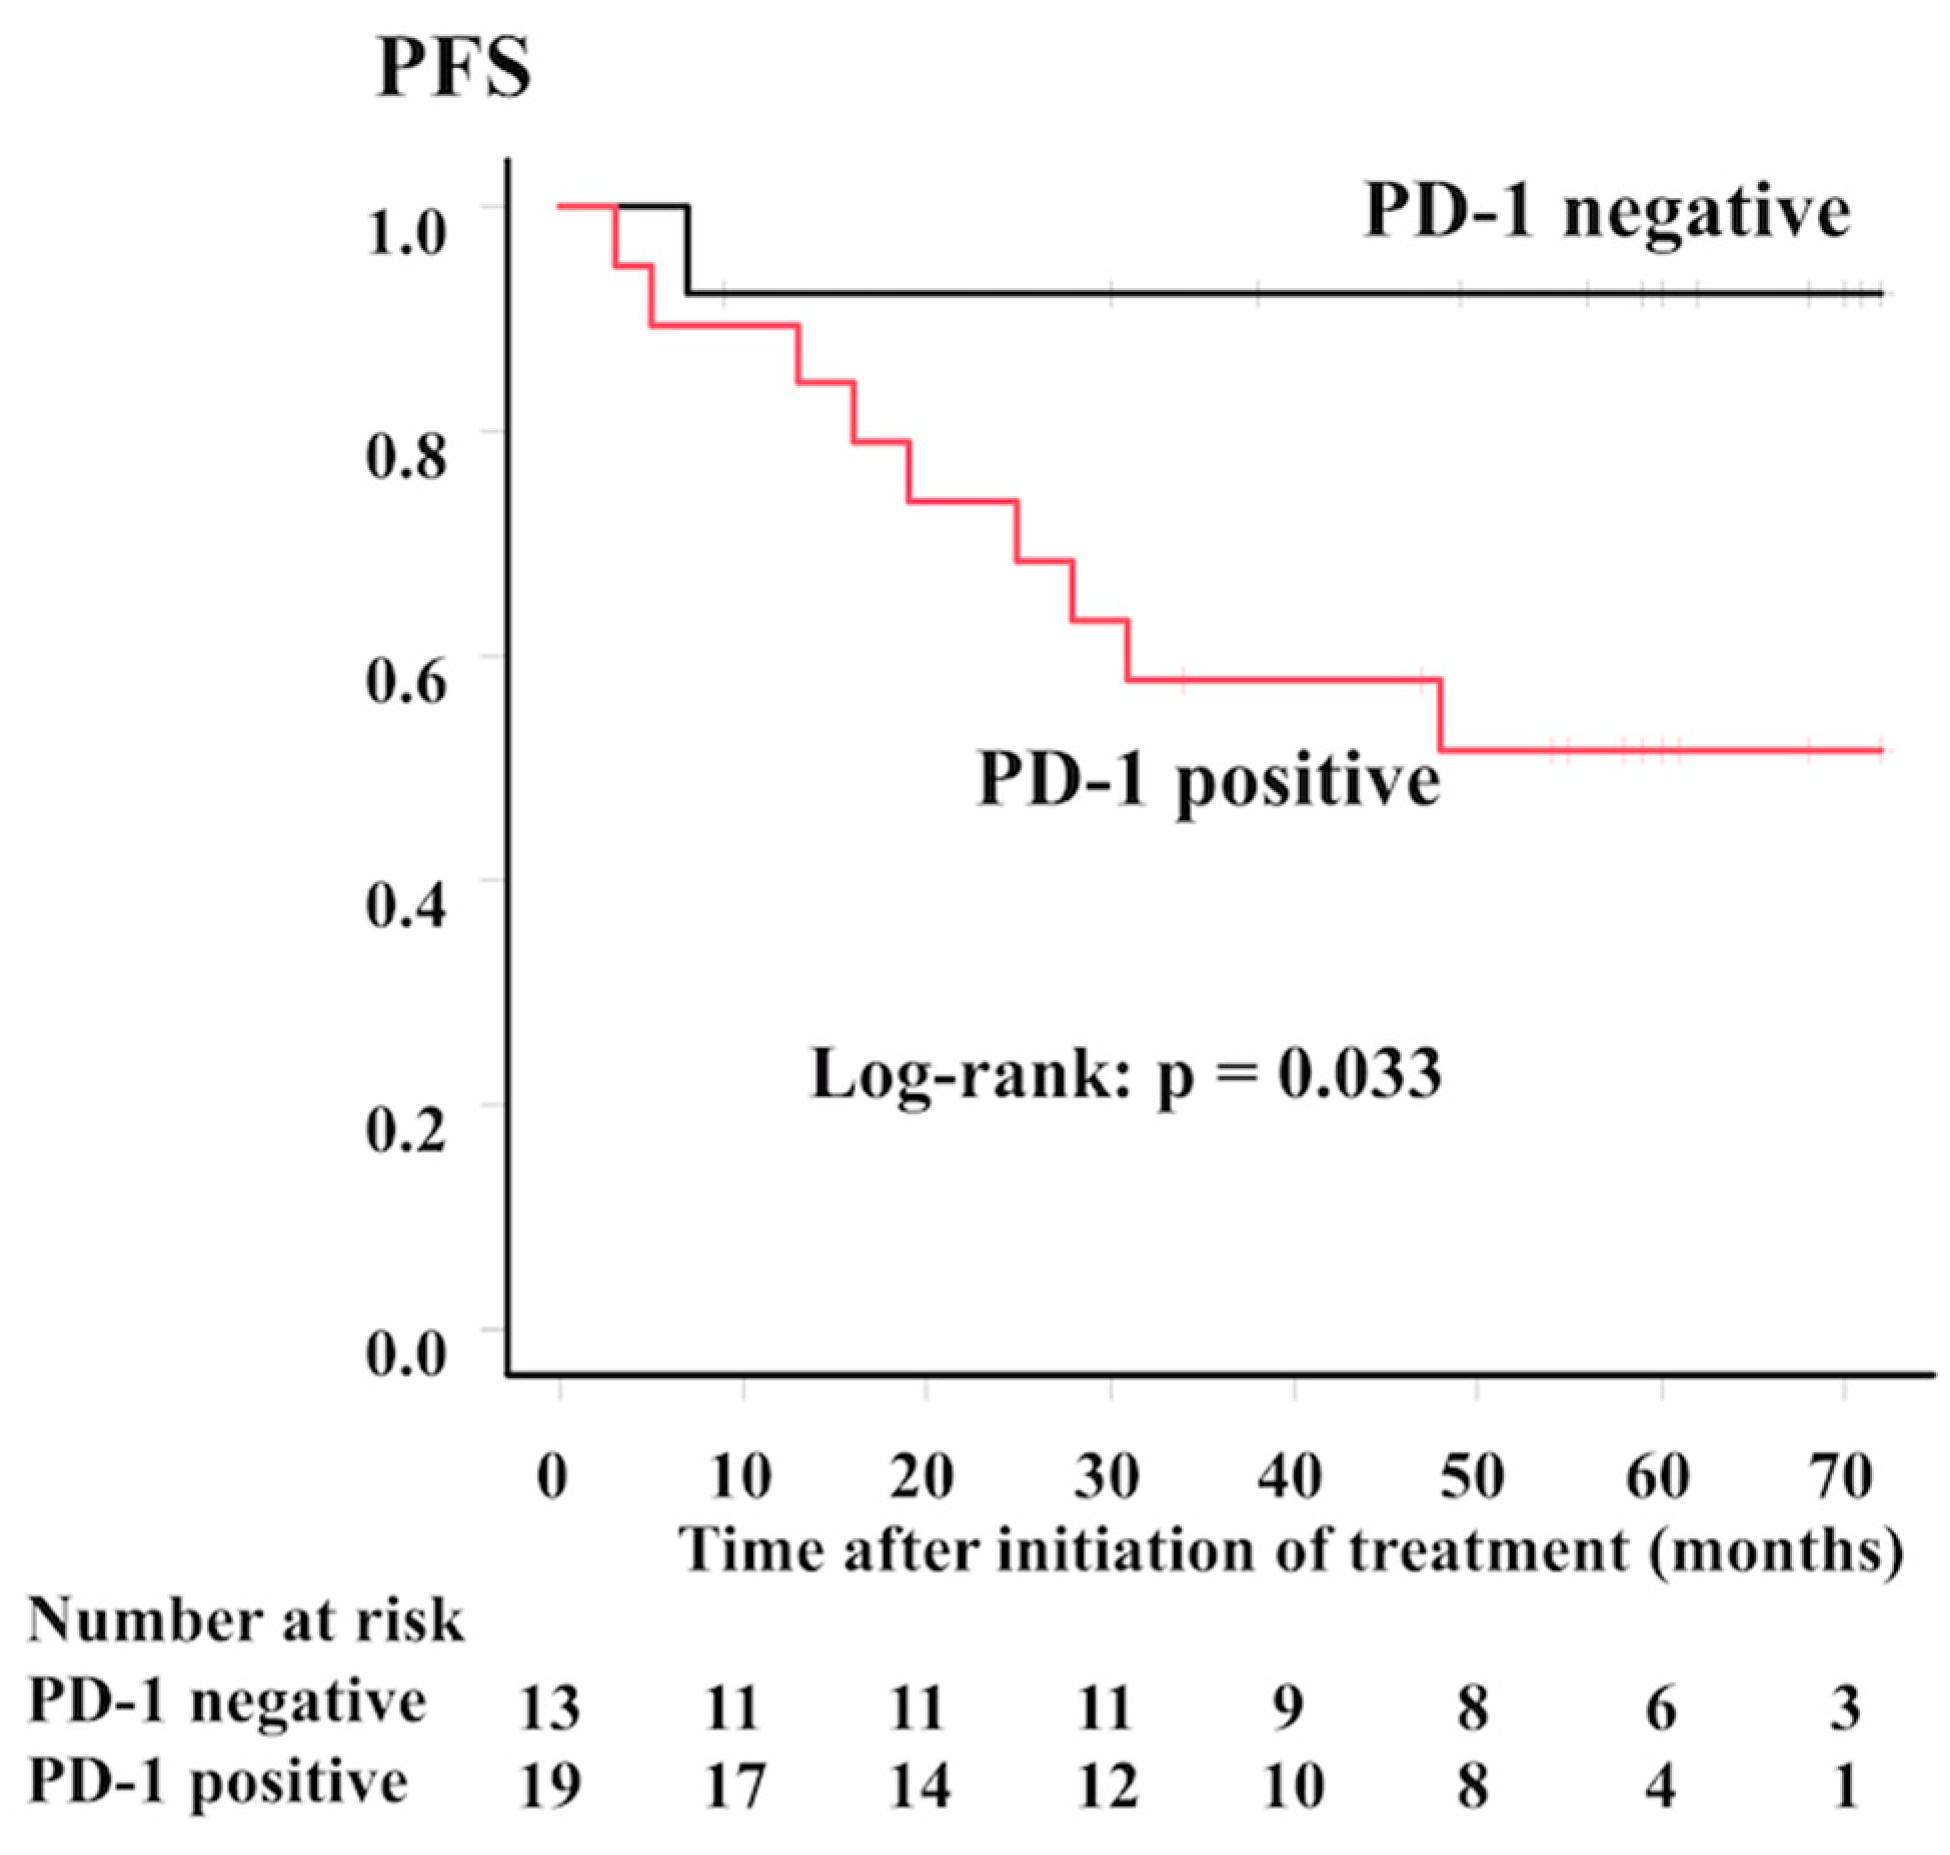
2.3. Correlation between PD-1 Expression on Lymphoma Cells and Clinical Relevance

We first investigated the correlation between PD-1 expression on lymphoma cells and clinical features such as age, serum lactate dehydrogenase levels, clinical stage, cell of origin (COO), and progression-free survival (PFS). Patients with PD-1 expression on lymphoma cells showed poorer PFS (log-rank: p = 0.033) than those without PD-1 expression (Figure 2). The other clinical parameters did not show any relationship with PD-1 expression on lymphoma cells (Table 3). PD-L1 expression on lymphoma cells or CD68+ macrophages or PD-1 expression on CD3+ lymphocytes did not show any correlation with the clinical parameters (data not shown).

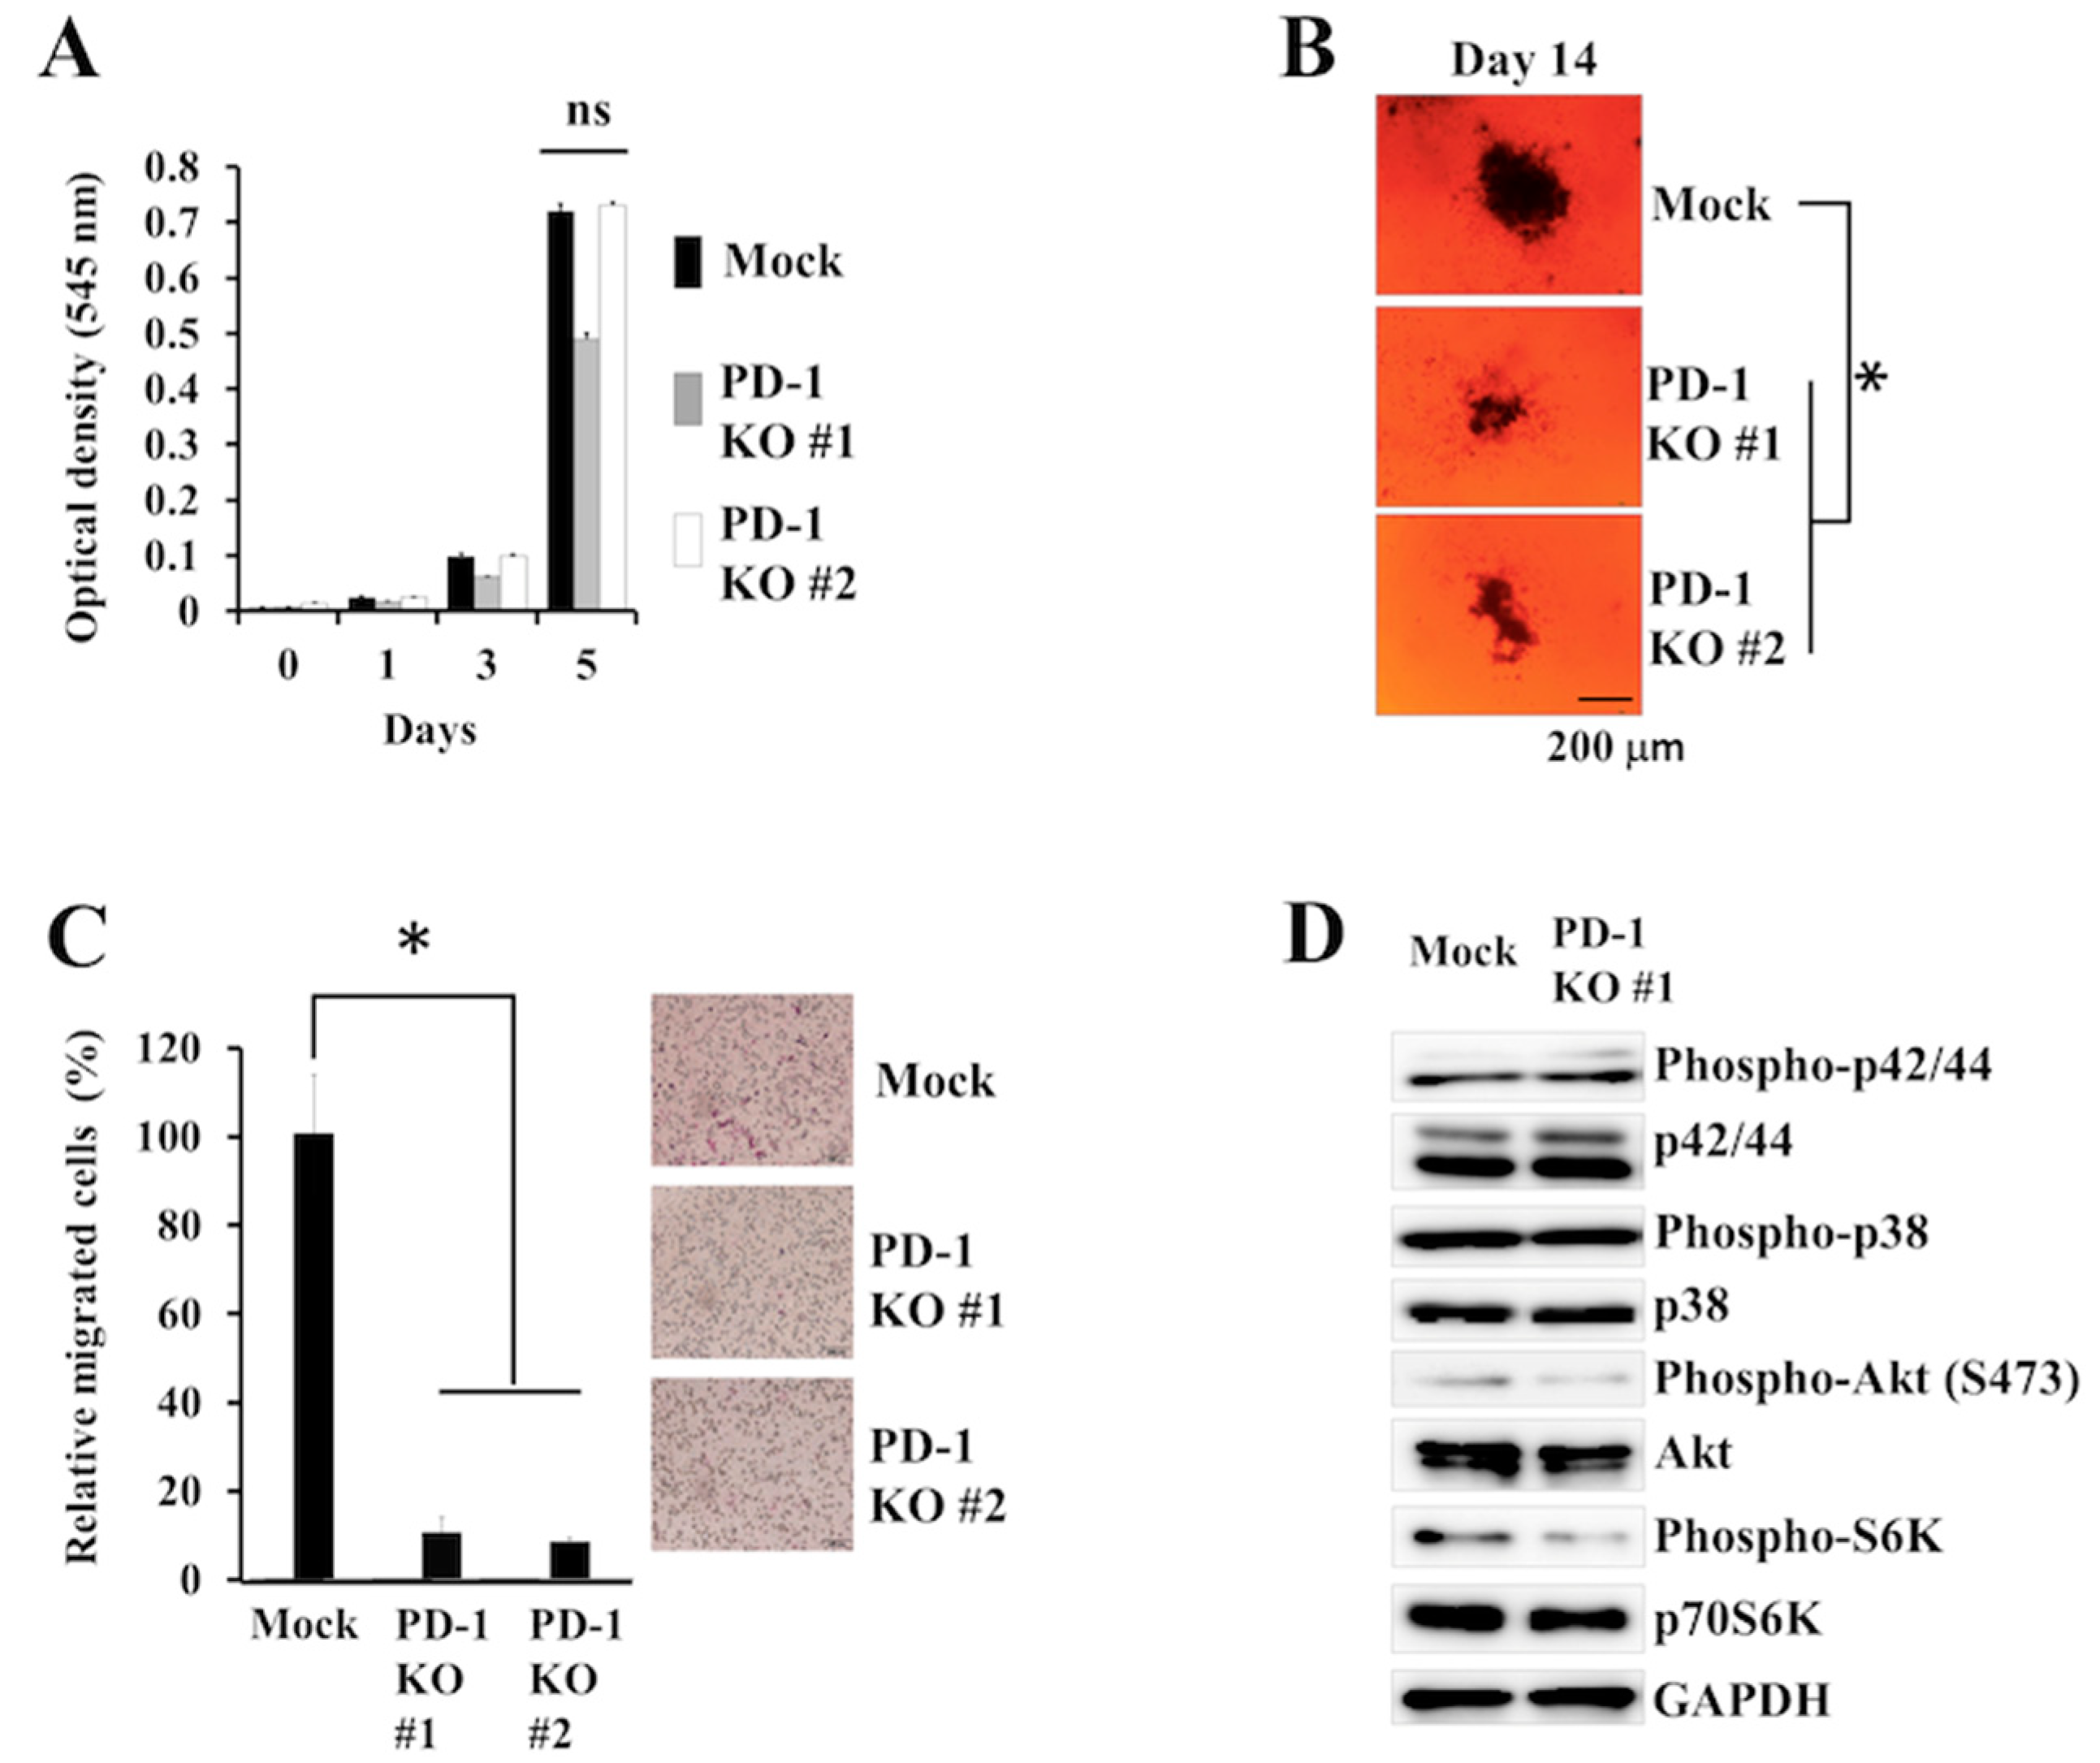
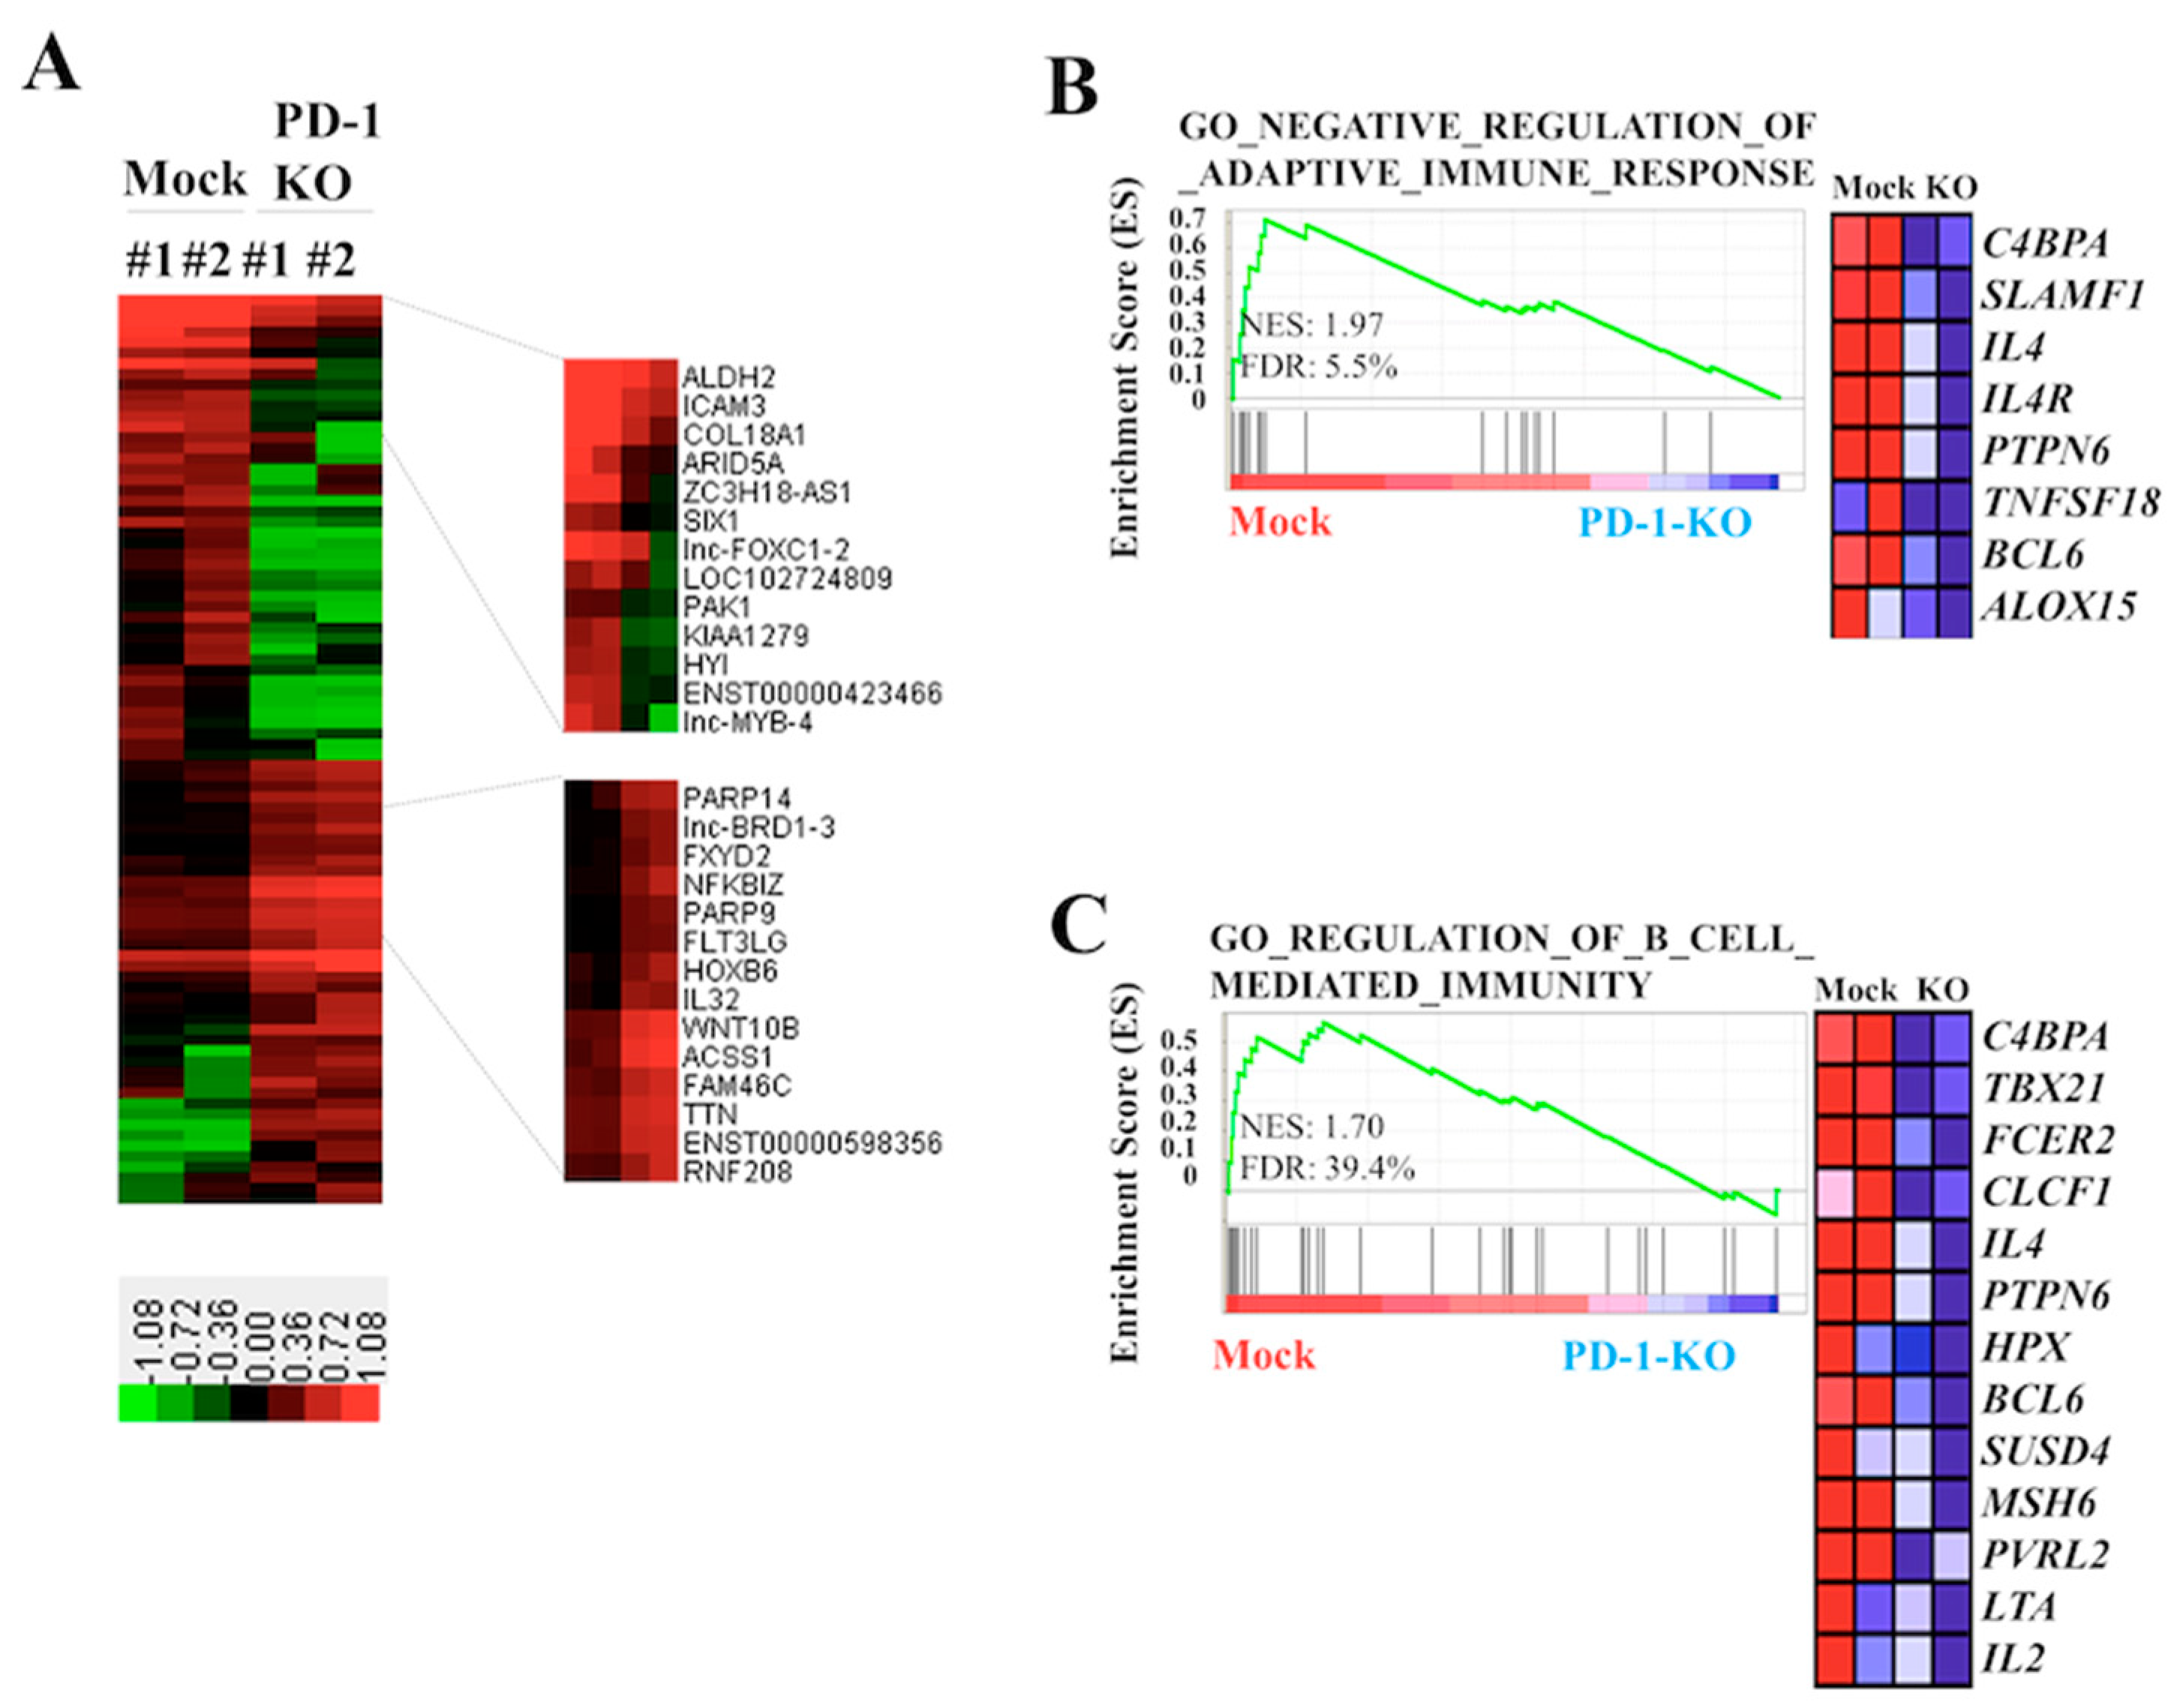
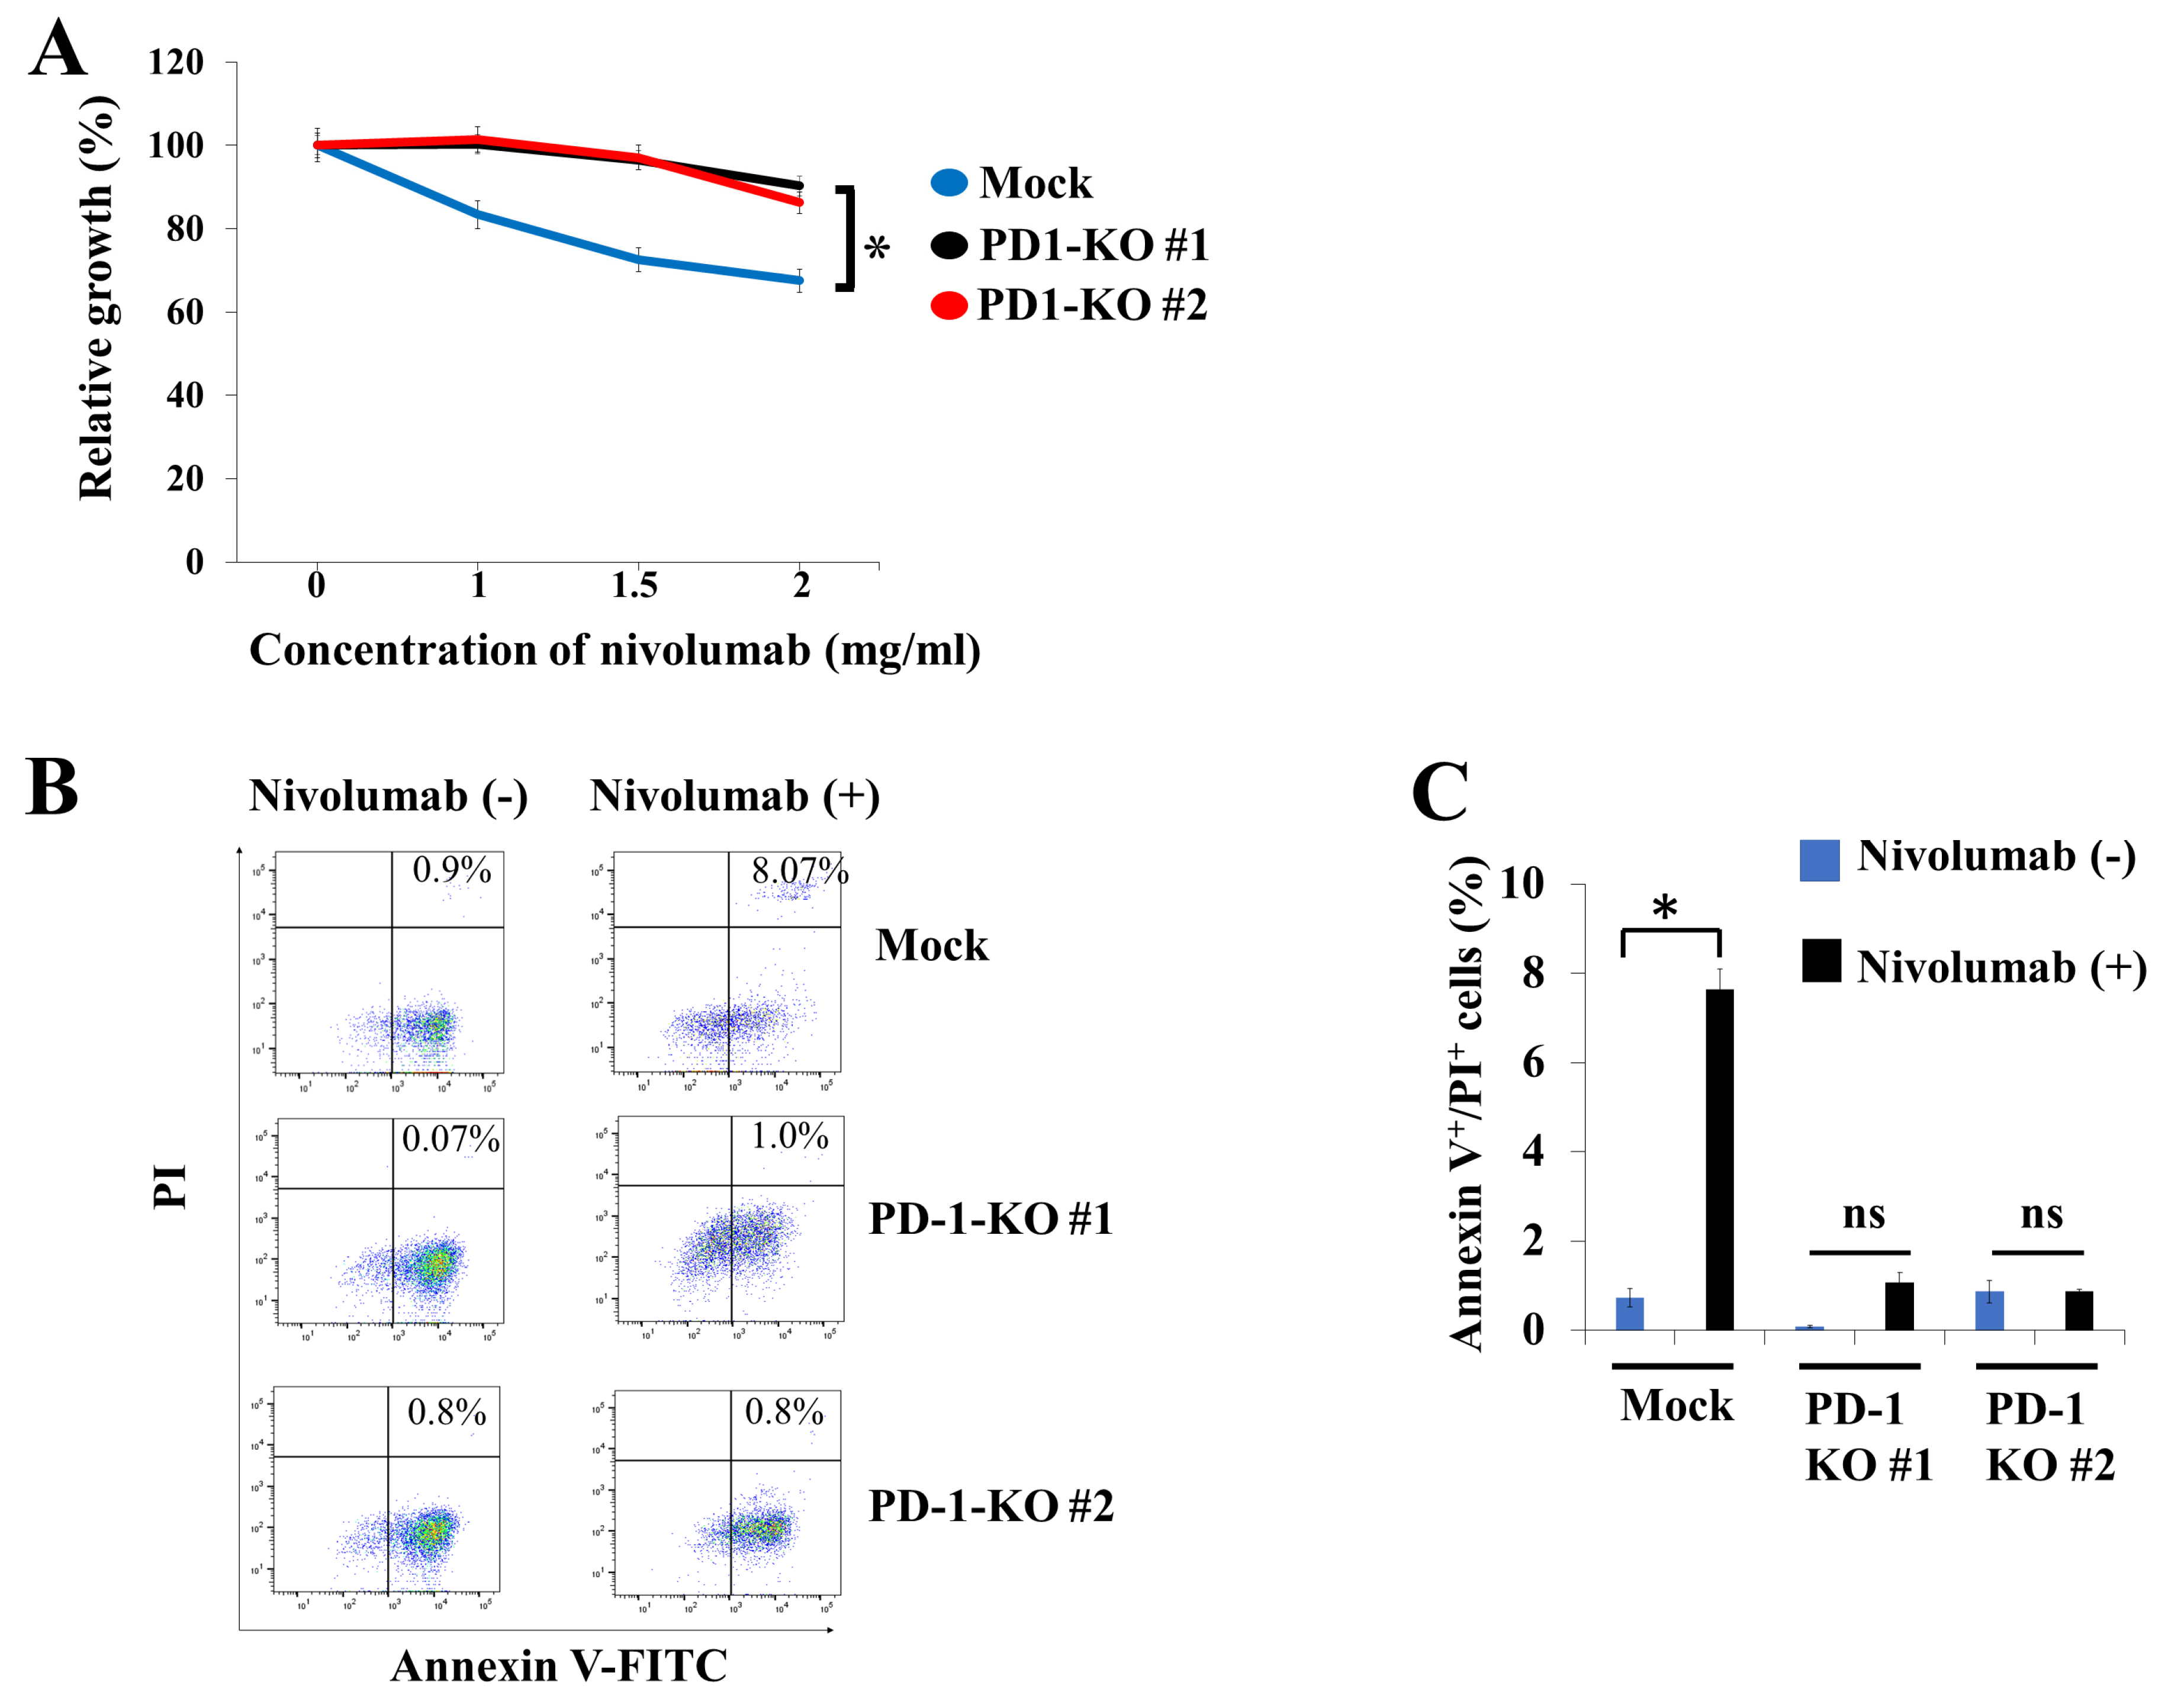
2.4. Biological Effects of PD-1 KO via CRISPR-Cas9-Mediated Genome Editing in Human B-Lymphoma VAL Cells

As our results showed that PD-1 expression on lymphoma cells was related to poor PFS in patients with de novo DLBCL, we next investigated the effects of PD-1 expression on cell growth and migration using human B-lymphoma VAL cells, which expressed PD-1 but not PD-L1 (Figure S2). While the MTT assay showed that proliferation of VAL/mock and VAL/PD-1-KO cells was similar (Figure 3A), soft agar colony formation and migration assays revealed that cell growth and migration were significantly lower in VAL/PD-1-KO cells compared with those in VAL/mock cells (p < 0.05; Figure 3B,C). This suggests that PD-1 expression was associated with enhancement of cell growth and migration. To further investigate the role of PD-1 expression in VAL cells, we performed Western blotting analysis to investigate the molecules affecting cell growth. Phosphorylation levels of S6 kinase were downregulated in VAL/PD-1-KO cells compared with those in VAL/mock cells, while the total and phosphorylation levels of p42/44, p38, and Akt were similar in the two groups (Figure 3D).
We next performed comprehensive gene expression analysis and GSEA with VAL/mock and VAL/PD-1-KO cells. Heat map analysis revealed distinct differences in gene expression patterns between VAL/mock and VAL/PD-1-KO cells (Figure 4A). We observed that PD-1 KO downregulated the expression of 97 genes by <0.5-fold and upregulated the expression of 24 genes by >2.0-fold compared with that in VAL/mock cells (raw fluorescence values of genes >100 were analyzed; Tables S3 and S4). GSEA showed significant association with gene sets related to the negative regulation of adaptive immune response and regulation of B-cell-mediated immunity (Figure 4B,C). We also found that VAL/PD-1-KO cells showed lower cell proliferation via increased proportion of apoptotic cells in the presence of nivolumab alone compared with VAL/mock cells (p < 0.01; Figure 5A–C).

3. Discussion

Using MC-IF, we found that PD-1 expression on lymphoma cells was detected in 59% of the patients with de novo DLBCL, and this was significantly associated with poor PFS in our cohort (Figure 1 and Figure 2; Table 2). For the first time, this study reports the clinical significance of PD-1 expression on lymphoma cells in de novo DLBCL, as detected using MC-IF. Furthermore, we demonstrated that the VAL/PD-1-KO cells showed reduced cell growth and migration, decreased S6 kinase phosphorylation, a distinct gene expression profile, and fewer apoptotic cells induced by nivolumab alone compared with those in the VAL/mock cells (Figure 3, Figure 4 and Figure 5). Thus, we found that PD-1 expression on lymphoma cells detected by MC-IF is a novel prognostic biomarker for the current standard immunochemotherapy in de novo DLBCL, and that PD-1 expression on B-lymphoma cells shows a biologically distinct phenotype.
Greater PD-1 expression on lymphoma cells and PD-L1 expression in CD68+ macrophages in the TME was detected with MC-IF than in previous reports using conventional IHC, the latter of which is based on a chromogenic reaction in patients with de novo DLBCL [5,6,16,17]. The reason for the difference in the frequency of PD-1 and PD-L1 expression could be largely due to differences in the detection systems used. Owing to the higher resolution of fluorescent staining and signal to noise ratio, MC-IF can detect several molecules in one tissue. As shown in this study, lymphoma cells in DLBCL are surrounded by immune cells such as PD-1+ T-cells and PD-L1+ macrophages, which make the determination of PD-1 and PD-L1 expression on lymphoma cells, infiltrating immune cells, or both cell types challenging when using conventional IHC. MC-IF can therefore be a powerful tool for detecting IC molecules in DLBCL patient samples.
We showed that loss of PD-1 expression via genome editing with the CRISPR-Cas9 system reduced colony formation and cell migration in human B-lymphoma VAL cells (Figure 3). We also observed that S6 kinase phosphorylation was lower in VAL/PD-1-KO cells than in VAL/mock cells (Figure 3D). Studies have shown that intrinsic PD-1 receptor expression promotes melanoma tumor growth by augmenting S6 kinase phosphorylation [4]. In addition, our gene expression data showed that loss of PD-1 in VAL cells resulted in an altered gene expression profile (Figure 4). Our GSEA data indicated that PD-1 KO significantly inhibited negative regulation of adaptive immune response signaling as well as regulation of B-cell-mediated immunity (Figure 4). As PD-1 plays a pivotal inhibitory role in immune regulation, our GSEA data may indicate the possibility that PD-1 is involved in intrinsic cellular signaling, acting as a negative regulator of immune response in a subset of B-cell lymphoma. Additionally, our gene expression data demonstrated that loss of PD-1 expression reduced CD44 and ALDH2 expression in VAL cells (Table S3). CD44 plays an important role in the regulation of hematopoietic cell stemness [19], and ALDH2 is a cancer stem cell marker of lung cancer cells [20]. These results suggest that PD-1 expression may be required for maintaining tumor formation by regulating cancer cell stemness. In this respect, a previous study observed predominant PD-1 expression in malignant melanoma-initiating cells [21]. We also found that nivolumab, an anti-PD-1 antibody, inhibited cell proliferation and induced apoptosis in VAL/mock cells when compared with VAL/PD-1-KO cells (Figure 5). This observation suggests that intrinsic cell signaling of PD-1 was associated with cell survival in the VAL cells. As this study utilized only one human B-lymphoma cell line (VAL), further studies are necessary to better understand the function of lymphoma cell PD-1 expression in DLBCL.
It is speculated that tumors expressing PD-L1 can escape from PD-1-expressing host CTL attack. However, as the frequency of lymphoma cell PD-L1 expression was only 3% in contrast to 86% on CD68+ macrophages in the TME (Table 2), we can assume that PD-L1+ CD68+ macrophages in the TME may play a pathological role in lymphoma cell development and survival in de novo DLBCL. Macrophages in the TME are usually called tumor-associated macrophages (TAMs), and many studies have indicated a correlation between increased TAMs and poor prognosis in cancers [22,23]. TAMs may promote tumorigenesis via various mechanisms such as growth factor production, immunosuppression, and metastasis promotion [24]. Our data indicated that PD-L1+ TAMs may support PD-1+ lymphoma cell growth. Macrophages show high plasticity and diverse phenotypes depending on the surrounding immune microenvironment. PD-L1 may be associated with the TAM phenotype. In addition, a positive correlation between poor prognosis and higher level of soluble PD-L1 has been reported in plasma of patients with DLBCL [25]. As our data revealed that PD-L1 was expressed by TAMs in most patients with de novo DLBCL, plasma PD-L1 may reflect the number of TAMs expressing PD-L1, rather than reflect B-lymphoma cells expressing PD-L1.
Little is known about the timing and function of PD-1 expression on B-cells during normal B-cell differentiation [26]. Therefore, the normal counterpart of B-lymphoma cells expressing PD-1 is unknown. Somatic mutations in the PD-1 gene and amplification or translocation of chromosome arm 2q37.2, in which the PD-1 gene is located, have not been reported in DLBCL. In addition, as observed by MC-IF that PD-1 was not expressed by follicular lymphoma cells in several patients (Figure S3), DLBCL cell PD-1 expression may be a unique occurrence. Further studies are necessary to elucidate the mechanisms of PD-1 expression on DLBCL cells.
Approximately 30% of the patients with DLBCL are not cured and, therefore, new treatments such as IC blockage therapies are required. However, clinical trials have shown that PD-1 inhibitors are not effective in patients with DLBCL [6,9]. The lack of PD-L1 expression on lymphoma cells in many patients with DLBCL might be responsible for this observation. In addition, the CD68+ macrophages of >80% of the patients with DLBCL express PD-L1, which may reduce PD-1+ CTL activity owing to the binding of PD-1 to PD-L1. Assessing the expression of PD-L2 and B7-1 on lymphoma cells might help select appropriate IC inhibitors for DLBCL therapy.
One major limitation of this study is that the number of patients studied was small. Although we observed that patients with PD-1 expression on lymphoma cells showed significantly shorter PFS (Figure 2), we could not find any correlation between its expression and other clinical parameters (Table 3). Analysis of a larger number of patients will clarify the effects of lymphoma cell PD-1 expression on clinical features. Another limitation is that our survival data were retrieved from a retrospective single-center analysis. A future prospective multicenter study analyzing survival is necessary to confirm our findings.
In conclusion, by conducting MC-IF on patient FFPE samples, we demonstrated that PD-1 expression on lymphoma cells was detected in 59% of the cases and was associated with poor PFS in patients with de novo DLBCL treated with standard immunochemotherapies. Loss of PD-1 expression via genome editing with the CRISPR-Cas9 system reduced colony formation and cell migration in a human B-lymphoma cell line. PD-L1 was expressed by 3% of the lymphoma cells, while it was expressed in 86% of the infiltrating CD68+ macrophages in the TME. Our data indicated that PD-1 expression on lymphoma cells was associated with a malignant phenotype, owing to enhancement of cell proliferation and migration. Furthermore, infiltrating macrophages expressing PD-L1 may have a pathological role in de novo DLBCL. Further studies are necessary to confirm our findings, which may offer prognostic biomarkers for the current therapies and potent future IC blockage therapies for DLBCL.

4. Materials and Methods

4.1. Tissue Samples and Antibodies Used for MC-IF Staining

FFPE tissues from patient tumors from the archives of the Aichi Medical University Hospital were used with institutional review board approval (2016-H125 (11 July 2016), 2020-184 (16 June, 2020)). The study was conducted in accordance with the Declaration of Helsinki. Thirty-two consecutive patients with de novo DLBCL diagnosed from January 2014 to June 2016 in our institute were enrolled in the study. These patients were treated with R-CHOP, rituximab, cyclophosphamide, vincristine, and prednisone (R-COP), or pirarubicin or tetrahydropyranyl adriamycin (R-THP)-COP. Patients with primary mediastinal large B-cell lymphoma, primary central nervous system large B-cell lymphoma, cutaneous large B-cell lymphoma, or transformed DLBCL were excluded from the study. The histopathological and immunohistochemical features were reviewed by experienced hematological pathologists (A.S. and T.T.). The response criteria were based on standard guidelines [27,28]. The medium follow-up period for the patients in the study was 49 months (range; 2–72 months). The antibodies for MC-IF against PD-1 (NOT105), PD-L1 (28-8), CD68 (PG-M1), PAX5 (BC/24), and CD3 (SP162) are listed in Table S1.

4.2. MC-IF Analysis

MC-IF staining with 4 µm-thick FFPE sections was performed using the tyramide signal amplification system. This was done in conjunction with multispectral image analysis for detecting the IC molecules PD-1 and PD-L1 and hematological cell lineage markers CD3, CD68, and PAX5. The combinations of staining molecules analyzed were PD-L1/CD68/PAX5/DAPI (4′,6-diamidino-2-phenylindole) and PD-1/CD3/PAX5/DAPI. The de-paraffinized sections (4 µm thick) were incubated with antigen retrieval buffer for 10 min at 110 °C in an autoclave. After cooling to 60 °C, the tissues were blocked with 2% horse serum for 10 min at approximately 20 °C. Primary antibody reactions with 400× diluted anti-PD-1 or anti-PD-L1 antibodies were performed for 60 min at approximately 20 °C. After washing thrice with phosphate-buffered saline (PBS) for 5 min each, a secondary antibody reaction with peroxidase polymer anti-mouse IgG or anti-rabbit IgG was performed for 30 min at approximately 20 °C. The sections were washed thrice with PBS for 5 min each, and the stained molecules were visualized using the tyramide signal amplification system according to the manufacturer’s instructions (PerkinElmer, Hopkinton, MA, USA). Before progressing to the next staining, the sections were heated with 10 mM Tris-HCl containing 2 mM EDTA (pH 9.0) for 10 min at 95 °C to remove the bound antibodies from the first step of staining. CD68 or CD3 and PAX5 were stained using the same procedure as mentioned above. Finally, the sections were stained with DAPI for counter nuclear staining. The images were captured using the Aperio CS2 digital pathology slide scanner (Leica Biosystems, Richmond, IL, USA) and analyzed using Aperio ImageScope software (Leica Biosystems). Samples were considered positive when PD-1 or PD-L1 was expressed in ≥20% cells expressing PAX5, CD68, or CD3.

4.3. Cell Culture and Reagents

The human B-lymphoid cell lines Farage, Raji, P3HR-1, VAL, and REC-1 were kindly gifted by Hiroshi Miwa of Mie University. The cells were maintained at 37 °C in a 5% CO2 humidified atmosphere in RPMI-1640 medium supplemented with 10% fetal bovine serum (FBS) and penicillin–streptomycin. RPMI-1640, FBS, and penicillin–streptomycin solution were purchased from Wako Pure Chemical Industries (Tokyo, Japan). Nivolumab was purchased from Selleck Chemicals (Houston, TX, USA).

4.4. PD-1 Knockout Using the Clustered Regularly Interspaced Short Palindromic Repeats (CRISPR)-Cas9 System

The CRISPR-Cas9 system was used to disrupt PD-1, as previously described [29]. pSpCas9 (BB)-2A-GFP (PX458) was a gift from Feng Zhang (Addgene plasmid # 48138). Briefly, a single guide RNA (sgRNA) sequence for PD-1 was selected using Optimized CRISPR Design (http://crispr.mit.edu/ (Accessed date: 10 July 2017) (5′-CACGAAGCTCTCCGATGTGT-3′) in exon 2. The plasmid expressing hCas9 and the sgRNA were prepared by ligating oligonucleotides into the BbsI site of PX458 (PD-1/PX458). To establish an insert PD-1 clone, 1 μg PD-1/PX458 was transfected into VAL cells (1 × 10⁶ cells) using a 4D-Nucleofector™ (Lonza Japan, Tokyo, Japan). After 3 days, cells expressing green fluorescence protein (GFP) were sorted using fluorescence-assisted cell sorting (FACS) (BD Biosciences, San Jose, CA, USA). Cell clones were selected, expanded, and then used for biological assays. Forward (5′-TTCCTCACCTCTCTCCATCT-3′) and reverse (5′-CACCTGTCACCCTGAGCTCT-3′) primers were used for analyzing the PD-1 sequence.

4.5. Western Blotting and Flow Cytometry

Western blotting and flow cytometry analyses were performed to determine PD-1 and PD-L1 expression in the human B-lymphoma cell lines Farage, Raji, P3HR-1, VAL, and REC-1, and VAL/PD-1-knockout (KO) cells, as previously described [30]. The immune complexes were detected using ImmunoStar LD (Wako Pure Chemical Industries) in conjunction with an Amersham Imager 600 (GE Healthcare, Chicago, IL, USA). Flow cytometry was performed using a flow cytometer (FACSCanto II; BD Biosciences). The antibodies used for Western blotting and flow cytometry are summarized in Table S2.

4.6. Microarray Gene Expression Analyses for VAL/Mock and VAL/PD-1-KO Cells

The experimental procedure for cDNA microarray analysis was based on the manufacturer’s protocol (Agilent Technologies, Santa Clara, CA, USA), as described previously [29]. Briefly, cDNA synthesis and cRNA labeling were performed with cyanine 3 (Cy3) dye using the Agilent Low Input Quick Amp labeling kit. The Cy3-labeled cRNA was purified, fragmented, and hybridized on a SurePrint G3 Human Gene Expression 8 × 60 K v3 chip containing 26,083 RNAs by using a gene expression hybridization kit (Agilent Technologies). The microarray slide was washed and scanned using an Agilent DNA microarray scanner. The scanned data were quantified using the Feature Extraction software program, version 11.0.1.1 (Agilent Technologies). The signal intensities were then normalized, as previously described [31]. The background signals were also normalized, and the microarray expression data were rank-ordered based on the differential expression in VAL/PD-1-KO cells versus VAL/mock cells. Gene set enrichment analysis (GSEA) was performed according to the instructions at https://software.broadinstitute.org/gsea/index.jsp (Accessed date: 20 November 2017) [32,33]. The raw and normalized microarray data have been submitted to the GEO database at NCBI (GSE152509; https://0-www-ncbi-nlm-nih-gov.brum.beds.ac.uk/geo/query/acc.cgi?acc=GSE152509) (Accessed date: 20 November 2017).

4.7. Cell Viability Assay

Cell viability was determined using a 3-(4,5-dimethylthiazol-2-yl)-2,5-diphenyltetrazolium bromide (MTT) assay. Briefly, cells (1 × 10³ cells/well) were seeded in a 96-well plate and incubated for 0, 1, 3, or 5 days at 37 °C in an atmosphere of 5% CO2. Subsequently, 10 μL MTT solution (5 mg/mL; Sigma-Aldrich, St. Louis, MO, USA) was added to each well, and the cells were further incubated for 4 h. Next, the cell lysis buffer was added to the wells to dissolve the colored formazan crystals produced by MTT. Finally, the absorbance at 545 nm at each time point (days 0, 1, 3, and 5) was measured using a Spectramax M5 spectrophotometer (Molecular Devices, San Jose, CA, USA).

4.8. Soft Agar Colony Formation Assay

The VAL/PD-1-KO and VAL/mock cells (1 × 10³ cells/well) were cast in 2 mL of 0.4% agarose (top layer) (Bacto agar; BD Biosciences) and poured on top of 2 mL of 0.6% agarose (bottom layer) in 6-well plates. After incubation for 14–17 days, the colonies were stained with MTT solution (5 mg/mL) in PBS. Photographs were taken with bright-field microscopy using a microscope (IX-73; Olympus). VAL/PD-1-KO and VAL/mock cells (1 × 10³ cells/well) were cast in 2 mL of 0.4% agarose (top layer) (Bacto agar; BD Biosciences) and poured onto 2 mL of 0.6% agarose (bottom layer) in 6-well plates. After incubation for 2 weeks, colonies were stained with MTT solution (5 mg/mL) in PBS. The number of colonies was counted under a microscope (IX-73; Olympus, Tokyo, Japan). Colony size was analyzed using colony counter software (Keyence, Tokyo, Japan).

4.9. Cell Migration Assay

Prior to the migration assay, VAL/PD-1-KO and VAL/mock cells were stained with 1 µM calcein AM (FujiFilm Wako, Osaka, Japan) for 30 min. The cells were washed twice and seeded with serum-free RPMI-1640 medium containing 0.5% bovine serum albumin at a density of 2 × 10⁵ cells/well in the upper chamber of the Transwell inserts (Corning, Corning, NY, USA, 8 µm pore size) in a 24-well plate. RPMI-1640 with 10% FBS was used as the lower chamber medium. After incubation for 48 h, the migrated cells were visualized using a BZ-9000 fluorescent microscope (Keyence, Osaka, Japan), and fluorescence intensity was measured with a Spectramax M5 (Molecular Devices, San Jose, CA, USA). Data are expressed relative to the results obtained with migrated VAL/mock cells, which was arbitrarily set at 100%.

4.10. Annexin V Assay

Cells were cultured in 6-well plates (5 × 10⁵ cells/well) for 24 h, followed by incubation with fluorescein isothiocyanate (FITC)-conjugated annexin V (Biolegend, San Diego, CA, USA) and propidium iodide (PI) (Biolegend) at approximately 25 °C for 15 min. Fluorescence intensities of FITC and PI were determined by flow cytometric analysis using a FACSCanto II instrument (BD, Franklin Lakes, NJ, USA).

4.11. Statistical Analysis

Clinical features were compared using Fisher’s exact test. The survival of the two groups of patients was compared using the Kaplan‒Meier method and log-rank test. PFS was defined as the time from the start of treatment to disease progression or death. Experimental results were presented as mean ± SE. The statistical significance of the experimental results between groups was determined using one-way analysis of variance (ANOVA) and a Student’s t-test. Statistical analyses were performed using the SPSS 23.0 program (SPSS) and EZR software (V1.40) [34]. p < 0.05 was considered statistically significant.

Supplementary Materials

The following are available online at https://0-www-mdpi-com.brum.beds.ac.uk/article/10.3390/hemato2020023/s1, Table S1: Antibodies used for MC-IF, Table S2: Antibodies used for WB and FACS, Table S3: Downregulated genes in VAL/PD-1-KO cells, Table S4: Upregulated genes in VAL/PD-1-KO cells; Table S5: Ratio of PD-1+ and PD-L1+ cells in cell lineage in patients with de novo DLBCL, Figure S1: A representative image of MC-IF for PD-1 and CD3 of a patient with de novo DLBCL, Figure S2: Generation of PDCD-1 (PD-1)-knockout VAL cells, Figure S3: A representative image of MC-IF for PD-1, PD-L1, CD3, and PAX5 of a patient with follicular lymphoma.

Author Contributions

Conceptualization, I.H. and S.B.; methodology, I.H., S.S., A.O., and S.K.; validation, A.S. and T.T.(Taishi Takahara); formal analysis, I.H., S.S., A.O., and S.K.; investigation, I.H., S.S., and R.U.; resources, I.H., S.M., V.Q.L., A.N., S.T., K.Y., M.E., T.T. (Toyonori Tsuzuki), Y.H., and A.T.; writing—original draft preparation, I.H., S.S., and A.O.; writing—review and editing, I.H.; visualization, I.H.; supervision, I.H., R.U., and A.T.; project administration, I.H., R.U., and A.T.; funding acquisition, I.H., S.S., A.O., S.K., R.U., and A.T. All authors have read and agreed to the published version of the manuscript.

Funding

This study was supported in part by grants from the Ministry of Education, Culture, Sports and Technology of Japan (19K08825 to I.H., 18K07277 to S.S., 18K08342 to A.O.), the Japan Agency for Medical Research and Development (AMED; 19ae0101074s040 to R.U.), and by a research grant from Kyowa Kirin.

Institutional Review Board Statement

The study was conducted according to the guidelines of the Declaration of Helsinki, and approved by the Institutional Review Board of Aichi Medical University Hospital ((2016-H125 (11 July, 2016), 2020-184 (16 June, 2020)).

Informed Consent Statement

Informed consent was obtained from all subjects involved in the study.

Data Availability Statement

Not applicable.

Acknowledgments

The authors thank Yuka Oohigashi, Akiko Shimada, and Taeko Nakamura for their valuable secretarial assistance and Editage for their editorial assistance.

Conflicts of Interest

I.H. received honoraria or membership to an entity’s board of directors, speaker’s bureau, or advisory committee from Celgene, Janssen, Takeda, Ono, Bristol-Myers Squibb (BMS), Novartis, Daiichi Sankyo, Kyowa Kirin, Eisai, Nihon-Shinyaku, Pfizer, AbbVie, Otsuka, Shionogi, Mundi, CSL Behring, and Merck Sharp & Dohme (MSD). I.H. and A.T. received research funding from BMS, MSD, Astellas, Otsuka, Ono, Kyowa Kirin, Sanofi, Shionogi, Zenyaku, Daiichi Sankyo, Taiho, Takeda, Chugai, Eli Lilly, Nihon Shinyaku, Novartis, Pfizer, Celgene, Fukuyu Hospital, and Yamada Yohojo. S.B. received honoraria and research funding from Chugai. R.U. received research funding from Kyowa Kirin, Chugai Pharmaceutical, and Ono Pharmaceutical. The remaining authors declare no competing financial interests.

References

  1. Iwai, Y.; Okazaki, T.; Nishimura, H.; Kawasaki, A.; Yagita, H.; Honjo, T. Microanatomical localization of PD-1 in human tonsils. Immunol. Lett. 2002, 83, 215–220. [Google Scholar] [CrossRef]
  2. Salmaninejad, A.; Valilou, S.F.; Shabgah, A.G.; Aslani, S.; Alimardani, M.; Pasdar, A.; Sahebkar, A. PD-1/PD-L1 pathway: Basic biology and role in cancer immunotherapy. J. Cell. Physiol. 2019, 234, 16824–16837. [Google Scholar] [CrossRef]
  3. Du, S.; McCall, N.; Park, K.; Guan, Q.; Fontina, P.; Ertel, A.; Zhan, T.; Dicker, A.P.; Lu, B. Blockade of Tumor-Expressed PD-1 promotes lung cancer growth. OncoImmunology 2018, 7, e1408747. [Google Scholar] [CrossRef] [PubMed]
  4. Kleffel, S.; Posch, C.; Barthel, S.R.; Mueller, H.; Schlapbach, C.; Guenova, E.; Elco, C.P.; Lee, N.; Juneja, V.R.; Zhan, Q.; et al. Melanoma cell-Intrinsic PD-1 receptor functions promote tumor growth. Cell 2015, 162, 1242–1256. [Google Scholar] [CrossRef] [PubMed] [Green Version]
  5. Kiyasu, J.; Miyoshi, H.; Hirata, A.; Arakawa, F.; Ichikawa, A.; Niino, D.; Sugita, Y.; Yufu, Y.; Choi, I.; Abe, Y.; et al. Expression of programmed cell death ligand 1 is associated with poor overall survival in patients with diffuse large B-cell lymphoma. Blood 2015, 126, 2193–2201. [Google Scholar] [CrossRef] [PubMed]
  6. Xu-Monette, Z.Y.; Zhou, J.; Young, K.H. PD-1 expression and clinical PD-1 blockade in B-cell lymphomas. Blood 2018, 131, 68–83. [Google Scholar] [CrossRef] [PubMed] [Green Version]
  7. Gravelle, P.; Burroni, B.; Pericart, S.; Rossi, C.; Bezombes, C.; Tosolini, M.; Damotte, D.; Brousset, P.; Fournié, J.J.; Laurent, C. Mechanisms of PD-1/PD-L1 expression and prognostic relevance in non-Hodgkin lymphoma: A summary of immunohistochemical studies. Oncotarget 2017, 8, 44960–44975. [Google Scholar] [CrossRef] [Green Version]
  8. Xu-Monette, Z.Y.; Xiao, M.; Au, Q.; Padmanabhan, R.; Xu, B.; Hoe, N.; Rodríguez-Perales, S.; Torres-Ruiz, R.; Manyam, G.C.; Visco, C.; et al. Immune profiling and quantitative analysis decipher the clinical role of immune-checkpoint expression in the tumor immune microenvironment of DLBCL. Cancer Immunol. Res. 2019, 7, 644–657. [Google Scholar] [CrossRef]
  9. Ansell, S.M.; Minnema, M.C.; Johnson, P.; Timmerman, J.M.; Armand, P.; Shipp, M.A.; Rodig, S.J.; Ligon, A.H.; Roemer, M.G.M.; Reddy, N.; et al. Nivolumab for relapsed/refractory diffuse large B-cell lymphoma in patients ineligible for or having failed autologous transplantation: A single-arm, phase II study. J. Clin. Oncol. 2019, 37, 481–489. [Google Scholar] [CrossRef]
  10. Iwai, Y.; Hamanishi, J.; Chamoto, K.; Honjo, T. Cancer immunotherapies targeting the PD-1 signaling pathway. J. Biomed. Sci. 2017, 24, 26. [Google Scholar] [CrossRef] [Green Version]
  11. Champiat, S.; Dercle, L.; Ammari, S.; Massard, C.; Hollebecque, A.; Postel-Vinay, S.; Chaput, N.; Eggermont, A.; Marabelle, A.; Soria, J.C.; et al. Hyperprogressive disease is a new pattern of progression in cancer patients treated by anti-PD-1/PD-L1. Clinical. Cancer Res. 2017, 23, 1920–1928. [Google Scholar] [CrossRef] [PubMed] [Green Version]
  12. Ratner, L.; Waldmann, T.A.; Janakiram, M.; Brammer, J.E. Rapid progression of adult T-cell leukemia–lymphoma after PD-1 inhibitor therapy. N. Engl. J. Med. 2018, 378, 1947–1948. [Google Scholar] [CrossRef] [PubMed]
  13. Stack, E.C.; Wang, C.; Roman, K.A.; Hoyt, C.C. Multiplexed immunohistochemistry, imaging, and quantitation: A review, with an assessment of Tyramide signal amplification, multispectral imaging and multiplex analysis. Methods 2014, 70, 46–58. [Google Scholar] [CrossRef]
  14. Feng, Z.; Puri, S.; Moudgil, T.; Wood, W.; Hoyt, C.C.; Wang, C.; Urba, W.J.; Curti, B.D.; Bifulco, C.B.; Fox, B.A. Multispectral imaging of formalin-fixed tissue predicts ability to generate tumor-infiltrating lymphocytes from melanoma. J. Immunother. Cancer 2015, 3, 47. [Google Scholar] [CrossRef] [PubMed] [Green Version]
  15. Carey, C.D.; Gusenleitner, D.; Lipschitz, M.; Roemer, M.G.M.; Stack, E.C.; Gjini, E.; Hu, X.; Redd, R.; Freeman, G.J.; Neuberg, D.; et al. Topological analysis reveals a PD-L1-associated microenvironmental niche for Reed-Sternberg cells in Hodgkin lymphoma. Blood 2017, 130, 2420–2430. [Google Scholar] [CrossRef] [PubMed]
  16. Muenst, S.; Hoeller, S.; Willi, N.; Dirnhofera, S.; Tzankov, A. Diagnostic and prognostic utility of PD-1 in B cell lymphomas. Dis. Markers 2010, 29, 47–53. [Google Scholar] [CrossRef]
  17. Laurent, C.; Charmpi, K.; Gravelle, P.; Tosolini, M.; Franchet, C.; Ysebaert, L.; Brousset, P.; Bidaut, A.; Ycart, B.; Fournié, J.J. Several immune escape patterns in non-Hodgkin’s lymphomas. Oncoimmunology 2015, 4, e1026530. [Google Scholar] [CrossRef] [Green Version]
  18. McCord, R.; Bolen, C.R.; Koeppen, H.; Kadel, E.E., 3rd; Oestergaard, M.Z.; Nielsen, T.; Sehn, L.H.; Venstrom, J.M. PD-L1 and tumor-associated macrophages in de novo DLBCL. Blood Adv. 2019, 3, 531–540. [Google Scholar] [CrossRef] [PubMed]
  19. Cao, H.; Heazlewood, S.Y.; Williams, B.; Cardozo, D.; Nigro, J.; Oteiza, A.; Nilsson, S.K. The role of CD44 in fetal and adult hematopoietic stem cell regulation. Haematologica 2016, 101, 26–37. [Google Scholar] [CrossRef] [Green Version]
  20. Liu, J.; Xiao, Z.; Wong, S.K.; Tin, V.P.; Ho, K.Y.; Wang, J.; Sham, M.H.; Wong, M.P. Lung cancer tumorigenicity and drug resistance are maintained through ALDH(hi)CD44(hi) tumor initiating cells. Oncotarget 2013, 4, 1698–1711. [Google Scholar] [CrossRef] [Green Version]
  21. Schatton, T.; Schütte, U.; Frank, N.Y.; Zhan, Q.; Hoerning, A.; Robles, S.C.; Zhou, J.; Hodi, F.S.; Spagnoli, G.C.; Murphy, G.F.; et al. Modulation of T-cell activation by malignant melanoma initiating cells. Cancer Res. 2010, 70, 697–708. [Google Scholar] [CrossRef] [Green Version]
  22. Zhang, Q.W.; Liu, L.; Gong, C.Y.; Shi, H.S.; Zeng, Y.H.; Wang, X.Z.; Zhao, Y.W.; Wei, Y.Q. Prognostic significance of tumor-associated macrophages in solid tumor: A meta-analysis of the literature. PLoS ONE 2012, 7, e50946. [Google Scholar] [CrossRef] [Green Version]
  23. Gwak, J.M.; Jang, M.H.; Kim, D.I.; Seo, A.N.; Park, S.Y. Prognostic value of tumor-associated macrophages according to histologic locations and hormone receptor status in breast cancer. PLoS ONE 2015, 10, e0125728. [Google Scholar] [CrossRef]
  24. Cassetta, L.; Pollard, J.W. Targeting macrophages: Therapeutic approaches in cancer. Nat. Rev. Drug. Discov. 2018, 17, 887–904. [Google Scholar] [CrossRef] [PubMed]
  25. Rossille, D.; Gressier, M.; Damotte, D.; Maucort-Boulch, D.; Pangault, C.; Semana, G.; Le Gouill, S.; Haioun, C.; Tarte, K.; Lamy, T.; et al. Groupe Ouest-Est des Leucémies et Autres Maladies du Sang; Groupe Ouest-Est des Leucémies et Autres Maladies du Sang. High level of soluble programmed cell death ligand 1 in blood impacts overall survival in aggressive diffuse large B-Cell lymphoma: Results from a French multicenter clinical trial. Leukemia 2014, 28, 2367–2375. [Google Scholar] [PubMed]
  26. Thibult, M.L.; Mamessier, E.; Gertner-Dardenne, J.; Pastor, S.; Just-Landi, S.; Xerri, L.; Chetaille, B.; Olive, D. PD-1 is a novel regulator of human B-cell activation. Int. Immunol. 2012, 25, 129–137. [Google Scholar] [CrossRef] [Green Version]
  27. Juweid, M.E.; Wiseman, G.A.; Vose, J.M.; Ritchie, J.M.; Menda, Y.; Wooldridge, J.E.; Mottaghy, F.M.; Rohren, E.M.; Blumstein, N.M.; Stolpen, A.; et al. Response assessment of aggressive non-Hodgkin’s lymphoma by integrated International Workshop Criteria and fluorine-18–fluorodeoxyglucose positron emission tomography. J. Clin. Oncol. 2005, 23, 4652–4661. [Google Scholar] [CrossRef] [PubMed]
  28. Cheson, B.D.; Pfistner, B.; Juweid, M.E.; Gascoyne, R.D.; Specht, L.; Horning, S.J.; Coiffier, B.; Fisher, R.I.; Hagenbeek, A.; Zucca, E.; et al. International Harmonization Project on Lymphoma. Revised response criteria for malignant lymphoma. J. Clin. Oncol. 2007, 25, 579–586. [Google Scholar] [CrossRef]
  29. Wahiduzzaman, M.; Ota, A.; Karnan, S.; Hanamura, I.; Mizuno, S.; Kanasugi, J.; Rahman, M.L.; Hyodo, T.; Konishi, H.; Tsuzuki, S.; et al. Novel combined Ato-C treatment synergistically suppresses proliferation of Bcr-Abl-positive leukemic cells in vitro and in vivo. Cancer Lett. 2018, 433, 117–130. [Google Scholar] [CrossRef] [PubMed]
  30. Asai, A.; Karnan, S.; Ota, A.; Takahashi, M.; Damdindorj, L.; Konishi, Y.; Hossain, E.; Konishi, H.; Nagata, A.; Yokoo, K.; et al. High-resolution 400K oligonucleotide array comparative genomic hybridization analysis of neurofibromatosis type 1-associated cutaneous neurofibromas. Gene 2015, 558, 220–226. [Google Scholar] [CrossRef]
  31. Huber, W.; von Heydebreck, A.; Sültmann, H.; Poustka, A.; Vingron, M. Variance stabilization applied to microarray data calibration and to the quantification of differential expression. Bioinformatics 2002, 18, S96–S104. [Google Scholar] [CrossRef] [PubMed]
  32. Subramanian, A.; Tamayo, P.; Mootha, V.K.; Mukherjee, S.; Ebert, B.L.; Gillette, M.A.; Paulovich, A.; Pomeroy, S.L.; Golub, T.R.; Lander, E.S.; et al. Gene set enrichment analysis: A knowledge-based approach for interpreting genome-wide expression profiles. Proc. Natl. Acad. Sci. USA 2005, 102, 15545–15550. [Google Scholar] [CrossRef] [PubMed] [Green Version]
  33. Mootha, V.K.; Lindgren, C.M.; Eriksson, K.F.; Subramanian, A.; Sihag, S.; Lehar, J.; Puigserver, P.; Carlsson, E.; Ridderstråle, M.; Laurila, E.; et al. PGC-1alpha-responsive genes involved in oxidative phosphorylation are coordinately downregulated in human diabetes. Nat. Genet. 2003, 34, 267–273. [Google Scholar] [CrossRef] [PubMed]
  34. Kanda, Y. Investigation of the freely available easy-to-use software ’EZR’ for medical statistics. Bone. Marrow. Transplant. 2013, 48, 452–458. [Google Scholar] [CrossRef] [Green Version]
Figure 1. Representative multicolor immunofluorescent staining images of a patient with de novo DLBCL. (A) PD-1 (green) was expressed by PAX-5 (pink)-positive cells, which represent DLBCL cells. The lower panel is a merged image of the upper and middle panels. (B) PD-L1 (green) was expressed by CD68 (pink)-positive cells, which represent macrophages, in the TME, but not by PAX-5 (orange)-positive cells. The lower panels are merged images of the PD-L1/DAPI panels and middle panels. The images were captured using a digital pathology slide scanner (Aperio CS2 (Leica Biosystems, Richmond, IL, USA)) and analyzed using Aperio ImageScope software. PD-1, programmed death-1; PD-L1, programmed death-ligand 1; DLBCL, diffuse large B-cell lymphoma; PAX5, paired box 5; TME, tumor microenvironment.
Hemato 02 00023 g001
Figure 2. PFS and PD-1 expression on DLBCL cells. Patients with de novo DLBCL treated with immunochemotherapies and expressing PD-1 on lymphoma cells showed significantly poorer PFS. PFS, progression-free survival; PD-1, programmed death-1; DLBCL, diffuse large B-cell lymphoma.
Hemato 02 00023 g002
Figure 3. Effects of PD-1 expression on growth, migration, and cellular signaling of VAL cells. (A) MTT assay showing cell proliferation in VAL/mock and VAL/PD-1-KO cell clones. (B) Colony formation of VAL/mock and VAL/PD-1-KO cell clones on soft agar via a colony formation assay. (C) Comparison of the cell migration activity of VAL/PD-1-KO with VAL/mock cell clones. (D) Western blotting analyses for phosphorylation level of p42/44, p38, Akt, and S6 kinase in VAL/mock and VAL/PD-1-KO cell clones. ns, not significant; * p < 0.005. PD-1, programmed death-1.
Hemato 02 00023 g003
Figure 4. Gene expression analysis between VAL/mock and VAL/PD-1-KO cells. (A) Heat map of the top 86 upregulated and downregulated genes in VAL/PD-1-KO cells. The heat map, with the corresponding gene name on the right side, was constructed using GSEA version 2.2.4 software (Broad Institute). (B,C) Representative GSEA enrichment plots and corresponding heat maps of the indicated gene sets in VAL/mock and VAL/PD-1-KO cell clones. (B) Negative regulation of adaptive immune response signaling. (C) Regulation of B-cell-mediated immunity. Genes contributing to enrichment are shown in rows, and the sample is shown in one column on the heat map. Expression is represented as a gradient from high (red) to low (blue). FDR, false discovery rate; NES, normalized enrichment score.
Hemato 02 00023 g004
Figure 5. Nivolumab inhibited cell proliferation via induction of direct apoptosis in VAL/mock cells compared with VAL/PD-1-KO cells. (A) MTT assay showing the relative growth rate of VAL/mock and VAL/PD-1-KO cell clones in the presence of 1 mg/mL of nivolumab alone after 48 h (blue, VAL/mock; black and red, VAL/PD-1-KO cell clones). Nivolumab inhibited cell proliferation of VAL/mock cells compared with that of VAL/PD-1-KO cells. The relative optical density (OD) at 595 nm on each indicated day was normalized to (divided by) that on day 0. (B,C) Nivolumab induced direct apoptosis in VAL/mock cells while it did not in VAL/PD-1-KO cell clones. ns, not significant; * p < 0.005. PD-1, programmed death-1.
Hemato 02 00023 g005
Table 1. Patient characteristics.
ParameterNumber of Patients
(n, %)
Age, years
Median73 (43–90)
≤60516%
>602784%
Sex
M2063%
F1237%
Serum LD
Normal1444%
Elevated1856%
Ann Arbor stage
I or II1444%
III or IV1856%
Bulky mass (>7 cm)39%
COO (by Hans)
GCB1134%
Non-GC1966%
N/A2
Primary treatments
R-CHOP or R-CHOP-like32100%
LD, lactate dehydrogenase; COO, cell of origin; GCB, germinal center B-cell; non-GC, non-germinal center; N/A, not available; R-CHOP, rituximab, cyclophosphamide, doxorubicin, vincristine, prednisolone.
Table 2. Expression of PD-1 and PD-L1 in patients with de novo DLBCL.
Number of Patients
(n, %)
PAX5+ cells (B-lymphoma cells)
PD-1Positive1959%
Negative1341%
N/A0
PD-L1Positive13%
Negative2997%
N/A2
CD68+ cells (macrophages) in TME
PD-L1Positive2486%
Negative414%
N/A4
CD3+ cells (T-cells) in TME
PD-1Positive2489%
Negative311%
N/A5
PD-1, programmed death-1; PD-L1, programmed death-ligand 1; DLBCL, diffuse large cell B-cell lymphoma; N/A, not available; TME, tumor microenvironment.
Table 3. Clinical relevance of PD-1 expression on lymphoma cells.
ParameterNumber of PatientsPD-1 Positivep
(n = 32)No/Total (%)
Age, years
≤6052/5 (40%)0.69
>602717/27 (63%)
Serum LD
Normal146/14 (42%)0.55
Elevated1813/18 (72%)
Ann Arbor stage
I or II147/14 (50%)0.77
III or IV1812/18 (66%)
COO (by Hans)
GCB126/12 (50%)0.76
Non-GCB1813/18 (72%)
N/A20/2
PD-L1 expression on tumor cells
Positive10/1 (0%)N/A
Negative2816/28 (57%)
N/A33/3
PD-1, programmed death-1; No, number; LD, lactate dehydrogenase; COO, cell of origin; GCB, germinal center B-cell; PD-L1, programmed death-ligand 1; N/A, not available.
Publisher’s Note: MDPI stays neutral with regard to jurisdictional claims in published maps and institutional affiliations.

