Article

Effect of Stoichiometry on Shape Memory Properties of Ti-Ni-Hf-Cu-Nb Shape Memory Alloys Manufactured by Suspended Droplet Alloying

1
School of Metallurgy and Materials, University of Birmingham, Edgbaston, Birmingham B15 2TT, UK
2
School of Electric Mechanical Engineering, Guangdong University of Technology, Guangzhou 510060, China
3
Department of Mechanical Engineering, University of Birmingham, Edgbaston, Birmingham B15 2TT, UK
4
Institute of New Materials Guangdong Academy of Science, Guangzhou 510651, China
5
Institute of Medicine and Health, Guangdong Academy of Science, Guangzhou 510500, China
*
Author to whom correspondence should be addressed.
Submission received: 5 November 2021 / Revised: 26 December 2021 / Accepted: 30 December 2021 / Published: 5 January 2022
(This article belongs to the Special Issue Solids in Europe)

Abstract

:
A novel Ti-Ni-Hf-Cu-Nb shape memory alloy has been developed by a new combinatorial alloy synthesis method, the Suspended Droplet Alloying. The influence of alloying elements on the transformation temperature, the microstructure and the shape memory effect of this alloy have also been studied. It was found that Cu has a greater negative influence on the transformation temperature of Ti-Ni-Hf-CuX alloys (about −5 K/at.%) than on the Ti-Ni-CuX alloys (−0.67 K/at.%). In addition, the negative effect intensifies with increasing Hf content. The transformation temperature rapidly decreases with increasing Nb composition in the Ti-Ni-Cu-Nb and Ti-Ni-Hf-Cu-Nb alloys, with the solid solution of Nb in the matrix being 1 at.%. A Ti-Ni-Cu-Hf-Nb alloy with high thermal cycle stability has been developed, where the alloying elements affect the transformation behaviour via altering the slipping energy and forming different types of precipitations.

1. Introduction

Shape memory alloys (SMAs) have attracted much attention since they were first reported by the U.S. Naval Ordnance Lab in 1962 due to their unique properties including shape memory effect (SME) and superelasticity (SE) [1,2,3]. Their unique characteristic is associated with a diffusionless reversible martensitic transformation (MT) between two phases: the martensite phase and the austenite phase, by introducing shape and volumetric changes at applied temperature or load [2]. The peculiar characteristics of SMAs make them a very promising candidate for structural and functional materials in a wide range of applications including aerospace, automotive, medical implants/instruments and energy industries [1,2,4]. Ti-Ni-based alloys are low cost, high performance SMAs, among which Ti-Ni-Cu and Ti-Ni-Nb alloys have good thermal cycling stability, but the hysteresis of Ti-Ni-Nb alloys is much larger than Ti-Ni-Cu alloys [2,5,6,7,8,9]. Chluba et al. [10] reported a Ti54Ni34Cu12 thin film with fine Ti2Cu precipitates showed very good thermo-mechanical stability due to the fine epitaxy Ti2Cu precipitates reducing Nb is not only an effective element to increase the thermo-mechanical stability, but also increases the hysteresis of transformation (by 100 K with 10 at.% Nb) in Ti-Ni-based SMAs, due to fine β-Nb particles around the precipitates [6]. Another element, Hf, is effective for increasing the martensitic transformation start temperature (Ms) of Ti-Ni-based SMAs. However, its addition reduces the recoverable deformation and increases the hysteresis of transformation (up to 200 K at 30 at.% Hf) [2], which is the difference between martensitic transformation finish temperature (Mf) and the austenitic transformation starts temperature (As). The combination of good thermal cycling stability, low hysteresis and high MT has been a great challenge for several decades, due to the complex microstructure and high chemical composition sensitivity of SMAs [11].
Recently, a few quaternary SMAs have been developed to improve shape memory performance. Vermaut et al. studied Ti25Ni50−xZr25Cux SMAs with high Cu content (15 and 20 at.%) produced by melt spinning, but the application is limited by the process and semi-crystallised microstructure [12]. Lin et al. reported a linear relationship between Ms, transformation enthalpy during cooling (∆Hc) and Cu content in Ti50Ni25−xPd25−yCux+y high temperature SMAs [13], but the cost of this alloy is expensive. Meng et al. studied the thermal stability, transformation temperatures (TTs), and microstructure of Ti36Ni49−xHf15Cux alloys, but the addition of Cu shows a small improvement on its thermal stability [14,15,16]. Wang et al. studied the influence of Nb content on the Ti50Ni50Cu10 SMA [17]; Tong et al. successfully produced a Ti-Ni-Cu-Nb alloy with stable thermal cycles via arc-melting [18]. However, the TTs of Ti-Ni-Cu-Nb alloys have not been improved comparing to Ti-Ni alloys. Yi et al. studied the Ti-Ni-Hf-Ag alloys [19] and Ti-Ni-Hf-Y alloys [20] with high transformation temperature but the cost of these doping elements are expensive. Li et al. fabricated Ti-Ni-Hf-Cu thin-film specimens and studied the phase transformation behaviour, but the use of thin film materials for structural applications is challenging [21]. Yi et al. improved the mechanical properties of Ti-Ni-Hf-Cu via introducing (Ti, Hf)2Ni precipitates, which indicates a potential way to improve the shape recovery of Ti-Ni based SMAs [22]. Lemke et al. [23] and Chen et al. [24] reported that the Ti-Ni-Hf-Nb alloys have good workability and competitive TTs, indicating the possibility of further development of Ti-Ni-based SMAs.
From the aforementioned research, it is seen that the quaternary or more complex SMAs system has not been sufficiently investigated. One of the reasons is the difficulty of producing a vast quantity of complicated alloys with precision in a short time frame. Hence, we developed a rapid alloying system, Suspended Droplet Alloying (SDA), to conquer the problem and systematically study the influence of alloying elements on the MT of Ti-Ni-based SMAs. The specifics of this technique are detailed in a previously published study [25]. Here, we proposed using Hf to improve the Ms while using Nb and Cu to adjust the hysteresis and thermal stability of Ti-Ni-based SMAs by prompting nucleation, forming various precipitates and altering the matrix composition. As such, Ti-rich Ti-Ni-Cu-Nb and Ti-Ni-Hf-Cu-Nb alloys were produced by the SDA process to develop high transformation temperature and high thermo-mechanical stability SMAs. This study focused on thermal cycle stability, MT behaviours and microstructure investigation of novel Ti-Ni-Hf-Cu-Nb SMAs developed via the SDA technique.

2. Materials and Experimental Methods

Elemental Ti, Ni, Cu, and Nb wires with 99.9% purity used in this study were provided by Advant Ltd. (High Wycombe, UK). The purity of Hf and Zr wires was 97% due to the difficulty of separating these elements from each other. Samples were fabricated using the Quantum SDA machine under Argon atmosphere (oxygen level 30 ppm) and then sectioned by Agie Charmilles CUT 20 P Electrical Discharge Machining (EDM), before being ground and polished (by 0.04 µm compound) for further investigation. JOEL 7000 and TESCAN field emission SEM, equipped with Oxford Inca Energy-Dispersive X-ray Spectroscopy (EDS) system was applied to investigate the microstructure and chemical composition with compositional accuracy around 1 wt.%.
The micro-pillar test was performed by CFEI Quanta 3D FEG FIB-SEM with Alemnis nanoindentation system. The pillar was milled to 10 μm diameter, 32 μm height and the loading rate of compression test was 10 μN/s.
Samples were cut to a size of 1 mm ± 0.5 mm thickness and 4 mm ± 1 mm diameter for Differential Scanning Calorimetry (DSC) testing, after the EDS chemical composition measurement. The heating and cooling rate of DSC testing were 10 K/min. The Mettler Toledo DSC1 system was applied to understand the transformation behaviour from 223 K to 473 K. The first thermal cycle of DSC testing was excluded from the results as it may have been affected by the sample preparation process. The TTs, including Ms, Mf, As and austenite transformation finish temperature (Af) were determined by the tangent method and the enthalpies were the area between the transformation peak and baseline in the DSC curve [26]. The typical error of transformation temperature measurement is about 10 K.
The Mettler Toledo DSC500 system was used to determine the heat treatment temperature by performing the test from RT (298 K) to 1773 K at 10 K/min. An isothermal period was held at 1773 K for 30 min before cooling at the same rate. The sample was protected by 99.995% purity Argon atmosphere during the experiment.
The samples were wrapped with Tantalum wire and sealed in a vacuumed steel tube to prevent oxidation during post heat treatment.

3. Results and Discussions

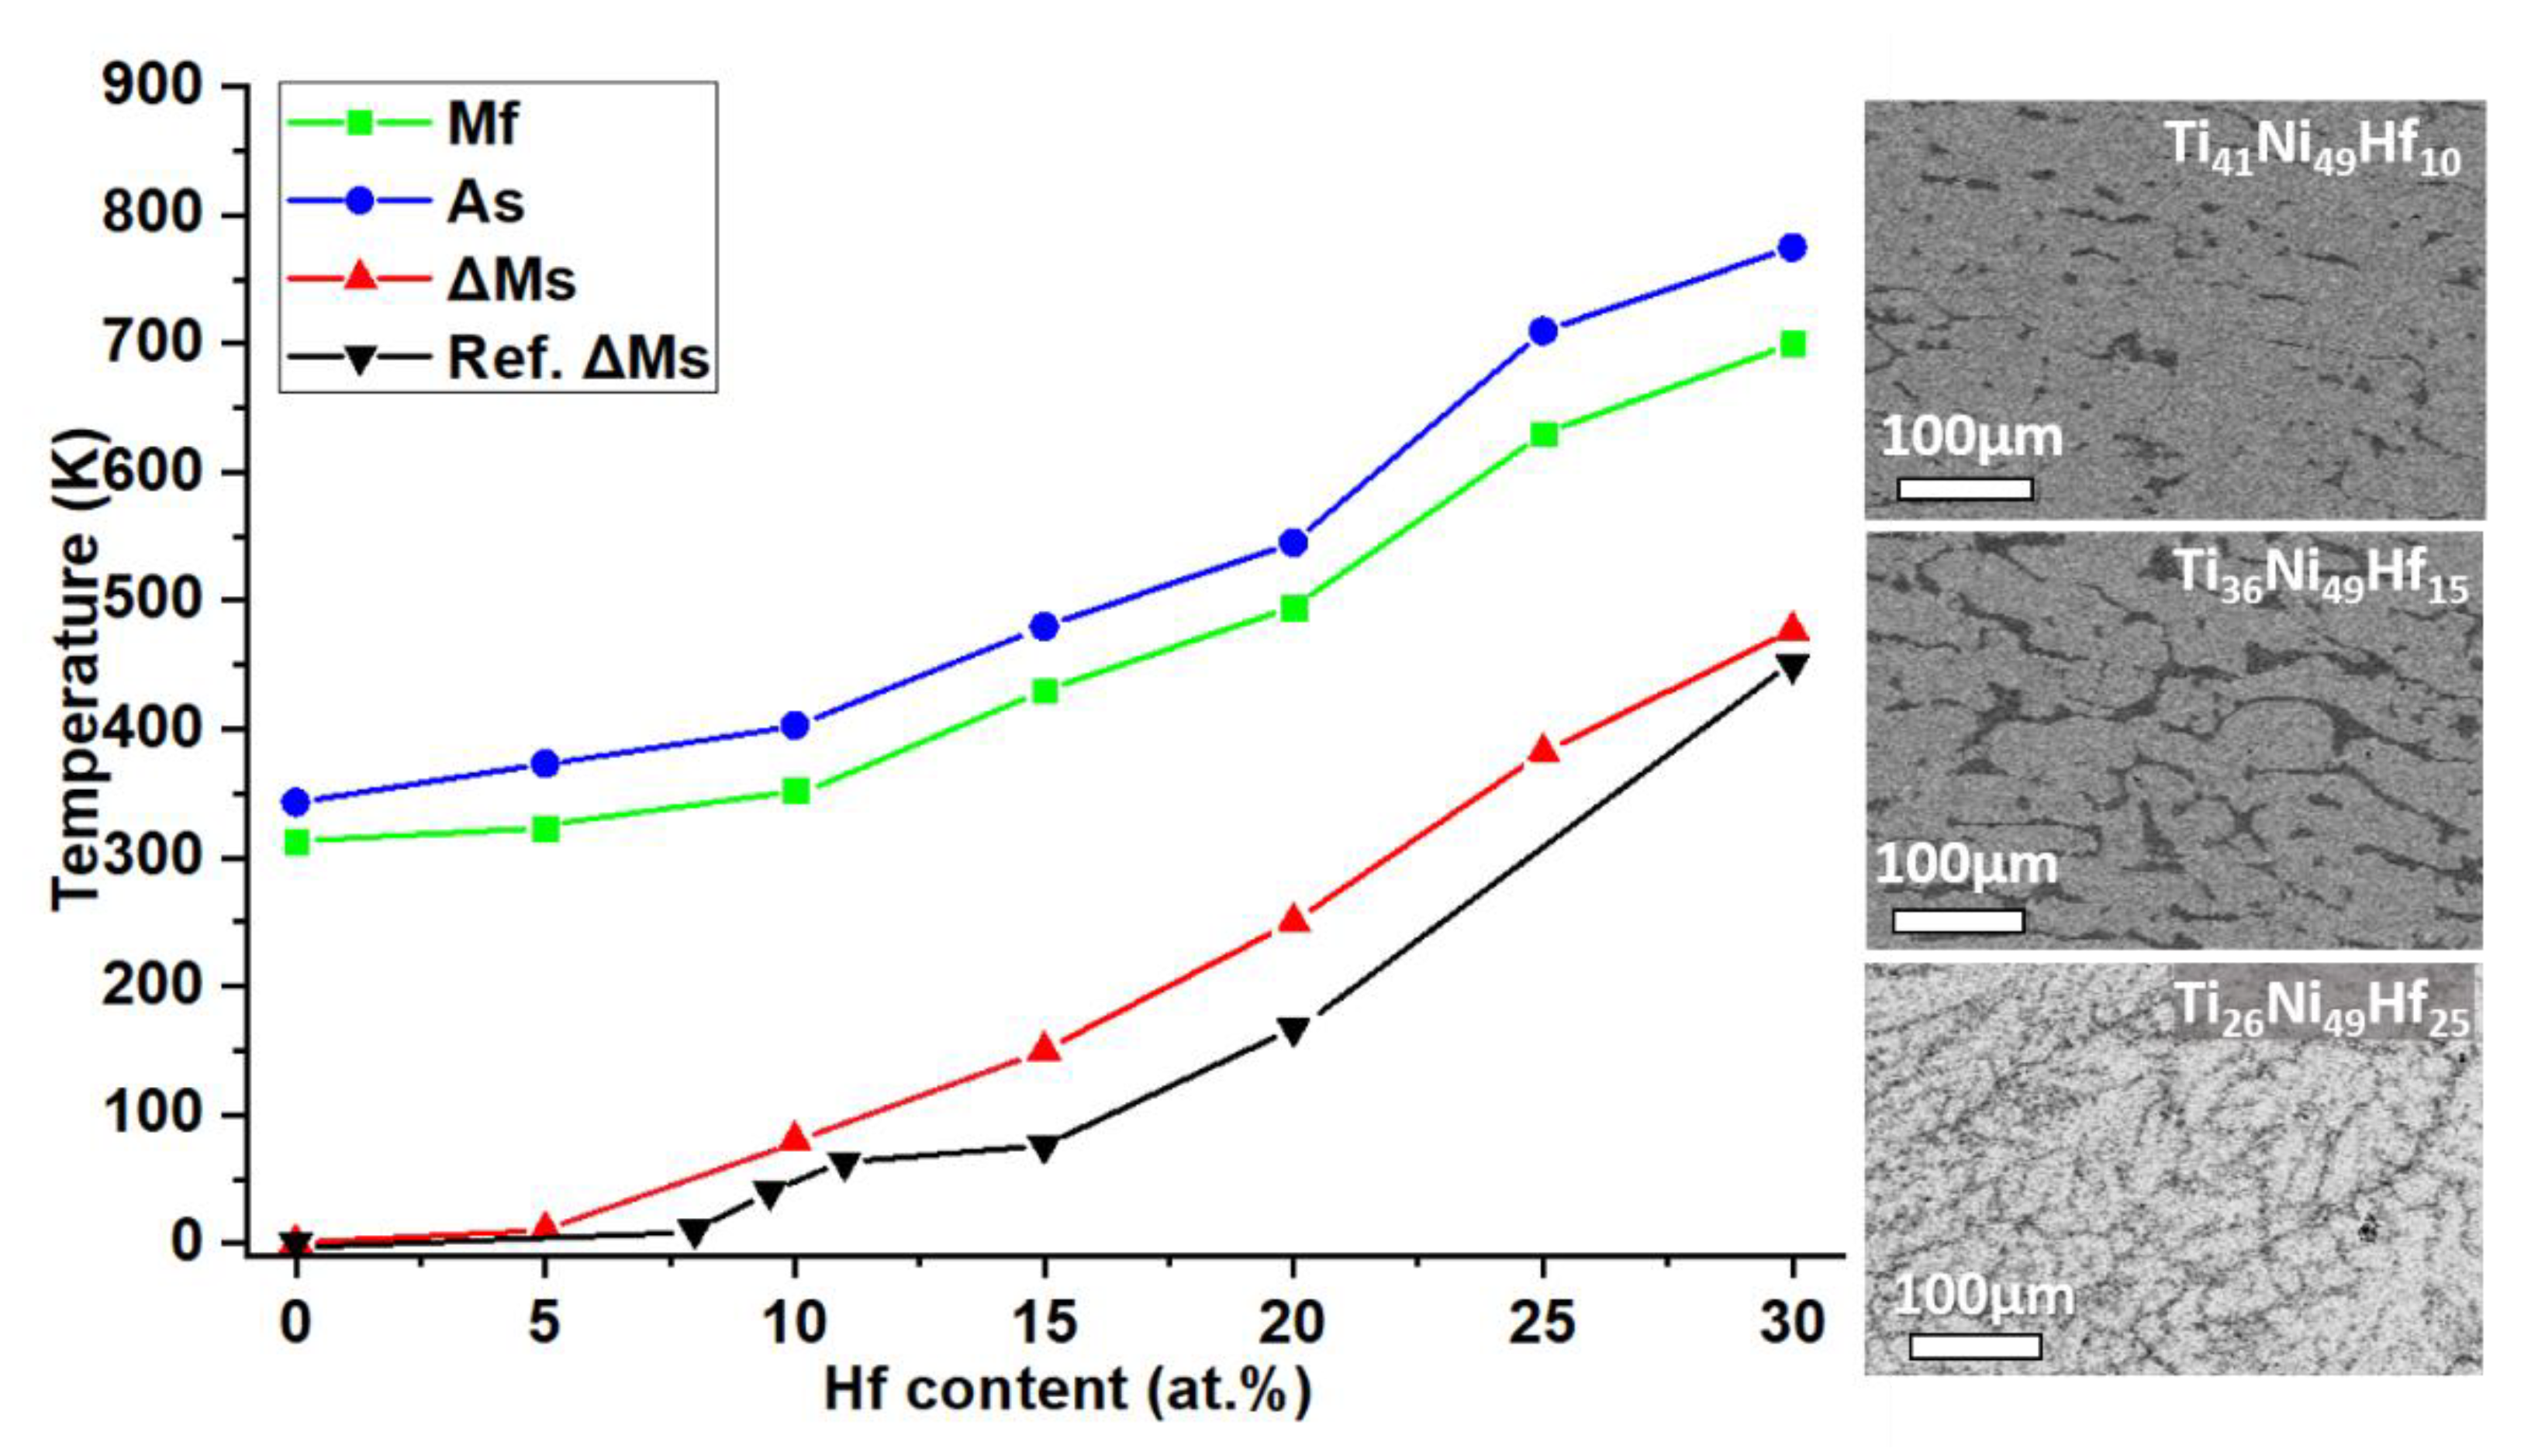
3.1. Influence of Hf and Cu Content on Transformation Temperature of Ti-Ni Based Shape Memory Alloys

Ti51Ni49, Ti51Ni39Cu10, Ti51Ni24Cu25, Ti46Ni49Hf5 and Ti36Ni44Hf15Cu5 alloys were fabricated by SDA technique and studied by DSC testing after solution treatment, as shown in Figure 1. The addition of Hf reduced the thermal cycle stability (i.e., the Ms decreases as the number of thermal cycles increases) of Ti-Ni-based SMAs, as the Ms of Ti51Ni49 alloys decreased by 12 K after 8 cycles while the Ms of Ti46Ni49Hf5 alloys decreased by 18 K after the same number of cycles. Cu was shown to significantly improve the thermal stability of Ti-Ni alloys as both the Ti51Ni39Cu10 and Ti51Ni24Cu25 alloys displayed constant Ms after 3 cycles. Ti36Ni44Hf15Cu5 SMA also had high Ms and acceptable thermal stability, with the Ms of this alloy decreasing by about 8 K in 8 cycles, surpassing the Ti-Ni and Ti-Ni-Hf SMAs. It is well known that the Cu is able to improve the thermal cycle stability of Ti-Ni-Cu SMAs by reducing the critical shearing stress (c44) of the lattice [27]. The results in Figure 1 show that the Cu improves the thermal cycle stability of the Ti-Ni-Hf alloys with a small compromise of Ms.
Prior to creating quaternary and higher complicated alloys, it is necessary to investigate the influence of different elements (Cu, Hf, and Nb) on the Ms and hysteresis. Figure 2 shows the influence of Hf composition on the Ms of the solution treated (1273 K, 2 h followed by water quench) Ti51XNi49HfX SMA produced by the SDA process. The (∆Ms) in Figure 2 is the Ms difference between Ti-Ni-Hf and Ti51Ni49 SDA samples at the same solution treated condition, while the Ref. ∆Ms is the difference between Ms of Ti-Ni-Hf alloys reported in the literature and the Ms of Ti51Ni49 SDA samples [2,9,28]. The effect of Hf content on Ms can be simplified as a linear function, which is
Ms (x) = 16x + 333
where x is the atomic ratio of Hf content. Although a wide range of Ti-Ni-Hf SMAs have been reported, the manufacturing process and post treatment vary among them. Since the manufacturing process and post treatment has a strong impact on the shape memory behaviours, it is difficult to compare the shape memory behaviours between literature. In this study, we produced Ti51Ni49−xHfx SMAs with Hf content from 0 to 30 at.% by the SDA technique and consistent heat treatment. It is found that, the Hf content has a linear influence on the Ms and the coefficient is 16 K/at.%. Second, the Ms of Ti-rich Ti-Ni-Hf alloys is slightly higher than the Ni-rich alloys. It is due to the Ti-rich alloys ensures the low Ni content in the matrix, which has a strong negative influence on the Ms of Ti-Ni-based alloys [29]. It has been reported in the literature that the Ms of Ni-rich Ti-Ni-Hf alloys increased after ageing, due to the forming of (Ti+Hf)3Ni4 precipitates reduced the Ni content in the matrix [28]. In this study, the Ti-rich alloys show higher Ms without complicated ageing treatment as they ensure low Ni content in the matrix. Third, Figure 2 shows the transformation hysteresis of Ti51Ni49−xHfx SMAs increases with increasing Hf content. However, the hysteresis in SDA samples is around 100 K, which is about half of the hysteresis reported by literature [2,30]. It has been reported that the hysteresis in Ti-Ni-based SMAs is caused by the heterogeneity of the materials, including grain boundary and phase interface [31]. The microstructure of Ti-Ni-Hf samples shows that the grain size decreases with increasing Hf content, which could be the reason for the variant of hysteresis. Compared to the alloys produced by arc melting in Paul’s study [30], the samples fabricated by SDA process have smaller grain size and better homogeneity. The higher amount of Hf in the materials provided more nucleation sites and enlarged the temperature gradient during solidification, therefore the grain size was reduced.
Previous studies detailed in literature and experimental results of SDA samples have shown that Hf significantly increases the Ms. Figure 3a shows the Cu decreases the Ms marginally, with increasing composition, which is consistent with the results reported in the literature [16,32]. The influence of Cu content on the Ms of solution treated (1073 K, 2 h followed by water quench) Ti51Ni49−xCux alloys can be described as:
Ms (x) = −0.67x +344
where x is Cu atomic composition and Ms in K. It is well known that Cu is able to improve the thermal cycle stability and reduce the hysteresis of Ti-Ni-based SMAs, but the systemic study on its effect on the Ms has not been reported. The results in Figure 3a and Equation (2) shows the Cu has a slightly negative effect on the Ms of Ti-Ni-Cu alloys.
Figure 3b shows that Cu has a greater influence on the Ms of quaternary Ti-Ni-Hf-Cu alloys than that of the ternary alloys. Although some researchers have investigated the transformation behaviour of Ti36Ni49−XHf15CuX alloys, some compositions, including Ti36Ni39Hf15Cu10 and Ti41Ni49−XHf10CuX have not been reported [33]. Therefore, Ti36Ni44Hf15Cu5, Ti36Ni39Hf15Cu10 and Ti41Ni49−XHf10CuX alloys were fabricated. The influence of Cu content on Ms of as-fabricated Ti-Ni-Hf-Cu alloys is shown in Figure 3b. The higher the Hf composition, the greater the reduction observed in of Ms with increasing Cu composition. Meng et al. also found that Hf and Cu had a negative effect on each other [15]. For the Ti-Ni-Hf-Cu sample with 15 at.% Hf, the influence of Cu composition on Ms can be described as:
Ms (x) = −5.7x + 445
where x is the Cu content (atomic ratio) in Ti-Ni-Hf-Cu alloys with 15 at.% Hf. The Ti36Ni44Hf15Cu5 thin-film sample reported in the literature was manufactured by the melt-spun process, which has different transformation characteristics to the bulk materials (Ms is 420 K in as-cast condition, and 363 K after annealing) [14,34]. It shows good agreement between our study and the literature, the slightly higher Ms in thin-film samples might result from a faster cooling rate and smaller grain size. The Ms of 10 at.% Hf alloys also displayed linear reduction as the Cu content was increased and the SDA results agreed with the literature [33]. The relation can be described as:
Ms (x) = −5.1x + 380
where x is the Cu content (at.%) in Ti-Ni-Hf-Cu alloys with 10 at.% Hf. The results demonstrated that Hf and Cu have a negative influence on each other on TTs, as the Ms decrease in Ti41Ni49-xHf10Cux SMA (−5.7 K/at.%) was much greater than seen with the Ti51Ni49−xCux SMA (−0.67 K/at.%). It is likely due to the Hf atom has a larger size, which increases the misfit of the matrix lattice and requires more energy for transformation, while the Cu atom in the matrix not only reduced the shearing resistance but also reduces the critical transformation energy. It has been reported that the lowest slip energy direction of Ti-Ni-Hf alloys is different from Ti-Ni and Ti-Ni-Cu alloys, which means the greater negative effect of Cu in Ti-Ni-Hf-Cu alloys might result from the Hf increases the atom distance in the lattice and reduces the slipping energy [35].

3.2. Improving the Thermal Stability of Quaternary and Quinary Shape Memory Alloys

It is known that the Nb composition not only affects the As but also the deformation strain of Ti-Ni-Nb alloys [6,7]. The As increases from 308 K to 364 K as the Nb composition increases from 3 at.% to 20 at.%, as shown in Figure 4a. The influence of Nb-content on the Ms can be described as:
Ms (x) = −6.3x + 343
where the x is atomic Nb content in Ti-Ni-Nb alloys. The influence of Nb composition on Ms of Ti51−0.5xNi49−0.5xNbx alloys is slightly stronger than the Cu in Ti-Ni-Hf-Cu alloys (−6.3 K/at.% for Nb and −5.7 K/at.% for Cu). This is because the Nb solution in the matrix reduces the slipping energy. The atom size of Nb is larger than Cu, which means the influence of Nb content on the TTs is stronger.
Ti-rich alloy based on Ti51Ni39Cu10 alloys were chosen to study the influence of Nb on the Ms of Ti-Ni-Cu-Nb alloys, as this composition has good thermal stability, narrow transformation peak, and small hysteresis [10]. The results in Figure 4b show the Ms of alloys decreased from 338 K to 283 K with increasing Nb composition from 1 at.% to 3 at.%, while the thermal stability remained the same as the base alloy. This suggests that the increasing Nb composition decreases the Ms, but does not negatively affect the thermal stability of Ti51−0.5xNi39−0.5xCu10Nbx SMA when the Nb content is lower than 3 at.%. The influence of Nb content on the Ms can be described as:
Ms (x) = −19x + 338
where x is the Nb content (atomic ratio) in Ti-Ni-Cu-Nb alloys. Comparing the influence of Nb content on the Ti-Ni-Nb SMAs, a greater Ms reduction was seen in the Ti51−0.5xNi39−0.5xCu10Nbx alloys (−6.3 K/at.% in Ti51−0.5xNi49−0.5xNbx SMA). The negative effect on TTs in Ti-rich Ti-Ni-Cu-Nb SMA is greater than (Ti50Ni40Cu10)100−xNbx SMA reported by Wang et al. [17]. Since our study shows Cu and Nb also have a negative effect on each other on the transformation temperature. The lower TTs in Ti-rich Ti-Ni-Cu-Nb alloys is the result of higher Nb and Cu content. As a consequence of these results, the addition of Nb-content will be limited in further alloy development.
The microstructure of Ti51−0.5xNi39−0.5xCu10Nbx alloys reveal that the β-Nb particles present around the precipitates, and the EDS results show that the Nb content in the matrix does not exceed 1 at.% as the overall Nb content of the alloys increases as shown in Table 1. Figure 5 shows the backscatter images of Ti-Ni-Cu-Nb samples. The average spacing between Ti2(Ni, Cu) precipitates (dark contrast particles) are approximately 20 μm and the area fraction of white particles (Nb-rich) expanded as the Nb content increased. Most Nb-rich particles appear around the Ti2(Ni, Cu) precipitates. EDS analysis shows the typical Nb content around Ti2(Ni, Cu) precipitates was 2 to 4 at.% (marked as 2 in Figure 5), while the Nb content in the matrix varied from 0.5 to 1.6 at.% as the Nb increased from 1 to 3 at.% (marked as 1 in Figure 5). No Ti2Cu precipitates were found in these samples and the Ni composition was higher than Cu in Ti2(Ni, Cu) precipitates. The EDS point analysis on the β-Nb particles shows 6 to 26 at.% Nb content (marked as 3 in Figure 5). This indicates that the Nb affected the transformation behaviour mainly by changing the misfit between the matrix and precipitates, instead of altering the lattice parameters of the matrix like Cu and Hf do. The low magnification image Figure 5d shows the Ti-Ni-Cu-Nb samples built by SDA have a homogeneous microstructure and fine precipitates. Comparing to the (Ti50Ni40Cu10)100−xNbx SMA produced by arc melting, the maximum solution of Nb in matrix is similar (1.9 at.% in arc melt sample) but the size of β-Nb particles in SDA samples are about 50% smaller [17]. This indicates better compositional homogeneity and finer grains in SDA Ti-rich samples.
Since Nb does not affect the thermal stability of Ti-Ni-Cu alloys and the reduction of Ms is acceptable, the next step was to add Hf into the alloys to alter the transformation temperature and assess the thermal stability of Ti-Ni-Hf-Cu-Nb alloys. As shown in Figure 6, Ti41−0.5xNi39−0.5xCu10Hf10Nbx alloys were produced and investigated after 1273 K 3 h heat treatment. Eleven DSC cycles were applied to investigate the thermal stabilities of Ti-Ni-Hf-Cu-Nb samples. Figure 6a and c indicate that increasing Nb composition decreased the Ms of these alloys but thermal stability remained at the same level. The Ms decreased 25 K when the Nb content increase from 0 to 2 at.% as shown in Figure 6a. Figure 6c shows the Ti41−0.5xNi39−0.5xCu10Hf10Nbx alloys have good thermal stability as the difference of Ms between each thermal cycle are −0.6 to −0.8 K/cycles, and the decrease of Ms in 11 cycles was less than 10K. The Ti41−0.5xNi39−0.5xCu10Hf10Nbx alloys. Figure 6b shows the transformation heat of the third and eleventh cycles of Ti41−0.5xNi39−0.5xCu10Hf10Nbx alloy, and Figure 6d shows the averaged heat difference between each thermal cycle. The transformation heat decreases with increasing thermal cycles and Nb content, which indicates less and less materials are transformable during thermal cycles. This usually results from the accumulation of dislocation and the pinning effect of precipitation. The hysteresis of these samples was lower than 40 K, similar to the Ti-Ni binary alloys (40 K). Therefore, the results indicate that Nb can be included in Ti-Ni-Cu and Ti-Ni-Hf-Cu alloys for improving thermal-mechanical fatigue properties.
The dMs (Ms difference between cycles) increased with greater Nb composition up to 1 at.% but decreased as the Nb content reached 2 at.%, as shown in Figure 6c. Although the 1 at.% Nb alloy had the highest Ms, its thermal cycle stability was the poorest among these compositions, and the alloy with 2 at.% Nb addition was chosen for further research. The variation of transformation heat (enthalpies) increased as the Nb composition was raised, as shown in Figure 6b. Since the Nb composition in the matrix stayed constant when Nb content was higher than 1%, the transformation heat was significantly affected by Nb-rich particles around the precipitates. The alloys with 0.5 and 1 at.% Nb has the lowest enthalpies at the third thermal cycle while the alloys with 2 at.% Nb has the highest enthalpies. The slightly lower enthalpies in the 0.5 and 1 at.% alloys might be due to higher precipitate fraction in the materials. However, the sample with 2 at.% Nb has the largest enthalpies drop at the eleventh thermal cycle (about 3.5 J/g), which indicates the transformable materials in this alloy significantly reduced after 11 cycles. This could be the increasing size and quantity of the β-Nb particles hindered the recovery deformation. dH (∆H), which is the transformation heat difference between austenite and martensitic transformation, is often used to analyse transformation behaviour. The dH of the third cycle in Ti41−0.5xNi39−0.5xCu5Hf10Nbx alloys linearly increased when the Nb composition was lower than 1 at.% but only rose slightly when the content was between 1 and 2 at.% as shown in Figure 6d. The dH of the eleventh cycle, however, linearly increased with increasing Nb content. Both the transformation overall enthalpies and their difference reduced during thermal cycles in the low Nb content samples. The aforementioned results might be due to the reversible lattice deformation being suppressed by slips generated during thermal cycles, which introduced the residual martensite phase around the Nb-rich precipitates. This residual martensite phase reduces the nucleation energy of martensite and the reverse transformation. The variation of enthalpies shown in Figure 6d indicates the Nb content has a significant influence on the residual lattice deformation, as the transformation heat difference after 11 thermal cycles is larger in the sample with higher Nb content. The decreasing enthalpies and dH in low Nb samples is due to the irreversible lattice deformed and remaining deformation during the first few thermal cycles.

3.3. Microstructure and Shape Memory Behaviours of Ti-Ni-Hf-Cu-Nb Alloys

3.3.1. Transformation Temperature of Ti-Ni-Hf-Cu-Nb SMAs

The DSC result in the Figure 7a,b reveal that two alloys with similar compositions, Ti43Ni33Hf10.5Cu11Nb2.5 and Ti44Ni34Hf10Cu10Nb2, have different transformation behaviours under thermal cycles. Figure 7a shows the Ti43Ni33Hf10.5Cu11Nb2.5 alloy has a low transformation temperature (Ms = 248 K or −25 °C), but the transformation curves between thermal cycles are overlapped and the transformation peak is wide. Figure 7b shows the Ti44Ni34Hf10Cu10Nb2 alloy has a higher transformation temperature (Ms = 305 K or 32 °C), but the thermal stability of this alloy is weaker (Ms dropped from 305 K to 298 K in 7 cycles).

3.3.2. Microstructure of Ti-Ni-Hf-Cu-Nb Alloys

The backscatter images in Figure 8 show different microstructures of Ti-Ni-Hf-Cu-Nb alloys. Figure 8a shows the low Ms sample has fine precipitates (5 to 10 μm) and smaller dendrite size (10 to 20 μm), while Figure 8b shows the high Ms sample has coarse dendrites (20 to 40 μm) and several different types of precipitates of approximately 15 μm in size.
The EDS area analysis results in Table 2 show the composition of these alloys were Ti44.8Ni34Hf10Cu8.5Nb2.7 and Ti42Ni33Hf10.5Cu12Nb2.5, respectively, close to the target composition. EDS results of different phases are also included in Table 2. The Ti content in the matrix of the low Ms sample is 2 at.% lower than that in the high Ms sample, while the quantity of Hf in the matrix of low Ms sample is 1 at.% higher. In addition, the Cu content in the low Ms sample is 2 at.% greater than in the high Ms sample. The total composition of Ti and Hf in the matrix of low Ms sample is 50 at.%, 1 at.% lower than the high Ms sample. The Nb content in high Ms sample is 0.3 at.% higher. The lower Ti+Hf content and higher Cu+Nb content is one explanation as to why the low Ms sample has a lower TT and higher thermal stability than the high Ms sample. The results show that the distribution of elements in the matrix of these specified alloys has a strong influence on their Ms and thermal stabilities.
The EDS mapping of the low Ms sample in Figure 9 shows bright and dark contrasting precipitates within the sample, which are Ti-rich and Nb-rich, respectively. The matrix has the brightest contrast in BSE images and the EDS shows it had the highest Hf content, which suggests the most Hf was dissolved in the matrix. In the low Ms sample, the brighter contrast Ti- and Hf-rich precipitate (indicated by red arrows in Figure 9) were more abundant, with 65 at.% Ti+Hf content, which could be the (Ti, Hf)2(Ni, Cu) precipitates with a small amount of Nb replacing both Ti/Hf and Ni/Cu. The Hf content in this precipitate is lower than that in the matrix but higher than the dark contrast precipitate. The darker contrast precipitates are low in Ni and Hf but rich in Nb, as indicated by the yellow arrows in Figure 9. The Nb-rich precipitates were found within and around the Ti-rich precipitates. The Nb content in this precipitate was greater than 20 at.%, but the Ti+Hf content was still approximately 66 at.%, which indicates this was (Ti, Hf)2(Ni, Cu, Nb) with Nb replacing Ni and Cu. A similar microstructure in Ti34.2Ni47.8Hf14Nb4 SMA was reported by Lemke et al. [23], but the Ti was not homogeneous distributed in precipitates and the number of precipitates were less than the SDA Ti-rich SMAs. This is due to the higher Ti content, lower Nb content and higher cooling rate in Ti-rich specimen introduced more Ti-rich precipitates and enhance the homogenous precipitation.
In addition, the Cu elemental mapping in Figure 9 reveals segregation, with a moderately Cu-rich area within the matrix, near the precipitates, and a slightly Cu-lean area at the centre. As discussed in Section 3.1, Cu has a negative influence on Ms but improves thermal cycle stability. Therefore, despite the Ms in this sample being lower it was more stable than the high Ms sample. The segregation of Cu also caused a broader transformation peak in Figure 7a. Yi et al. reported multi transformation peaks in the Ti-Ni-Hf SMAs with heterogeneous composition distribution [36].
Figure 10 shows the BSE image and EDS mapping of the high Ms sample, which revealed three different precipitates. Those with the darkest contrast had two different compositions, (Ti+Cu)-rich (indicated by red arrows) and Nb-rich (indicated by white arrows). The average composition of the Ti+Cu-rich precipitates was Ti55.5Ni17.0Hf8.1Cu16.3Nb3.1, which implied that Cu had replaced Ni and Nb replaced Ti/Hf in the (Ti, Hf)2(Ni, Cu) precipitate. The average composition of the Nb-rich precipitate was Ti62.6Ni9.3Hf4.1Cu2.7Nb21.3, close to that of the low Ms sample. Some dendritic lacy β-Nb particles were found around the Ti-rich precipitates, which is similar to Lemke’s study with 8 at.% Nb [23]. These precipitates also presented as small eutectic-like particles in the high Ms sample.
The brighter contrast precipitates (indicated by yellow arrows) were Ti-rich with the lowest Cu content. The average composition of this phase was Ti56.6Ni27.2Hf8.3Cu5.8Nb2.0, similar to the Ti-rich precipitates in the low Ms sample. The Cu-rich segregation area was smaller comparing to the low Ms sample. There was a bright contrast area at the centre of the BSE image (indicated by a black arrow) with a composition of Ti36.0Ni33.9 Hf10.0Cu15.5Nb4.6, similar to the matrix composition (Ti40.3Ni38Hf10.6Cu10.4Nb0.7) but with Cu replacing Ni and the Nb replacing Ti. This area would have had a much lower Ms than the matrix but the volume was too small to be detected during the DSC test. Comparing the results to Ti-Ni-Hf-Nb SMAs produced by arc melting [23,24], the higher Ti content in our study has a higher volume of precipitates and lower Nb content in the matrix, which indicates the Ti, Hf-rich precipitates absorbed Nb during solidification.
It could be that the Ti2(Ni, Cu) particles reduced the stress field of the martensitic lattice and improved thermal-mechanical stability, which is consistent with the results reported by Chluba et al. [10]. However, the size of precipitates in bulk materials is much bigger than that in the thin film. Hence, the mechanism of improved stability remains further study.

3.3.3. Heat Treatment on Ti-Ni-Hf-Cu-Nb Samples

In order to homogenise the materials and improve shape memory properties, solution and homogenise treatments were applied to the Ti-Ni-Hf-Cu-Nb samples. The DSC results of the as-fabricated high Ms sample seen in Figure 11 show that apart from the austenitic transformation peak at 300 K, four endothermic peaks occurred during heating. The first at 1174 K, slightly lower than the melting temperature of Ti2Cu (1233 K) and Ti2Ni (1239 K). This could have been the melting of the (Ti, Hf, Nb)2(Ni, Cu) phase with a low Nb content and high Cu content, which was the bright contrast precipitates marked by red arrows in Figure 10. The second and third endothermic peaks occurred at 1448 K and 1563 K, respectively, possibly the melting of the matrix and the Cu segregation observed by EDS mapping. The final endothermic peak at 1755 K was perhaps the melting of the Nb-rich precipitates and β-Nb particles as Nb-Ni phase melting point exceed 1720 K when the Nb content is greater than 50 at.% [37].
Three exothermic peaks emerged during cooling, with the first at 1719 K, 36 K lower than the last endothermic peak. They were the solidification and melting of the Nb-rich precipitates. The second and largest exothermic peak was at 1643 K. The magnified curve in Figure 12d reveals an additional emerged 1650 K peak. This might have been due to the diffusion and homogenisation of the chemical composition during the isothermal period at high temperature (1773 K). Since the peak width during cooling is much smaller than those of the heating peaks, the matrix was homogenised after the high temperature isothermal period. The third peak is much smaller than the other two, at 1324 K, which indicates the volume of this phase was much smaller than the other. The third exothermic peak in Figure 12b is more than 100 K higher than the first endothermic peak during heating, which indicates the change of composition. According to the DSC result above, the low temperature precipitates melts below 1273 K while the matrix melt above this temperature. Therefore, a 1273 K three hours heat treatment was chosen for the homogenisation.
The backscatter image of the heat treated Ti-Ni-Hf-Cu-Nb low Ms sample shows the significantly different microstructure after heat treatment, as seen in Figure 13. The size of precipitates increased from 10 μm to more than 50 μm and a few different precipitates were formed after solution treatment. The EDS results in Figure 13 indicates that the precipitates at the edge with fine patterns (marked by yellow arrow) had a marginally higher Ti composition than the matrix, but lower than the other precipitate areas. The content of Ni, Hf, Cu elements in this phase was lower than the matrix area but the Nb content was higher. Considering the microstructure of these precipitates this could have been the globule β-Nb phase. The centre area of precipitates has higher Ti composition, lower Hf content but similar Nb content compared to the matrix. The areas with higher Ni content were marked by the white arrows and the areas with higher Cu content were marked by black arrows. Therefore, these phases may have been lower Nb content (Ti, Hf, Nb)2(Ni, Cu) phase with some Ni and Cu variation. The 2 to 3 μm precipitates with dark contrast (marked by red arrow) have high Ti and Nb composition but the lowest Ni, Cu, Hf content compared to the other phases, indicating this phase was (Ti, Hf, Nb)2(Ni, Cu) with high Nb content, which differs from the Ti2Ni type phases in Ti-Ni alloys. The phases marked by blue arrows have high Ti content and low Ni, Hf, Cu, Nb content, which indicates it is close to Ti2Ni precipitates.
In addition, there was no segregation found in the matrix, suggesting the homogenising treatment eliminated most of the segregation in Ti-Ni-Hf-Cu-Nb low Ms alloy. The DSC testing in Figure 14 shows that the transformation peak of heat treated sample was reduced to 20 K with the same thermal stability as the as-built sample, signifying that heat treatment can narrow the transformation range by eliminating segregation in the matrix. Although the high Ms sample was heat treated by the same process, the DSC result showed no significant difference to the as-built sample. With regard to different precipitates between as-built and heat treated samples, the better thermal cycle stability in the low Ms alloy might be due to the higher Cu content in the matrix as well as the interface between precipitates and matrix.
In order to investigate the segregation in the low Ms Ti-Ni-Hf-Cu-Nb alloy, a DSC sample of as-built condition and a heat treated DSC sample (HT3) were analysed by EDS. Three EDS mappings were applied on each sample at different positions, the top, middle and bottom areas of the samples. Each EDS mapping has 1024 × 800 index points and each point has 0.5 s index live time. The average composition of the matrix in each mapping area was calculated from manually selected data points where were at least 5 μm away from the precipitates, listed in Table 3. The results indicated that the compositional variation in the matrix of the as-built sample was larger than that of the heat treated sample. As discussed in previous sections, the reduction of Ti+Hf composition or increase of Nb content in the matrix leads to a lower transformation temperature in the DSC result. By using the equations in Section 2, and analysing the EDS result, the lowest Ms temperature of the as-built matrix was 25.3 K lower than the heat treated sample due to variation of Nb and Cu content, which was close to the experimental result (30 K). Therefore, the main reason for the broad transformation peak in the as-built low Ms sample was due to the segregation in the matrix, especially the heterogeneous distribution of Nb and Cu.

3.3.4. Micromechanical Properties

In Figure 15, three pillars in the solution treated Ti-Ni-Hf-Cu-Nb low Ms samples were milled and compression tested at room temperature. The plateau phase occurred at approximately 700 MPa with the 2.5% strain, while the strain retrieved at 1500 MPa was 7.5%. The Young’s modulus before the plateau stage is 28 GPa and about 33 GPa after the plateau stage. The recoverable strain is approximately 3%. The Ti-Ni-Hf-Cu-Nb has comparable plateau stress and irreversible deformations to the Ti-Ni alloys in similar testing conditions, but its elastic modulus was approximately 50% higher [38]. The Young’s modulus and recoverable strain of Ti-Ni-Hf-Cu-Nb alloys are similar to the Ti-Ni-Hf alloys (23 GPa before plateau stage and 3.1% recoverable strain) [8]. However, the thermal stability of The Ti-Ni-Hf-Cu-Nb alloy is much better than the Ti-Ni-Hf alloys. This is due to the Cu improving the thermal stability via reducing the shear resistance, and the introduction of β-Nb particle increases the resistance of lattice deformation. The Nb particles and Ti/Hf-rich precipitates might also have pinning effect, which limits the accumulation of dislocation and increase the thermal stability.

4. Conclusions

A novelTi-Ni-Hf-Cu-Nb shape memory alloys with acceptable transformation temperatures and good thermal cycle stabilities have been developed. The influence of Cu, Nb and Hf on transformation temperature of Ti-Ni, Ti-Ni-Cu, Ti-Ni-Hf-Cu alloys have been investigated.
  • The addition of Cu in Ti-Ni SMAs slightly decreased the MT temperature by −0.67 K/at.%.
  • Cu and Hf have a negative influence on each other on the MT temperature of Ti-Ni-Hf-Cu SMAs. The reduction of Cu on 10 at.% and 15 at.% Hf alloys were −5.1 K/at.% and −5.7 K/at.%, respectively.
  • Nb has a stronger influence on the MT temperature of Ti51−xNi39−xCu10Nb2x shape memory alloys (−19 K/at.%) than Ti51−0.5xNi49−0.5xNbx alloys (−6.3 K/at.%). However, the Nb content did not affect the thermal cycle stability of Ti51−xNi39−xCu10Nb2x alloys when the Nb content is lower than 3 at.%.
  • Nb content has less influence on MT temperature of Ti41−0.5xNi46−0.5xHf10Cu5Nbx shape memory alloys (−1.5 K/at.%) than Ti41−0.5xNi39−0.5xHf10Cu10Nbx alloys (−12.5 K/at.%). However, the relationship between Nb content and the MT temperature of Ti41−xNi39−xHf10Cu10Nb2x alloys is not linear.
  • The Ti41−0.5xNi39−0.5xHf10Cu10Nbx alloys with 1 at.% Nb has the highest transformation temperature but the alloys with 2 at.% Nb has the best thermal cycle stability. The reduction of transformation heat and difference between austenitic transformation and MT increased with higher Nb content.
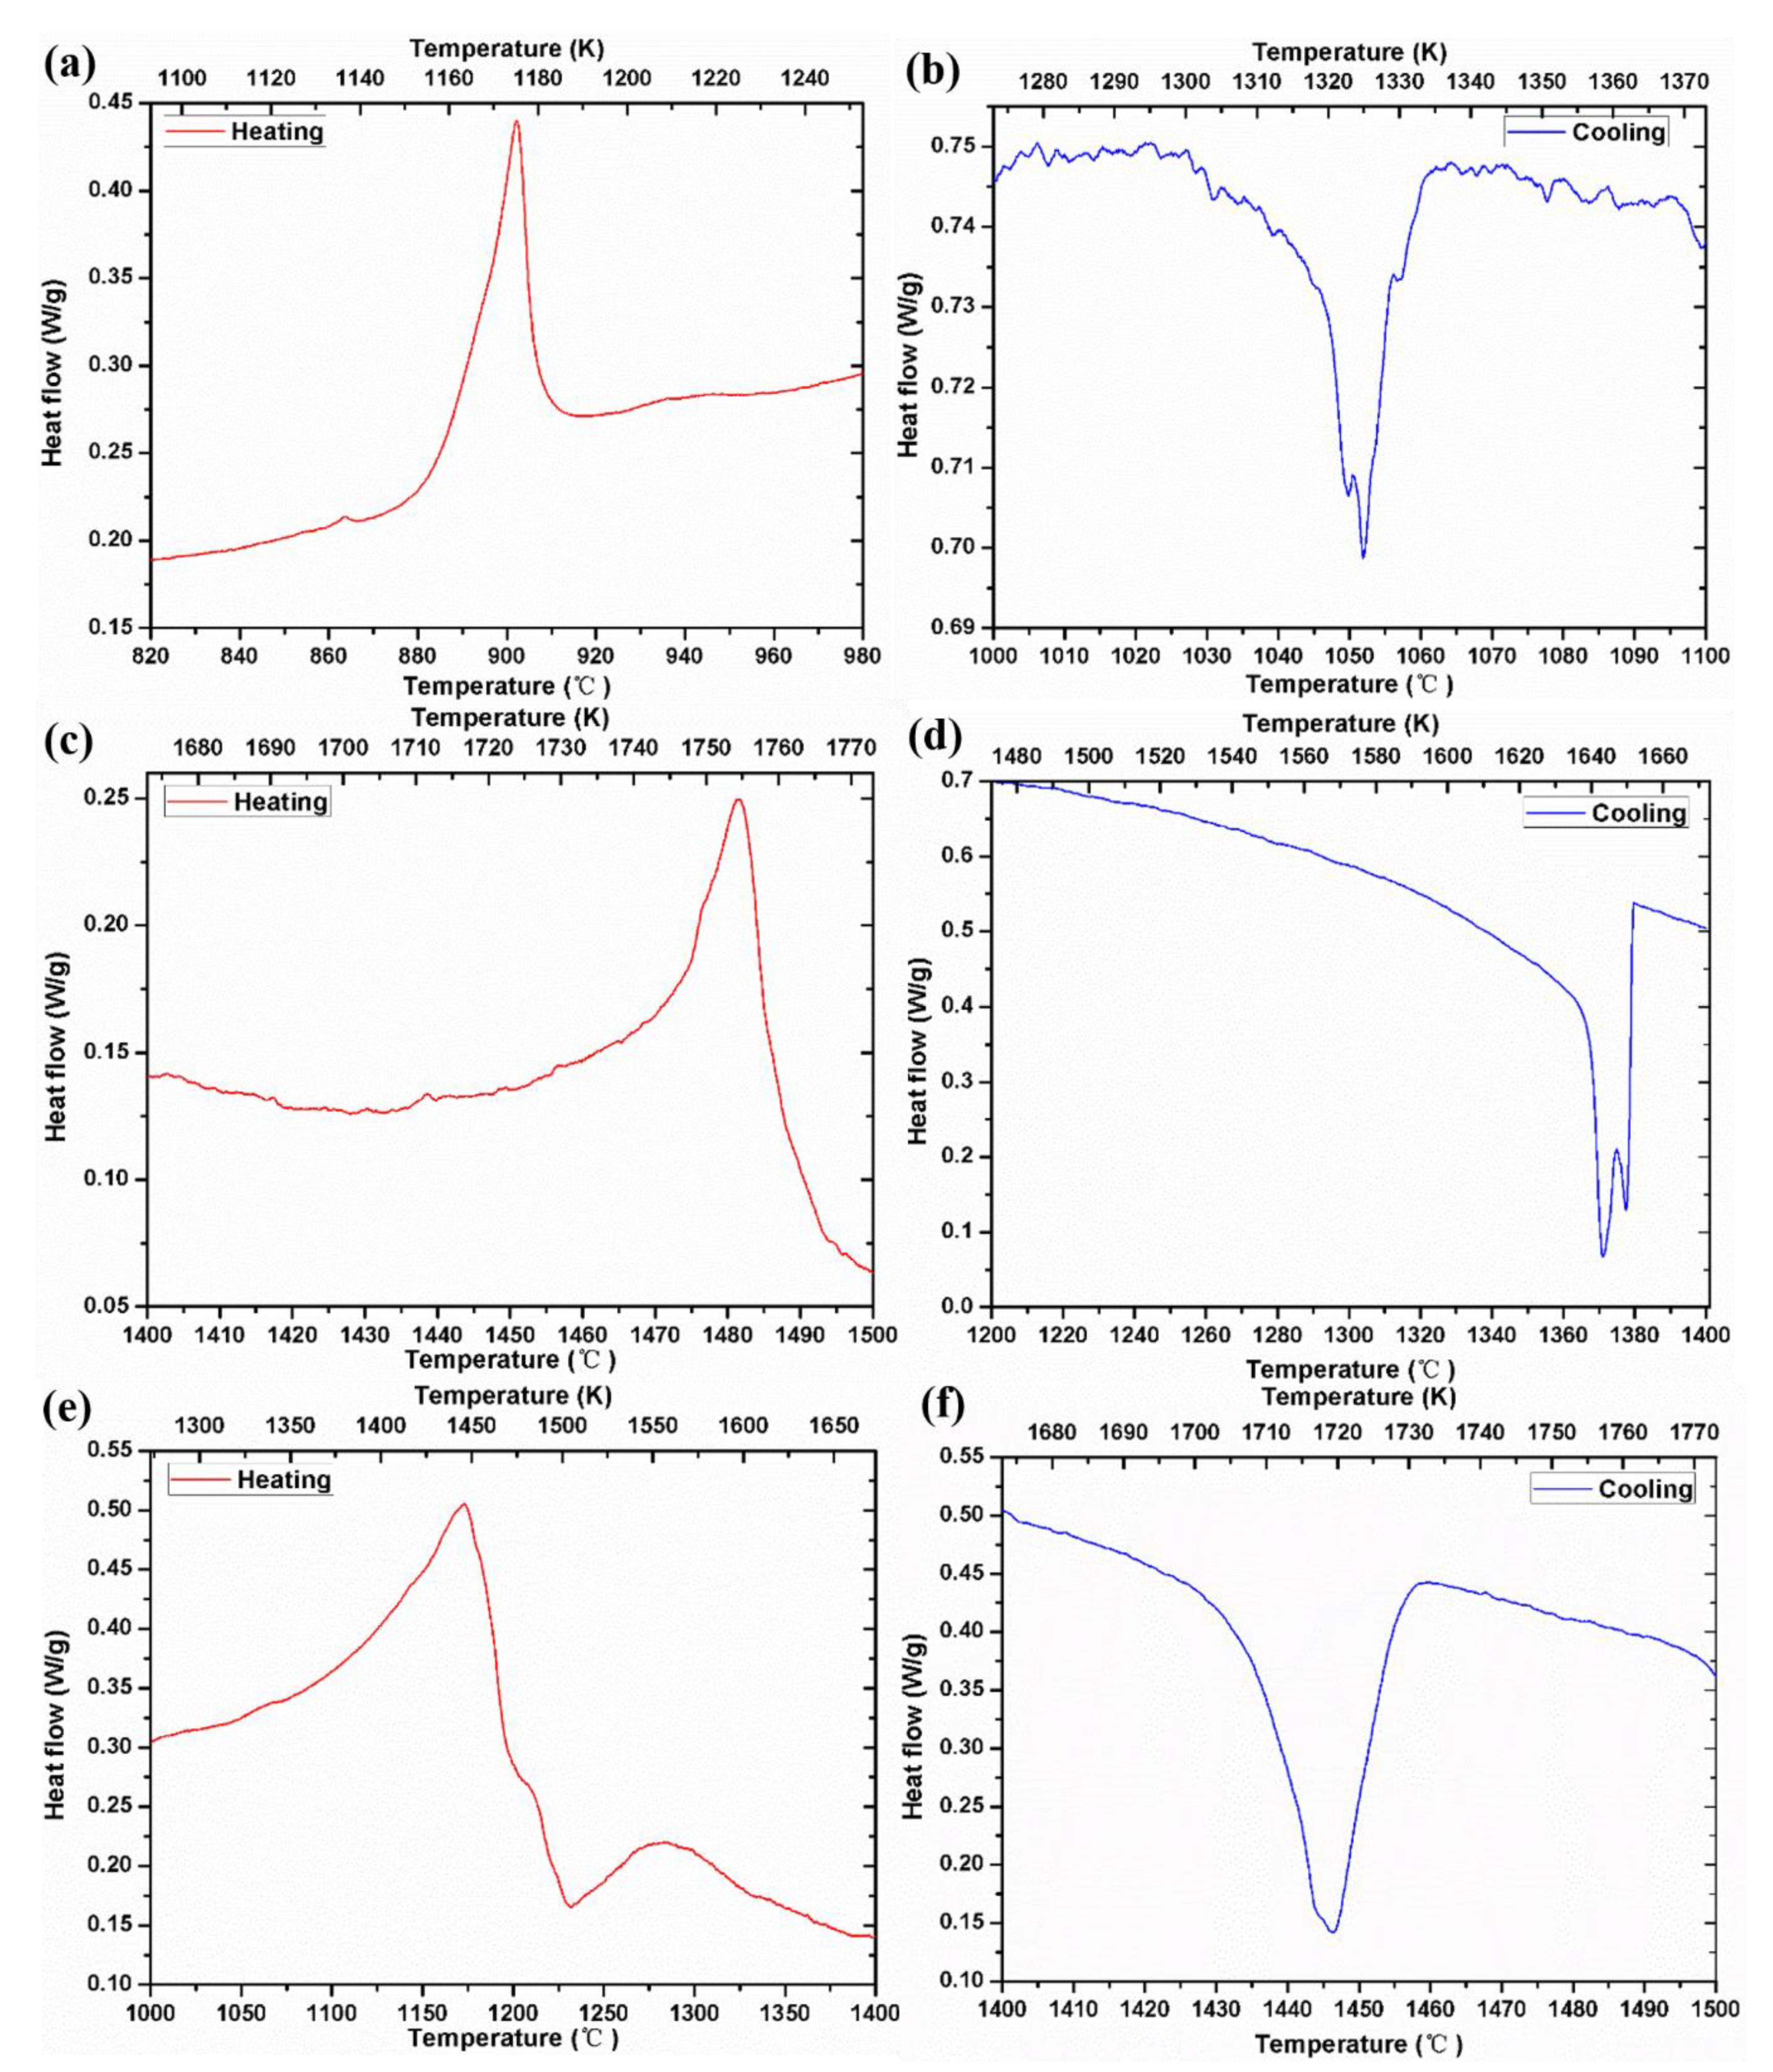
  • The Ti43Ni33Hf10.5Cu11Nb2.5 and Ti44Ni34Hf10Cu10Nb2 alloys showed completely different transformation behaviour due to different matrix composition. Three different precipitates were found in Ti44Ni34Hf10Cu10Nb2 high Ms alloys which may be the reason for unstable transformation and the variation of transformation temperature.
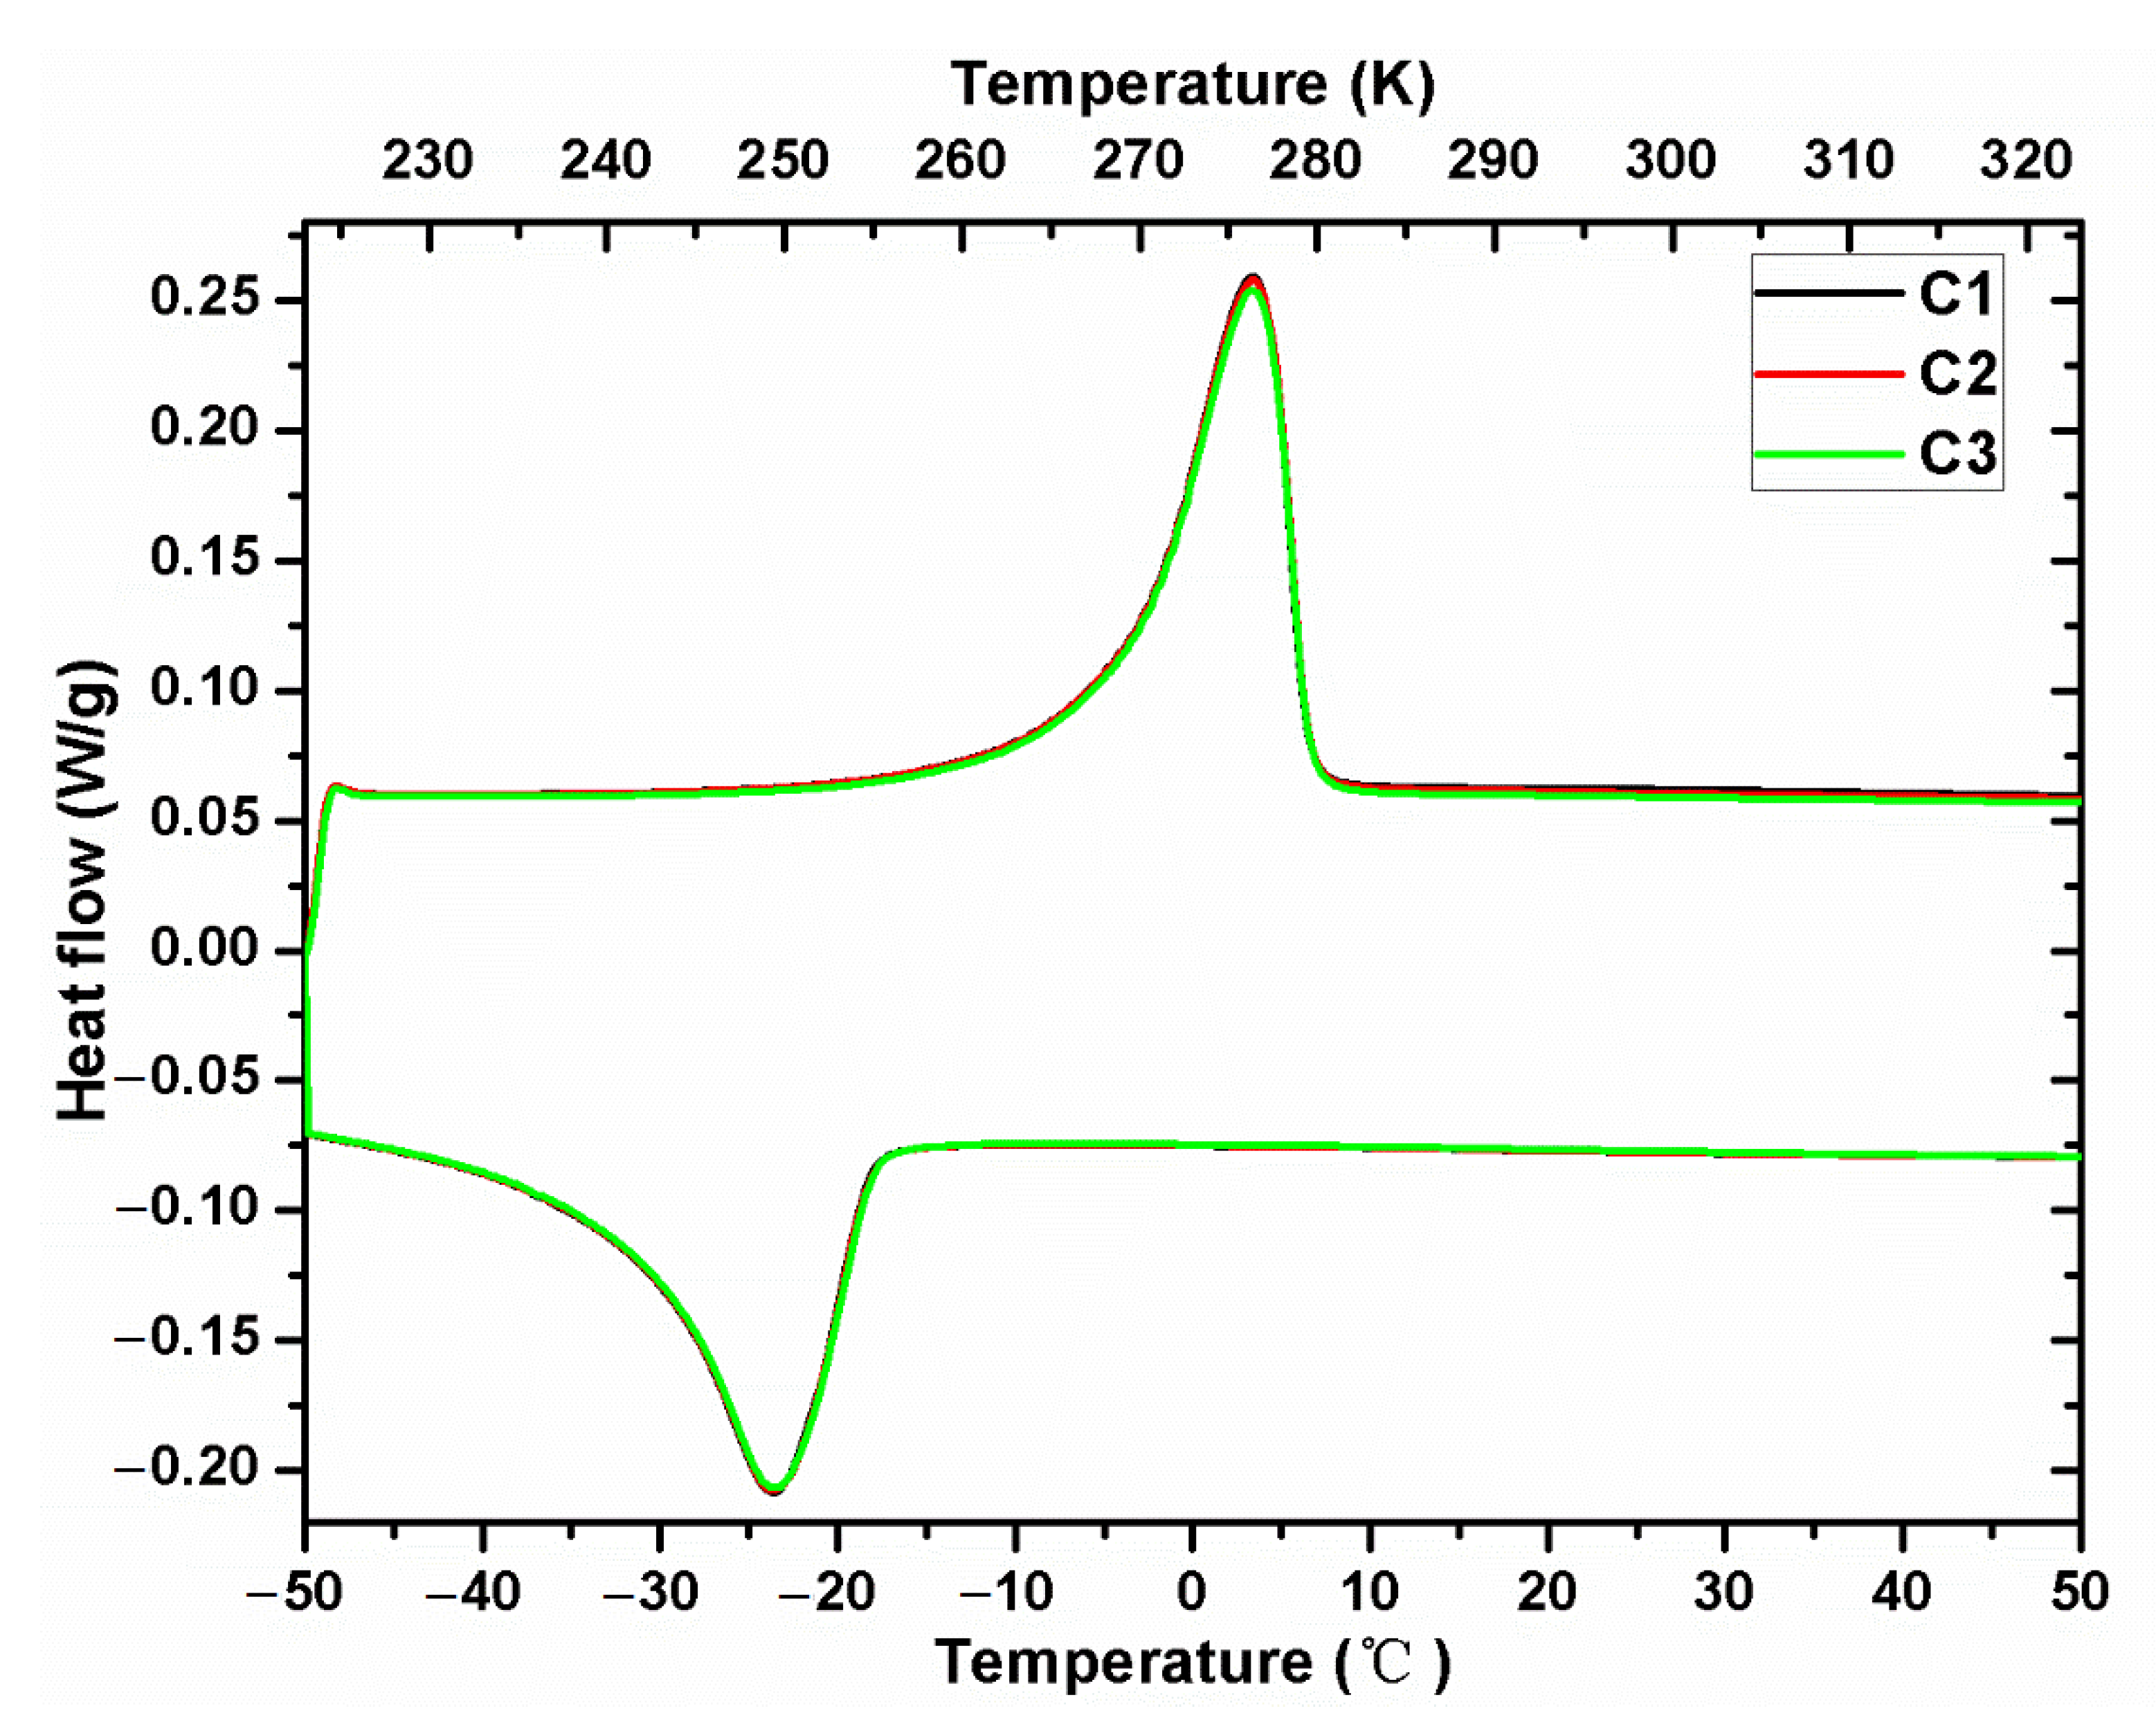
  • The homogenised low Ms Ti43Ni33Hf10.5Cu11Nb2.5 alloys has stable narrow transformation peak with no obvious thermal fatigue after a few thermal cycles. Three different types of precipitates were found in heat treated sample.
  • The micro-pillar compression test of low Ms showed two-stage deformation. Both the plateau stress and Young’s Modulus are higher than the Ti-Ni shape memory alloys.

Author Contributions

S.L.: Conceptualization, Writing—original draft; M.W.: Investigation, Data curation; K.E.: Methodology, Project administration; C.G.: Project administration; C.L.: Project administration; M.A.: Writing—review and editing, Supervision. All authors have read and agreed to the published version of the manuscript.

Funding

This work was financially supported by the [Guangzhou Science and Technology Plan Programme] (Project No. 201704030067) and was carried out in collaboration with Guangdong Academy of Sciences and the University of Birmingham. This project is also supported by the Accelerated Metallurgy Project, co-funded by the [European Commission in the seventh Framework Programme] (Contract NMP4-LA-2011-263206), by the [European Space Agency] and by the individual partner organisations.

Data Availability Statement

Not available.

Acknowledgments

The authors would like to thank Nicholas Adkins, who was a Senior Research Fellow in the University of Birmingham, providing helps on the experimental work, paper editing and project management of this work. The authors would also like to thank Yu-lung Chiu, Stephen McCain from University of Birmingham and Xiaohui Li from Guangdong Academy of Science providing helps on the experimental work and equipment.

Conflicts of Interest

The authors declare that they have no known competing financial interest or personal relationship that could have appeared to influence the work reported in this paper.

References

  1. Otsuka, K.; Ren, X. Recent developments in the research of shape memory alloys. Intermetallics 1999, 7, 511–528. [Google Scholar] [CrossRef]
  2. Otsuka, K.; Ren, X. Physical metallurgy of Ti–Ni-based shape memory alloys. Prog. Mater. Sci. 2005, 50, 511–678. [Google Scholar] [CrossRef]
  3. Otsuka, K.; Wayman, C.M. Shape Memory Materials; Cambridge University Press: Cambridge, UK, 1988. [Google Scholar]
  4. Elahinia, M.H.; Hashemi, M.; Tabesh, M.; Bhaduri, S.B. Manufacturing and processing of NiTi implants: A review. Prog. Mater. Sci. 2012, 57, 911–946. [Google Scholar] [CrossRef]
  5. Lin, K.; Wu, S.; Tsai, C.-L. The Effect of Thermal Cycling on B2→B19→B19′ Transformations of Ti50Ni40Cu10 Shape Memory Alloy by Dynamic Mechanical Analyzer. Mater. Trans. 2008, 49, 2776–2780. [Google Scholar] [CrossRef]
  6. He, X.-M.; Zhao, L.-Z.; Duo, S.-W.; Zhang, R.-F.; Rong, L.-J. Stress-induced martensitic transformation in (Ni47Ti44)100−xNbx shape memory alloys with wide hysteresis. Trans. Nonferrous Met. Soc. China 2006, 16, s42–s46. [Google Scholar] [CrossRef]
  7. Jiang, P.C.; Zheng, Y.F.; Tong, Y.X.; Chen, F.; Tian, B.; Li, L.; Gunderov, D.V.; Valiev, R.Z. Transformation hysteresis and shape memory effect of an ultrafine-grained TiNiNb shape memory alloy. Intermetallics 2014, 54, 133–135. [Google Scholar] [CrossRef]
  8. Firstov, G.S.; Van Humbeeck, J.; Koval, Y.N. Comparison of high temperature shape memory behaviour for ZrCu-based, Ti–Ni–Zr and Ti–Ni–Hf alloys. Scr. Mater. 2004, 50, 243–248. [Google Scholar] [CrossRef]
  9. Potapov, P.L.; Shelyakov, A.V.; Gulyaev, A.A.; Svistunov, E.L.; Matveeva, N.M.; Hodgson, D. Effect of Hf on the structure of Ni-Ti martensitic alloys. Mater. Lett. 1997, 32, 247–250. [Google Scholar] [CrossRef]
  10. Chluba, C.; Ge, W.; de Miranda, R.L.; Strobel, J.; Kienle, L.; Quandt, E.; Wuttig, M. Ultralow-fatigue shape memory alloy films. Science 2015, 348, 1004–1007. [Google Scholar] [CrossRef] [PubMed]
  11. Santamarta, R.; Arróyave, R.; Pons, J.; Evirgen, A.; Karaman, I.; Karaca, H.E.; Noebe, R.D. TEM study of structural and microstructural characteristics of a precipitate phase in Ni-rich Ni–Ti–Hf and Ni–Ti–Zr shape memory alloys. Acta Mater. 2013, 61, 6191–6206. [Google Scholar] [CrossRef]
  12. Vermaut, P.; Lityńska, L.; Portier, R.; Ochin, P.; Dutkiewicz, J. The microstructure of melt spun Ti–Ni–Cu–Zr shape memory alloys. Mater. Chem. Phys. 2003, 81, 380–382. [Google Scholar] [CrossRef]
  13. Lin, K.-N.; Wu, S.-K.; Wu, L.-M. Martensitic Transformation of Ti50Ni25−xPd25−yCux+y Quaternary Shape Memory Alloys with X, Y ≤ 10 at%. Mater. Trans. 2009, 50, 2384–2390. [Google Scholar] [CrossRef] [Green Version]
  14. Meng, X.L.; Tong, Y.X.; Lau, K.T.; Cai, W.; Zhou, L.M.; Zhao, L.C. Effect of Cu addition on phase transformation of Ti–Ni–Hf high-temperature shape memory alloys. Mater. Lett. 2002, 57, 452–456. [Google Scholar] [CrossRef]
  15. Meng, X.L.; Fu, Y.D.; Cai, W.; Li, Q.F.; Zhao, L.C. Cu content and annealing temperature dependence of martensitic transformation of Ti36Ni49−xHf15Cux melt spun ribbons. Intermetallics 2009, 17, 1078–1084. [Google Scholar] [CrossRef]
  16. Meng, X.L.; Cai, W.; Fu, Y.D.; Zhang, J.X.; Zhao, L.C. Martensite structure in Ti–Ni–Hf–Cu quaternary alloy ribbons containing (Ti,Hf)2Ni precipitates. Acta Mater. 2010, 58, 3751–3763. [Google Scholar] [CrossRef]
  17. Wang, G.C.; Hu, K.P.; Tong, Y.X.; Tian, B.; Chen, F.; Li, L.; Zheng, Y.F.; Gao, Z.Y. Influence of Nb content on martensitic transformation and mechanical properties of TiNiCuNb shape memory alloys. Intermetallics 2016, 72, 30–35. [Google Scholar] [CrossRef]
  18. Tong, Y.; Gu, H.; James, R.D.; Qi, W.; Shuitcev, A.V.; Li, L. Novel TiNiCuNb shape memory alloys with excellent thermal cycling stability. J. Alloy. Compd. 2018, 782, 343–347. [Google Scholar] [CrossRef]
  19. Yi, X.; Pang, G.; Sun, B.; Meng, X.; Cai, W. The microstructure and martensitic transformation behaviors in Ti-Ni-Hf -X (Ag, Sn) high temperature shape memory alloys. J. Alloy. Compd. 2018, 756, 19–25. [Google Scholar] [CrossRef]
  20. Yi, X.; Gao, W.; Meng, X.; Gao, Z.; Cai, W.; Zhao, L. Martensitic transformation behaviors and mechanical properties of (Ti36Ni49Hf15)100−xYx high temperature shape memory alloys. J. Alloy. Compd. 2017, 705, 98–104. [Google Scholar] [CrossRef]
  21. Li, J.; Yi, X.; Meng, X.; Qiao, S.; Cai, W.; Zhao, L. Deposition and phase transformation behaviors of Ti–Ni-Hf-Cu quaternary shape memory alloy thin films. J. Alloy. Compd. 2019, 806, 33–39. [Google Scholar] [CrossRef]
  22. Yi, X.; Sun, K.; Gao, W.; Meng, X.; Cai, W.; Zhao, L. Microstructure design of the excellent shape recovery properties in (Ti,Hf)2Ni/Ti-Ni-Hf high temperature shape memory alloy composite. J. Alloy. Compd. 2017, 729, 758–763. [Google Scholar] [CrossRef]
  23. Lemke, J.N.; Gallino, F.; Cresci, M.; Coda, A. Achieving improved workability and competitive high temperature shape memory performance by Nb addition to Ni-Ti-Hf alloys. Scr. Mater. 2020, 191, 161–166. [Google Scholar] [CrossRef]
  24. Chen, J.; Zhang, S.; Zhang, Y.; Zhang, J.; Wen, Y.; Yang, Q.; Huang, S.; Wang, X. A study on the cold workability and shape memory effect of NiTiHf-Nb eutectic high-temperature shape memory alloy. Intermetallics 2020, 127, 106982. [Google Scholar] [CrossRef]
  25. Li, S.; Adkins, N.J.E.; McCain, S.; Attallah, M.M. Suspended droplet alloying: A new method for combinatorial alloy synthesis; nitinol-based alloys as an example. J. Alloy. Compd. 2018, 768, 392–398. [Google Scholar] [CrossRef] [Green Version]
  26. Bianchi, M.; Scarpa, F.; Smith, C.W. Shape memory behaviour in auxetic foams: Mechanical properties. Acta Mater. 2010, 58, 858–865. [Google Scholar]
  27. Gou, L.; Liu, Y.; Ng, T.Y. An investigation on the crystal structures of Ti50Ni50−xCux shape memory alloys based on density functional theory calculations. Intermetallics 2014, 53, 20–25. [Google Scholar] [CrossRef]
  28. Meng, X.L.; Cai, W.; Zheng, Y.F.; Zhao, L.C. Phase transformation and precipitation in aged Ti–Ni–Hf high-temperature shape memory alloys. Mater. Sci. Eng. A 2006, 438–440, 666–670. [Google Scholar] [CrossRef]
  29. Frenzel, J.; George, E.P.; Dlouhy, A.; Somsen, C.; Wagner, M.F.-X.; Eggeler, G. Influence of Ni on martensitic phase transformations in NiTi shape memory alloys. Acta Mater. 2010, 58, 3444–3458. [Google Scholar] [CrossRef]
  30. Thoma, P.E.; Boehm, J.J. Effect of composition on the amount of second phase and transformation temperatures of NixTi90−xHf10 shape memory alloys. Mater. Sci. Eng. A 1999, 273–275, 385–389. [Google Scholar] [CrossRef]
  31. Sun, Q.P.; He, Y.J. A multiscale continuum model of the grain-size dependence of the stress hysteresis in shape memory alloy polycrystals. Int. J. Solids Struct. 2008, 45, 3868–3896. [Google Scholar] [CrossRef]
  32. Haenschke, T.; Davis, C.L.; Attallah, M.M. Influence of the microstructural inhomogeneities on the martensite-to-austenite phase transformation temperatures in TiNiCu-based shape-memory alloys. Mater. Chem. Phys. 2013, 141, 272–277. [Google Scholar] [CrossRef]
  33. Liang, X.L.; Chen, Y.; Shen, H.M.; Zhang, Z.F.; Li, W.; Wang, Y.N. Thermal cycling stability and two-way shape memory effect of Ni–Cu–Ti–Hf alloys. Solid State Commun. 2001, 119, 381–385. [Google Scholar] [CrossRef]
  34. Meng, X.L.; Cai, W.; Lau, K.T.; Zhao, L.C.; Zhou, L.M. Phase transformation and microstructure of quaternary TiNiHfCu high temperature shape memory alloys. Intermetallics 2005, 13, 197–201. [Google Scholar] [CrossRef]
  35. Chowdhury, P.; Sehitoglu, H. A revisit to atomistic rationale for slip in shape memory alloys. Prog. Mater. Sci. 2017, 85, 1–42. [Google Scholar] [CrossRef] [Green Version]
  36. Yi, X.; Meng, X.; Cai, W.; Zhao, L. Multi-stage martensitic transformation behaviors and microstructural characteristics of Ti-Ni-Hf high temperature shape memory alloy powders. J. Alloy. Compd. 2019, 781, 644–656. [Google Scholar] [CrossRef]
  37. Okamoto, H. Nb-Ni (Niobium–Nickel). J. Phase Equilib. Diffus. 2008, 29, 210. [Google Scholar] [CrossRef]
  38. Pfetzing-Micklich, J.; Ghisleni, R.; Simon, T.; Somsen, C.; Michler, J.; Eggeler, G. Orientation dependence of stress-induced phase transformation and dislocation plasticity in NiTi shape memory alloys on the micro scale. Mater. Sci. Eng. A 2012, 538, 265–271. [Google Scholar] [CrossRef]
Figure 1. Reduction of Ms of Ti-Ni-based SMAs with increasing thermal cycles. The labels Cu25, Cu10, Hf5, NiTi, Hf15Cu5 represent the thermal stability of Ti51Ni24Cu25, Ti51Ni39Cu10 Ti46Ni49Hf5, Ti51Ni49 and Ti36Ni44Hf15Cu5, respectively.
Solids 03 00001 g001
Figure 2. Influence of Hf content on the transformation temperature of Ti51Ni49−xHfx SDA built SMA at as-fabricated condition. The Mf, As and ∆Ms are martensitic transformation finish temperature, austenite transformation start temperature and the difference between the Ms of Ti51Ni49−xHfx and the Ms of Ti51Ni49 determined by the DSC experiment. The Ref. ∆Ms is the difference between the Ms of Ti50Ni50−xHfx and the Ms of Ti51Ni49 reported by literature [2].
Solids 03 00001 g002
Figure 3. Influence of Cu content on Ms of (a) Ti-Ni-Cu SMAs shows the Ms decreases linearly with increasing Cu content, and (b) Ti36Ni49xHf15Cux (labelled as Ti-Ni-Hf15-Cux) and Ti41Ni49xHf10Cux (labelled as Ti-Ni-Hf10-Cux) alloys show linear decreasing Ms as the Cu content increase in Ti-Ni-Hf-Cu alloys. The influence of Cu becomes stronger in higher Hf content alloys.
Solids 03 00001 g003
Figure 4. The influence of Nb content on the Ms of (a) Ti51−xNi51−xNb2x alloys [7] and (b) Ti51−0.5xNi39−0.5xCu10Nbx alloys produced by SDA shows Nb decreases the Ms.
Solids 03 00001 g004
Figure 5. Backscatter images of Ti51−0.5xNi39−0.5xCu10Nbx sample produced by SDA show: (a) fine precipitates in Ti49.5Ni37.5Cu10Nb3 sample under low magnification; (b) dark contrast Ti-rich precipitates and a few bright contrast Nb-rich particles within the 1 at.% Nb sample; (c) both dark and bright contrast precipitates (Ti-rich and Nb-rich) within the 2 at.% Nb sample; (d) more bright contrast Nb-rich particles around 2 to 3 µm size within the 3 at.% Nb sample.
Solids 03 00001 g005
Figure 6. Transformation behaviour of Ti410.5xNi390.5xCu10Hf10Nbx SMA: (a) influence of Nb content and thermal cycles (the third cycle is indicated by the black line and the eleventh cycle is red line) on Ms temperature; (b) influence of Nb content and thermal cycles on transformation heat; (c) influence of Nb content on the reduction of Ms per thermal cycle; (d) influence of Nb content and thermal cycles on the transformation heat difference between austenite transformation and MT.
Solids 03 00001 g006
Figure 7. DSC results of (a) Ti43Ni33Hf10.5Cu11Nb2.5 sample shows low Ms (251 K), board transformation peak (50 K) and good thermal cycle stability (three cycles overlapped); (b) Ti44Ni34Hf10Cu10Nb2 sample shows high Ms (305 K), narrow transformation peak (30 K) and weak thermal cycle stability.
Solids 03 00001 g007
Figure 8. Backscatter image of (a) low Ms Ti43Ni33Hf10.5Cu11Nb2.5 sample shows fine dendrite and Ti(Hf)-rich precipitates around dendrite boundary. The EDS area analysis shows the composition of the sample is Ti44.8Ni34Hf10Cu8.5Nb2.7; (b) high Ms Ti44Ni34Hf10Cu10Nb2 sample shows larger dendrite size and 4 different types of precipitates. The EDS area analysis result shows the sample composition is Ti42Ni33Hf10.5Cu12Nb2.5.
Solids 03 00001 g008
Figure 9. EDS mapping around the precipitates in Ti43Ni33Hf10.5Cu11Nb2.5 low Ms as-built sample shows high Nb content in the precipitates with the darkest contrast. The precipitates generally have higher Ti and Nb content.
Solids 03 00001 g009
Figure 10. EDS mapping around the precipitates in Ti44Ni34Hf10Cu10Nb2 high Ms sample shows three different types of precipitates indicated by white, red and yellow arrows.
Solids 03 00001 g010
Figure 11. High temperature DSC testing result of as-built Ti-Ni-Hf-Cu-Nb2.5 high Ms sample indicates multi-phases and changes of local composition in some phases.
Solids 03 00001 g011
Figure 12. Magnified peak areas of high Ms Ti-Ni-Hf-Cu-Nb DSC curves (a) the endothermic/melting peak of the lowest melting phase during heating, (b) the exothermic/solidification peak of the lowest melting phase during cooling, (c) the endothermic/melting peak with the highest transformation energy phase during heating, (d) the exothermic/solidification peak with the highest transformation energy phase during cooling, (e) the endothermic/melting peak of the highest melting point phase during heating, (f) the exothermic/solidification peak with the highest melting point phase during cooling.
Solids 03 00001 g012
Figure 13. Backscatter image and EDS mapping of precipitates of heat treated Ti-Ni-Hf-Cu-Nb low Ms sample shows the change of microstructure.
Solids 03 00001 g013
Figure 14. DSC testing result of heat treated Ti-Ni-Hf-Cu-Nb low Ms alloys show narrow transformation peaks and stable transformation behavior with similar transformation temperature to the as-fabricated sample.
Solids 03 00001 g014
Figure 15. Micro-pillar compression test result of solution treated low Ms Ti-Ni-Hf-Cu-Nb sample.
Solids 03 00001 g015
Table 1. EDS analysis results of Ti-Ni-Cu-Nb samples.
SampleTi50Ni39Cu10Nb1Ti50Ni38Cu10Nb2Ti50Ni37Cu10Nb3
1 (matrix)Ti50Ni42Cu8Ti50Ni42Cu7Nb1Ti50Ni41.5Cu7.5Nb1
2 (Ti-rich)Ti55Ni32Cu11Nb2Ti63Ni28Cu6Nb2Ti60Ni28Cu9Nb3
3 (Nb-rich)To50Ni38Cu11Nb1Ti55Ni14Cu5Nb26Ti60Ni28Cu8Nb4
Area analysisTi50Ni39Cu10Nb1Ti49Ni39Cu10Nb2Ti50Ni37Cu10Nb3
Table 2. Chemical composition in Ti43Ni33Hf10.5Cu11Nb2.5 and Ti44Ni34Hf10Cu10Nb2 samples analysed by EDS.
SampleLow Ms, Ti43Ni33Hf10.5Cu11Nb2.5High Ms,
Ti44Ni34Hf10Cu10Nb2
MatrixTi39Ni38Hf11Cu11Nb1Ti40.3Ni38Hf10.6Cu10.4Nb0.7
Nb-rich (dark)Ti60.5Ni9Hf5Cu4.5Nb21Ti62.6Ni9.3Hf4.1Cu2.7Nb21.3
Ti-rich (bright)Ti57Ni28Hf8Cu5Nb2Ti56.6Ni27.2Hf8.3Cu5.8Nb2.0
(Ti+Cu)-rich (dark)-Ti55.5Ni17.0Hf8.1Cu16.3Nb3.1
Area averageTi43.8Ni34Hf10Cu9.5Nb2.7Ti43Ni33Hf10.5Cu11Nb2.5
Table 3. Table of average matrix composition calculated from EDS mapping of As-fabricated and heat treated low Ms Ti-Ni-Hf-Cu-Nb DSC samples (all composition in at.%).
SampleAreaTiNiCuNbHfTi+HfNi+Cu
As-builtTop39.536.911.91.410.249.748.8
Middle40.036.312.51.010.350.348.7
Bottom40.136.112.60.810.450.548.7
Min39.334.811.40.610.149.547.9
Max40.437.713.72.210.550.849.3
HT3Top39.836.512.31.110.450.148.8
Middle39.736.612.31.010.350.049.0
Bottom40.036.612.31.010.250.248.8
Min39.536.311.60.810.049.748.0
Max40.237.012.81.410.650.349.2
Publisher’s Note: MDPI stays neutral with regard to jurisdictional claims in published maps and institutional affiliations.

