
Race, Socioeconomic Status, and Cerebellum Cortex Fractional Anisotropy in Pre-Adolescents


1
Department of Family Medicine, College of Medicine, Charles R. Drew University of Medicine and Science, Los Angeles, CA 90059, USA
2
Department of Urban Public Health, Charles R. Drew University of Medicine and Science, Los Angeles, CA 90059, USA
3
Department of Pediatrics, Charles R. Drew University of Medicine and Science, Los Angeles, CA 90059, USA
*
Author to whom correspondence should be addressed.
Adolescents 2021, 1(2), 70-94; https://0-doi-org.brum.beds.ac.uk/10.3390/adolescents1020007
Submission received: 26 November 2020
/
Revised: 8 December 2020
/
Accepted: 22 December 2020
/
Published: 31 March 2021
(This article belongs to the Special Issue Inequality in Adolescence)
Abstract
:Introduction: Cerebellum cortex fractional anisotropy is a proxy of the integrity of the cerebellum cortex. However, less is known about how it is shaped by race and socioeconomic status (SES) indicators such as parental education and household income. Purpose: In a national sample of American pre-adolescents, this study had two aims: to test the effects of two SES indicators, namely parental education and household income, on cerebellum cortex fractional anisotropy, and to explore racial differences in these effects. Methods: Using data from the Adolescent Brain Cognitive Development (ABCD) study, we analyzed the diffusion Magnetic Resonance Imaging (dMRI) data of 9565, 9–10-year-old pre-adolescents. The main outcomes were cerebellum cortex fractional anisotropy separately calculated for right and left hemispheres using dMRI. The independent variables were parental education and household income; both treated as categorical variables. Age, sex, ethnicity, and family marital status were the covariates. Race was the moderator. To analyze the data, we used mixed-effects regression models without and with interaction terms. We controlled for propensity score and MRI device. Results: High parental education and household income were associated with lower right and left cerebellum cortex fractional anisotropy. In the pooled sample, we found significant interactions between race and parental education and household income, suggesting that the effects of parental education and household income on the right and left cerebellum cortex fractional anisotropy are all significantly larger for White than for Black pre-adolescents. Conclusions: The effects of SES indicators, namely parental education and household income, on pre-adolescents’ cerebellum cortex microstructure and integrity are weaker in Black than in White families. This finding is in line with the Marginalization-related Diminished Returns (MDRs), defined as weaker effects of SES indicators for Blacks and other racial and minority groups than for Whites.
1. Introduction
Our ability to study the microstructure and integrity of brain regions and structures [1,2] has drastically improved since the development of diffusion tensor imaging (DTI) and diffusion magnetic resonance imaging (dMRI) [3,4,5]. Diffusion tensor imaging (DTI) and dMRI assess the direction of the movement of the water molecules in brain tissue as a result of exposure to a moving electromagnetic field. Diffusion magnetic resonance imaging (dMRI) and DRI can measure fractional anisotropy that reflects white and gray matter diffusivity, density, integrity, and micro-structure [2,6,7]. Such fractional anisotropy can capture some of the developmental abnormalities in the brain cerebellum cortex and other structures [8,9,10]. Altered fractional anisotropy of various brain structures such as the thalamus, amygdala, hippocampus, cerebral cortex, and cerebellum cortex are well-documented in clinical and subclinical anomalies [6,11,12,13] associated with brain injury, psychosis, depression [14,15,16], autism [17,18,19], and attention deficit hyperactive disorder (ADHD) [20,21,22]. Altered fractional anisotropy across brain structures are linked to poor processing speed [23,24] motor dysfunction [25,26], learning [27,28,29], executive function [24,30,31,32], emotion regulation [33,34,35,36,37], inhibitory control [38,39,40], and even memory formation [41,42,43].
Parental education and household income are two main socioeconomic status (SES) factors [44] that correlate with adolescents’ brain development and associated behavioral and emotional outcomes. Parental education and family income are inversely associated with adolescents’ odds of antisocial behaviors [45], school problems [46], learning disorders [47], attention deficit and hyperactivity disorder [48,49,50,51], aggression [52], early sexual initiation [53], and use of tobacco [54,55], alcohol [56,57], and drugs [58]. The SES effects on brain structures and function are believed to be one of the reasons why we see connection between various family SES indicators and adolescents’ behavioral and emotional profile [59,60,61]. While all SES indicators are important, parental education and household income reflect two complementary aspects of the home and social environment [62]. While high family income reduces the risk of food and housing insecurity and overall stress, high parental education reflects an aspect of SES that is not covered by the availability of financial resources. Parental education is more reflective of effective and involved parenting [63,64,65], intellectually enriched environment and psychosocial rather than economic environment [66,67,68]. It is particularly important to study racial differences in the effects of parental education and household income because research suggests that while income generates more equal outcomes across racial groups [69,70], parental education may exert far fewer influences for families of color [71]. This difference is because parents of color with high education are likely to be discriminated against in the labor market [72] and parental education generates less income and wealth in non-White families [73,74,75]. However, by the time that income reaches the pocket of families, many of these environmental and structural barriers are already bypassed, so income can generate more equal outcomes across diverse racial groups.
Most of the existing knowledge on the brain effects of SES indicators are focused on structure (e.g., size) and the function (e.g., response to threat) of brain structures [76,77,78,79,80] such as the cerebral cortex, hippocampus, amygdala, and thalamus [81]. While we know altered size and function of such brain structures correlate with psychosis, depression, anxiety, ADHD, and learning disorder [82,83,84,85,86,87,88,89], less is known about the role of the micro-structure of the cerebellum cortex. Thus, there is a need to test if what is relevant to other brain structures [81] such as the hippocampus, amygdala, thalamus, and cerebellum cortex [48,66,77,79,90,91,92,93,94,95,96], also holds for microstructure and integrity of the cerebellum cortex. As such, to fill the existing gap in the literature, there is a need to compare racial groups for the effects of two major SES indicators (parental education and household income) on the cerebellum cortex fractional anisotropy.
While there is a very well-established body of literature on SES effects on the brain [78,79,80,90,91,95,97,98], and some of this literature shows that SES also impacts brain microstructure and brain tissue integrity [1,99,100], we need more research in this area. First, most of the literature on SES effects on adolescents’ brain development are on brain structures other than the cerebellum cortex [59,62,101,102]. Second, the existing research has mainly studied the additive rather than multiplicative effects of race and SES, because race and SES are seen as overlapping proxies of trauma, stress, and adversities [59,62,101,102]. Although additive effects of race and SES on brain function and structure are known [59,101,102], recent research has suggested that SES indicators may show diminished effects on the brain development of Black relative to White adolescents [103] and adults [104]. Despite these recent developments in the literature, we are not aware of any studies focusing on racial differences in the effects of SES indicators on children’s cerebellum cortex fractional anisotropy.
According to the Marginalization-related Diminished Returns (MDRs) framework [69,105], due to racism, marginalization, stratification, and discrimination, SES indicators (particularly parental education) tend to generate fewer effects on health outcomes, including adolescents’ brain development, in racial minority families compared to White families. Similar MDRs are shown for the effects of parental education on Black pre-adolescents’ attention [106], impulse control [107], inhibitory control [108], depression [109], suicidality [63], anxiety [110], social and behavioral problems [111,112], and attention deficit hyperactive disorder (ADHD) [49]. As a result of these MDRs, we observe poor development and behavior in high family SES only because they are Black and treated differently by society [62]. However, very little, if any, is known on such MDRs for cerebellum cortex fractional anisotropy.
Aims
In a national sample of 9–10-year-old pre-adolescents, this study had two aims: first, to explore the effects of parental education and household income on cerebellum cortex fractional anisotropy as a proxy of cerebellum cortex microstructure and tissue integrity, and second, to explore racial variation in such effects. While we expected overall effects of parental education and household income on cerebellum cortex fractional anisotropy, in line with the MDRs literature, we expected these effects to be weaker for Black than for White pre-adolescents. That means we hypothesized pre-adolescents’ cerebellum cortex fractional anisotropy to remain similar in high SES and low SES Black pre-adolescents, while the difference in cerebellum cortex fractional anisotropy is expected to be large between low SES and high SES White pre-adolescents. If we find support for our hypothesis, we will attribute the observed racial differences to MDRs-generating processes such as racism, discrimination, and segregation (as opposed to biological and genetic differences).
2. Methods
2.1. The ABCD Study Design and Setting
This secondary data analysis had a cross-sectional methodological design. This investigation used data from the Adolescent Brain Cognitive Development (ABCD) study [113,114,115,116,117]. This cross-sectional study used wave 1 data from the ABCD study. ABCD is a national brain imaging study of pre-adolescents’ brain structure and function [113,118].
2.2. Ethics
The ethics review board of the University of California in San Diego approved the ABCD study. While youth signed assent, parents signed consent [118]. Given the de-identified nature of the data, our secondary analysis was exempt from the Charles R Drew University of Medicine and Science ethics review board.
2.3. Samples and Sampling
The ABCD study participants were drawn from schools in various cities across various US states. The subject recruitment was mainly conducted through local school systems. Schools were selected based on characteristics such as race, ethnicity, SES, sex, and urbanicity [119]. This paper’s analytical sample was 9565 pre-adolescents who were between 9 and 10 years old. Inclusion in this analysis was limited to 9–10-year-old pre-adolescents who had complete data on race, ethnicity, parental education, household income, and cerebellum cortex fractional anisotropy.
2.4. Image Acquisition and dMRI
The ABCD study has captured T1 and T2 weighted structural, functional, and diffusion MRI data using General Electric 750, 3 tesla (T) Siemens Prisma, and Phillips multi-channel coiled scanners. All these MRI devices have been capable of multiband echo-planar imaging (EPI) acquisitions [114]. A localizer has been implemented to maximize the image acquisition harmonization before the scanning process starts. The T1 and T2 weighted scan sequences were optimized for cortical and subcortical segmentation. This was done using a magnetization-prepared rapid acquisition gradient-echo. Casey et al. have provided a detailed description of MRI acquisition in the ABCD study [120]. Although in the ABCD study, task-based and resting-state functional, structural, and diffusion MRI are used, the current analysis only used dMRI data [120]. The scan sessions in the ABCD study consist of a fixed order of scan types. These start with a localizer followed by the acquisition of 3D T1-weighted images, 2 runs of resting state fMRI, diffusion weighted images, 3D T2-weighted images, resting-state fMRI, and finally three task-based fMRIs [120].
Before scans are preformed, all participants undergo a detailed MR screening questionnaire for ruling out existence of any MRI contraindication. These include braces, pacemakers, and other metal in the body including piercings, medical screw, pins, etc. This MR screening is conducted three times: at the time of recruitment to the study when MRI is being scheduled and prior to the scans [120].
The next steps before actual scan sessions are simulation and motion compliance training. As MRI parameters are highly sensitive to noise and their reliability and validity are susceptible to movement artifacts, especially in pediatric populations [121], before the scan, a simulator is used to desensitize participants to the scanner environment. Simulation occurs in dedicated mock scanners, which have prerecorded scanner sounds and collapsible play tunnels equal to the diameter of the scanner bore (55–60 mm). As head motion is a major threat to the validity of pediatric MRI, behavioral shaping techniques are applied as a part of motion compliance training [122]. Commercial simulators or Wii devices that are fixed to the child’s head monitor head motion and provide feedback to the participating child. Following the performance of simulation and motion compliance, participants practice three fMRI tasks to be sure they understand the instructions.
In addition, during the 3D T2 and diffusion weighted imaging acquisitions and during acquisition of the localizer and 3D T1 scans, a child-friendly movie is being played while the child is in the scanner [120]. The 3D T1-weighted magnetization-prepared rapid acquisition gradient echo scan is obtained for cortical and subcortical segmentation of the brain [120]. The high angular resolution diffusion imaging (HARDI) scan, with multiple b-values, and fast integrated B0 distortion correction reversed polarity gradient (RPG) method [123,124], is acquired for segmentation of white matter tracts and measurement of diffusion [120].
As described in detail by Hagler and colleagues [125], the T1-weighted acquisition in the ABCD study is a 3D T1w inversion-prepared radio-frequency (RF)-spoiled gradient echo scan that was 1 mm isotropic [126,127]. The dMRI acquisition uses multiband echo planar imaging and was 1.7 mm isotropic [128,129]. The dMRI acquisition uses a slice acceleration factor of 3. It has 96 diffusion directions, seven b = 0 frames, and four different b-values. The 96 directions included 6 directions with b = 500, 15 directions with b = 1000, 15 directions with b = 2000, and 60 directions with b = 3000 [120].
The processing of the dMRI data is also described in detail elsewhere [125]. Briefly, distortions due to eddy currents are corrected, outliers are removed from the data, head motion is corrected using rigid body registration, spatial and image intensity distortion from B0 field inhomogeneities are corrected, and the b = 0 images are registered to the T1-weighted images using mutual information. Then, the ABCD dMRI processing pipelines measure a number of different properties of white matter data, including FA, an index of the directionality of water diffusion within a voxel. Other properties include mean diffusivity (MD), a mean of the eigenvalues, longitudinal diffusivity (LD), the first eigenvalue, and transverse diffusivity (TD), the mean of the second and third eigenvalues [130]. These dMRI metrics were calculated for white and gray matter structures and segments as well as fiber tracts based on the brain atlas. These are standard methods for segmenting gray and white matter based on brain atlas [131]. While other dMRI were also available, in this study we only used cerebellum cortex fractional anisotropy [120].
Head motion is a significant concern for pediatric imaging. In the ABCD study, real-time motion detection and correction for the structural scans are implemented by the ABCD DAIC hardware and software. Specifically, anatomical 3D T1- and 3D T-2 weighted images are collected using prospective motion correction (PROMO) on the General Electric (GE) [127], Volumetric Navigators (vNav) for prospective motion correction and selective reacquisition on the Siemens and when available on the Philips platform [126].
A real-time head motion monitoring system called FIRMM (fMRI Integrated Real-time Motion Monitor [121], collaboratively developed at Washington University, St. Louis and Oregon Health Sciences University, is implemented for motion detection in resting state fMRI scans at the Siemens sites. FIRMM allows scanner operators to adjust the scanning paradigm based on a participant’s degree of head motion (i.e., the worse the motion, the less usable data and greater the need for more data to be acquired). The ABCD also used an arousal questionnaire. Immediately following scanning, participants were administered the ABCD arousal state questionnaire again.
2.5. Variables
2.5.1. Dependent Variable
Using dMRI data, the outcome in this study was right and left cerebellum cortex fractional anisotropy. Fractional anisotropy is a proxy of the integrity and tissue microstructure of the brain’s tissue (cerebellum cortex in this study). Cerebellum cortex fractional anisotropy was calculated for right and left hemispheres, based on the brain atlas. We operationalized this variable as a continuous measure. The ABCD data set already includes pre-calculated and available right and left cerebellum cortex fractional anisotropy (Appendix A.2).
2.5.2. Independent Variable
Parental education: The independent variable was parental education, measured by self-reported educational attainment of both parents. ABCD study has calculated this variable based on the highest level of educational attainment of both parents. This variable was a categorical variable with the following categories. (1) <HS Diploma, (2) HS Diploma/GED, (3) Some College, (4) Bachelor, and (5) Post Graduate Degree.
Household income: The second independent variable was family income, a three-level categorical measure: Parents were asked about their overall household income. The item read as “What is your total combined family income for the past 12 months? This should include income (before taxes and deductions) from all sources, wages, rent from properties, social security, disability and veteran’s benefits, unemployment benefits, workman”. Responses included 1 = Less than USD 50,000; 2 = USD 50,000–100,000; 3 = USD 100,000+.
2.5.3. Covariates
Age: Parents were asked to report pre-adolescents’ age. Age was in months passed since birth.
Sex: A dichotomous variable, sex, was coded as male = 1 and female = 0.
Family marital status: Family marital status, a dichotomous variable, was coded as married = 1, non-married = 0 (reference).
Ethnicity: Parents were asked if they were from a Latino background. Ethnicity was coded as Latino = 1 and = 0.
2.5.4. Moderator
Race: Race was a self-identified variable: Black, Asian, Mixed/Other, and White (reference category). Multiracial respondents were included in the survey and were categorized as Mixed/Other.
2.6. Data Analysis
Using Data Exploration and Analysis Portal (DEAP), we reported mean (SD) and frequency tables (%) for our variables overall and by race. Then, we calculated Chi-square and Analysis of Variance (ANOVA) to explore bivariate associations between our study variables. To run multivariable analyses, three mixed-effects regression models were run for each outcome (Appendix A.1). The first model did not include race by parental education or household income interaction term. Model 2 included the race by parental education interaction terms. Model 3 included the race by household income interaction terms. To test our modeling assumptions, we ruled out collinearity between study variables. We also tested the distribution of our outcome variables and error terms (residuals) (Appendix A.2). The predictor variables were parental education and household income. The outcomes were right and left cerebellum cortex fractional anisotropy. Confounders included ethnicity, sex, age, and parental marital status. The moderator was race. We controlled for propensity score and MRI device. Regression coefficient, standard errors (SEs), and p-values were reported. A p-value of less than 0.05 was significant.
3. Results
3.1. Descriptives
This secondary analysis included 9565 9–10-year-old pre-adolescents. Pre-adolescents were either White (n = 6436), Black (n = 1343), Asian (n = 203), or other/mixed race (n = 1583). Table 1 shows the summary statistics of the study variables in the overall sample and by race. The difference between racial groups in terms of right and left cerebellum cortex fractional anisotropy was statistically significant.
3.2. Model Fits
Table 2 shows a summary of the fit statistics for all our eight models. As this table shows, the models better explained the outcomes when they included the interactions terms between race and SES. That means interactions between race and parental education and household income help the model to better explain the variance of the right and left cerebellum cortex fractional anisotropy.
3.3. Parental Education and Right and Left Cerebellum Cortex Fractional Anisotropy
Table 3 shows the results of regression models in the total sample with race, parental education, and household income as the predictors and right and left cerebellum cortex fractional anisotropy as the outcome. In the pooled sample, parental education was associated with right and left cerebellum cortex fractional anisotropy (net of confounders).
3.4. Household Income and Right and Left Cerebellum Cortex Fractional Anisotropy
Table 4 shows the results of regression models in the total sample with parental education as the predictor and right and left cerebellum cortex fractional anisotropy as the outcome. In the pooled sample, parental education was associated with right and left cerebellum cortex fractional anisotropy (net of confounders). These effects were significantly larger for White than for Black pre-adolescents, documented by significant interactions between race and parental education on the right and left cerebellum cortex fractional anisotropy.
3.5. Household Income and Right and Left Cerebellum Cortex Fractional Anisotropy
Table 5 shows the results of regression models in the total sample with household income as the predictor and right and left cerebellum cortex fractional anisotropy as the outcome. In the pooled sample, we found significant interactions between race and household income on the right and left cerebellum cortex fractional anisotropy.
3.6. Parental Education and Right and Left Cerebellum Cortex Fractional Anisotropy Overall and by Race
Figure 1 shows the associations between parental education and right and left cerebellum cortex fractional anisotropy overall. Figure 1a and Figure 2a show associations between parental education and right and left cerebellum cortex fractional anisotropy (net of confounders) in the pooled sample. Figure 1b and Figure 2b show that these effects are significantly larger for White than for Black pre-adolescents.
3.7. Household Income and Right and Left Cerebellum Cortex Fractional Anisotropy
Figure 2 shows the associations between household income and right and left cerebellum cortex fractional anisotropy overall. Figure 3a and Figure 4a did not show any association between household income and right and left cerebellum cortex fractional anisotropy (net of confounders) in the pooled sample. Figure 3b and Figure 4b show that the association between household income and right and left cerebellum cortex fractional anisotropy are significantly larger for White than for Black pre-adolescents.
4. Discussion
The effects of higher parental education and household income on the right and left cerebellum cortex fractional anisotropy are larger for White pre-adolescents than they are for Black pre-adolescents. Racial differences in the effects of high parental education and household income on the right and left cerebellum cortex fractional anisotropy is in line with the MDRs.
Multiple previous studies have shown that high SES indicators such as parental education and household income correlate with multiple functional and structural aspects of the brain in adolescents and adults. Most of the past work, however, is on regions and structures other than the cerebellum. For example, research has well-established links between higher family SES and the structure and function of the cerebral cortex, thalamus, hippocampus, amygdala, and striatum. In fact, the effects of SES on these brain structures and functions might be why SES is linked to adolescents’ cognitive function, emotions, and behaviors [132].
We found similar results for household income and parental education. While parental education and household income correlate, and have overlapping mechanisms of the effects, they also have unique ways by which they influence brain development [133,134,135,136]. Parental education and household income are linked to brain structure because they are proxies of high-quality parenting [137,138,139,140,141] and lower parental risk behaviors [142,143,144,145] and low stress across domains [146]. Parenting and parental behaviors have salient effects on adolescents’ brain development that are not all due to SES [147]. As such, both parental education and household income and income represent the social environment in which the child’s development is happening. This is particularly important because both parenting and SES protect adolescents against psychopathologies [148,149,150], problem behaviors [45,151,152], and poor cognitive performance [71,153,154,155]. At the same time, low family SES is a proxy of the scarcity of resources, which can interfere with the healthy development of young people’s brains.
The results reported here are in line with what we know about Marginalization-related Diminished Returns (MDRs). MDRs can be defined as weaker effects of SES indicators such as parental education and household income on various health outcomes for racial minorities than for Whites. MDRs are documented for attention [106], impulsivity and inhibitory control [107,156], depression [63,109,157,158,159], suicidality [63], anxiety [110], social and behavioral problems [156,160], and ADHD [49] in Black adolescents.
Race and parental education and household income have multiplicative rather than additive effects on fractional anisotropy of the cerebellum cortex. As a result, low SES and high SES Black adolescents remain at high risk, regardless of their SES. This pattern is in contrast to Whites for whom high SES reduces the risk. Fractional anisotropy of the brain is shown to be linked to depression [14,15,16], autism [17,18,19], and attention deficit hyperactive disorder (ADHD) [20,21,22] as well as poor processing speed [23,24] motor dysfunction [25,26], learning [27,28,29], executive function [24,30,31,32], emotion regulation [33,34,35,36,37], inhibitory control [38,39,40], and even memory formation [41,42,43].
Future research should test how societal and structural conditions bound the boosting effects of parental education and household income on adolescents’ white and gray matter integrity in Black families. The results of such investigations may have useful implications for public policy, clinical practice, and public health. These findings suggest that a true social and economic policy to tackle racial inequalities in brain development should equalize SES and the marginal returns of SES. The results of such investigations may direct our policymakers to promote brain health equity; they may achieve equity through two complementary strategies: first to close the SES gap across racial groups, and second, to equalize the returns of SES through enhancing social justice in the daily lives of diverse racial groups.
Our study findings suggested a significant risk for both high- and low- SES Black pre-adolescents. For White pre-adolescents, low SES is a risk factor, and high SES is a protective factor. However, for Black pre-adolescents, both those from low SES or high SES backgrounds remain at high risk in terms of cerebellum cortex integrity. The smaller protective effects of SES for Black families may be due to environmental (not biological) aspects of race that are not due to SES. These may be because of race-related stressors like racism, discrimination, segregation, and blocked opportunities. Racial discrimination, stress, trauma, and adversities have all been shown to impact Blacks’ brain development across all SES levels [161,162,163]. Similar patterns are reported for various brain regions and functions [164].
Race and SES have multiplicative and complex effects as social determinants of children’s brain development. Thus, programs and interventions should be in place to alleviate the risk and promote the brain development of middle-class Black pre-adolescents. Early childhood programs and after-school programs are shown to be effective and may promote the brain development of underserved communities [165,166,167,168]. We argue that multi-level social and economic policies should reduce the environmental and structural adversities in Black families’ lives across the full SES spectrum.
Again, there is a need to emphasize that all the MDRs literature including this paper has conceptualized race as a social, not as a biological, determinant of pre-adolescents’ brain development. In our study, race is a proxy of racism that reduces the effects of SES, even for families who have access to economic and human resources. Racial differences reported here are not shaped by genes but the differential treatment of society. Labor market discrimination, segregation, low school quality, and differential policing are examples of racism in the US. This view is different from any alternative argument that links race as an innate, unchangeable, biological marker to brain function and structure [169].
5. Limitations
This study has at least seven methodological limitations. The first is the cross-sectional design. Due to this limitation, no causal inferences are made between race, parental education, household income and brain microstructure. The second limitation is that the analyses also have only a few independent variables. It would be reasonable to expect that the results would be different if more explanatory variables were included. Our SES indicators were limited, and we did not include a comprehensive list of SES indicators such as wealth or home ownership. For example, the data do not include information on the occupational status of parents, an important indicator of SES. Another missing confounding variable was the type of residence (urban vs. rural) which can affect the dependent variable through unequal access to healthcare. All of our SES indicators were measured at the family level. Neighborhood-level SES indicators such as home value, residential-area income, and area-level education level were not included. The third limitation was the lack of data on the current medical conditions. Altered cerebellum cortex fractional anisotropy can be indicative of several conditions. Among them might be schizophrenia, attention deficit/hyperactivity disorder (ADHD), and autism. These disorders are determined by genetic factors as well as environmental conditions. Given that we did not control for current medical conditions and/or family history of these disorders, our results should be interpreted with caution. Altered fractional anisotropy of various brain structures has been linked to deficits in working memory, attention, and general cognition by earlier research, which were not assessed here. Fourth, we only focused on overall fractional anisotropy, without mapping it by regions of interest and cerebellum sub-regions. Fifth, we only described one aspect of the brain and we could compare it with other functional and structural features such as size, volume, diffusivity and density. Sixth, this study only described the differential effects of parental education and household income without investigating why such differences exist. Seventh, the sample size was imbalanced, and a larger proportion of the sample was White, with less than 20% being Black. Despite these limitations, this was one of the first studies on the intersections of race, SES, and cerebellum microstructure.
6. Conclusions
While SES indicators such as parental education and household income are associated with right and left cerebellum cortex fractional anisotropy, these effects are stronger for White than for Black American pre-adolescents. These Marginalization-related Diminished Returns (MDRs) are probably due to the differences in the living experiences of Black and White middle-class families, which reduces the utility of SES indicators in Black communities. Future research should investigate whether racism, social stratification, and segregation reduce the effects of parental education and household income in Black communities when compared to their White counterparts.
Author Contributions
Conceptualization, Writing—review & editing: S.A. and S.B.; Data analysis and Supervision: S.A. Both authors have read and agreed to the published version of the manuscript.
Funding
Assari is supported by the National Institutes of Health (NIH) grants U54MD007598, DA035811-05, U54MD008149, D084526-03, and U54CA229974.
Data Availability Statement
Data used in the preparation of this article were obtained from the Adolescent Brain Cognitive Development (ABCD) Study (https://abcdstudy.org (accessed on 22 December 2020)), held in the NIMH Data Archive (NDA) available here: https://nda.nih.gov/abcd (accessed on 22 December 2020).
Acknowledgments
Data came from the Adolescent Brain Cognitive Development (ABCD) Study. This is a multisite, longitudinal study designed to recruit more than 10,000 pre-adolescents aged 9–10 and follow them over 10 years into early adulthood. A listing of participating sites and a complete listing of the study investigators can be found at https://abcdstudy.org/principal-investigators.html (accessed on 22 December 2020). ABCD consortium investigators designed and implemented the study and/or provided data but did not participate in the analysis or writing of this report. This manuscript reflects the views of the authors and may not reflect the opinions or views of the NIH or ABCD consortium investigators. The ABCD data repository grows and changes over time. The ABCD data used in this report came from the ABCD 2.0 under the doi: 10.15154/1503209 available here https://nda.nih.gov/abcd/query/abcd-curated-annual-release-2.0.html (accessed on 22 December 2020). The ABCD Study is supported by the National Institutes of Health Grants (U01DA041022, U01DA041028, U01DA041048, U01DA041089, U01DA041106, U01DA041117, U01DA041120, U01DA041134, U01DA041148, U01DA041156, U01DA041174, U24DA041123, U24DA041147). A full list of supporters is available at https://abcdstudy.org/nih-collaborators (accessed on 22 December 2020).
Conflicts of Interest
The authors declare no conflict of interest.
Appendix A
Appendix A.1. Model Formula
Model 1 (All, Overall Effect)
| dmri_dti.fa_subcort.aseg_cerebellum.cortex.rh ~ high.educ.bl + household.income.bl + race.4level + married.bl + age + sex + hisp |
| Random: ~(1|rel_family_id) |
| dmri_dti.fa_subcort.aseg_cerebellum.cortex.lh ~ high.educ.bl + household.income.bl + race.4level + married.bl + age + sex + hisp |
| Random: ~(1|rel_family_id) |
| dmri_dti.fa_subcort.aseg_cerebellum.cortex.rh ~ high.educ.bl + household.income.bl + race.4level + married.bl + age + sex + hisp + high.educ.bl * race.4level |
| Random: ~(1|rel_family_id) |
| dmri_dti.fa_subcort.aseg_cerebellum.cortex.lh ~ high.educ.bl + household.income.bl + race.4level + married.bl + age + sex + hisp + high.educ.bl * race.4level |
| Random: ~(1|rel_family_id) |
Appendix A.2. Distribution of Study Variables and Models Assumptions
Figure A1.
Models Assumptions.


References
- Eluvathingal, T.J.; Chugani, H.T.; Behen, M.E.; Juhasz, C.; Muzik, O.; Maqbool, M.; Chugani, D.C.; Makki, M. Abnormal brain connectivity in children after early severe socioemotional deprivation: A diffusion tensor imaging study. Pediatrics 2006, 117, 2093–2100. [Google Scholar] [CrossRef]
- Deary, I.J.; Bastin, M.E.; Pattie, A.; Clayden, J.D.; Whalley, L.J.; Starr, J.M.; Wardlaw, J.M. White matter integrity and cognition in childhood and old age. Neurology 2006, 66, 505–512. [Google Scholar] [CrossRef]
- Lim, K.O.; Hedehus, M.; Moseley, M.; de Crespigny, A.; Sullivan, E.V.; Pfefferbaum, A. Compromised white matter tract integrity in schizophrenia inferred from diffusion tensor imaging. Arch. Gen. Psychiatry 1999, 56, 367–374. [Google Scholar] [CrossRef] [PubMed]
- Lim, K.O.; Choi, S.J.; Pomara, N.; Wolkin, A.; Rotrosen, J.P. Reduced frontal white matter integrity in cocaine dependence: A controlled diffusion tensor imaging study. Biol. Psychiatry 2002, 51, 890–895. [Google Scholar] [CrossRef]
- Ma, X.; Coles, C.D.; Lynch, M.E.; Laconte, S.M.; Zurkiya, O.; Wang, D.; Hu, X. Evaluation of corpus callosum anisotropy in young adults with fetal alcohol syndrome according to diffusion tensor imaging. Alcohol Clin. Exp. Res. 2005, 29, 1214–1222. [Google Scholar] [CrossRef] [PubMed]
- Kubicki, M.; Park, H.; Westin, C.F.; Nestor, P.G.; Mulkern, R.V.; Maier, S.E.; Niznikiewicz, M.; Connor, E.E.; Levitt, J.J.; Frumin, M.; et al. DTI and MTR abnormalities in schizophrenia: Analysis of white matter integrity. Neuroimage 2005, 26, 1109–1118. [Google Scholar] [CrossRef] [Green Version]
- Hoeft, F.; Barnea–Goraly, N.; Haas, B.W.; Golarai, G.; Ng, D.; Mills, D.; Korenberg, J.; Bellugi, U.; Galaburda, A.; Reiss, A.L. More is not always better: Increased fractional anisotropy of superior longitudinal fasciculus associated with poor visuospatial abilities in Williams syndrome. J. Neurosci. 2007, 27, 11960–11965. [Google Scholar] [CrossRef] [PubMed] [Green Version]
- Grant, J.E.; Correia, S.; Brennan–Krohn, T.; Malloy, P.F.; Laidlaw, D.H.; Schulz, S.C. Frontal white matter integrity in borderline personality disorder with self–injurious behavior. J. Neuropsychiatry Clin. Neurosci. 2007, 19, 383–390. [Google Scholar] [CrossRef]
- Ashtari, M.; Cottone, J.; Ardekani, B.A.; Cervellione, K.; Szeszko, P.R.; Wu, J.; Chen, S.; Kumra, S. Disruption of white matter integrity in the inferior longitudinal fasciculus in adolescents with schizophrenia as revealed by fiber tractography. Arch. Gen. Psychiatry 2007, 64, 1270–1280. [Google Scholar] [CrossRef] [Green Version]
- Kraus, M.F.; Susmaras, T.; Caughlin, B.P.; Walker, C.J.; Sweeney, J.A.; Little, D.M. White matter integrity and cognition in chronic traumatic brain injury: A diffusion tensor imaging study. Brain 2007, 130, 2508–2519. [Google Scholar] [CrossRef]
- Mueller, H.P.; Unrath, A.; Sperfeld, A.D.; Ludolph, A.C.; Riecker, A.; Kassubek, J. Diffusion tensor imaging and tractwise fractional anisotropy statistics: Quantitative analysis in white matter pathology. Biomed. Eng. Online 2007, 6, 42. [Google Scholar] [CrossRef] [Green Version]
- Keller, T.A.; Kana, R.K.; Just, M.A. A developmental study of the structural integrity of white matter in autism. Neuroreport 2007, 18, 23–27. [Google Scholar] [CrossRef]
- Munoz Maniega, S.; Lymer, G.K.; Bastin, M.E.; Marjoram, D.; Job, D.E.; Moorhead, T.W.; Owens, D.G.; Johnstone, E.C.; McIntosh, A.M.; Lawrie, S.M. A diffusion tensor MRI study of white matter integrity in subjects at high genetic risk of schizophrenia. Schizophr. Res. 2008, 106, 132–139. [Google Scholar] [CrossRef]
- Ouyang, X.; Tao, H.J.; Liu, H.H.; Deng, Q.J.; Sun, Z.H.; Xu, L.; Liu, Z.N.; Xue, Z.M. White matter integrity deficit in treatment–naive adult patients with major depressive disorder. East Asian Arch. Psychiatry 2011, 21, 5–9. [Google Scholar] [PubMed]
- Guo, W.B.; Liu, F.; Chen, J.D.; Xu, X.J.; Wu, R.R.; Ma, C.Q.; Gao, K.; Tan, C.L.; Sun, X.L.; Xiao, C.Q.; et al. Altered white matter integrity of forebrain in treatment–resistant depression: A diffusion tensor imaging study with tract–based spatial statistics. Prog. Neuropsychopharmacol. Biol. Psychiatry 2012, 38, 201–206. [Google Scholar] [CrossRef] [PubMed]
- Walther, S.; Hugli, S.; Hofle, O.; Federspiel, A.; Horn, H.; Bracht, T.; Wiest, R.; Strik, W.; Muller, T.J. Frontal white matter integrity is related to psychomotor retardation in major depression. Neurobiol. Dis. 2012, 47, 13–19. [Google Scholar] [CrossRef] [PubMed]
- Sahyoun, C.P.; Belliveau, J.W.; Mody, M. White matter integrity and pictorial reasoning in high–functioning children with autism. Brain. Cogn. 2010, 73, 180–188. [Google Scholar] [CrossRef] [Green Version]
- Im, W.Y.; Ha, J.H.; Kim, E.J.; Cheon, K.A.; Cho, J.; Song, D.H. Impaired White Matter Integrity and Social Cognition in High–Function Autism: Diffusion Tensor Imaging Study. Psychiatry Investig. 2018, 15, 292–299. [Google Scholar] [CrossRef] [PubMed] [Green Version]
- Cai, K.; Yu, Q.; Herold, F.; Liu, Z.; Wang, J.; Zhu, L.; Xiong, X.; Chen, A.; Muller, P.; Kramer, A.F.; et al. Mini–Basketball Training Program Improves Social Communication and White Matter Integrity in Children with Autism. Brain Sci. 2020, 10, 803. [Google Scholar] [CrossRef]
- Hamilton, L.S.; Levitt, J.G.; O’Neill, J.; Alger, J.R.; Luders, E.; Phillips, O.R.; Caplan, R.; Toga, A.W.; McCracken, J.; Narr, K.L. Reduced white matter integrity in attention–deficit hyperactivity disorder. Neuroreport 2008, 19, 1705–1708. [Google Scholar] [CrossRef] [Green Version]
- Davenport, N.D.; Karatekin, C.; White, T.; Lim, K.O. Differential fractional anisotropy abnormalities in adolescents with ADHD or schizophrenia. Psychiatry Res. 2010, 181, 193–198. [Google Scholar] [CrossRef] [PubMed] [Green Version]
- King, J.B.; Yurgelun–Todd, D.; Stoeckel, A.; DiMuzio, J.M.; Lopez–Larson, M.P. Sex differences in white matter integrity in youths with attention–deficit/hyperactivity disorder: A pilot study. Front Neurosci. 2015, 9, 232. [Google Scholar] [CrossRef] [PubMed] [Green Version]
- Kerchner, G.A.; Racine, C.A.; Hale, S.; Wilheim, R.; Laluz, V.; Miller, B.L.; Kramer, J.H. Cognitive processing speed in older adults: Relationship with white matter integrity. PLoS ONE 2012, 7, e50425. [Google Scholar] [CrossRef] [PubMed] [Green Version]
- Genova, H.M.; DeLuca, J.; Chiaravalloti, N.; Wylie, G. The relationship between executive functioning, processing speed, and white matter integrity in multiple sclerosis. J. Clin. Exp. Neuropsychol. 2013, 35, 631–641. [Google Scholar] [CrossRef] [Green Version]
- Manoach, D.S.; Ketwaroo, G.A.; Polli, F.E.; Thakkar, K.N.; Barton, J.J.; Goff, D.C.; Fischl, B.; Vangel, M.; Tuch, D.S. Reduced microstructural integrity of the white matter underlying anterior cingulate cortex is associated with increased saccadic latency in schizophrenia. Neuroimage 2007, 37, 599–610. [Google Scholar] [CrossRef]
- Walther, S.; Federspiel, A.; Horn, H.; Razavi, N.; Wiest, R.; Dierks, T.; Strik, W.; Muller, T.J. Alterations of white matter integrity related to motor activity in schizophrenia. Neurobiol. Dis. 2011, 42, 276–283. [Google Scholar] [CrossRef]
- Liu, X.; Lai, Y.; Wang, X.; Hao, C.; Chen, L.; Zhou, Z.; Yu, X.; Hong, N. Reduced white matter integrity and cognitive deficit in never–medicated chronic schizophrenia: A diffusion tensor study using TBSS. Behav. Brain Res. 2013, 252, 157–163. [Google Scholar] [CrossRef]
- Xiao, J.; He, Y.; McWhinnie, C.M.; Yao, S. Altered white matter integrity in individuals with cognitive vulnerability to depression: A tract–based spatial statistics study. Sci. Rep. 2015, 5, 9738. [Google Scholar] [CrossRef] [Green Version]
- Ray, N.R.; O’Connell, M.A.; Nashiro, K.; Smith, E.T.; Qin, S.; Basak, C. Evaluating the relationship between white matter integrity, cognition, and varieties of video game learning. Restor. Neurol. Neurosci. 2017, 35, 437–456. [Google Scholar] [CrossRef] [Green Version]
- Gold, B.T.; Powell, D.K.; Xuan, L.; Jicha, G.A.; Smith, C.D. Age-related slowing of task switching is associated with decreased integrity of frontoparietal white matter. Neurobiol. Aging 2010, 31, 512–522. [Google Scholar] [CrossRef] [Green Version]
- Brinkman, T.M.; Reddick, W.E.; Luxton, J.; Glass, J.O.; Sabin, N.D.; Srivastava, D.K.; Robison, L.L.; Hudson, M.M.; Krull, K.R. Cerebral white matter integrity and executive function in adult survivors of childhood medulloblastoma. Neuro Oncol. 2012, 14 (Suppl. 4), iv25–iv36. [Google Scholar] [CrossRef] [Green Version]
- Borghesani, P.R.; Madhyastha, T.M.; Aylward, E.H.; Reiter, M.A.; Swarny, B.R.; Schaie, K.W.; Willis, S.L. The association between higher order abilities, processing speed, and age are variably mediated by white matter integrity during typical aging. Neuropsychologia 2013, 51, 1435–1444. [Google Scholar] [CrossRef] [Green Version]
- Passamonti, L.; Fairchild, G.; Fornito, A.; Goodyer, I.M.; Nimmo–Smith, I.; Hagan, C.C.; Calder, A.J. Abnormal anatomical connectivity between the amygdala and orbitofrontal cortex in conduct disorder. PLoS ONE 2012, 7, e48789. [Google Scholar] [CrossRef] [PubMed]
- Guo, W.B.; Liu, F.; Xue, Z.M.; Gao, K.; Wu, R.R.; Ma, C.Q.; Liu, Z.N.; Xiao, C.Q.; Chen, H.F.; Zhao, J.P. Altered white matter integrity in young adults with first–episode, treatment–naive, and treatment–responsive depression. Neurosci. Lett. 2012, 522, 139–144. [Google Scholar] [CrossRef]
- Choi, S.; Han, K.M.; Won, E.; Yoon, B.J.; Lee, M.S.; Ham, B.J. Association of brain–derived neurotrophic factor DNA methylation and reduced white matter integrity in the anterior corona radiata in major depression. J. Affect. Disord. 2015, 172, 74–80. [Google Scholar] [CrossRef]
- Lee, R.; Arfanakis, K.; Evia, A.M.; Fanning, J.; Keedy, S.; Coccaro, E.F. White Matter Integrity Reductions in Intermittent Explosive Disorder. Neuropsychopharmacology 2016, 41, 2697–2703. [Google Scholar] [CrossRef] [PubMed] [Green Version]
- Olson, E.A.; Cui, J.; Fukunaga, R.; Nickerson, L.D.; Rauch, S.L.; Rosso, I.M. Disruption of white matter structural integrity and connectivity in posttraumatic stress disorder: A TBSS and tractography study. Depress. Anxiety 2017, 34, 437–445. [Google Scholar] [CrossRef] [Green Version]
- Moeller, F.G.; Hasan, K.M.; Steinberg, J.L.; Kramer, L.A.; Dougherty, D.M.; Santos, R.M.; Valdes, I.; Swann, A.C.; Barratt, E.S.; Narayana, P.A. Reduced anterior corpus callosum white matter integrity is related to increased impulsivity and reduced discriminability in cocaine–dependent subjects: Diffusion tensor imaging. Neuropsychopharmacology 2005, 30, 610–617. [Google Scholar] [CrossRef] [Green Version]
- Bell, R.P.; Foxe, J.J.; Nierenberg, J.; Hoptman, M.J.; Garavan, H. Assessing white matter integrity as a function of abstinence duration in former cocaine–dependent individuals. Drug Alcohol Depend. 2011, 114, 159–168. [Google Scholar] [CrossRef] [Green Version]
- Li, P.; Tsapanou, A.; Qolamreza, R.R.; Gazes, Y. White matter integrity mediates decline in age–related inhibitory control. Behav. Brain Res. 2018, 339, 249–254. [Google Scholar] [CrossRef] [PubMed]
- Bucur, B.; Madden, D.J.; Spaniol, J.; Provenzale, J.M.; Cabeza, R.; White, L.E.; Huettel, S.A. Age–related slowing of memory retrieval: Contributions of perceptual speed and cerebral white matter integrity. Neurobiol. Aging 2008, 29, 1070–1079. [Google Scholar] [CrossRef] [PubMed] [Green Version]
- Rogalski, E.J.; Murphy, C.M.; deToledo–Morrell, L.; Shah, R.C.; Moseley, M.E.; Bammer, R.; Stebbins, G.T. Changes in parahippocampal white matter integrity in amnestic mild cognitive impairment: A diffusion tensor imaging study. Behav. Neurol. 2009, 21, 51–61. [Google Scholar] [CrossRef] [PubMed]
- Peters, B.D.; Szeszko, P.R.; Radua, J.; Ikuta, T.; Gruner, P.; DeRosse, P.; Zhang, J.P.; Giorgio, A.; Qiu, D.; Tapert, S.F.; et al. White matter development in adolescence: Diffusion tensor imaging and meta–analytic results. Schizophr Bull 2012, 38, 1308–1317. [Google Scholar] [CrossRef] [Green Version]
- Oshri, A.; Hallowell, E.; Liu, S.; MacKillop, J.; Galvan, A.; Kogan, S.M.; Sweet, L.H. Socioeconomic hardship and delayed reward discounting: Associations with working memory and emotional reactivity. Dev. Cogn. Neurosci. 2019, 37, 100642. [Google Scholar] [CrossRef]
- Palma–Coca, O.; Hernandez–Serrato, M.I.; Villalobos–Hernandez, A.; Unikel–Santoncini, C.; Olaiz–Fernandez, G.; Bojorquez–Chapela, I. Association of socioeconomic status, problem behaviors, and disordered eating in Mexican adolescents: Results of the Mexican National Health and Nutrition Survey 2006. J. Adolesc. Health 2011, 49, 400–406. [Google Scholar] [CrossRef]
- Sirin, S.R. Socioeconomic status and academic achievement: A meta–analytic review of research. Rev. Edu. Res. 2005, 75, 417–453. [Google Scholar] [CrossRef] [Green Version]
- Fluss, J.; Ziegler, J.C.; Warszawski, J.; Ducot, B.; Richard, G.; Billard, C. Poor reading in French elementary school: The interplay of cognitive, behavioral, and socioeconomic factors. J. Dev. Behav. Pediatr. 2009, 30, 206–216. [Google Scholar] [CrossRef] [Green Version]
- Machlin, L.; McLaughlin, K.A.; Sheridan, M.A. Brain structure mediates the association between socioeconomic status and attention–deficit/hyperactivity disorder. Dev. Sci. 2019, e12844. [Google Scholar] [CrossRef]
- Assari, S.; Caldwell, C.H. Family Income at Birth and Risk of Attention Deficit Hyperactivity Disorder at Age 15: Racial Differences. Children 2019, 6, 10. [Google Scholar] [CrossRef] [Green Version]
- Jablonska, B.; Kosidou, K.; Ponce de Leon, A.; Wettermark, B.; Magnusson, C.; Dal, H.; Dalman, C. Neighborhood Socioeconomic Characteristics and Utilization of ADHD Medication in Schoolchildren: A Population Multilevel Study in Stockholm County. J. Atten. Disord. 2020, 24, 265–276. [Google Scholar] [CrossRef] [PubMed]
- Collins, K.P.; Cleary, S.D. Racial and ethnic disparities in parent–reported diagnosis of ADHD: National Survey of Children’s Health (2003, 2007, and 2011). J. Clin. Psychiatry 2016, 77, 52–59. [Google Scholar] [CrossRef] [Green Version]
- Heshmat, R.; Qorbani, M.; Ghoreshi, B.; Djalalinia, S.; Tabatabaie, O.R.; Safiri, S.; Noroozi, M.; Motlagh, M.E.; Ahadi, Z.; Asayesh, H.; et al. Association of socioeconomic status with psychiatric problems and violent behaviours in a nationally representative sample of Iranian children and adolescents: The CASPIAN–IV study. BMJ Open 2016, 6, e011615. [Google Scholar] [CrossRef] [Green Version]
- Feldstein Ewing, S.W.; Hudson, K.A.; Caouette, J.; Mayer, A.R.; Thayer, R.E.; Ryman, S.G.; Bryan, A.D. Sexual risk–taking and subcortical brain volume in adolescence. Ann. Behav. Med. 2018, 52, 393–405. [Google Scholar] [CrossRef] [PubMed] [Green Version]
- Kaleta, D.; Usidame, B.; Dziankowska–Zaborszczyk, E.; Makowiec–Dabrowska, T. Socioeconomic Disparities in Age of Initiation and Ever Tobacco Smoking: Findings from Romania. Cent. Eur. J. Public Health 2015, 23, 299–305. [Google Scholar] [CrossRef] [PubMed] [Green Version]
- Barreto, S.M.; de Figueiredo, R.C.; Giatti, L. Socioeconomic inequalities in youth smoking in Brazil. BMJ Open 2013, 3, e003538. [Google Scholar] [CrossRef] [Green Version]
- Moore, G.F.; Littlecott, H.J. School– and family–level socioeconomic status and health behaviors: Multilevel analysis of a national survey in wales, United Kingdom. J. Sch. Health 2015, 85, 267–275. [Google Scholar] [CrossRef] [Green Version]
- Silveira, C.M.; Siu, E.R.; Anthony, J.C.; Saito, L.P.; de Andrade, A.G.; Kutschenko, A.; Viana, M.C.; Wang, Y.P.; Martins, S.S.; Andrade, L.H. Drinking patterns and alcohol use disorders in Sao Paulo, Brazil: The role of neighborhood social deprivation and socioeconomic status. PLoS ONE 2014, 9, e108355. [Google Scholar] [CrossRef] [Green Version]
- Gerra, G.; Benedetti, E.; Resce, G.; Potente, R.; Cutilli, A.; Molinaro, S. Socioeconomic Status, Parental Education, School Connectedness and Individual Socio–Cultural Resources in Vulnerability for Drug Use among Students. Int. J. Environ. Res. Public Health 2020, 17, 1306. [Google Scholar] [CrossRef] [Green Version]
- Javanbakht, A.; King, A.P.; Evans, G.W.; Swain, J.E.; Angstadt, M.; Phan, K.L.; Liberzon, I. Childhood Poverty Predicts Adult Amygdala and Frontal Activity and Connectivity in Response to Emotional Faces. Front. Behav. Neurosci. 2015, 9, 154. [Google Scholar] [CrossRef] [PubMed] [Green Version]
- Masten, C.L.; Telzer, E.H.; Eisenberger, N.I. An FMRI investigation of attributing negative social treatment to racial discrimination. J. Cogn. Neurosci. 2011, 23, 1042–1051. [Google Scholar] [CrossRef] [PubMed]
- Wu, X.; Zou, Q.; Hu, J.; Tang, W.; Mao, Y.; Gao, L.; Zhu, J.; Jin, Y.; Wu, X.; Lu, L.; et al. Intrinsic Functional Connectivity Patterns Predict Consciousness Level and Recovery Outcome in Acquired Brain Injury. J. Neurosci. 2015, 35, 12932–12946. [Google Scholar] [CrossRef] [Green Version]
- Noble, K.G.; Houston, S.M.; Brito, N.H.; Bartsch, H.; Kan, E.; Kuperman, J.M.; Akshoomoff, N.; Amaral, D.G.; Bloss, C.S.; Libiger, O. Family income, parental education and brain structure in children and adolescents. Nat. Neurosci. 2015, 18, 773. [Google Scholar] [CrossRef]
- Assari, S.; Boyce, S.; Bazargan, M.; Caldwell, C.H. African Americans’ Diminished Returns of Parental Education on Adolescents’ Depression and Suicide in the Adolescent Brain Cognitive Development (ABCD) Study. Euro. J. Investig. Health Psych. Educ. 2020, 10, 656–668. [Google Scholar]
- Assari, S. Parental Education on Youth Inhibitory Control in the Adolescent Brain Cognitive Development (ABCD) Study: Blacks’ Diminished Returns. Brain Sci. 2020, 10, 312. [Google Scholar] [CrossRef] [PubMed]
- Assari, S.; Boyce, S.; Akhlaghipour, G.; Bazargan, M.; Caldwell, C.H. Reward Responsiveness in the Adolescent Brain Cognitive Development (ABCD) Study: African Americans’ Diminished Returns of Parental Education. Brain Sci. 2020, 10, 391. [Google Scholar] [CrossRef] [PubMed]
- Jenkins, L.M.; Chiang, J.J.; Vause, K.; Hoffer, L.; Alpert, K.; Parrish, T.B.; Wang, L.; Miller, G.E. Subcortical structural variations associated with low socioeconomic status in adolescents. Hum. Brain Mapp. 2020, 41, 162–171. [Google Scholar] [CrossRef] [PubMed] [Green Version]
- Willis, A.W.; Schootman, M.; Kung, N.; Wang, X.Y.; Perlmutter, J.S.; Racette, B.A. Disparities in deep brain stimulation surgery among insured elders with Parkinson disease. Neurology 2014, 82, 163–171. [Google Scholar] [CrossRef] [PubMed] [Green Version]
- Parker, N.; Wong, A.P.; Leonard, G.; Perron, M.; Pike, B.; Richer, L.; Veillette, S.; Pausova, Z.; Paus, T. Income inequality, gene expression, and brain maturation during adolescence. Sci. Rep. 2017, 7, 7397. [Google Scholar] [CrossRef] [PubMed] [Green Version]
- Assari, S. Health Disparities due to Diminished Return among Black Americans: Public Policy Solutions. Soc. Issu. Policy Rev. 2018, 12, 112–145. [Google Scholar] [CrossRef]
- Assari, S. Unequal Gain of Equal Resources across Racial Groups. Int. J. Health Policy Manag. 2018, 7, 1–9. [Google Scholar] [CrossRef] [Green Version]
- Assari, S.; Caldwell, C.H.; Bazargan, M. Association Between Parental Educational Attainment and Youth Outcomes and Role of Race/Ethnicity. JAMA Netw. Open 2019, 2, e1916018. [Google Scholar] [CrossRef] [Green Version]
- Assari, S. Blacks’ Diminished Return of Education Attainment on Subjective Health; Mediating Effect of Income. Brain Sci. 2018, 8, 176. [Google Scholar] [CrossRef] [Green Version]
- Assari, S. Understanding America: Unequal Economic Returns of Years of Schooling in Whites and Blacks. World J. Edu. Res. 2020, 7, 78–92. [Google Scholar] [CrossRef] [PubMed]
- Assari, S.; Preiser, B.; Kelly, M. Education and Income Predict Future Emotional Well-Being of Whites but Not Blacks: A Ten-Year Cohort. Brain Sci. 2018, 8, 122. [Google Scholar] [CrossRef] [PubMed] [Green Version]
- Assari, S. College Graduation and Wealth Accumulation: Blacks’ Diminished Returns. World J. Edu. Res. 2020, 7, 1–18. [Google Scholar] [CrossRef]
- Kim, D.J.; Davis, E.P.; Sandman, C.A.; Glynn, L.; Sporns, O.; O’Donnell, B.F.; Hetrick, W.P. Childhood poverty and the organization of structural brain connectome. Neuroimage 2019, 184, 409–416. [Google Scholar] [CrossRef] [Green Version]
- Staff, R.T.; Murray, A.D.; Ahearn, T.S.; Mustafa, N.; Fox, H.C.; Whalley, L.J. Childhood socioeconomic status and adult brain size: Childhood socioeconomic status influences adult hippocampal size. Ann. Neurol. 2012, 71, 653–660. [Google Scholar] [CrossRef] [PubMed]
- Lawson, G.M.; Camins, J.S.; Wisse, L.; Wu, J.; Duda, J.T.; Cook, P.A.; Gee, J.C.; Farah, M.J. Childhood socioeconomic status and childhood maltreatment: Distinct associations with brain structure. PLoS ONE 2017, 12, e0175690. [Google Scholar] [CrossRef] [Green Version]
- Noble, K.G.; Houston, S.M.; Kan, E.; Sowell, E.R. Neural correlates of socioeconomic status in the developing human brain. Dev. Sci. 2012, 15, 516–527. [Google Scholar] [CrossRef]
- Baxendale, S.; Heaney, D. Socioeconomic status, cognition, and hippocampal sclerosis. Epilepsy Behav. 2011, 20, 64–67. [Google Scholar] [CrossRef]
- McDermott, C.L.; Seidlitz, J.; Nadig, A.; Liu, S.; Clasen, L.S.; Blumenthal, J.D.; Reardon, P.K.; Lalonde, F.; Greenstein, D.; Patel, R.; et al. Longitudinally mapping childhood socioeconomic status associations with cortical and subcortical morphology. J. Neurosci. 2019, 39, 1365–1373. [Google Scholar] [CrossRef] [PubMed] [Green Version]
- Mills, K.L.; Bathula, D.; Costa Dias, T.G.; Iyer, S.P.; Fenesy, M.C.; Musser, E.D.; Stevens, C.A.; Thurlow, B.L.; Carpenter, S.D.; Nagel, B.J. Altered cortico–striatal–thalamic connectivity in relation to spatial working memory capacity in children with ADHD. Front. Psychiatry 2012, 3, 2. [Google Scholar] [CrossRef] [PubMed] [Green Version]
- Rosch, K.S.; Crocetti, D.; Hirabayashi, K.; Denckla, M.B.; Mostofsky, S.H.; Mahone, E.M. Reduced subcortical volumes among preschool–age girls and boys with ADHD. Psychiatry Res. Neuroimag. 2018, 271, 67–74. [Google Scholar] [CrossRef] [Green Version]
- Tsatsanis, K.D.; Rourke, B.P.; Klin, A.; Volkmar, F.R.; Cicchetti, D.; Schultz, R.T. Reduced thalamic volume in high–functioning individuals with autism. Biolog. Psychiatry 2003, 53, 121–129. [Google Scholar] [CrossRef]
- Huang, X.; Pu, W.; Li, X.; Greenshaw, A.J.; Dursun, S.M.; Xue, Z.; Liu, H.; Liu, Z. Decreased left putamen and thalamus volume correlates with delusions in first–episode schizophrenia patients. Front. Psychiatry 2017, 8, 245. [Google Scholar] [CrossRef] [PubMed] [Green Version]
- Young, K.A.; Holcomb, L.A.; Yazdani, U.; Hicks, P.B.; German, D.C. Elevated neuron number in the limbic thalamus in major depression. Amer. J. Psychiatry 2004, 161, 1270–1277. [Google Scholar] [CrossRef] [PubMed]
- Nugent, A.C.; Davis, R.M.; Zarate, C.A., Jr.; Drevets, W.C. Reduced thalamic volumes in major depressive disorder. Psychiatry Res. Neuroimag. 2013, 213, 179–185. [Google Scholar] [CrossRef] [Green Version]
- Young, K.A.; Bonkale, W.L.; Holcomb, L.A.; Hicks, P.B.; German, D.C. Major depression, 5HTTLPR genotype, suicide and antidepressant influences on thalamic volume. Brit. J. Psychiatry 2008, 192, 285–289. [Google Scholar] [CrossRef] [Green Version]
- Adriano, F.; Spoletini, I.; Caltagirone, C.; Spalletta, G. Updated meta–analyses reveal thalamus volume reduction in patients with first–episode and chronic schizophrenia. Schizophrenia Res. 2010, 123, 1–14. [Google Scholar] [CrossRef]
- Hair, N.L.; Hanson, J.L.; Wolfe, B.L.; Pollak, S.D. Association of Child Poverty, Brain Development, and Academic Achievement. JAMA Pediatr. 2015, 169, 822–829. [Google Scholar] [CrossRef]
- Hanson, J.L.; Nacewicz, B.M.; Sutterer, M.J.; Cayo, A.A.; Schaefer, S.M.; Rudolph, K.D.; Shirtcliff, E.A.; Pollak, S.D.; Davidson, R.J. Behavioral problems after early life stress: Contributions of the hippocampus and amygdala. Biol. Psychiatry 2015, 77, 314–323. [Google Scholar] [CrossRef] [Green Version]
- McEwen, B.S.; Gianaros, P.J. Central role of the brain in stress and adaptation: Links to socioeconomic status, health, and disease. Ann. N. Y. Acad. Sci. 2010, 1186, 190–222. [Google Scholar] [CrossRef] [Green Version]
- Suchy–Dicey, A.; Shibata, D.; Cholerton, B.; Nelson, L.; Calhoun, D.; Ali, T.; Montine, T.J.; Longstreth, W.T.; Buchwald, D.; Verney, S.P. Cognitive Correlates of MRI–defined Cerebral Vascular Injury and Atrophy in Elderly American Indians: The Strong Heart Study. J. Int. Neuropsychol. Soc. 2019, 1–13. [Google Scholar] [CrossRef] [PubMed]
- McLean, J.; Krishnadas, R.; Batty, G.D.; Burns, H.; Deans, K.A.; Ford, I.; McConnachie, A.; McGinty, A.; McLean, J.S.; Millar, K.; et al. Early life socioeconomic status, chronic physiological stress and hippocampal N–acetyl aspartate concentrations. Behav. Brain Res. 2012, 235, 225–230. [Google Scholar] [CrossRef]
- Brito, N.; Noble, K.G. Socioeconomic status and structural brain development. Front. Neurosci. 2014, 8. [Google Scholar] [CrossRef] [Green Version]
- Johnson, S.B.; Riis, J.L.; Noble, K.G. State of the Art Review: Poverty and the Developing Brain. Pediatrics 2016, 137. [Google Scholar] [CrossRef] [PubMed] [Green Version]
- Hanson, J.L.; Chandra, A.; Wolfe, B.L.; Pollak, S.D. Association between income and the hippocampus. PLoS ONE 2011, 6, e18712. [Google Scholar] [CrossRef] [PubMed] [Green Version]
- Wang, Y.; Zhang, L.; Kong, X.; Hong, Y.; Cheon, B.; Liu, J. Pathway to neural resilience: Self–esteem buffers against deleterious effects of poverty on the hippocampus. Hum. Brain Mapp. 2016, 37, 3757–3766. [Google Scholar] [CrossRef]
- Howell, B.R.; Godfrey, J.; Gutman, D.A.; Michopoulos, V.; Zhang, X.; Nair, G.; Hu, X.; Wilson, M.E.; Sanchez, M.M. Social subordination stress and serotonin transporter polymorphisms: Associations with brain white matter tract integrity and behavior in juvenile female macaques. Cereb. Cortex 2014, 24, 3334–3349. [Google Scholar] [CrossRef] [Green Version]
- Cassiers, L.L.M.; Sabbe, B.G.C.; Schmaal, L.; Veltman, D.J.; Penninx, B.; Van Den Eede, F. Structural and Functional Brain Abnormalities Associated With Exposure to Different Childhood Trauma Subtypes: A Systematic Review of Neuroimaging Findings. Front. Psychiatry 2018, 9, 329. [Google Scholar] [CrossRef] [PubMed] [Green Version]
- Evans, G.W.; Swain, J.E.; King, A.P.; Wang, X.; Javanbakht, A.; Ho, S.S.; Angstadt, M.; Phan, K.L.; Xie, H.; Liberzon, I. Childhood Cumulative Risk Exposure and Adult Amygdala Volume and Function. J. Neurosci. Res. 2016, 94, 535–543. [Google Scholar] [CrossRef] [PubMed] [Green Version]
- Javanbakht, A.; Kim, P.; Swain, J.E.; Evans, G.W.; Phan, K.L.; Liberzon, I. Sex–Specific Effects of Childhood Poverty on Neurocircuitry of Processing of Emotional Cues: A Neuroimaging Study. Behav. Sci. 2016, 6, 28. [Google Scholar] [CrossRef] [Green Version]
- Assari, S.; Boyce, S.; Bazargan, M. Subjective Socioeconomic Status and Children’s Amygdala Volume: Minorities’ Diminish Returns. NeuroSci 2020, 1, 59–74. [Google Scholar] [CrossRef]
- Dotson, V.M.; Kitner–Triolo, M.H.; Evans, M.K.; Zonderman, A.B. Effects of race and socioeconomic status on the relative influence of education and literacy on cognitive functioning. J. Int. Neuropsychol. Soc. 2009, 15, 580. [Google Scholar] [CrossRef] [Green Version]
- Assari, S. Parental education and spanking of American children: Blacks’ diminished returns. World J. Edu. Res. 2020, 7, 19–44. [Google Scholar] [CrossRef] [PubMed]
- Assari, S.; Boyce, S.; Bazargan, M. Subjective Family Socioeconomic Status and Adolescents’ Attention: Blacks’ Diminished Returns. Children 2020, 7, 80. [Google Scholar] [CrossRef]
- Assari, S.; Caldwell, C.H.; Mincy, R. Family Socioeconomic Status at Birth and Youth Impulsivity at Age 15; Blacks’ Diminished Return. Children 2018, 5, 58. [Google Scholar] [CrossRef] [PubMed] [Green Version]
- Assari, S.; Islam, S. Diminished Protective Effects of Household Income on Internalizing Symptoms among African American than European American Pre-Adolescents. J. Economy. Trade Mark. Manag. 2020, 2. [Google Scholar] [CrossRef]
- Assari, S.; Caldwell, C.H. High Risk of Depression in High–Income African American Boys. J. Racial Ethn. Health Disparities 2018, 5, 808–819. [Google Scholar] [CrossRef] [PubMed]
- Assari, S.; Caldwell, C.H.; Zimmerman, M.A. Family Structure and Subsequent Anxiety Symptoms; Minorities’ Diminished Return. Brain Sci. 2018, 8, 97. [Google Scholar] [CrossRef] [PubMed] [Green Version]
- Assari, S.; Boyce, S.; Caldwell, C.H.; Bazargan, M. Minorities’ Diminished Returns of Parental Educational Attainment on Adolescents’ Social, Emotional, and Behavioral Problems. Children 2020, 7, 49. [Google Scholar] [CrossRef] [PubMed]
- Boyce, S.; Bazargan, M.; Caldwell, C.H.; Zimmerman, M.A.; Assari, S. Parental Educational Attainment and Social Environmental of Urban Public Schools in the U.S.: Blacks’ Diminished Returns. Children 2020, 7, 44. [Google Scholar] [CrossRef]
- Alcohol Research: Current Reviews Editorial Staff. NIH’s Adolescent Brain Cognitive Development (ABCD) Study. Alcohol Res. 2018, 39, 97. [Google Scholar]
- Volkow, N.D.; Koob, G.F.; Croyle, R.T.; Bianchi, D.W.; Gordon, J.A.; Koroshetz, W.J.; Perez-Stable, E.J.; Riley, W.T.; Bloch, M.H.; Conway, K.; et al. The conception of the ABCD study: From substance use to a broad NIH collaboration. Dev. Cogn. Neurosci. 2018, 32, 4–7. [Google Scholar] [CrossRef]
- Karcher, N.R.; O’Brien, K.J.; Kandala, S.; Barch, D.M. Resting–State Functional Connectivity and Psychotic–like Experiences in Childhood: Results From the Adolescent Brain Cognitive Development Study. Biol. Psychiatry 2019, 86, 7–15. [Google Scholar] [CrossRef]
- Lisdahl, K.M.; Sher, K.J.; Conway, K.P.; Gonzalez, R.; Feldstein Ewing, S.W.; Nixon, S.J.; Tapert, S.; Bartsch, H.; Goldstein, R.Z.; Heitzeg, M. Adolescent brain cognitive development (ABCD) study: Overview of substance use assessment methods. Dev. Cogn. Neurosci. 2018, 32, 80–96. [Google Scholar] [CrossRef]
- Luciana, M.; Bjork, J.M.; Nagel, B.J.; Barch, D.M.; Gonzalez, R.; Nixon, S.J.; Banich, M.T. Adolescent neurocognitive development and impacts of substance use: Overview of the adolescent brain cognitive development (ABCD) baseline neurocognition battery. Dev. Cogn. Neurosci. 2018, 32, 67–79. [Google Scholar] [CrossRef]
- Auchter, A.M.; Hernandez Mejia, M.; Heyser, C.J.; Shilling, P.D.; Jernigan, T.L.; Brown, S.A.; Tapert, S.F.; Dowling, G.J. A description of the ABCD organizational structure and communication framework. Dev. Cogn. Neurosci. 2018, 32, 8–15. [Google Scholar] [CrossRef]
- Garavan, H.; Bartsch, H.; Conway, K.; Decastro, A.; Goldstein, R.Z.; Heeringa, S.; Jernigan, T.; Potter, A.; Thompson, W.; Zahs, D. Recruiting the ABCD sample: Design considerations and procedures. Dev. Cogn. Neurosci. 2018, 32, 16–22. [Google Scholar] [CrossRef] [PubMed]
- Casey, B.; Cannonier, T.; Conley, M.I.; Cohen, A.O.; Barch, D.M.; Heitzeg, M.M.; Soules, M.E.; Teslovich, T.; Dellarco, D.V.; Garavan, H. The adolescent brain cognitive development (ABCD) study: Imaging acquisition across 21 sites. Dev. Cognit. Neurosci. 2018, 32, 43–54. [Google Scholar] [CrossRef]
- Dosenbach, N.U.; Koller, J.M.; Earl, E.A.; Miranda–Dominguez, O.; Klein, R.L.; Van, A.N.; Snyder, A.Z.; Nagel, B.J.; Nigg, J.T.; Nguyen, A.L. Real–time motion analytics during brain MRI improve data quality and reduce costs. Neuroimage 2017, 161, 80–93. [Google Scholar] [CrossRef]
- Epstein, J.N.; Casey, B.; Tonev, S.T.; Davidson, M.; Reiss, A.L.; Garrett, A.; Hinshaw, S.P.; Greenhill, L.L.; Vitolo, A.; Kotler, L.A. Assessment and prevention of head motion during imaging of patients with attention deficit hyperactivity disorder. Psychiatry Res. Neuroimag. 2007, 155, 75–82. [Google Scholar] [CrossRef] [Green Version]
- Holland, D.; Kuperman, J.M.; Dale, A.M. Efficient correction of inhomogeneous static magnetic field–induced distortion in Echo Planar Imaging. Neuroimage 2010, 50, 175–183. [Google Scholar] [CrossRef] [PubMed] [Green Version]
- Treiber, J.M.; White, N.S.; Steed, T.C.; Bartsch, H.; Holland, D.; Farid, N.; McDonald, C.R.; Carter, B.S.; Dale, A.M.; Chen, C.C. Characterization and correction of geometric distortions in 814 diffusion weighted images. PLoS ONE 2016, 11, e0152472. [Google Scholar] [CrossRef] [PubMed]
- Hagler, D.J., Jr.; Hatton, S.; Cornejo, M.D.; Makowski, C.; Fair, D.A.; Dick, A.S.; Sutherland, M.T.; Casey, B.; Barch, D.M.; Harms, M.P. Image processing and analysis methods for the Adolescent Brain Cognitive Development Study. Neuroimage 2019, 202, 116091. [Google Scholar] [CrossRef] [PubMed]
- Tisdall, M.D.; Hess, A.T.; Reuter, M.; Meintjes, E.M.; Fischl, B.; van der Kouwe, A.J. Volumetric navigators for prospective motion correction and selective reacquisition in neuroanatomical MRI. Magn. Reson. Med. 2012, 68, 389–399. [Google Scholar] [CrossRef] [Green Version]
- White, N.; Roddey, C.; Shankaranarayanan, A.; Han, E.; Rettmann, D.; Santos, J.; Kuperman, J.; Dale, A. PROMO: Real-time prospective motion correction in MRI using image-based tracking. Magn. Magn. Reson. Med. 2010, 63, 91–105. [Google Scholar] [CrossRef] [Green Version]
- Moeller, S.; Yacoub, E.; Olman, C.A.; Auerbach, E.; Strupp, J.; Harel, N.; Uğurbil, K. Multiband multislice GE-EPI at 7 tesla, with 16-fold acceleration using partial parallel imaging with application to high spatial and temporal whole-brain fMRI. Magn. Reson. Med. 2010, 63, 1144–1153. [Google Scholar] [CrossRef] [Green Version]
- Setsompop, K.; Gagoski, B.A.; Polimeni, J.R.; Witzel, T.; Wedeen, V.J.; Wald, L.L. Blipped-controlled aliasing in parallel imaging for simultaneous multislice echo planar imaging with reduced g-factor penalty. Magn. Reson. Med. 2012, 67, 1210–1224. [Google Scholar] [CrossRef] [Green Version]
- Alexander, A.L.; Lee, J.E.; Lazar, M.; Field, A.S. Diffusion tensor imaging of the brain. Neurotherapeutics 2007, 4, 316–329. [Google Scholar] [CrossRef] [Green Version]
- Hagler Jr, D.J.; Ahmadi, M.E.; Kuperman, J.; Holland, D.; McDonald, C.R.; Halgren, E.; Dale, A.M. Automated white-matter tractography using a probabilistic diffusion tensor atlas: Application to temporal lobe epilepsy. Hum. Brain Mapp. 2009, 30, 1535–1547. [Google Scholar] [CrossRef] [PubMed] [Green Version]
- Barch, D.; Pagliaccio, D.; Belden, A.; Harms, M.P.; Gaffrey, M.; Sylvester, C.M.; Tillman, R.; Luby, J. Effect of Hippocampal and Amygdala Connectivity on the Relationship Between Preschool Poverty and School–Age Depression. Am. J. Psychiatry 2016, 173, 625–634. [Google Scholar] [CrossRef]
- Santelli, J.S.; Lowry, R.; Brener, N.D.; Robin, L. The association of sexual behaviors with socioeconomic status, family structure, and race/ethnicity among US adolescents. Am. J. Public Health 2000, 90, 1582–1588. [Google Scholar] [CrossRef] [Green Version]
- Cohen, S.; Schwartz, J.E.; Epel, E.; Kirschbaum, C.; Sidney, S.; Seeman, T. Socioeconomic status, race, and diurnal cortisol decline in the Coronary Artery Risk Development in Young Adults (CARDIA) Study. Psychosom. Med. 2006, 68, 41–50. [Google Scholar] [CrossRef] [PubMed] [Green Version]
- Hagger–Johnson, G.E.; Shickle, D.A.; Deary, I.J.; Roberts, B.A. Direct and indirect pathways connecting cognitive ability with cardiovascular disease risk: Socioeconomic status and multiple health behaviors. Psychosom. Med. 2010, 72, 777–785. [Google Scholar] [CrossRef]
- Schulz, A.J.; Mentz, G.; Lachance, L.; Johnson, J.; Gaines, C.; Israel, B.A. Associations between socioeconomic status and allostatic load: Effects of neighborhood poverty and tests of mediating pathways. Am. J. Public Health 2012, 102, 1706–1714. [Google Scholar] [CrossRef]
- Perkins, S.C.; Finegood, E.D.; Swain, J.E. Poverty and language development: Roles of parenting and stress. Innov. Clin. Neurosci 2013, 10, 10–19. [Google Scholar] [PubMed]
- Woods–Jaeger, B.A.; Cho, B.; Sexton, C.C.; Slagel, L.; Goggin, K. Promoting Resilience: Breaking the Intergenerational Cycle of Adverse Childhood Experiences. Health Edu. Behav. 2018, 45, 772–780. [Google Scholar] [CrossRef]
- Emmen, R.A.; Malda, M.; Mesman, J.; van Ijzendoorn, M.H.; Prevoo, M.J.; Yeniad, N. Socioeconomic status and parenting in ethnic minority families: Testing a minority family stress model. J. Fam. Psychol. 2013, 27, 896–904. [Google Scholar] [CrossRef] [Green Version]
- Anton, M.T.; Jones, D.J.; Youngstrom, E.A. Socioeconomic status, parenting, and externalizing problems in African American single–mother homes: A person–oriented approach. J. Fam. Psychol. 2015, 29, 405–415. [Google Scholar] [CrossRef]
- Kiang, L.; Andrews, K.; Stein, G.L.; Supple, A.J.; Gonzalez, L.M. Socioeconomic stress and academic adjustment among Asian American adolescents: The protective role of family obligation. J. Youth Adolesc. 2013, 42, 837–847. [Google Scholar] [CrossRef] [Green Version]
- Danese, A.; Moffitt, T.E.; Harrington, H.; Milne, B.J.; Polanczyk, G.; Pariante, C.M.; Poulton, R.; Caspi, A. Adverse childhood experiences and adult risk factors for age–related disease: Depression, inflammation, and clustering of metabolic risk markers. Arch. Pediatr. Adolesc. Med. 2009, 163, 1135–1143. [Google Scholar] [CrossRef] [Green Version]
- Spann, S.J.; Gillespie, C.F.; Davis, J.S.; Brown, A.; Schwartz, A.; Wingo, A.; Habib, L.; Ressler, K.J. The association between childhood trauma and lipid levels in an adult low–income, minority population. Gen. Hosp. Psychiatry 2014, 36, 150–155. [Google Scholar] [CrossRef] [Green Version]
- Subic–Wrana, C.; Tschan, R.; Michal, M.; Zwerenz, R.; Beutel, M.; Wiltink, J. Childhood trauma and its relation to diagnoses and psychic complaints in patients of an psychosomatic university ambulance. Psychother Psychosom. Med. Psychol. 2011, 61, 54–61. [Google Scholar] [CrossRef]
- Ladebauche, P. Childhood trauma—When to suspect abuse. RN 1997, 60, 38–42, quiz 43. [Google Scholar]
- Parkes, A.; Sweeting, H.; Wight, D. Parenting stress and parent support among mothers with high and low education. J. Fam. Psychol. 2015, 29, 907. [Google Scholar] [CrossRef] [PubMed]
- Assari, S.; Bazargan, M. Unequal Associations between Educational Attainment and Occupational Stress across Racial and Ethnic Groups. Int. J. Envir. Res. Public Health 2019, 16, 3539. [Google Scholar] [CrossRef] [Green Version]
- Chassin, L.; Presson, C.C.; Sherman, S.J.; Edwards, D.A. Parent educational attainment and adolescent cigarette smoking. J. Subst. Abuse 1992, 4, 219–234. [Google Scholar] [CrossRef]
- Kocaoglu, B.; Moschonis, G.; Dimitriou, M.; Kolotourou, M.; Keskin, Y.; Sur, H.; Hayran, O.; Manios, Y. Parental educational level and cardiovascular disease risk factors in schoolchildren in large urban areas of Turkey: Directions for public health policy. BMC Public Health 2005, 5, 13. [Google Scholar] [CrossRef] [PubMed] [Green Version]
- Padilla–Moledo, C.; Ruiz, J.R.; Castro-Pinero, J. Parental educational level and psychological positive health and health complaints in Spanish children and adolescents. Child. Care Health Dev. 2016, 42, 534–543. [Google Scholar] [CrossRef] [PubMed]
- Choi, J.K.; Wang, D.; Jackson, A.P. Adverse experiences in early childhood and their longitudinal impact on later behavioral problems of children living in poverty. Child. Abuse Negl. 2019, 98, 104181. [Google Scholar] [CrossRef]
- Barbarin, O.; Bryant, D.; McCandies, T.; Burchinal, M.; Early, D.; Clifford, R.; Pianta, R.; Howes, C. Children enrolled in public pre–K: The relation of family life, neighborhood quality, and socioeconomic resources to early competence. Am. J. Orthopsychiatry 2006, 76, 265–276. [Google Scholar] [CrossRef] [PubMed]
- Assari, S.B.S.; Bazargan, M.; Caldwell, C.H. Diminished Returns of Parental Education in Terms of Youth School Performance: Ruling Out Regression Toward the Mean. Children 2020, 7, 74. [Google Scholar] [CrossRef] [PubMed]
- Darvishi, E.; Assari, M.J.; Farhadian, M.; Chavoshi, E.; Ehsani, H.R. Occupational exposure to mercury vapor in a compact fluorescent lamp factory: Evaluation of personal, ambient air, and biological monitoring. Toxicol. Ind. Health 2019, 35, 304–313. [Google Scholar] [CrossRef]
- Assari, S.; Caldwell, C.H. Parental Educational Attainment Differentially Boosts School Performance of American Adolescents: Minorities’ Diminished Returns. J. Fam. Reprod. Health 2019, 13, 7–13. [Google Scholar] [CrossRef]
- Assari, S.; Boyce, S. Family’s Subjective Economic Status and Children’s Matrix Reasoning: Blacks’ Diminished Returns. Res. Health Sci. 2020, 6, 1–23. [Google Scholar] [CrossRef]
- Assari, S. Social Determinants of Depression: The Intersections of Race, Gender, and Socioeconomic Status. Brain Sci. 2017, 7, 156. [Google Scholar] [CrossRef] [Green Version]
- Assari, S.; Gibbons, F.X.; Simons, R. Depression among Black Youth; Interaction of Class and Place. Brain Sci. 2018, 8, 108. [Google Scholar] [CrossRef] [PubMed] [Green Version]
- Assari, S.; Gibbons, F.X.; Simons, R.L. Perceived Discrimination among Black Youth: An 18–Year Longitudinal Study. Behav. Sci. 2018, 8, 44. [Google Scholar] [CrossRef] [PubMed] [Green Version]
- Assari, S. Youth Social, Emotional, and Behavioral Problems in the ABCD Study: Minorities’ Diminished Returns of Family Income. J. Econ. Public Financ. 2020, 6, 1–19. [Google Scholar] [CrossRef]
- Moadab, G.; Bliss–Moreau, E.; Bauman, M.D.; Amaral, D.G. Early amygdala or hippocampus damage influences adolescent female social behavior during group formation. Behav. Neurosci. 2017, 131, 68–82. [Google Scholar] [CrossRef] [PubMed]
- Thames, A.D.; Kuhn, T.P.; Mahmood, Z.; Bilder, R.M.; Williamson, T.J.; Singer, E.J.; Arentoft, A. Effects of social adversity and HIV on subcortical shape and neurocognitive function. Brain Imag. Behav. 2018, 12, 96–108. [Google Scholar] [CrossRef]
- Tottenham, N.; Sheridan, M.A. A review of adversity, the amygdala and the hippocampus: A consideration of developmental timing. Front. Hum. Neurosci. 2009, 3, 68. [Google Scholar] [CrossRef]
- Clark, U.S.; Miller, E.R.; Hegde, R.R. Experiences of Discrimination Are Associated With Greater Resting Amygdala Activity and Functional Connectivity. Biol. Psychiatry Cogn. Neurosci. Neuroimag. 2018, 3, 367–378. [Google Scholar] [CrossRef] [PubMed]
- Gershoff, E.T.; Ansari, A.; Purtell, K.M.; Sexton, H.R. Changes in parents’ spanking and reading as mechanisms for Head Start impacts on children. J. Fam. Psychol. 2016, 30, 480. [Google Scholar] [CrossRef] [PubMed]
- Neville, H.J.; Stevens, C.; Pakulak, E.; Bell, T.A.; Fanning, J.; Klein, S.; Isbell, E. Family–based training program improves brain function, cognition, and behavior in lower socioeconomic status preschoolers. Proc. Natl. Acad. Sci. USA 2013, 110, 12138–12143. [Google Scholar] [CrossRef] [PubMed] [Green Version]
- Garces, E.; Thomas, D.; Currie, J. Longer–term effects of Head Start. Amer. Econo. Rev. 2002, 92, 999–1012. [Google Scholar] [CrossRef] [Green Version]
- Zigler, E.; Valentine, J. Project Head Start: A Legacy of the War on Poverty. Available online: https://eric.ed.gov/?id=ED183266 (accessed on 22 December 2020).
- Herrnstein, R.J.; Murray, C. The Bell Curve: Intelligence and Class Structure in American Life; Simon and Schuster: New York, NY, USA, 2010. [Google Scholar]
Figure 1.
Association between parental education and right cerebellum cortex fractional anisotropy overall and by race.
Figure 1.
Association between parental education and right cerebellum cortex fractional anisotropy overall and by race.

Figure 2.
Association between parental education and left cerebellum cortex fractional anisotropy overall and by race.
Figure 2.
Association between parental education and left cerebellum cortex fractional anisotropy overall and by race.

Figure 3.
Association between household income and right cerebellum cortex fractional anisotropy overall and by race.
Figure 3.
Association between household income and right cerebellum cortex fractional anisotropy overall and by race.


Figure 4.
Association between household income and left cerebellum cortex fractional anisotropy overall and by race.
Figure 4.
Association between household income and left cerebellum cortex fractional anisotropy overall and by race.


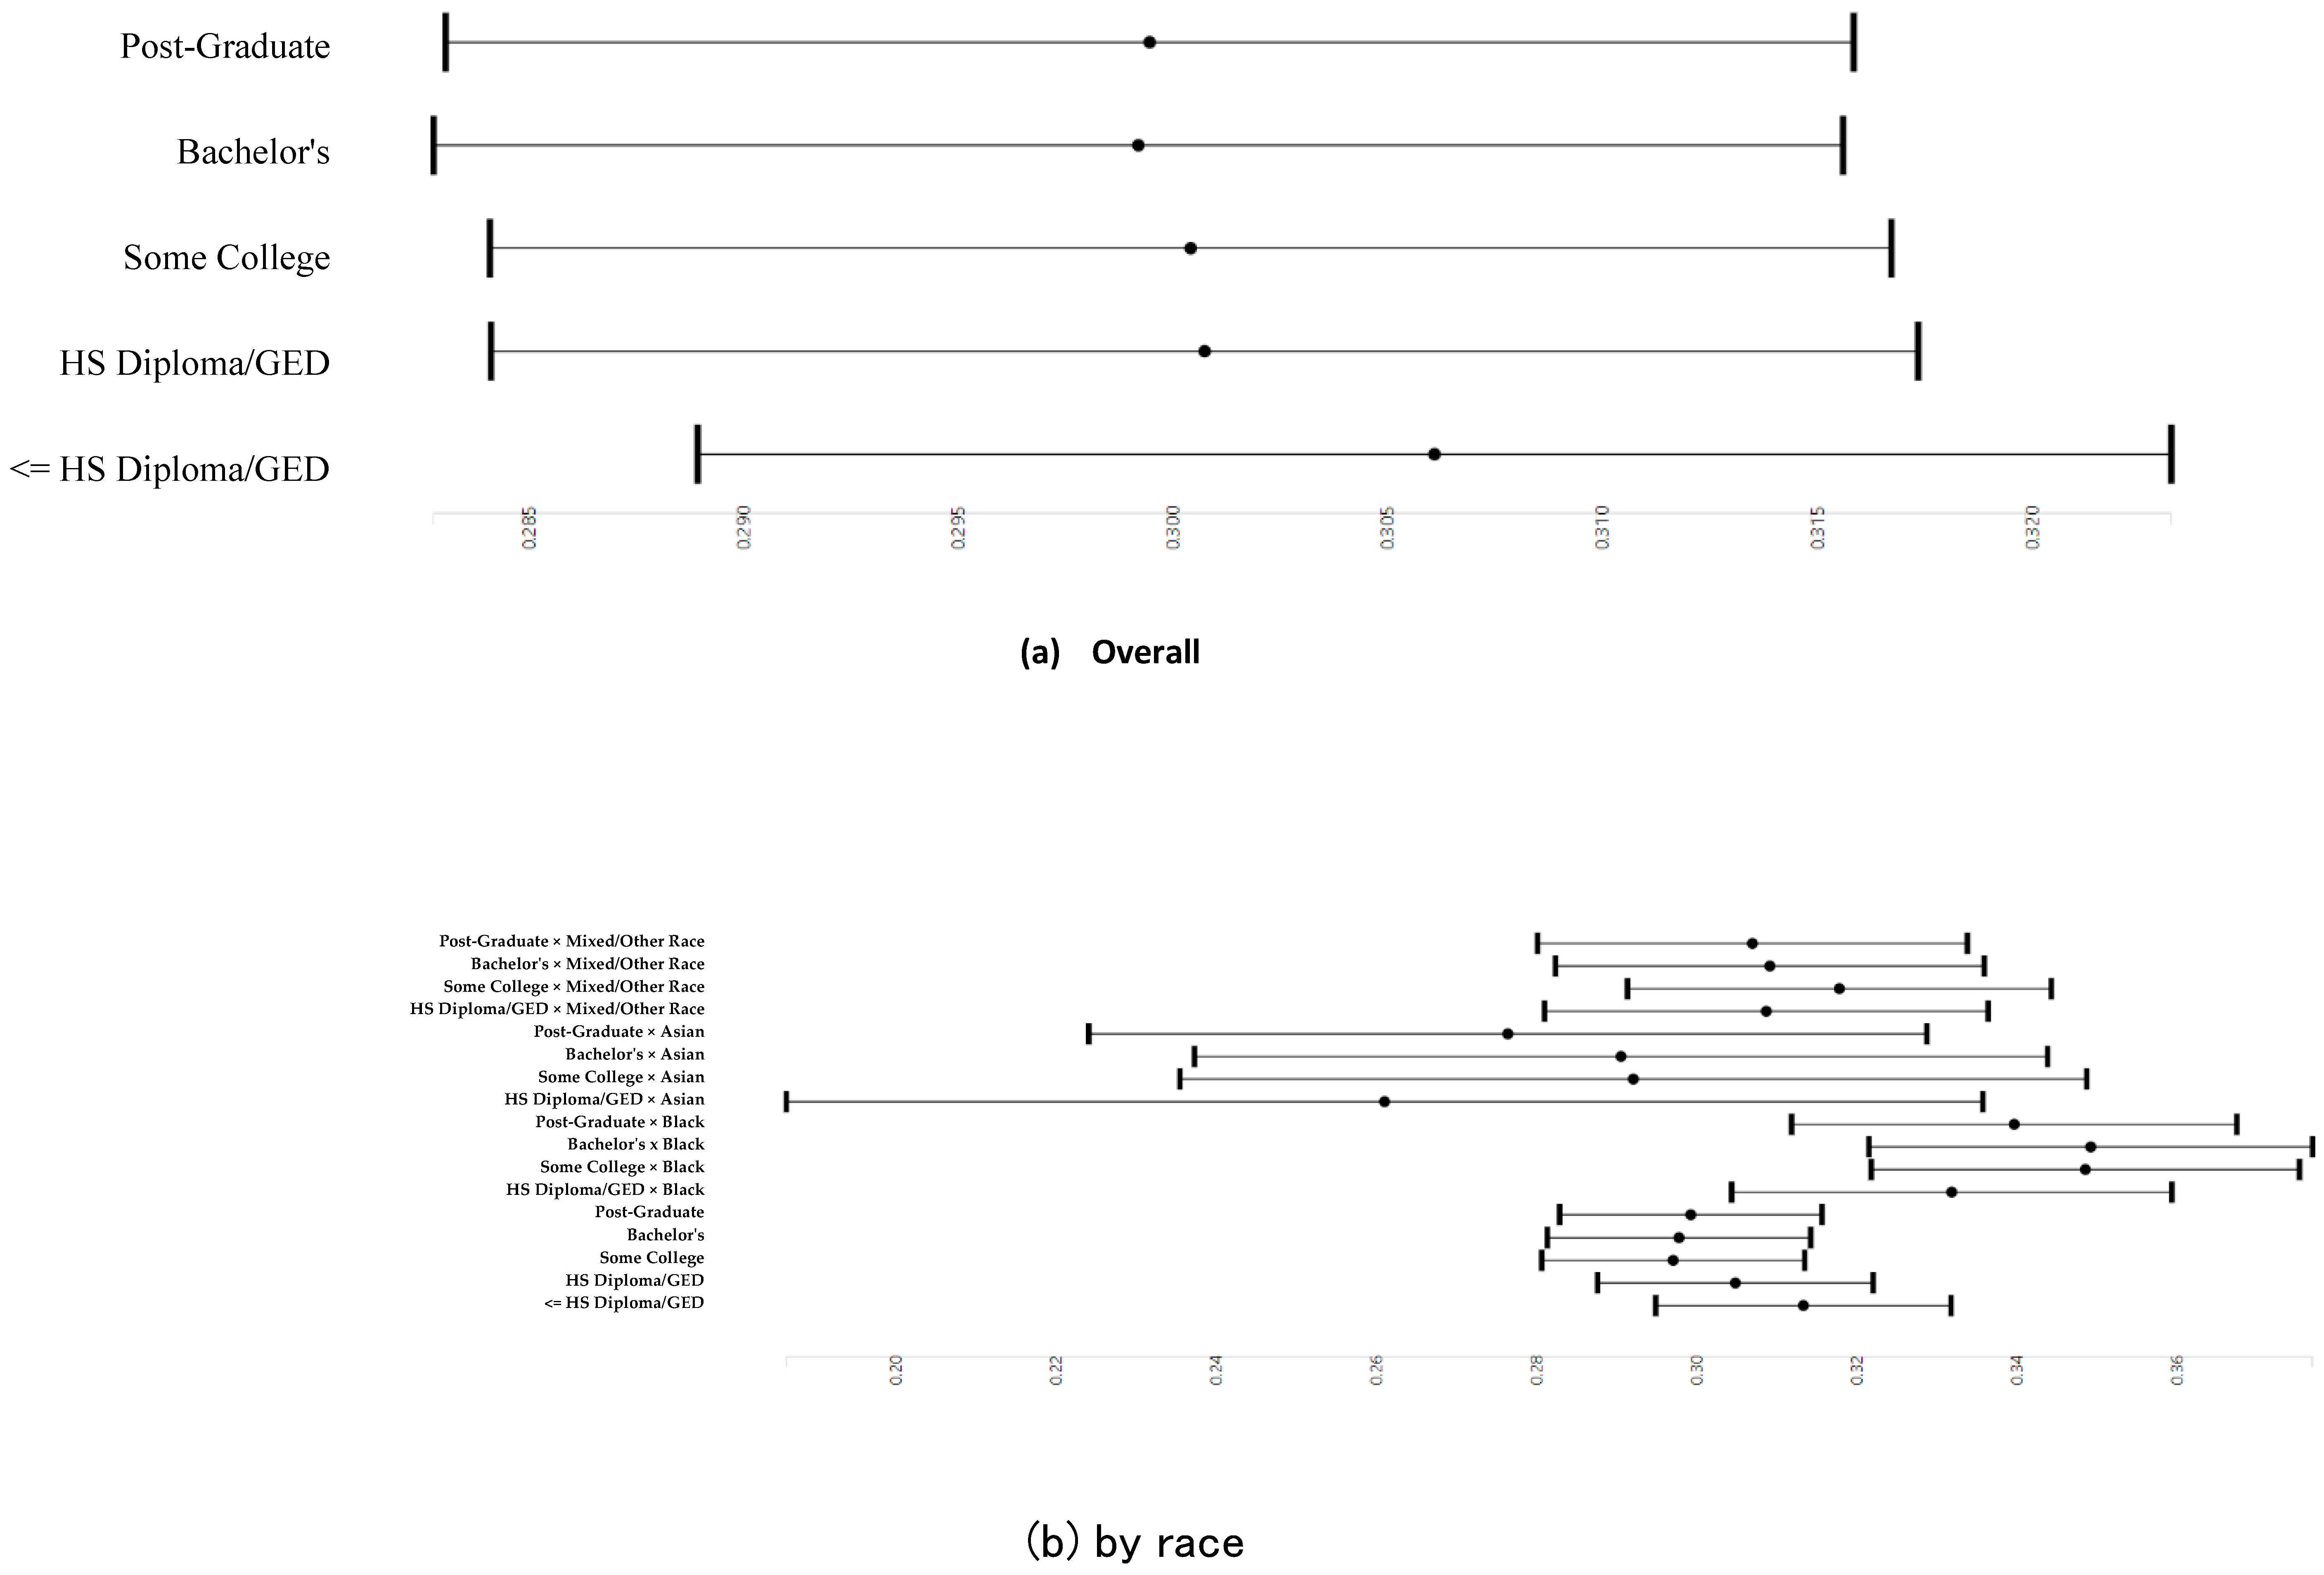
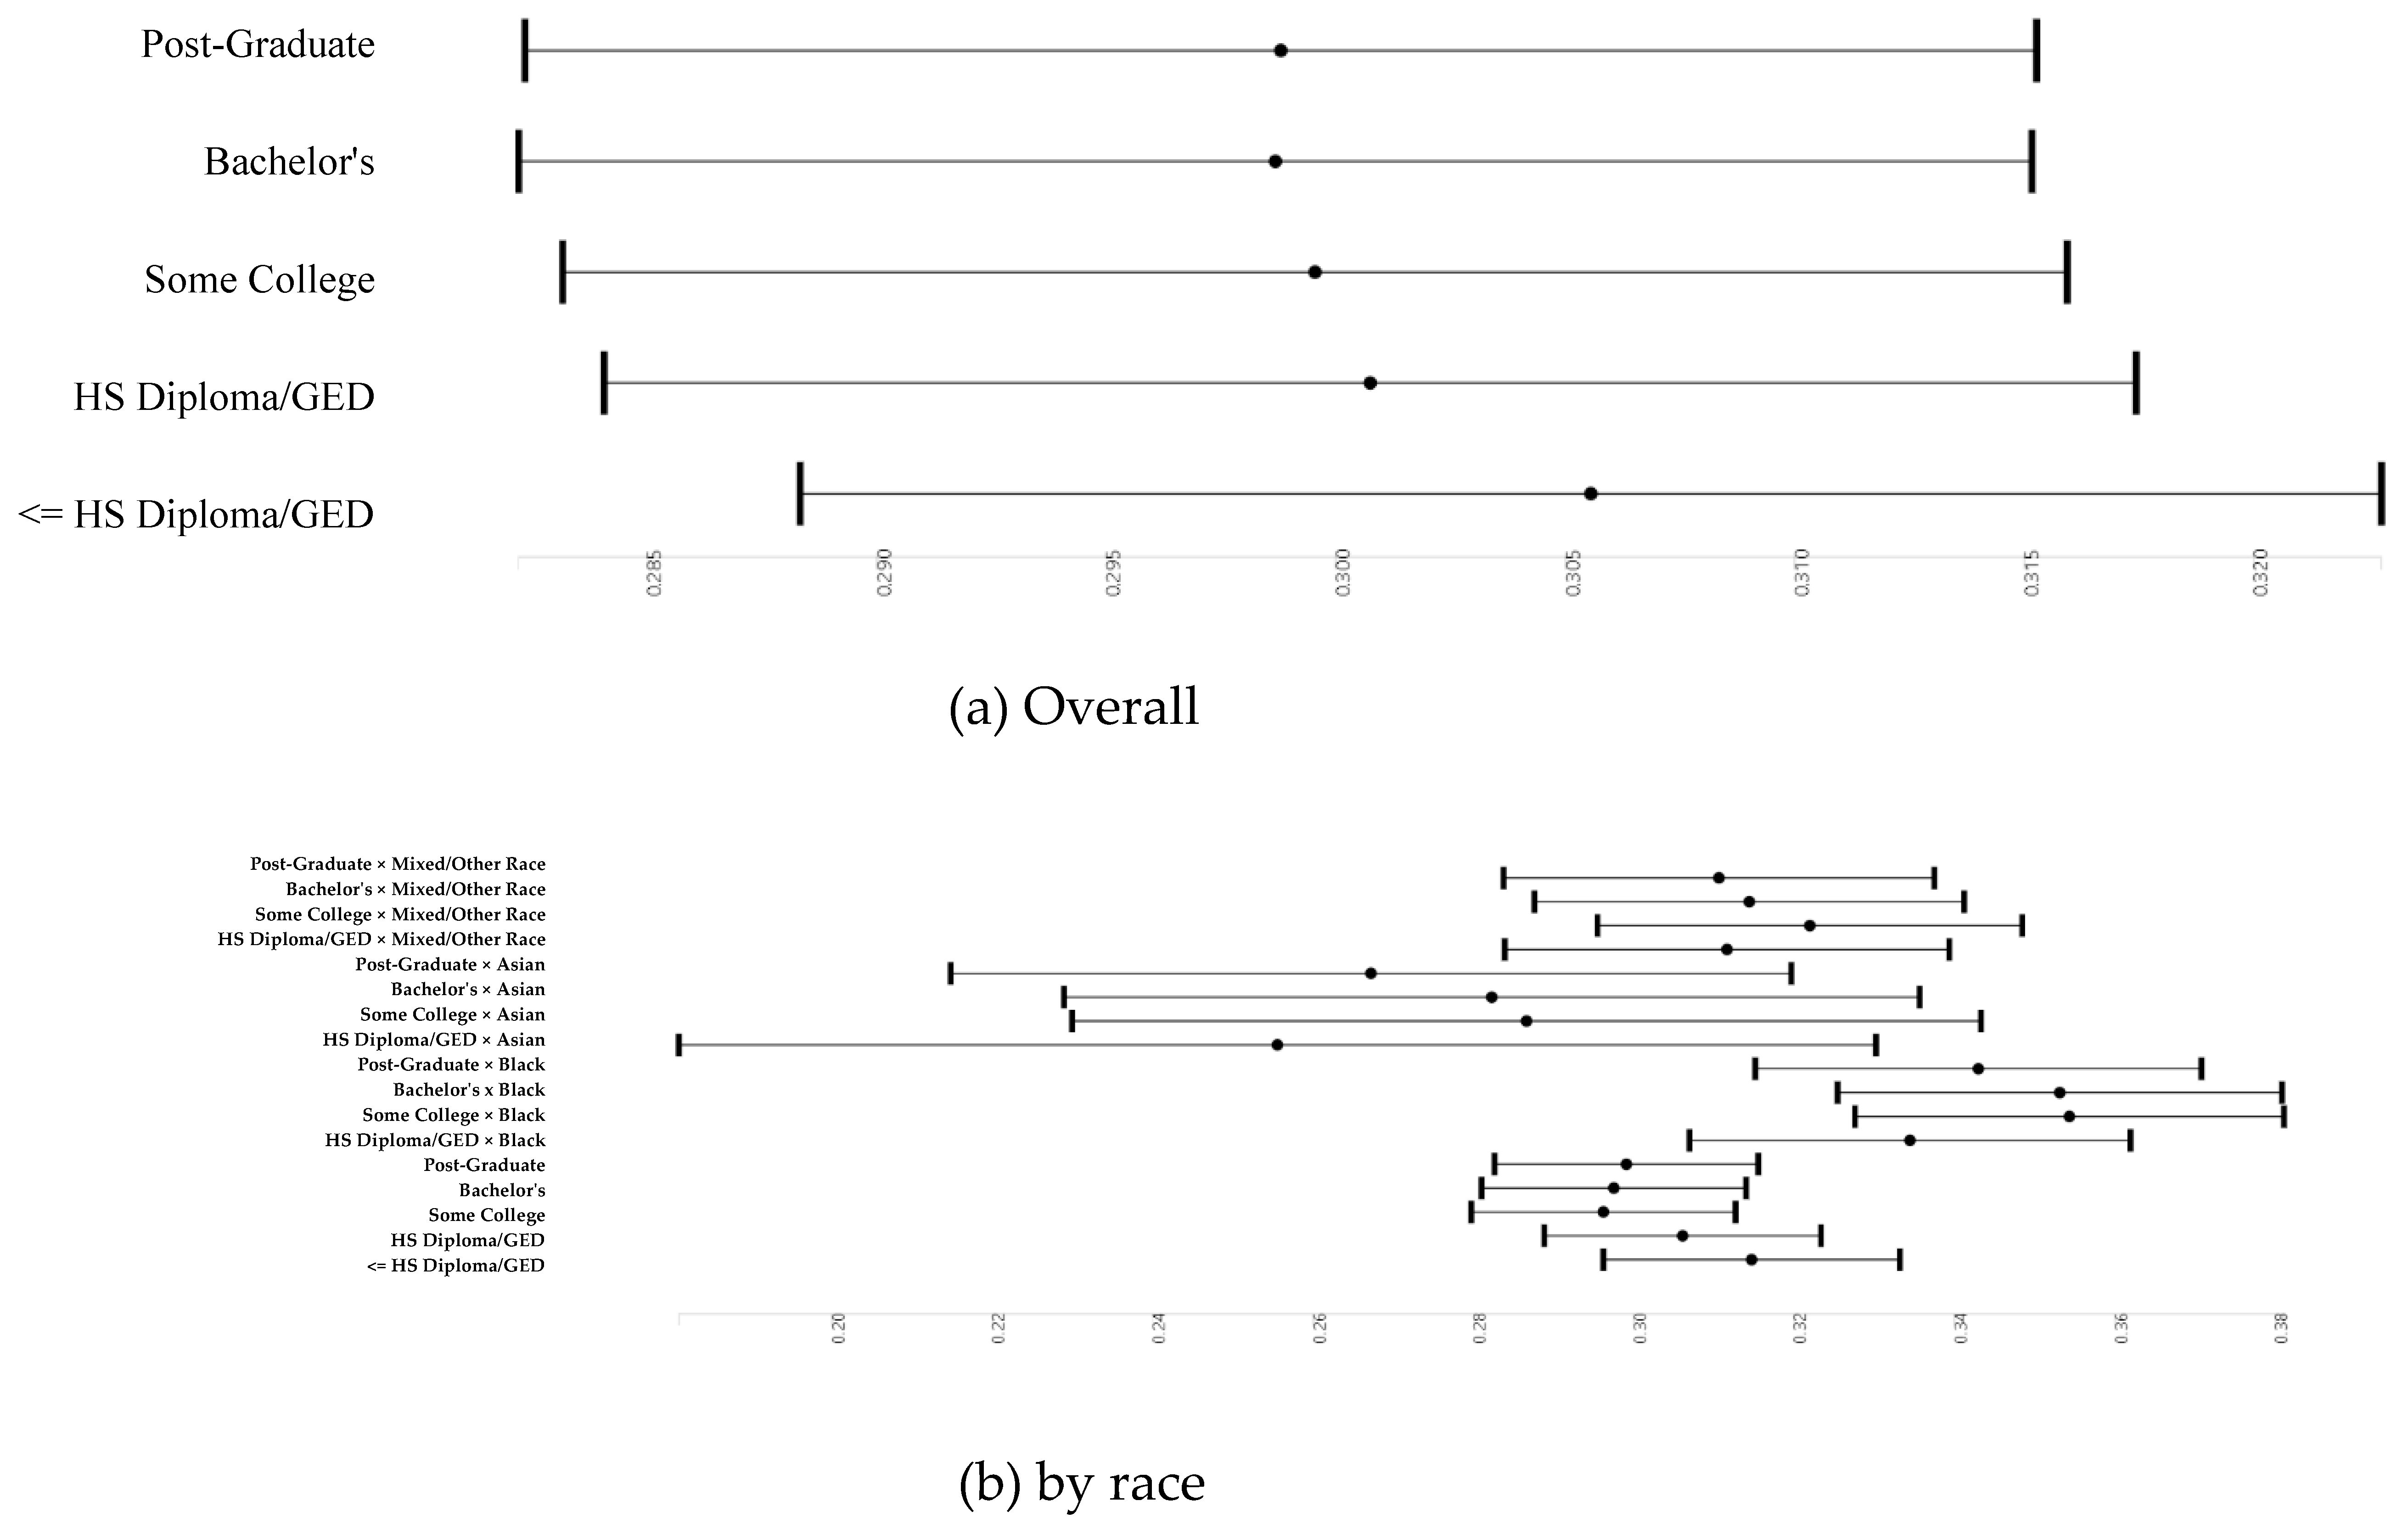
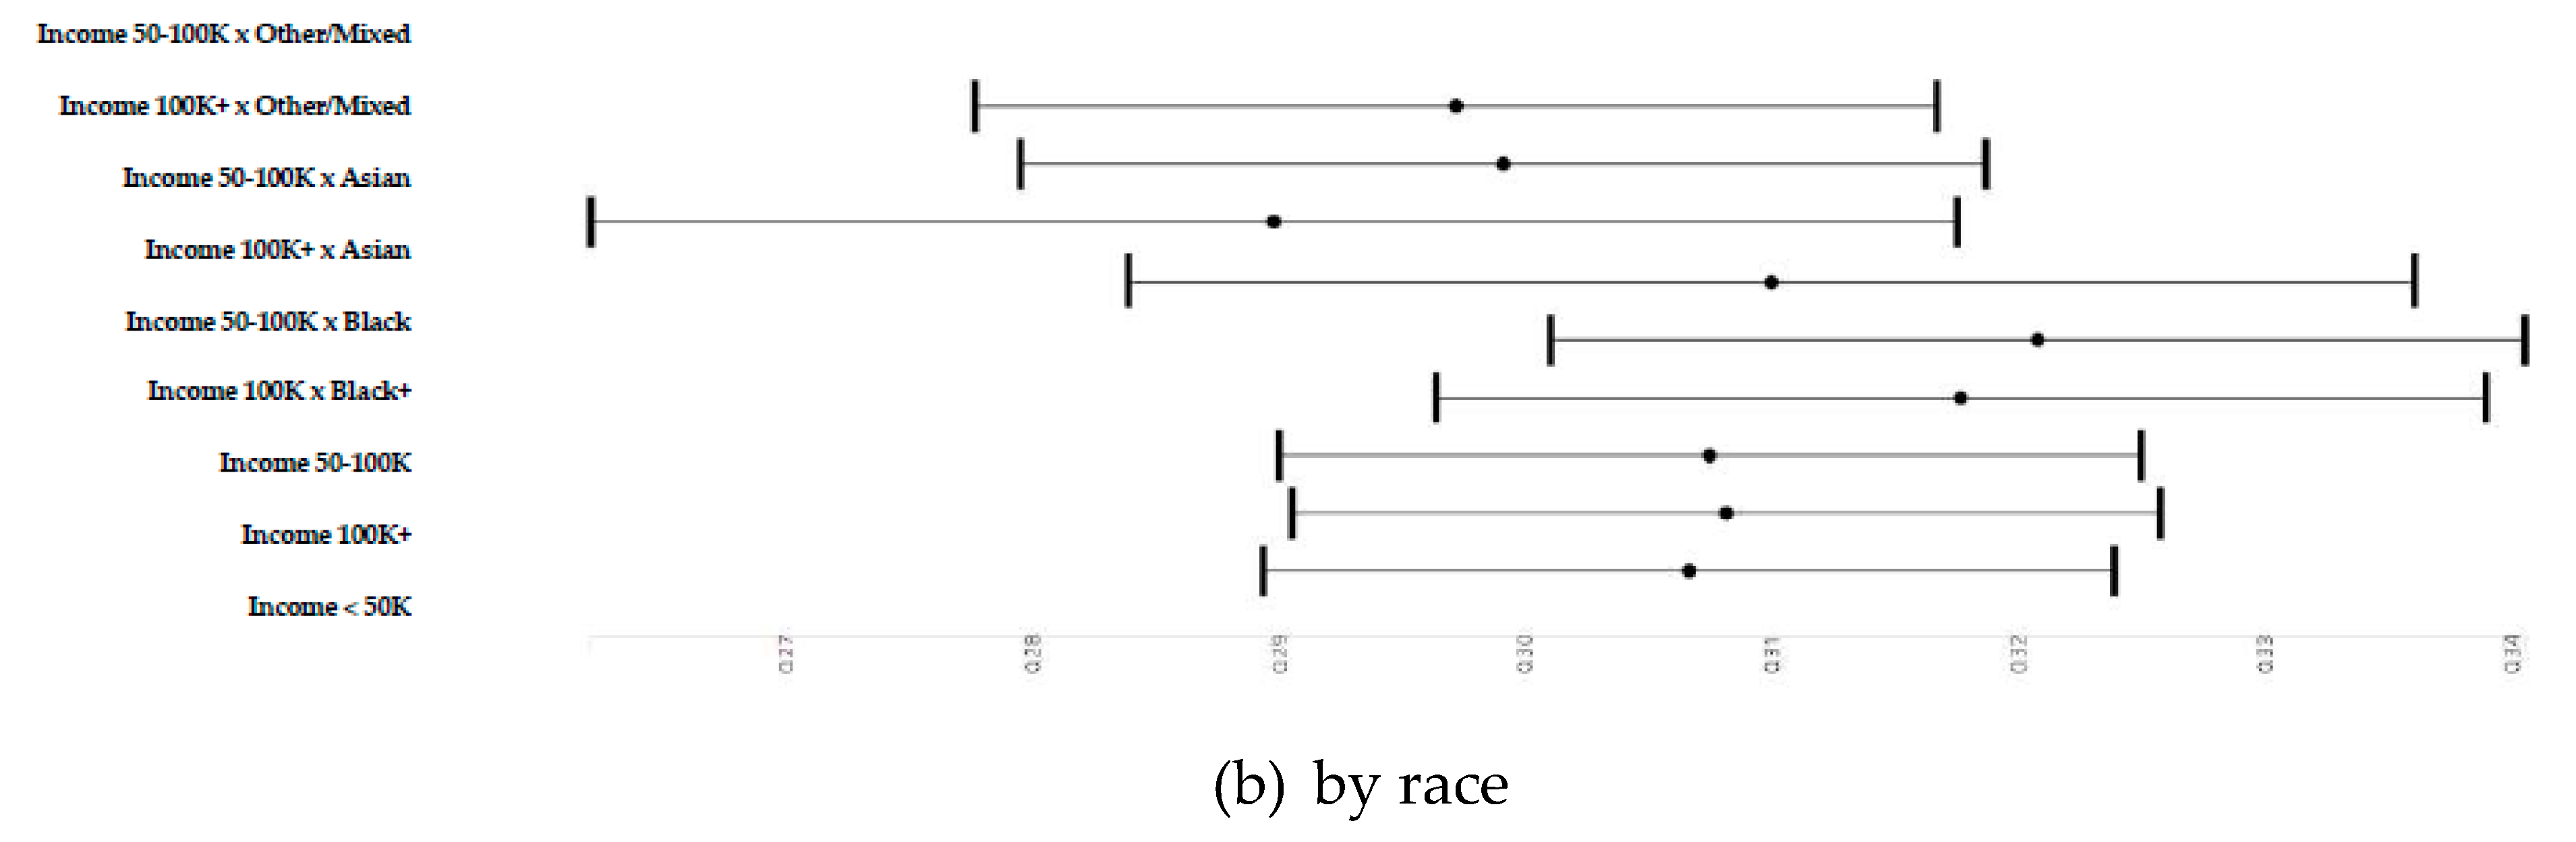
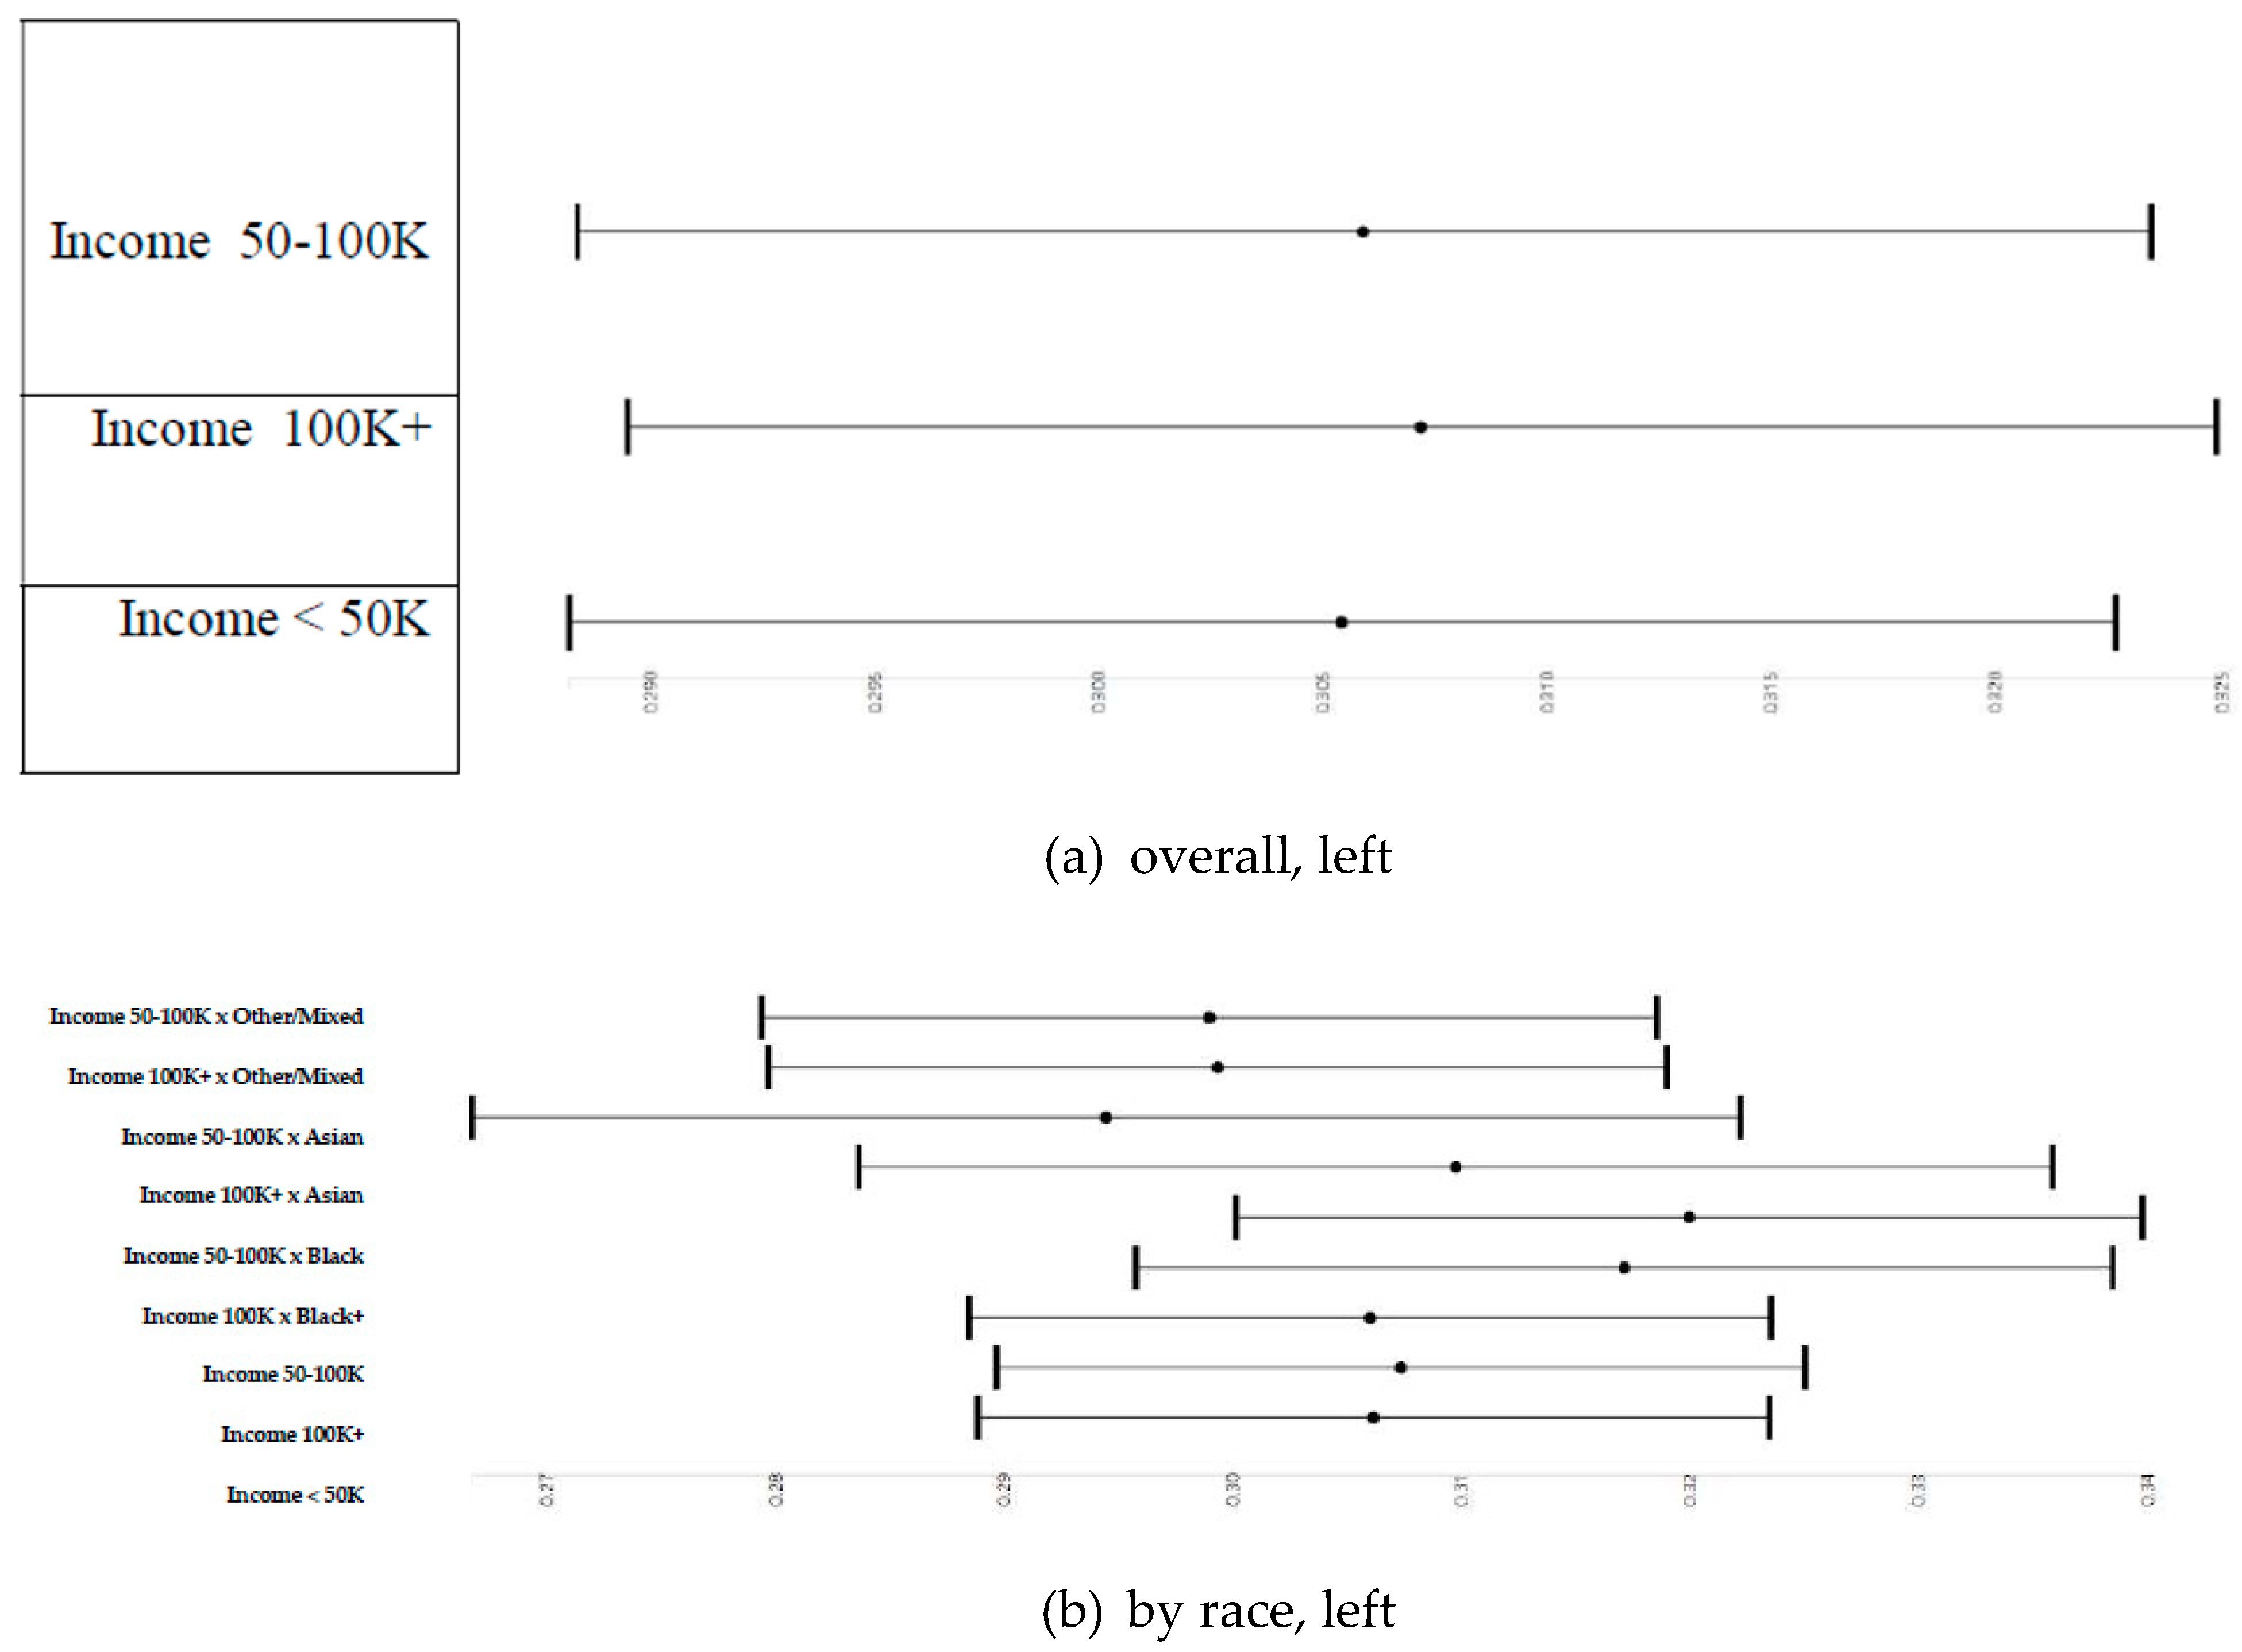
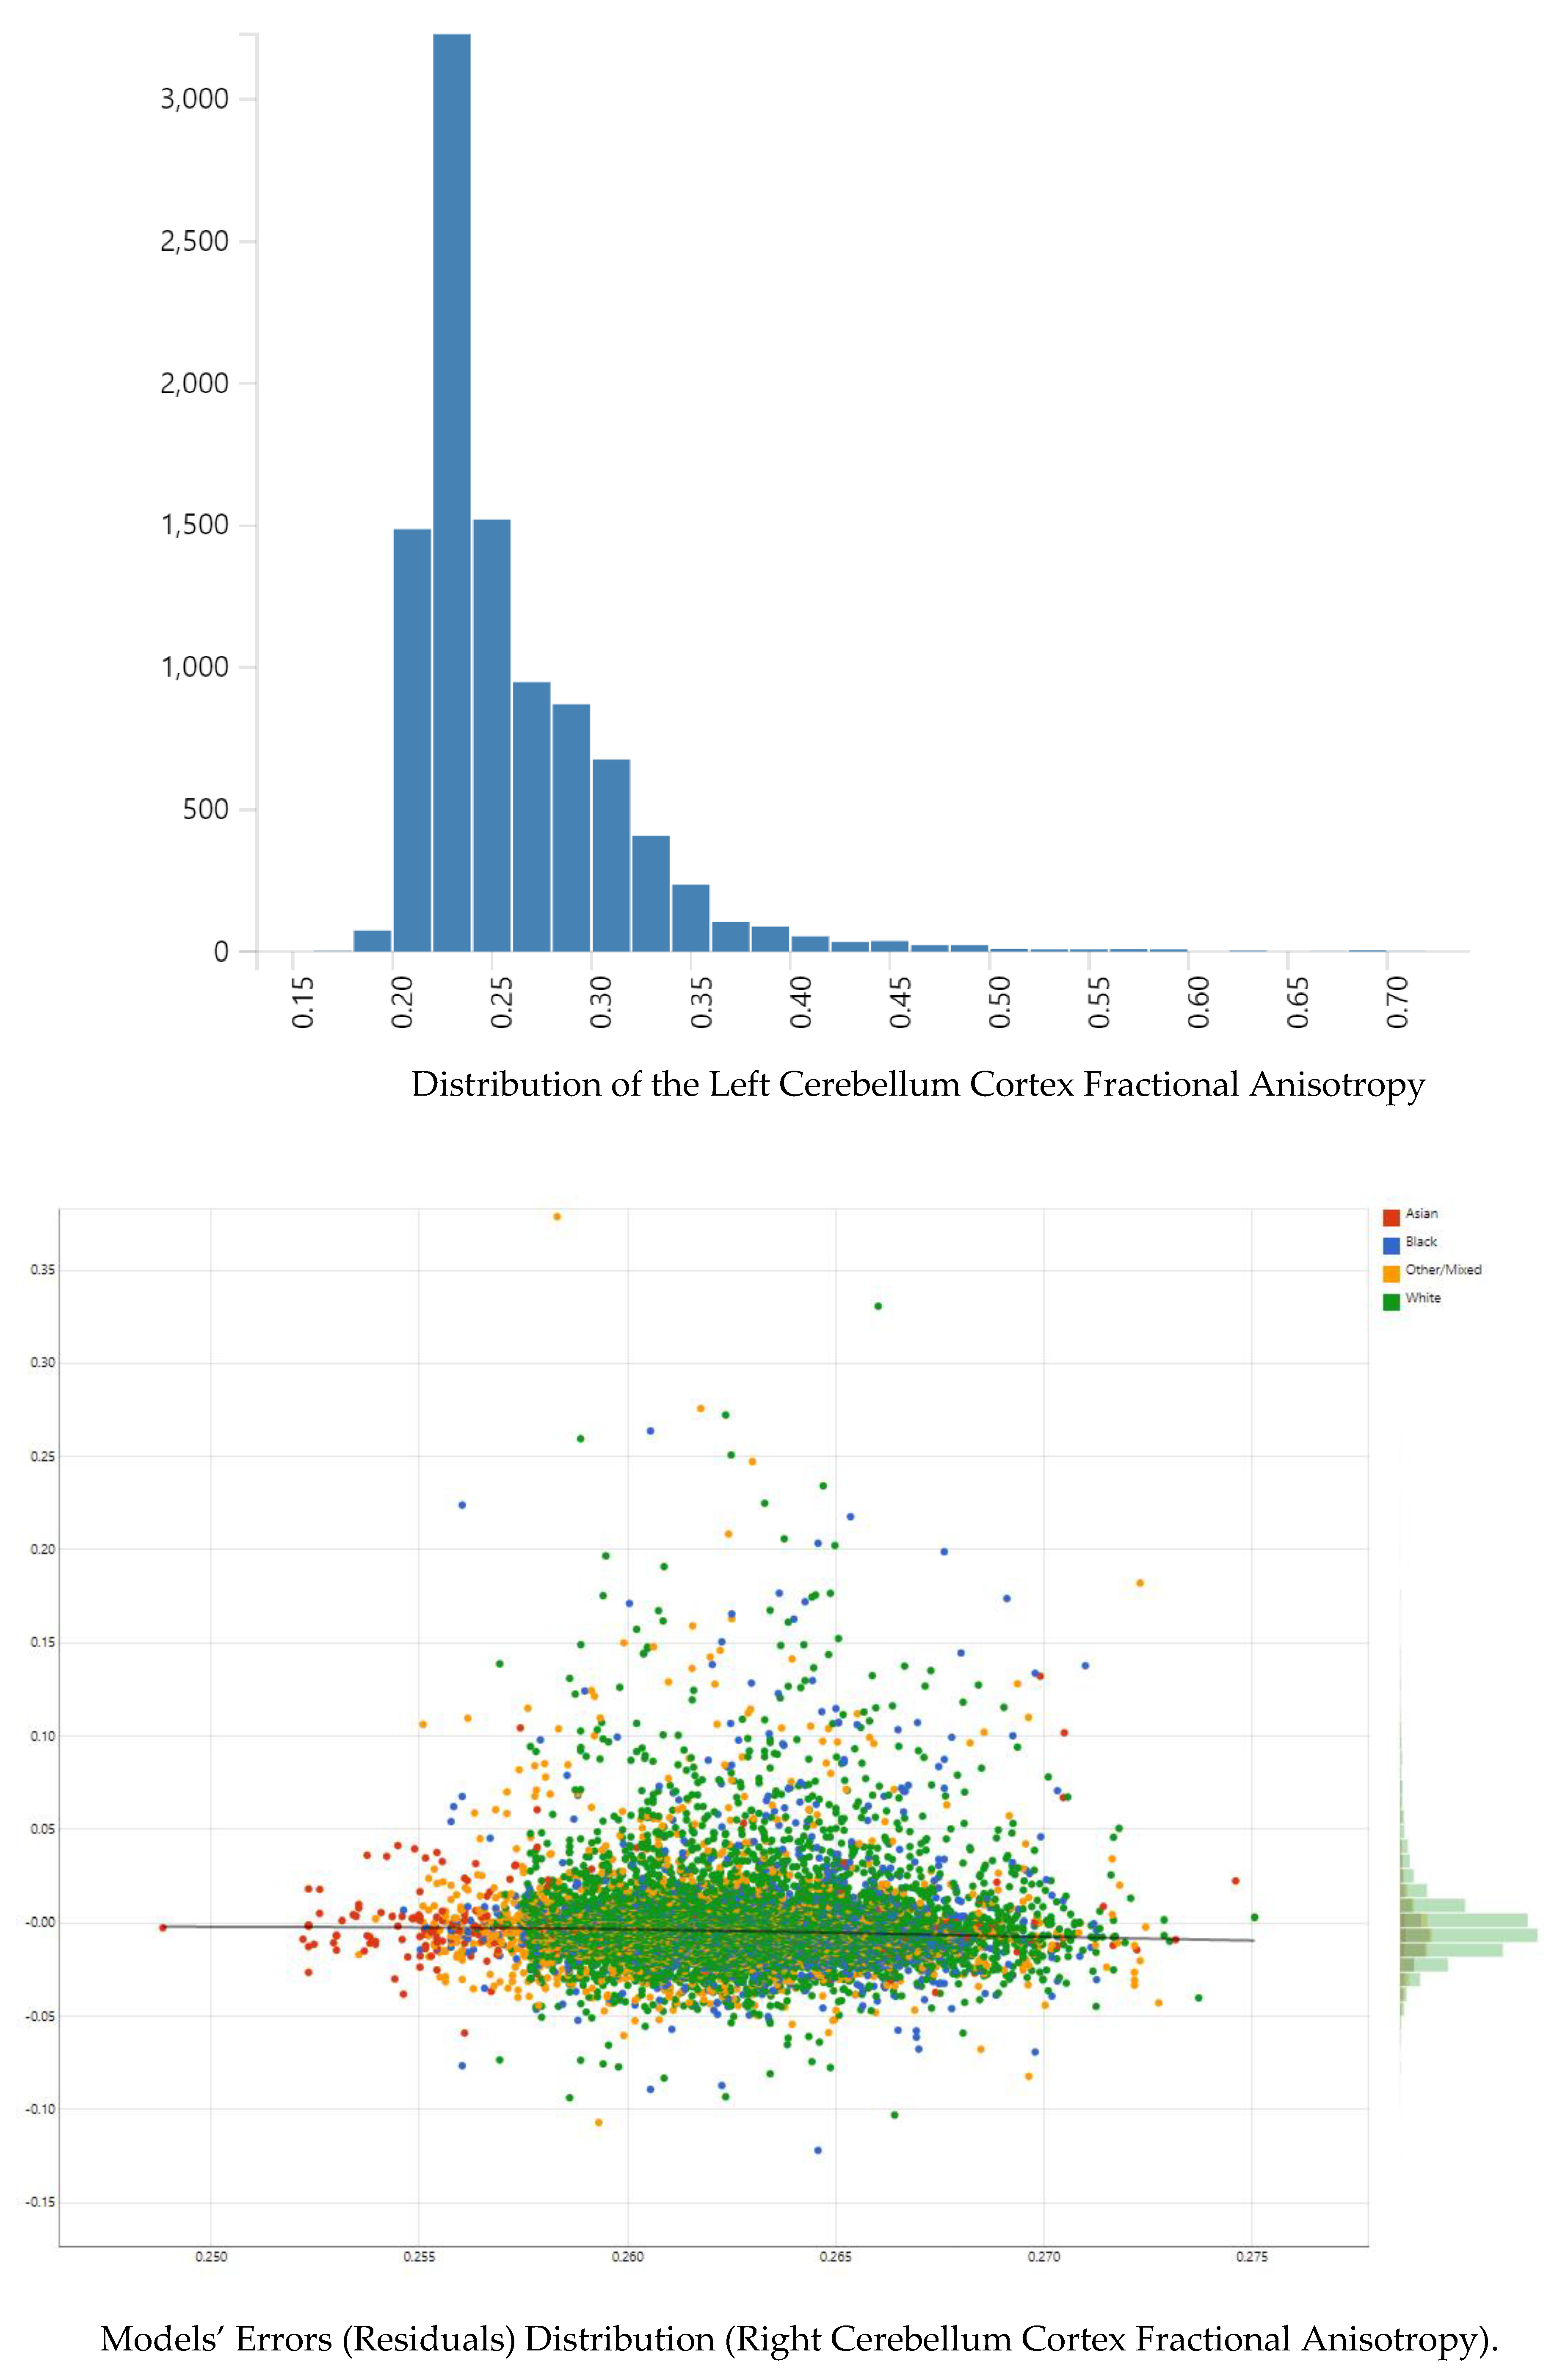
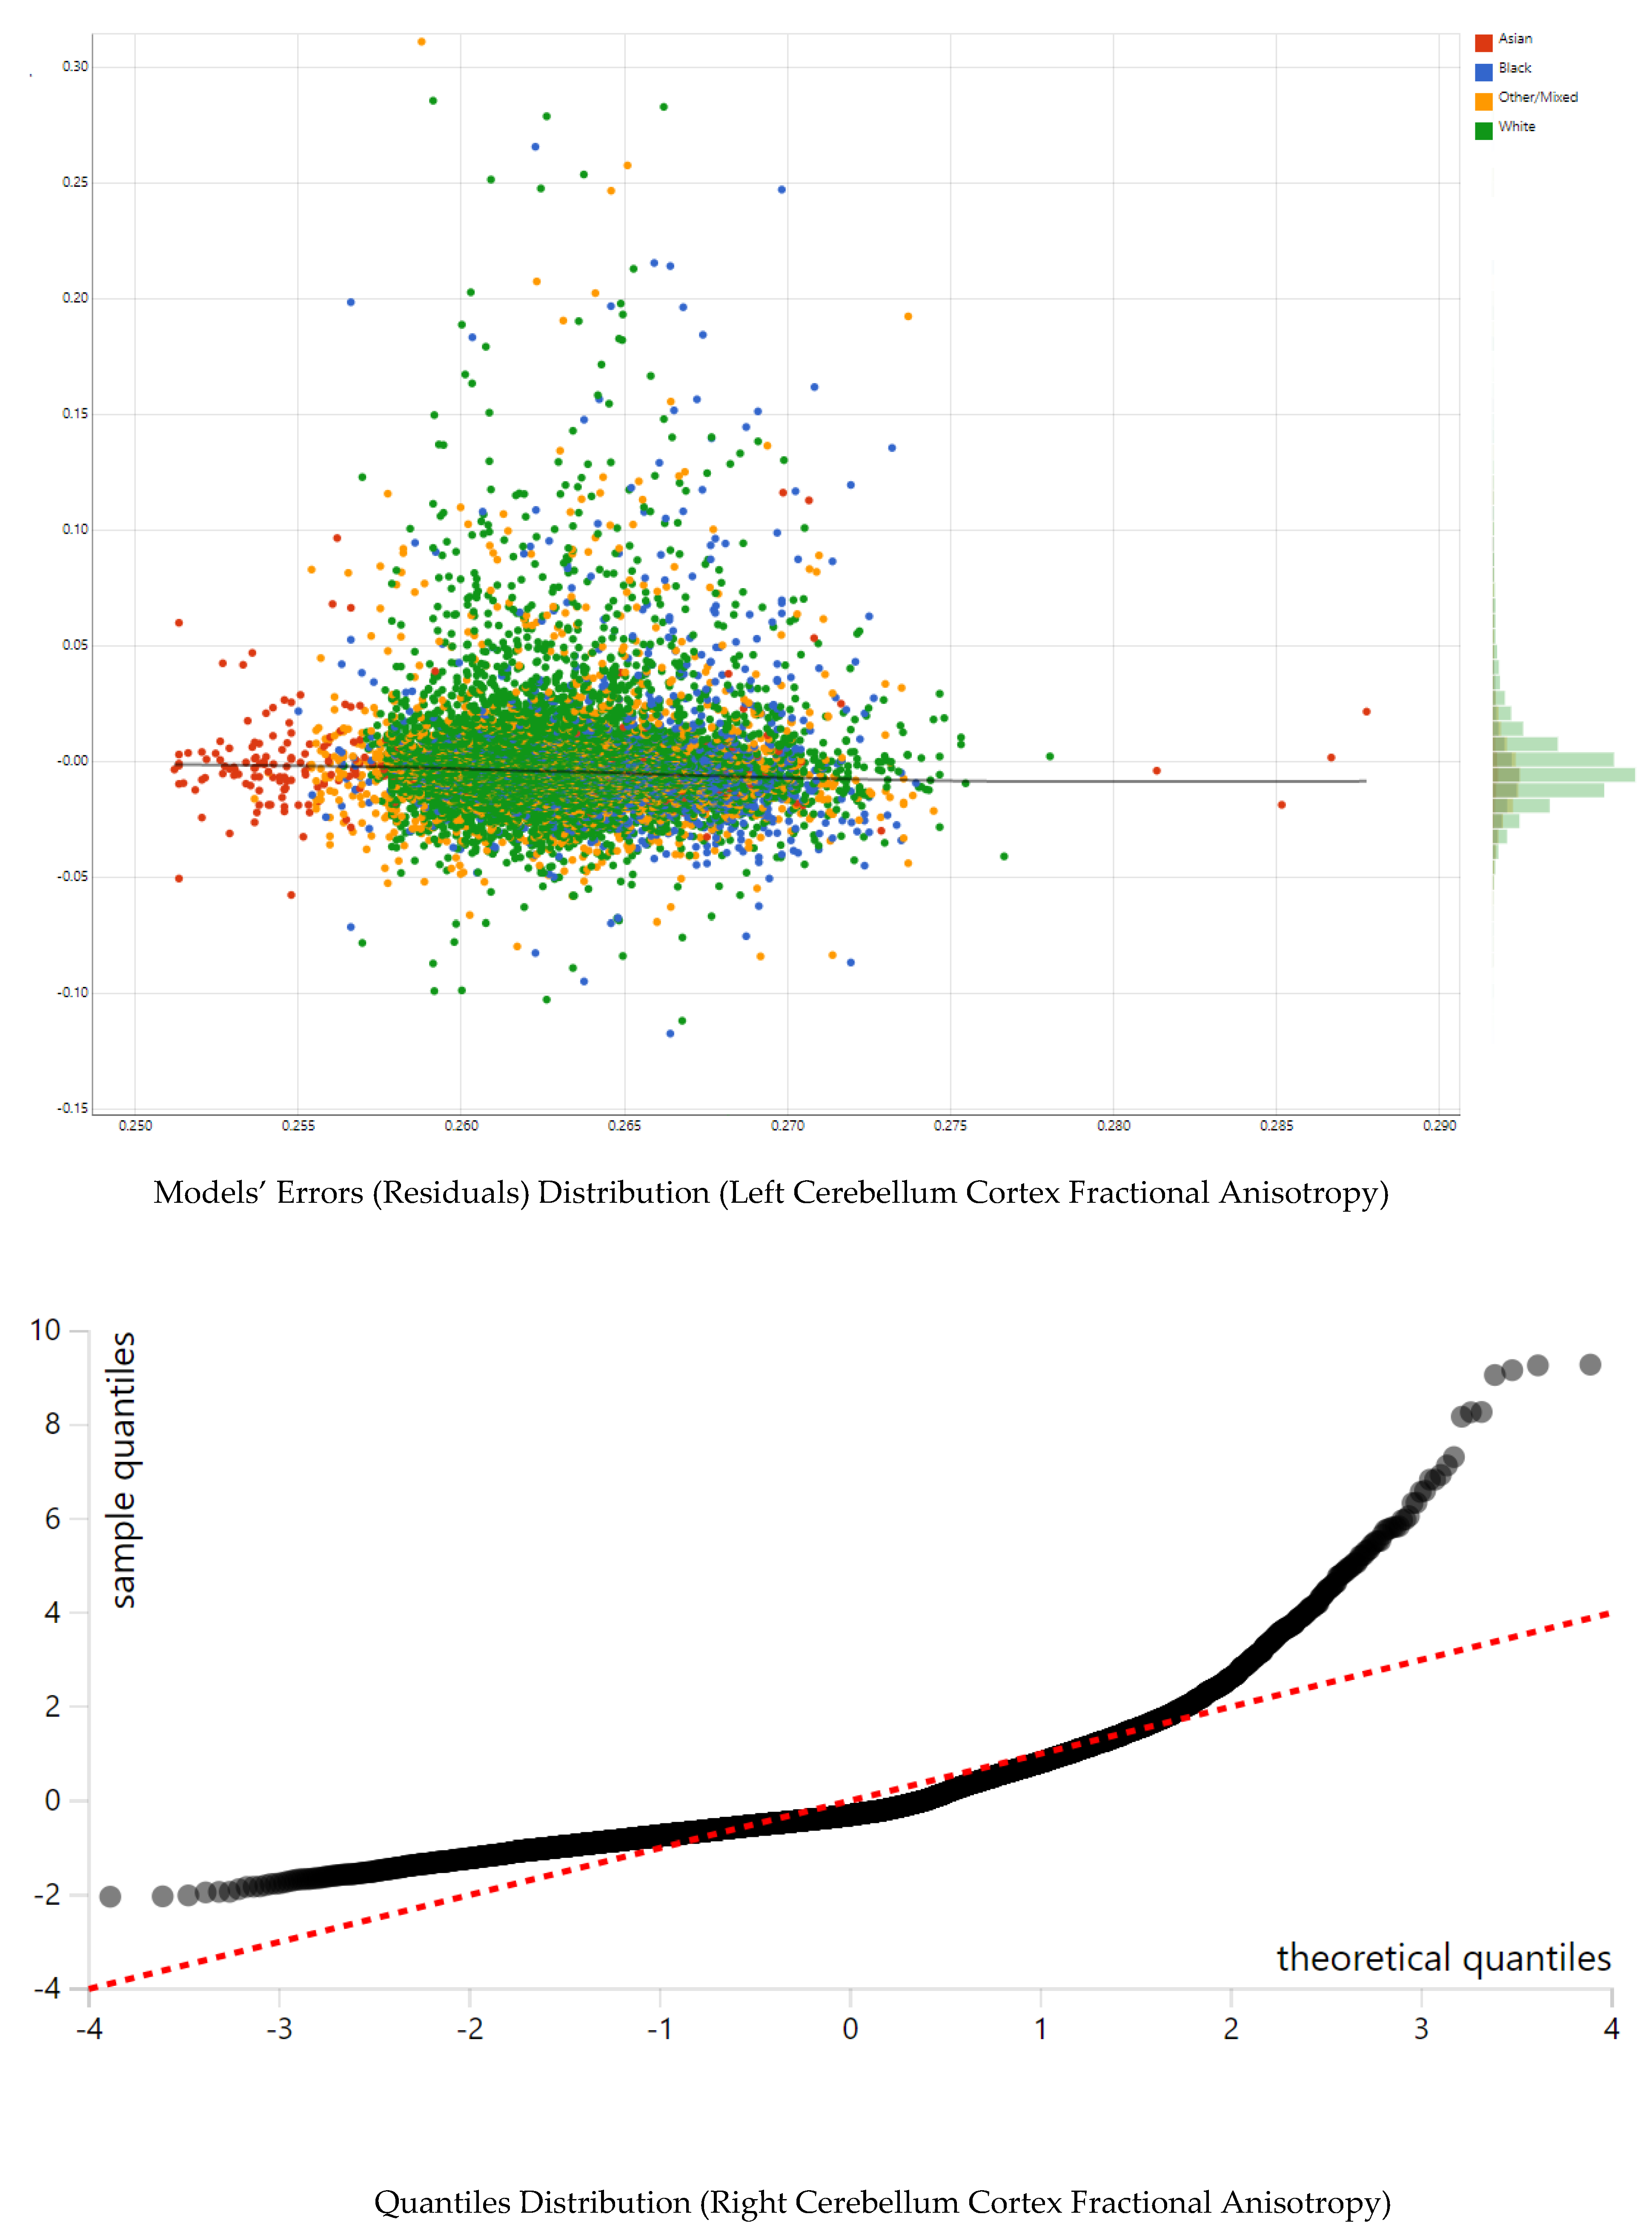
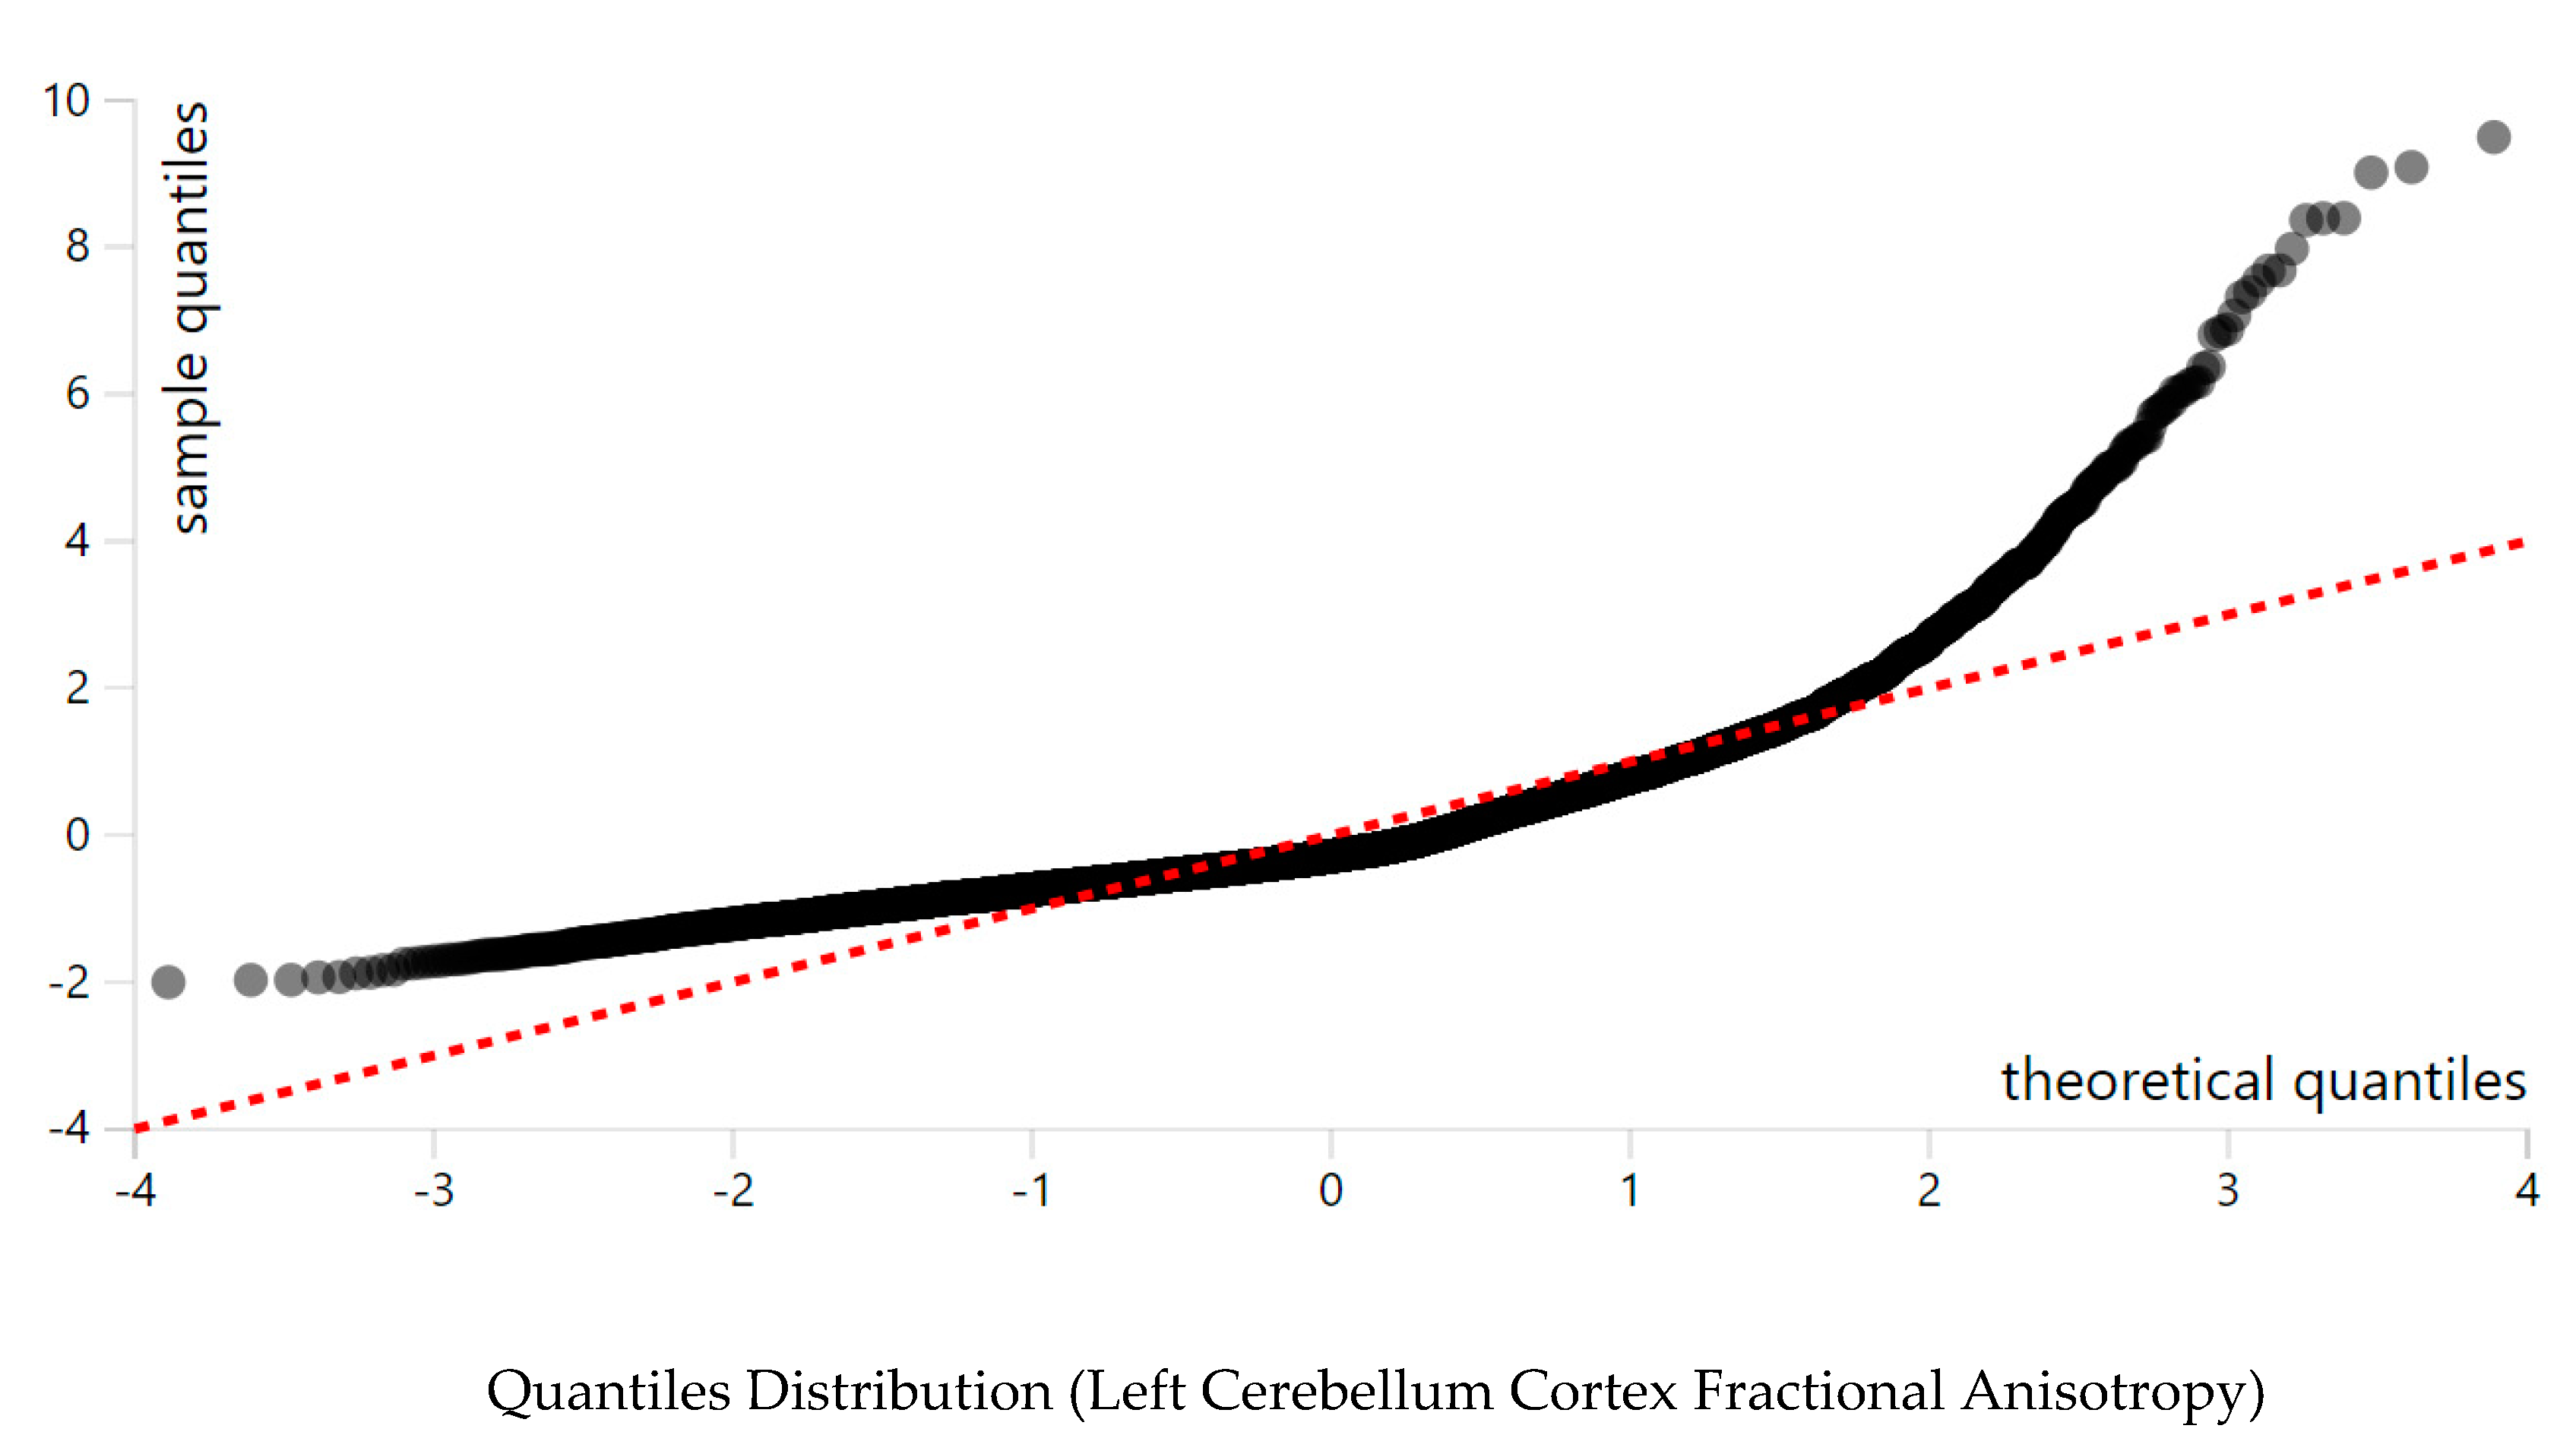
Table 1.
Descriptive data by race.
| Level | All | White | Black | Asian | Other/Mixed | p | |||||||
|---|---|---|---|---|---|---|---|---|---|---|---|---|---|
| Weighted | Weighted | Weighted | Weighted | Weighted | |||||||||
| n | 9565 | 6436 | 1343 | 203 | 1583 | ||||||||
| Age (Month) | 119.07 (7.47) | 119.34(7.49) | 119.12 (7.49) | 119.38(7.49) | 119.10 (7.22) | 119.39(7.24) | 119.83 (7.80) | 120.16(7.80) | 118.70 (7.54) | 118.86(7.62) | 0.097 | 0.102 | |
| Right mean cerebellum cortex fractional anisotropy | 0.26 (0.05) | 0.27(0.05) | 0.26 (0.05) | 0.26(0.05) | 0.26 (0.05) | 0.26(0.05) | 0.28 (0.05) | 0.27(0.05) | 0.28 (0.06) | 0.28(0.06) | <0.001 | <0.001 | |
| Left mean cerebellum cortex fractional anisotropy | 0.27 (0.05) | 0.27(0.05) | 0.26 (0.05) | 0.26(0.05) | 0.26 (0.06) | 0.26(0.06) | 0.28 (0.05) | 0.27(0.05) | 0.28 (0.06) | 0.28(0.06) | <0.001 | <0.001 | |
| Parental education | <HS Diploma | 339 (3.5) | (4.4) | 130 (2.0) | (2.8) | 104 (7.7) | (9.0) | 4 (2.0) | (1.5) | 101 (6.4) | (9.4) | <0.001 | <0.001 |
| HS Diploma/GED | 760 (7.9) | (9.6) | 288 (4.5) | (6.1) | 301 (22.4) | (25.0) | 3 (1.5) | (1.7) | 168 (10.6) | (15.2) | |||
| Some College | 2429 (25.4) | (29.8) | 1348 (20.9) | (26.6) | 533 (39.7) | (41.4) | 16 (7.9) | (8.7) | 532 (33.6) | (40.6) | |||
| Bachelor | 2546 (26.6) | (25.1) | 1926 (29.9) | (28.5) | 201 (15.0) | (13.4) | 52 (25.6) | (26.5) | 367 (23.2) | (18.4) | |||
| Post Graduate Degree | 3491 (36.5) | (31.1) | 2744 (42.6) | (36.1) | 204 (15.2) | (11.3) | 128 (63.1) | (61.6) | 415 (26.2) | (16.5) | |||
| Household income | <50,000 | 2680 (28.0) | (37.7) | 1151 (17.9) | (28.4) | 882 (65.7) | (74.7) | 31 (15.3) | (18.5) | 616 (38.9) | (54.9) | <0.001 | <0.001 |
| >=100,000 | 4147 (43.4) | (31.2) | 3338 (51.9) | (37.4) | 162 (12.1) | (6.2) | 124 (61.1) | (51.4) | 523 (33.0) | (17.6) | |||
| >=50,000 and <100,000 | 2738 (28.6) | (31.2) | 1947 (30.3) | (34.2) | 299 (22.3) | (19.0) | 48 (23.6) | (30.1) | 444 (28.0) | (27.5) | |||
| Married family | No | 2848 (29.8) | (36.6) | 1288 (20.0) | (28.2) | 944 (70.3) | (77.1) | 31 (15.3) | (15.6) | 585 (37.0) | (46.3) | <0.001 | <0.001 |
| Yes | 6717 (70.2) | (63.4) | 5148 (80.0) | (71.8) | 399 (29.7) | (22.9) | 172 (84.7) | (84.4) | 998 (63.0) | (53.7) | |||
| Sex | Female | 4608 (48.2) | (49.2) | 3040 (47.2) | (48.2) | 680 (50.6) | (51.8) | 103 (50.7) | (50.4) | 785 (49.6) | (51.0) | 0.062 | 0.142 |
| Male | 4957 (51.8) | (50.8) | 3396 (52.8) | (51.8) | 663 (49.4) | (48.2) | 100 (49.3) | (49.6) | 798 (50.4) | (49.0) | |||
| Hispanic | No | 7762 (81.2) | (77.7) | 5355 (83.2) | (80.3) | 1276 (95.0) | (92.5) | 184 (90.6) | (94.6) | 947 (59.8) | (45.6) | <0.001 | <0.001 |
| Yes | 1803 (18.8) | (22.3) | 1081 (16.8) | (19.7) | 67 (5.0) | (7.5) | 19 (9.4) | (5.4) | 636 (40.2) | (54.4) |
Outcomes: right and left cerebellum cortex fractional anisotropy.
Table 2.
Variance explained by our models.
| Education | Income | |||||||
|---|---|---|---|---|---|---|---|---|
| Right | Left | Right | Left | |||||
| All Main Effects | All Interaction Effects | All Main Effects | All Interaction Effects | All Main Effects | All Interaction Effects | All Main Effects | All Interaction Effects | |
| n | 9565 | 9565 | 9565 | 9565 | 9565 | 9565 | 9565 | 9565 |
| R-squared | 0.01158 | 0.01122 | 0.01634 | 0.01691 | 0.01158 | 0.01122 | 0.01474 | 0.0137 |
| ΔR-squared | 0.00044 (0.04%) | 0.00046 (0.05%) | 0.01216 (1.22%) | 0.01272 (1.27%) | 1 × 10⁻⁴ (0.01%) | 0.00011 (0.01%) | 0.0103 (1.03%) | 0.00921 (0.92%) |
Table 3.
Regressions in the overall sample and by race with right and left cerebellum cortex fractional anisotropy as the outcomes.
Table 3.
Regressions in the overall sample and by race with right and left cerebellum cortex fractional anisotropy as the outcomes.
| Right | Left | |||||||
|---|---|---|---|---|---|---|---|---|
| b | SE | p | sig | b | SE | p | Sig | |
| Parental education (HS Diploma/GED) | −0.0054 | 0.0035 | 0.124 | −0.0048 | 0.0035 | 0.167 | ||
| Parental education (Some College) | −0.0057 | 0.0032 | 0.073 | # | −0.0060 | 0.0032 | 0.057 | # |
| Parental education (Bachelor) | −0.0069 | 0.0034 | 0.041 | * | −0.0069 | 0.0034 | 0.041 | * |
| Parental education (Post Graduate Degree) | −0.0066 | 0.0034 | 0.053 | # | −0.0068 | 0.0034 | 0.048 | * |
| Household income (>=100 K) | 0.0019 | 0.0020 | 0.320 | 0.0018 | 0.0020 | 0.366 | ||
| Household income (>=50 K and <100 K) | 0.0010 | 0.0017 | 0.554 | 0.0005 | 0.0017 | 0.782 | ||
| Race (Black) | −0.0051 | 0.0019 | 0.008 | ** | −0.0040 | 0.0019 | 0.038 | * |
| Race (Asian) | 0.0120 | 0.0035 | 0.001 | ** | 0.0114 | 0.0035 | 0.001 | ** |
| Race (Other/Mixed) | 0.0110 | 0.0017 | < 0.001 | *** | 0.0112 | 0.0017 | < 0.001 | *** |
| Married Family | −0.0042 | 0.0015 | 0.004 | ** | −0.0040 | 0.0015 | 0.008 | ** |
| Age (Months) | −0.0003 | 0.0001 | < 0.001 | *** | −0.0003 | 0.0001 | < 0.001 | *** |
| Sex (Male) | 0.0012 | 0.0011 | 0.260 | 0.0011 | 0.540 | |||
Outcomes: right and left cerebellum cortex fractional anisotropy. # p < 0.1, * p < 0.05, ** p < 0.01, *** p < 0.001.
Table 4.
Regressions on the association between parental education with right and left cerebellum cortex fractional anisotropy.
Table 4.
Regressions on the association between parental education with right and left cerebellum cortex fractional anisotropy.
| Right | Left | |||||||
|---|---|---|---|---|---|---|---|---|
| b | SE | p | sig | b | SE | p | sig | |
| Parental education (HS Diploma/GED) | −0.0085 | 0.0054 | 0.117 | −0.0086 | 0.0054 | 0.112 | ||
| Parental education (Some College) | −0.0163 | 0.0048 | 0.001 | *** | −0.0185 | 0.0048 | 0.000 | *** |
| Parental education (Bachelor) | −0.0155 | 0.0049 | 0.002 | ** | −0.0172 | 0.0049 | 0.000 | *** |
| Parental education (Post Graduate Degree) | −0.01405 | 0.0049 | 0.004 | ** | −0.0156 | 0.0049 | 0.001 | ** |
| Household income (>=100 K) | 0.0026 | 0.0020 | 0.188 | 0.0025 | 0.0020 | 0.204 | ||
| Household income (>=50 K and <100 K) | 0.0015 | 0.0017 | 0.371 | 0.0011 | 0.0017 | 0.531 | ||
| Race (Black) | −0.0331 | 0.0071 | < 0.001 | *** | −0.03484 | 0.0071 | < 0.001 | *** |
| Race (Asian) | 0.0428 | 0.0238 | 0.072 | # | 0.0519 | 0.0238 | 0.029 | * |
| Race (Other/Mixed) | 0.0122 | 0.0068 | 0.072 | # | 0.0099 | 0.0068 | 0.145 | |
| Married Family | −0.0043 | 0.0015 | 0.004 | ** | −0.0040 | 0.0015 | 0.006 | ** |
| Age (Months) | −0.0003 | 0.0001 | < 0.001 | *** | −0.0003 | 0.0001 | < 0.001 | *** |
| Sex (Male) | 0.0013 | 0.0011 | 0.218 | 0.0008 | 0.0011 | 0.468 | ||
| Parental education (HS Diploma/GED) × Race (Black) | 0.0185 | 0.0082 | 0.024 | * | 0.0198 | 0.0082 | 0.016 | * |
| Parental education (Some College) × Race (Black) | 0.0352 | 0.0075 | < 0.001 | *** | 0.0396 | 0.0075 | < 0.001 | *** |
| Parental education (Bachelor) × Race (Black) | 0.0359 | 0.0082 | < 0.001 | *** | 0.0384 | 0.0082 | < 0.001 | *** |
| Parental education (Post Graduate Degree) × Race (Black) | 0.0263 | 0.0083 | 0.002 | ** | 0.0283 | 0.0083 | 0.001 | *** |
| Parental education (HS Diploma/GED) × Race (Asian) | −0.0523 | 0.0365 | 0.152 | −0.0591 | 0.0364 | 0.105 | ||
| Parental education (Some College) × Race (Asian) | −0.0212 | 0.0266 | 0.425 | −0.0281 | 0.0266 | 0.292 | ||
| Parental education (Bachelor) × Race (Asian) | −0.0228 | 0.0247 | 0.357 | −0.0324 | 0.0248 | 0.191 | ||
| Parental education (Post Graduate Degree) × Race (Asian) | −0.0369 | 0.0242 | 0.128 | −0.0475 | 0.0243 | 0.050 | # | |
| Parental education (HS Diploma/GED) × Race (Other/Mixed) | −0.0046 | 0.0085 | 0.584 | −0.0031 | 0.0085 | 0.716 | ||
| Parental education (Some College) × Race (Other/Mixed) | 0.0045 | 0.0073 | 0.540 | 0.0073 | 0.0073 | 0.321 | ||
| Parental education (Bachelor) × Race (Other/Mixed) | −0.0042 | 0.0076 | 0.584 | −0.0003 | 0.0076 | 0.970 | ||
| Parental education (Post Graduate Degree) × Race (Other/Mixed) | −0.0064 | 0.0076 | 0.402 | −0.0041 | 0.0076 | 0.591 | ||
Outcomes: right and left cerebellum cortex fractional anisotropy. # p < 0.1, * p < 0.05, ** p < 0.01, *** p < 0.001.
Table 5.
Regressions on the association between household income with right and left cerebellum cortex fractional anisotropy.
Table 5.
Regressions on the association between household income with right and left cerebellum cortex fractional anisotropy.
| Right | Left | |||||||
|---|---|---|---|---|---|---|---|---|
| b | SE | p | sig | b | SE | p | sig | |
| Household income (>=100 K) | 0.0015 | 0.0022 | 0.490 | 0.0012 | 0.0022 | 0.590 | ||
| Household income (>=50 K and <100 K) | 0.0009 | 0.0021 | 0.684 | −0.0002 | 0.0021 | 0.941 | ||
| Parental education (HS Diploma/GED) | −0.0047 | 0.0035 | 0.174 | −0.0042 | 0.0035 | 0.223 | ||
| Parental education (Some College) | −0.0056 | 0.0032 | 0.077 | # | −0.0060 | 0.0032 | 0.059 | # |
| Parental education (Bachelor) | −0.0069 | 0.0034 | 0.042 | * | −0.0069 | 0.0034 | 0.042 | * |
| Parental education (Post Graduate Degree) | −0.0066 | 0.0034 | 0.055 | # | −0.0067 | 0.0034 | 0.050 | * |
| Race (Black) | −0.0094 | 0.0025 | 0.000 | *** | −0.0083 | 0.0025 | 0.001 | *** |
| Race (Asian) | 0.0146 | 0.0086 | 0.090 | # | 0.0125 | 0.0086 | 0.146 | |
| Race (Other/Mixed) | 0.0154 | 0.0026 | < 0.001 | *** | 0.0148 | 0.0026 | < 0.001 | *** |
| Married Family | −0.0043 | 0.0015 | 0.004 | ** | −0.0040 | 0.0015 | 0.006 | ** |
| Age (Months) | −0.0003 | 0.0001 | < 0.001 | *** | −0.0003 | 0.0001 | < 0.001 | *** |
| Sex (Male) | 0.0012 | 0.0011 | 0.263 | 0.0007 | 0.0011 | 0.544 | ||
| Household income (>=100 K) × Race (Black) | 0.0110 | 0.0059 | 0.059 | # | 0.0110 | 0.0059 | 0.062 | # |
| Household income (>=50 K and <100 K) × Race (Black) | 0.0142 | 0.0043 | 0.001 | ** | 0.0138 | 0.0043 | 0.001 | ** |
| Household income (>=100 K) × Race (Asian) | 0.0033 | 0.0098 | 0.732 | 0.0036 | 0.0098 | 0.712 | ||
| Household income (>=50 K and <100 K) × Race (Asian) | −0.0169 | 0.0109 | 0.124 | −0.0117 | 0.0109 | 0.284 | ||
| Household income (>=100 K) × Race (Other/Mixed) | −0.0075 | 0.0041 | 0.068 | # | −0.0068 | 0.0041 | 0.099 | # |
| Household income (>=50 K and <100 K) × Race (Other/Mixed) | −0.0094 | 0.0040 | 0.019 | * | −0.0072 | 0.0040 | 0.074 | # |
Outcomes: right and left cerebellum cortex fractional anisotropy. # p < 0.1, * p < 0.05, ** p < 0.01, *** p < 0.001.
Publisher’s Note: MDPI stays neutral with regard to jurisdictional claims in published maps and institutional affiliations. |
© 2021 by the authors. Licensee MDPI, Basel, Switzerland. This article is an open access article distributed under the terms and conditions of the Creative Commons Attribution (CC BY) license (https://creativecommons.org/licenses/by/4.0/).
Share and Cite
MDPI and ACS Style
Assari, S.; Boyce, S. Race, Socioeconomic Status, and Cerebellum Cortex Fractional Anisotropy in Pre-Adolescents. Adolescents 2021, 1, 70-94. https://0-doi-org.brum.beds.ac.uk/10.3390/adolescents1020007
AMA Style
Assari S, Boyce S. Race, Socioeconomic Status, and Cerebellum Cortex Fractional Anisotropy in Pre-Adolescents. Adolescents. 2021; 1(2):70-94. https://0-doi-org.brum.beds.ac.uk/10.3390/adolescents1020007
Chicago/Turabian StyleAssari, Shervin, and Shanika Boyce. 2021. "Race, Socioeconomic Status, and Cerebellum Cortex Fractional Anisotropy in Pre-Adolescents" Adolescents 1, no. 2: 70-94. https://0-doi-org.brum.beds.ac.uk/10.3390/adolescents1020007