
Net Zero and Catalysis: How Neutrons Can Help


1
ISIS Neutron and Muon Facility, STFC Rutherford Appleton Laboratory, Chilton, Oxon OX11 0QX, UK
2
School of Chemistry, Joseph Black Building, University of Glasgow, Glasgow G12 8QQ, UK
*
Author to whom correspondence should be addressed.
Physchem 2021, 1(1), 95-120; https://0-doi-org.brum.beds.ac.uk/10.3390/physchem1010007
Submission received: 7 May 2021
/
Revised: 24 May 2021
/
Accepted: 7 June 2021
/
Published: 9 June 2021
(This article belongs to the Special Issue Physical Chemistry Perspectives for the New Decade)
Abstract
:Net Zero has the aim of achieving equality between the amount of greenhouse gas emissions produced and the amount removed from the atmosphere. There is widespread acceptance that for Net Zero to be achievable, chemistry, and hence catalysis, must play a major role. Most current studies of catalysts and catalysis employ a combination of physical methods, imaging techniques and spectroscopy to provide insight into the catalyst structure and function. One of the methods used is neutron scattering and this is the focus of this Perspective. Here, we show how neutron methods are being used to study reactions and processes that are directly relevant to achieving Net Zero, such as methane reforming, Fischer–Tropsch synthesis, ammonia and methanol production and utilization, bio-mass upgrading, fuel cells and CO2 capture and exploitation. We conclude by describing some other areas that offer opportunities.
1. Introduction
In June 2019, the UK Houses of Parliament passed legislation requiring the reduction of the UK’s net emissions of greenhouse gases by 100% (relative to 1990 levels) by 2050 [1]. This is the ‘Net Zero’ target and requires achieving equality between the amount of greenhouse gas emissions produced and the amount removed from the atmosphere. This is an ambition that is shared by many other countries: as of 23 April 2021, 44 countries and the European Union have pledged to meet Net Zero [2]. Together, they account for around 70% of global CO2 emissions and GDP. There are two different routes to achieving Net Zero, which work in tandem: reducing existing emissions and actively removing greenhouse gases [3].
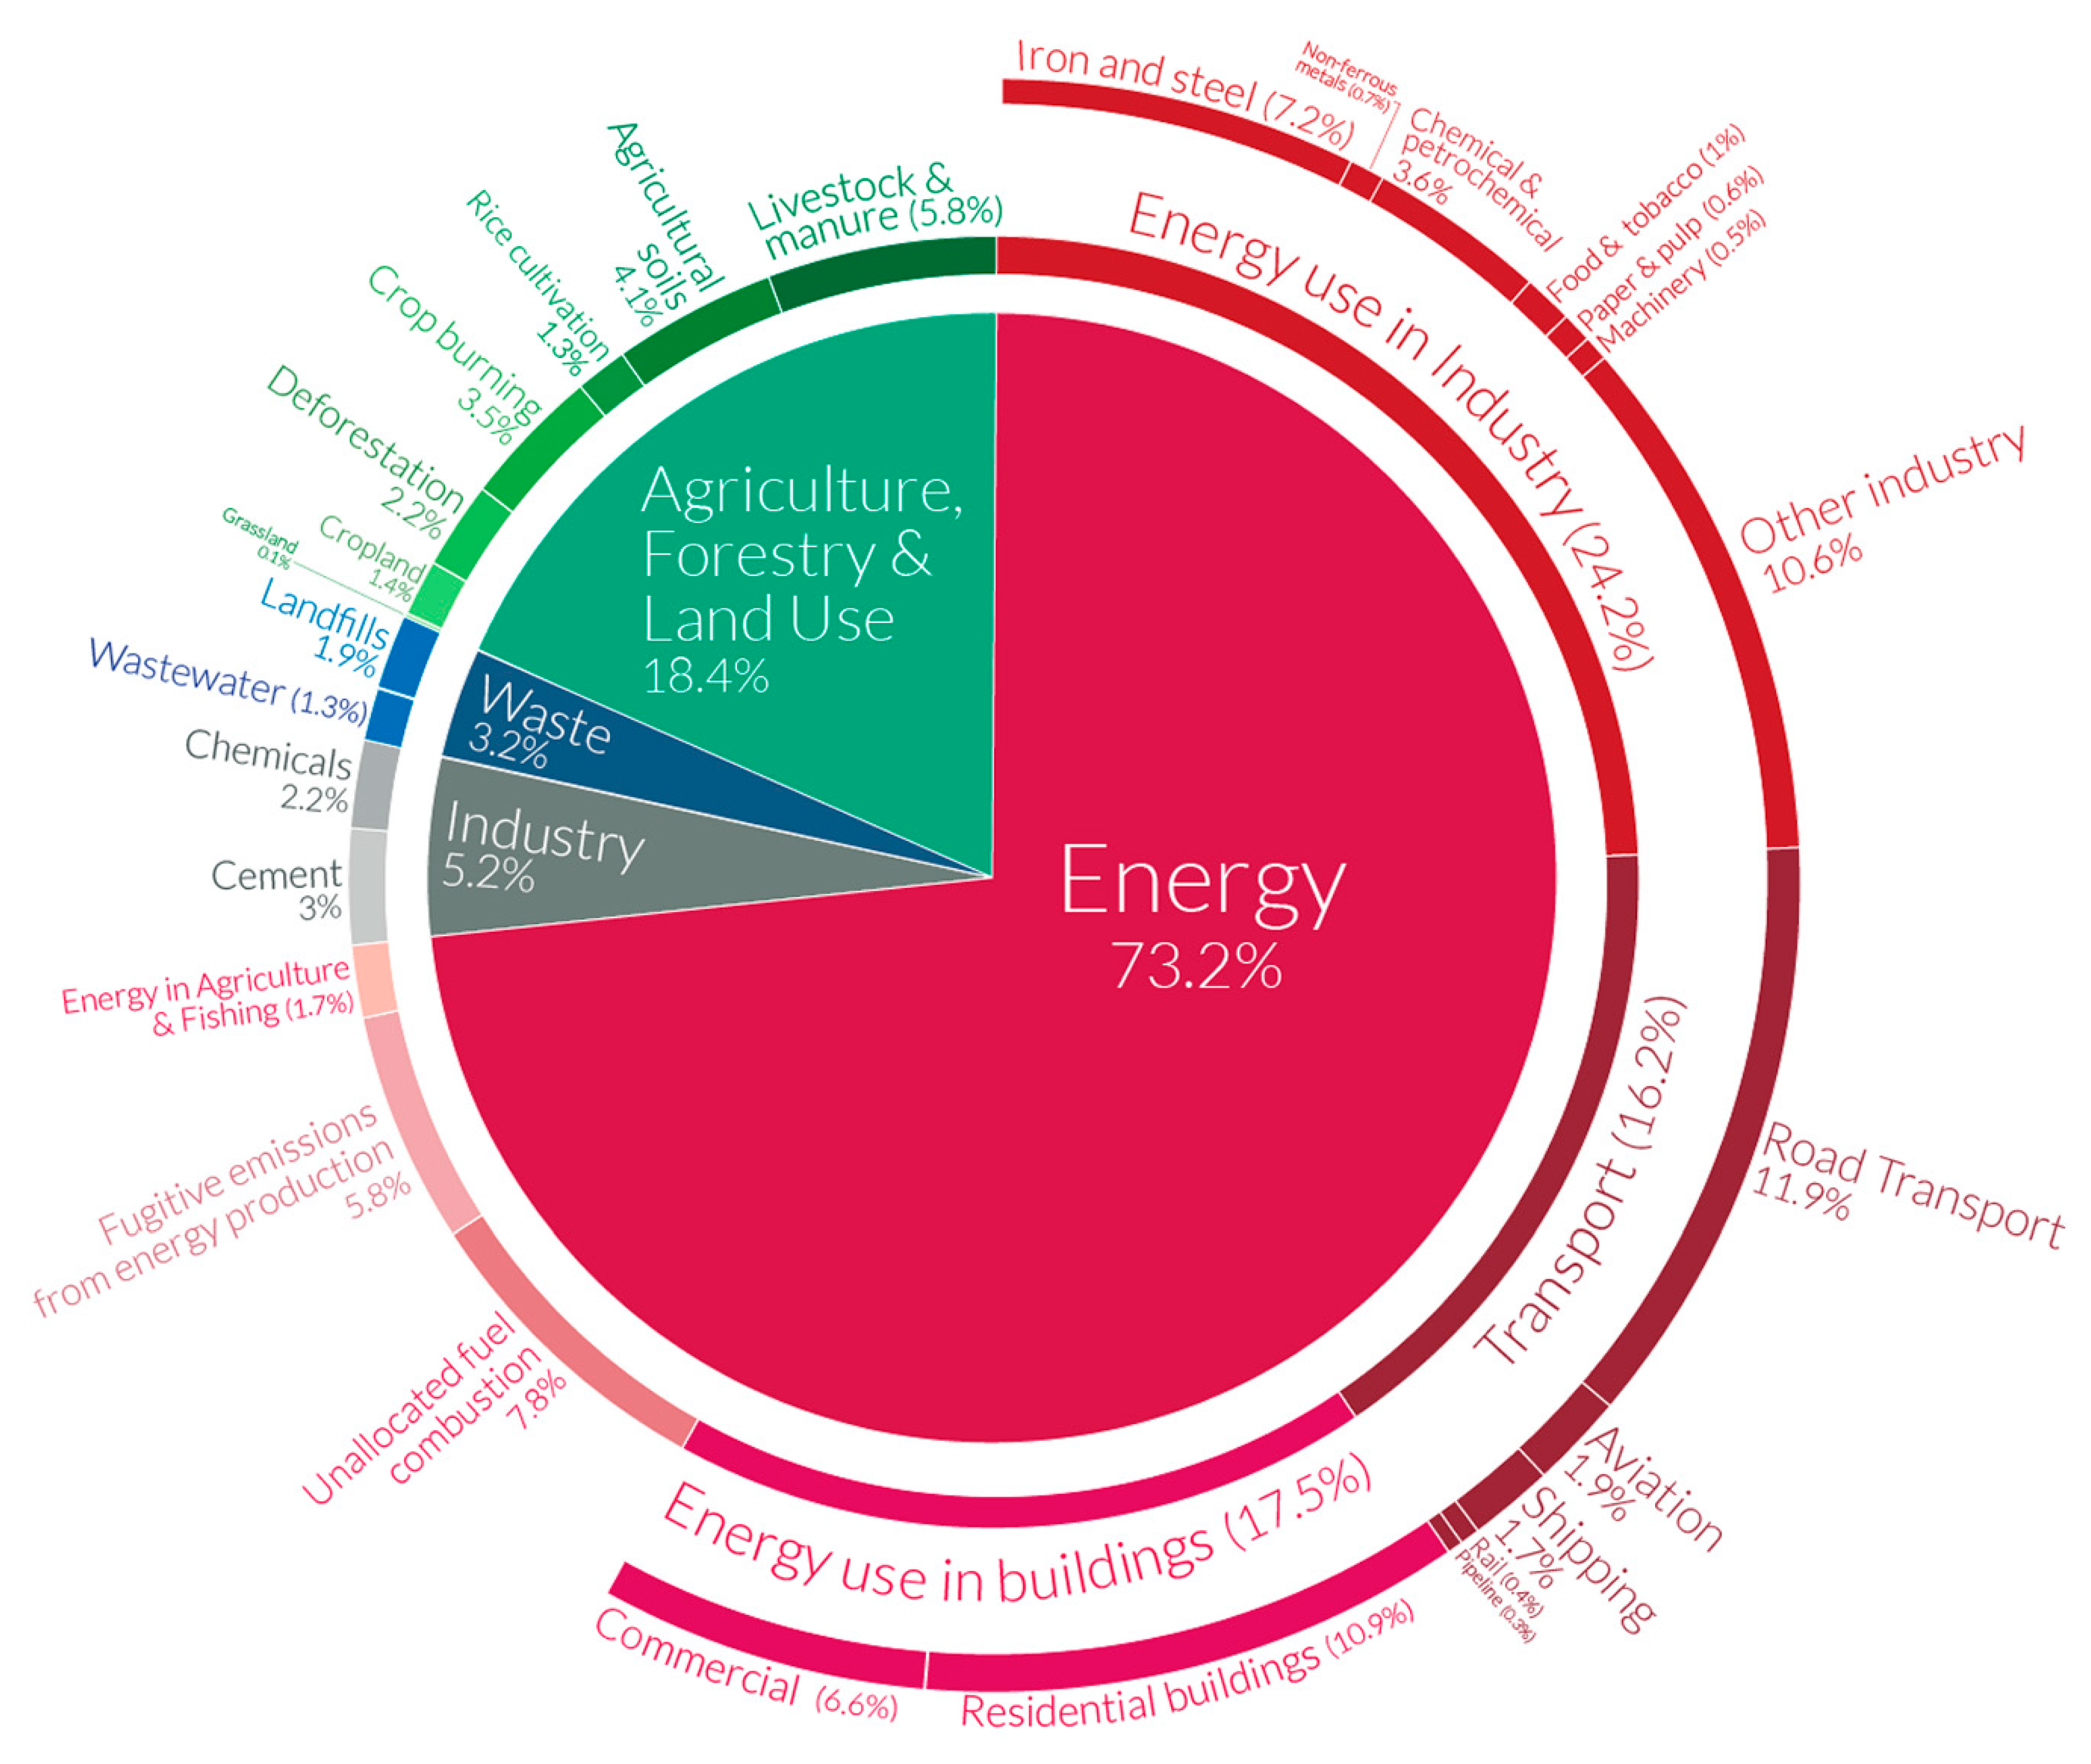
There is widespread acceptance that for Net Zero to be achievable, chemistry must by necessity play a major role [4]. Figure 1 [5] illustrates the scale of the challenge. In 2016, chemical manufacturing accounted for 5.8% of global greenhouse emissions. Transportation was 16.2 %, as transport is dominated by products from the petrochemical industry, this is also included here. Thus, in total, the chemical industry accounts for 22% of global greenhouse emissions (10.9 billion tonnes CO2 eq.). As more than 80% of chemical processes involve catalysis at some stage [4], it is apparent that catalysis, and the study of catalysts, will be an important component in the successful implementation of Net Zero. It should also be remembered that catalysis is involved in ~30% of GDP of an advanced nation [6], such as the UK, thus there is both a moral stick and a (very large) financial carrot in play.
Catalysis is such a broad church that there is no one method that is applicable in all circumstances. It is also complex, so most modern studies employ a combination of physical methods [7] (e.g., elemental analysis, surface area), imaging techniques (e.g., optical, electron, X-ray) and spectroscopy (e.g., infrared, Raman, NMR) to provide a picture of the composition (and how it changes with time) and, hopefully, mechanism. The list is not exhaustive, there are many other methods and techniques that are employed in particular circumstances. One of these is neutron scattering and this is the focus of this Perspective. Neutron methods are currently underused in studies of catalysis and catalysts. Here, we show how they are already being used to study reactions and processes that are directly relevant to achieving Net Zero and indicate some other areas that offer opportunities.
2. Neutron Scattering
The theory [8,9] and practice [10,11,12] of neutron scattering are well-documented. In this section we provide a brief introduction to neutron scattering and to the advantages and disadvantages of the techniques that are used.
The neutron is a neutral particle with a mass almost equal to that of a hydrogen atom (1H = 1.0079, 1n = 1.0087 amu). Neutrons are plentiful—they comprise ~50% of terrestrial matter—but are very strongly held: the binding energy per neutron varies from 2–8 MeV [13]. While there are radioactive sources that can be configured to emit neutrons, there are only two methods that generate sufficient quantities of neutrons for condensed matter studies: nuclear fission and spallation. Research reactors use fission of 235U to produce neutrons. Spallation sources impact a high energy (100′s of MeV, 1 eV = 8067 cm−1) proton beam onto a heavy metal target (W or Hg) to generate highly excited nuclear states that decay by evaporation of neutrons. The neutrons produced by either technique have ~2 MeV of energy, these are brought to useful (~1–1000 meV, i.e., a ~billion- to a million-fold reduction in energy) by multiple inelastic collisions (moderation) with a hydrogenous material. Reactors and spallation sources differ in two key aspects. Reactors are generally continuous sources, while spallation sources are generally pulsed sources, although there are exceptions in both cases. The second aspect is that neutrons from a research reactor are heavily moderated, so that the maximum available energy is ~100 meV (~800 cm−1). Spallation sources are deliberately under-moderated, so as to preserve some high neutrons and the full spectrum (1 meV to ~100 eV) of energy is available. A list of neutron sources around the world can be found at [14]. The pre-eminent reactor source is the Institut Laue Langevin (ILL, Grenoble, France) [15] and the leading spallation sources are the ISIS Neutron and Muon Source (Chilton, UK) [16], the Spallation Neutron Source (SNS, Oak Ridge, USA) [17] and the Japan Proton Accelerator Research Complex (J-PARC, Tokai, Japan) [18]. The next generation European Spallation Source (ESS, Lund, Sweden) is currently under construction and is scheduled to begin operations in 2023 [19].
Neutron scattering occurs between the neutron and an atomic nucleus, mediated by the nuclear strong force. As the nucleus is only 0.1% of the diameter of the atom, to a neutron, most of matter is empty space and consequently neutrons are highly penetrating, several centimetres of steel or aluminium are largely transparent. This simplifies cell design for catalyst samples.
As a neutron has mass, any scattering event always involves a change of momentum (Q, Å−1). Depending on whether the scattering is elastic or inelastic, there may also be a change in energy (ω, cm−1) of the neutron. The two types of scattering are complementary, in essence, they tell you ‘where atoms are’ (elastic) and ‘how they are moving’ (inelastic). The most familiar form of neutron scattering is probably neutron diffraction. This is carried out on both single crystals [20] and powders [21]; for studies of catalysts, the latter is more relevant. The neutron scattering cross section is both element and isotope dependent, it is not strictly related to the element’s atomic number as in X-ray scattering. For neutron diffraction of catalysts this has two major advantages: light atoms (e.g., H, Li, N, O) are observable in the presence of heavy atoms and adjacent elements in the periodic table can have different cross sections, so providing contrast. An area of elastic scattering that has seen much development recently is neutron imaging [22]. Again, this is analogous to X-ray imaging and the analysis methods, including tomographic reconstruction, are comparable. However, the ability to image hydrogenous materials makes neutron imaging unique.
Inelastic neutron scattering (INS) spans an energy transfer range equivalent to the microwave to the vacuum ultraviolet of the electromagnetic spectrum. The lowest energy range, ~±10 meV, is the region of quasielastic neutron scattering (QENS) [23]. This enables measurement of diffusion constants and activation energies at the atomic scale, i.e., without the complication of grain boundaries. Higher energies, 0–500 meV (0–4000 cm−1), correspond to the mid-infrared part of the spectrum and this is the region of neutron vibrational spectroscopy [12]. This probes the same phenomena as conventional infrared and Raman spectroscopy, but the properties of the neutron mean that modes involving displacement of hydrogen are emphasized. At the highest energies is neutron Compton scattering (deep inelastic scattering, DINS) that directly measures atomic momentum distributions [24].
The major disadvantage of neutron scattering is that, in comparison to X-ray sources, neutron sources are relatively weak, which means that the technique requires comparatively large samples. Thus, for powder diffraction 0.1–1.0 g is needed, for inelastic scattering 2–20 g may be required. Measurement times per sample are in the range minutes to hours.
Neutron sources are also scarce: [14] lists a total of ~50 worldwide, but only the ILL, ISIS, SNS and J-PARC offer a complete range of instruments for both elastic and inelastic scattering. The small number of sources is undoubtedly a major contributor to the under-use of neutron scattering for studies of catalysts. To encourage their use, all the major facilities operate with a “free-at-the-point-of-use” system, i.e., investigators that are awarded beam time (usually by a competitive proposal system) do not pay for the beam time. Most facilities will also cover travel, accommodation and provide a contribution to sample preparation costs for users from the country hosting the source and affiliated partners.
3. The Opportunities
Catalysis comes in many forms: heterogeneous [25], homogeneous [26], enzymatic [27] and electrocatalysis [28] to name but a few. In this Perspective, we will only be considering heterogeneous catalysis and within that area, specifically gas (or vapour) solid interactions. Much of catalysis is the directed movement of hydrogen atoms from one molecule to another, as neutrons excel at ‘seeing’ hydrogen, neutron scattering clearly has a role to play. In the following sub-sections, we consider a range of industrially important processes and reactants where neutron scattering is already being used and possible further developments.
3.1. Hydrogen
All of the chemical processes carried out at the largest scale (ammonia production, methanol synthesis, hydrocracking) all require hydrogen as a reactant. This is problematic: almost all of the H2 currently produced is via the steam reforming of methane (SMR), Equation (1). This requires high temperature (>800 °C) and pressure (10–40 bar), and thus requires significant energy input and, to add insult to injury, the reaction also produces CO2. There are attempts to make “blue” H2 by including CO2 capture in the process, but current methods are very energy intensive [29]. The only truly “green” way to make H2 is by water splitting, with the energy required generated by renewables or nuclear power. There are demonstration systems that use the reaction between a high temperature metal salt and water [30], but the most obvious way to generate H2 is by electrolysis of water [31]. Unfortunately, current electrolysers are not very efficient [32]. Thus, H2 production offers two huge opportunities: (i) to improve the electrolysers and (ii) to make SMR “greener” by understanding the process and hence making it more efficient and also by developing much better methods of CO2 capture or application. The first of these is perhaps more an electrochemistry and materials science challenge than a catalysis one, but the second is certainly within the heterogeneous catalysis remit.
3.2. Methane Reforming
Methane reforming comes in two forms, depending on whether water (steam reforming, Equation (1)) or CO2 (Equation (2)) is used as the oxidant. The CO2 emissions result from the need to run the reaction at high temperature and pressure (14–40 bar with outlet temperatures in the range 815 to 925 °C [33]) because the reaction is highly endothermic. It is also common practice to include the water gas shift reaction (WGSR, Equation (3)) to increase the H2 content, but this comes at the cost of additional CO2.
CH4 + H2O → CO + 3H2
CH4 + CO2 → 2CO + 2H2
H2O + CO → CO2 + H2
Both SMR and dry reforming use nickel supported on alumina catalysts. As the reaction proceeds, carbon progressively builds-up on the surface and this is the major cause of deactivation. The nature of this overlayer is poorly understood and it is not clear whether it may have a role in the catalysis by influencing how the reactants reach the active sites and the products depart.
SMR has not been extensively investigated by neutron scattering, the only report [34] used INS to examine the catalyst. The major reason for the scarcity of work, is that sample preparation is extremely demanding requiring a complex arrangement to generate steam at the high temperature required for reaction and a special quartz reactor (because steam is so corrosive).
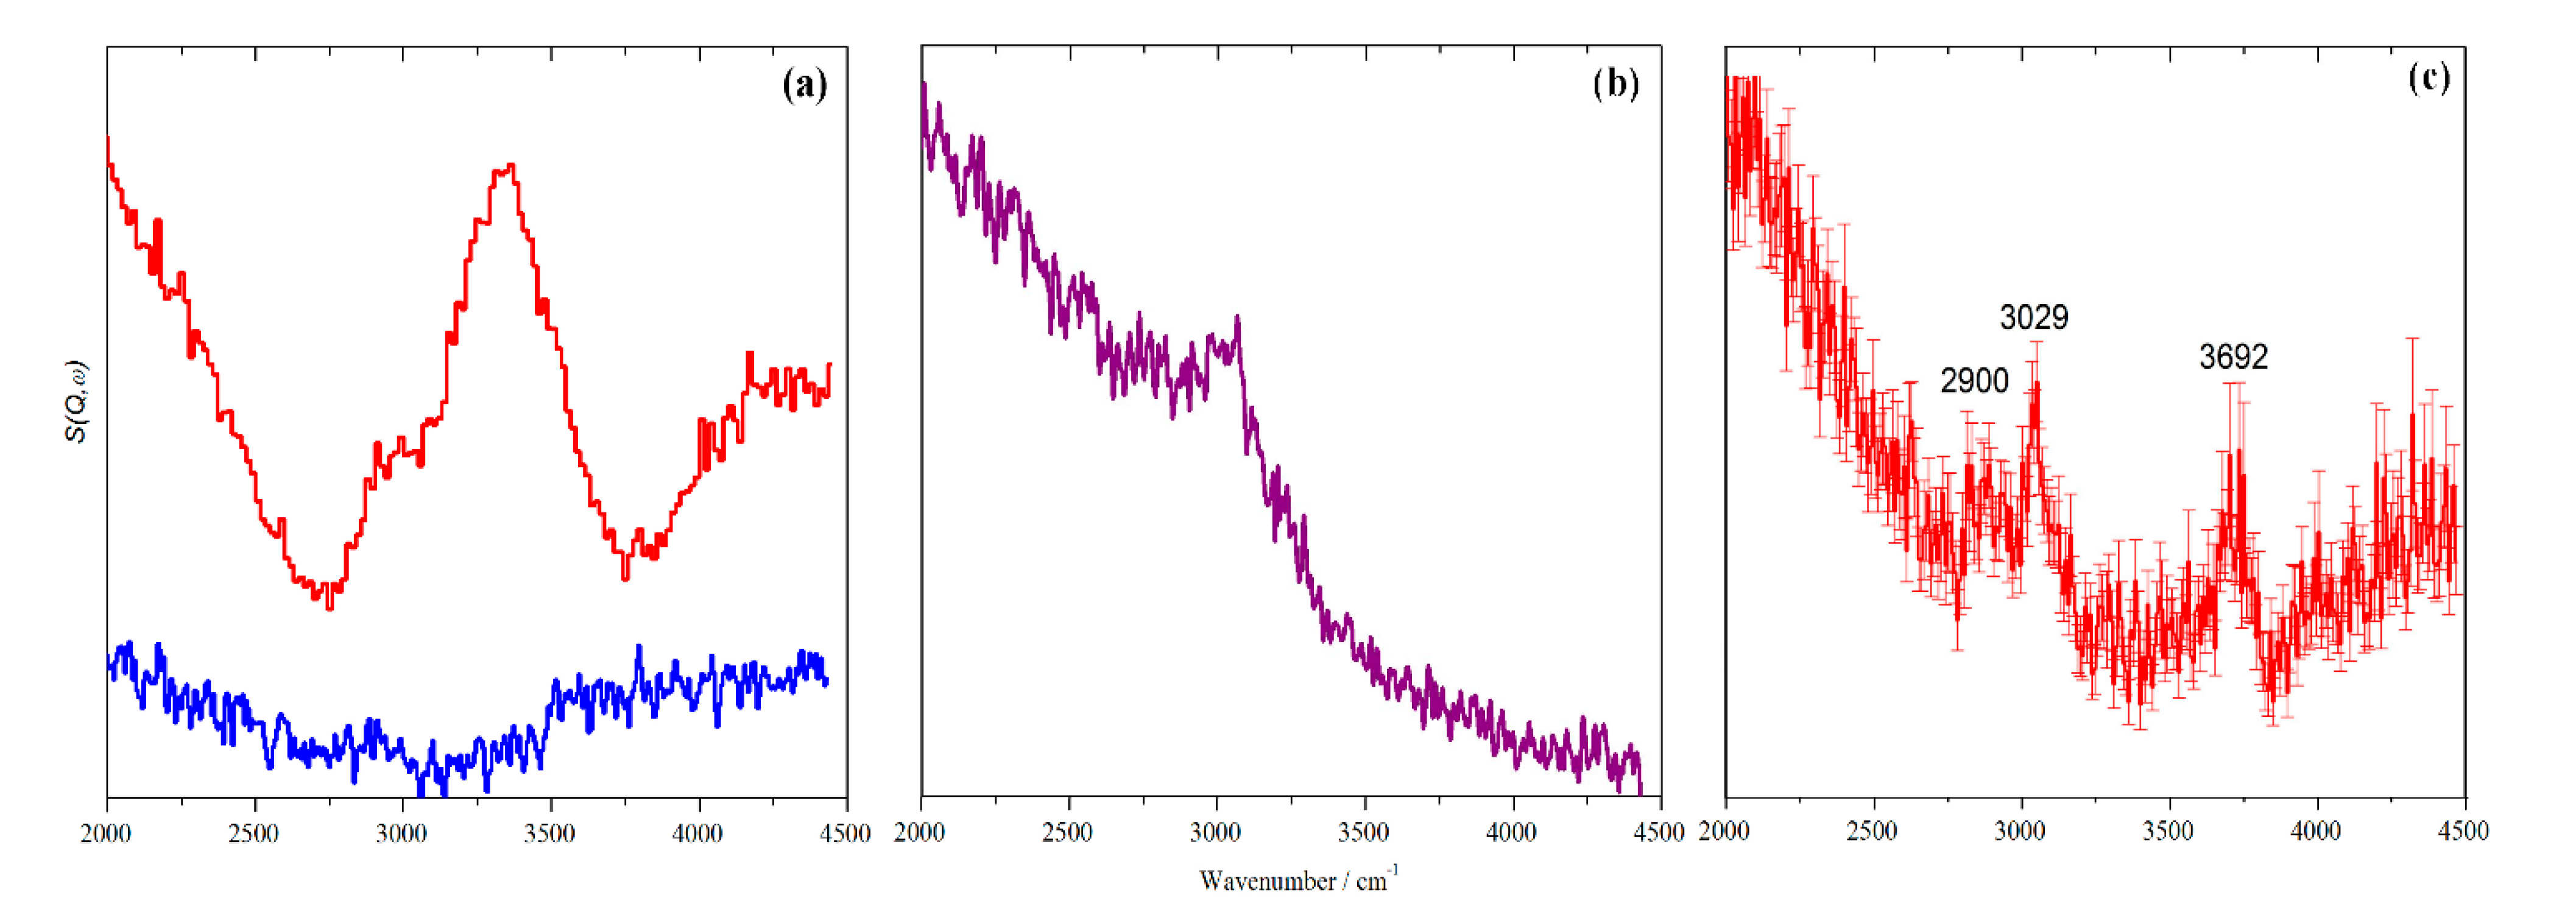
In contrast, dry reforming has been studied extensively [35,36,37,38,39] by INS. There are two main reasons for this: experimentally it is much easier to prepare samples [40] and the prospect of a process that uses CO2 is very enticing. Figure 2 shows a comparison of the spectra in the C–H stretch region. Figure 2a,b show the results of dry reforming, the only difference is that the α-Al2O3 support was different in both cases while (c) is the result of SMR using the same catalyst as (b). It can be seen that the hydrocarbonaceous layer that is generated is different in all three cases. It is important to note that the catalyst was still functioning in all three cases when the reaction was stopped. One outcome that has been used extensively is that it is possible to quantify the amount of hydrogen that is present on the catalyst from the INS spectra. In combination with temperature programmed oxidation (TPO), that provides the carbon content, it is possible to determine the C:H ratio. It is found to be 160:1 for (a), 2550:1 for (b) and 11689:1 for (c). This demonstrates that the catalyst is highly efficient at cycling hydrogen but much less so at cycling carbon. The work also shows that the carbon formation, and hence the catalyst lifetime, is very dependent on the reaction conditions. Thus, the INS spectra provide a novel way to investigate catalyst deactivation, which could be usefully employed further in the SMR reaction but clearly has applications in other processes where deactivation occurs by coke formation.
3.3. Ammonia
One area that green H2 would have a massive impact on, is ammonia production. This is largest quantity commodity chemical produced and the process accounts for several per cent of global CO2 emissions [5]. Ammonia has potential as a fuel, as the products of total combustion are water and N2. An economical alternative to the Haber–Bosch process for ammonia production is a long-sought target.
The commercial process is typically conducted 773 K and pressures around 200 bar, resulting in ammonia concentrations in the exhaust gas of up to 18 vol.% [41]. The catalyst developed by Bosch is magnetite (Fe3O4) promoted by fusing with irreducible oxides (K2O, Al2O3, CaO) in an oxide melt. The fused material is mechanically granulated and carefully reduced to give the active α-Fe catalyst used industrially.
Neutron powder diffraction has been used [42,43] to investigate the phases present in situ. The reaction was carried out using an N2/D2 (1:3) feed (D2 was used to reduce the incoherent background) on a real catalyst (supplied by BASF) in a tubular fixed-bed reactor made of a nickel alloy at 698 K and 75 bar, somewhat below the industrial conditions. Neutron diffraction was used because it is sensitive to light elements and under the reaction conditions, iron nitrides are expected to form. An additional advantage is that neutrons are highly penetrating, simplifying cell design [42]. Surprisingly, nitrides were not observed but the α-Fe peaks were anisotropically broadened compared to those of a reference iron sample, probably as a result of defects. It seems likely that the unexpected stability of the α-Fe phase in the catalyst is related to these microstructural effects.
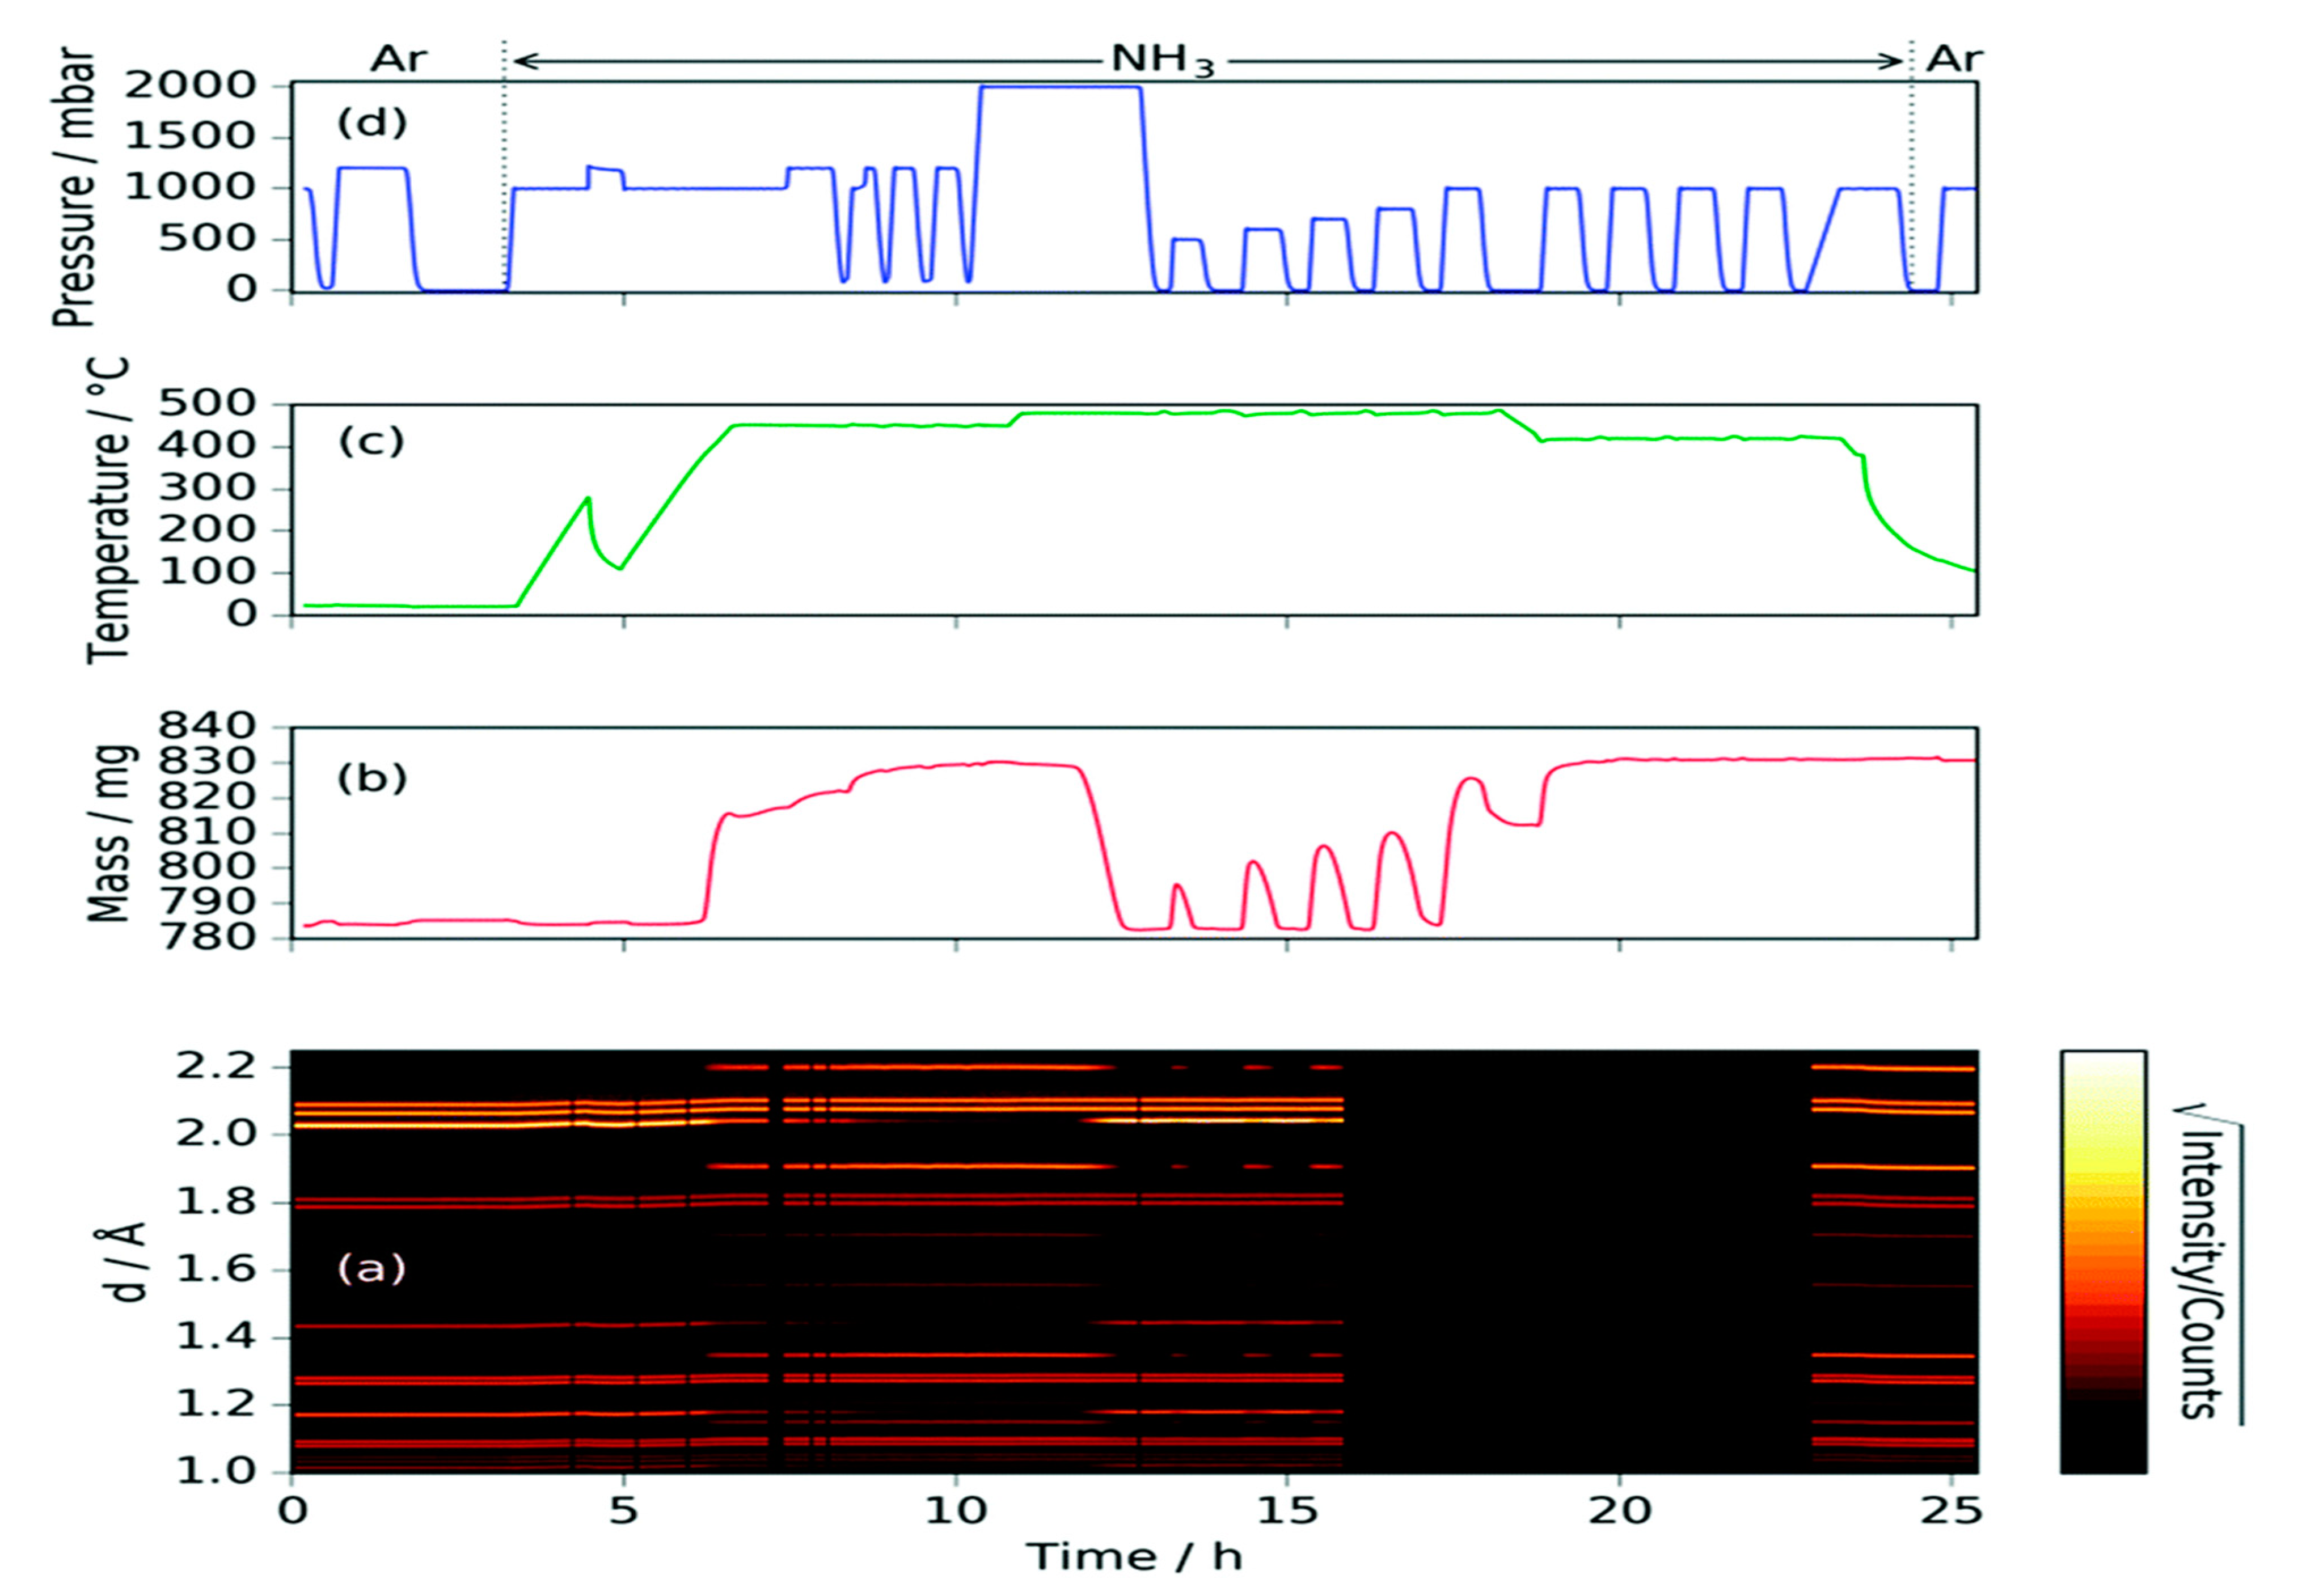
The reverse reaction, ammonia decomposition, is also of interest because of the possible use of ammonia as a fuel and, in particular, as a hydrogen storage material. Iron powder was heated under ammonia to >400 °C, above which ammonia decomposition occurs [44]. Neutron diffraction and gravimetric data were collected simultaneously and correlated. The use of neutron diffraction allowed the parallel reactions of ammonia decomposition and iron nitriding/denitriding to be studied under static conditions (where the approximate gas composition can be determined from the strong incoherent neutron scattering of hydrogen) in order to determine the conditions under which the catalyst is iron or some form of iron nitride. Figure 3 shows the results.
The gravimetric analysis agrees well with the Rietveld analysis of the neutron diffraction data, both of which confirm that the form of the iron catalyst (metal or nitride) is strongly dependent on the ammonia decomposition conditions. The use of NH3, rather than ND3, (which would normally be used for powder neutron diffraction) meant that the incoherent scattering of the hydrogen within the gases present in the reaction chamber could be correlated to how much ammonia had decomposed.
For both the ammonia synthesis and decomposition reactions, neutron diffraction has much to offer as it is sensitive to the light atoms that must be present (H, N) and reaction vessel design is relatively straightforward.
3.4. Fischer–Tropsch Synthesis
While there is a massive push to change transport from being powered by fossil fuels to running on electricity, there can be little doubt that some forms of transport will be using hydrocarbon fuel for decades to come: aviation and large trucks being likely examples. To run these modes of transport requires a greener source of fuel and Fischer–Tropsch synthesis (FTS) can provide this [45]. The process is the reaction of CO and H2 (syngas) to produce sulfur-free diesel, Equation (4). CO can be generated from biomass and with green H2 the process is relatively benign. An exciting recent development is a modification of the process that produces significant amounts of olefins (FTO) [46], Equation (5). FTO requires the use of iron.
nCO + (2n + 1)H2 → CnH2n+2 + nH2O
nCO + 2nH2 → CnH2n + nH2O
Historically, unsupported iron-based catalysts have been used for the Fischer–Tropsch process and these have been extensively studied since the process was commercialised in the 1920′s [47]. More recently, supported cobalt catalysts have come to the fore as they are less active for the WGSR (Equation (3)) and are well-suited to syngas derived from SMR (Equation (1)).
A technical-grade iron-based Fischer–Tropsch catalyst [48] was taken from the Secunda coal-to-liquids plant (Sasol Ltd., South Africa) whilst the reactor was operating under steady-state conditions. On removal from the reactor, the catalyst retained significant quantities of hydrocarbon product, which compromises analysis. The solid catalyst was Soxhlet extracted in toluene for 24 h, which is expected to extract all hydrocarbon products formed as part of the Fischer–Tropsch process. Figure 3 shows the INS spectrum.
As with methane reforming, it is apparent that under reaction conditions, a hydrocarbonaceous overlayer forms. This has a surprisingly well-defined spectrum, suggesting that it is more molecular-like than amorphous carbon-like. A comparison is shown with the INS spectrum calculated (blue trace) by density functional theory (DFT) for the model fragment shown in the inset. This was chosen so as to have a 1:1 ratio of sp2:sp3 C–H bonds, which can be deduced from the spectrum measured in the C–H stretch region using another instrument. This illustrates two major advantages of INS spectroscopy for catalyst studies: (i) relative band intensities are directly related to concentration and (ii) that generation of a synthetic spectrum is straightforward from ab initio calculations.
The aim of an iron-based FTS plant is to produce long chain hydrocarbons, i.e., wax that can be hydrocracked to diesel. However, in a working catalyst, this coats the catalyst and for any neutron scattering study, the wax would completely swamp any signal from the catalyst, hence the need to Soxhlet extract the sample used for Figure 4. For commercial plants, typical reaction conditions are either 200–250 °C or 320–350 °C, both at ~20 bar pressure. The pressure is essential for polymerisation of the CH2 intermediates. Running the same reaction at 1 bar results in only methane formation, so all the products are gaseous, but the catalyst is the same in both cases. This model reaction has been used for extensive studies of iron-based catalysts for both FTS [49,50,51,52,53] and FTO [54,55,56].
The INS studies reported in [48,49,50,51,52,53,54,55,56] all concern iron-based catalysts and there is clearly more that could be done, particularly regarding the effect of the additives that direct FTS to FTO. The cobalt-based systems have not been investigated by neutron scattering, apart from a study that aimed to characterise the states of adsorbed hydrogen on a range of cobalt catalysts [57]. These are more challenging systems because the cobalt is only present as 10–30 wt.% on an oxidic (e.g., Al2O3, SiO2, ZnO or TiO2) support [45]. Nonetheless, the current generation of INS spectrometers are 10–100 times more sensitive than those of only 10 years ago and such systems are now tractable.
The state of the catalyst under reaction conditions is controversial for both the iron and cobalt-based systems. For iron, the working catalyst comprises a complex mixture of iron (α-Fe), magnetite (Fe3O4), iron carbides (Hägg carbide (χ-Fe5C2), cementite (θ-Fe3C) and the hydrocarbonaceous overlayer [45]. For cobalt, the presence, or not, of carbides and whether the metal is present as the hcp or fcc polymorph is controversial. For both iron and cobalt, most of the species have a light atom in the presence of a heavy atom. This makes X-ray diffraction difficult because the scattered intensity is dominated by the heavy atoms. In contrast, neutron diffraction is almost equally sensitive to Co (8.78 barn), Fe (11.22 barn), C (5.52 barn) and O (4.23 barn) (coherent scattering cross section in brackets, 1 barn = 10−28 m2), thus phase identification is easier and more certain. With the added bonus of relatively straightforward cell design, neutron diffraction has much to offer for operando studies of Fischer–Tropsch catalysts.
3.5. Methanol
An alternative use of syngas (with added CO2) is to make methanol. Methanol is one of the world’s largest commodity chemicals: in 2020 global methanol production was estimated to be in excess of 100,000,000 t and demand is growing at ~5% pa [58].
Methanol synthesis employs a Cu/ZnO/Al2O3 catalyst and is typically carried out at 50 bar and 523 K. The generally accepted mechanism [59] is that CO2 is adsorbed as formate, which is then sequentially hydrogenated to adsorbed methoxy, which then desorbs as methanol. Depending on the reaction conditions, CO may be oxidized to CO2 or hydrogenated itself. However, there are still unresolved questions as to the nature of the active catalyst and the details of the mechanism.
To gain insight into the structure of the active catalyst, small angle neutron scattering (SANS) [60,61] and neutron powder diffraction [62,63,64] were utilised and to observe surface species, INS has been used [65,66]. SANS is surprisingly rarely used for catalyst studies, even though supported metal particles are typically in the 2–20 nm range, which is well-suited to SANS. In this instance SANS and neutron powder diffraction of a model Zn0.92Cu0.08O catalyst showed that on annealing in hydrogen, metallic copper precipitates on the surface of distorted ZnO crystallites. Operando neutron powder diffraction of the working catalyst showed that the Cu nanoparticles are unexpectedly stable under the reaction conditions.
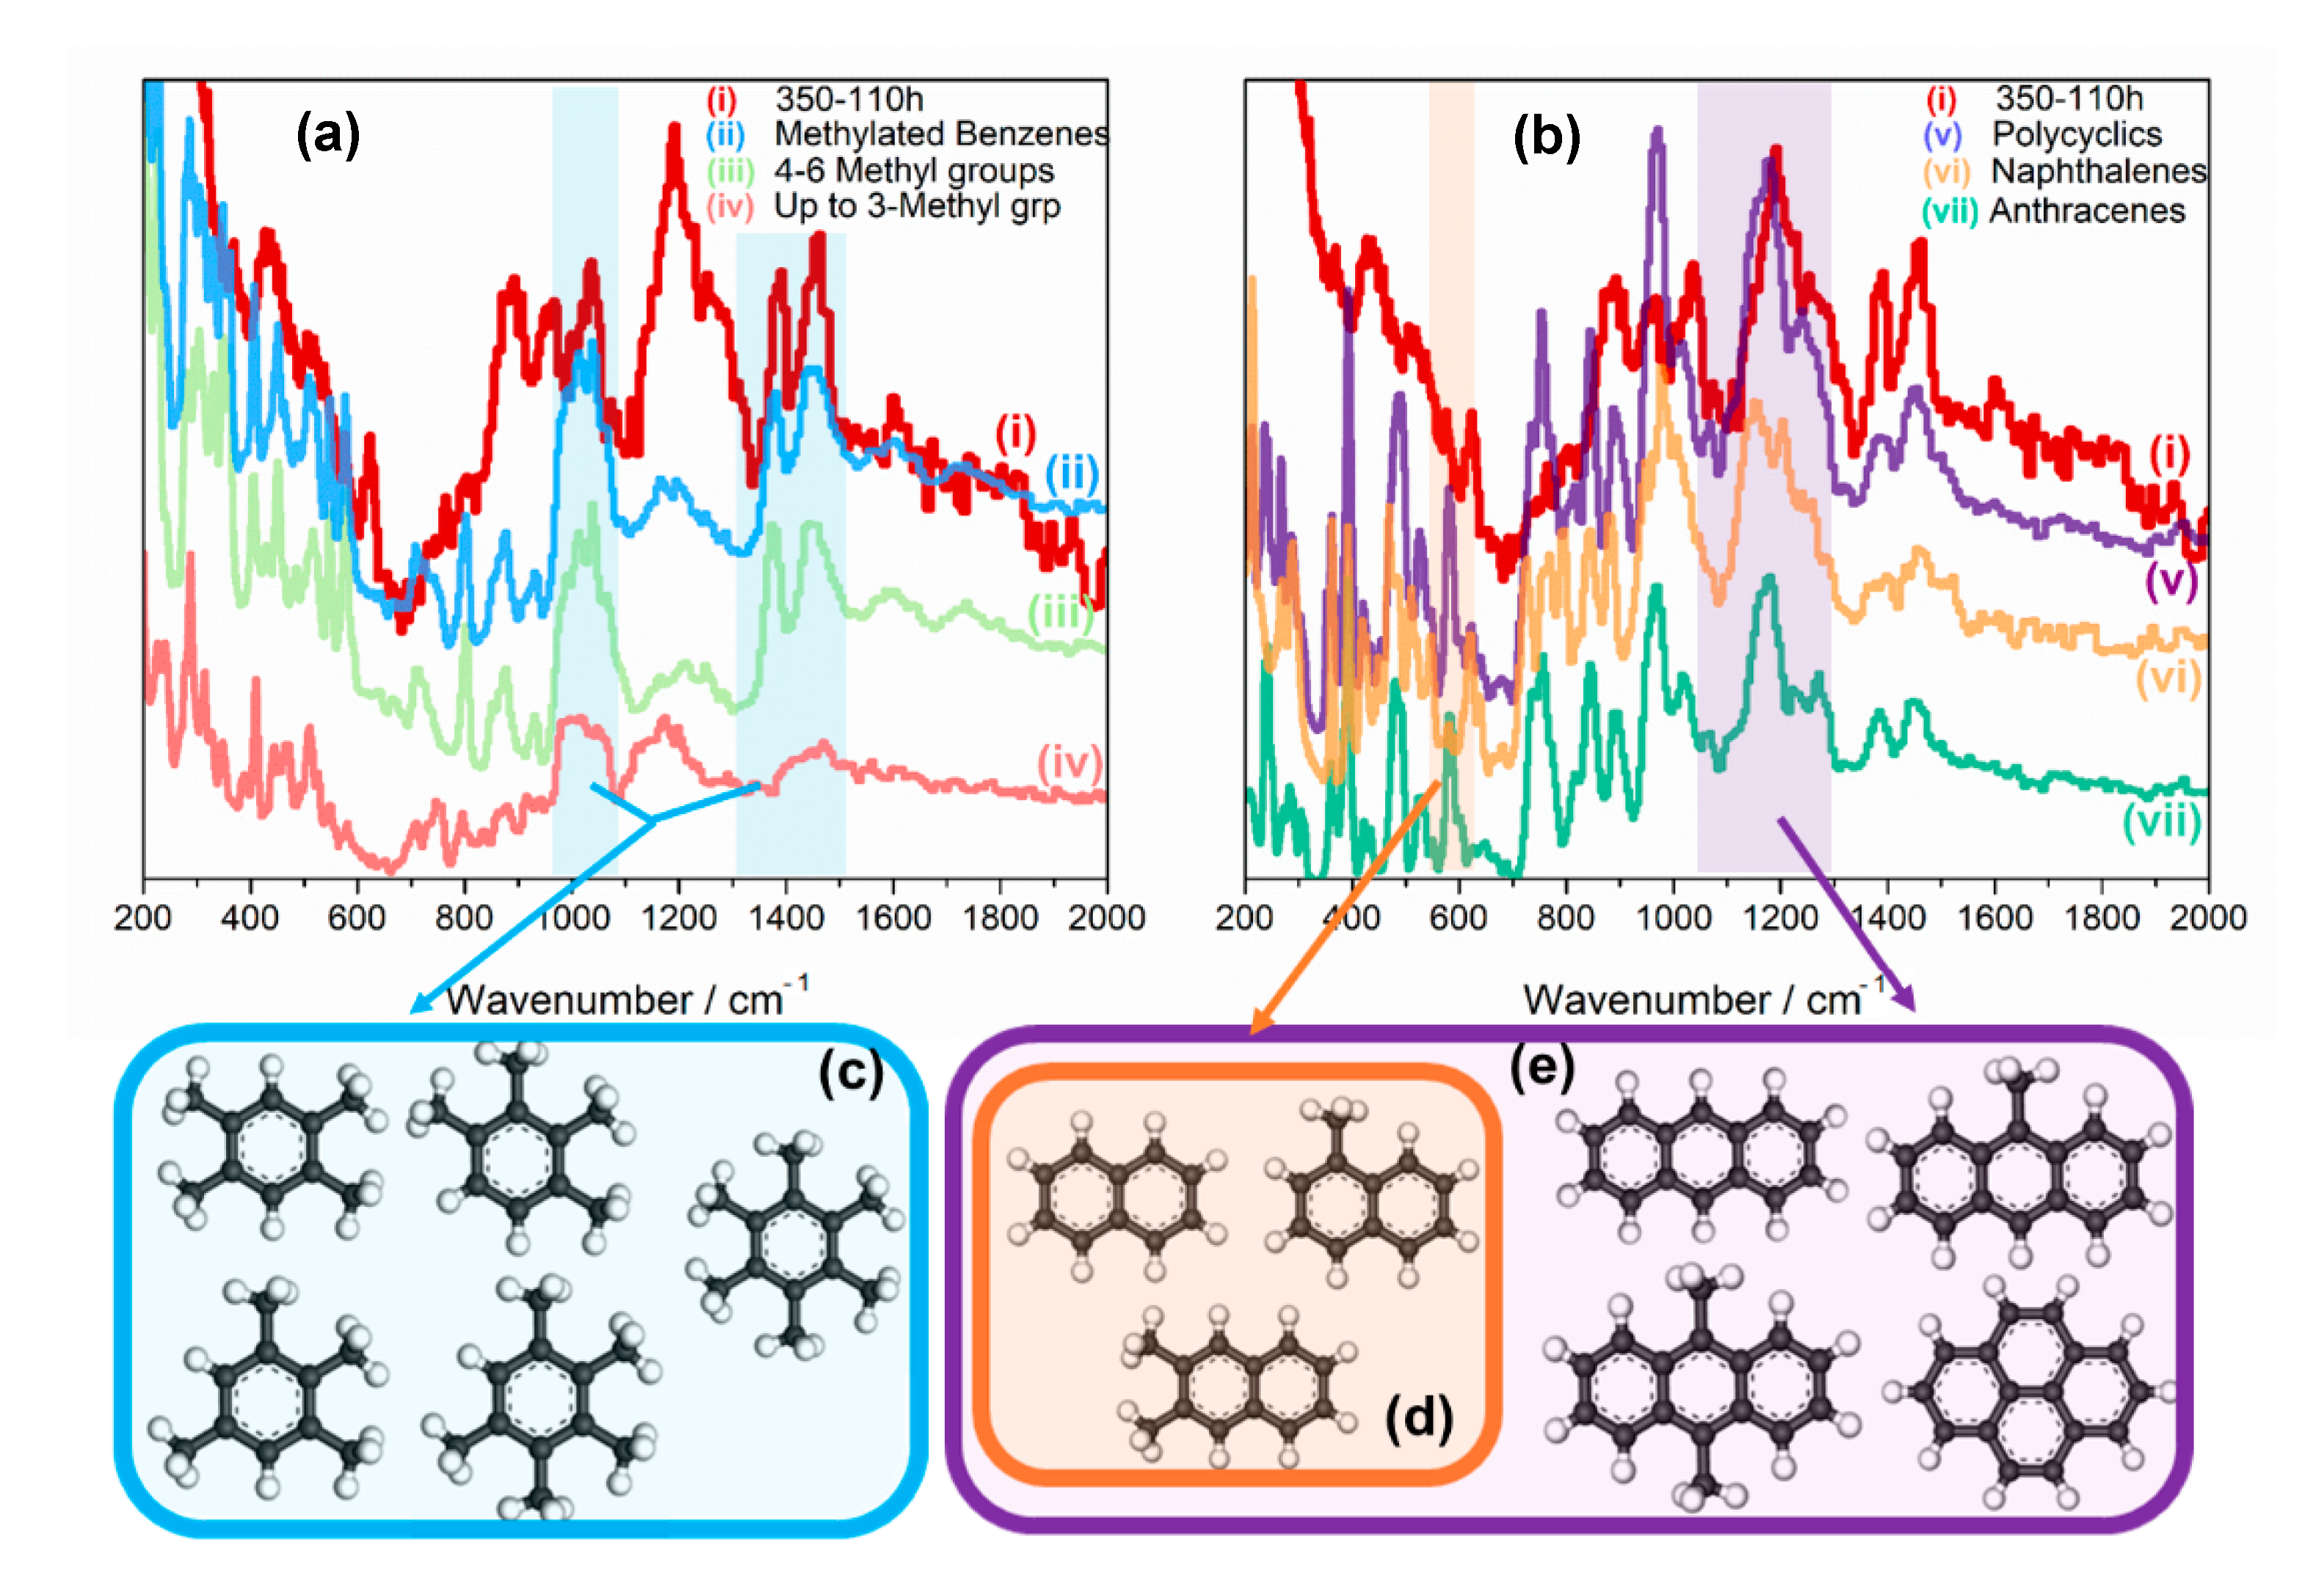
Methanol is readily upgraded to a mixture of light olefins and aromatics [67] (methanol-to-hydrocarbons, MTH). The balance between the type of product can be adjusted by the choice of catalyst and reaction conditions, so this process provides platform chemicals and fuel [68,69]. The reaction over H-ZSM-5 has been extensively studied by INS [70,71,72,73,74]. The advantage of INS for studies of microporous (zeolites, aluminophosphates (ALPOs), siliconaluminophosphates (SAPOs)) and mesoporous (MCM-41 type) materials is that they are almost completely transparent across the entire 0–4000 cm−1 range (the incoherent scattering cross section’s of Al, Si, P, O are all <5 barn). This means that the hydrocarbonaceous (incoherent scattering cross section of 1H = 80.2 barn) species of interest are, largely, the only contributors to the spectra. In contrast, infrared spectroscopy struggles (at best) to observe the diagnostic 0–2000 cm−1 range because of intense absorption by the framework modes of the material. Figure 5 (red trace in (a) and (b)) shows what has been dubbed as the “vibrational fingerprint of the hydrocarbon pool” because this is found under a wide range of operating conditions [73] and feedstocks (methanol [70,71,73], dimethyl ether [75], methyl acetate [76]). By comparison to a library [77] of compounds that may be present in the working catalyst, the features are assigned as shown.
Microporous materials are ubiquitous as catalysts. They are used for fluidised catalytic cracking, in diesel engine exhaust systems, for gas separation and as catalyst supports. The methodology that has been developed to study the MTH process is equally applicable to these different systems and processes.
3.6. Biomass
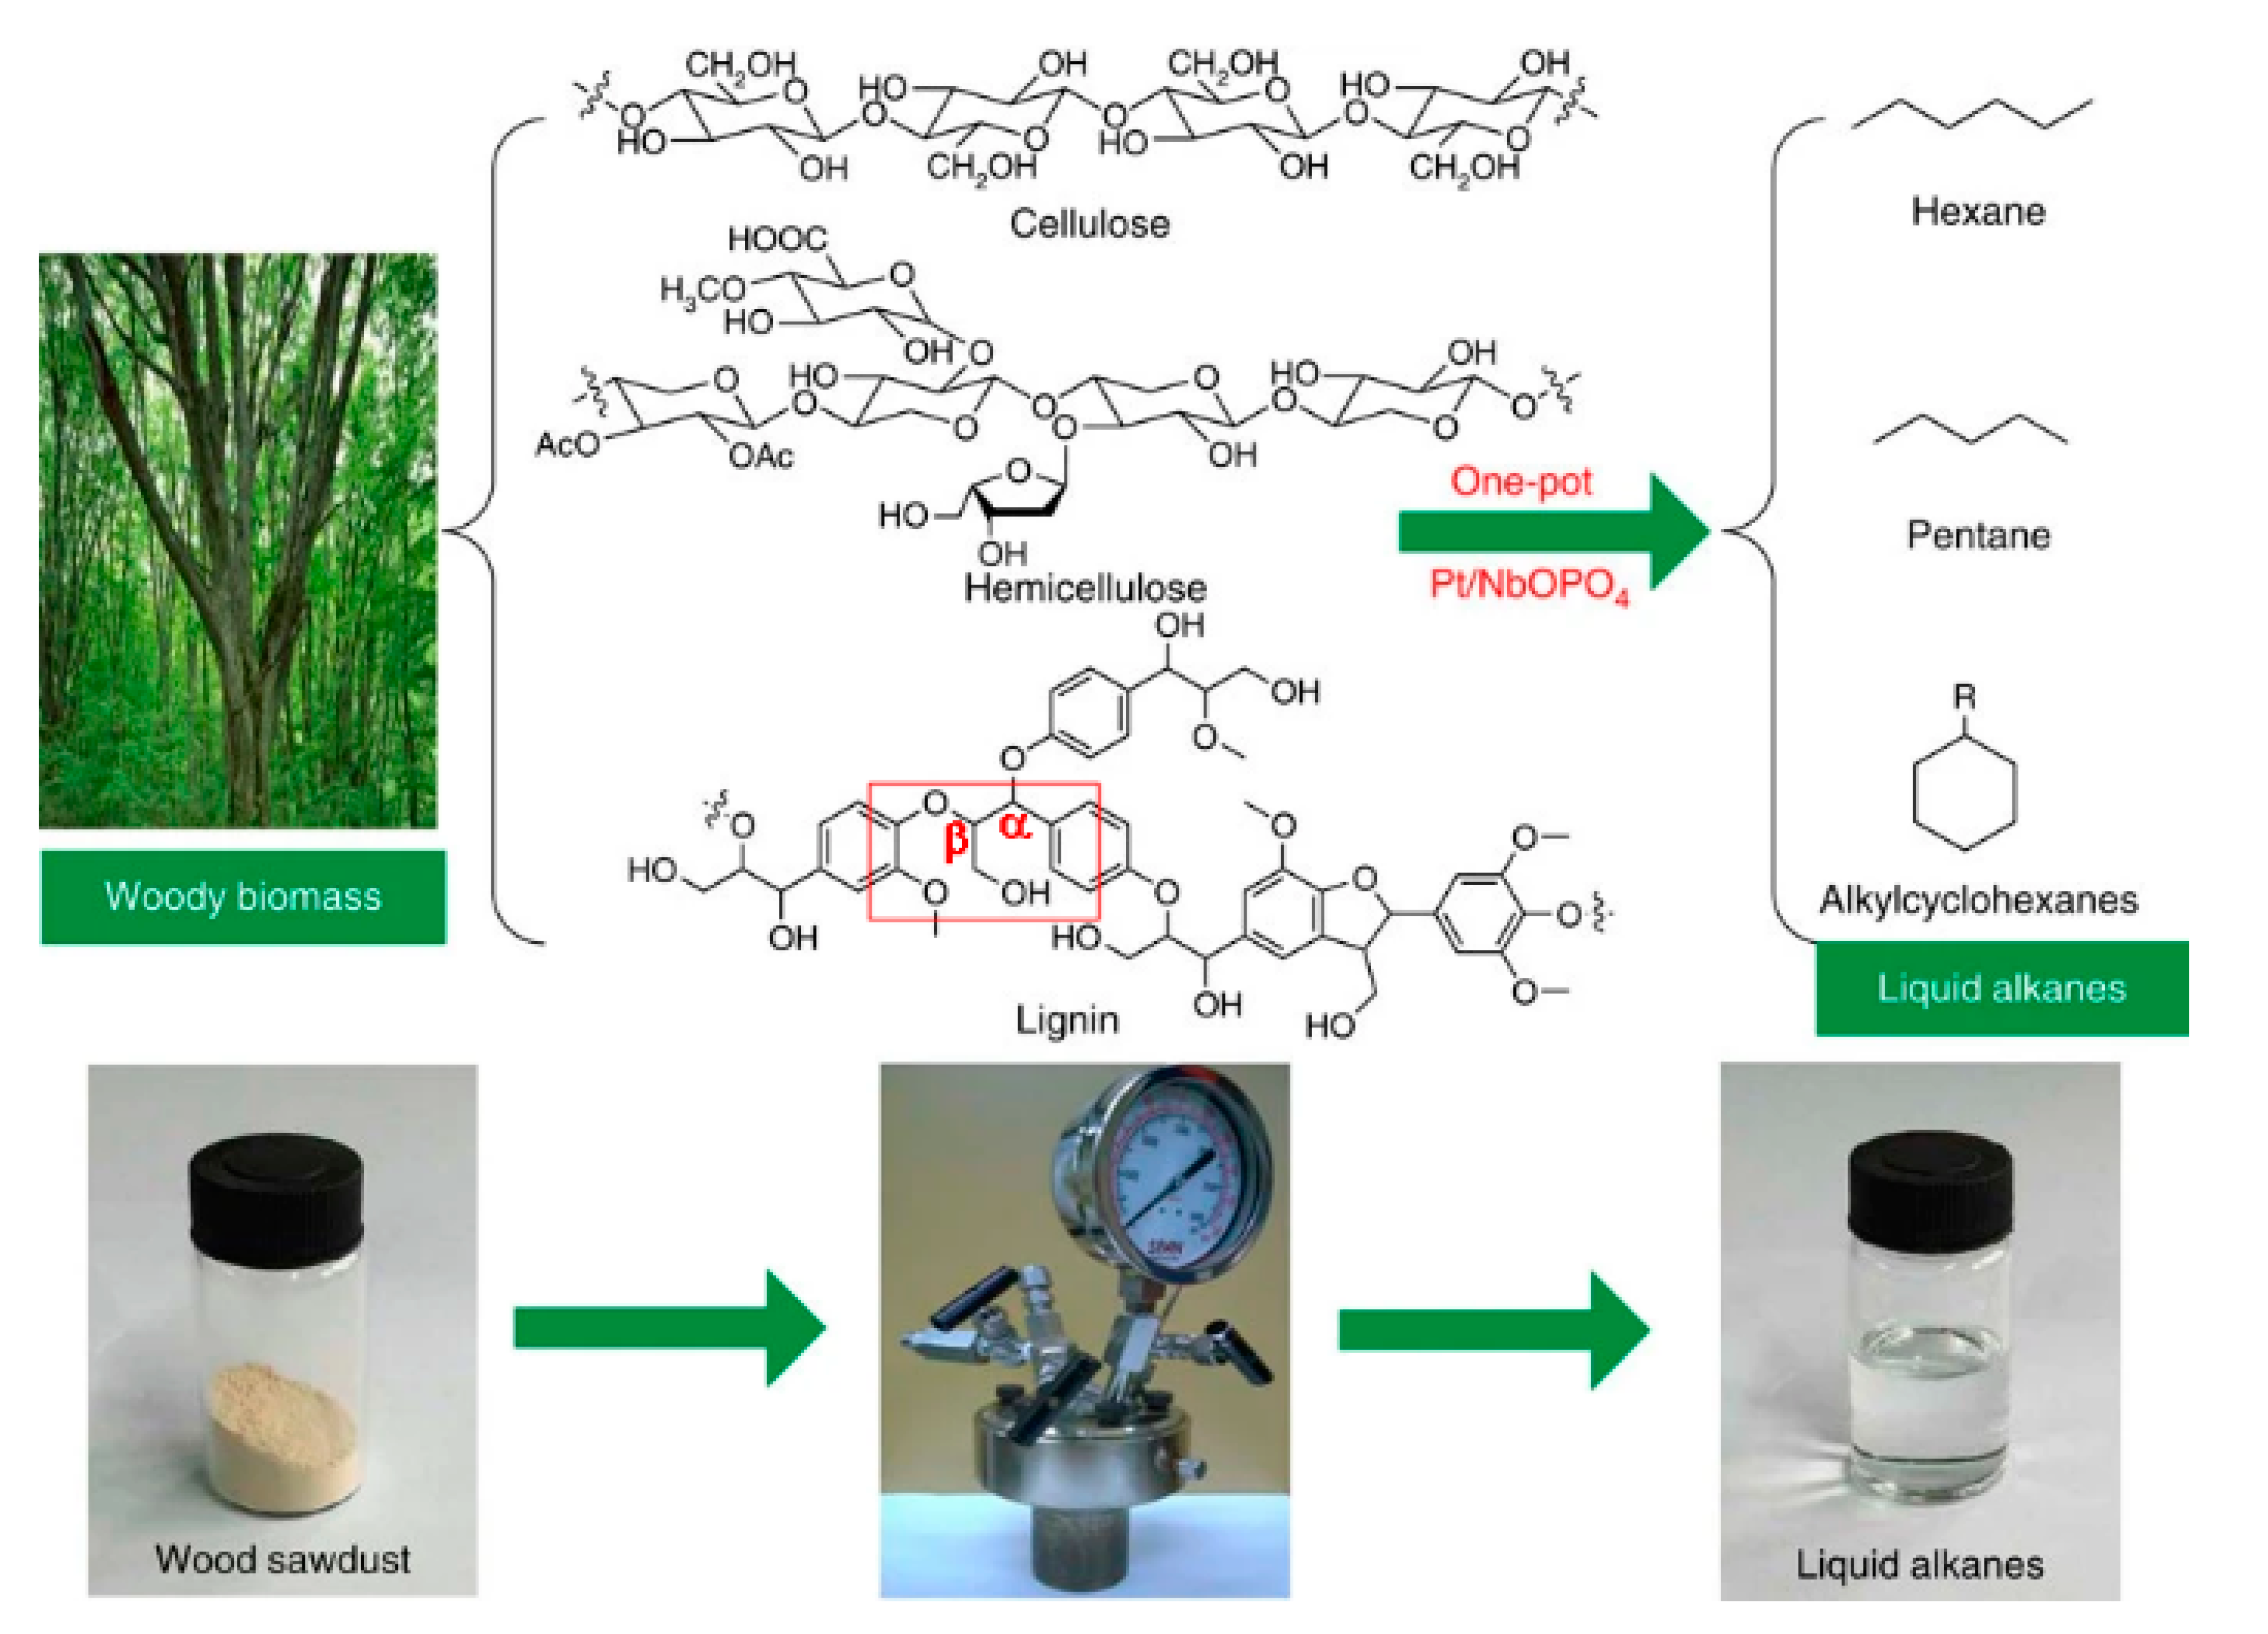
The chemical industry is organised around a supply of platform molecules (e.g., ethene, propene, butenes, benzene) that are almost exclusively derived from crude oil. The investment in infrastructure is so vast, that this can only change on a decades-long scale. However, by keeping the same processes (i.e., chemical plant) but by producing the platform chemicals from biomass, the carbon footprint would be cut enormously. This is an area of major activity and one that will only continue to grow. Catalysis is absolutely central here: as can be seen in Figure 6 [78], the main constituents of biomass (cellulose, hemicellulose and lignin) consist of highly oxygenated, cross-linked polymers; cleaving the polymers to industrially useful C2–C6 molecules and deoxygenating them can only be done catalytically.
Cellulose and hemicellulose are relatively easy to process, but one of the most abundant, but most recalcitrant, forms of biomass is lignin. This constitutes ~30 wt.% of plant material, but it is most often used as fuel. A rare example of a catalytic system that is able to process all the constituents of woody biomass to useful chemicals is Pt/NbOPO4 [78]. This is capable of processing a wide range hard and softwoods under fairly mild conditions (190 °C, 5 MPa H2 for 20 h). INS spectroscopy played a key role in understanding the mechanism of the process.
Lignin valorisation is a key target for biomass utilisation. The β-O-4 linkage (red rectangle in Figure 6) constitutes 48−60% of the total interunit linkages in lignin, as such, it is a key target for depolymerisation of lignin. Guaiacol (2-methoxyphenol) is a commonly used model compound for this link and its hydrodeoxygenation has been investigated by INS and QENS spectroscopies [79]. Pillared clay-supported NiMo catalysts were used, because bentonite clays are an abundant natural resource. The catalysts are similar to conventional hydrodesulfurization catalysts, hence were tested in both their reduced and sulfided forms. The sulfided catalyst displayed better activity and selectivity as compared to the reduced catalyst, yielding phenol as the major product. QENS demonstrated that jump diffusion of guaiacol was seen after adsorption on both the sulfided catalyst and reference pillared clay. INS showed that there were two types of interaction of guaiacol with the catalyst. The first is guaiacol adsorbed via various types of H-bonding interaction, as observed in the sulfided catalyst. The second type of interaction is guaiacol adsorbed on the surface, presumably at a Mo vacant site, by chemisorption through formation of a methoxyphenate species.
Much of the carbon in lignin is present as arenes, Figure 6. Selective cleavage of C–C and C–O bonds to release these as industrially desirable (and hence valuable) BTX (benzene, toluene, xylenes) species (i.e., without hydrogenation of the aromatic ring) would be a useful development. Precious metals (Ru, Pd, Pt) supported on Nb2O5 have been shown to be capable of doing this and INS has been used to investigate the mechanism [80,81,82].
One chemical that is attracting considerable attention is γ-valerolactone (GVL), which can be obtained from cellulose via levulinic acid [83], (Figure 7 (left)). This has potential uses that range from biofuel to polymer precursors. One compound of particular interest is butene, a key platform chemical. It was shown [84] that a Nb substituted ZSM-5 (Si:Al = 25, Si:Nb = 37) zeolite was capable of 80% selectivity to butene from GVL at 320 °C and 1 bar. This was only possible because the substituted zeolite had both Lewis and Brønsted sites that could chelate the GVL. The INS spectra (Figure 7 (right)) clearly show the interaction with the catalyst.
Biomass conversion to platform chemicals is a very difficult problem. Optimising the process will require the use of many techniques. The work discussed here, shows that neutron scattering has an important part to play.
3.7. Fuel Cells
A fuel cell is an electrochemical cell that converts the chemical energy of a hydrogenous fuel and an oxidizing agent (usually O2) into electricity via a pair of redox reactions. There are many types of fuel cells, but they all consist of an anode, a cathode and an electrolyte that allows ions to move between the two sides of the fuel cell. Catalysts are required for both the anode and the cathode. There are three main types of fuel cell: (i) low temperature (60–100 °C, exemplified by polymer electrolyte membrane fuel cells, PEMFC [85]), (ii) intermediate temperature (120–500 °C, ITFC, exemplified by CsH2PO4 [86] and oxide proton conductors [87]) and (iii) high temperature (800–1000 °C, exemplified by solid oxide fuel cells, SOFC [88]). For conduction, low temperature cells use oxonium ions, intermediate temperature cells use protons and high temperature cells use oxide ions.
PEMFC use Pt/C catalysts for both the hydrogen (cathode) and oxygen (anode) splitting reactions. The adsorbed states of hydrogen on platinum have been studies by INS for decades (e.g., [89,90,91,92,93,94]). The spectra show a remarkable degree of commonality, implying that similar species are present, irrespective of whether the platinum is supported or not. It was recently shown [95] that all the spectra can be assigned as a mixture of on-top, twofold bridging and threefold bridging hydrogen in ~1:2:1 ratio.
The membrane that separates the anode and cathode in a PEMFC is a crucial component. This is usually Nafion, a polymer consisting of a polytetrafluoroethylene (PTFE) backbone, with perfluorinated-vinyl-polyether side chains terminating in sulfonic acid groups. The state of water and ion transport in this have been extensively studied by neutron techniques including INS [96], QENS [97,98,99] and SANS [100,101]. Particularly notable is the development of cells that allow operando measurements of a working PEMFC [98,99,101]. Figure 8 illustrates the experimental set-up and the results for an operando SANS experiment.
ITFC have been much less studied by neutron methods. The QENS and INS spectra of the candidate materials CsH2PO4 [102,103] and CsHSO4 [104,105,106,107] have been studied. The interest in these materials is that they undergo a phase transition at ~150 °C to a superprotonic state, where the conductivity increases by five orders of magnitude. The only report (by any method) of the observation of the key O–H stretch modes in the superprotonic phase of CsHSO4 is by INS [107].
At somewhat higher temperatures, 200–500 °C, oxygen deficient ceramic oxides such as Y doped BaCeO3 (BaCe1−xYxO3−x/2,) and In doped BaZrO3 are becoming increasingly important [108]. On hydration by treatment in a humid atmosphere at elevated temperatures, these become partially hydroxylated, e.g., BaZr1−xInxO3−x/2 becomes BaZr1−xInxO3Hx. At elevated temperature, the protons are mobile and hop between oxygen atoms by a Grotthuss-type mechanism. Neutron diffraction is especially useful here, [109], as it enables the proton positions to be determined, e.g., [110,111]. The technique enables measurements at relevant temperatures to be made and, often, simultaneous physical measurements, such as conductivity [112]. Polarised neutron diffraction has potential as a means to quantify the hydrogen content in the bulk, non-destructively [113].
These materials are also ideally suited to inelastic neutron scattering as only the protons have any significant scattering cross section. Consequently, they have been extensively investigated by QENS [114,115] (to determine diffusion constants and insights into the proton transport mechanism) and by INS [116,117,118,119,120], which probes the local structure of the hydroxyls. This may differ from the average structure determined by diffraction methods, e.g., [121].
SOFC are ideally suited to neutron diffraction studies as the solid electrolyte consists of a light element (O) in the presence of heavy ones (e.g., Ce, Zr, La). This is precisely where neutron diffraction excels, as the location of the oxygen atoms (and vacancies) is crucial to understanding the properties of the material. Measurements under realistic temperature and gas conditions are relatively straightforward [122,123,124].
Fuel cells are already, and will increasingly be, an important part of the Net Zero landscape. Catalysis plays a key role in fuel cells, especially PEMFC. Neutron scattering’s importance as means to provide useful information about the fuel cell’s components under relevant conditions of temperature and gas composition will only continue to grow.
3.8. CO2 Capture and Utilization
In an ideal world, human activities would not generate additional CO2 beyond what is naturally present. In the real world this is not possible, hence the need to mitigate production of CO2 [125,126]. CO2 production is an inevitable consequence of chemical processes, so the next best choice is to capture the CO2 at the point of production and either sequester it (carbon capture and storage (CCS)) or (preferably) use it [127]. Neither option is straightforward. CO2 is non-polar and, as a consequence of it being a thermodynamic “sink”, unreactive.
The single largest use of CO2 is in enhanced oil recovery (EOR) and enhanced gas recovery (ERG) [128]. Here, CO2 is injected into the well to so as to “push” out more of the hydrocarbons. This can be conducted in such a way that some of the CO2 is retained in the well [128]. In addition to its use for ERG, injection of CO2 could also be used as a means to stabilise methane hydrate in underground reservoirs [129,130]. This is particularly relevant as there are concerns over rising levels of methane in the atmosphere, as methane has 84 times the warming power of carbon dioxide over the first 20 years after it reaches the atmosphere.
Currently, the most widely used method for capture is based on reaction with an aqueous amine [131]. The most common is monoethanolamine to generate carbamates, Equation (4), and bicarbonates, Equation (5):
HOCH2CH2NH2 + CO2 → (HOCH2CH2NH3)+ (HOCH2CH2NHCO2)−
HOCH2CH2NH2 + CO2 + H2O → (HOCH2CH2NH3)+ (HCO3)−
The CO2 is recovered by heating the solution to decompose the salt. The technology is expensive and energy intensive, as much as 30% of the energy produced by a power station can be needed for CCS. Consequently, there is intense activity to find alternatives.
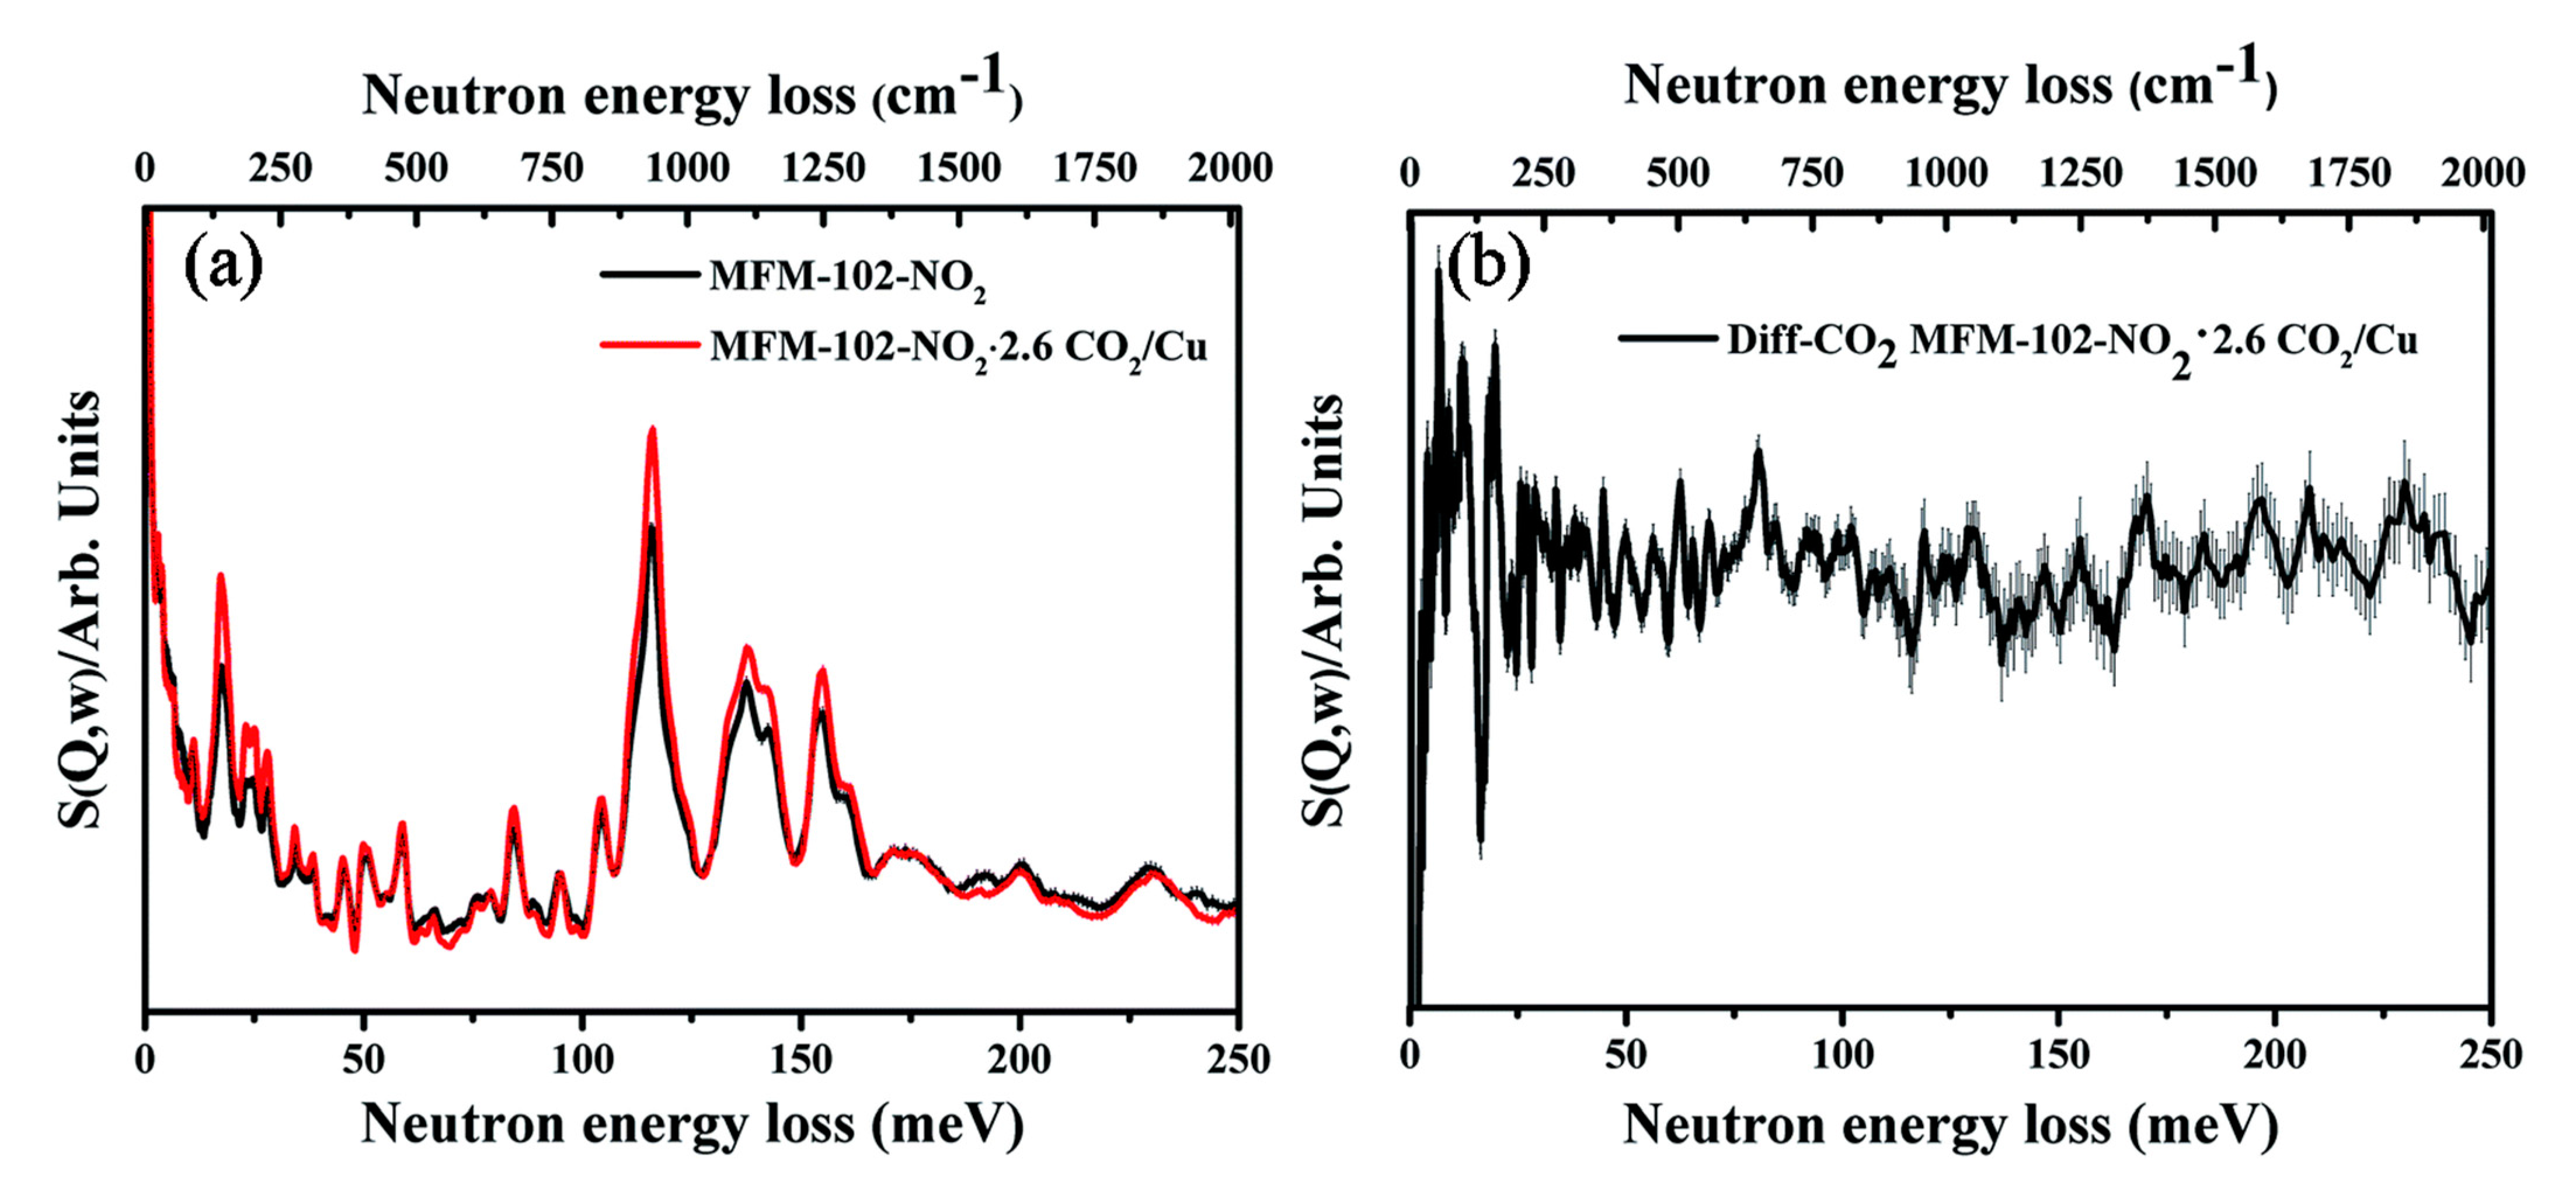
Adsorption in a solid material is an attractive alternative and metal organic framework (MOF) materials have been looked at for this purpose [132]. Neutron diffraction has been used extensively as it enables location of the CO2 and how it is interacting with the framework [133,134,135,136,137]. INS spectroscopy is able to interrogate the MOF and see the changes in the spectra caused by the interaction with CO2, Figure 9, but as may be seen, this is indirect because the CO2 itself is not detected. This is unfortunate and highlights the need for further increases in sensitivity of the instrumentation.
Even more challenging is the chemical use of CO2 [127]. Some of the possibilities have been discussed in previous sections (dry reforming, Section 3.2; methanol, Section 3.5) but at present the only major chemical uses of CO2 are for urea production (via the Bosch–Meiser process [138], Equations (8) and (9)) and for polyol synthesis [125,126].
2NH3 + CO2 → (NH2CO2)– (NH4)+
(NH2CO2)– (NH4)+ → NH2CONH2 + H2O
Urea production (mainly for fertilizer) requires an ammonia source, consequently urea plants are usually integrated with ammonia production. The overall process is extremely energy intensive, with ammonia production being the major source of CO2, as the hydrogen comes from SMR. This highlights the need for green ammonia.
Polyols are the other major use for CO2 [139,140]. These are hydroxyl terminated polymers that can be reacted with isocyanates to make polyurethanes. Polyols can be made by the reaction of CO2 with propylene oxide to create polycarbonates, Figure 10a. The physical properties of these materials limit their application to specialty polymers. A more recent development is the production of poly(ether carbonates) with the use of a different catalyst system [141,142], Figure 10b. Life cycle analysis [143] shows that the polymers still generate greenhouse gas emissions, but less so than conventional routes. There is scope for further optimization.
3.9. Neutron Imaging
In this section, rather than a process we will consider a technique that has enormous potential for the study of catalytic process—neutron imaging. The technique was first demonstrated soon after the discovery of the neutron in 1932, but only in the last 20 years has the combination of detectors and processing power been available to make it a technique that is widely applied [146]. As with X-ray imaging, both radiography (2D) and tomography (3D) can be carried out. As Figure 11 shows, there are many contrast mechanisms available [147]. Of particular relevance to Net Zero is the ability to visualize lithium inside working lithium-based batteries [148,149].
For studies of catalysts, it is the intense scattering by hydrogen and the high penetration by neutrons that are attractive. This enables functioning devices to be studied without having to compromise the device by the need to have windows. In this context, a major use for neutron imaging has been visualizing water flow, and its management, inside PEMFC [147,150,151,152,153]. By making use of the neutron wavelength-dependent transmission of ice and liquid water it is possible to distinguish the two in situ inside a PEMFC [154]. This offers possibilities for chemically resolved spectra.
Perhaps the simplest catalytic process is the conversion of ortho- (o-H2) to para-hydrogen (p-H2) by paramagnetic materials, usually γ-Fe2O3 [155]. This is an especially favourable situation as o-H2 and p-H2 have very different scattering cross sections, thus providing contrast. Figure 12 shows a series of images each recorded in only two seconds [156] (a real time video is available in the Supplementary Information of [156], it is also available at [157]). It is also possible to quantify the amount of o-H2 so the kinetics may be followed.
Ex situ measurements can provide useful information about the progress of a reaction, the pyrolysis of biomass provides an example [158]. Measurements on an automotive catalytic converter monolith have allowed investigation of where the wash-coat that includes the catalyst is deposited and how soot from the engine’s exhaust is distributed [159].
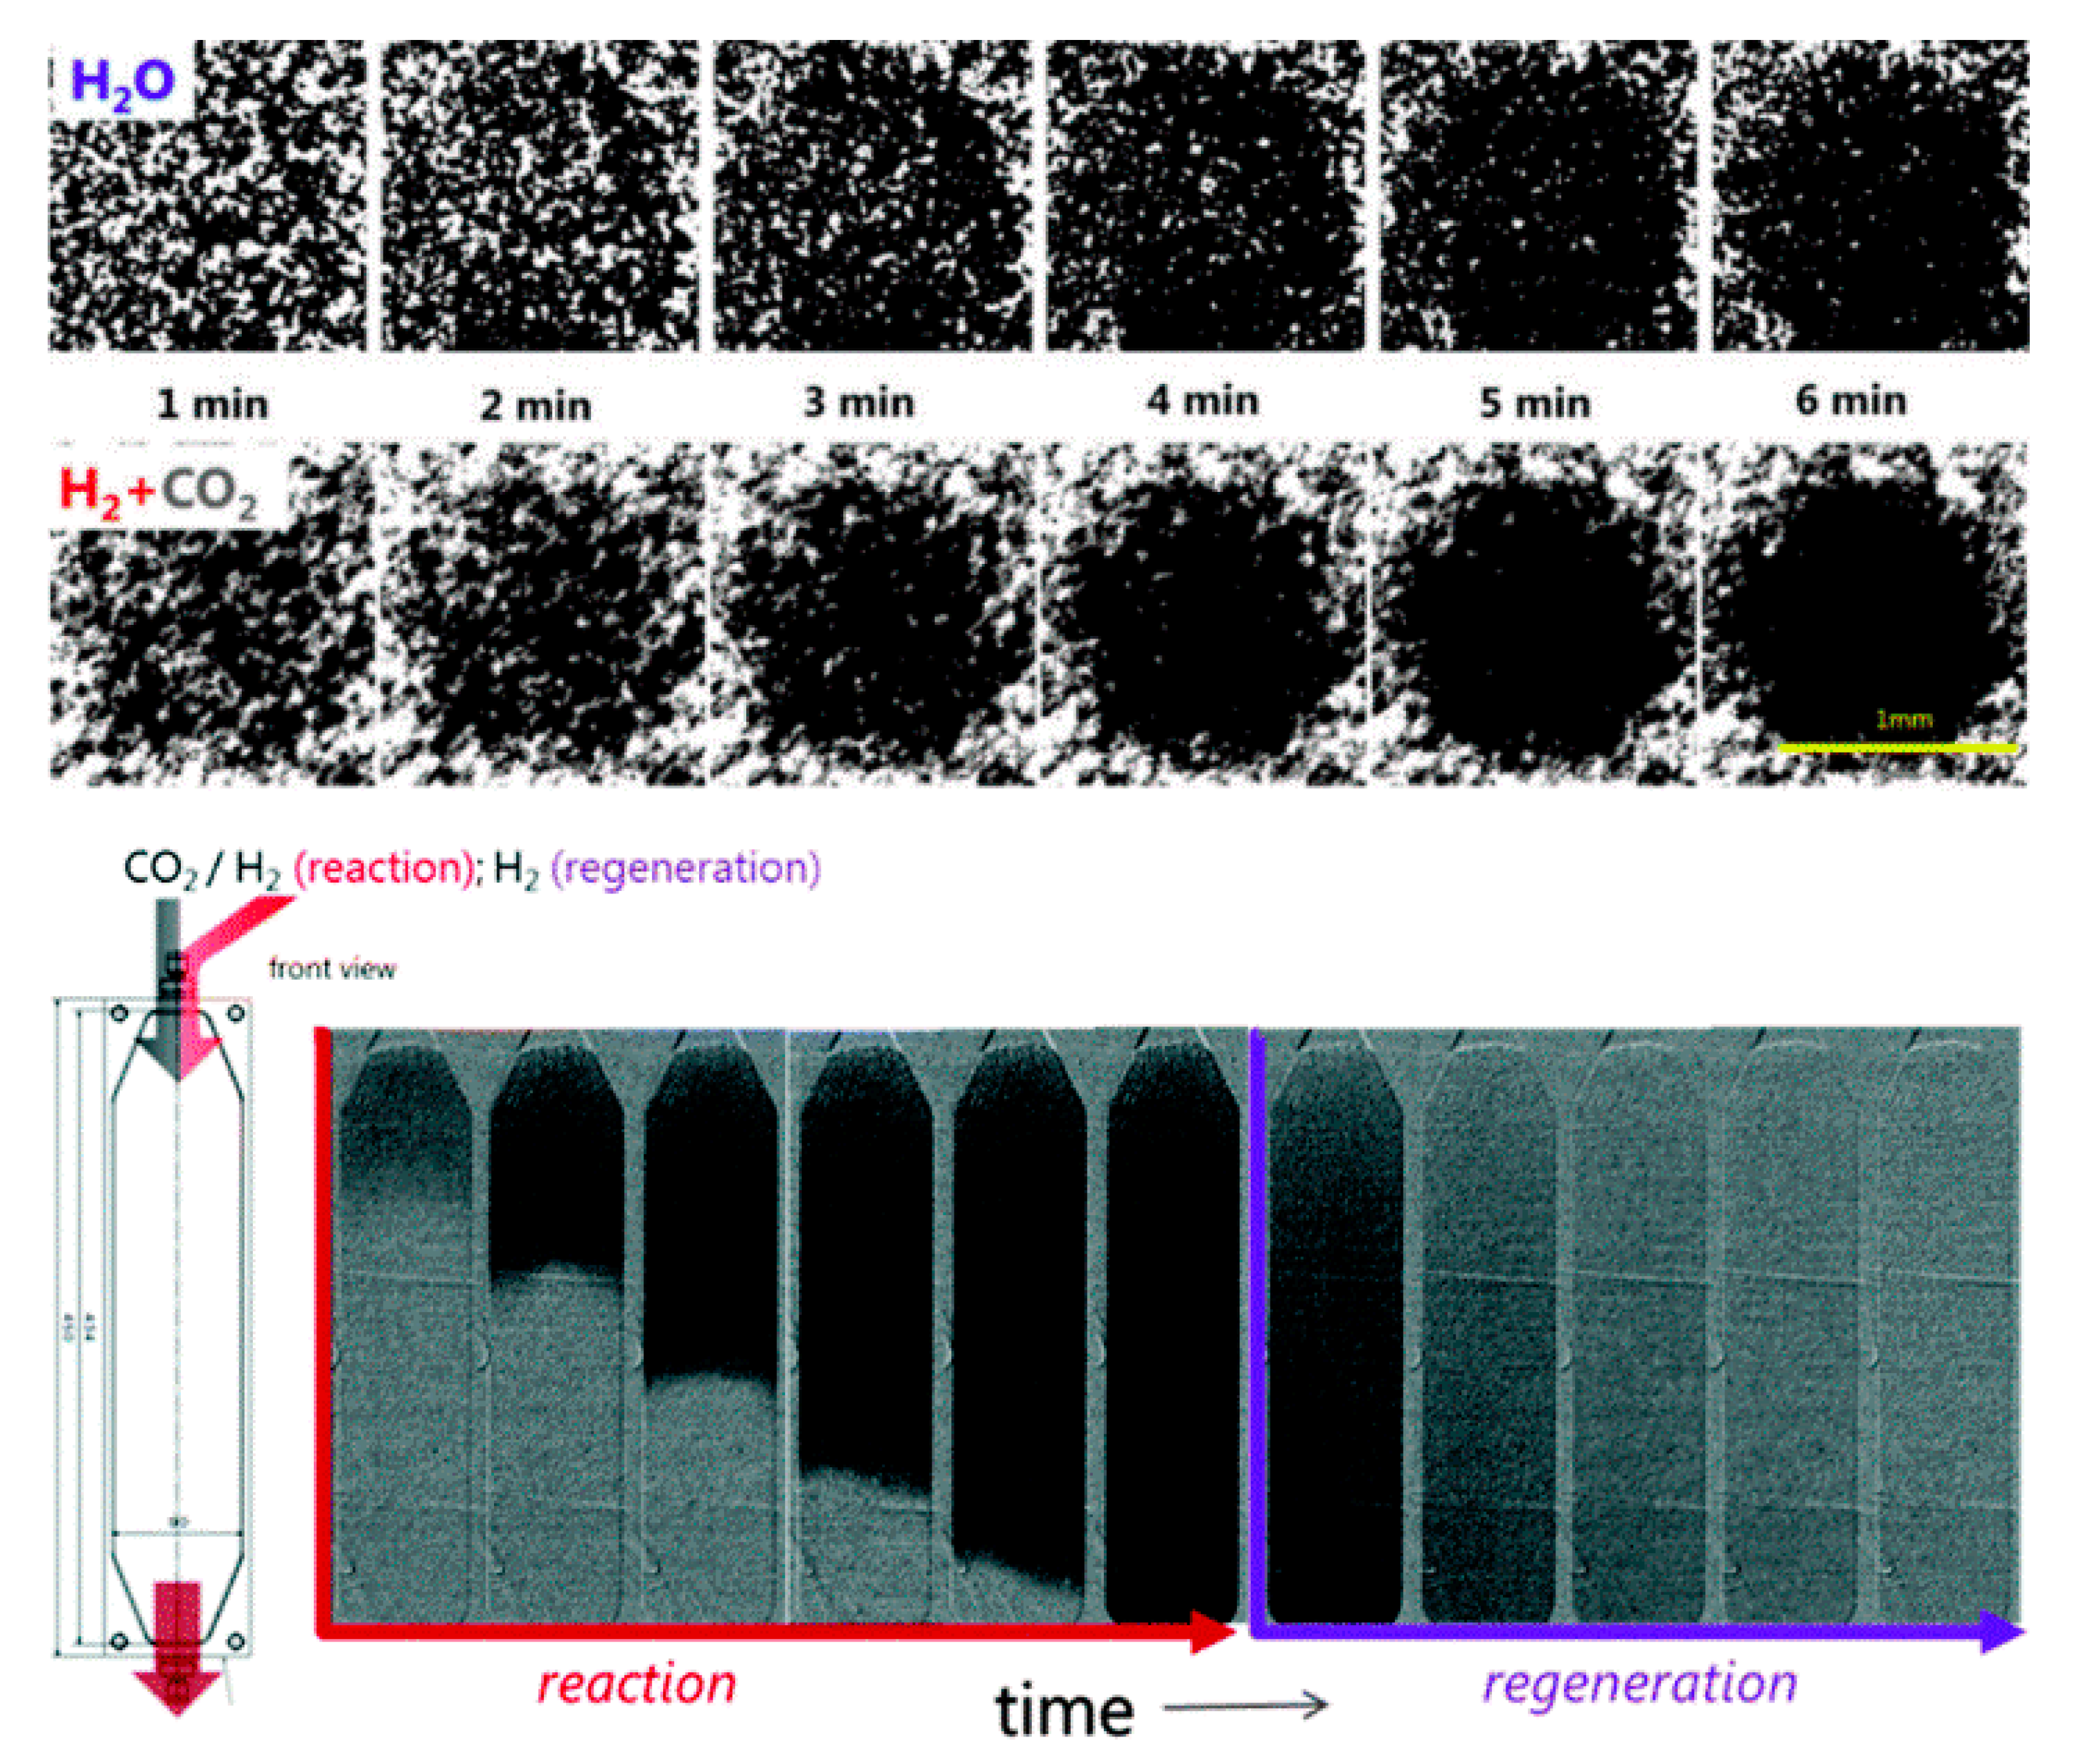
Crucially for catalysis, neutron imaging can be carried out at real temperatures [160,161,162]. The Sabatier reaction, Equation (10), typically runs at 250 °C and above and is catalysed by nickel. The kinetics and yield can be improved by continuously removing the water. One way to do this is by sorption in a zeolite. By creating the nickel catalyst in the zeolite, the reaction and sorption capabilities can be closely connected.
4H2 + CO2 → 2H2O + CH4
Figure 13 (top two rows) compares a series of high-resolution neutron images showing water adsorption from a humidified hydrogen gas stream with that from water accumulation during sorption-enhanced methanation [161]. The adsorption of water from a water-containing gas stream shows the expected shell structure, while water formed during the reaction accumulates homogeneously inside the bead. This demonstrates that the catalysis takes place throughout the bead. This proceeds most efficiently when sorption occurs. This leads to a reaction front moving down the catalyst bed and this can be seen in Figure 13 (bottom row) [160]. The catalyst can be regenerated by desorbing the water, this occurs almost uniformly throughout the catalyst bed, in contrast to the reaction.
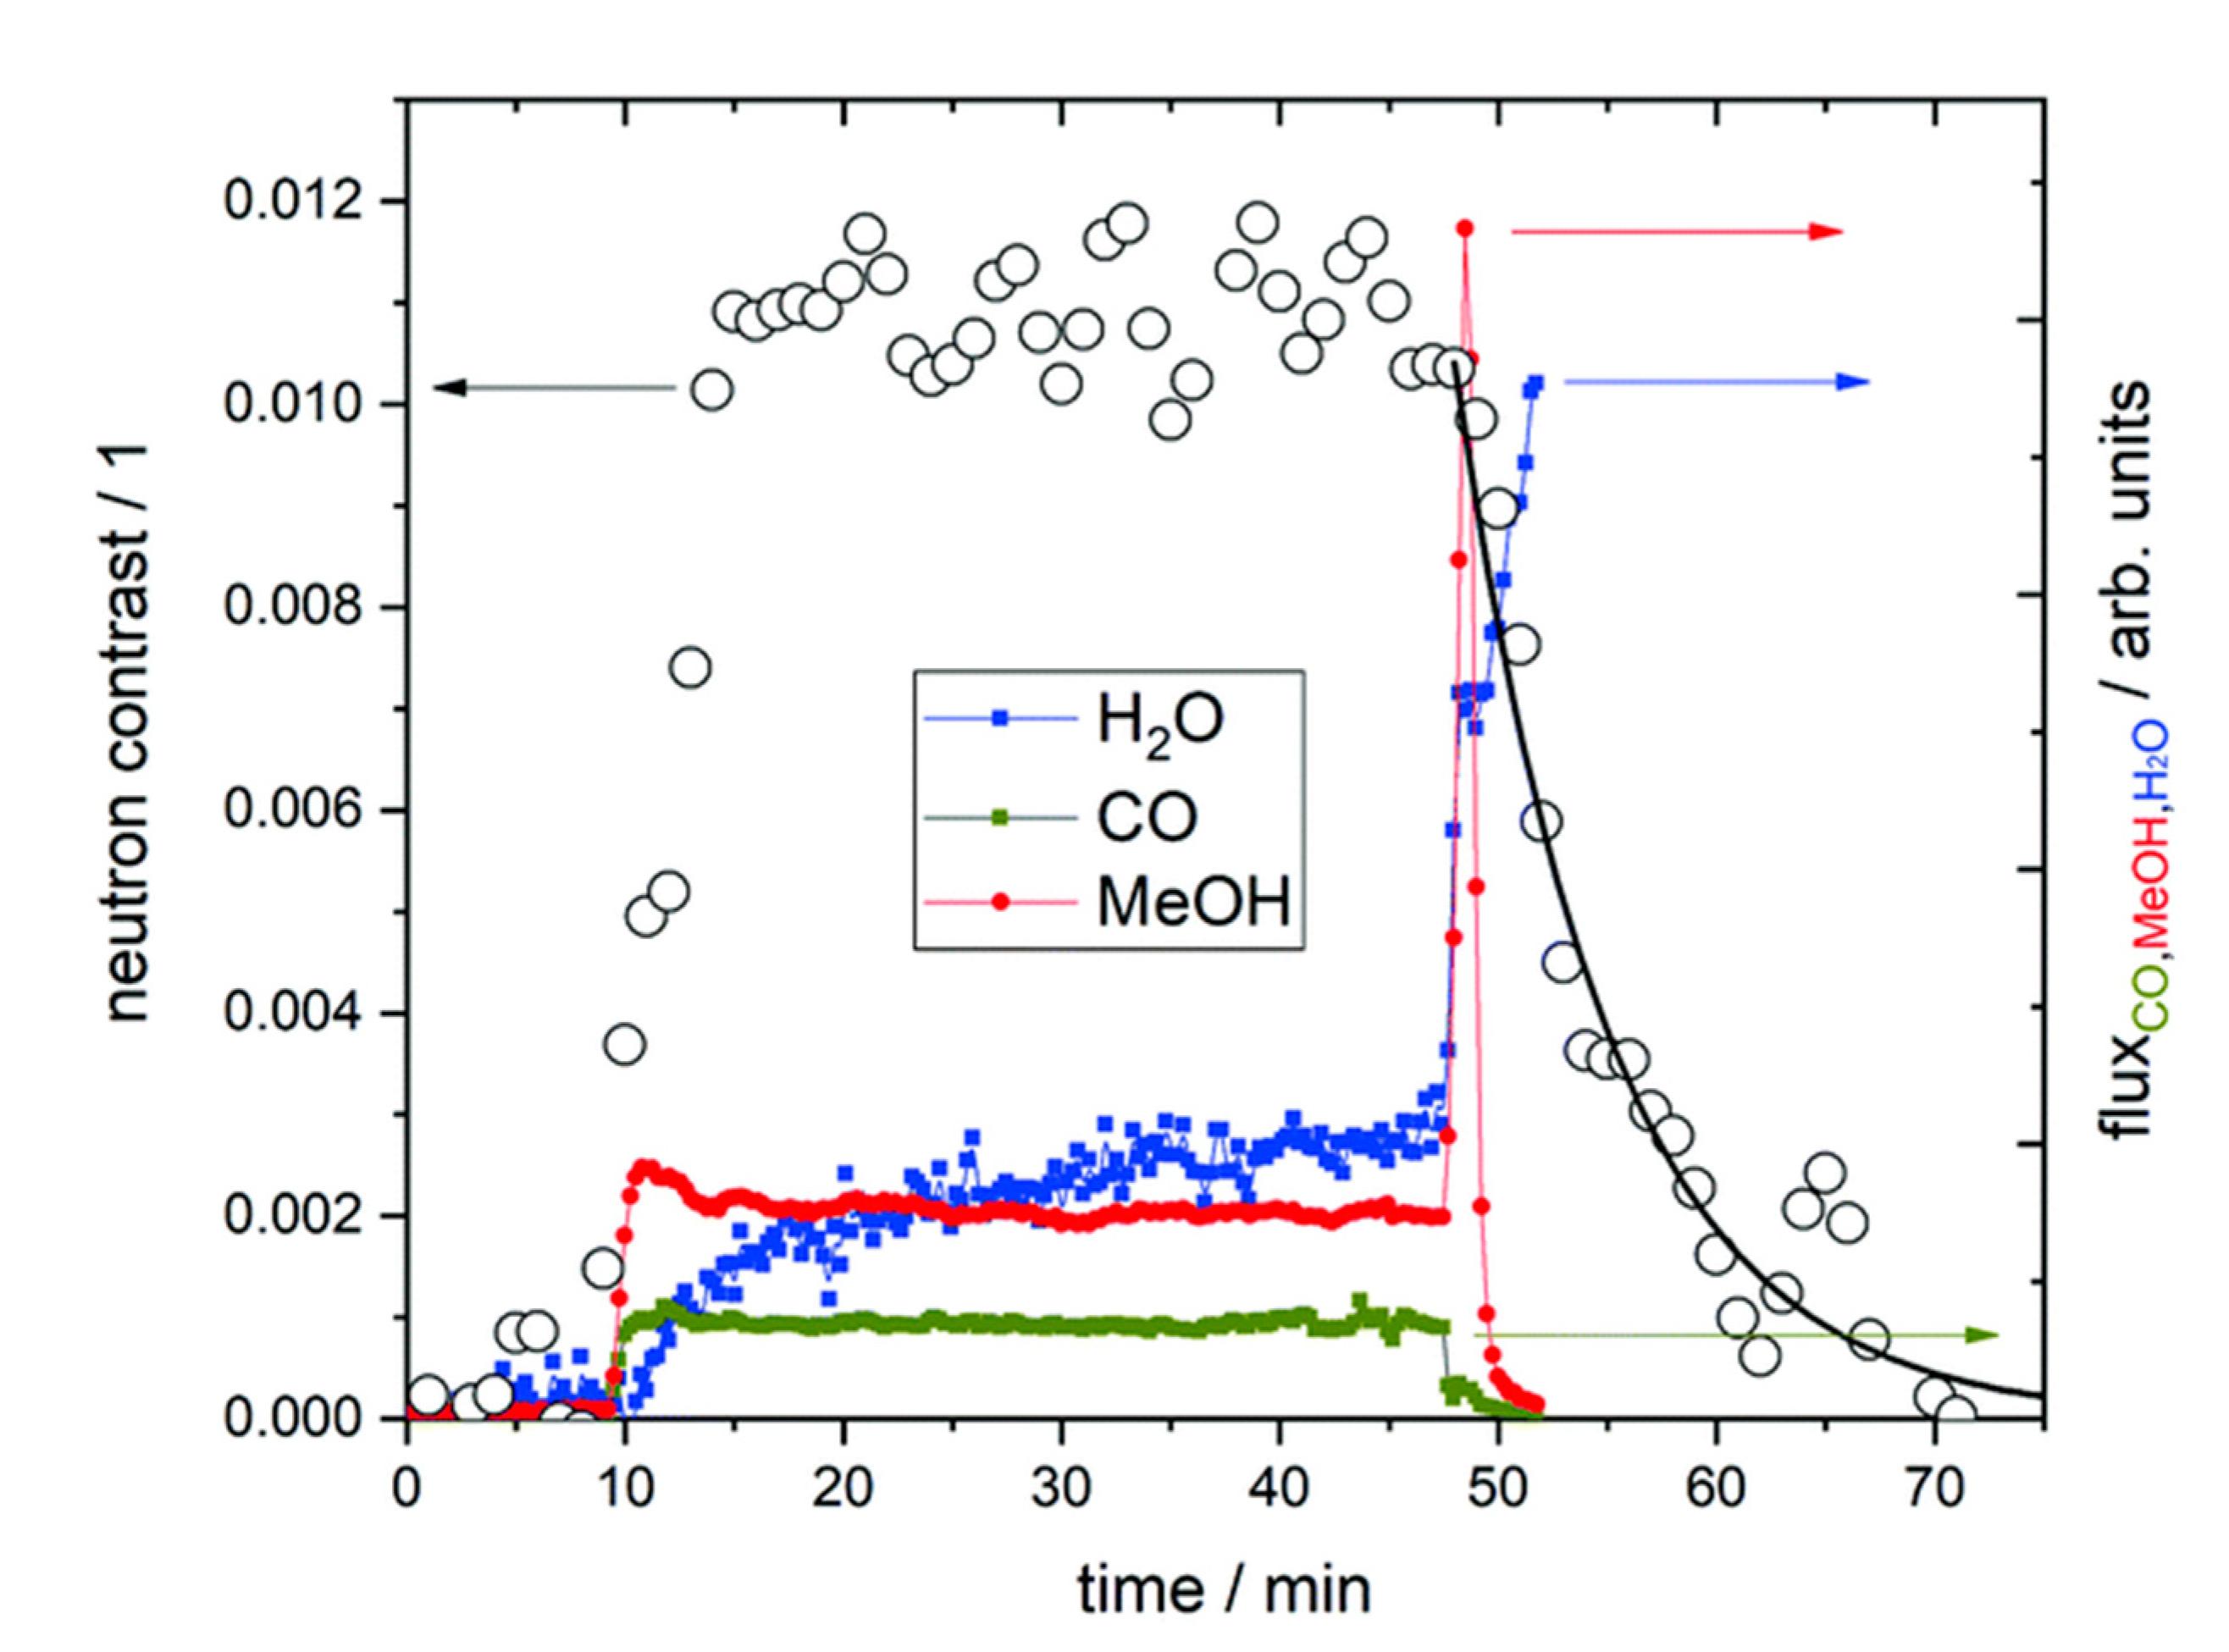
Methanol synthesis (Section 3.5) is a crucial element in Net Zero. Time dependent measurements of a working catalyst [162], Figure 14, show that the desorption of intermediates and products from the surface takes up to one hour after switching from high pressure reaction conditions to pure hydrogen at 1 bar, while the coverage is completed within a few minutes after switching to reaction conditions. The main desorption product is water. Interestingly, also the methanol concentration peaks with pressure release, in contrast to CO, which just stops. Micro-kinetic models emphasize the stability of some intermediates (such as OH forming eventually water, also seen in ex situ studies by INS [66]) on the surface of the catalyst blocking adsorption sites needed for catalysis. This explains the initial higher production yield as well as the absence of a concentration dependence of the coverage: a few percent of CO2 is sufficient to produce these adsorbates covering most of the surface of the catalyst.
At state-of-the-art neutron imaging facilities [163], time resolution on the order of 10 ms is achievable, while 10 μm spatial resolution has been demonstrated. The spatial and temporal resolution are much poorer than is possible with X-ray synchrotrons because the brightness is orders-of-magnitude less. As mentioned earlier, the strengths of neutron imaging are the sensitivity to light elements (especially 1H) and the penetration of neutrons. Images such as Figure 12 and Figure 13 are of the “whole reactor”, so provide not only chemical insight but also information relevant for chemical engineering. The time resolved operando study of methanol synthesis [162] provides a clear indication of what is possible with the technique and points the way forward.
4. Outlook
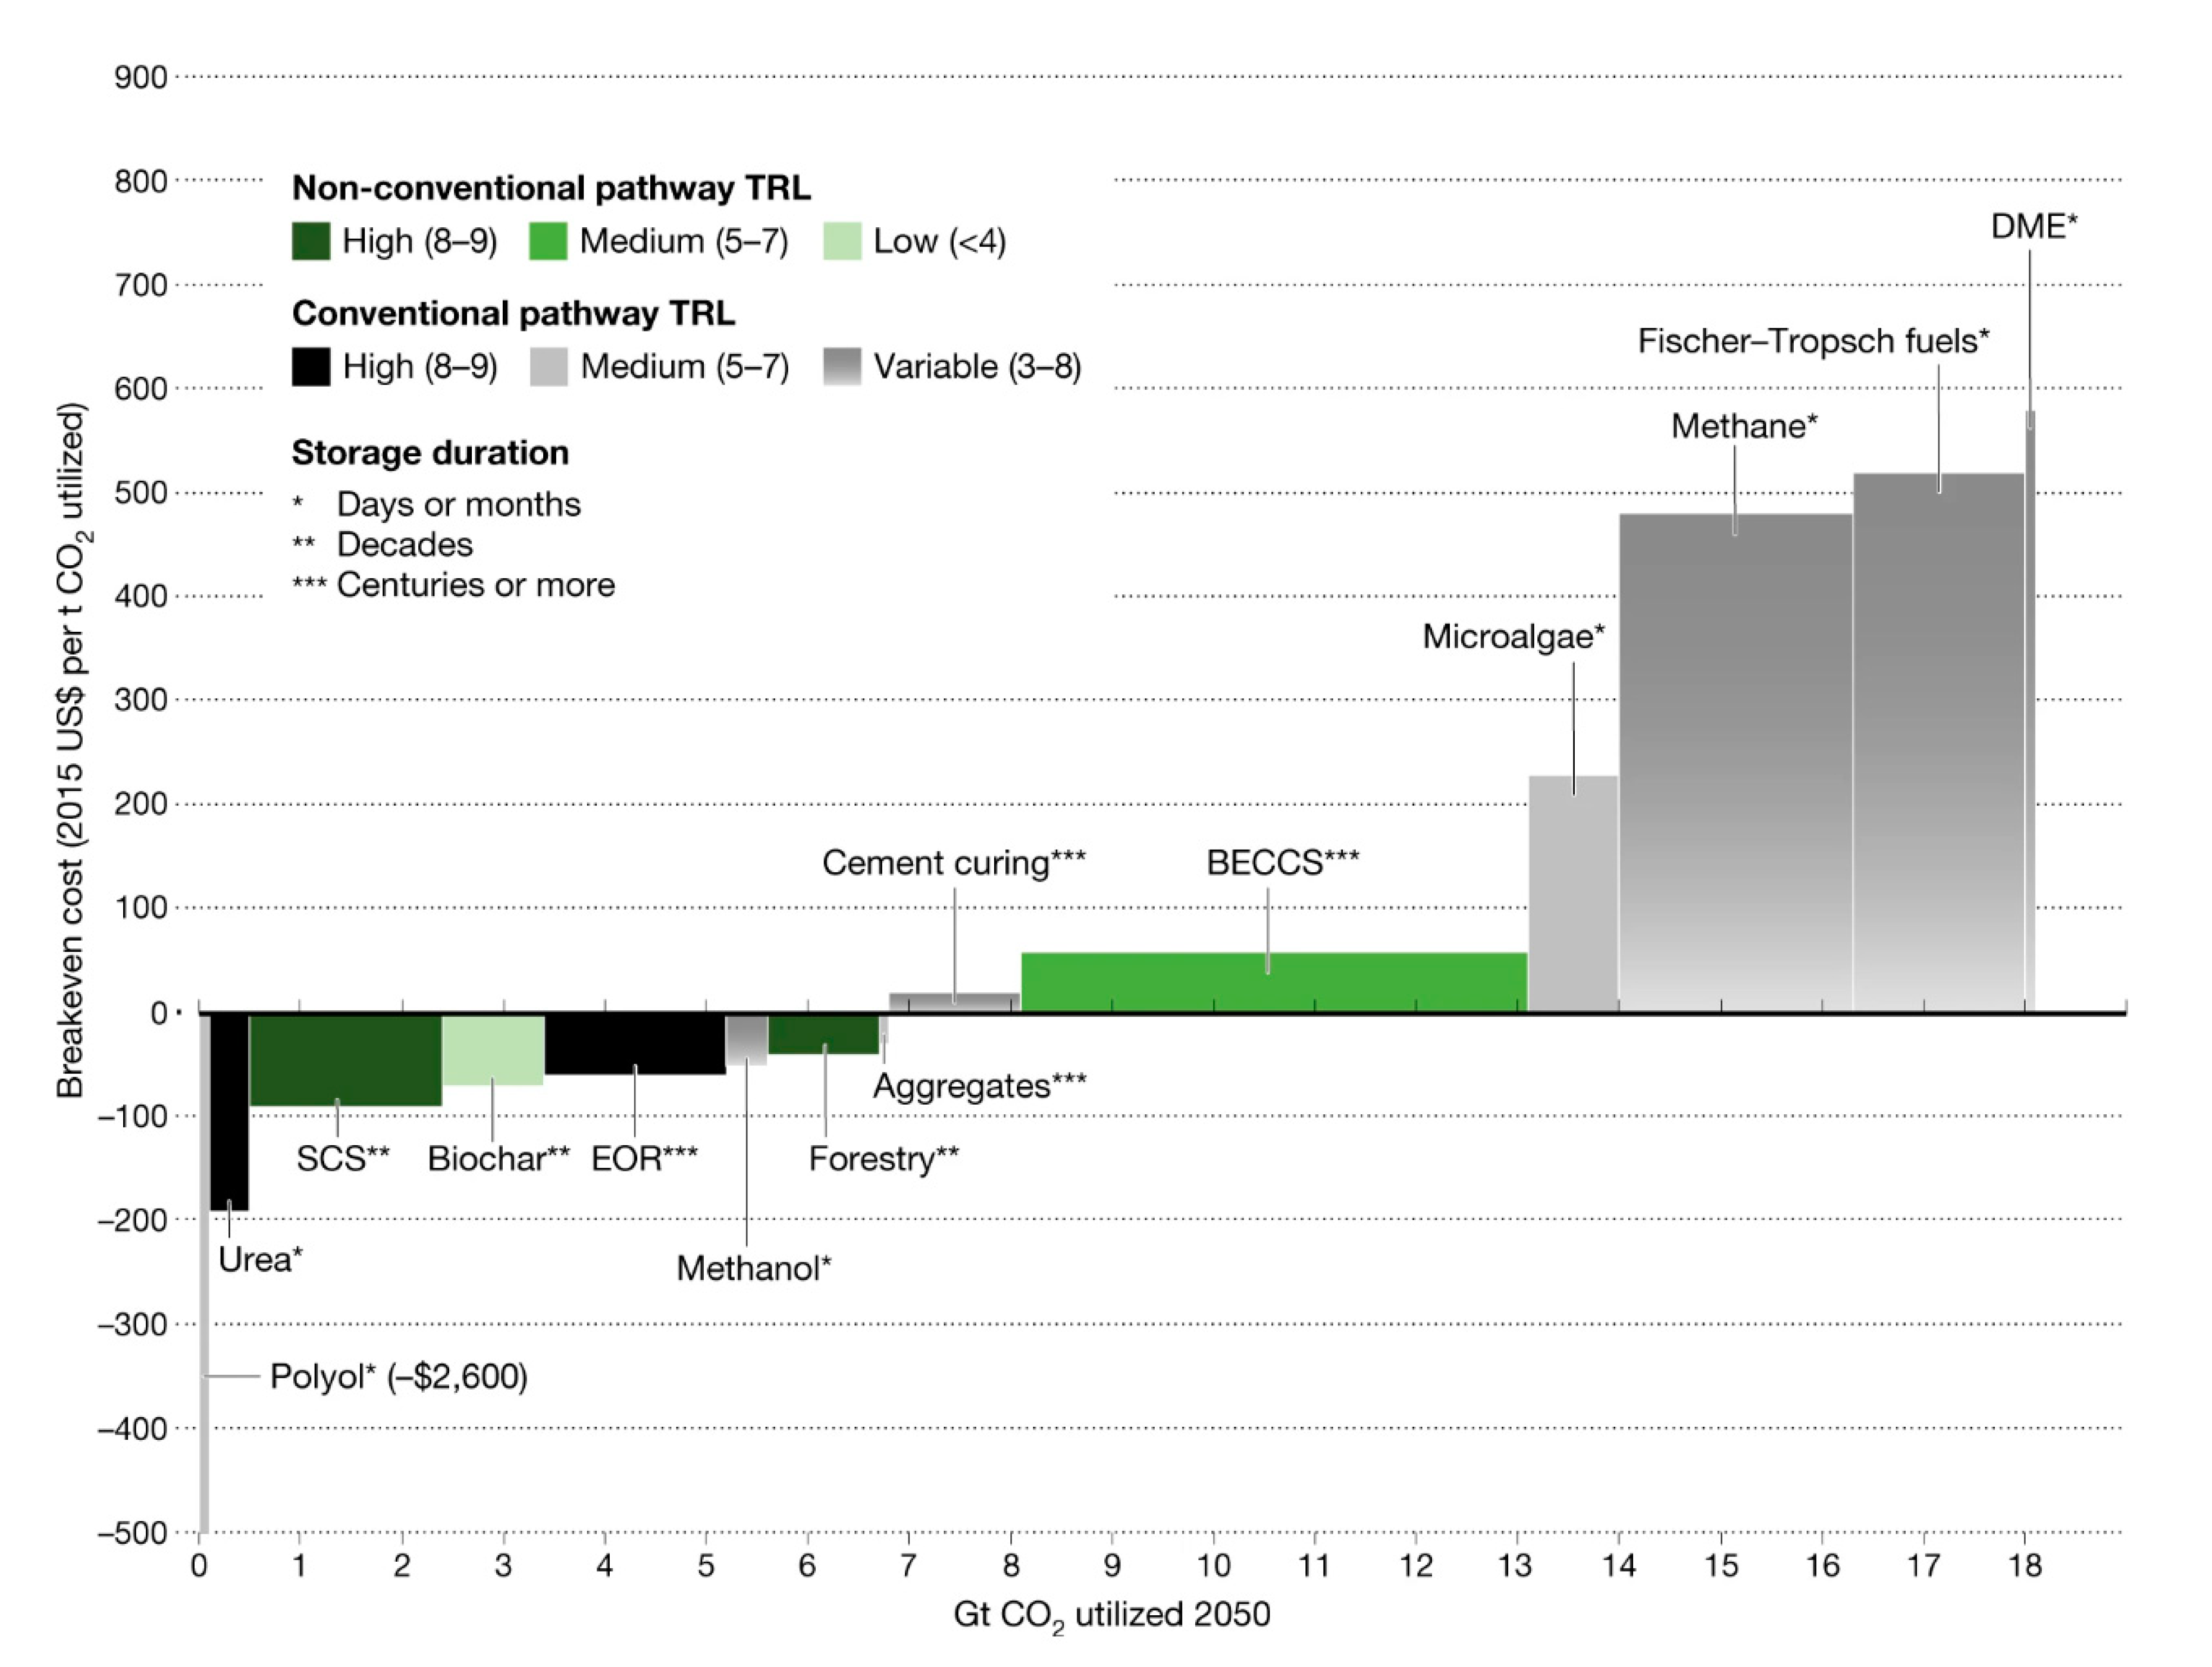
As described in the Introduction, the chemical industry accounts for about one-fifth of global emissions [5]. To reduce this to Net Zero, catalysis must play a role. Figure 15 shows just how big this role could be [126]. The three largest CO2 sources: methane, Fischer–Tropsch fuels and dimethylether (DME, which is obtained from methanol), are all areas where catalysis is vital and where driving costs down is essential. In the area of CO2 utilization, urea and polyols are already profitable (negative cost on Figure 15 but there is clearly scope for further use of CO2. Other possibilities include the use of photocatalysis [164]. This is particularly attractive because it uses light (ideally solar) as the energy source, reducing the need for fossil-fuel powered heating. Photocatalytic reduction of CO2 to methane and alkanes [165], to methanol [166] and (photo)electrochemical reduction to formic acid [127] have all been demonstrated. Nonetheless, by whatever method CO2 is processed, all the routes will require a catalyst in some form or another and, at some stage, hydrogen will be involved. As we have shown, neutrons excel at showing where the hydrogen is located (diffraction, imaging) and what is it doing (spectroscopy). For many catalytic processes neutrons are already used; the current range of applications can only grow if Net Zero is to be achieved.
The examples described here illustrate the breadth of the applications of neutron scattering for the study of catalysts and catalytic processes. For studies of structure at both the microscopic (diffraction) and macroscopic (imaging) length scales neutrons have the advantage that they are democratic: they see most elements, more or less, equally well. In particular, light atoms are observable, even in the presence of heavy atoms. This is in contrast to X-ray methods that are biased towards the higher atomic number atoms that are present. It is often the light atoms that are of most interest; whether in catalysis (H, C, N, O), fuel cells and batteries (H, Li, O, Na, Mg) or CCS (C, O). Inelastic neutron scattering of catalysts and energy materials has been largely dominated by studies of hydrogenous systems, (because of the large incoherent cross section of 1H (80.2 barn) vs. 5 or less for most other common elements (isotopes)). Over the last 20 years or so, QENS has established itself as the technique of choice for the determination of diffusion constants at the microscopic scale. Advances in instrumentation mean that studies of Li, Na, Mg for battery materials are now feasible, albeit very difficult, e.g., [167,168,169]. At higher energy transfer, neutron vibrational spectroscopy offers unique advantages for studies of catalysts. Thus metals, carbon, oxides (Al2O3, SiO2, TiO2, FeOx, ZnO, CeO2…) and zeolites are all transparent across the entire “mid-infrared” (0–4000 cm−1) region. With infrared spectroscopy, all these have regions that are opaque because of strong absorption by the material. An area where it is becoming increasingly apparent that INS spectroscopy can provide information that is not accessible by any other means is the nature of the species present on, or in, deactivated catalysts [48,73].
As noted earlier, neutrons are a scarce resource [14], worldwide there are only ~50 neutron scattering facilities and only four of these: ISIS [16], the ILL [15], SNS [17] and J-PARC [18], have a large suite of cutting-edge instruments. For neutron scattering to play a larger role in achieving Net Zero, continued investment in neutron facilities is essential. This is required at all cost levels, from the development of new sample environment equipment that enables reactions to be studied operando at relevant temperatures and pressures (e.g., the neutron diffraction studies of the ammonia [42,43] and of the methanol [62,63] synthesis catalysts), through upgraded (TOSCA at ISIS shows what is possible [170]) or new instruments (e.g., imaging [147]) through to new facilities, such as the European Spallation Source [19] with its suite of instruments [171], many of which are relevant to catalysis, to next generation sources such as ISIS-II [172].
Author Contributions
Conceptualization, S.F.P. and D.L.; writing—original draft preparation, S.F.P.; writing—review and editing, S.F.P. and D.L. Both authors have read and agreed to the published version of the manuscript.
Funding
This work was funded by the Science and Technology Facilities Council (STFC).
Conflicts of Interest
The authors declare no conflict of interest.
References
- UK Government. Available online: https://www.gov.uk/government/news/uk-becomes-first-major-economy-to-pass-net-zero-emissions-law (accessed on 7 March 2021).
- International Energy Agency. Available online: https://www.iea.org/reports/net-zero-by-2050 (accessed on 23 May 2021).
- The Institute for Government. Available online: https://www.instituteforgovernment.org.uk/explainers/net-zero-target (accessed on 7 March 2021).
- The Royal Society of Chemistry. Available online: https://0-www-rsc-org.brum.beds.ac.uk/globalassets/22-new-perspectives/sustainability/rsc-chemicals-strategy-policy-2020.pdf (accessed on 7 March 2021).
- Ritchie, H.; Roser, R. Emissions by Sector. Our World in Data. Available online: https://ourworldindata.org/emissions-by-sector (accessed on 7 March 2021).
- Catlow, C.R.A.; Davidson, M.; Hardacre, C.; Hutchings, G.J. Catalysis making the world a better place. Philos. Trans. R. Soc. A 2016, 374, 20150089. [Google Scholar] [CrossRef] [PubMed]
- Niemantsverdriet, J.W. Spectroscopy in Catalysis: An Introduction, 3rd ed.; Wiley-VCH: Weinheim, Germany, 2007. [Google Scholar]
- Squires, G.L. Introduction to the Theory of Thermal Neutron Scattering; Dover Publications: Mineola, NY, USA, 1978. [Google Scholar]
- Fernandez-Alonso, F.; Price, D.L. (Eds.) Neutron Scattering—Fundamentals, Experimental Methods in the Physical Sciences; Academic Press: Amsterdam, The Netherlands, 2013; Volume 44. [Google Scholar]
- Willis, B.T.M.; Carlile, C.J. Experimental Neutron Scattering; Oxford University Press: Oxford, UK, 2013. [Google Scholar]
- Fernandez-Alonso, F.; Price, D.L. (Eds.) Neutron Scattering—Applications in Biology, Chemistry and Materials Science, Experimental Methods in the Physical Sciences; Academic Press: Amsterdam, The Netherlands, 2017; Volume 49. [Google Scholar]
- Mitchell, P.C.H.; Parker, S.F.; Ramirez-Cuesta, A.J.; Tomkinson, J. Vibrational Spectroscopy with Neutrons, with Applications in Chemistry, Biology, Materials Science and Catalysis; World Scientific: Singapore, 2005. [Google Scholar]
- Lépine-Szily, A.; Descouvemont, P. Nuclear astrophysics: Nucleosynthesis in the universe. Int. J. Astrobiol. 2012, 11, 243–250. [Google Scholar] [CrossRef]
- Neutronsources.org. Available online: https://neutronsources.org/ (accessed on 7 March 2021).
- The Institut Laue-Langevin. Available online: https://www.ill.eu/ (accessed on 7 March 2021).
- The ISIS Neutron and Muon Source. Available online: https://www.isis.stfc.ac.uk/Pages/About.aspx (accessed on 7 March 2021).
- The Spallation Neutron Source. Available online: https://neutrons.ornl.gov/sns (accessed on 7 March 2021).
- The Japan Proton Accelerator Research Complex. Available online: https://snsr.jaea.go.jp/en/research/j-parc.html (accessed on 7 March 2021).
- The European Spallation Source. Available online: https://europeanspallationsource.se/about (accessed on 7 March 2021).
- Wilson, C.C. Single Crystal Neutron Diffraction from Molecular Materials; World Scientific: Singapore, 2000. [Google Scholar]
- Kisi, E.H.; Howard, C.J. Applications of Neutron Powder Diffraction; Oxford University Press: Oxford, UK, 2012. [Google Scholar]
- Anderson, I.S.; McGreevy, R.L.; Bilheux, H.Z. (Eds.) Neutron Imaging and Applications. A Reference for the Imaging Community; Springer: Heidelberg, Germany, 2009. [Google Scholar]
- Hempelmann, R. Quasielastic Neutron Scattering and Solid State Diffusion; Oxford University Press: Oxford, UK, 2000. [Google Scholar]
- Andreani, C.; Krzystyniak, M.; Romanelli, G.; Senesi, R.; Fernandez-Alonso, F. Electron-volt neutron spectroscopy: Beyond fundamental systems. Adv. Phys. 2017, 66, 1–73. [Google Scholar] [CrossRef]
- Chorkendorff, I.; Niemantsverdriet, J.W. Concepts of Modern Catalysis and Kinetics; Wiley-VCH: Weinheim, Germany, 2003. [Google Scholar]
- Bhaduri, S.; Mukesh, D. Homogeneous Catalysis: Mechanisms and Industrial Applications, 2nd ed.; Wiley: Weinheim, Germany, 2014. [Google Scholar]
- Husain, Q.; Ullah, M.F. (Eds.) Biocatalysis; Springer: Basel, Switzerland, 2019. [Google Scholar]
- Shao, M. (Ed.) Electrocatalysis; Springer: Basel, Switzerland, 2020. [Google Scholar]
- International Energy Agency. Available online: https://www.iea.org/reports/the-future-of-hydrogen (accessed on 23 May 2021).
- Boretti, A. Technology readiness level of solar thermochemical splitting cycles. ACS Energy Lett. 2021, 6, 1170–1174. [Google Scholar] [CrossRef]
- Wang, S.; Lu, A.; Zhong, C.-J. Hydrogen production from water electrolysis: Role of catalysts. Nano Converg. 2021, 8, 4. [Google Scholar] [CrossRef]
- Ďurovič, M.; Hnát, J.; Bouzek, K. Electrocatalysts for the hydrogen evolution reaction in alkaline and neutral media. A comparative review. J. Power Sources 2021, 493, 229708. [Google Scholar] [CrossRef]
- Murkin, C.; Brightling, J. Eighty years of steam reforming. Johns. Matthey Technol. Rev. 2016, 60, 263–269. [Google Scholar] [CrossRef]
- McFarlane, A.R.; Silverwood, I.P.; Norris, E.L.; Ormerod, R.M.; Frost, C.D.; Parker, S.F.; Lennon, D. The application of inelastic neutron scattering to investigate the steam reforming of methane over an alumina-supported nickel catalyst. Chem. Phys. 2013, 427, 54–60. [Google Scholar] [CrossRef]
- Silverwood, I.P.; Hamilton, N.G.; Laycock, C.J.; Staniforth, J.Z.; Ormerod, R.M.; Frost, C.D.; Parker, S.F.; Lennon, D. Quantification of surface species present on a nickel/alumina methane reforming catalyst. Phys. Chem. Chem. Phys. 2010, 12, 3102–3107. [Google Scholar] [CrossRef]
- Silverwood, I.P.; Hamilton, N.G.; Staniforth, J.Z.; Laycock, C.J.; Parker, S.F.; Ormerod, M.; Lennon, D. Persistent species formed during the carbon dioxide reforming of methane over a nickel-alumina catalyst. Catal. Today 2010, 155, 319–325. [Google Scholar] [CrossRef]
- Silverwood, I.P.; Hamilton, N.G.; McFarlane, A.R.; Kapitán, J.; Hecht, L.; Norris, E.L.; Ormerod, R.M.; Frost, C.D.; Parker, S.F.; Lennon, D. Application of inelastic neutron scattering to studies of CO2 reforming of methane over alumina-supported nickel and gold-doped nickel catalysts. Phys. Chem. Chem. Phys. 2012, 14, 15214–15225. [Google Scholar] [CrossRef] [PubMed]
- McFarlane, A.R.; Silverwood, I.P.; Warringham, R.; Norris, E.L.; Ormerod, R.M.; Frost, C.D.; Parker, S.F.; Lennon, D. The application of inelastic neutron scattering to investigate the ‘dry’ reforming of methane over an alumina-supported nickel catalyst operating under conditions where filamentous carbon formation is prevalent. RSC Adv. 2013, 3, 16577–16589. [Google Scholar] [CrossRef] [Green Version]
- Liao, X.; Gerdts, R.; Parker, S.F.; Chi, L.; Zhao, Y.; Hill, M.; Jones, M.O.; Jiang, Z. In-depth understanding of the bimetallic effects and coked carbon species on an active bimetallic Ni(Co)/Al2O3 dry reforming catalyst. Phys. Chem. Chem. Phys. 2016, 18, 17311–17319. [Google Scholar] [CrossRef] [PubMed] [Green Version]
- Silverwood, I.P.; Hamilton, N.G.; McFarlane, A.R.; Ormerod, R.M.; Guidi, T.; Bones, J.; Dudman, M.P.; Goodway, C.M.; Kibble, M.; Parker, S.F.; et al. Experimental arrangements suitable for the acquisition of inelastic neutron scattering spectra of heterogeneous catalysts. Rev. Sci. Inst. 2011, 82, 034101. [Google Scholar] [CrossRef]
- Hooper, C.W. Ammonia synthesis: Commercial practice. In Catalytic Ammonia Synthesis; Jennings, J.R., Ed.; Springer: Boston, MA, USA, 1991. [Google Scholar] [CrossRef]
- Kandemir, T.; Girgsdies, F.; Kasatkin, I.; Kunkes, E.; Liss, K.-D.; Peterson, V.K.; Schlögl, R.; Behrens, M. Heterogeneous Catalysis under pressure—In-situ neutron diffraction under industrial conditions. J. Phys. Conf. Ser. 2012, 340, 012053. [Google Scholar] [CrossRef] [Green Version]
- Kandemir, T.; Schuster, M.E.; Senyshyn, A.; Behrens, M.; Schlögl, R. The Haber–Bosch process revisited: On the real structure and stability of “ammonia iron” under working conditions. Angew. Chem. Int. Ed. 2013, 52, 12723–12726. [Google Scholar] [CrossRef]
- Wood, T.J.; Makepeace, J.W.; David, W.I.F. Neutron diffraction and gravimetric study of the iron nitriding reaction under ammonia decomposition conditions. Phys. Chem. Chem. Phys. 2017, 19, 27859–27865. [Google Scholar] [CrossRef]
- Von de Loosdrecht, J.; Botes, F.G.; Ciobica, I.M.; Ferreira, A.; Gibson, P.; Moodley, D.J.; Saib, A.M.; Visagie, J.L.; Westrate, C.J.; Niemantsverdriet, J.W. Fischer–Tropsch synthesis: Catalysts and chemistry. In Comprehensive Inorganic Chemistry II; Reedijk, J., Poeppelmeier, K., Eds.; Elsevier: Oxford, UK, 2013; Volume 7, pp. 525–557. [Google Scholar] [CrossRef]
- Torres, G.H.M.; de Jong, K.P. Catalysts for production of lower olefins from synthesis gas: A review. ACS Catal. 2013, 3, 2130–2149. [Google Scholar] [CrossRef]
- Paalanen, P.P.; Weckhuysen, B.M. Carbon pathways, sodium-sulphur promotion and identification of iron carbides in iron-based Fischer-Tropsch synthesis. ChemCatChem 2020, 12, 4202–4223. [Google Scholar] [CrossRef]
- Hamilton, N.G.; Silverwood, I.P.; Warringham, R.; Kapitán, J.; Hecht, L.; Webb, P.B.; Tooze, R.P.; Parker, S.F.; Lennon, D. Vibrational analysis of an industrial Fe-based Fischer-Tropsch catalyst employing inelastic neutron scattering. Angew. Chem. Int. Ed. 2013, 52, 5608–5611. [Google Scholar] [CrossRef]
- Hamilton, N.G.; Warringham, R.; Silverwood, I.P.; Kapitán, J.; Hecht, L.; Webb, P.B.; Tooze, R.P.; Zhou, W.; Frost, C.D.; Parker, S.F.; et al. The application of inelastic neutron scattering to investigate CO hydrogenation over an iron Fischer-Tropsch synthesis catalyst. J. Catal. 2014, 312, 221–231. [Google Scholar] [CrossRef] [Green Version]
- Warringham, R.; Hamilton, N.G.; Silverwood, I.P.; How, C.; Webb, P.B.; Tooze, R.P.; Zhou, W.; Frost, C.D.; Parker, S.F.; Lennon, D. The application of inelastic neutron scattering to investigate a hydrogen pre-treatment stage of an iron Fischer-Tropsch catalyst. Appl. Catal. A Gen. 2015, 489, 209–217. [Google Scholar] [CrossRef]
- Warringham, R.; McFarlane, A.R.; MacLaren, D.A.; Webb, P.B.; Tooze, R.P.; Taylor, J.; Ewings, R.A.; Parker, S.F.; Lennon, D. The application of inelastic neutron scattering to explore the significance of a magnetic transition in an iron based Fischer-Tropsch catalyst that is active for the hydrogenation of CO. J. Chem. Phys. 2015, 143, 174703. [Google Scholar] [CrossRef] [PubMed]
- Warringham, R.; Davidson, A.L.; Webb, P.B.; Tooze, R.P.; Parker, S.F.; Lennon, D. Examining the temporal behavior of the hydrocarbonaceous overlayer on an iron based Fischer-Tropsch catalyst. RSC Adv. 2019, 9, 2608–2617. [Google Scholar] [CrossRef] [Green Version]
- Davidson, A.L.; Webb, P.B.; Parker, S.F.; Lennon, D. Hydrogen partitioning as a function of time-on-stream for an un-promoted iron-based Fischer-Tropsch synthesis catalyst applied to CO hydrogenation. Ind. Eng. Chem. Res. 2019, 59, 52–60. [Google Scholar] [CrossRef]
- Warringham, R.; Davidson, A.L.; Webb, P.B.; Tooze, R.P.; Parker, S.F.; Lennon, D. Perspectives on the effect of sulfur on the hydrocarbonaceous overlayer on iron Fischer-Tropsch catalysts. Catal. Today 2020, 339, 32–39. [Google Scholar] [CrossRef]
- Davidson, A.L.; Gibson, E.K.; Cibin, G.; Vanrensburg, H.; Parker, S.F.; Webb, P.B.; Lennon, D. The application of inelastic neutron scattering to investigate iron-based Fischer-Tropsch to olefins catalysis. J. Catal. 2020, 393, 197–208. [Google Scholar] [CrossRef]
- Davidson, A.L.; Webb, P.B.; Parker, S.F.; Lennon, D. An inelastic neutron scattering investigation of the temporal behaviour of the hydrocarbonaceous overlayer of a prototype Fischer-Tropsch to olefins catalyst. Top. Catal. 2021. [Google Scholar] [CrossRef]
- Davidson, A.L.; Lennon, D.; Webb, P.B.; Albers, P.W.; Berweiler, M.; Poss, R.; Roos, M.; Reinsdorf, A.; Wolf, D.; Parker, S.F. The characterisation of hydrogen on nickel and cobalt catalysts. Top. Catal. 2021. [Google Scholar] [CrossRef]
- The Methanol Institute. Available online: https://www.methanol.org/methanol-price-supply-demand/ (accessed on 9 April 2021).
- Waugh, K.C. Methanol synthesis. Catal. Lett. 2012, 142, 1153–1166. [Google Scholar] [CrossRef]
- Trunov, V.A.; Sokolov, A.E.; Lebedev, V.T.; Smirnov, O.P.; Kurbakov, A.I.; van den Heuvel, J.; Batyrev, E.; Yurieva, T.M.; Plyasova, L.M.; Török, G. Detection of hydrogen-copper clustering in Zn1−x CuxO compounds using neutron scattering methods. Phys. Solid State 2006, 48, 1291–1297. [Google Scholar] [CrossRef]
- Trunov, V.A.; Lebedev, V.T.; Sokolov, A.E.; Grushko, Y.S.; Török, G.; van den Heuvel, J.; Batyrev, E.; Yurieva, T.M.; Plyasova, L.M. Investigation of the hydrogen capacity of composites based on ZnOCu. Crystallog. Rep. 2007, 52, 474–478. [Google Scholar] [CrossRef]
- Kandemir, T.; Wallacher, D.; Hansen, T.C.; Liss, K.-D.; d’Alnoncourt, R.N.; Schlögl, R.; Behrens, M. In situ neutron diffraction under high pressure—Providing an insight into working catalysts. Nucl. Instrum. Methods Phys. Res. Sect. A 2012, 673, 51–55. [Google Scholar] [CrossRef] [Green Version]
- Kandemir, T.; Girgsdies, F.; Hansen, T.C.; Liss, K.-D.; Kasatkin, I.; Kunkes, E.L.; Wowsnick, G.; Jacobsen, N.; Schlögl, R.; Behrens, M. In situ study of catalytic processes: Neutron diffraction of a methanol synthesis catalyst at industrially relevant pressure. Angew. Chem. Int. Ed. 2013, 52, 5166–5170. [Google Scholar] [CrossRef] [PubMed] [Green Version]
- Kandemir, T.; Kasatkin, I.; Girgsdies, F.; Zander, S.; Kühl, S.; Tovar, M.; Schlögl, R.; Behrens, M. Microstructural and defect analysis of metal nanoparticles in functional catalysts by diffraction and electron microscopy: The Cu/ZnO catalyst for methanol synthesis. Top. Catal. 2014, 57, 188–206. [Google Scholar] [CrossRef] [Green Version]
- Khassin, A.A.; Jobic, H.; Filonenko, G.A.; Dokuchits, E.V.; Khasin, A.V.; Minyukova, T.P.; Shtertser, N.V.; Plyasova, L.M.; Yurieva, T.M. Interaction of hydrogen with Cu–Zn mixed oxide model methanol synthesis catalyst. J. Mol. Catal. A 2013, 373, 151–160. [Google Scholar] [CrossRef]
- Kandemir, T.; Friedrich, M.; Parker, S.F.; Studt, F.; Lennon, D.; Schlögl, R.; Behrens, M. Different routes to methanol: Inelastic neutron scattering spectroscopy of adsorbates on supported copper catalysts. Phys. Chem. Chem. Phys. 2016, 18, 17253–17258. [Google Scholar] [CrossRef] [Green Version]
- Yarulina, I.; Chowdhury, A.D.; Meirer, F.; Weckhuysen, B.M.; Gascon, J. Recent trends and fundamental insights in the methanol-to-hydrocarbons process. Nat. Catal. 2018, 1, 398–411. [Google Scholar] [CrossRef]
- Haw, J.F.; Song, W.; Marcus, D.M.; Nicholas, J.B. The mechanism of methanol to hydrocarbon catalysis. Acc. Chem. Res. 2003, 36, 317–326. [Google Scholar] [CrossRef]
- Gogate, M.R. Methanol-to-olefins process technology: Current status and future prospects. Pet. Sci. Technol. 2019, 37, 559–565. [Google Scholar] [CrossRef]
- Howe, R.F.; McGregor, J.; Parker, S.F.; Collier, P.; Lennon, D. Application of inelastic neutron scattering to the methanol-to-gasoline reaction over a ZSM-5 catalyst. Catal. Lett. 2016, 46, 1242–1248. [Google Scholar] [CrossRef] [PubMed] [Green Version]
- Suwardiyanto; Howe, R.F.; Gibson, E.K.; Catlow, C.R.A.; Hameed, A.; McGregor, J.; Collier, P.; Parker, S.F.; Lennon, D. An assessment of hydrocarbon species in the methanol-to-hydrocarbon reaction over a ZSM-5 catalyst. Faraday Discuss. 2017, 197, 447–471. [Google Scholar] [CrossRef] [Green Version]
- Matam, S.K.; O’Malley, A.J.; Catlow, C.R.A.; Suwardiyanto; Collier, P.; Hawkins, A.; Zachariou, A.; Lennon, D.; Silverwood, I.; Parker, S.F.; et al. The effects of MTG catalysis on methanol mobility in ZSM-5. Cat. Sci. Technol. 2018, 8, 3304–3312. [Google Scholar] [CrossRef] [Green Version]
- Zachariou, A.; Hawkins, A.P.; Suwardiyanto; Collier, P.; Barrow, N.; Howe, R.F.; Parker, S.F.; Lennon, D. New spectroscopic insight into the deactivation of a ZSM-5 methanol-to-hydrocarbons catalyst. ChemCatChem 2021. [Google Scholar] [CrossRef]
- Lin, L.; Fan, M.; Sheveleva, A.M.; Han, X.; Tang, Z.; Carter, J.H.; da Silva, I.; Parlett, C.M.A.; Tuna, F.; McInnes, E.J.L.; et al. Control of zeolite microenvironment for propene synthesis from methanol. Nat. Commun. 2021, 12, 822. [Google Scholar] [CrossRef]
- Zachariou, A.; Hawkins, A.P.; Lennon, D.; Parker, S.F.; Suwardiyanto; Matam, S.K.; Catlow, C.R.A.; Collier, P.; Hameed, A.; McGregor, J.; et al. Investigation of ZSM-5 catalysts for dimethylether conversion using inelastic neutron scattering. Appl. Catal. A Gen. 2019, 569, 1–7. [Google Scholar] [CrossRef]
- Zachariou, A.; Hawkins, A.P.; Collier, P.; Howe, R.F.; Parker, S.F.; Lennon, D. The effect of co-feeding methyl acetate on the H-ZSM5 catalysed methanol-to-hydrocarbons reaction. Top. Catal. 2020, 63, 370–377. [Google Scholar] [CrossRef] [Green Version]
- Zachariou, A.; Hawkins, A.P.; Collier, P.; Howe, R.F.; Lennon, D.; Parker, S.F. The methyl torsion in unsaturated compounds. ACS Omega 2020, 5, 2755–2765. [Google Scholar] [CrossRef] [PubMed] [Green Version]
- Xia, Q.; Chen, Z.; Shao, Y.; Gong, X.; Wang, H.; Liu, X.; Parker, S.F.; Han, X.; Yang, S.; Wang, Y. Direct hydrodeoxygenation of raw woody biomass into liquid alkanes. Nat. Commun. 2016, 7, 11162. [Google Scholar] [CrossRef] [PubMed]
- Adilina, I.B.; Rinaldi, N.; Simanungkalit, S.; Aulia, F.; Oemry, F.; Stenning, G.; Silverwood, I.P.; Parker, S.F. Hydrodeoxygenation of guaiacol as a bio-oil model compound over pillared clay-supported nickel–molybdenum catalysts. J. Phys. Chem. C 2019, 123, 21429–21439. [Google Scholar] [CrossRef] [Green Version]
- Shao, Y.; Xia, Q.; Dong, L.; Liu, X.; Han, X.; Parker, S.F.; Cheng, Y.; Daemen, L.L.; Ramirez-Cuesta, A.J.; Yang, S.; et al. Selective production of arenes via direct lignin upgrading over a niobium-based catalyst. Nat. Commun. 2017, 8, 16104. [Google Scholar] [CrossRef]
- Dong, L.; Shao, Y.; Han, X.; Liu, X.; Xia, Q.; Parker, S.F.; Cheng, Y.; Daemen, L.L.; Ramirez-Cuesta, A.J.; Yang, Y. Comparison of two multifunctional catalysts [M/Nb2O5 (M = Pd, Pt)] for one-pot hydrodeoxygenation of lignin. Cat. Sci. Technol. 2018, 8, 6129–6136. [Google Scholar] [CrossRef] [Green Version]
- Dong, L.; Lin, L.; Han, X.; Si, X.; Liu, X.; Guo, Y.; Lu, F.; Rudić, S.; Parker, S.F.; Yang, S.; et al. Breaking the limit of lignin monomer production via cleavage of interunit carbon–carbon linkages. Chem 2019, 6, 1521–1536. [Google Scholar] [CrossRef] [Green Version]
- Yan, K.; Yang, Y.; Chai, J.; Lu, Y. Catalytic reactions of gamma-valerolactone: A platform to fuels and value-added chemicals. Appl. Catal. B Environ. 2015, 179, 292–304. [Google Scholar] [CrossRef]
- Lin, L.; Sheveleva, A.M.; da Silva, I.; Parlett, C.M.A.; Tang, Z.; Liu, Y.; Fan, M.; Han, X.; Carter, J.H.; Tuna, F.; et al. Quantitative production of butenes from biomass-derived γ-valerolactone catalysed by hetero-atomic MFI zeolite. Nat. Mater. 2020, 19, 86–93. [Google Scholar] [CrossRef]
- Mehta, V.; Cooper, J.S. Review and analysis of PEM fuel cell design and manufacturing. J. Power Sources 2003, 114, 32–53. [Google Scholar] [CrossRef]
- Mohammad, N.; Mohamad, A.B.; Kadhum, A.A.H.; Loh, K.S. A review on synthesis and characterization of solid acid materials for fuel cell applications. J. Power Sources 2016, 322, 77–92. [Google Scholar] [CrossRef]
- Kreuer, K.-D. Proton-conducting oxides. Annu. Rev. Mater. Res. 2003, 33, 333–359. [Google Scholar] [CrossRef] [Green Version]
- Mahato, N.; Banerjee, A.; Gupta, A.; Omar, S.; Balani, K. Progress in material selection for solid oxide fuel cell technology: A review. Prog. Mater. Sci. 2015, 72, 141–337. [Google Scholar] [CrossRef]
- Asada, H.; Toya, T. Study of hydrogen adsorbed on platinum by neutron inelastic scattering spectroscopy. J. Chem. Phys. 1975, 63, 4078–4079. [Google Scholar] [CrossRef]
- Rush, J.J.; Cavanagh, R.R.; Kelley, R.D. Neutron scattering from adsorbates on platinum black. J. Vac. Sci. Technol. A 1983, 1, 1245–1246. [Google Scholar] [CrossRef]
- Renouprez, A.J.; Jobic, H. Neutron scattering study of hydrogen adsorption on platinum catalysts. J. Catal. 1988, 113, 509–516. [Google Scholar] [CrossRef]
- Albers, P.; Auer, E.; Ruth, K.; Parker, S.F. Inelastic neutron scattering investigation of the nature of surface sites occupied by hydrogen on highly dispersed platinum on commercial carbon black supports. J. Catal. 2000, 196, 174–179. [Google Scholar] [CrossRef]
- Albers, P.W.; Lopez, M.; Sextl, G.; Jeske, G.; Parker, S.F. Inelastic neutron scattering investigation on the site occupation of atomic hydrogen on platinum particles of different size. J. Catal. 2004, 223, 44–53. [Google Scholar] [CrossRef]
- Carosso, M.; Vottero, E.; Lazzarini, A.; Morandi, S.; Manzoli, M.; Lomachenko, K.A.; Jiménez-Ruiz, M.; Pellegrini, R.; Lamberti, C.; Piovano, A.; et al. Dynamics of reactive species and reactant-induced reconstruction of Pt clusters in Pt/Al2O3 catalysts. ACS Catal. 2019, 9, 7124–7136. [Google Scholar] [CrossRef]
- Parker, S.F.; Mukhopadhyay, S.; Jiménez-Ruiz, M.; Albers, P.W. Adsorbed states of hydrogen on platinum: A new perspective. Chem. Eur. J. 2019, 25, 6496–6499. [Google Scholar] [CrossRef] [Green Version]
- Parker, S.F.; Shah, S. Characterisation of hydration water in Nafion membrane. RSC Adv. 2012, 11, 9381–9385. [Google Scholar] [CrossRef]
- Perrin, J.-C.; Lyonnard, S.; Volino, F. Quasielastic neutron scattering study of water dynamics in hydrated Nafion membranes. J. Phys. Chem. C 2007, 111, 3393–3404. [Google Scholar] [CrossRef]
- Martinez, N.; Arnaud, M.A.; Berrod, Q.; Frick, B.; Ollivier, J.; Porcar, L. Multiscale water dynamics in a fuel cell by operando quasi elastic neutron scattering. J. Phys. Chem. C 2018, 122, 1103–1108. [Google Scholar] [CrossRef]
- Yamada, T.; Tominaga, T. In situ quasi-elastic neutron scattering of Nafion membrane with water-vapor pressure control system. JPS Conf. Proc. 2021, 33, 011085. [Google Scholar] [CrossRef]
- Kim, M.-H.; Glinka, C.J.; Grot, S.A.; Grot, W.G. SANS study of the effects of water vapor sorption on the nanoscale structure of perfluorinated sulfonic acid (NAFION) membranes. Macromolecules 2006, 39, 4775–4787. [Google Scholar] [CrossRef] [Green Version]
- Morin, A.; Gebel, G.; Porcar, L.; Peng, Z.; Martinez, N.; Guillermo, A.; Lyonnard, S. Quantitative multi-scale operando diagnosis of water localization inside a fuel cell. J. Electrochem. Soc. 2017, 164, F9–F21. [Google Scholar] [CrossRef]
- Ishikawa, A.; Maekawa, H.; Yamamura, T.; Kawakita, Y.; Shibata, K.; Kawai, M. Proton dynamics of CsH2PO4 studied by quasi-elastic neutron scattering and PFG-NMR. Solid State Ionics 2008, 149, 2345–2349. [Google Scholar] [CrossRef]
- Fillaux, F.; Marchon, B.; Novak, A.; Tomkinson, J. Proton dynamics in the hydrogen bond, inelastic neutron scattering by single crystals of CsH2PO4 at 20 K. Chem. Phys. 1989, 130, 257–270. [Google Scholar] [CrossRef]
- Belushkin, A.V.; Carlile, C.J.; Shuvalov, L.A. The diffusion of protons in the superionic conductor CsHSO4 by quasielastic neutron scattering. J. Phys. Condens. Matter 1992, 4, 389–398. [Google Scholar] [CrossRef]
- Belushkin, A.V.; Adams, M.A.; Kolesnikov, A.I.; Shuvalov, L.A. Lattice dynamics and effects of anharmonicity in different phases of caesium hydrogen sulphate. J. Phys. Condens. Matter 1994, 6, 5823–5832. [Google Scholar] [CrossRef]
- Krzystyniak, M.; Drużbicki, K.; Fernandez-Alonso, F. Nuclear dynamics in the metastable phase of the solid acid caesium hydrogen sulfate. Phys. Chem. Chem. Phys. 2015, 17, 31287–31296. [Google Scholar] [CrossRef] [PubMed] [Green Version]
- Parker, S.F.; Cavaye, H.; Callear, S.K. Structure and dynamics of the superprotonic conductor caesium hydrogen sulfate, CsHSO4. Molecules 2020, 25, 1271. [Google Scholar] [CrossRef] [Green Version]
- Kreuer, K.-D. On solids with liquid-like properties and the challenge to develop new proton-conducting separator materials for intermediate temperature fuel cells. ChemPhysChem 2002, 3, 771–775. [Google Scholar] [CrossRef]
- Karlsson, M. Perspectives of neutron scattering on proton conducting. Dalton Trans. 2013, 42, 317–329. [Google Scholar] [CrossRef]
- Kendrick, E.; Knight, K.S.; Islam, M.S.; Slater, P.R. Structural studies of the proton conducting perovskite ‘La0.6Ba0.4ScO2.8’. Solid State Ionics 2007, 178, 943–949. [Google Scholar] [CrossRef]
- Mather, G.C.; Heras-Juaristi, G.; Ritter, C.; Fuentes, R.O.; Chinelatto, A.L.; Perez-Coll, D.; Amador, U. Phase transitions, chemical expansion, and deuteron sites in the BaZr0.7Ce0.2Y0.1O3−δ proton conductor. Chem. Mater. 2016, 218, 4292–4299. [Google Scholar] [CrossRef]
- Kinyanjui, F.G.; Norberg, S.T.; Ahmed, I.; Eriksson, S.G.; Hull, S. In-situ conductivity and hydration studies of proton conductors using neutron powder diffraction. Solid State Ionics 2012, 225, 312–316. [Google Scholar] [CrossRef]
- Noferini, D.; Koza, M.M.; Nilsen, G.J.; Karlsson, M. Study of the hydration level in proton conducting oxides using neutron diffraction with polarization analysis. Solid State Ionics 2018, 324, 163–167. [Google Scholar] [CrossRef]
- Karlsson, M. Proton dynamics in oxides: Insight into the mechanics of proton conduction from quasielastic neutron scattering. Phys. Chem. Chem. Phys. 2015, 17, 26–38. [Google Scholar] [CrossRef] [PubMed]
- Noferini, D.; Koza, M.M.; Rahman, S.M.H.; Evenson, Z.; Nilsen, G.J.; Eriksson, S.; Wildes, A.R.; Karlsson, M. Role of the doping level in localized proton motions in acceptor-doped barium zirconate proton conductors. Phys. Chem. Chem. Phys. 2018, 20, 13697–13704. [Google Scholar] [CrossRef]
- Karlsson, M.; Matic, A.; Parker, S.F.; Ahmed, I.; Börjesson, L.; Eriksson, S. O-H wag vibrations in hydrated BaInxZr1-xO3-x/2. Phys. Rev. B 2008, 77, 104302. [Google Scholar] [CrossRef]
- Bielecki, J.; Parker, S.F.; Ekanayake, D.; Börjesson, L.; Karlsson, M. Short-range structure and phonon assignment of the brownmillerite-type oxide Ba2In2O5 and its hydrated proton-conducting form BaInO3H. J. Mater. Chem. A 2014, 2, 16915–16924. [Google Scholar] [CrossRef]
- Perrichon, A.; Jiménez-Ruiz, M.; Mazzei, L.; Rahman, S.M.H.; Karlsson, M. Local structure and vibrational dynamics of proton conducting Ba2In2O5(H2O)x. J. Mater. Chem. A 2019, 7, 17626–17636. [Google Scholar] [CrossRef] [Green Version]
- Mazzei, L.; Perrichon, A.; Mancini, A.; Wahnström, G.; Malavasi, L.; Parker, S.F.; Börjesson, L.; Karlsson, M. Local structure and vibrational dynamics in indium-doped barium zirconate. J. Mater. Chem. A 2019, 7, 7360–7372. [Google Scholar] [CrossRef] [Green Version]
- Perrichon, A.; Torino, N.; Granhed, E.J.; Lin, Y.-C.; Parker, S.F.; Jiménez-Ruiz, M.; Karlsson, M.; Henry, P. Local coordination environments and vibrational dynamics of protons in hexagonal and cubic Sc-doped BaTiO3 proton-conducting oxides. J. Phys. Chem. C 2020, 124, 8643–8651. [Google Scholar] [CrossRef] [Green Version]
- Jayaraman, V.; Magrez, A.; Caldes, M.; Joubert, O.; Taulelle, F.; Rodriguez-Carvajal, J.; Piffard, Y.; Brohan, L. Characterization of perovskite systems derived from Ba2In2O5? Part II: The proton compounds Ba2In2(1-x)Ti2xO4+2x(OH)y [0 ≤ x ≤ 1; y ≤ 2(1-x)]. Solid State Ionics 2004, 170, 25–32. [Google Scholar] [CrossRef]
- Chen, Y.; Yang, L.; Ren, F.; An, K. Visualizing the structural evolution of LSM/xYSZ Composite cathodes for SOFC by in-situ neutron diffraction. Sci. Rep. 2014, 4, 5179. [Google Scholar] [CrossRef] [Green Version]
- Hull, S. In-situ neutron diffraction experiments. In Electro-Chemo-Mechanics of Solids; Bishop, S., Perry, N., Marrocchelli, D., Sheldon, B., Eds.; Springer: Cham, Switzerland, 2017; pp. 66–101. [Google Scholar] [CrossRef]
- Sarno, C.; Yang, T.; Di Bartolomeo, E.; Huq, A.; Huang, H.; McIntosh, S. Oxygen vacancy localization and anisotropic oxygen anion transport in Sr1-xYxCoO3-δ (x = 0.1, 0.2) under solid oxide fuel cell cathode conditions. Solid State Ionics 2018, 321, 34–42. [Google Scholar] [CrossRef]
- Jarvis, S.M.; Samsatli, S. Technologies and infrastructures underpinning future CO2 value chains: A comprehensive review and comparative analysis. Renew. Sustain. Energy Rev. 2018, 85, 46–68. [Google Scholar] [CrossRef]
- Hepburn, C.; Adlen, E.; Beddington, J.; Carter, E.A.; Fuss, S.; Dowell, N.M.; Minx, J.C.; Smith, P.; Williams, C.K. The technological and economic prospects for CO2 utilization and removal. Nature 2019, 575, 87–97. [Google Scholar] [CrossRef] [Green Version]
- Gao, W.; Liang, S.; Wang, R.; Jiang, Q.; Zhang, Y.; Zheng, Q.; Xie, B.; Toe, C.Y.; Zhu, X.; Wang, J.; et al. Industrial carbon dioxide capture and utilization: State of the art and future challenges. Chem. Soc. Rev. 2020, 49, 8584–8686. [Google Scholar] [CrossRef] [PubMed]
- Hamza, A.; Hussein, I.A.; Al-Marri, M.J.; Mahmoud, M.; Shawabkeh, R.; Aparicio, S. CO2 enhanced gas recovery and sequestration in depleted gas reservoirs: A review. J. Pet. Sci. Eng. 2021, 196, 107685. [Google Scholar] [CrossRef]
- Gambelli, A.M.; Castellani, B.; Nicolini, A.; Rossi, F. Experimental study on natural gas hydrate exploitation: Optimization of methane recovery, carbon dioxide storage and deposit structure preservation. J. Pet. Sci. Eng. 2019, 177, 594–601. [Google Scholar] [CrossRef]
- Gambelli, A.M. An experimental description of the double positive effect of CO2 injection in methane hydrate deposits in terms of climate change mitigation. Chem. Eng. Sci. 2021, 233, 116430. [Google Scholar] [CrossRef]
- Dutcher, B.; Fan, M.; Russell, A.G. Amine-based CO2 capture technology development from the beginning of 2013—A review. ACS Appl. Mater. Interfaces 2015, 7, 2137–2148. [Google Scholar] [CrossRef]
- Trickett, C.A.; Helal, A.; Al-Maythalony, B.A.; Yamani, Z.H.; Cordova, K.E.; Yaghi, O.M. The chemistry of metal–organic frameworks for CO2 capture, regeneration and conversion. Nat. Rev. Mater. 2017, 2, 17045. [Google Scholar] [CrossRef]
- Benson, O.; da Silva, I.; Argent, S.P.; Cabot, R.; Savage, M.; Godfrey, H.G.W.; Yan, Y.; Parker, S.F.; Manuel, P.; Lennox, M.J.; et al. Amides do not always work: Observation of guest binding in an amide-functionalised porous host. J. Am. Chem. Soc. 2016, 138, 14828–14831. [Google Scholar] [CrossRef]
- Easun, T.L.; Moreau, F.; Yan, Y.; Yang, S.; Schröder, M. Structural and dynamic studies of substrate binding in porous metal—Organic frameworks. Chem. Soc. Rev. 2017, 46, 239–274. [Google Scholar] [CrossRef] [PubMed] [Green Version]
- Moreau, F.; da Silva, I.; Al Smail, N.H.; Easun, T.L.; Savage, M.; Godfrey, H.G.W.; Parker, S.F.; Manuel, P.; Yang, S.; Schröder, M. Unravelling exceptional acetylene and carbon dioxide adsorption within a tetra-amide functionalized metal-organic framework. Nat. Commun. 2017, 8, 14085. [Google Scholar] [CrossRef]
- Wen, H.-M.; Liao, C.; Libo, L.L.; Alsalme, A.; Alothman, Z.; Krishna, R.; Wu, H.; Zhou, W.; Hu, J.; Chen, B. A metal–organic framework with suitable pore size and dual functionalities for highly efficient post-combustion CO2 capture. J. Mater. Chem. A 2019, 7, 3128–3134. [Google Scholar] [CrossRef]
- Duong, T.D.; Sapchenko, S.A.; da Silva, I.; Godfrey, H.G.W.; Cheng, Y.; Daemen, L.L.; Manuel, P.; Frogley, M.D.; Cinque, G.; Ramirez-Cuesta, A.J.; et al. Observation of binding of carbon dioxide to nitro-decorated metal–organic frameworks. Chem. Sci. 2020, 11, 5339–5346. [Google Scholar] [CrossRef]
- Driver, J.G.; Owen, R.E.; Makanyire, T.; Lake, J.A.; McGregor, J.; Styring, P. Blue urea: Fertilizer with reduced environmental impact. Front. Energy Res. 2019. [Google Scholar] [CrossRef] [Green Version]
- Darensbourg, D.J.; Wilson, S.J. What’s new with CO2? Recent advances in its copolymerization with oxiranes. Green Chem. 2012, 14, 2665–2671. [Google Scholar] [CrossRef]
- Grignard, B.; Gennen, S.; Jérôme, C.; Kleij, A.W.; Detrembleur, C. Advances in the use of CO2 as a renewable feedstock for the synthesis of polymers. Chem. Soc. Rev. 2019, 48, 4466–4514. [Google Scholar] [CrossRef]
- Langanke, J.; Wolf, A.; Hofmann, J.; Böhm, K.; Subhani, M.A.; Müller, T.E.; Leitner, W.; Gürtler, C. Carbon dioxide (CO2) as sustainable feedstock for polyurethane production. Green Chem. 2014, 16, 1865–1870. [Google Scholar] [CrossRef]
- Jang, J.H.; Ha, J.H.; Kim, I.; Baik, J.H.; Hong, S.C. Facile room-temperature preparation of flexible polyurethane foams from carbon dioxide based poly(ether carbonate) polyols with a reduced generation of acetaldehyde. ACS Omega 2019, 4, 7944–7952. [Google Scholar] [CrossRef] [PubMed] [Green Version]
- von der Assen, N.; Bardow, A. Life cycle assessment of polyols for polyurethane production using CO2 as feedstock: Insights from an industrial case study. Green Chem. 2014, 16, 3272–3280. [Google Scholar] [CrossRef] [Green Version]
- Youngs, T.G.A.; Manyar, H.; Bowron, D.T.; Gladden, L.F.; Hardacre, C. Probing chemistry and kinetics of reactions in heterogeneous catalysts. Chem. Sci. 2013, 4, 3484–3489. [Google Scholar] [CrossRef] [Green Version]
- Falkowska, M.; Chansai, S.; Manyar, H.G.; Gladden, L.F.; Bowron, D.T.; Youngs, T.G.A.; Hardacre, C. Determination of toluene hydrogenation kinetics with neutron diffraction. Phys. Chem. Chem. Phys. 2016, 18, 17237–17243. [Google Scholar] [CrossRef] [Green Version]
- Brenizer, J.S. A review of significant advances in neutron imaging from conception to the present. Phys. Procedia 2013, 43, 10–20. [Google Scholar] [CrossRef] [Green Version]
- Kardjilov, N.; Manke, I.; Woracek, R.; Hilger, A.; Banhart, J. Advances in neutron imaging. Mater. Today 2018, 21, 652–672. [Google Scholar] [CrossRef]
- Siegel, J.B.; Lin, X.; Stefanopoulou, A.G.; Hussey, D.S.; Jacobson, D.L.; Gorsich, D. Neutron imaging of lithium concentration in LFP pouch cell battery. J. Electrochem. Soc. 2011, 158, A523–A529. [Google Scholar] [CrossRef]
- Zhao, E.; Zhang, Z.-G.; Li, X.; He, L.; Yu, X.; Li, H.; Wang, F. Neutron-based characterization techniques for lithium-ion battery research. Chin. Phys. B 2020, 29, 018201. [Google Scholar] [CrossRef]
- Tang, H.-Y.; Santamaria, A.; Parka, J.W.; Lee, C.; Hwang, W. Quantification of water in hydrophobic and hydrophilic flow channels subjected to gas purging via neutron imaging. J. Power Sources 2011, 196, 9373–9381. [Google Scholar] [CrossRef]
- Manke, I.; Markötter, H.; Tötzke, C.; Kardjilov, N.; Grothausmann, R.; Dawson, M.; Hartnig, C.; Haas, S.; Thomas, D.; Hoell, A.; et al. Investigation of energy-relevant materials with synchrotron X-Rays and neutrons. Adv. Eng. Mater. 2011, 13, 712–729. [Google Scholar] [CrossRef]
- Kalyvas, C.; Kucernak, A.; Brett, D.; Hinds, G.; Atkins, S.; Brandon, N. Spatially resolved diagnostic methods for polymer electrolyte fuel cells: A review. WIREs Energy Environ. 2014, 3, 254–275. [Google Scholar] [CrossRef]
- Boillat, P.; Lehmann, E.H.; Trtik, P.; Cochet, M. Neutron imaging of fuel cells—Recent trends and future prospects. Curr. Opin. Electrochem. 2017, 5, 3–10. [Google Scholar] [CrossRef]
- Higuchi, Y.; Setoyama, D.; Isegawa, K.; Tsuchikawa, Y.; Matsumoto, Y.; Parker, J.D.; Shinohara, T.; Nagai, Y. Pulsed neutron imaging for differentiation of ice and liquid water towards fuel cell vehicle applications. Phys. Chem. Chem. Phys. 2021, 23, 1062–1071. [Google Scholar] [CrossRef]
- Ilisca, E. Ortho-para conversion of hydrogen molecules physisorbed on surfaces. Prog. Surf. Sci. 1992, 41, 217–335. [Google Scholar] [CrossRef]
- Romanelli, G.; Minniti, T.; Škoro, G.; Krzystyniak, M.; Taylor, J.; Fornalski, D.; Fernandez-Alonso, F. Visualization of the catalyzed nuclear-spin conversion of molecular hydrogen using energy-selective neutron imaging. J. Phys. Chem. C 2019, 123, 11745–11751. [Google Scholar] [CrossRef] [Green Version]
- ISIS Neutron and Muon Source. Watching Hydrogen Flip Its Spin. Available online: https://www.isis.stfc.ac.uk/Pages/Watching-hydrogen-flip-its-spin.aspx (accessed on 7 March 2021).
- Ossler, F.; Finney, C.E.A.; Warren, J.M.; Bilheux, J.-C.; Zhang, Y.; Mills, R.A.; Santodonato, L.J.; Bilheux, H.Z. Dynamics of hydrogen loss and structural changes in pyrolyzing biomass utilizing neutron imaging. Carbon 2021, 176, 511–529. [Google Scholar] [CrossRef]
- Toops, T.J.; Bilheux, H.Z.; Voisin, S.; Gregor, J.; Walker, L.; Strzelec, A.; Finney, C.E.A.; Pihl, J.A. Neutron tomography of particulate filters: A non-destructive investigation tool for applied and industrial research. Nucl. Inst. Meth. Phys. Res. A 2013, 729, 581–588. [Google Scholar] [CrossRef]
- Borgschulte, A.; Delmelle, R.; Duarte, R.B.; Heel, A.; Boillat, P.; Lehmann, E. Water distribution in a sorption enhanced methanation reactor by time resolved neutron imaging. Phys. Chem. Chem. Phys. 2016, 18, 17217–17223. [Google Scholar] [CrossRef]
- Terreni, J.; Trottmann, M.; Delmelle, R.; Heel, A.; Trtik, P.; Lehmann, E.H.; Borgschulte, A. Observing chemical reactions by time-resolved high-resolution neutron imaging. J. Phys. Chem. C 2018, 122, 23574–23581. [Google Scholar] [CrossRef]
- Terreni, J.; Billeter, E.; Sambalova, O.; Liu, X.; Trottmann, M.; Sterzi, A.; Geerlings, H.; Trtik, P.; Kaestner, A.; Borgschulte, A. Hydrogen in methanol catalysts by neutron imaging. Phys. Chem. Chem. Phys. 2020, 22, 22979–22988. [Google Scholar] [CrossRef] [PubMed]
- Lehmann, E.H. Neutron imaging facilities in a global context. J. Imaging 2017, 3, 52. [Google Scholar] [CrossRef] [Green Version]
- Kou, J.; Lu, C.; Wang, J.; Chen, Y.; Xu, Z.; Varma, R.S. Selectivity enhancement in heterogeneous photocatalytic transformations. Chem. Rev. 2017, 117, 1445–1514. [Google Scholar] [CrossRef] [Green Version]
- Roy, S.C.; Varghese, O.K.; Paulose, M.; Grimes, C.A. Toward solar fuels: Photocatalytic conversion of carbon dioxide to hydrocarbons. ACS Nano 2010, 4, 1259–1278. [Google Scholar] [CrossRef] [PubMed]
- Tseng, I.H.; Chang, W.C.; Wu, J.C.S. Photoreduction of CO2 using sol-gel derived titania and titania-supported copper catalysts. Appl. Catal. B 2002, 37, 37–48. [Google Scholar] [CrossRef]
- Heitmann, T.; Hester, G.; Mitra, S.; Calloway, T.; Tyagi, M.; Miskowiec, A.; Diallo, S.; Osti, N.; Mamontov, E. Probing Li ion dynamics in amorphous xLi2SO4·(1-x)LiPO3 by quasielastic neutron scattering. Solid State Ionics 2019, 334, 95–98. [Google Scholar] [CrossRef]
- Chen, Q.; Jalarvo, N.H.; Lai, W. Na ion dynamics in P2-Nax[Ni1/3Ti2/3]O2: A combination of quasi-elastic neutron scattering and first-principles molecular dynamics study. J. Mater. Chem. A 2020, 8, 25290–25297. [Google Scholar] [CrossRef]
- Howells, W.S.; Barnes, A.C.; Hamilton, M. Quasielastic neutron scattering and the dynamics of Mg2+ in the fast ion and liquid phases of Mg3Bi2. Physica B 1999, 266, 97–99. [Google Scholar] [CrossRef]
- Pinna, R.S.; Rudić, S.; Parker, S.F.; Armstrong, J.; Zanetti, M.; Škoro, G.; Waller, S.P.; Zacek, D.; Smith, C.A.; Capstick, M.J.; et al. The neutron guide upgrade of the TOSCA spectrometer. Nucl. Instrum. Methods Phys. Res. Sect. A 2018, 896, 68–74. [Google Scholar] [CrossRef] [Green Version]
- Andersen, K.H.; Argyriou, D.N.; Jackson, A.J.; Houston, J.; Henry, P.F.; Deen, P.P.; Toft-Petersen, R.; Beran, P.; Strobl, M.; Arnold, T.; et al. The instrument suite of the European Spallation Source. Nucl. Instrum. Methods Phys. Res. Sect. A 2020, 957, 163402–doi10. [Google Scholar] [CrossRef]
- The ISIS Neutron and Muon Source. The ISIS-II Roadmap. Available online: https://www.isis.stfc.ac.uk/Pages/ISIS-II%20Roadmap.pdf#search=ISIS%20II (accessed on 7 March 2021).
Figure 1.
Global greenhouse emissions by sector for 2016. Total emissions were 4.94 × 10¹⁰ tonnes CO2 equivalent. Reproduced from [5] under Creative Commons Attribution 4.0 International License, CC-BY.
Figure 1.
Global greenhouse emissions by sector for 2016. Total emissions were 4.94 × 10¹⁰ tonnes CO2 equivalent. Reproduced from [5] under Creative Commons Attribution 4.0 International License, CC-BY.

Figure 2.
INS spectra of the hydrocarbonaceous overlayer on Ni/Al2O3 methane reforming catalysts. (a) Before (blue) and after (red) dry reforming, where the carbon is predominantly present as amorphous carbon [37]. (b) After dry reforming, where the carbon is predominantly present as filamentous carbon [38]. (c) After steam reforming, where the carbon is predominantly present as filamentous carbon [34]. The same α-Al2O3 support was used in (b) and (c), but different to that used in (a).

Figure 3.
(a) Neutron powder diffraction data (black region between 16 and 23 h refers to time where neutron beam was unavailable); (b) mass of sample; (c) temperature of sample; (d) pressure within the reaction chamber (gas composition is shown at the top). The temperature dip between 4–5 h was due to a furnace trip error. Reproduced from [44] with permission of the PCCP Owner Societies.

Figure 4.
INS spectrum of a working technical-grade iron-based Fischer–Tropsch catalyst after Soxhlet extraction in toluene (red trace) [48]. The blue trace is the INS spectrum calculated from the mixed sp2/sp3 carbon fragment shown in the inset.
Figure 4.
INS spectrum of a working technical-grade iron-based Fischer–Tropsch catalyst after Soxhlet extraction in toluene (red trace) [48]. The blue trace is the INS spectrum calculated from the mixed sp2/sp3 carbon fragment shown in the inset.

Figure 5.
INS spectrum of a methanol-to-hydrocarbons H-ZSM-5 catalyst after 110 h on-stream at 350 °C (i) compared with the generated addition spectra (equimolar additions of model compound spectra). The colour coding highlights regions which are characteristic of the different hydrocarbons. (a) Comparison with methylated benzenes: (ii) all of the methylated benzenes; (iii) methylated benzenes with more than 4 or more methyl substitutions; (iv) methylated benzenes with up to 3 methyl substitutions. (b) Comparison with polycyclic aromatic molecules: (v) all polycyclics, (vi) naphthalenes and (vii) anthracenes. Sections (c,d) illustrate the principal contributors to the spectra: (c) methylated benzenes with ≥4 methyl groups; (d) naphthalenes; (e) anthracenes and pyrene. Reproduced from [73] under the Creative Commons Attribution 4.0 International License, CC-BY.

Figure 6.
Schematic representation of direct hydrodeoxygenation of raw woody biomass into liquid alkanes. Raw woody biomass can be directly converted into liquid alkanes over Pt/NbOPO4 catalyst in cyclohexane medium, with cellulose, hemicellulose and lignin fractions in solid woods being converted into hexanes, pentanes and alkylcyclohexanes, respectively. The red rectangle indicates the β-O-4 linkage. Adapted from [78] under the Creative Commons Attribution 4.0 International License, CC-BY.

Figure 7.
(Left)Production and upgrading of GVL to fuel, fuel additives and valuable chemicals [77]. (Right) Comparison of INS spectra for condensed solid GVL, adsorbed GVL and reacted GVL on NbAlS-1 (a hetero-atomic MFI-type zeolite). Reproduced from [83] with permission of Elsevier (left) and from [84] with permission of Springer Nature (right).
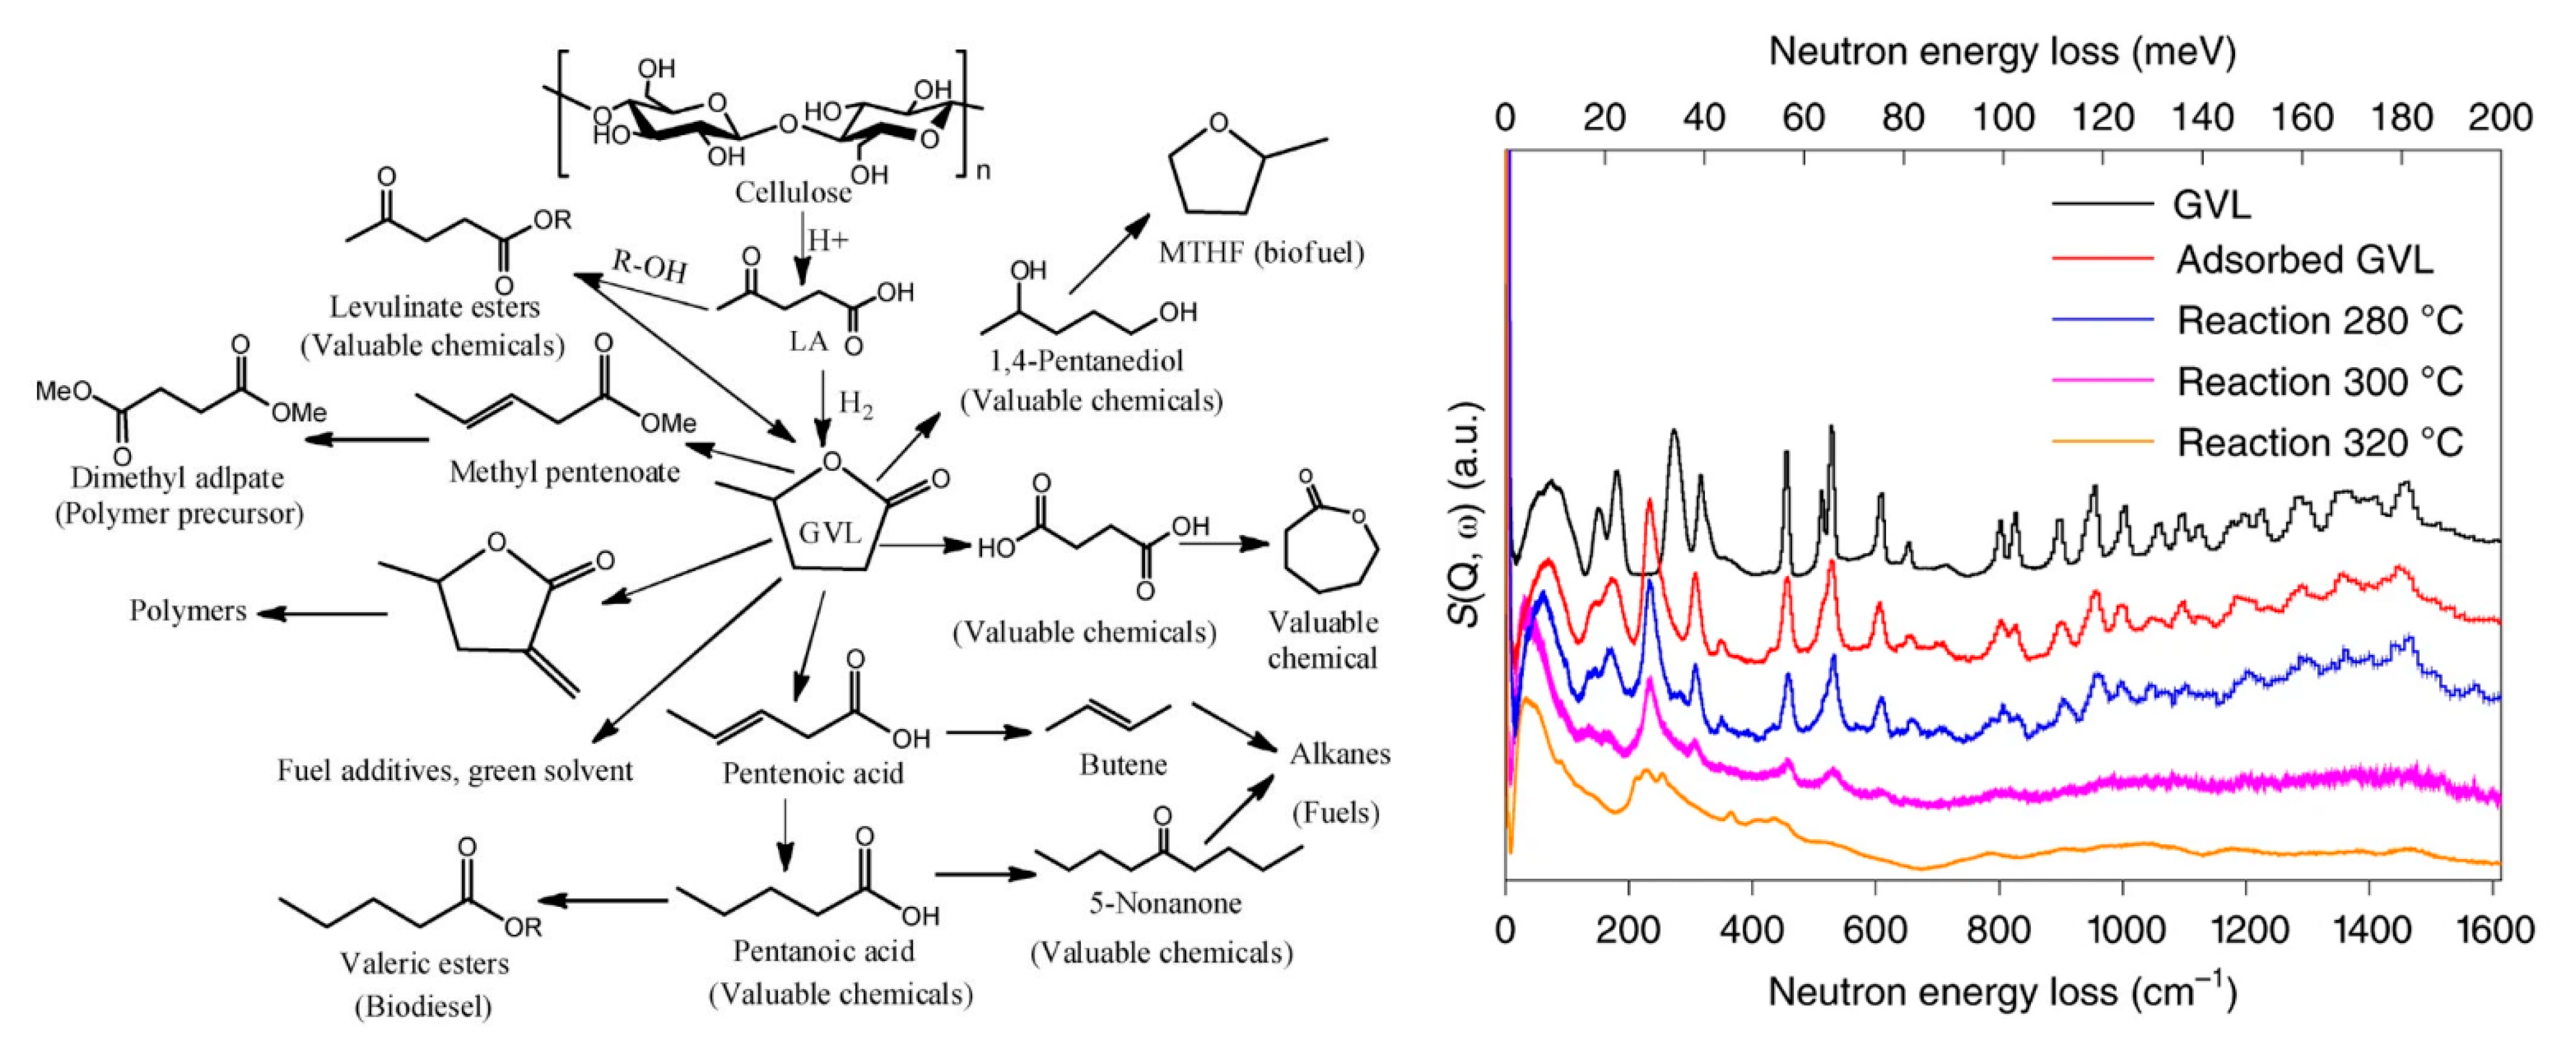
Figure 8.
(a) Schematic representation of the operando SANS experiment. The neutron transparent operating fuel cell, with air inlet/hydrogen outlet at the bottom, is vertically scanned and 2D scattering patterns are taken at each vertical position. The incoming beam (8 mm wide, 0.5 mm height) is horizontally positioned in the middle of the active area. (b) The 2D SANS patterns are radially averaged to obtain the I(Q) profiles at each normalized vertical position of the fuel cell. The I(Q) are characterized by the presence of the ionomer peak due to phase-separation in the hydrated polymer membrane, and a large-Q flat background due to the incoherent scattering from water molecules. (c) The amount of water inside the membrane, quantified by the average number of water molecules per sulfonic group, and the equivalent thickness of water outside the membrane are determined from the position of the ionomer peak and the incoherent background level, respectively. The evolution of water content along vertical scanning is obtained. The small size of the neutron beam allows discriminating the water distribution under serpentine ribs and channels. Reproduced from [101] with permission of The Institute of Physics.
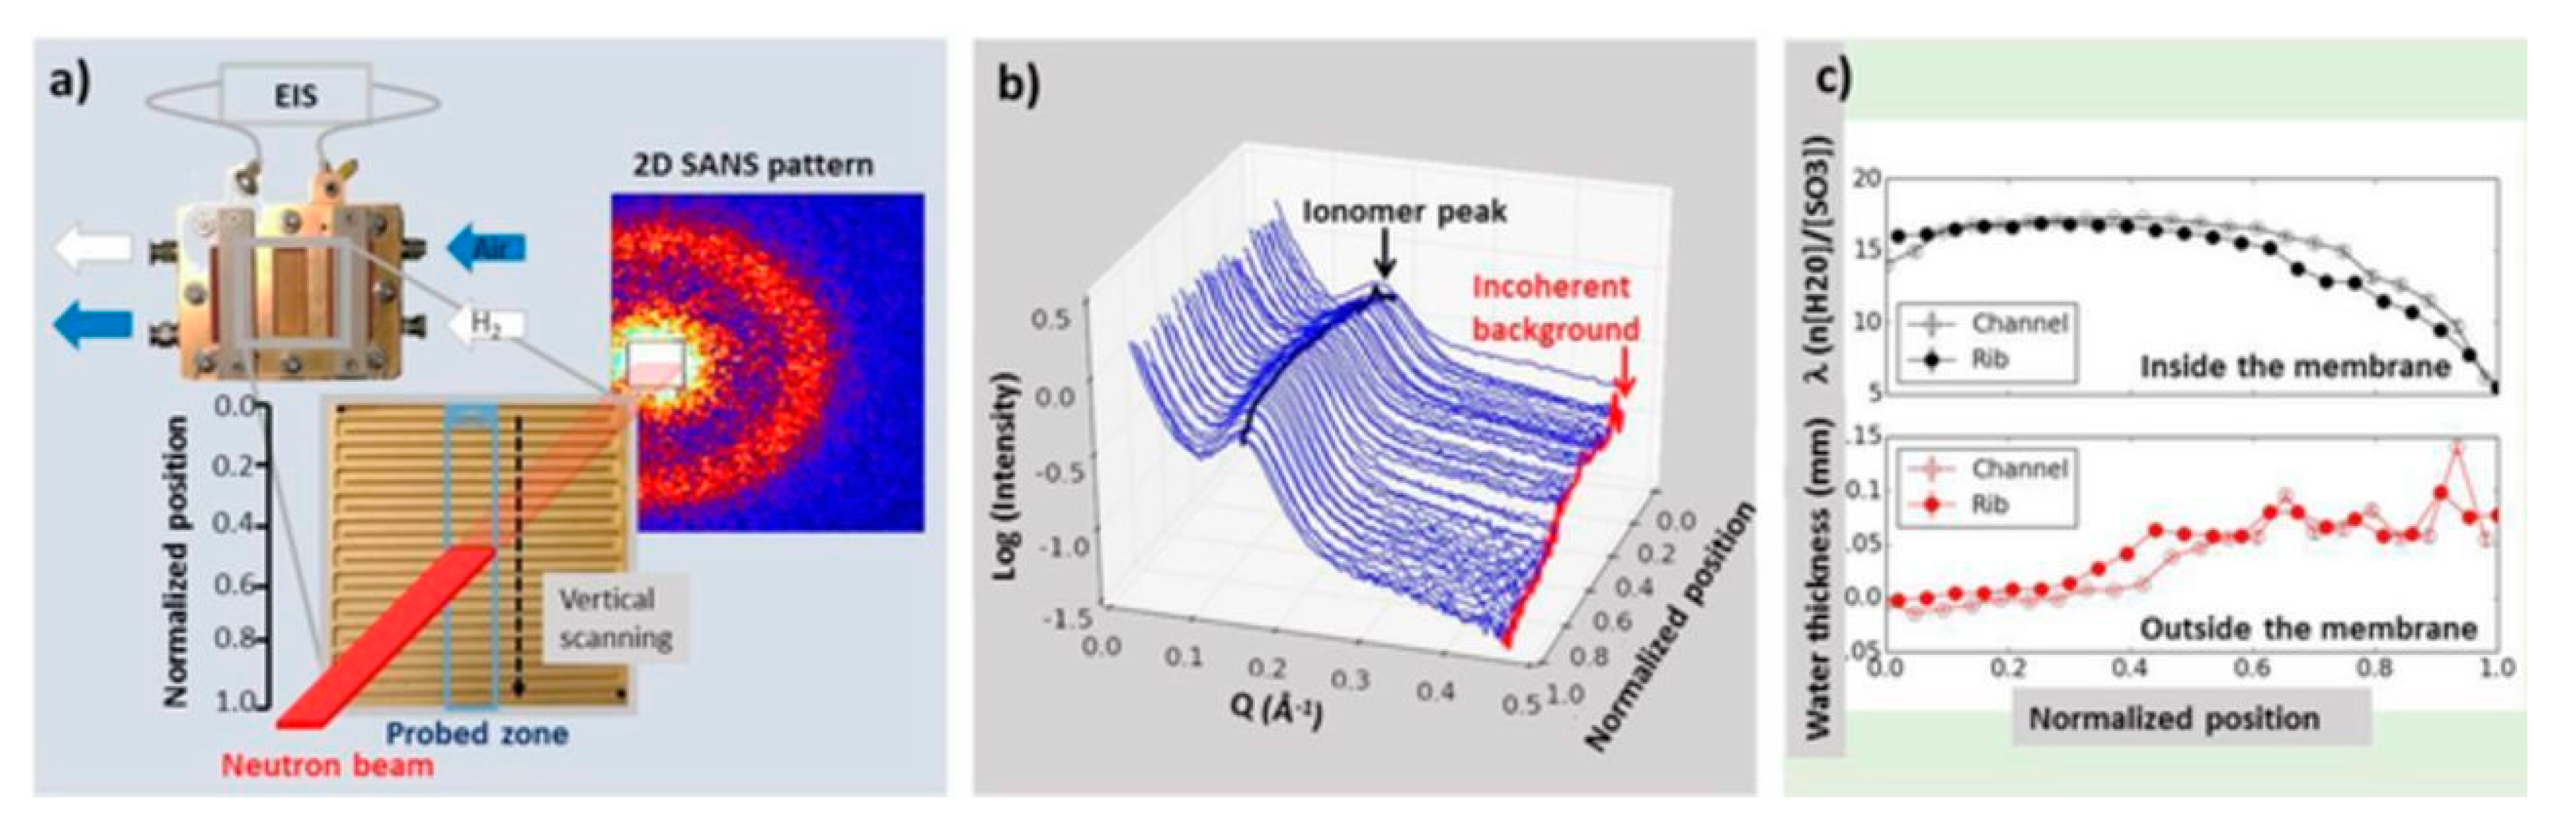
Figure 9.
(a) INS spectra for activated MOF MFM-102-NO2 and MFM-102-NO2 with CO2 loading. (b) Difference INS plot, derived by subtracting INS spectra for CO2-loaded MFM-102-NO2 and bare MFM-102-NO2 spectra. (Adapted from [137] under a Creative Commons Attribution 3.0 Unported License, CC-BY).
Figure 9.
(a) INS spectra for activated MOF MFM-102-NO2 and MFM-102-NO2 with CO2 loading. (b) Difference INS plot, derived by subtracting INS spectra for CO2-loaded MFM-102-NO2 and bare MFM-102-NO2 spectra. (Adapted from [137] under a Creative Commons Attribution 3.0 Unported License, CC-BY).

Figure 10.
Polyol production from CO2 and propylene oxide. (a) Polycarbonate and (b) poly(ether carbonate). Reproduced from [141] with permission from The Royal Society of Chemistry.
Figure 10.
Polyol production from CO2 and propylene oxide. (a) Polycarbonate and (b) poly(ether carbonate). Reproduced from [141] with permission from The Royal Society of Chemistry.
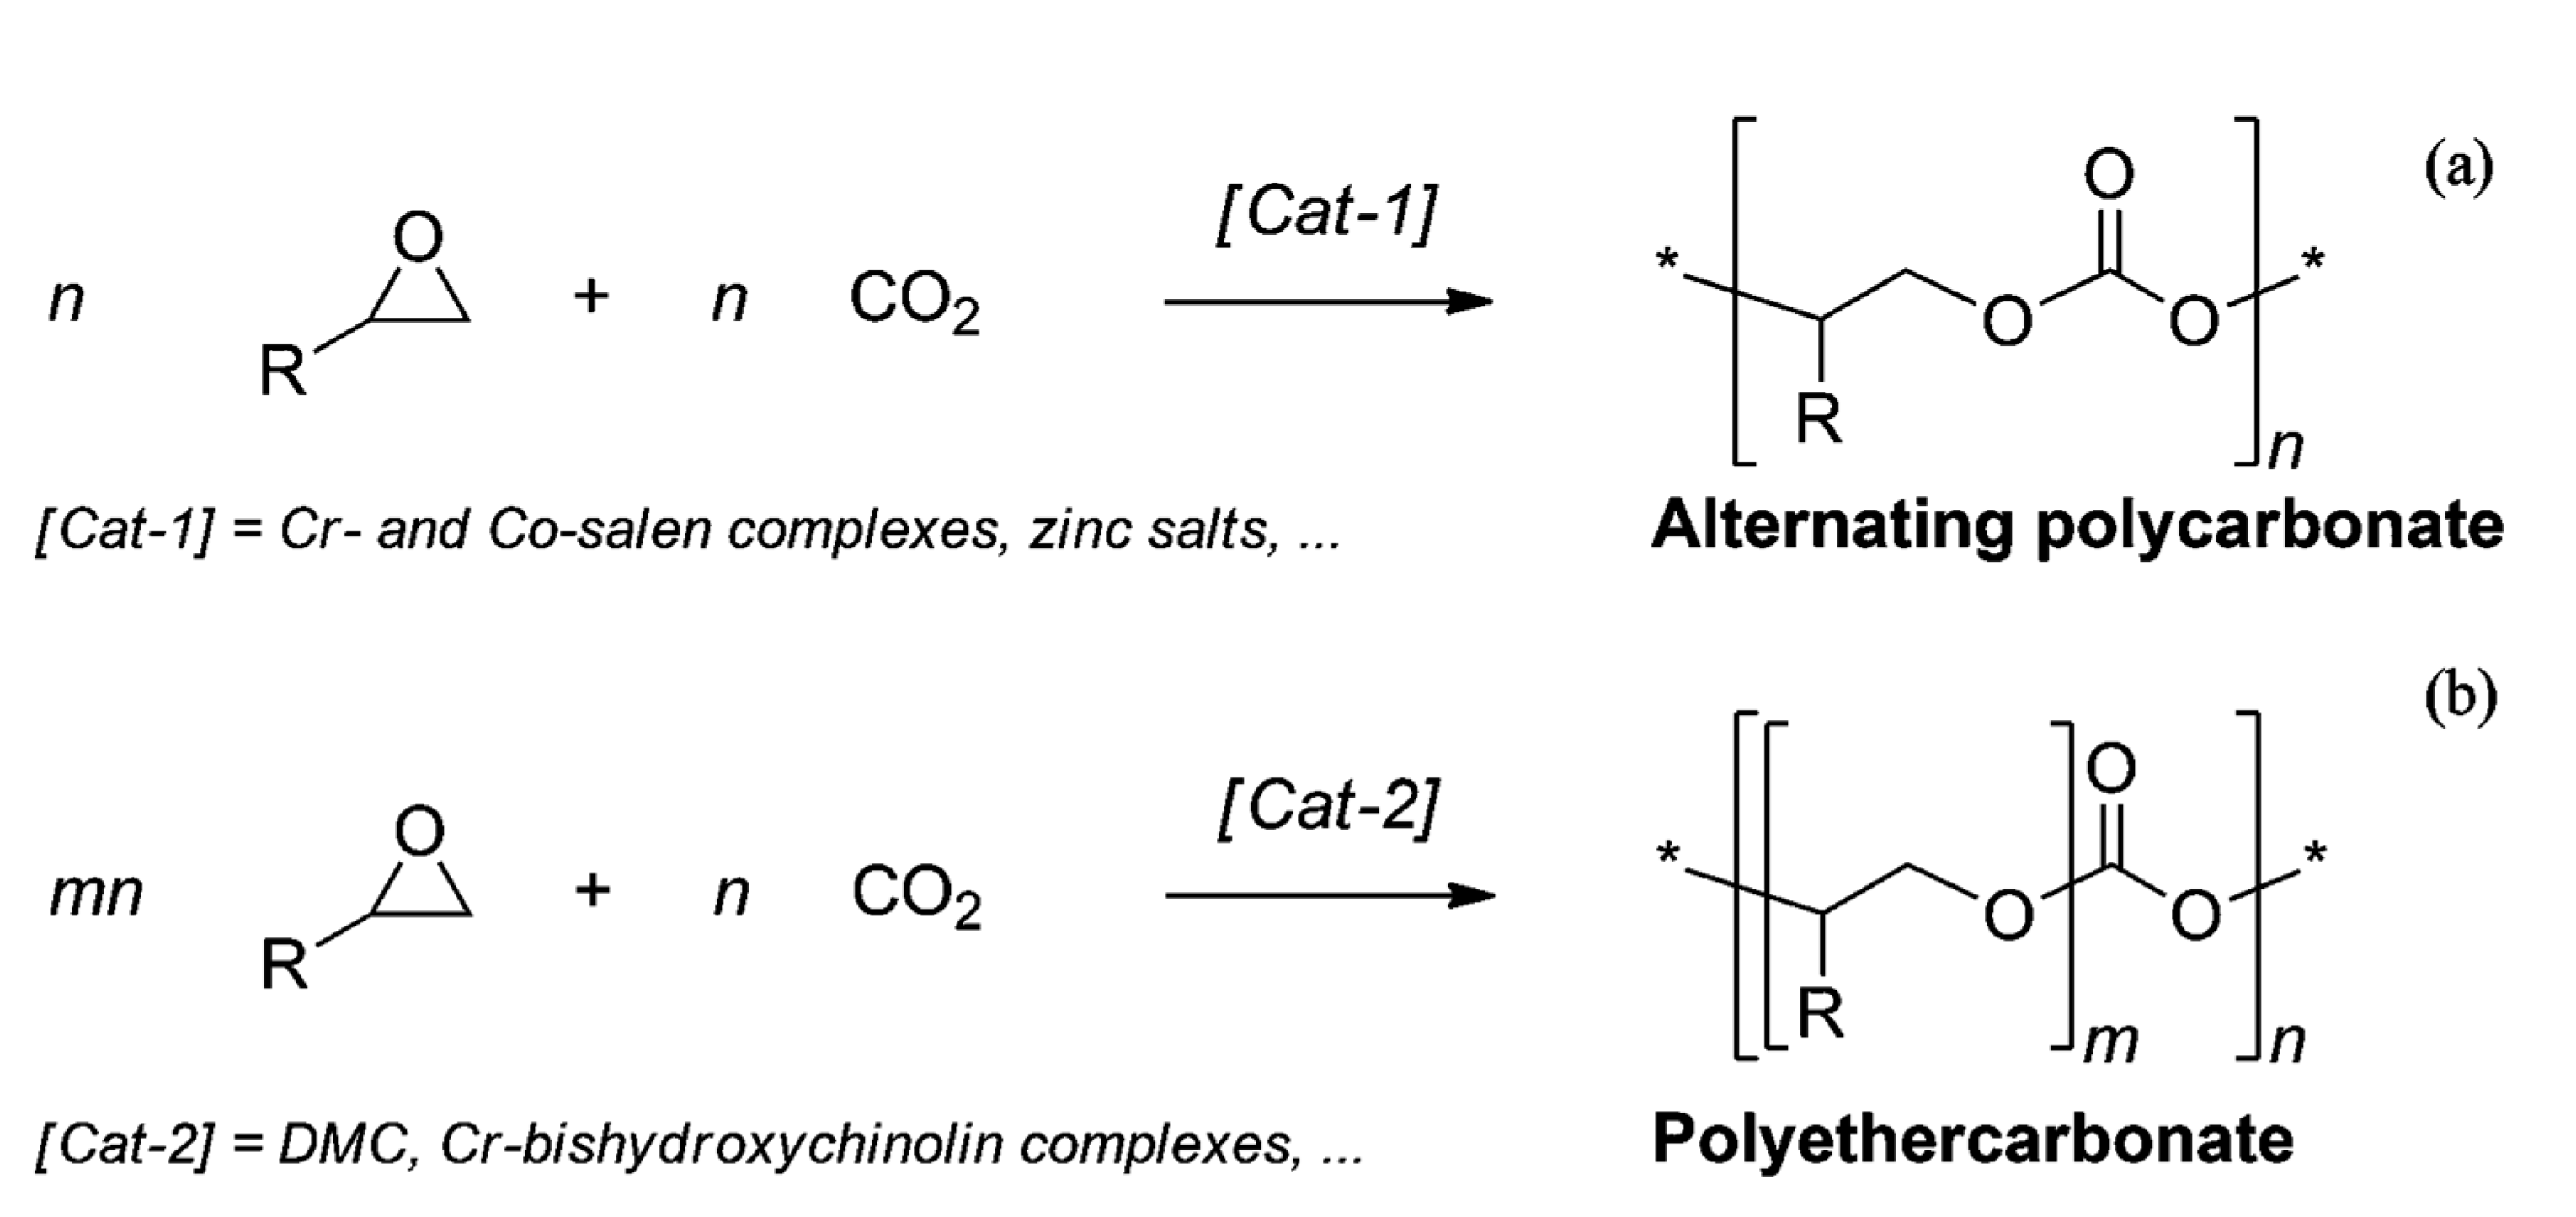
Figure 11.
Different contrast mechanisms can be used to explore various length scales in materials and to study their properties and related processes. The relation between contrast mechanisms and different application fields is presented. The length scale presented on the lower axis relates to the corresponding contrast mechanism specified on the upper axis. For the attenuation-based image techniques the large length scale was emphasized by grouping the scales from mm to cm. Reproduced from [147] with permission from Elsevier.
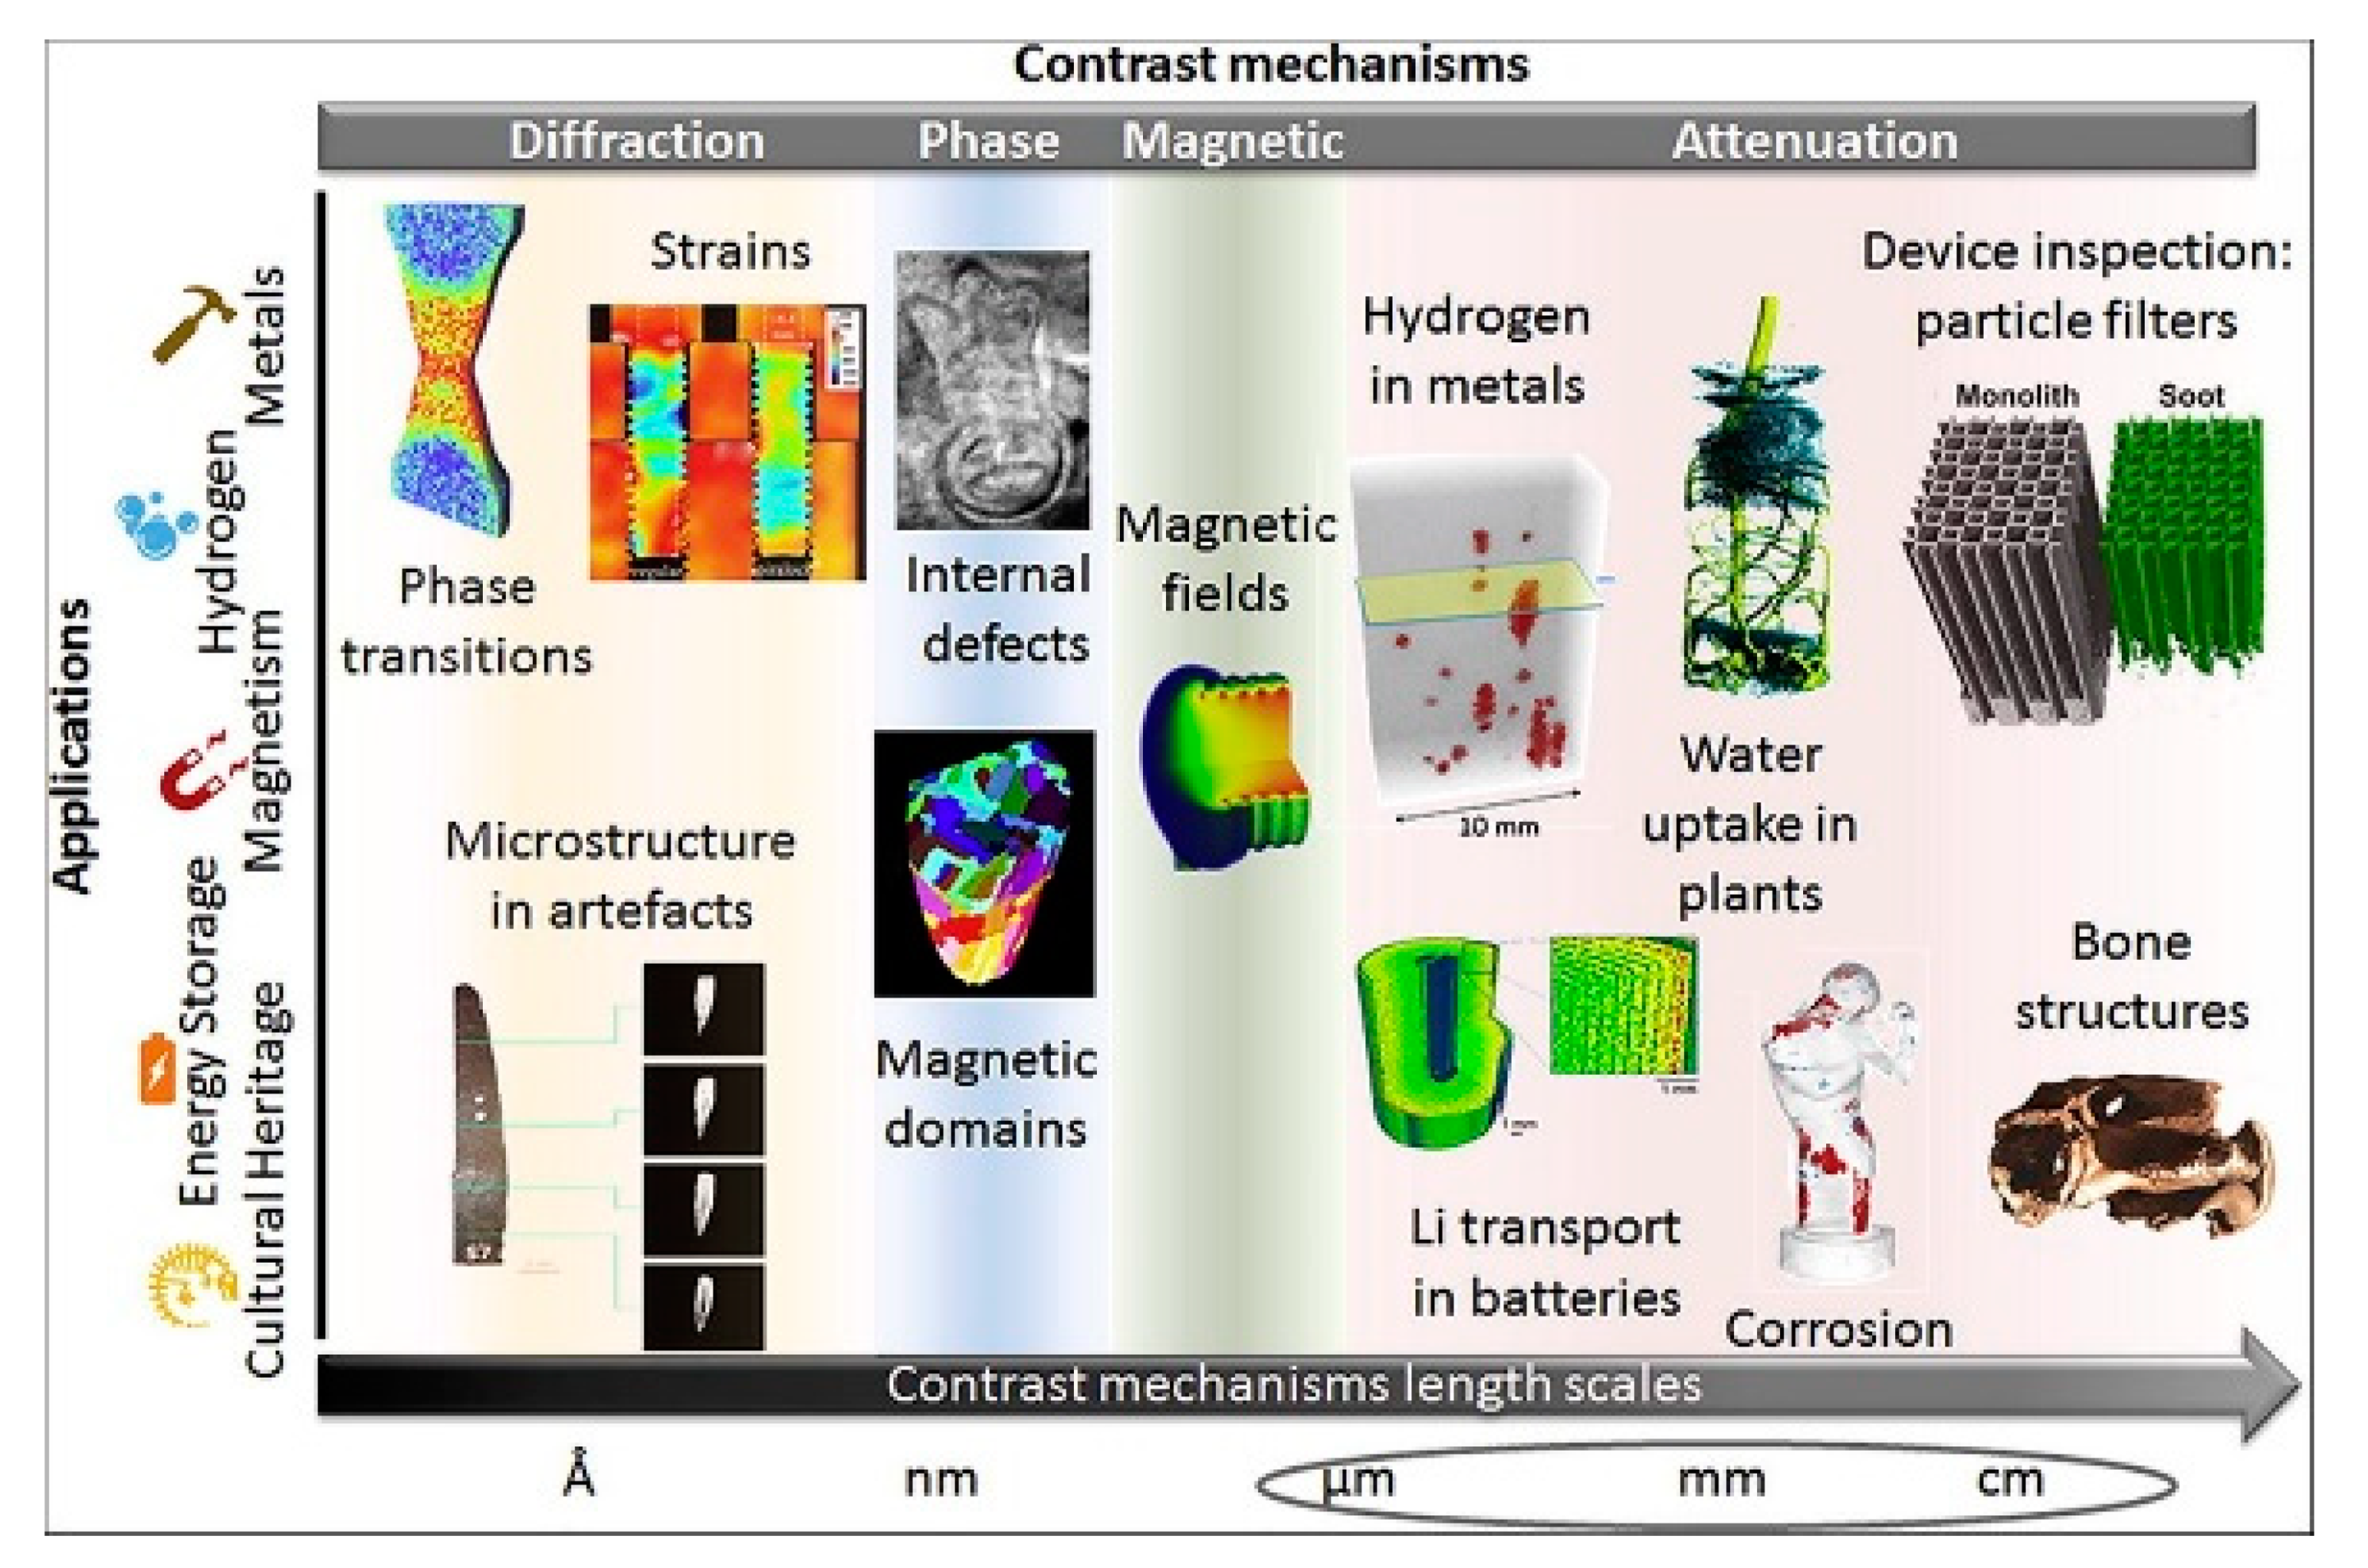
Figure 12.
Series of 2 s neutron radiographs during the H2 loading process at 15 K: no H2 loaded (A), adsorption onto the catalyst (B,C), filling of the rest of the container with liquid H2 (D), filled container with change in contrast in region II because of the conversion of o-H2 to p-H2 (E,F). Reprinted with permission from [156]. Copyright (2019) American Chemical Society.
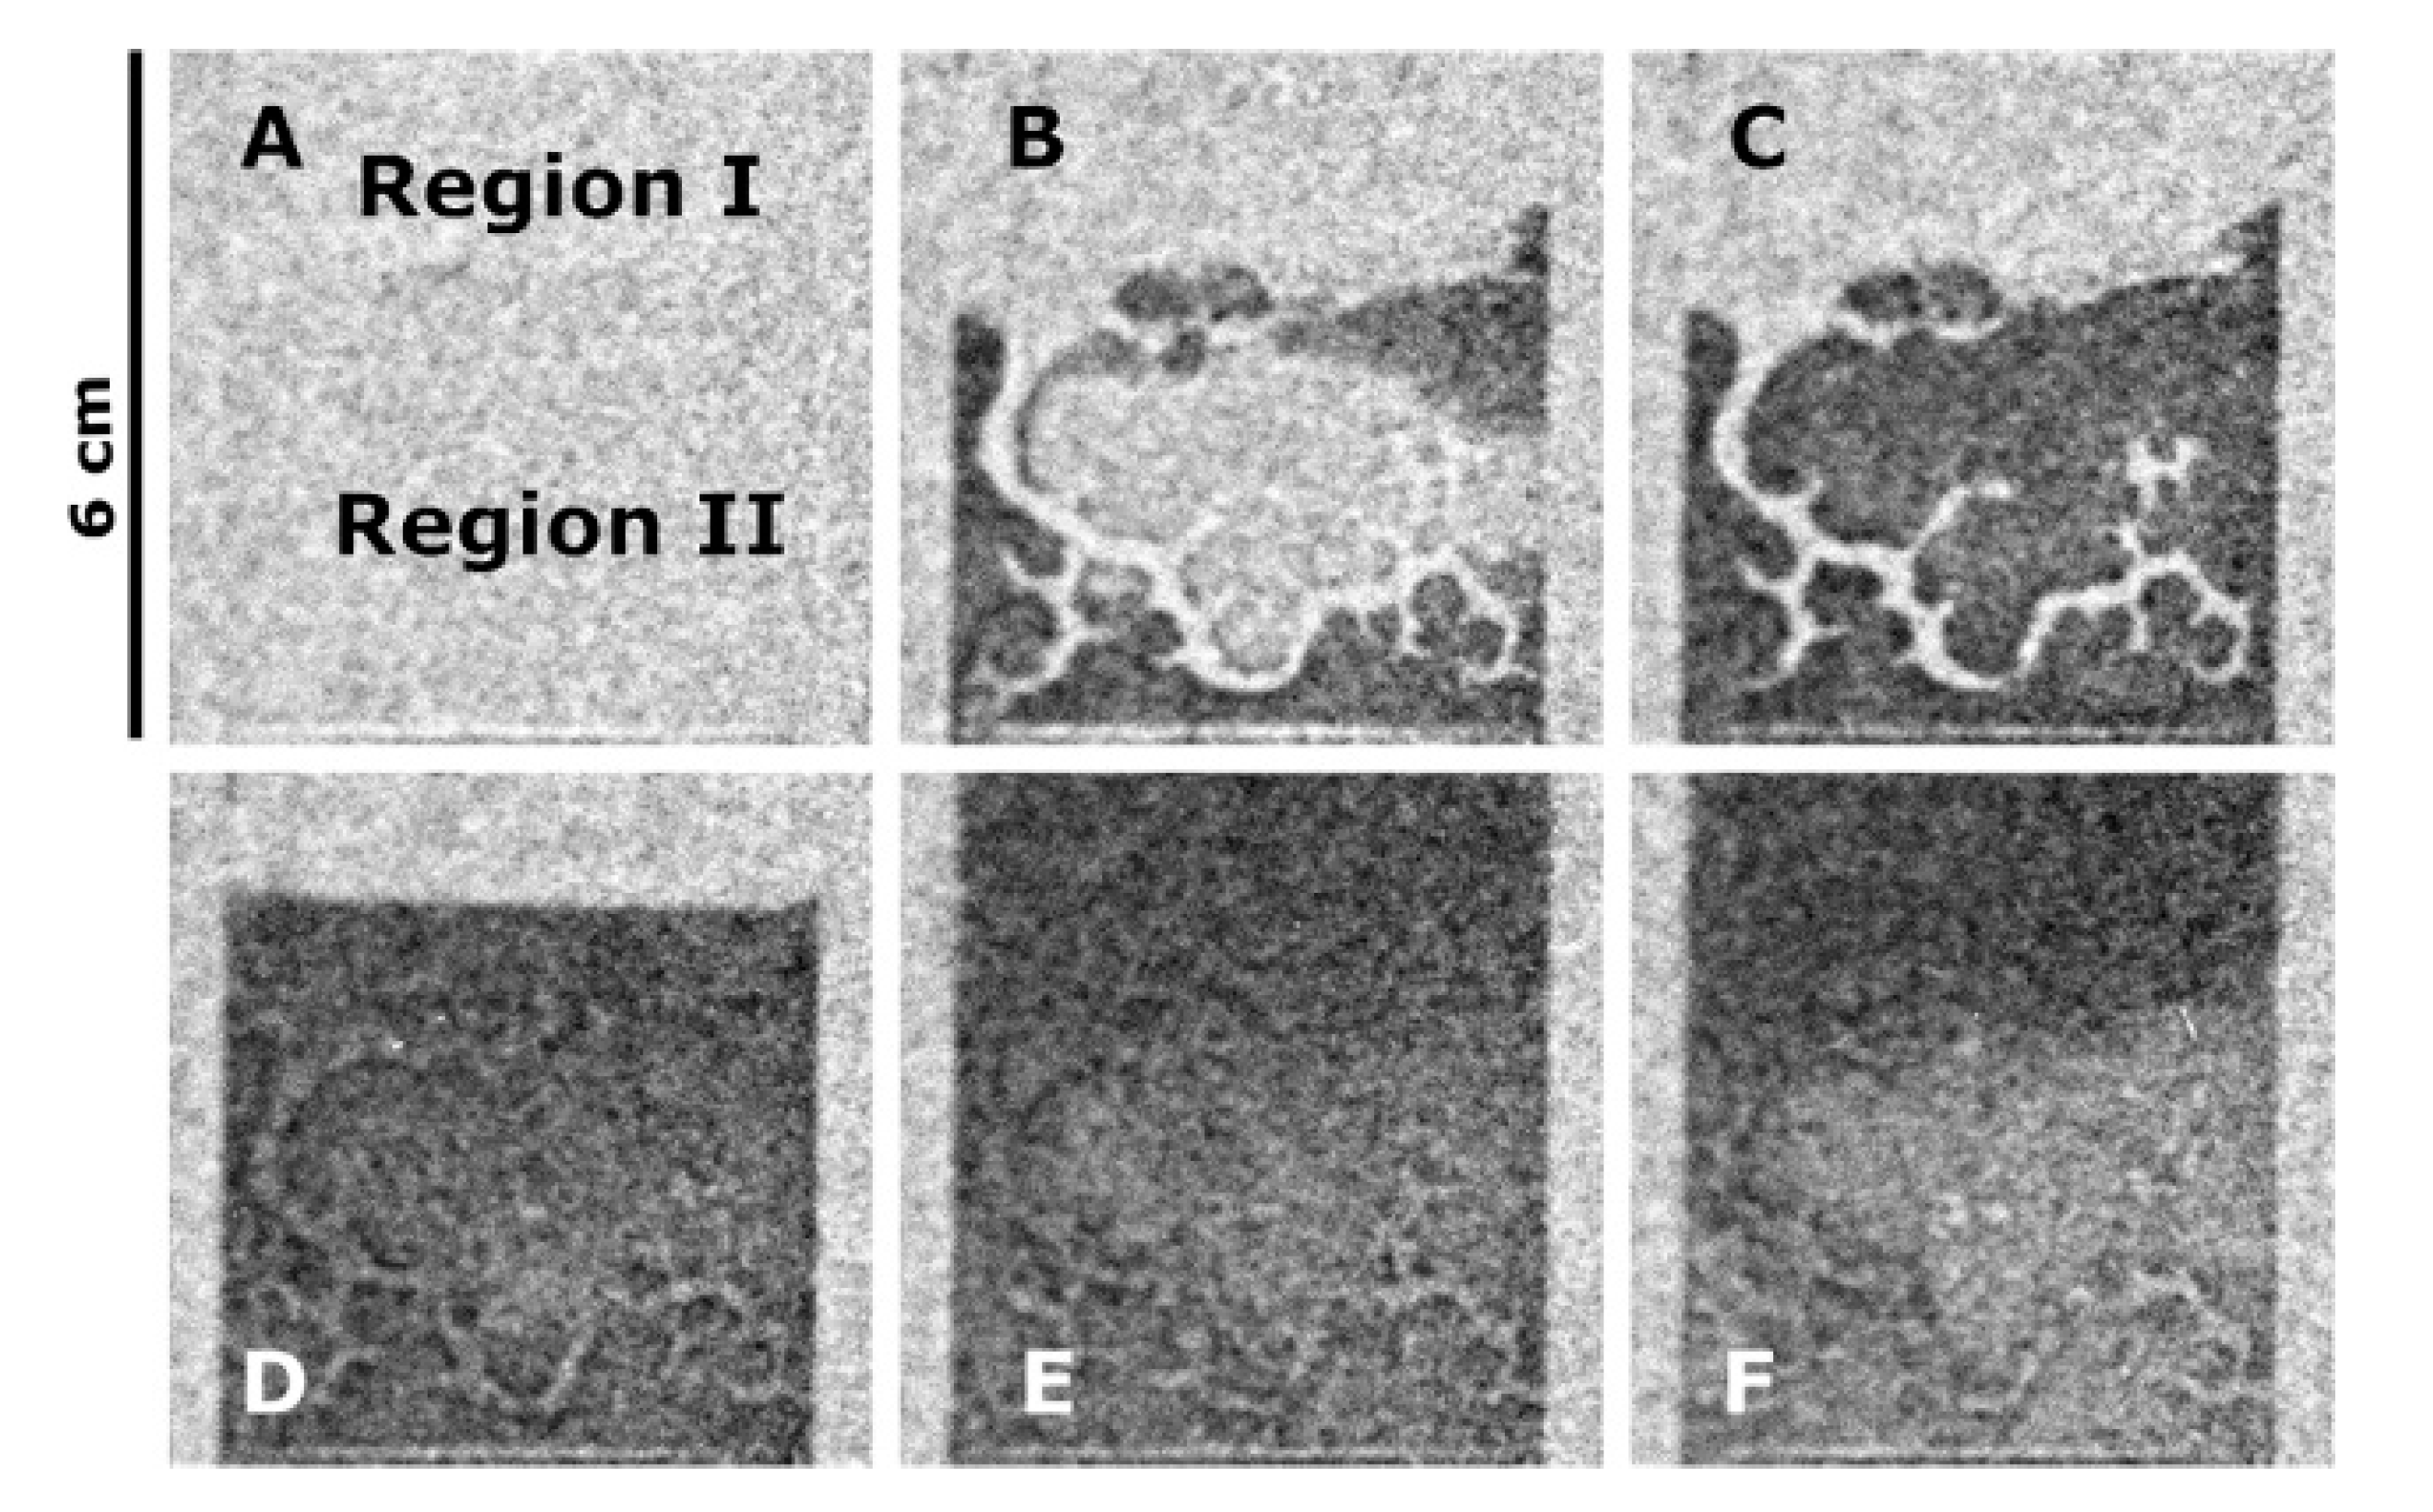
Figure 13.
Time series of high-resolution neutron images showing water adsorption from a humidified hydrogen gas stream (top row) and water accumulation during sorption-enhanced methanation (middle row). Temperature was 225 °C in both cases [153]. Bottom row left: Drawing of the reactor with dimensions, and the gas fluxes and gas analysis attached to it. Hydrogen flux is kept constant, and during the reaction and regeneration phase the CO2 flux is switched on and off, respectively [160]. Top two rows adapted with permission from [161]. Copyright (2018) American Chemical Society. Bottom row adapted from [160] with permission from The PCCP Owner Societies.

Figure 14.
Time resolved operando measurements: the neutron contrast as a parameter of the amount of hydrogen containing adsorbates on the catalyst surface reaches steady-state rapidly after switching from H2 to H2/CO2 mixtures as does the CO-yield. Contrarily, the methanol yield has a maximum on the fresh sample, and the water signal slowly increases. Switching off CO2 and reducing the pressure to ambient conditions forces desorption of intermediates and products. The immediate decrease of the CO signal indicates that there is only little CO adsorbed, while the increase of methanol and water proves that a substantial amount of methanol-related intermediates and the products themselves are adsorbed as also visible by the rather slow decay of the neutron contrast (the line is a fit to an exponential function). Reaction conditions: P = 12 bar, T = 473 K and H2:CO2 ratio = 6:1. Reproduced from [162] with permission from The PCCP Owner Societies.

Figure 15.
Estimated CO2 utilization potential and breakeven cost of different sub-pathways. The breakeven cost is the incentive, measured in 2015 USD per tonne of CO2, that is required to make the pathway economic. Negative breakeven costs indicate that the pathway is already profitable, without any incentive to utilize CO2 (such as a tax on CO2 emissions in cases in which utilization avoids emissions, or a subsidy for CO2 removed from the atmosphere in the case in which utilization removes CO2). Utilization estimates are based on 2050 projections. Many technologies are in the very early stages of development, and cost optimization via research and development could substantially change these estimates. Colour shadings reflect the technical readiness level (TRL) of the pathways, which again vary markedly within each pathway. Asterisks denote the storage duration offered by each pathway: days or months (*), decades (**) and centuries or more (***). (BECCS: Bioenergy with carbon capture and storage). Reproduced from [126] with permission of Springer Nature.

Publisher’s Note: MDPI stays neutral with regard to jurisdictional claims in published maps and institutional affiliations. |
© 2021 by the authors. Licensee MDPI, Basel, Switzerland. This article is an open access article distributed under the terms and conditions of the Creative Commons Attribution (CC BY) license (https://creativecommons.org/licenses/by/4.0/).
Share and Cite
MDPI and ACS Style
Parker, S.F.; Lennon, D. Net Zero and Catalysis: How Neutrons Can Help. Physchem 2021, 1, 95-120. https://0-doi-org.brum.beds.ac.uk/10.3390/physchem1010007
AMA Style
Parker SF, Lennon D. Net Zero and Catalysis: How Neutrons Can Help. Physchem. 2021; 1(1):95-120. https://0-doi-org.brum.beds.ac.uk/10.3390/physchem1010007
Chicago/Turabian StyleParker, Stewart F., and David Lennon. 2021. "Net Zero and Catalysis: How Neutrons Can Help" Physchem 1, no. 1: 95-120. https://0-doi-org.brum.beds.ac.uk/10.3390/physchem1010007