1. Introduction
High-performance fibers and functional fiber materials are innovative high-tech materials [
1,
2]. A high-performance fiber is made from synthetic polymers or inorganic materials, and has at least one extraordinary property, going far beyond the properties of conventional fibers, such as polyester (PET), nylon, and cotton. These extraordinary properties are related to resistance to various chemicals, light exposure, high temperature, and fire. Furthermore, high-strength fiber materials are counted as part of the group of high-performance fibers [
1,
2,
3,
4,
5,
6].
Functional fiber materials—also called functional textile fabrics—can be realized by the use of high-performance fibers. Alternatively, functional fabrics can be also realized by wet chemical processes, e.g., finishing processes or sol-gel processes, applied to conventional textile materials [
7,
8,
9,
10]. A good example is a flame-retardant fabric, which can be realized either by using flame-retardant fibers (e.g., meta-aramid), or by the treatment of conventional cotton with flame-retardant finishing agents [
11,
12].
Compared to conventional fibers, the market share of high-performance fibers is quite small at less than 1% [
13]. The main reason for this small amount is probably the high cost of high-performance fibers. Because of the high price, high-performance fibers are only used for applications where their extraordinary properties are demanded and the customer is willing to accept the costs. A good example in this area can be given with high-strength ropes for sport and sailing purposes, made from high-performance fibers. For example, a rope made from high-performance fibers (PBO and HPPE) is available with a price range of around 20 to 50 EUR/meter. In comparison, ropes offered by the same supplier based on conventional materials such as polyester, polypropylene, or hemp are offered in a price range of around 0.2 to 3 EUR/meter [
14]. However, because of these special applications, high-performance fibers are important and can generate special benefits. They could also lead to special profit for the supplier of the fiber. The same statement is, in a similar way, valid for functional textiles, where based on a certain function, a significantly higher price can be realized for the final product. A very prominent example can be given with antimicrobial functionalized clothes offered for persons with atopic dermatitis. For products in this category—even for a simple shirt—prices in the range of EUR 100 to EUR 200 can be realized [
15].
With this background, the aim of this review is to give an overview of the main categories of high-performance fibers and functional fiber materials. Material properties and applications are summarized. However, each high-performance fibers also exhibit few disadvantageous properties—some of these are mentioned also. For this, this review can be a helpful tool for the decision of what type of high-performance fiber is useful for a certain application and what application should be avoided. Of course, it is nearly impossible to report on every fiber material and property, so a selection for this presentation has to be made. This selection is mainly done according to the availability on the market for these fibers and products containing them. Additional to the report on selected properties and applications, scanning electron microscopic (SEM) investigations and electron dispersive spectroscopy (EDS) measurements are supported for the fibers presented and for the functional textiles. Both SEM and EDS are well established methods in material science and analytics [
16]. In addition, sensitive objects such as microorganisms can be investigated by those methods [
17]. In this area, the development of field-emission scanning electron microscopy (FESEM) for investigation on biological surfaces should particularly be mentioned [
18,
19].
The working principle of an electron microscope is quite old and was initially realized by Ruska and Knoll in the year 1932 [
20]. In an electron microscope, a focused electron beam is generated by a glow filament, of which the emitted electrons are accelerated towards the sample. When the electrons collide with the sample, the electrons are scattered back. The amount of these scattered electrons is measured by a detector. For each point on the sample, a measurement of the number of electrons scattered back from this point is recorded. Each of these points then corresponds to a pixel in the microscopic image; the brightness of each pixel codes for the number of detected electrons. An electron microscope image is therefore always a grayscale image. Since heavier chemical elements scatter electrons more efficiently than lighter ones, such elements result in larger detector signals and therefore brighter pixels. Consequently, electron microscopy differs from light microscopy; not only in its resolution, but also in its contrast behavior. This renders it a useful tool for textile analytics, since contrasts can be detected which would otherwise be invisible to the eye. However, the lack of electrical conductance of textile materials and their constitution of lighter chemical elements lead to difficulties investigating such samples in SEM, so replication techniques were used [
21]. Due to the necessity of very low operating pressures in early devices, textile materials also needed special drying steps before observation [
22]. Furthermore, the working principle of EDS is developed early on. Historically, the EDS measurement is based on electron beam microanalysis, which was introduced by Castaing and Guinier in 1949 [
23,
24]. A good review on the development of electron beam microanalysis is given by C. Colliex [
25]. It was not until 1966 that both techniques SEM and EDS were combined with a predecessor of most modern SEM-EDS devices, which was commercialized in 1967 [
26,
27].
Often, environmental scanning electron microscopy (ESEM) is also used for the investigation of textile materials [
28]. ESEM devices are equipped with a sample chamber containing only a low vacuum [
29]. The remaining gas in the sample chamber can avoid the electrical charging of the textile samples. Moreover, the swelling behavior of hydrophilic cellulosic fibers in the presence of humidity can be investigated by ESEM [
28,
29,
30,
31].
In the current paper, both techniques—SEM and EDS—are used to investigate conventional and industrial fiber products with high-performance and functional properties. These investigated textile samples are industrial products prepared and offered for specific customer applications. The shown fiber-based products are gained from completely different areas, such as technical filter materials from high-performance fibers, inorganic fiber materials for heat resistance applications, carbon fibers used in the production of fiber-reinforced composited, or flame-retardant textiles for clothing applications. The detection of composition is discussed, as well as fiber treatment for the realization of functional fiber properties. With this, it is aimed to support a broad overview of successful industrial textile products and to provide a helpful tool for fiber and textile analytics and identification.
2. Analytical Methods and Challenges for SEM and EDS Measurements on Textiles
This review paper reports on functional fiber materials and gives a special view of these materials by using scanning electron microscopy (SEM) and electron dispersive spectroscopy (EDS) [
16]. All presented measurement results are exclusively recorded for this review paper. The investigated samples are typical industrial fiber-based products, prepared and offered for specific customer applications. Among others, these are advanced filter materials from high-performance fibers, textiles for flame-retardant clothes, or metalized textile fabrics offered for the shielding of electrosmog. The used microscopes are a Tabletop TM3000 and a Tabletop TM4000, both from Hitachi High-Tech Corp., which are equipped with EDS units from Bruker. In the following, some typical measurement errors for SEM and EDS, if they are applied on textile and fiber samples, are presented. An overview of typical measurement errors is offered as a useful tool to improve measurement skills for students and scientists, starting with the application of this microscopic technique and its application on textile- and fiber-based samples. Of course, the shown measurement errors do not occur during every microscopic investigation, and they can be avoided by improving the measurement procedure, the sample preparation, or by using an advanced electron microscope.
Compared to former times, nowadays it is quite simple to work with a scanning electron microscope (SEM) and to record images. For example, the currently used Tabletop microscope can be successfully used by students only after a short introduction of around 30 min. Nevertheless, there are still challenges in optimizing SEM measurements—especially on textile and polymer samples [
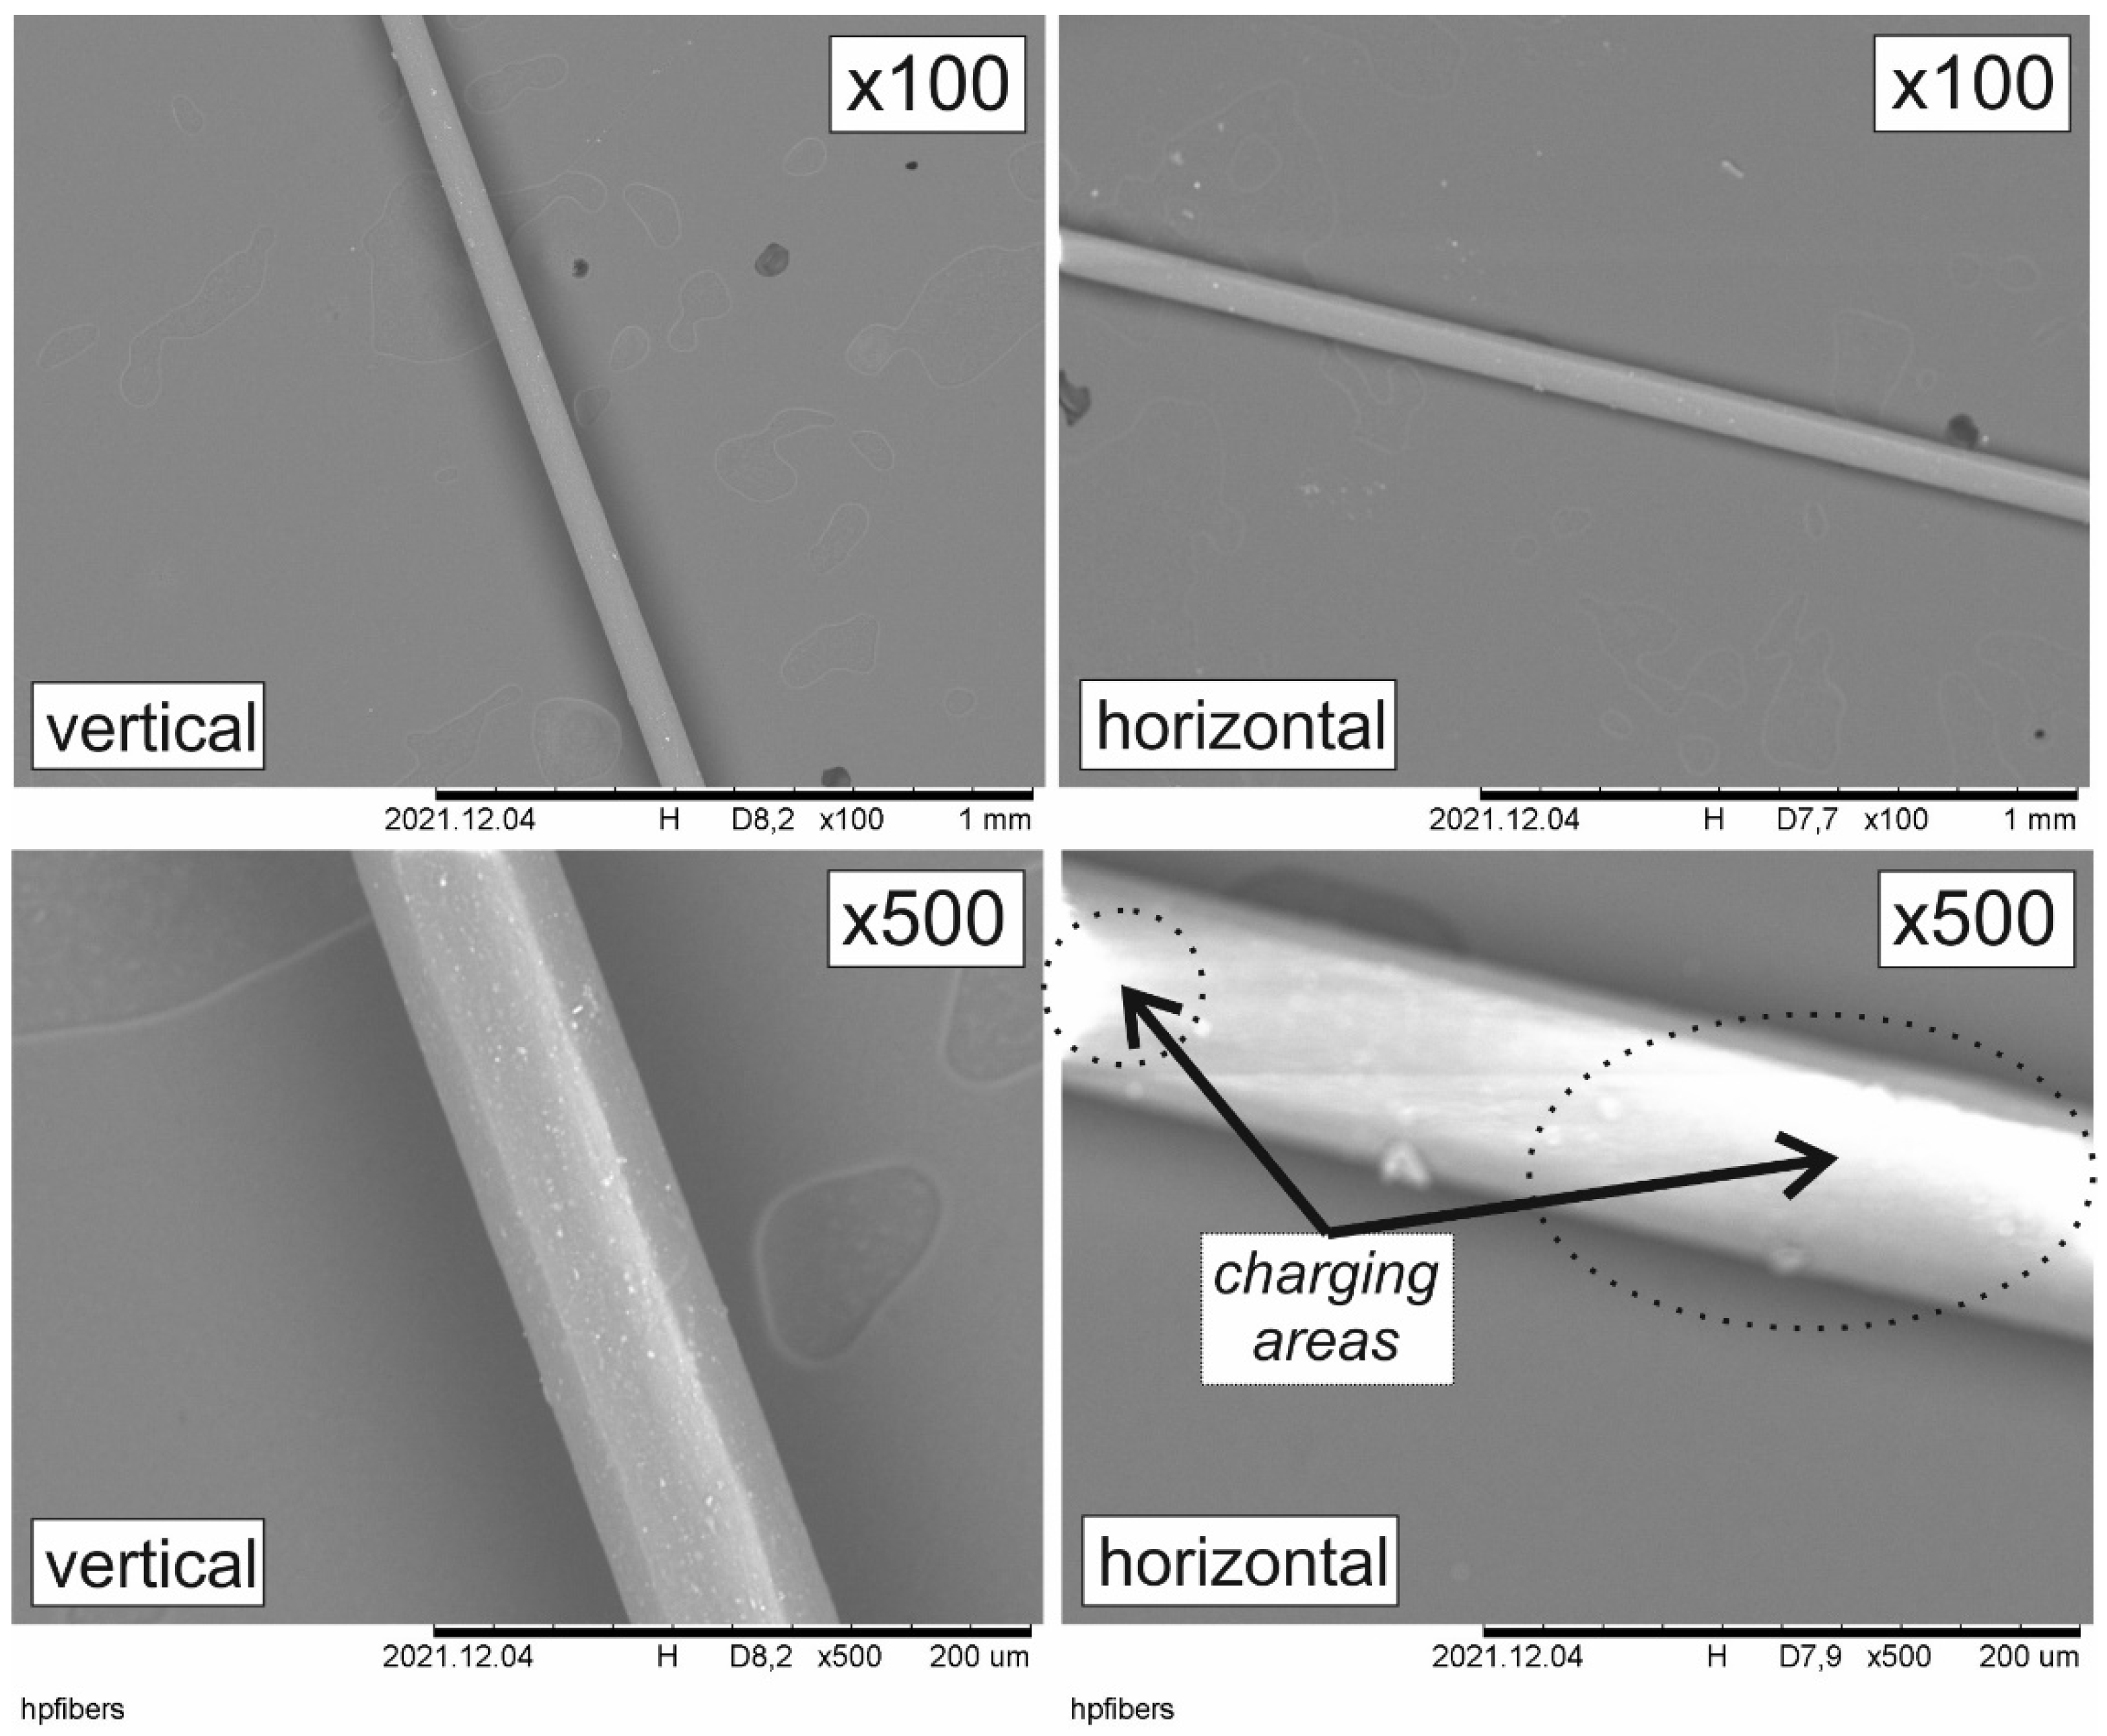
32]. These issues often lead to misleading pictures or limited magnification, which are significantly below the magnification theoretically possible for SEM measurements. It is a general issue of SEM measurements that the measured samples are exposed to an electron beam. This electron beam causes an energy impact and an electron contribution to the measured sample. If the image is recorded in high magnification, this impact of energy and electrons is concentrated on a smaller area of the sample surface. For this reason, measurements in higher magnification have a higher tendency to cause sample damages by energy impact, or to show charging effects. The occurrence of charging effects while measuring a textile fiber can be described by view on the SEM images shown in
Figure 1. Here, a polyester filament fiber is measured. For this measurement, the polyester fiber is placed on a conductive sticker containing graphite. This conductive sticker is not charged by exposure to the electron beam, because of its electric conductivity. Different behavior is shown by the polyester fiber, which is not electrically conductive. In the case of higher magnification, the number of up-taken electrons is high, and for this, the fiber appears brighter in the SEM image. This brightness covers the sample topography, so topography details cannot be detected, because of charging effects. For the shown example, with low magnification of ×100, charging effects have no influence on the quality of recorded SEM images (
Figure 1). A different result is gained for the higher magnification of ×500.
However, it makes a significant difference if the fiber is placed vertically or horizontally on the sample holder (
Figure 1). Especially for the horizontal arrangement, charged areas occur, influencing the quality of the recorded images. The reason for this is the horizontal direction of the moving electron beam during the sample scan. At the turning points of the beam at the left and right edges of the image area, the impact of electrons is high. In case the polyester fiber is placed vertically on the sample holder, the turn-point areas of the electron beam are not hitting the polyester fiber. Here, only the conductive sample holder is affected, so the influence on the image quality of the fiber is lower [
32].
For this, the recommendation for SEM measurements on single fibers is to place the fiber vertically on the sample holder. This is quite a simple method to improve the quality of SEM images. However, unwished-for charging effects can also be avoided by other methods. First, this is the coating of the non-conductive samples by a thin conductive layer, e.g., from gold, copper, or graphite. However, using such coatings, the surface topography may also change. Furthermore, the detection of chemicals on textile surfaces by EDS measurements can be hindered by such coatings. Second, a special measurement method called “charge-up-reduction-mode” can be used for SEM recording [
33]. In that case, only a moderate vacuum is present in the measurement chamber. By the ionization of remaining gas molecules in the measurement chamber, up-taken charges can be conducted away from the sample surface into the surrounding gas phase. In addition, by use of an environmental scanning electron microscope (ESEM), such charging effects can be avoided [
28,
30].
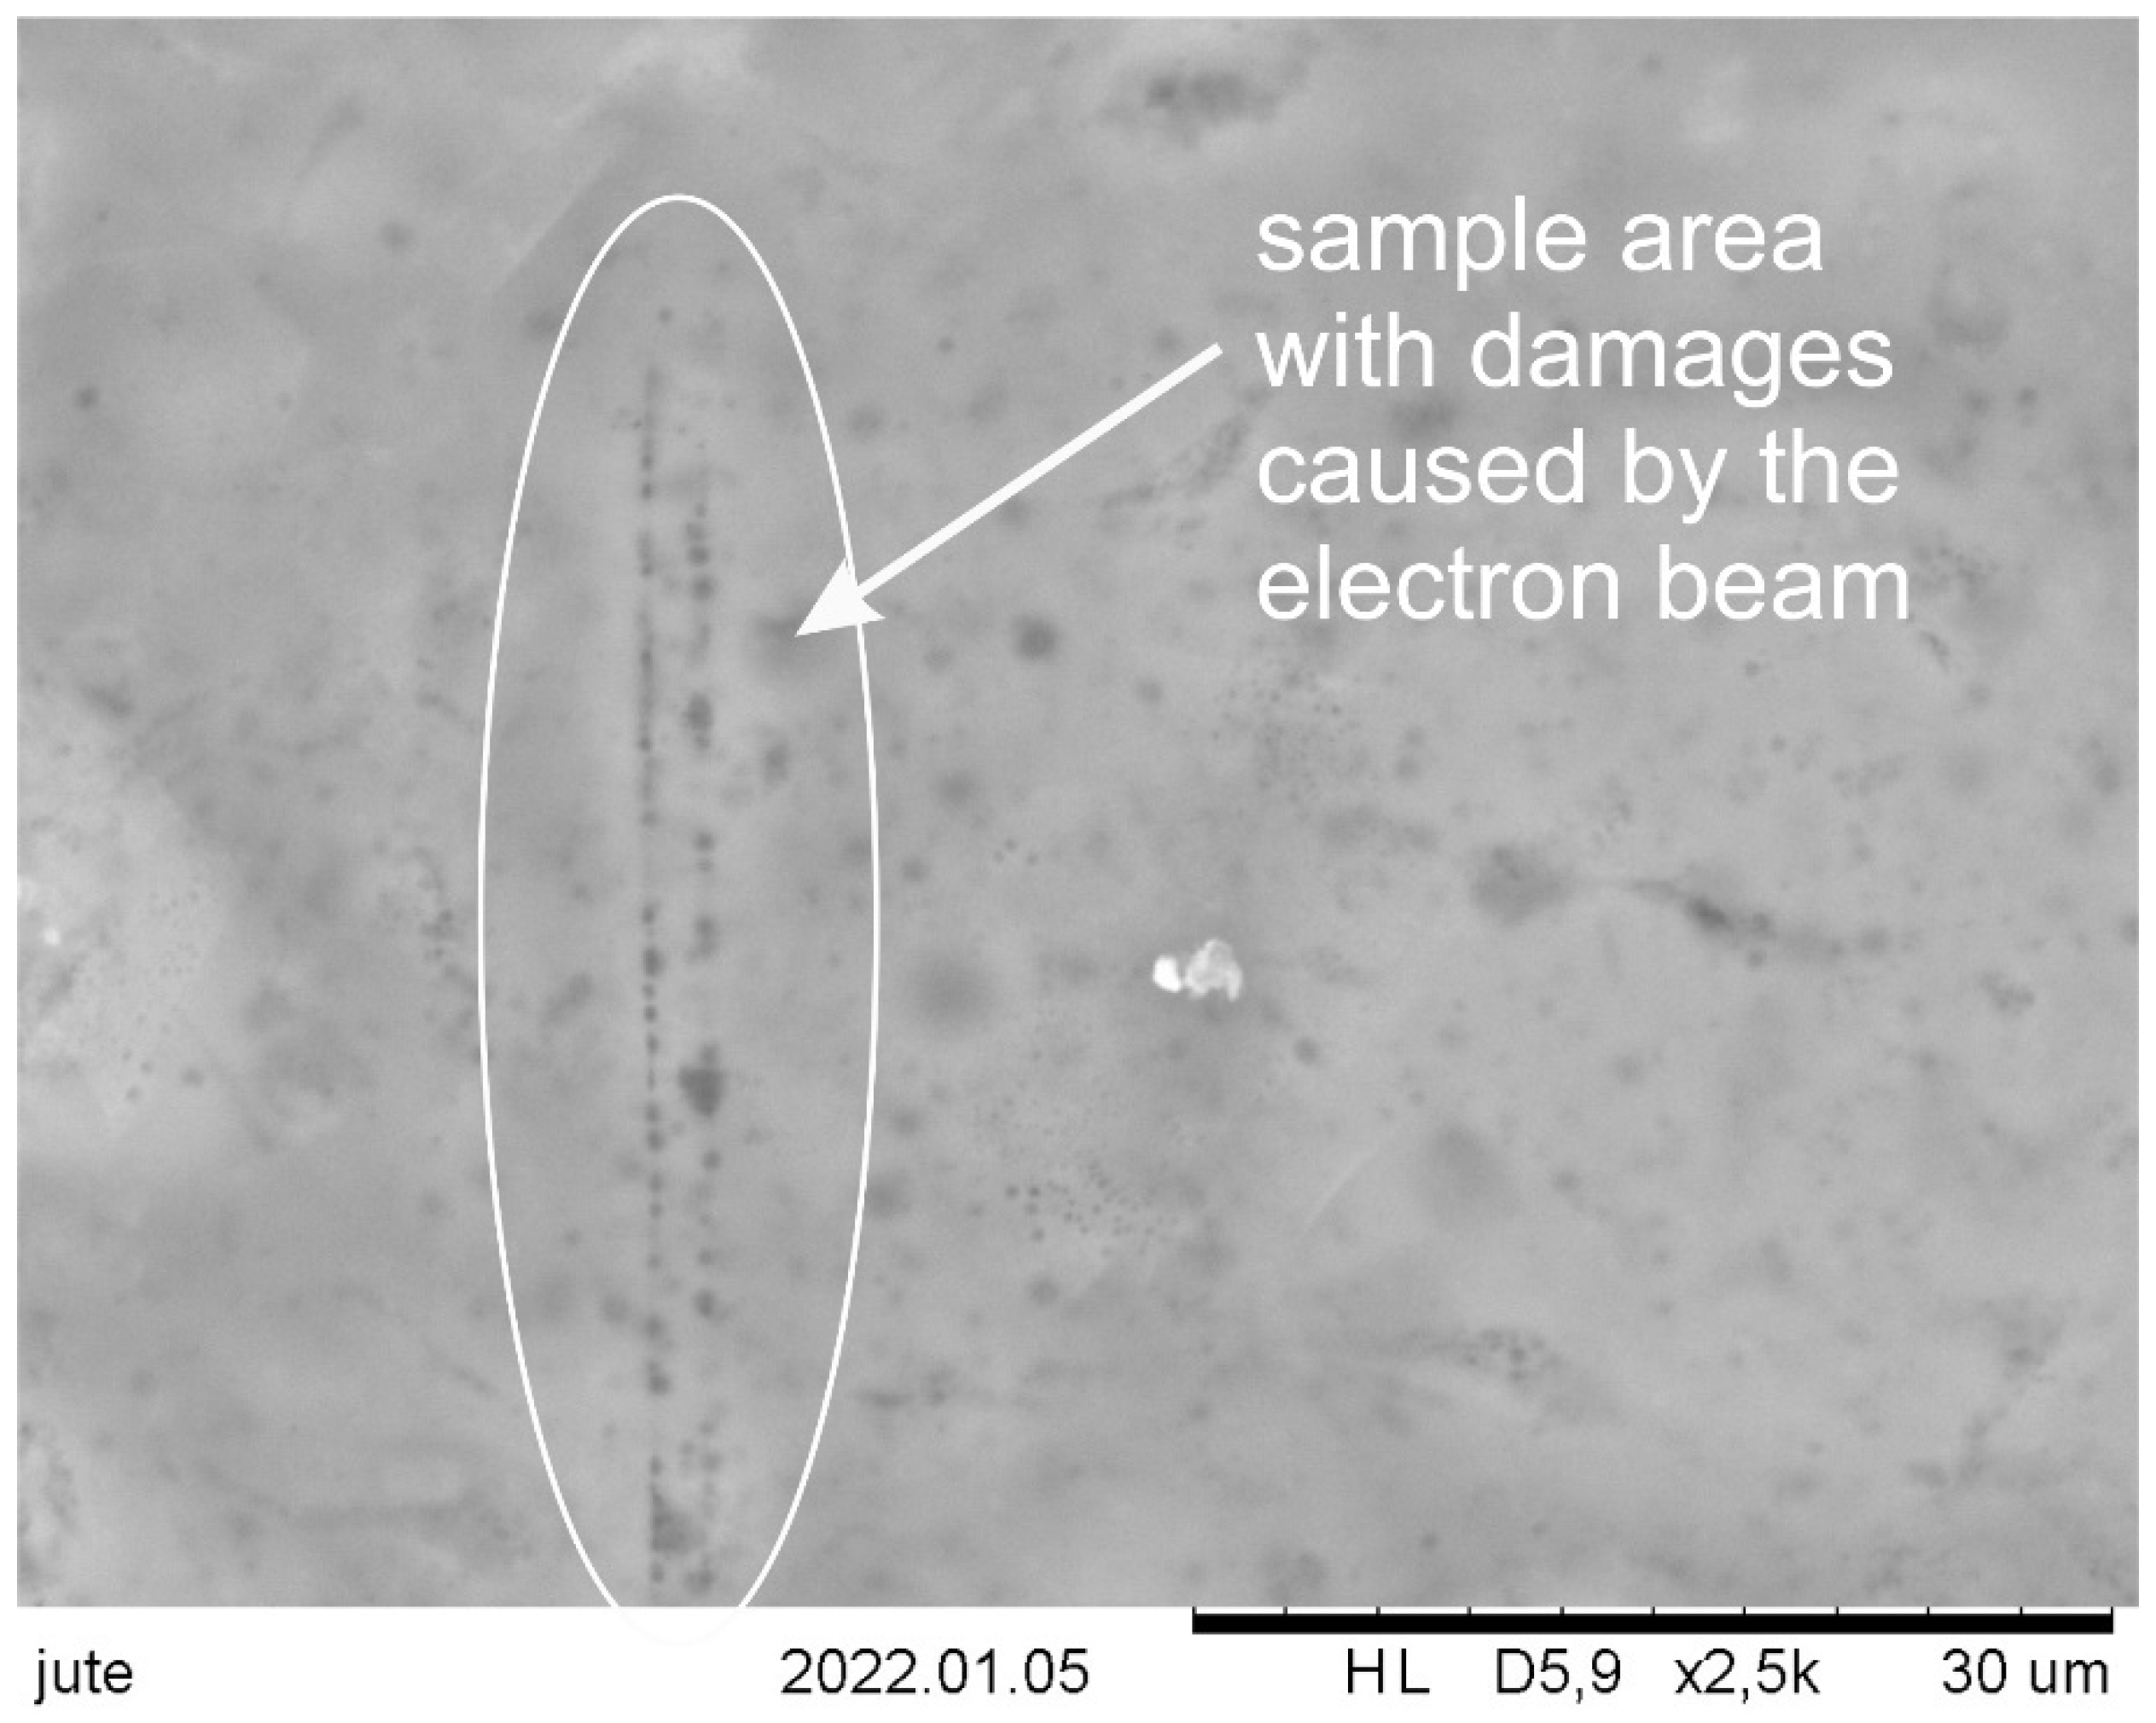
Other than the described charging effects, the energy impact of the applied electron beam can simply damage sensitive polymer materials (
Figure 2).
Figure 2 shows a typical vertical damaging feature caused by a former SEM measurement in higher magnification. Such vertical lines are typical damages occurring at the turn-point of the electron beam. In this area, the energy impact is higher compared to other sample areas, so the sensitive polymer substrate is damaged. By the use of advanced SEM techniques, such as ESEM or FESEM, such damages to sensitive samples can be minimized [
28,
34,
35]. Furthermore, with conventional SEM devices (like the Hitachi TM3000 or TM4000), such sample damages occur only in the case of sensitive organic samples.
Figure 2, is given as an example of one possible measurement error which can eventually occur, but of course, does not occur during every measurement with the used SEM device.
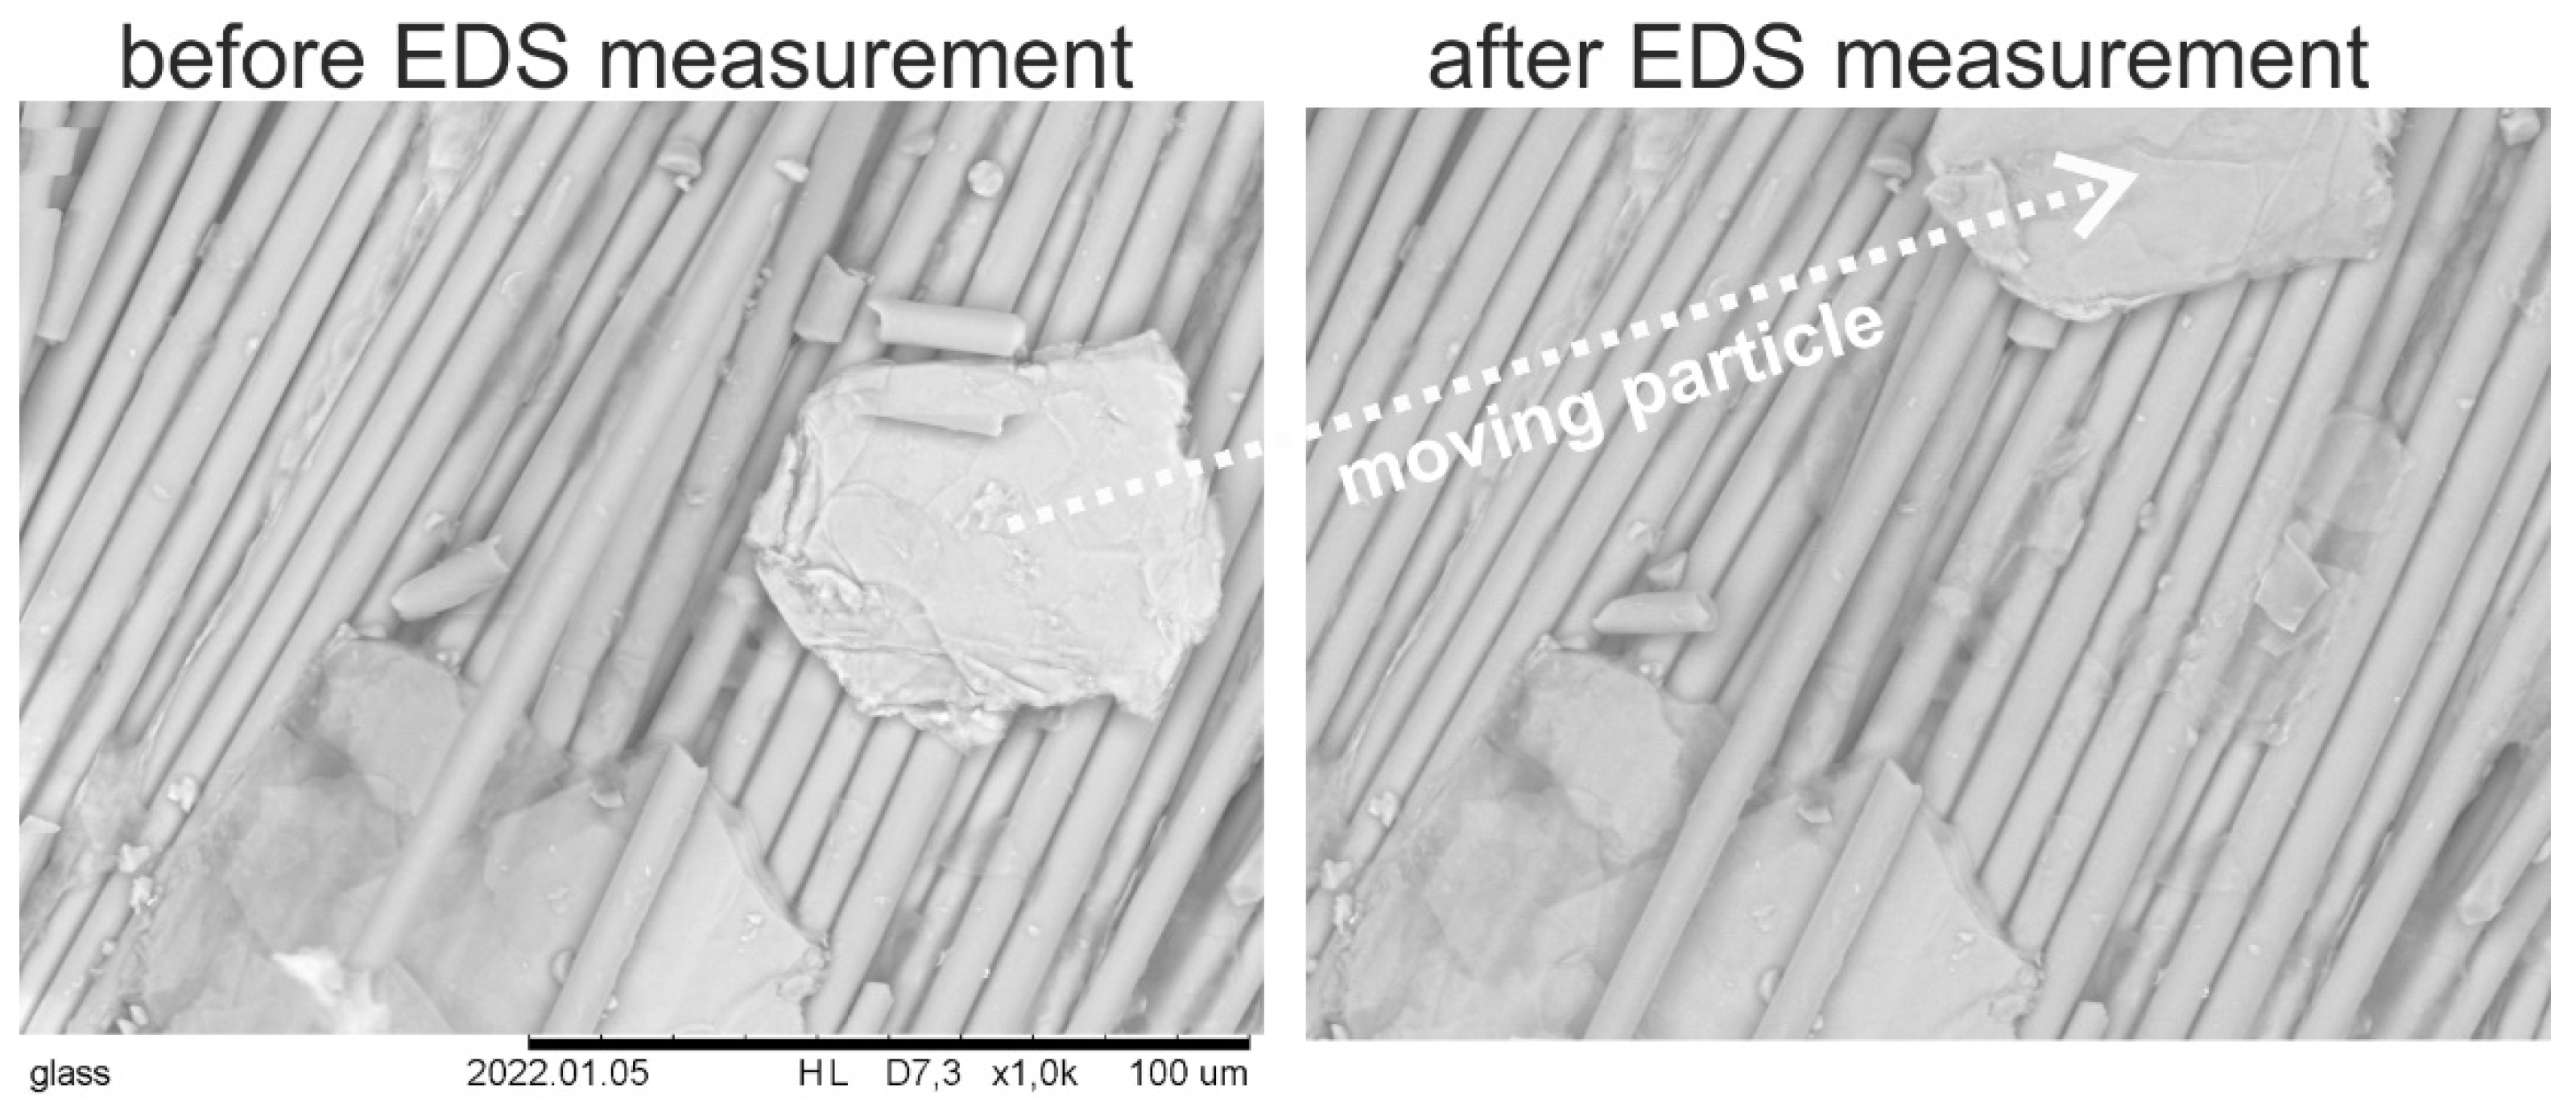
Additional to the simple damaging of the sample surface by exposure to the electron beam, other more sophisticated influences on the sample surface are also possible. A special feature is, e.g., the movement of particles on the sample surface during the measurement, as shown in
Figure 3. In this example, glass fiber fabric with deposited vermiculite particles is investigated. This glass fiber fabric is an industrial product supplied for high temperature application. The vermiculite particles are processed by the industrial supplier in between the fibers building up the fabric structure. However, few vermiculite particles are only deposited on the fabric surface and not fixed in between the fabric structure. During this measurement, one vermiculite particle on the fabric surface is charged and changes its position on the sample surface. Such features are usually not recorded for single SEM measurements with a short record time. Instead, they are more likely to occur during EDS measurements, which normally have a duration of several minutes. Of course, a sample treatment done before could eventually avoid such a position change, e.g., a sputtered gold layer on the sample could fix the loosely attached particles. In addition, by the use of the ESEM technique, such phenomena could be avoided. It should be clear that
Figure 3 is given as an example of one possible measurement error which can potentially occur, but of course does not occur necessarily during every measurement with an SEM device.
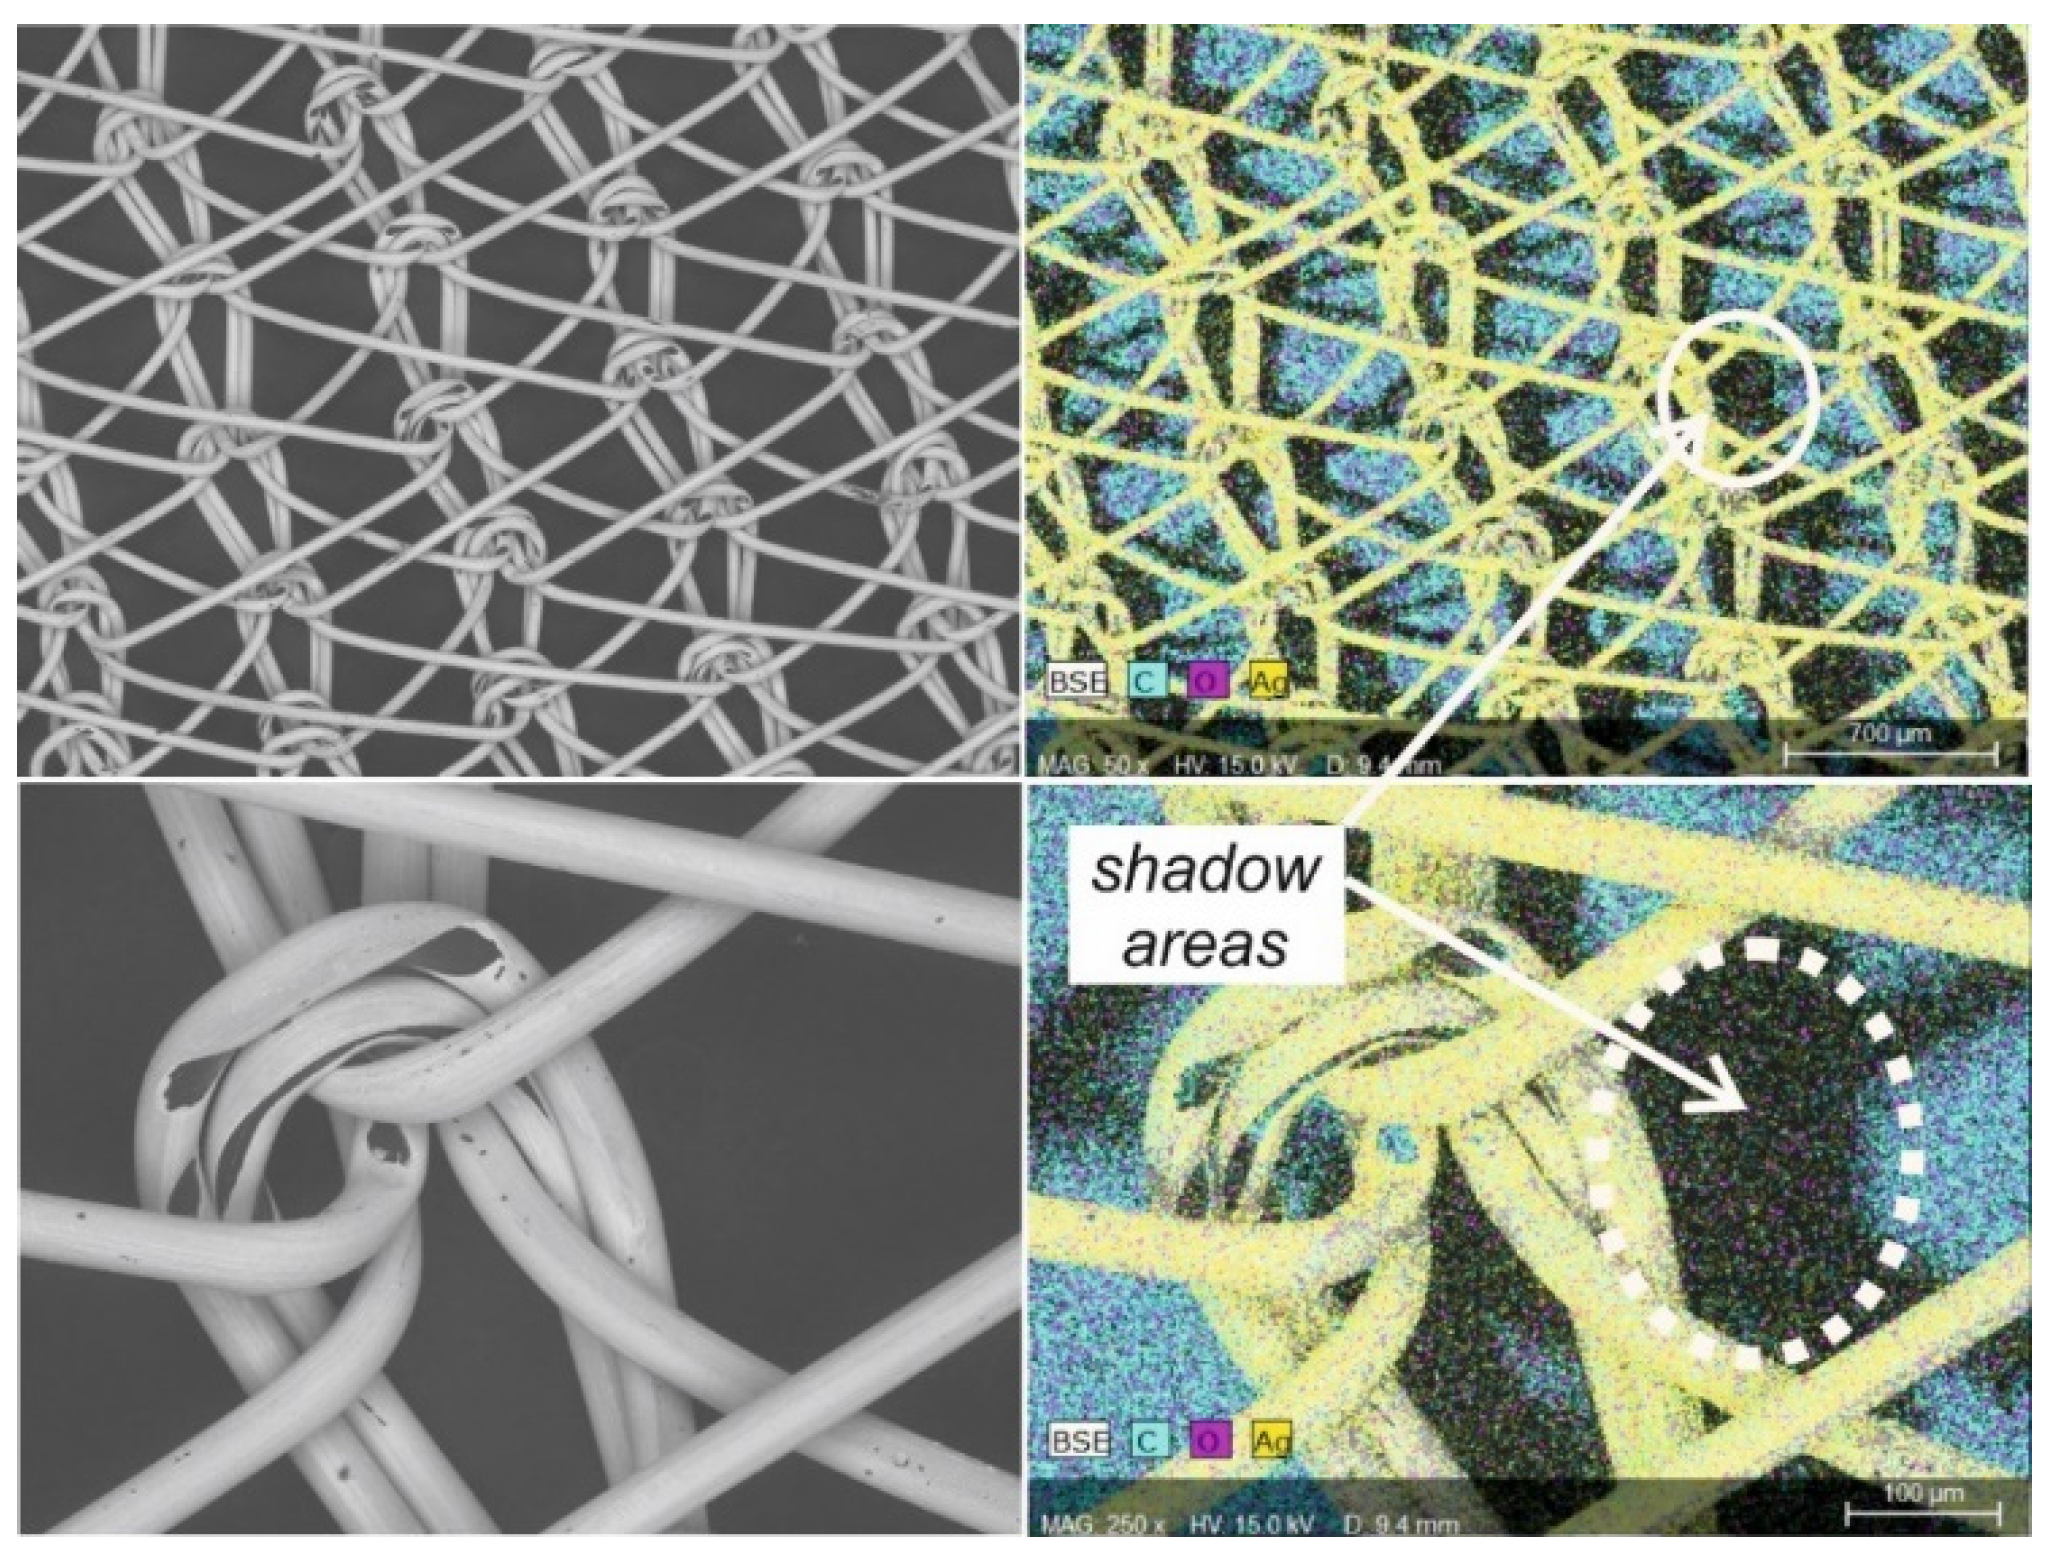
For EDS measurements, there is a specific feature often leading to measurement mistakes. This is the shadowing; impressively shown in
Figure 4. In this example, a fabric made from silver-coated yarn placed on the graphite-containing sample holder is presented. Here, the chemical elements—silver for the fiber and carbon for the sample holder—can be clearly detected by EDS mapping (
Figure 4). However, there are also areas wherein no element is detected. These black areas can also be named shadow areas. From these areas, no x-radiation is reaching the EDS detector, so no element can be determined from them. The reason for this feature is the non-symmetric arrangement of the EDS detector in the measurement chamber of this microscope. With this, the silver fibers in front are covering a certain area of the sample holder behind. As a result, a shadow image of the knitted fabric can be found on the sample holder. This non-symmetric arrangement is of course a feature related to the set-up of the sample chamber of the used SEM/EDS devices TM3000 and TM4000 from Hitachi. However, also for other scanning electron microscopes containing an EDS unit, effects related to the non-symmetric arrangement of detectors can be expected, because several detectors for primary electrons, secondary electrons, and the emitted X-rays have to be placed in the sample chamber of the microscope. It should be remarked that there is quite a simple method to minimize the shown “shadowing”. This is done by increasing the distance of the sample holder to the detectors.
3. High-strength Fibers
High-strength fibers exhibit extraordinary strength compared to conventional synthetic fibers and are, for this, used in applications, e.g., high-strength ropes, and cut-resistant textiles, for ballistic protection and for the realization of fiber-reinforced composite materials [
36,
37,
38,
39,
40,
41,
42,
43,
44]. A selection of properties of four high-strength fibers is given in
Table 1. Here, a comparison with the properties of the two conventional fibers nylon (polyamide 6.6) and PET (polyester) is also supported. The shown parameter—tensile strength—is related to the mechanical strength of the fibers. Additionally, the density, the LOI value, and the maximum temperature of usage are mentioned to support a broader view of fiber advantages and disadvantages. The LOI value is a parameter describing the flame-retardant properties of a fiber material [
45,
46]. The abbreviation LOI stands for limited oxygen index. This value gives the minimum oxygen content in the atmosphere which is necessary to set a fiber material on fire. An increased LOI value corresponds to the increased fire stability of the fiber. Due to the oxygen content of 21% in standard air, fibers with LOI values of 21 or less can be easily set on fire. Fibers with LOI values > 21 are usually determined to have a certain flame resistance. Fibers with LOI > 28 are usually described as fire-resistant. In
Table 1, for some fibers, two different LOI values or a range for the LOI value are given. Here, these numbers are taken from different references, reporting a variation of LOI values. As a further parameter, the maximum temperature of usage T
max is given in
Table 1. This parameter is not a clear material parameter of fiber materials. This T
max should be better taken as a recommendation to the user of the fiber. At temperatures below T
max, the main fiber properties can be guaranteed for dedicated usage. T
max is often related to a temperature causing fiber decomposition (pyrolysis) or the changing of mechanical properties due to reaching the temperature area around the glass temperature T
G or the melting temperature T
M. Additional to these numbers in
Table 1 selected related fiber properties are also summarized, which are often mentioned in relation to the fiber.
Table 2 summarizes all investigated high-strength fibers and other later discussed fibers with their sum formula of the polymer repeating unit. Furthermore, the content of chemical elements of the related polymer is given to support a discussion of EDS measurements. Because the chemical element hydrogen cannot be detected by EDS, hydrogen is not mentioned in
Table 2. In
Table 2, the mentioned chemical compositions of the fibers are determined by calculation from the composition of the monomer units of the polymers building up the fibers. In fact, these are theoretically values on the basis that the fibers are built up by pure polymers. However, the fibers are industrial products often containing pure polymers, as well as additives, surface treatments, copolymers, and polymer end groups. All these further components can influence the chemical compositions of real fiber products.
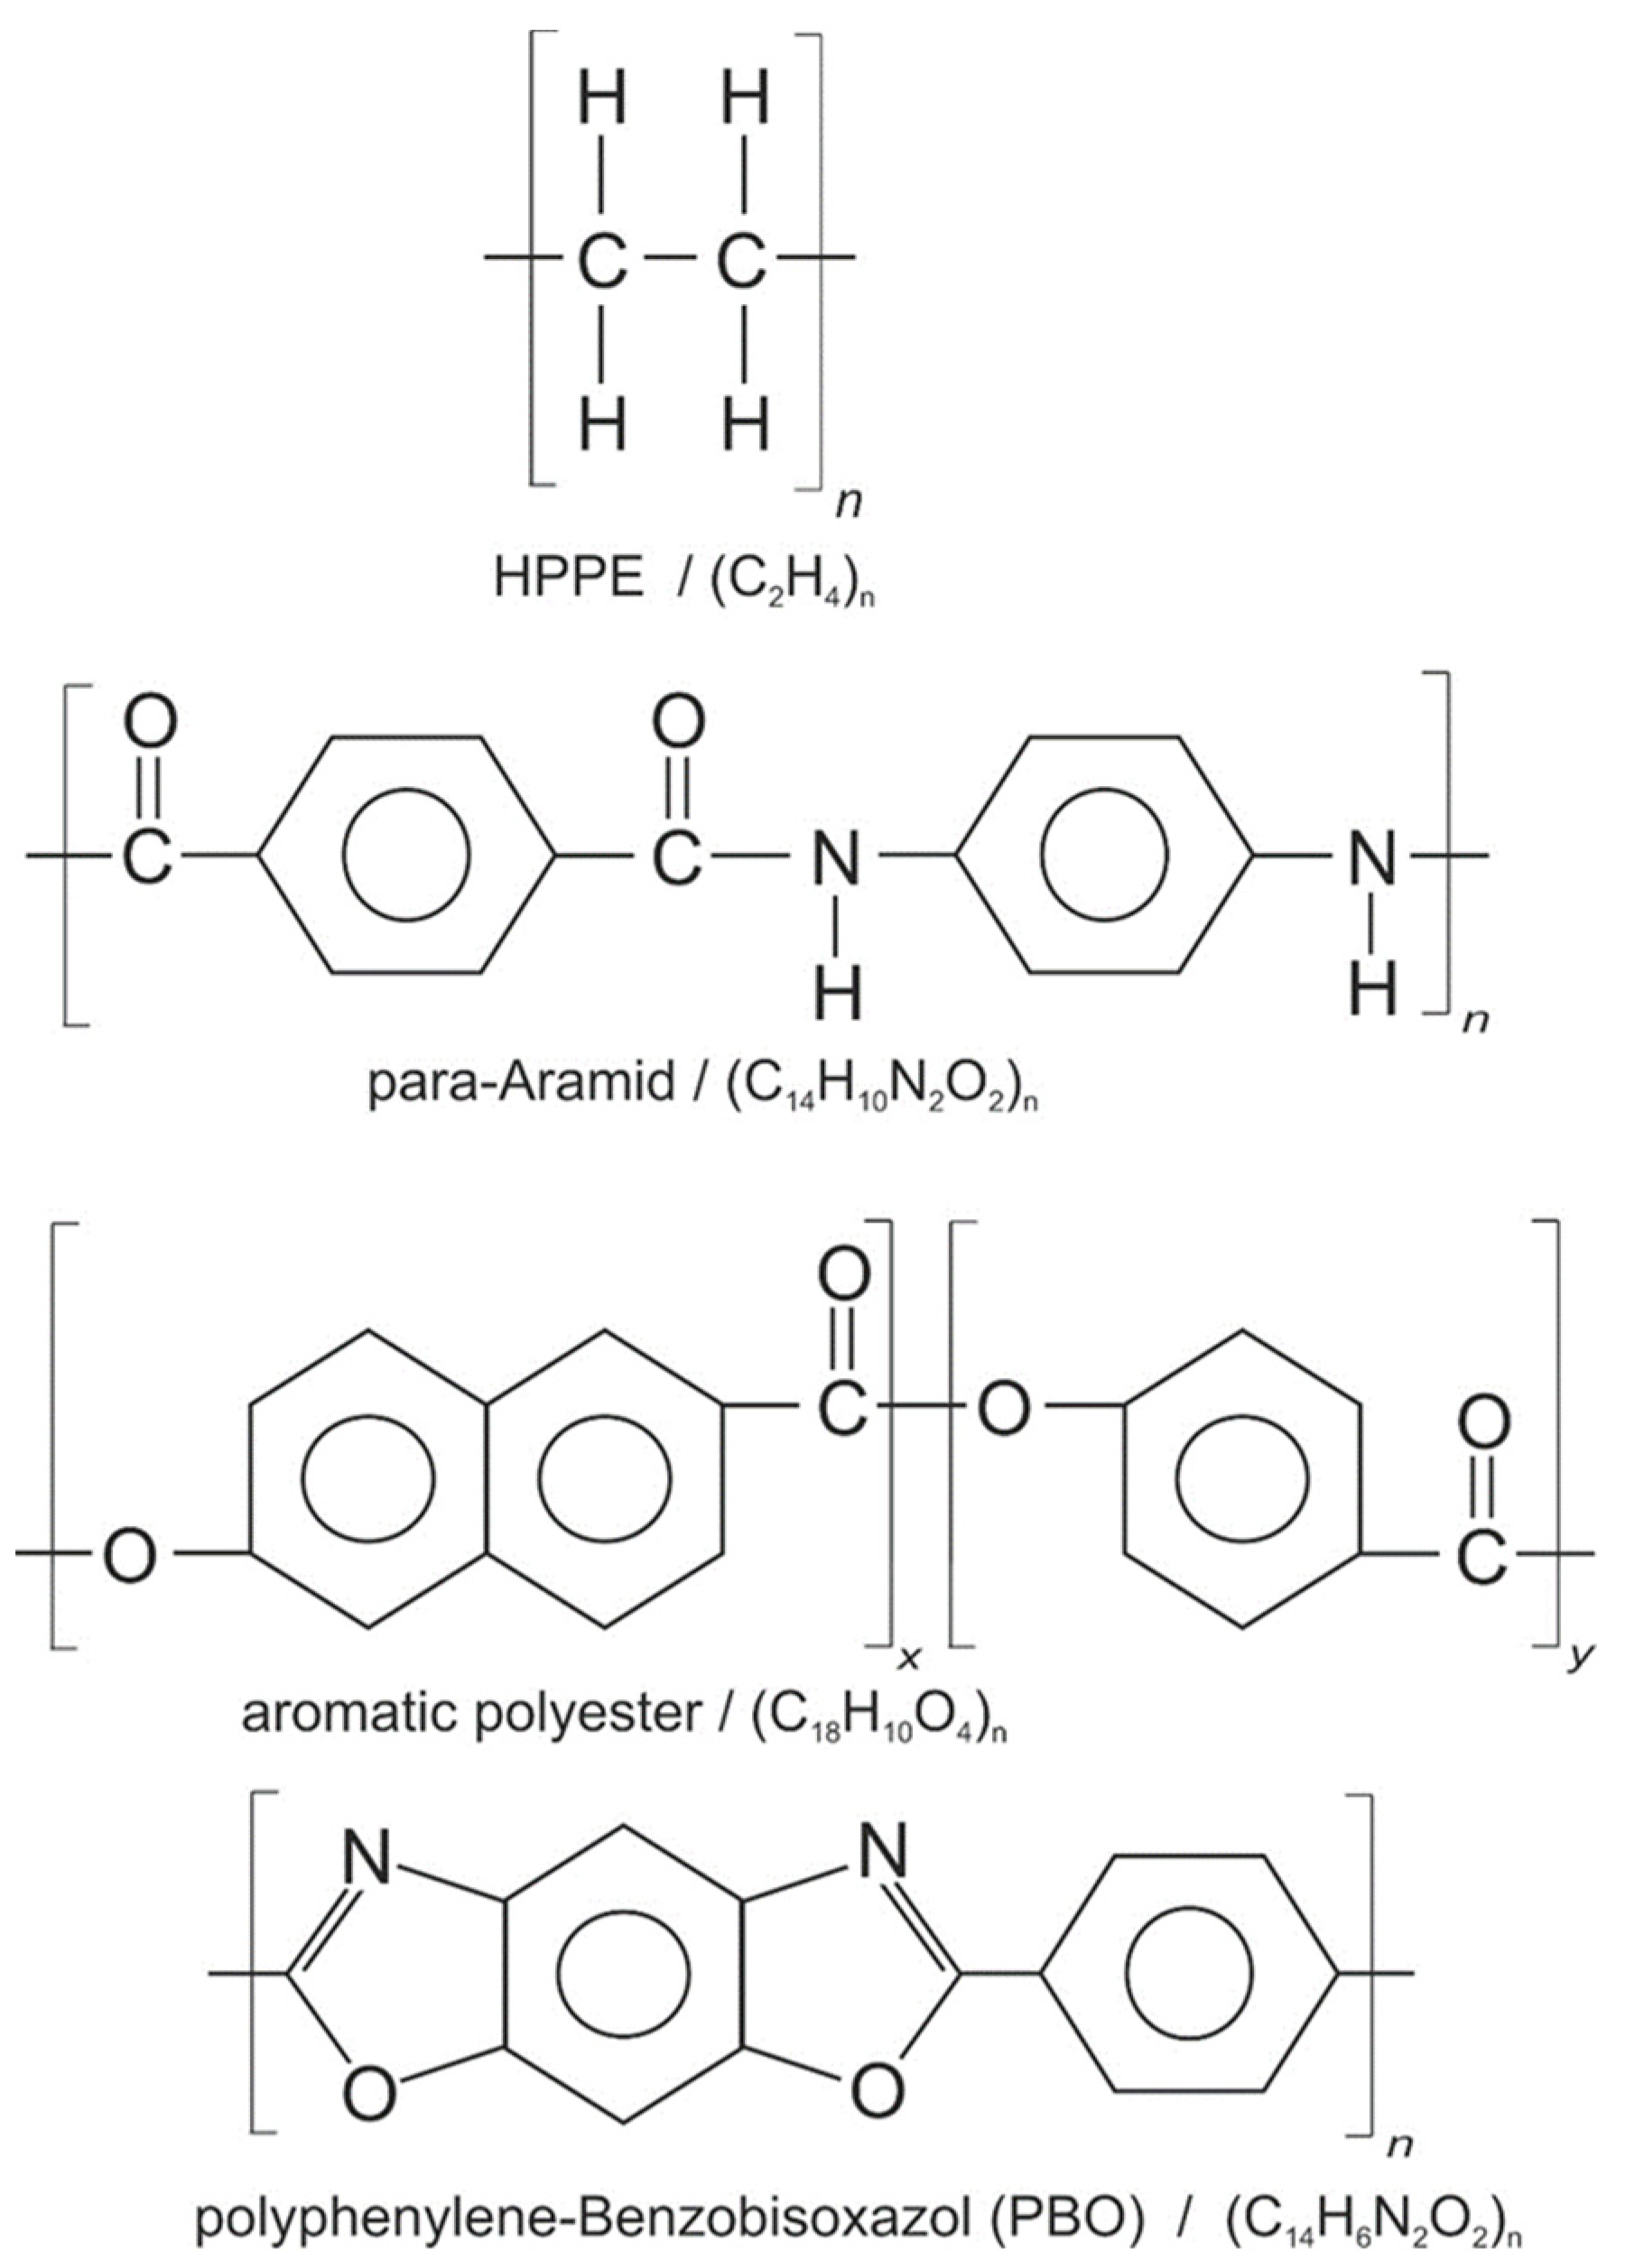
As high-strength fibers, four types are selected for presentation—high-performance polyethylene HPPE, para-aramid, aromatic polyester, and polyphenylenebisoxazol (PBO). This selection is done based on the economic relevance and availability of these fibers. The chemical structures of the polymers building up these four fibers are presented in
Figure 5, together with the sum formulas. By view on the chemical structure, the fundamental difference between HPPE compared to the other three high-strength fibers is clear. These three high-strength fibers are built up by aromatic ring systems which are conjugated over the entire polymer chain. By this, a stiff polymer chain is given—also named a rigid rod-like polymer [
44]. This structure leads naturally to a parallel orientation of the polymer chains in the fiber, and by this to a high degree of crystallinity. Here, the chemical structure of the polymer building up the fiber is directly responsible for the high strength of the fiber. Additional to the aromatic stiff polymer chain, its linear parallel orientation is necessary for the high strength of those polymer fibers. In comparison, Nomex fibers built up from meta-aramid consist also of aromatic polymer chains, but due to the meta conformation, are not in a linear structure, so that no linear orientation is possible, and crystallinity is greatly decreased. As a consequence, Nomex fibers exhibit weaker mechanical properties.
In contrast to the fibers built up by aromatic polymers, the chemical structure of the monomer unit of HPPE is the same as for conventional PE, which is known to be a quite soft polymer material used, e.g., for the production of polybags. The high strength of HPPE fibers is the result of several parameters and influences. At first, there is a high molecular weight of HPPE with values of more than 1 million g/mol. For this, HPPE is often also called ultra-high molecular weight polyethylene UHMWPE. In comparison, conventional low-density polyethylene LDPE contains a molecular weight in the range of 30,000 to 50,000 g/mol. For conventional high-density polyethylene HDPE, a molecular weight of around 60,000 to 100,000 g/mol is given. For this, HPPE fibers are built up by PE containing 10 to 100 times higher molecular weight compared to other conventional PE types. From UHMWPE as a polymer material, the HPPE fibers are produced by using a special gel spinning process. In comparison to the spinning with molten polymers, the gel spinning process has the advantage that polymer loops can be solved easier during fiber formation [
60,
61]. By this, the parallel orientation of the polymer chains by drawing is promoted and a high degree of crystallinity can be reached. These parallel orientations and crystallinity are the result of the fiber production parameters and are not naturally given by the chemical structure of PE [
60,
61]. This issue is one main difference between fibers made from rigid rod-like polymers.
HPPE fibers are often also called Dyneema fibers, in relation to the brand name Dyneema belonging to the Dutch company DSM. This company supplies different types of HPPE fibers with a variation in molecular weight and degree of crystallinity. Of course, there are also other companies supplying HPPE fibers under different brand names, such as, for example, Spectra Fiber (Honeywell), Exceed (ExxonMobil) or TYZ UHMWPE Fiber (Tongylzhong, China) [
1,
62,
63,
64,
65]. For this, several different types of HPPE fibers are available on the market. Other than the high strength of the HPPE fibers, their second outstanding property is the low density with values < 1 g/cm
3. Such a low density is typical for polyolefins such as polyethylene PE or polypropylene PP. Compared to other fibers based on polyester or polyamide structures, HPPE fibers exhibit a good stability against acidic or alkaline chemicals [
66]. The simple chemical structure of HPPE does not contain any functional group which can easily react and be cleaved under acidic or alkaline conditions. Furthermore, the stability against exposure to sunlight and weathering is significantly better compared to the aromatic high-strength fibers. The simple aliphatic chemical structure of HPPE fibers supports no absorption of UV-A and UV-B light, which is part of the sunlight. From this, a certain light stability results. Nevertheless, in view of
Table 1, the disadvantageous properties of HPPE are clear. HPPE fibers are absolutely not fire-resistant, and quite temperature-sensitive, with a low T
max < 100 °C.
In comparison, the other three presented high-strength fibers are fire-resistant and exhibit extraordinary temperature stability. In particular, the PBO fiber shows extraordinary properties, with a high LOI value around 60, and T
max higher than 300 °C, even in the presence of air. For usage in an inert gas atmosphere for PBO fibers, even higher temperatures of usage are reported [
11,
67]. Nevertheless, their sensitivity to exposure to sunlight is advantageous. Due to their aromatic structure, these high-strength fibers exhibit a high absorbance for UV light. The absorbed UV light can start photochemical reactions, leading to the destruction of the fiber materials.
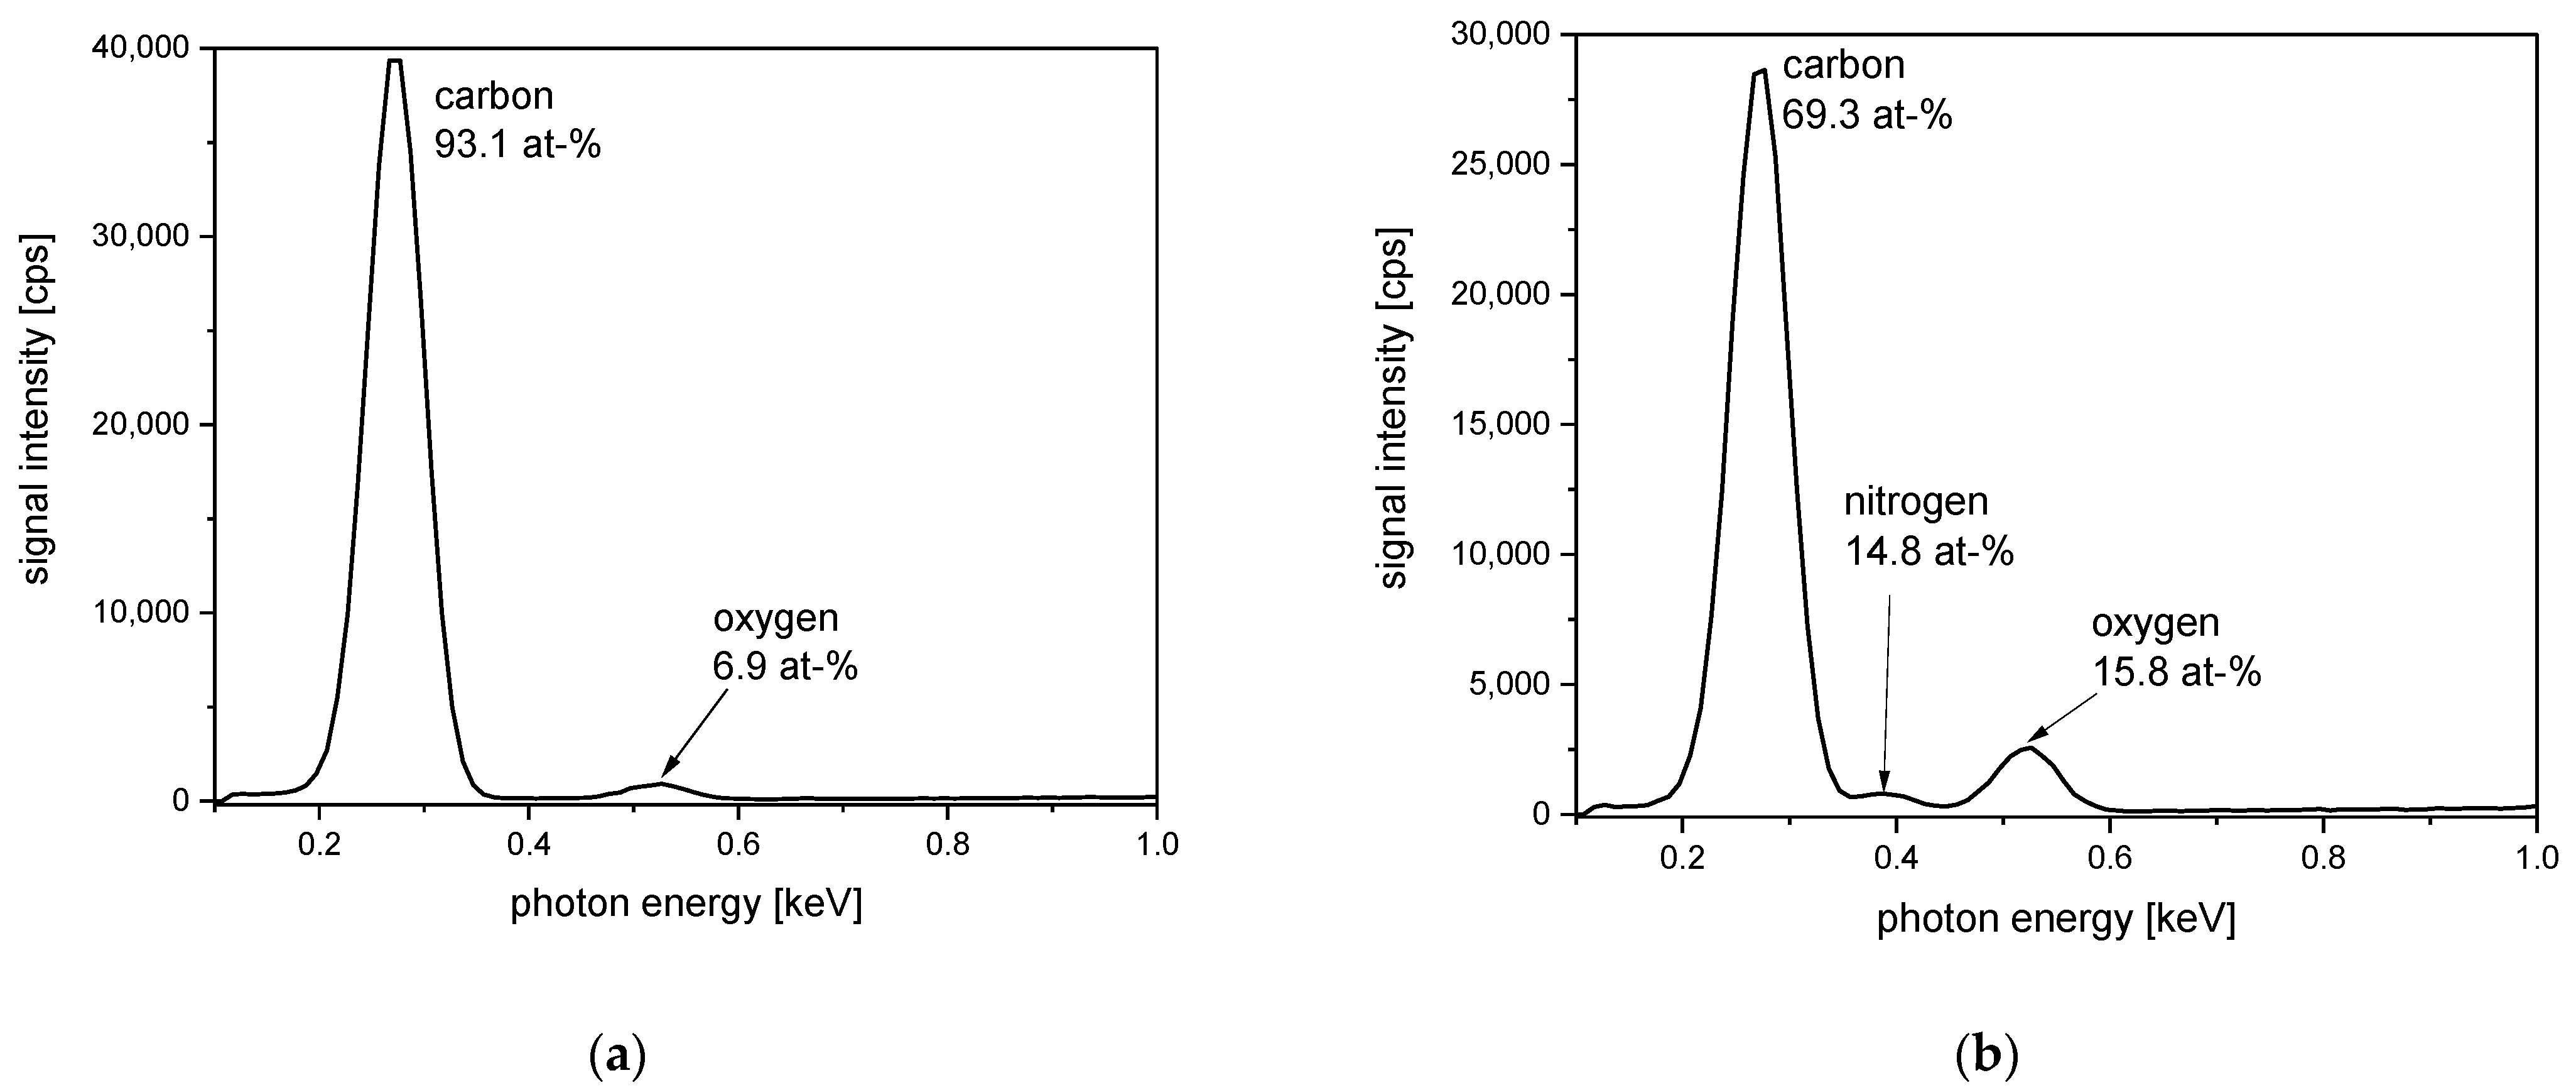
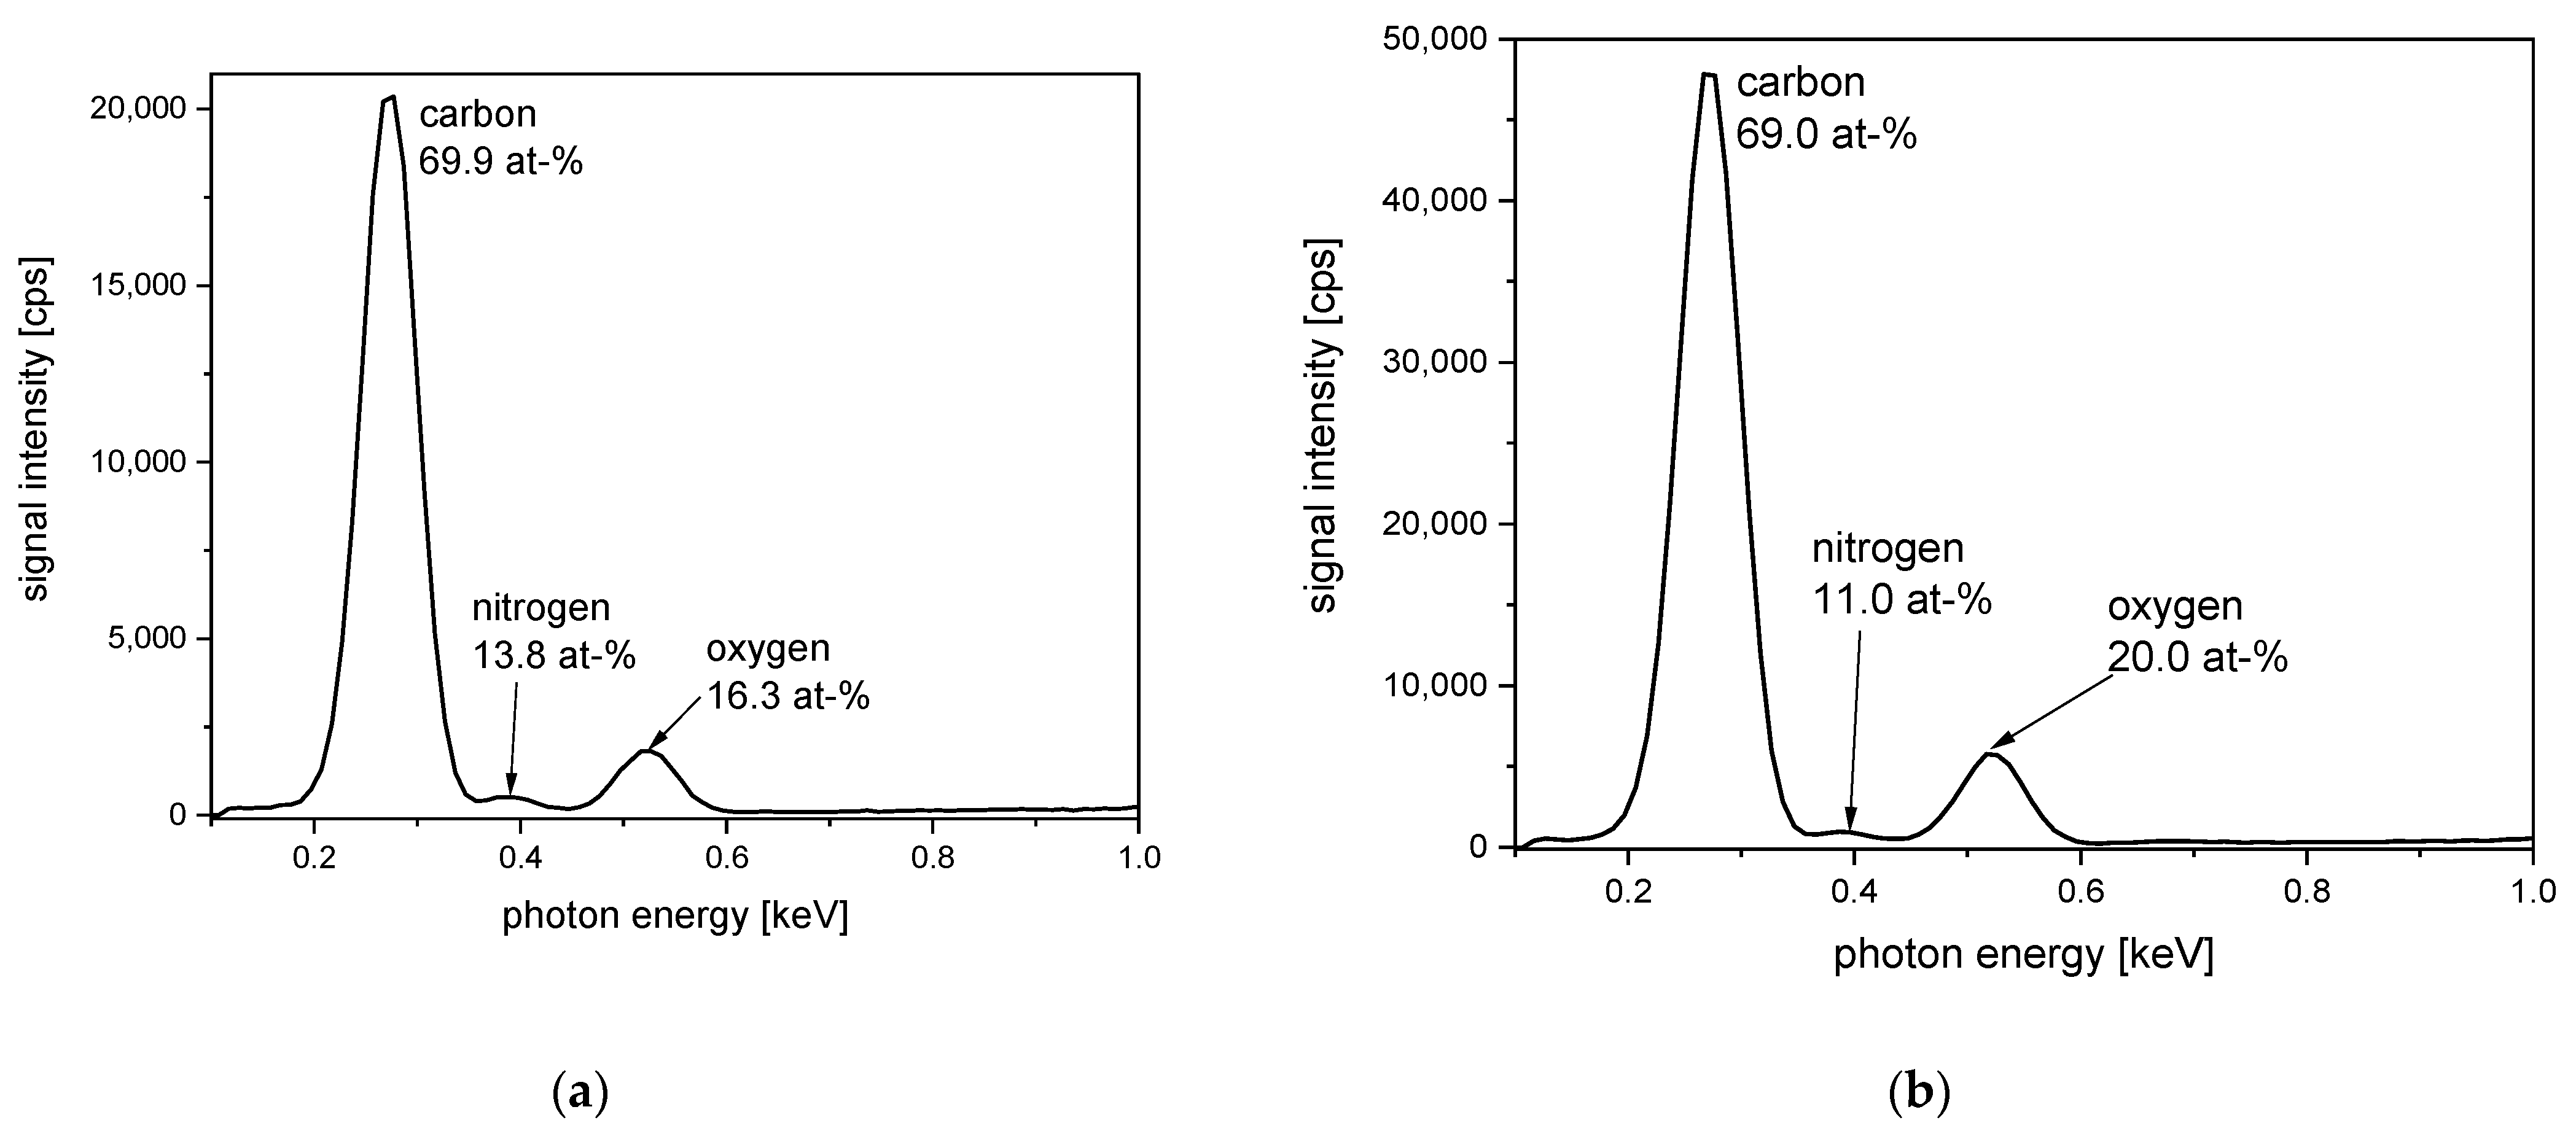
For EDS investigations of high-strength fibers, different samples from typical products are taken. PBO fibers (Zylon fibers) and HPPE fibers are taken from a high-strength rope offered for the sport market. This two-component rope (tradename: LIROS Runner PBO-XTR) is made up of a core of braided HPPE fibers and an outer layer made from braided PBO fibers. From the EDS spectrum of the PBO fibers, the three chemical elements carbon, oxygen, and nitrogen building up the fiber can be detected (
Figure 6). The detected concentration of these elements is nearly in the ratio which can be expected from the chemical sum formula of the PBO polymer (
Table 2). It should be remarked that the element hydrogen cannot be detected by EDS, and the sensitivity of the EDS method for the element nitrogen is quite low. For this, the nitrogen-related EDS signal is nearly negligible in comparison to the oxygen signal in the same EDS spectrum—even if both elements are present in PBO in the same content. In the literature for PBO fibers a significantly lower content of nitrogen compared to determined oxygen is also reported. However, due to the chemical composition of the PBO polymer, both chemical elements—oxygen and nitrogen—should occur in the same amount in PBO fibers [
68].
The EDS spectrum of HPPE fibers taken from the core rope is also shown in
Figure 6. Here, a clear signal related to carbon is recorded. Surprisingly, a signal for oxygen with a related surface concentration of 6.9 at-% is also detected. Oxygen is not a part of the chemical structure of HPPE, and the samples are not further treated before the EDS measurements are done. For this, the appearance of oxygen is probably caused by fiber treatment or finishing done on this industrial product. Furthermore, this is after plasma treatment oxygen can be detected on the surface of HPPE fibers [
69]. The grey coloration of the investigated HPPE rope can be a hint for such a fiber treatment, because naturally polyethylene materials are uncolored. Often, ropes from HPPE fibers exhibit a grey coloration. This coloration is also supported for marketing reasons. The grey coloration should remind the customer of conventionally used steel ropes and the related slogan “Dyneema fiber is stronger than steel” [
70].
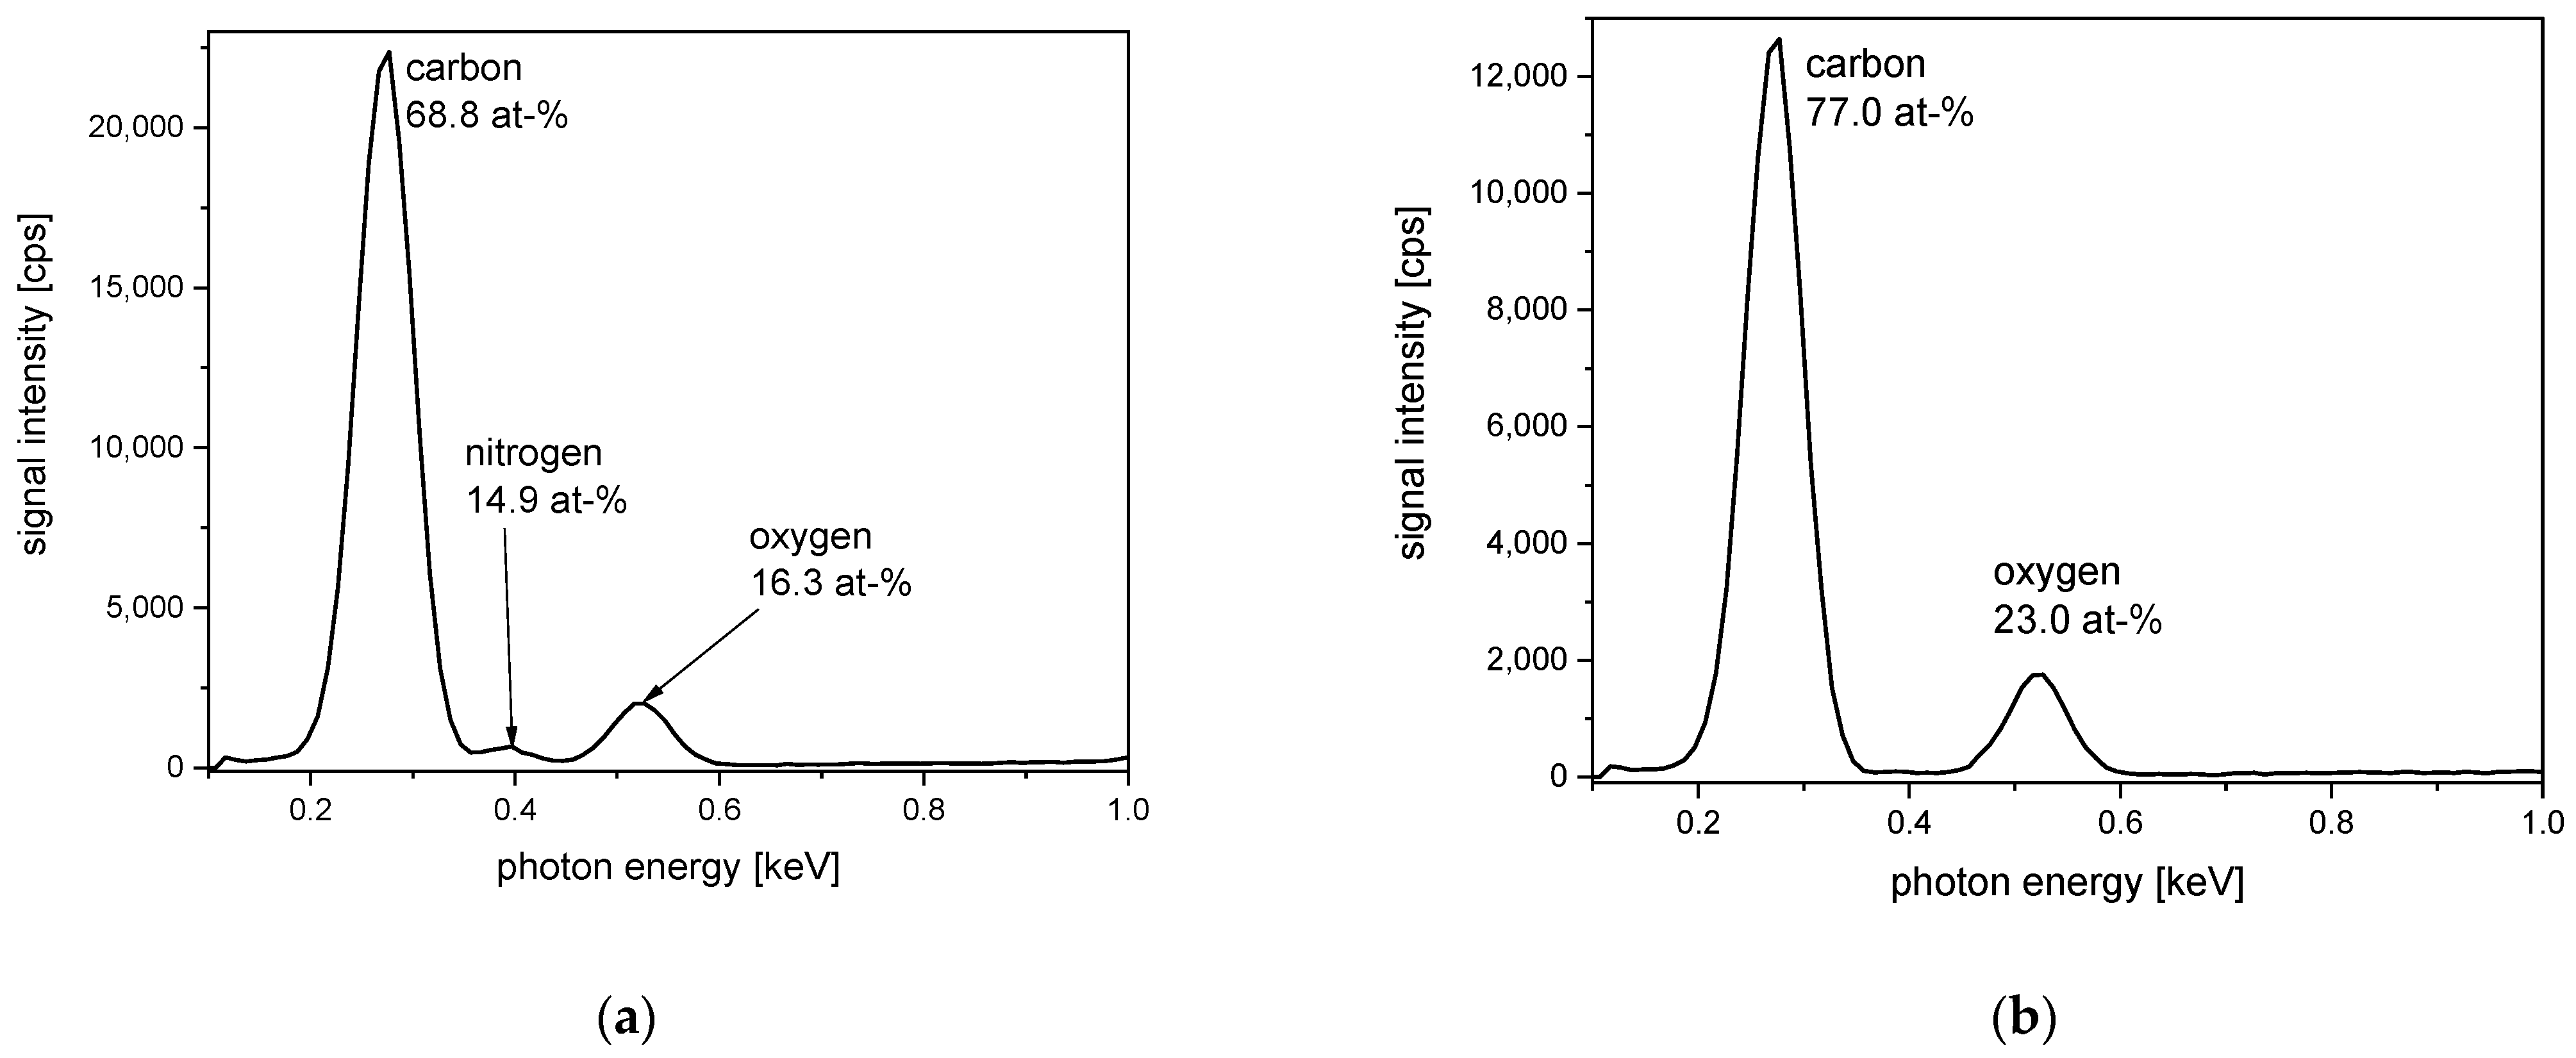
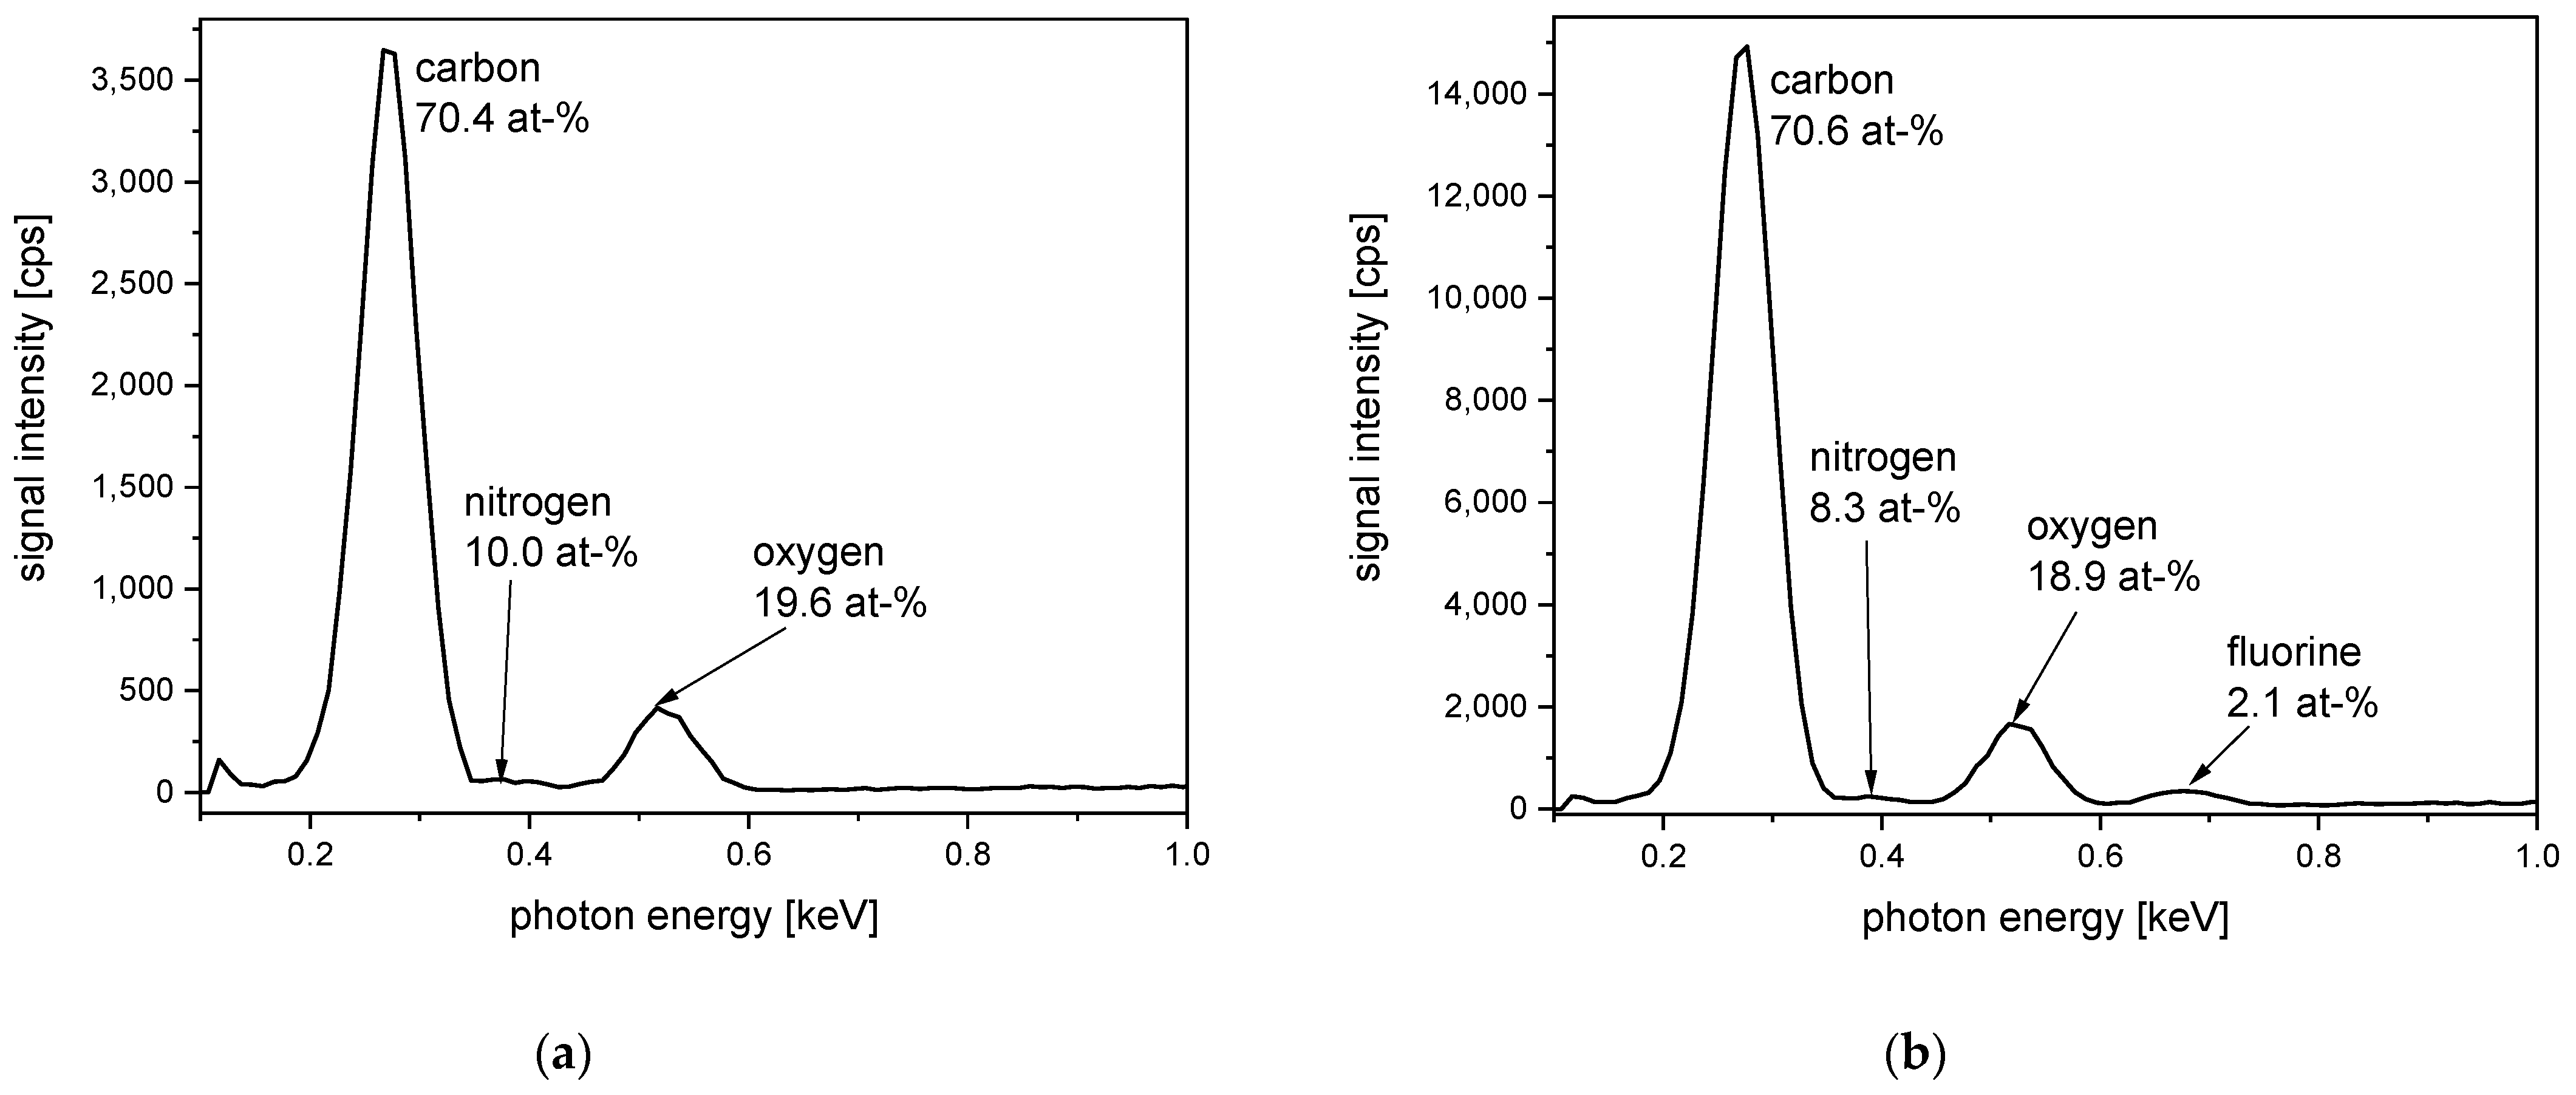
The EDS spectra from para-aramid fabric (Kevlar) and an aromatic polyester (Vectran line) are presented in
Figure 7 The aromatic polyester is gained from a line made from Vectran fibers. Vectra is a co-polyester formed from the monomers 2.6-hydroxynaphthoic acid and para-hydroxybenzoic acid [
71]. The chemical elements that are present in the structures of the related polymers can also be detected by EDS (compare
Figure 5 and
Figure 7,
Table 2). The EDS spectrum of the Vectran material shows only signals according to carbon and oxygen in a ratio that is expected from the chemical structure of the polymer. The EDS spectrum of the Kevlar fabric additionally exhibits the weak signal related to nitrogen. Even if this nitrogen signal is quite small, due to the low sensitivity of the EDS method for this element, it stands nearly for the same amount of detected nitrogen compared to the detected amount of oxygen. This measurement is in good accordance with the chemical structure of the para-aramid, which exhibits the elements oxygen and nitrogen in a ratio of 1:1 (
Figure 5). The determined amounts of nitrogen and oxygen are a little higher compared to their theoretical content calculated from the chemical structure of the polymer p-aramid (compare
Table 2). A report from earlier measurement shows that the contents of nitrogen and oxygen are below the theoretical values [
72]. Such low values are probably related to measurement or data evaluation mistakes. In contrast, the actual reported higher values can be explained by the occurrence of polymer end groups containing higher contents of nitrogen and oxygen.
4. Water- and Oil-Repellent Textiles
Water-repellent textiles are related to the presence of hydrophobic groups, either in the polymer structure or in the chemical structure of an applied finishing agent. In fact, there are different methods to realize a water-repellent textile as the treatment with polysiloxanes, paraffin waxes, or dendrimers [
73,
74,
75]. In comparison, the realization of an oil-repellent textile material is only possible with components containing so-called fluoro-carbon chemicals [
73]. Due to environmental and health concerns, the use of fluoropolymers for soil-repellent textile finishing is legally restricted, and alternative materials are the focus of current research. One approach is to replace long-chain fluoropolymers with short-chain alternatives [
76]. However, the potential bioaccumulation of such materials may also not be satisfactory. A second approach is to use completely fluorine-free textiles of which the surfaces are structured on a smaller length-scale [
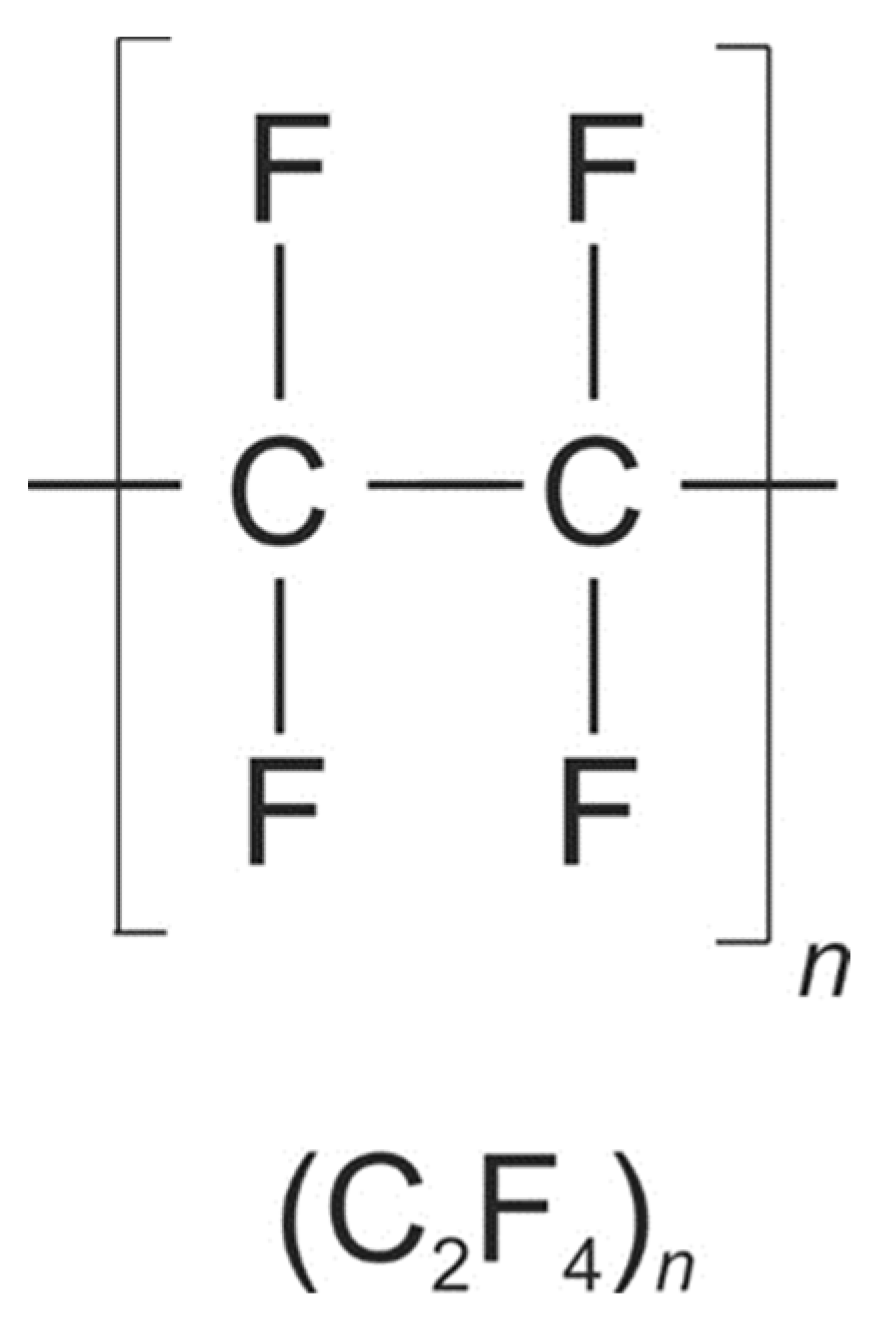
77]. However, it should be remarked that this second approach is reported in the scientific literature but did not find its way to industrial products until now. From a structural point of view, the simplest fluorocarbon fiber material is polytetrafluoroethylene PTFE, which is also supplied under the brand name Teflon. The chemical structure of PTFE is as simple as the structure of HPPE (compare
Figure 5 and
Figure 8).
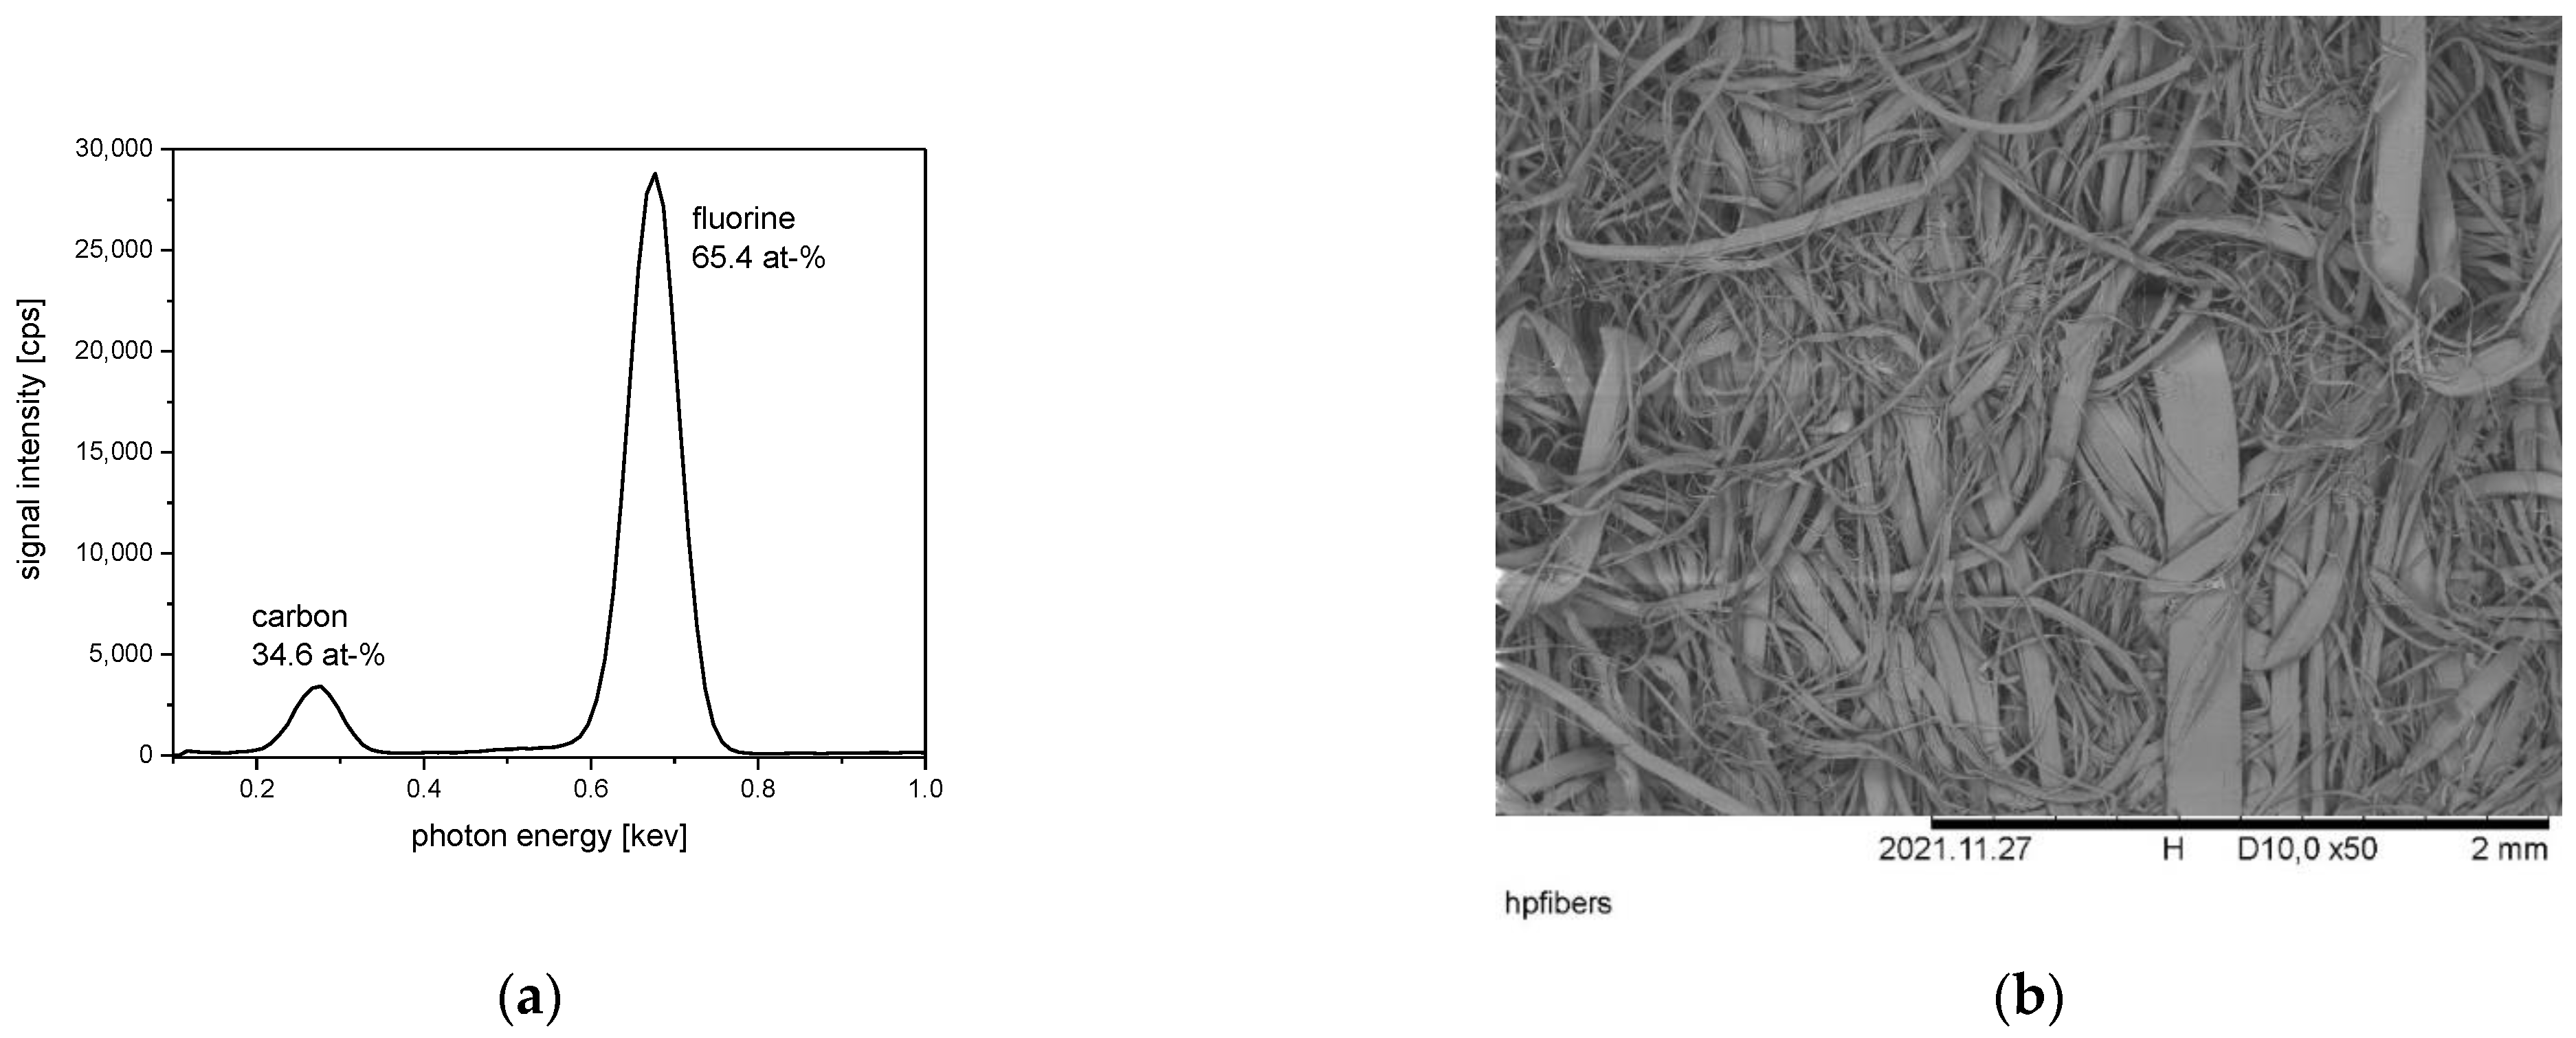
PTFE is built up only by the two chemical elements carbon and fluorine, which can both be detected in the related EDS spectrum (
Figure 9). The amount of carbon and fluorine is determined as expected from the chemical sum formula of PTFE (compare
Table 2 and
Figure 8). The presented EDS spectrum is taken from a PTFE-based non-woven filter material. The related SEM image is also presented in
Figure 9. Such filter materials are offered for the filtration of hot gases containing reactive chemicals. The determined amount of the determined elements is in the ratio which is expected from the sum formula of PTFE. The significantly better sensitivity of the EDS method for fluorine compared to carbon is especially remarkable. Cotton fabrics finished with fluoro-carbon containing dendrimer compounds are also investigated by using EDS. In addition, for these finished materials, it is possible to detect the fluorine component on the fabric surface [
78].
For PTFE fiber materials, in addition to oleophobicity, the extraordinary chemical stability, high temperature stability (T
max = 260 °C), and the strong fire resistance with LOI around 95% should be mentioned [
11,
47]. Out of all synthetic high-performance fibers, PTFE fibers can be named as the fibers with the highest chemical stability, which is probably the result of the high strength and stability of the C-F single bond. Nevertheless, two disadvantageous facts of PTFE fibers also have to be named. First, the high costs of PTFE in comparison to other conventional and high-performance fibers. Second, in the case of the thermal decomposition of PTFE, volatile fluorine containing compounds, e.g., COF
2 can be formed [
79]. Such compounds are quite toxic and can react with water under the formation of hydrogen fluoride gas HF.
5. Fiber Materials with Extraordinary Chemical Stability
The synthetic fiber material with the best chemical stability is clearly PTFE. However, other fibers are also named chemically stable. In fact, the term “chemically stable” is not exactly defined, so there is not an absolute criterium when a fiber is chemically stable or not. One reason for this is the broad range of different chemicals which could damage the fiber. Chemicals are often categorized into groups like acids, bases, oxidative agents, and organic solvents [
1]. Other categories mentioned are hydrolysis stability, thermal-oxidative stability, seawater stability, or stability against chlorine Cl
2 [
1,
80]. In particular, the category “organic solvents” is confusing, because of the broad range of different organic solvents with completely different solving properties. Furthermore, the type of application of the chemicals to a fiber material can differ in a broad range. The main parameters are temperature during exposure, duration of exposure, and applied concentration. The exposition temperature can be set to room temperature up to the boiling point of a liquid solvent. A treatment at high temperature is demanding even with a shorter exposure duration. Another factor influencing the view of chemical stability is how the effect of chemical treatment on the fiber is determined. Often reported is the weight loss of the fiber material after chemical treatment. However, the weight loss indicates only if the fiber material is dissolved into the chemical. It does not indicate if the fiber properties are influenced by the chemical and if the fiber can still be used for demanded application. The weight loss after chemical treatment may be low, but the change in the mechanical stability of the fiber could be strong after the same treatment, so the fiber is too weak for dedicated use. For this, a determined fiber strength after chemical treatment is more reliable compared to a simple determination of the fiber weight.
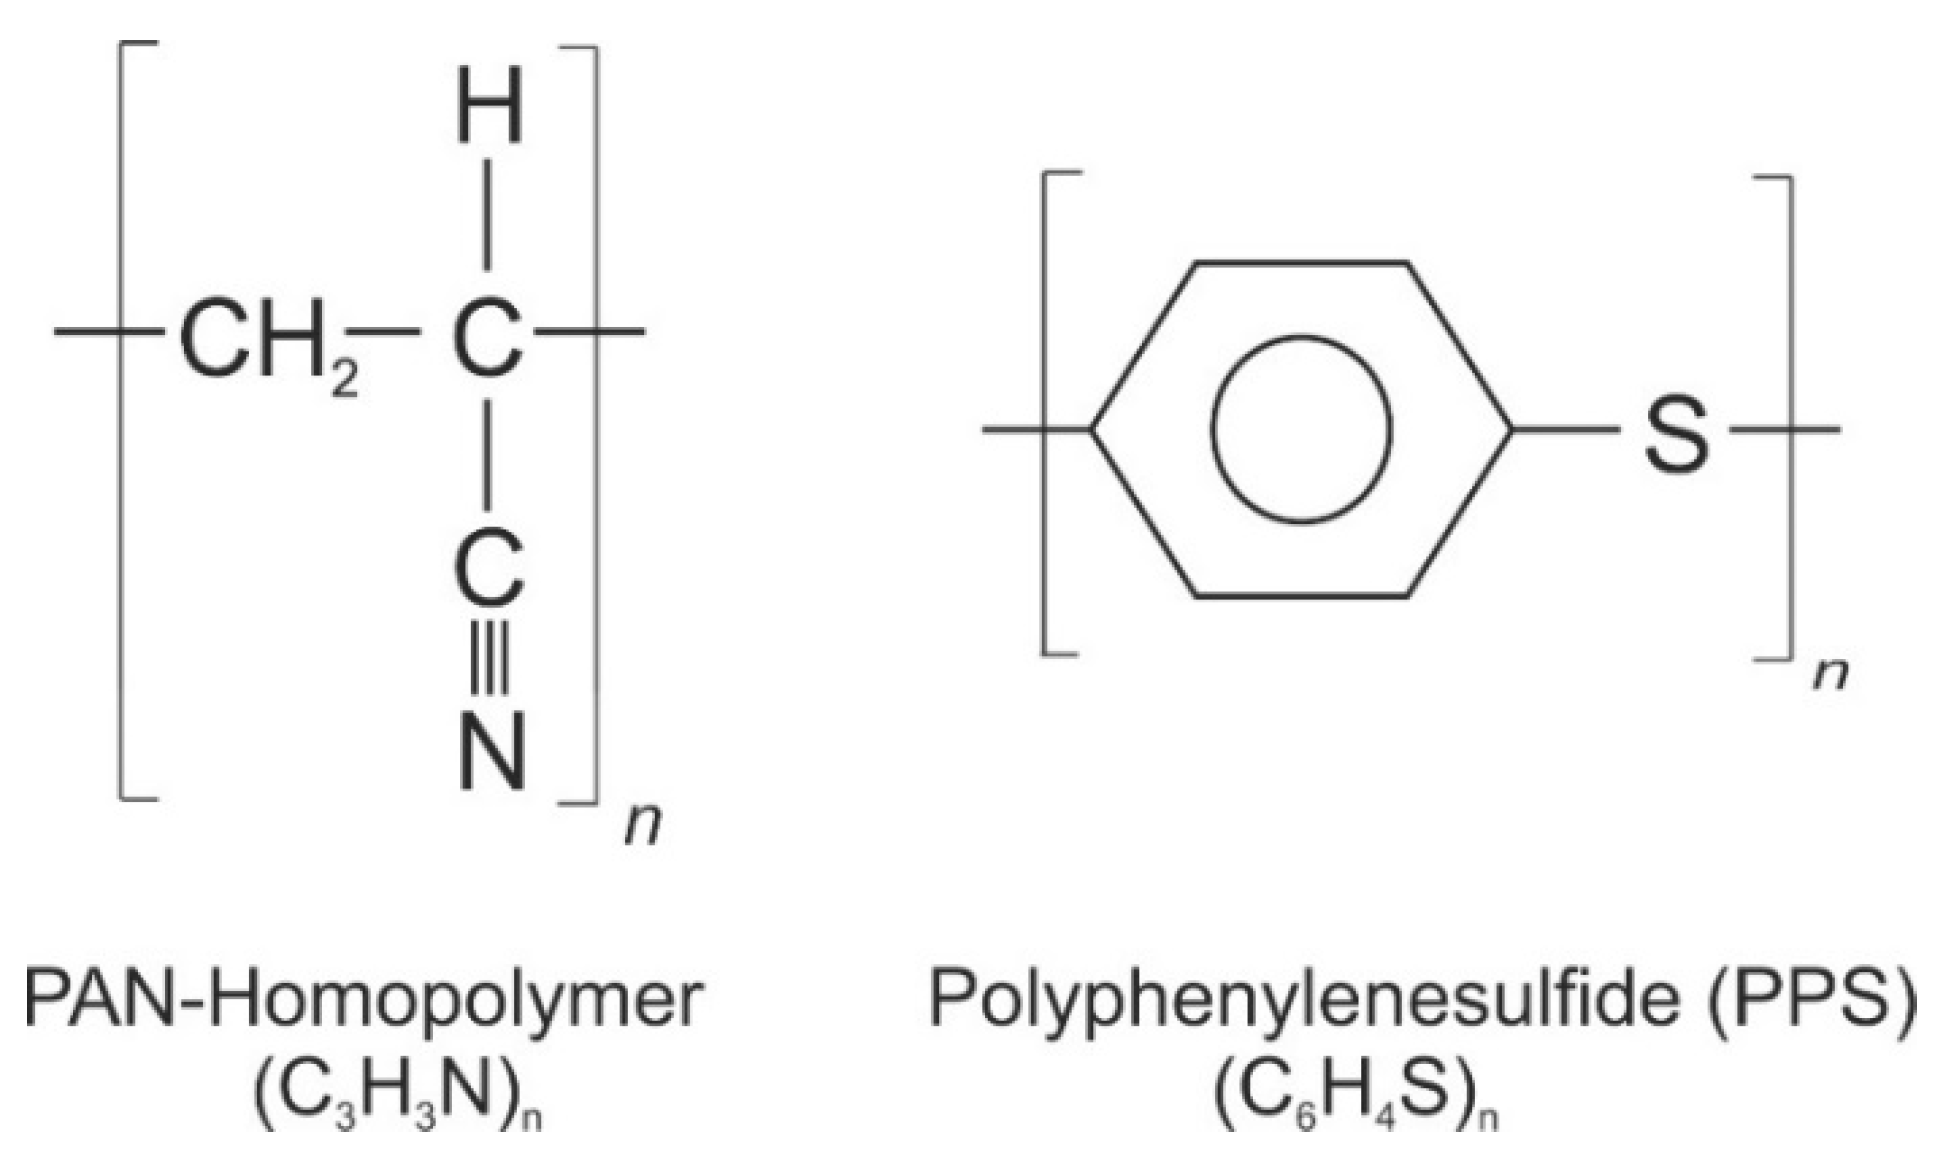
With this background, it is clear that the decision is not easy, and fiber materials are presented in this section of “extraordinary chemical stability”. Of course, PTFE fiber materials have to be mentioned. However, PTFE fibers are already discussed in the previous section due to their unique oleophobic properties. The decision is made to be presented here, especially the chemically stable fibers homo-polyacrylonitrile Homo-PAN and polyphenylene sulfide PPS (chemical structures shown in
Figure 10). In contrast with conventional modacrylic fibers that are copolymers, homo-polyacrylonitrile is built up only by one type of repeating unit (
Figure 10). Homo-PAN is a technical fiber which is not used in the clothing area. It exhibits an excellent stability under acidic and alkaline conditions, especially in contrast with other fibers containing ester, amide, or imide groups, which can be hydrolyzed under these conditions. Nevertheless, a strong alkaline treatment can lead to the reaction of the nitrile groups -CN on the fiber surface [
81,
82]. With this, the surface modification of PAN fibers for the improvement of dyeing properties is possible—while the main body of the fiber is not destroyed by the caustic treatment [
81,
82]. PAN-fibers can be damaged and solved by strong aprotic dipolar solvents, e.g., dimethylformamide DMF. On the other hand, this solubility in DMF offers the chance for the production of PAN-fibers by electrospinning, wet- or dry-spinning processes [
83,
84].
In contrast with PAN fibers, PPS fibers are even stable against solving with various types of organic solvents. Due to the extraordinary chemical stability, PPS fiber materials are often named as competing products for the replacement of PTFE fibers. This replacement is especially attractive, because of the moderate costs for PPS fibers compared to the high price of PTFE fibers. A shortcoming of PPS fiber materials is their sensitivity against oxidative agents. Even oxygen from air can damage PPS fibers during storage at high temperatures. Oxidative agents can oxidize the sulfur bridges of the PPS fibers in a first reactive step [
85,
86].
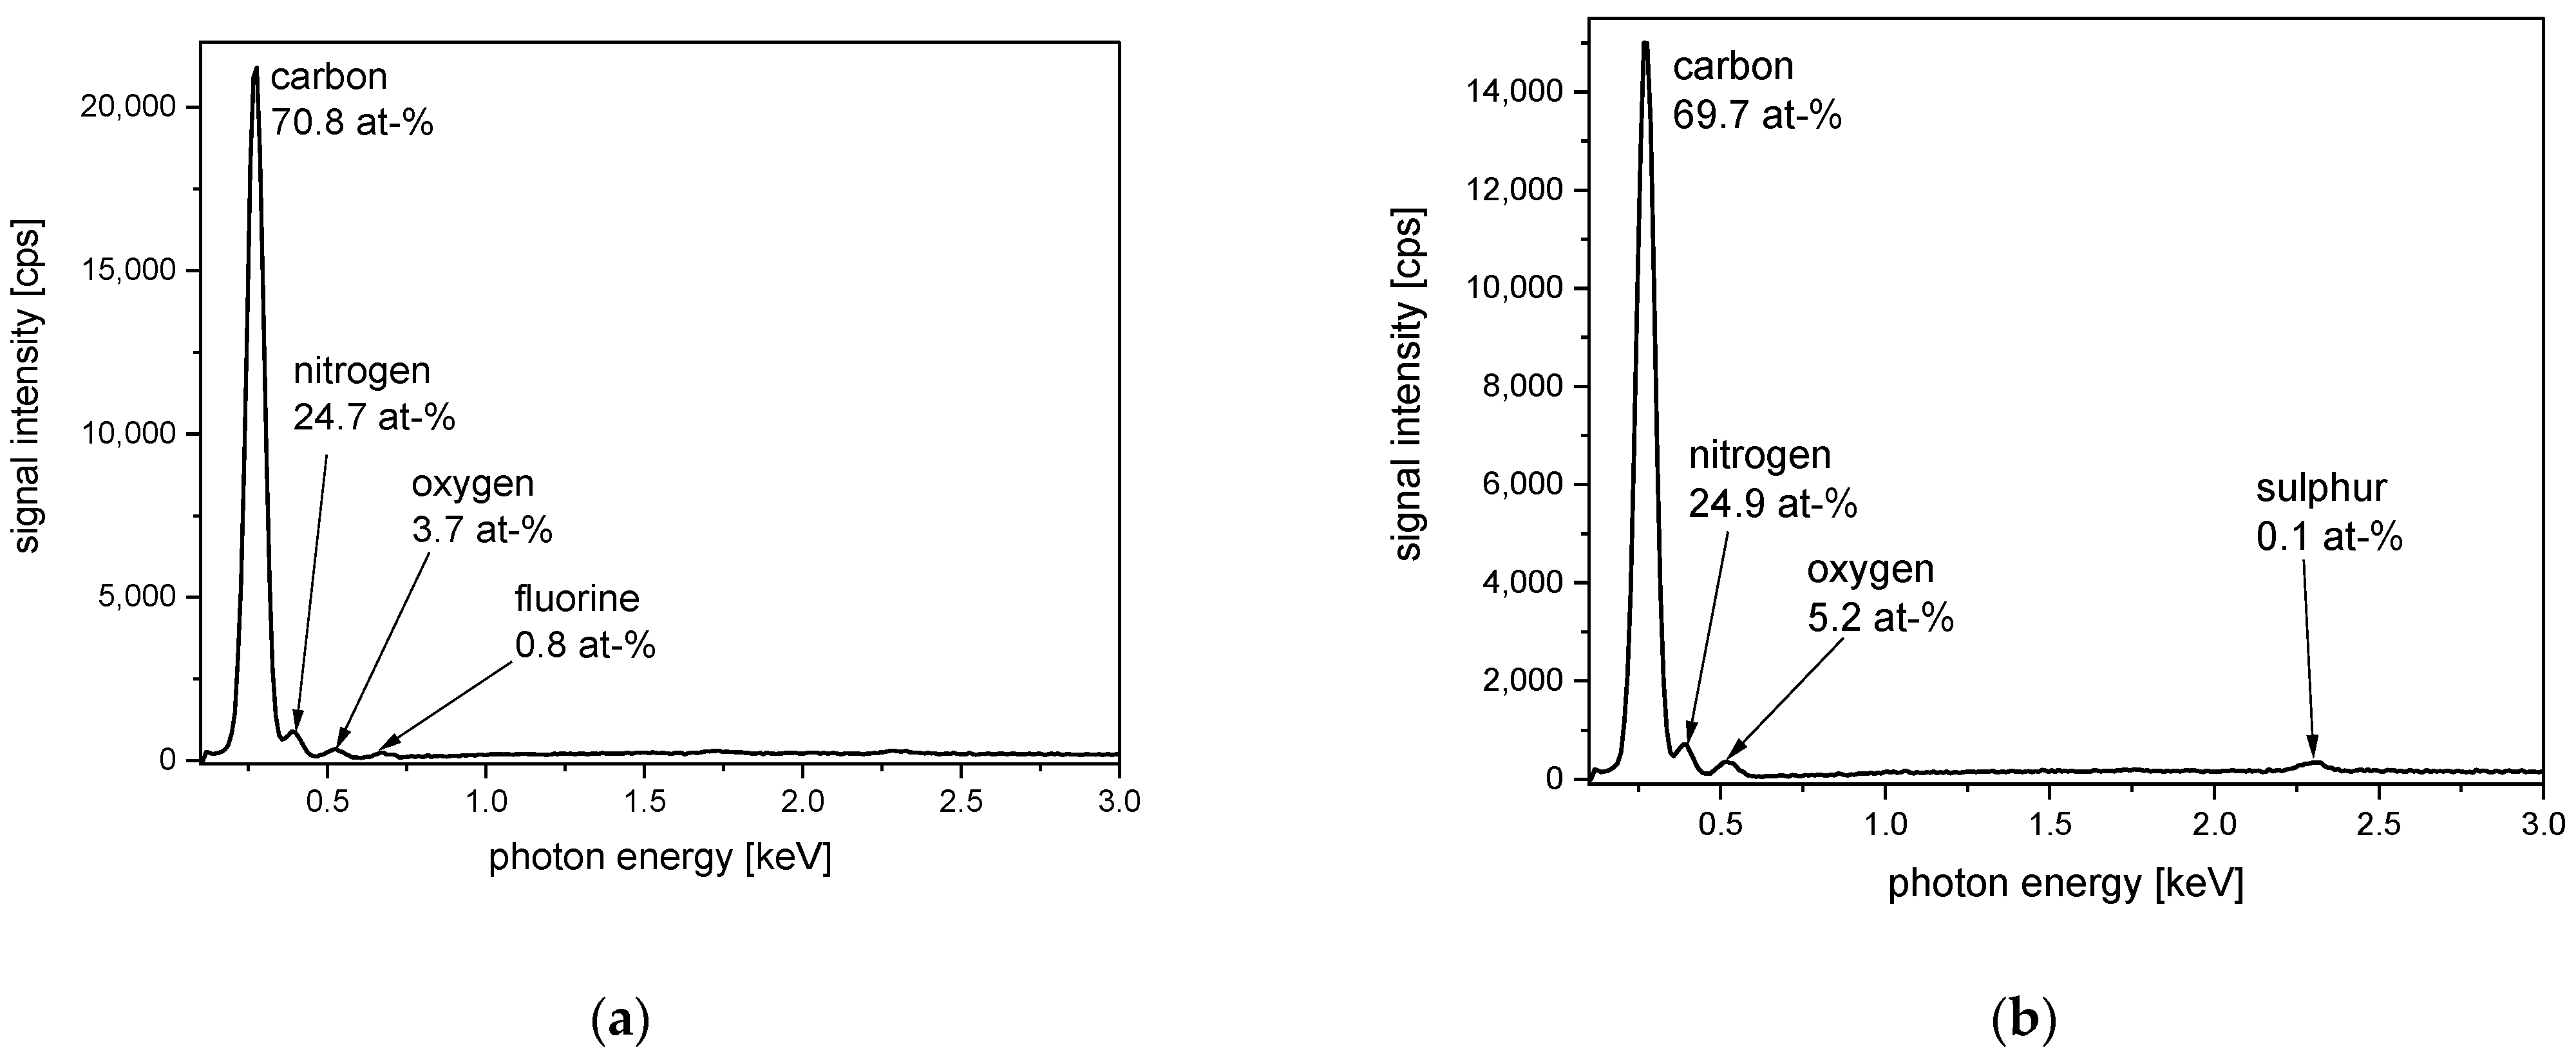
As examples of PAN materials, non-woven filter materials from PAN homopolymer fibers and PAN-copolymer are investigated by the EDS method (
Figure 11). The EDS-spectrum of the PAN homopolymer clearly exhibits signals according to the chemical elements carbon and nitrogen, as expected from the chemical structure of this polymer (compare also
Table 2). However, small amounts oxygen and fluorine are detected on the surface of this non-woven material. The presence of fluorine can be explained by a fiber treatment using fluoro-carbon compounds to gain water- and oil-repellent properties. This is done to improve the cleaning procedures of the filter materials after a certain duration of usage. Furthermore, the determined oxygen can be part of a finishing agent applied to the PAN non-woven to improve its properties. The EDS spectrum of the PAN copolymer exhibits, additionally, the signals for carbon and nitrogen, and signals dedicated to oxygen and sulfur, which can be explained by the composition of the comonomer. PAN copolymers often contain methyl acrylate units or sulphonate groups [
87,
88].
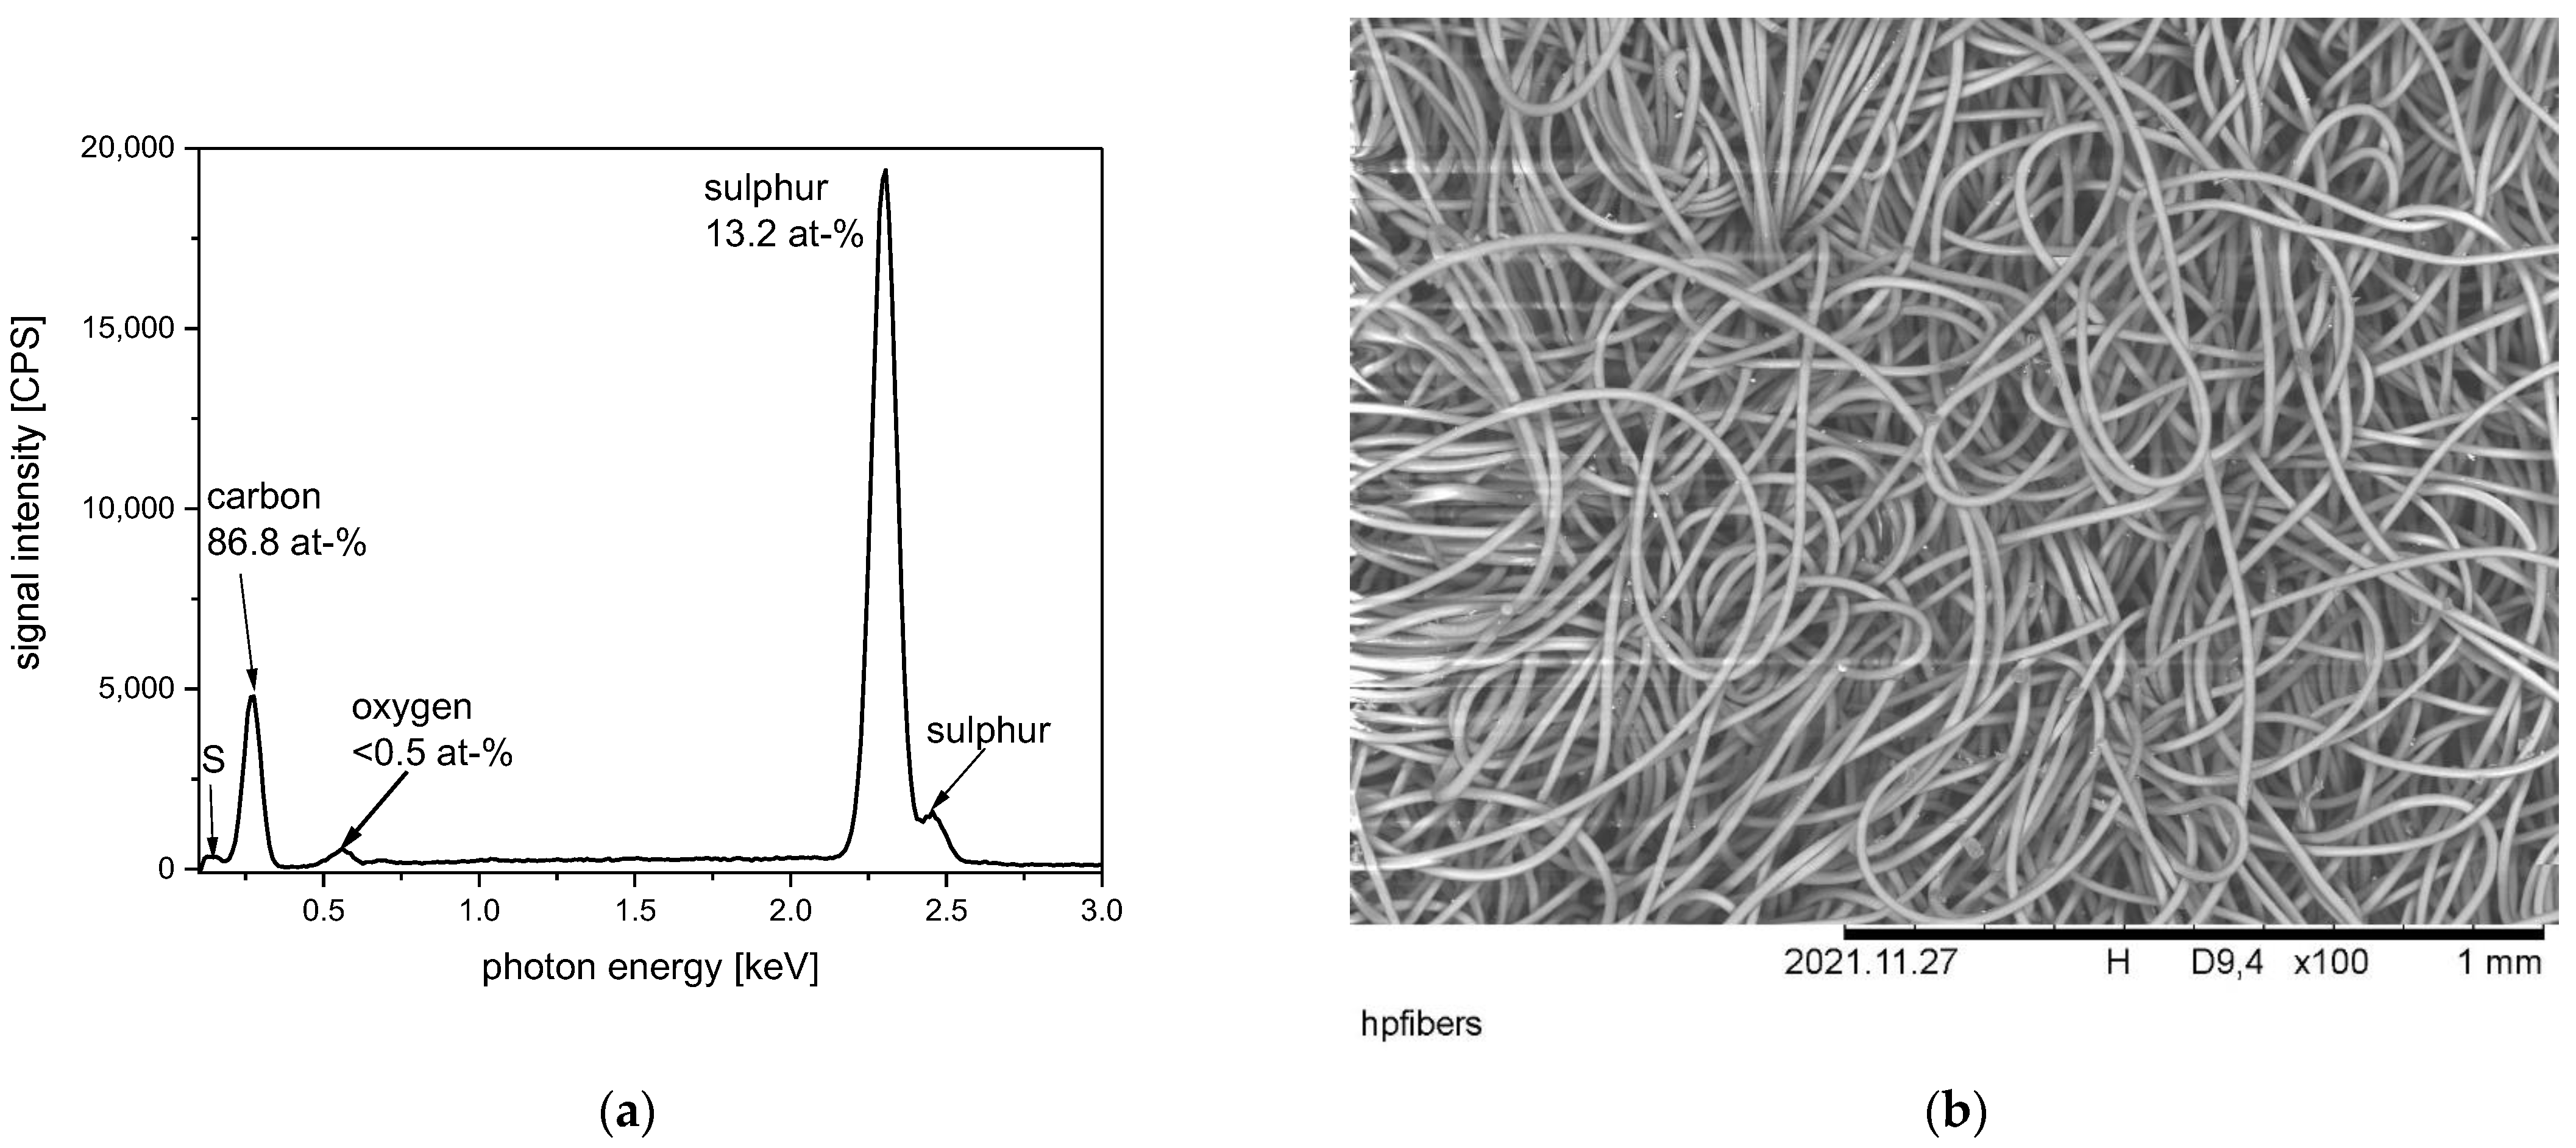
For the presentation of SEM images and EDS spectra, different PPS fiber materials are investigated and presented. All PPS samples are taken from non-woven fiber felts offered as filtration materials. These filter materials are dedicated to the filtration of chemically aggressive hot gases. First, a PPS filter material is presented, which contains no further additives (
Figure 12). The EDS spectrum of the PPS material clearly exhibits the composition of the elements carbon and sulfur in the expected ratio (compare also
Table 2). Due to the stronger sensitivity of the EDS method for sulfur compared to carbon, the signal intensity for sulfur is nearly four times stronger, even if the sulfur content on the fiber is only 13 at-%. Additionally, to the main sulfur signal at 2.31 keV, a second signal occurs at 2.46 keV. Furthermore, a small signal at low photon energy at 0.15 keV is dedicated to the presence of sulfur. Additionally, to carbon and sulfur, a small signal occurs, which can be assigned to oxygen. This occurrence of oxygen can be explained by the presence of finishing agents or by the part-oxidation of PPS at the sulfur bridge.
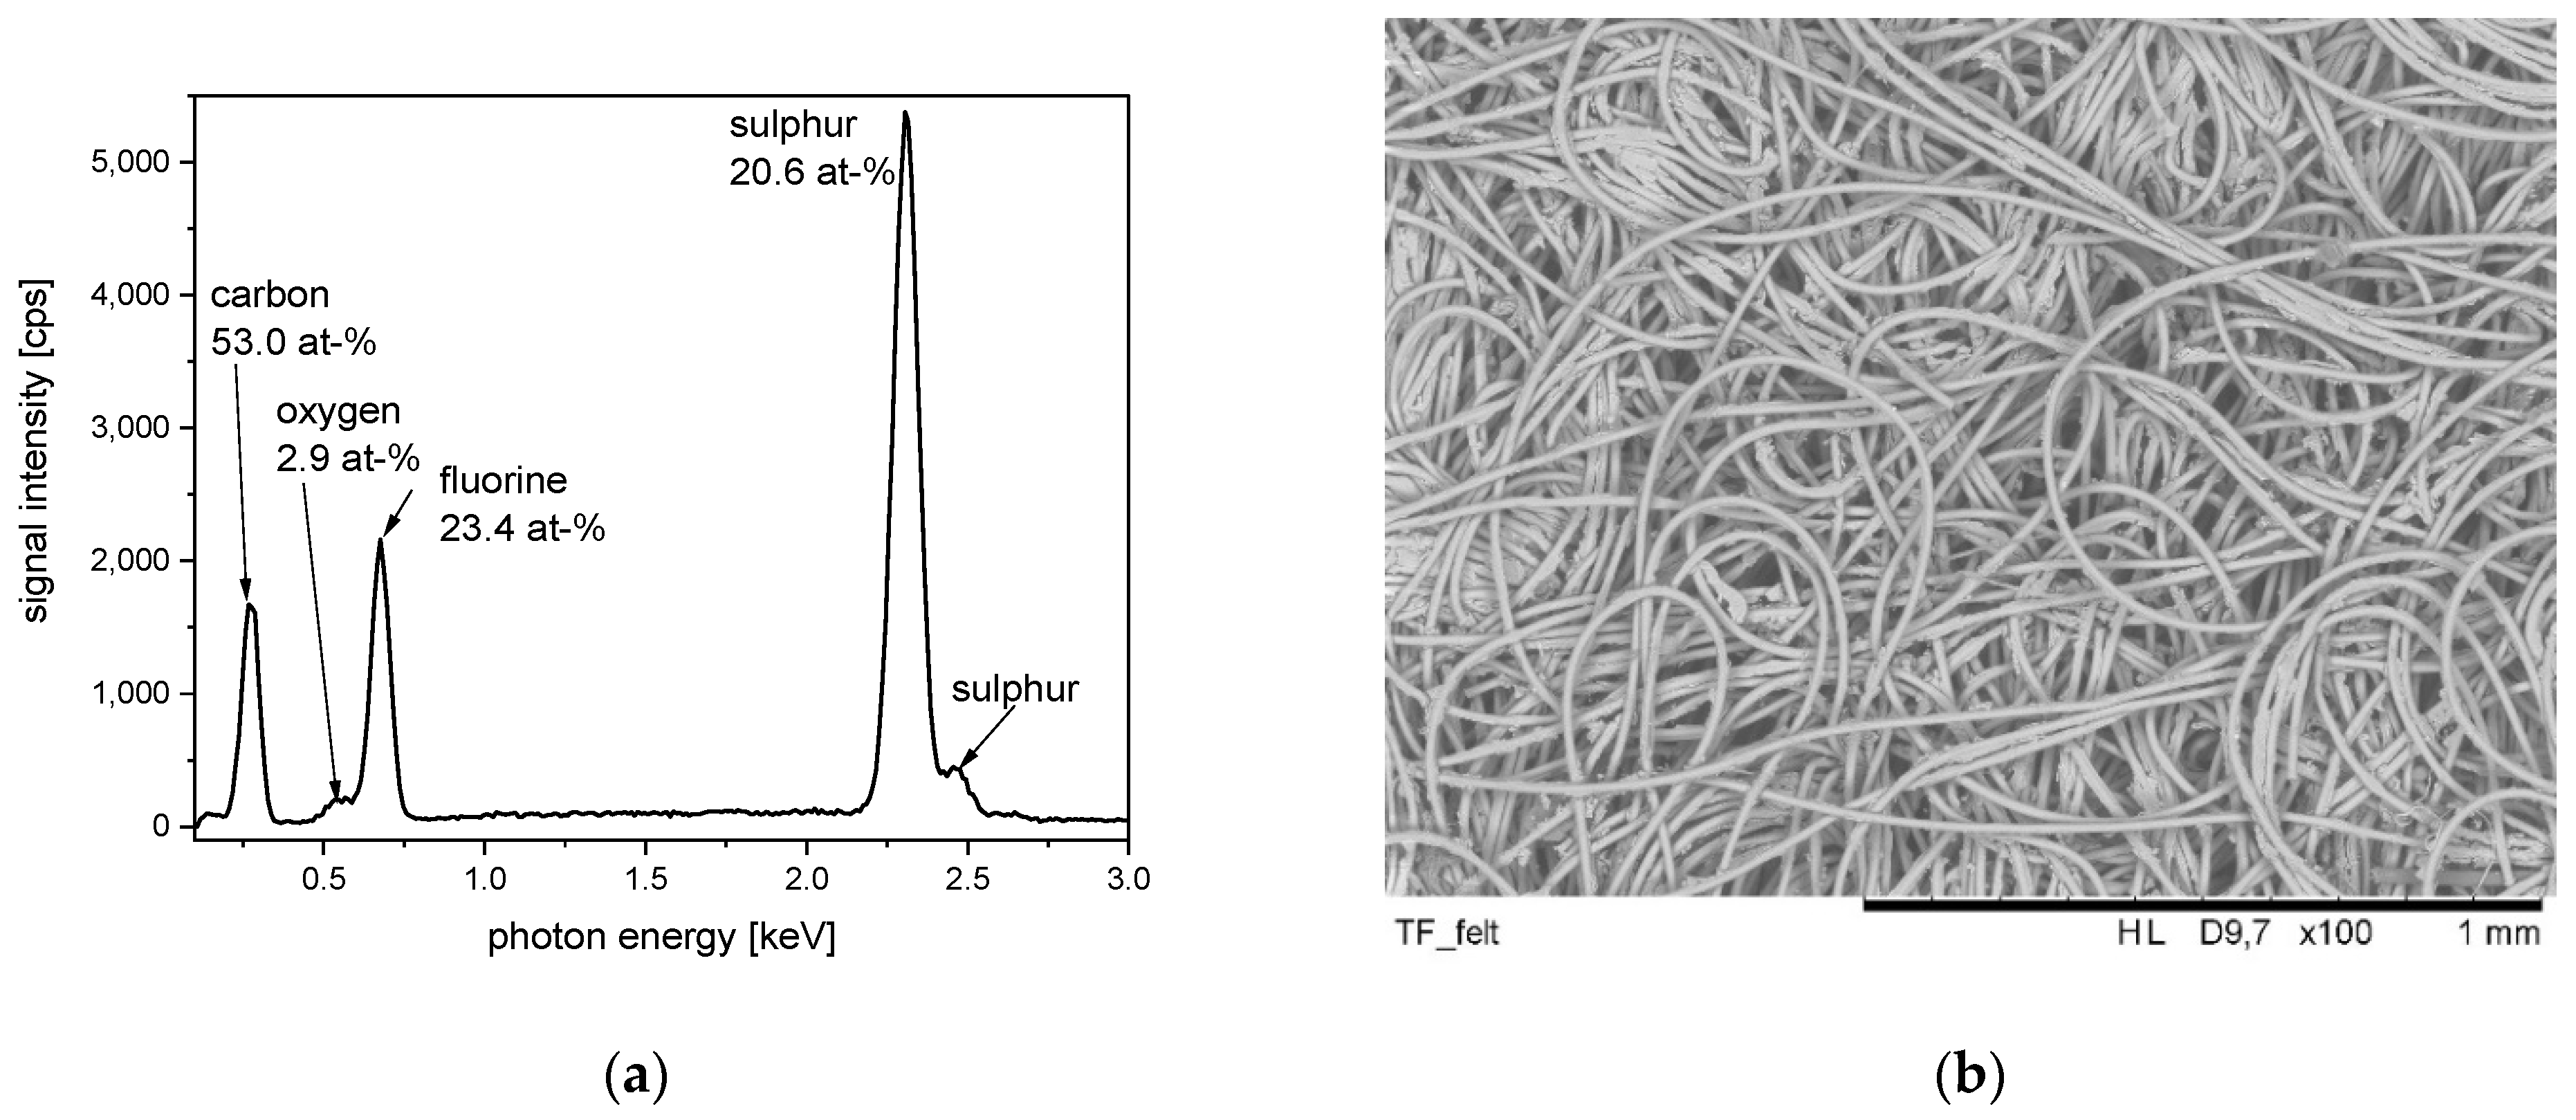
The second PPS fiber sample is modified by a fluoro carbon finish, probably applied to improve the cleaning properties of the non-woven filter material (
Figure 13). The EDS spectrum taken from this sample clearly shows the presence of fluorine as a result of previous finishing and the elements carbon and sulfur related to the PPS fiber. Of course, the element carbon is also part of a fluoro carbon finishing agent. Furthermore, a weak signal dedicated to the presence of oxygen is detected. Furthermore, here, the presence of oxygen can be explained with its content in the finishing agent or by the part-oxidation of PPS at the sulfur bridge. The treatment of PPS microfiber membranes with PTFE ultrafine powders is reported to lead to materials with superhydrophobicity and superoleophobicity. These materials can be used for oil/water separation [
89].
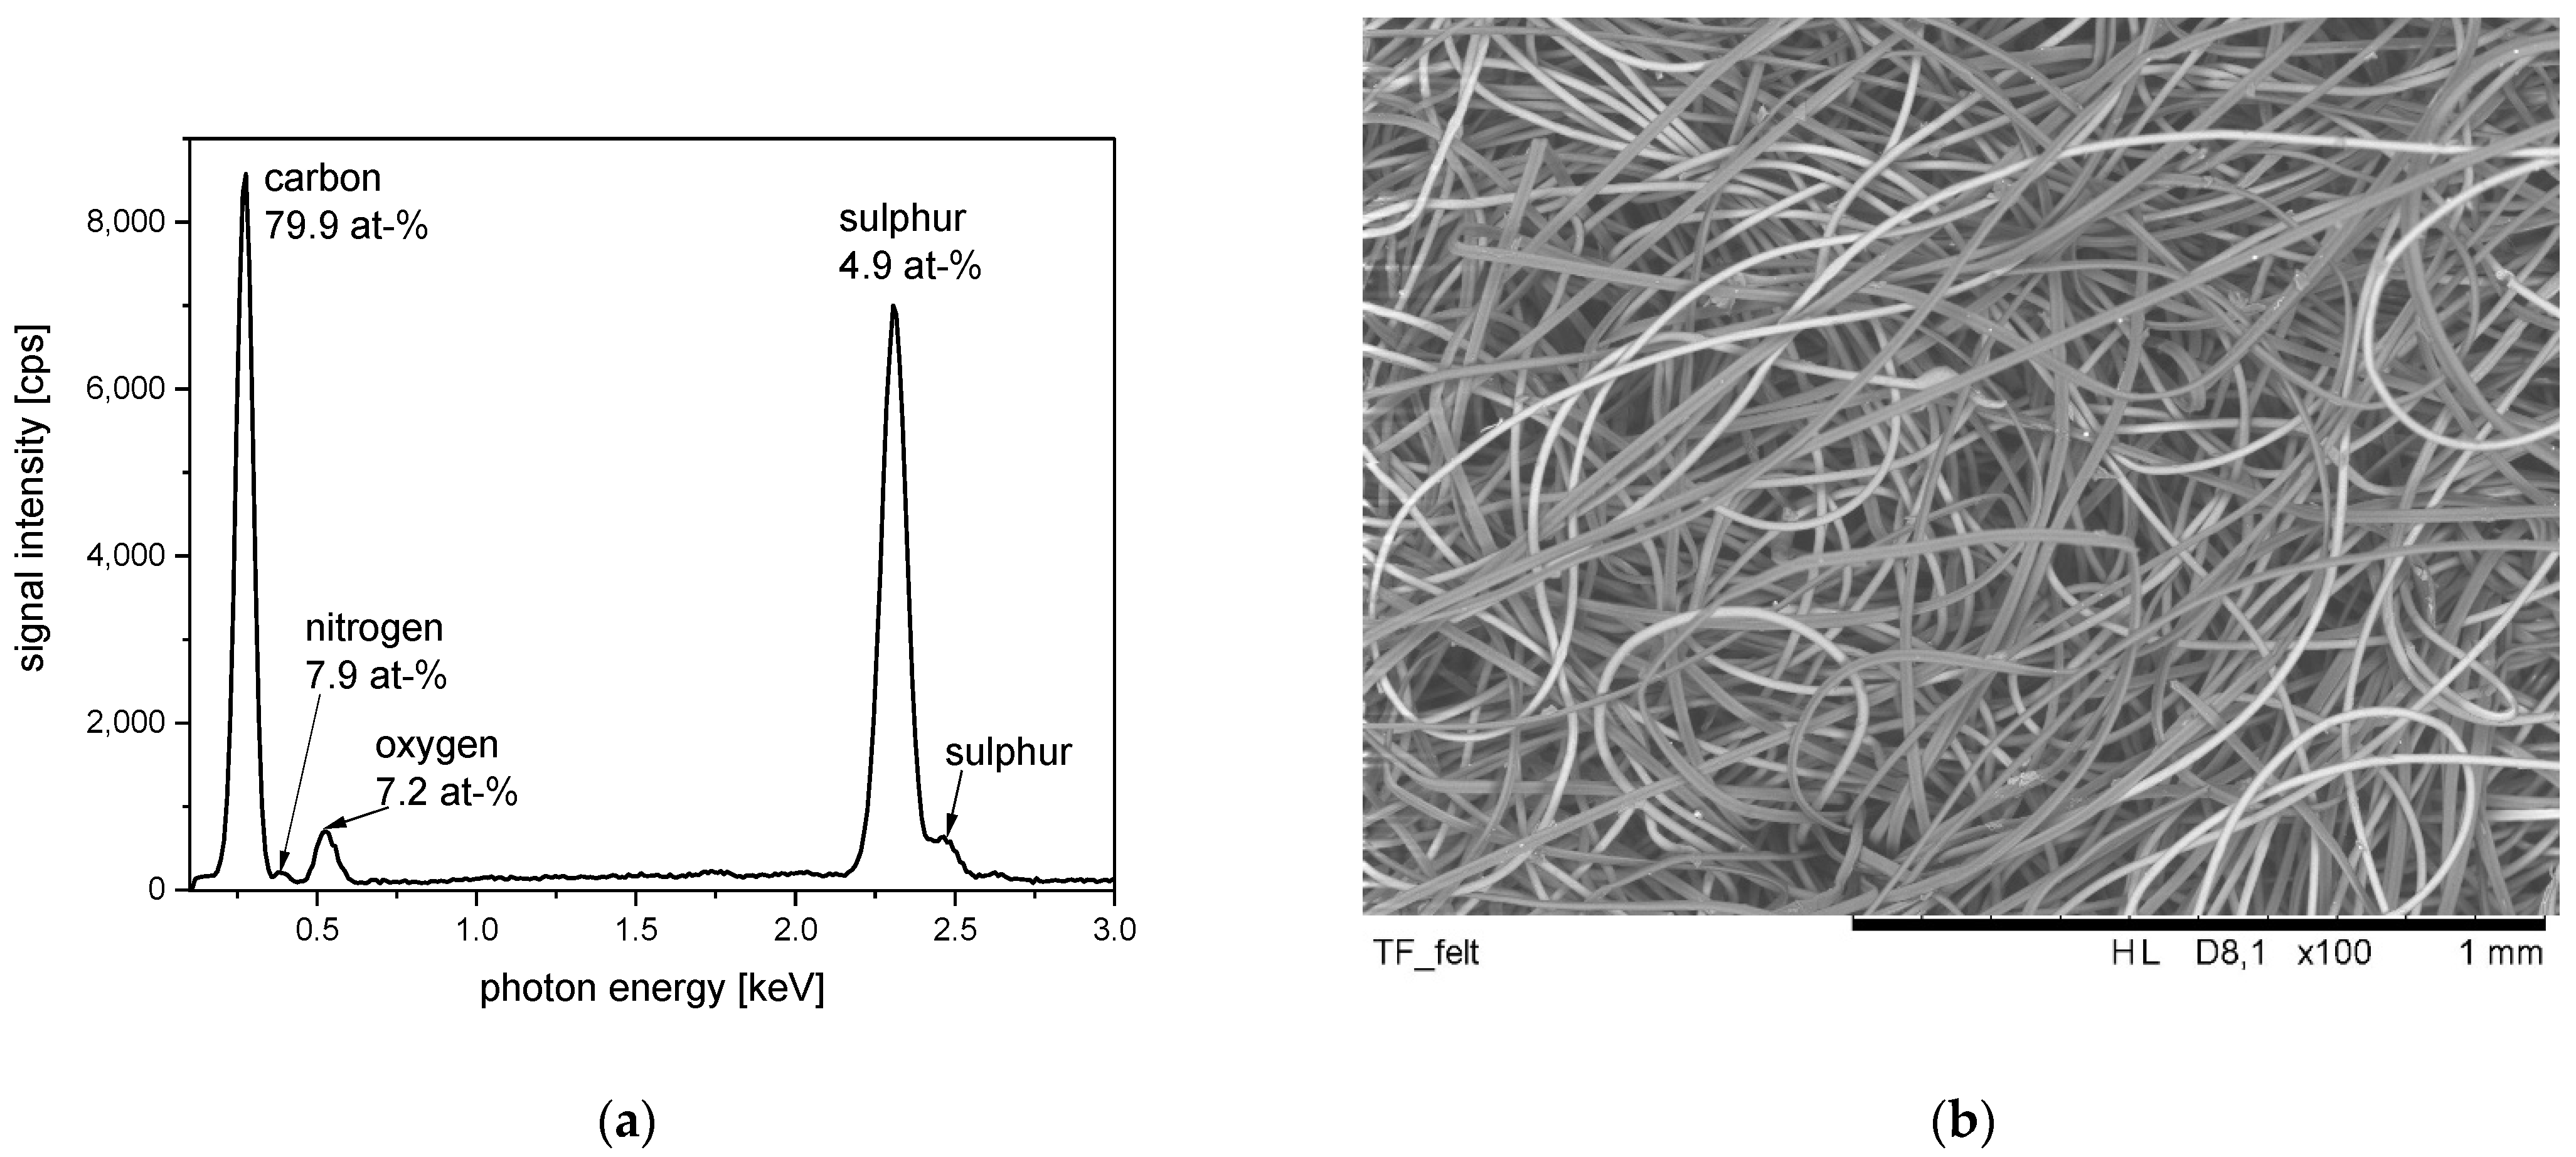
The third presented PPS containing sample is a non-woven filter material made by two different high-performance fibers (PPS and meta-aramid) (
Figure 14). In the related SEM image, the two different types of fibers can already be identified. As a material contrast, the PPS fibers appear brighter in the SEM image. The related EDS spectrum exhibits signals according to the four elements—carbon, oxygen, nitrogen, and sulfur. The difference in the element sensitivity of the EDS method for the different elements is impressively demonstrated by this EDS spectrum. This fiber sample contains nearly the same content of nitrogen compared to sulfur. However, the nitrogen-related EDS signal is nearly negligible and even weaker than the second sulfur signal, at 2.46 keV.
6. Fire-Retardant Textiles
Fire-retardant fiber materials are not ignited in contact with fire or are self-extinguishing after a flame contact is removed. Most often, the fire-retardant properties of textiles are ranked by the LOI value [
90]. Nevertheless, other fiber properties also have to be considered, if the right fiber material is to be chosen for a certain application. For applications with possible contact with light or chemicals, the fiber should also exhibit a suitable light and chemical stability. Another important criterium is whether the fiber can melt or not. A fire-retardant textile with the ability to melt must be avoided for clothing applications in direct skin contact. Finally, an overview of a possible smoke formation (smoke density and toxicity) should also be carried out to choose the right fiber. Practical applications are found, for example, in flame-retardant home textiles or clothes for firefighters [
91]. In these areas, usually, combinations of different flame-retardant textile materials are used. This combination can be done as blended yarn, mixed fabric, or multilayer material. The main aims of combing different materials are to realize flame-retardant properties, chemical stability, mechanical stability, and textile comfort together in one product [
91].
Often, flame-retardant properties are explained by the fire cycle describing the exothermic reactions of the pyrolyzed textile material with oxygen from the air in a repeating cyclic process. If the fire must be stopped, this fire cycle has to be disrupted [
92]. This disruption can be done by a different mechanism, e.g., cooling by endothermic reaction, the formation of non-burning gases diluting the oxygen content, char formation on the textile insulating it from the fire, or radical scavengers directly disrupting the radical chain reaction in the flame [
92].
Flame-retardant fibers and finishing agents are usually categorized according to the chemical elements that they contain. The chemical elements related to different flame-retardant processes are halogens (fluorine, chlorine, and bromine), nitrogen, phosphorous, sulfur, and silicon. As a structural element from organic chemistry, aromatic ring systems also support the flame-retardant properties of fiber materials. However, the flame-retardant properties are not just related to the presence of specific chemical elements. Furthermore, the formation of specific toxic components in burning gas is the result of different chemical elements present in the fiber. The formation of NOx and HCN in the burning gas is related to the presence of nitrogen. Sulfur-containing fiber materials often have SO2 in burning gas, and halogen content is related to the acidic gases HCl, HF, and HBr.
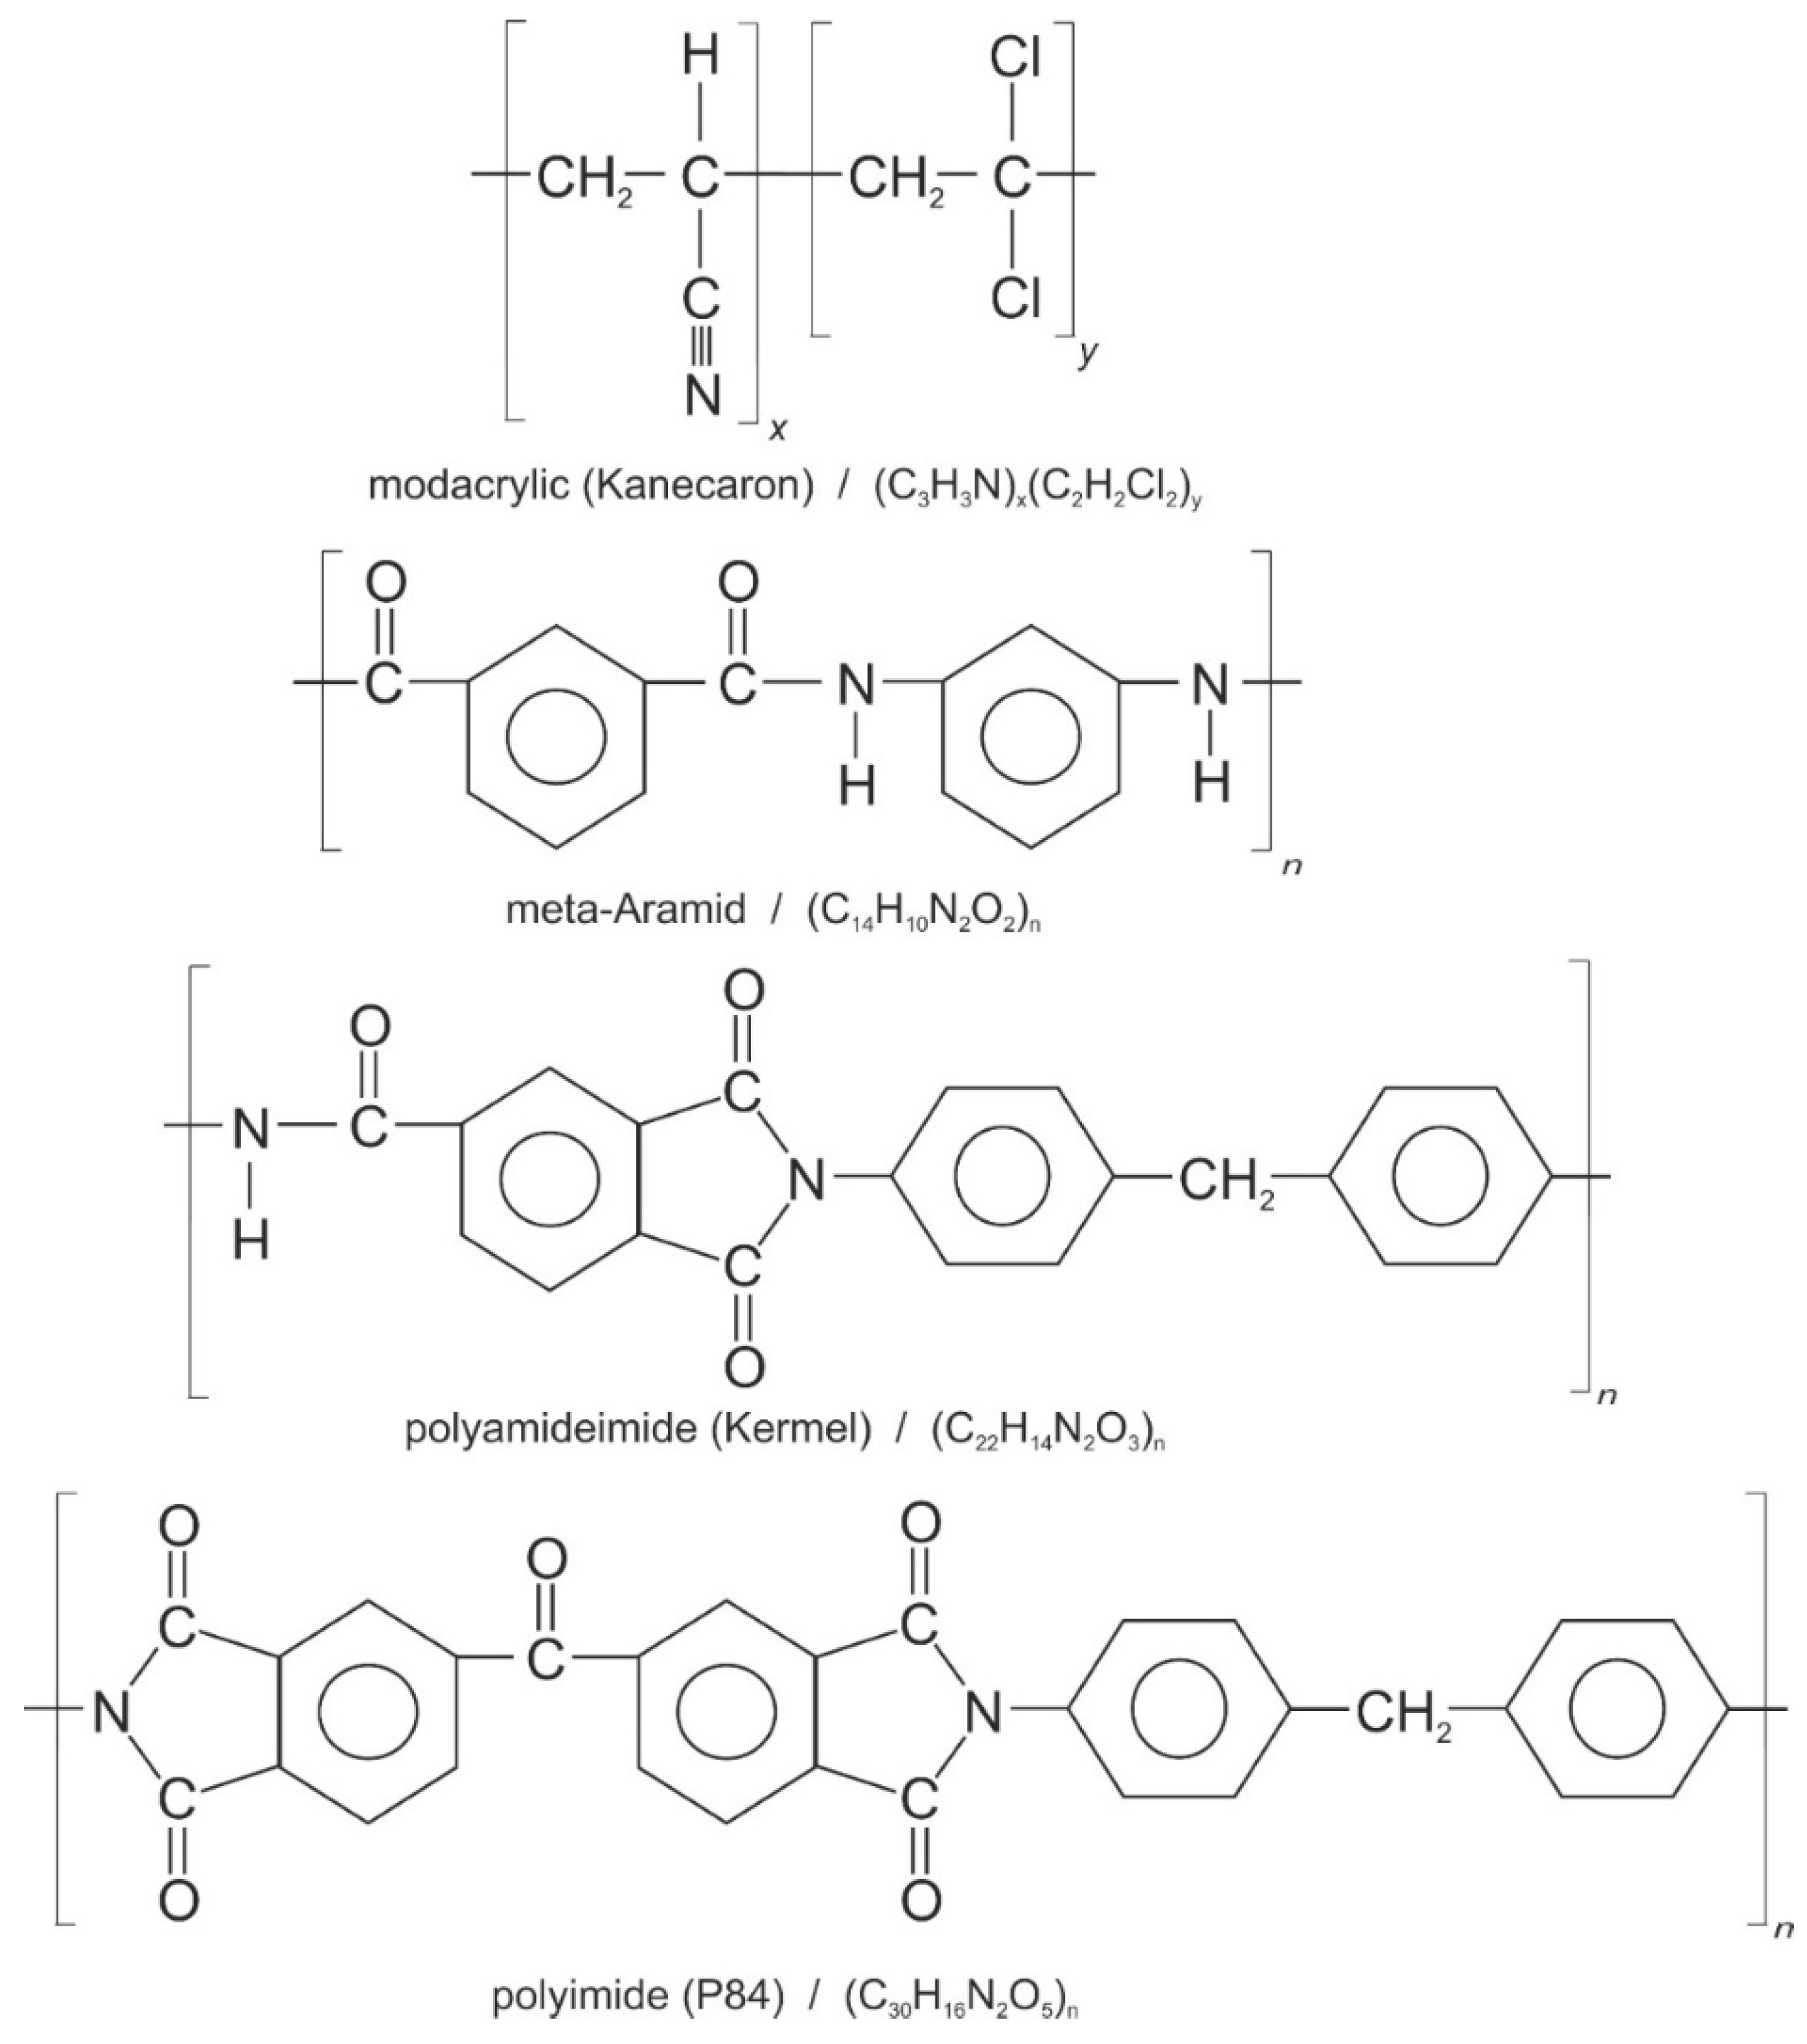
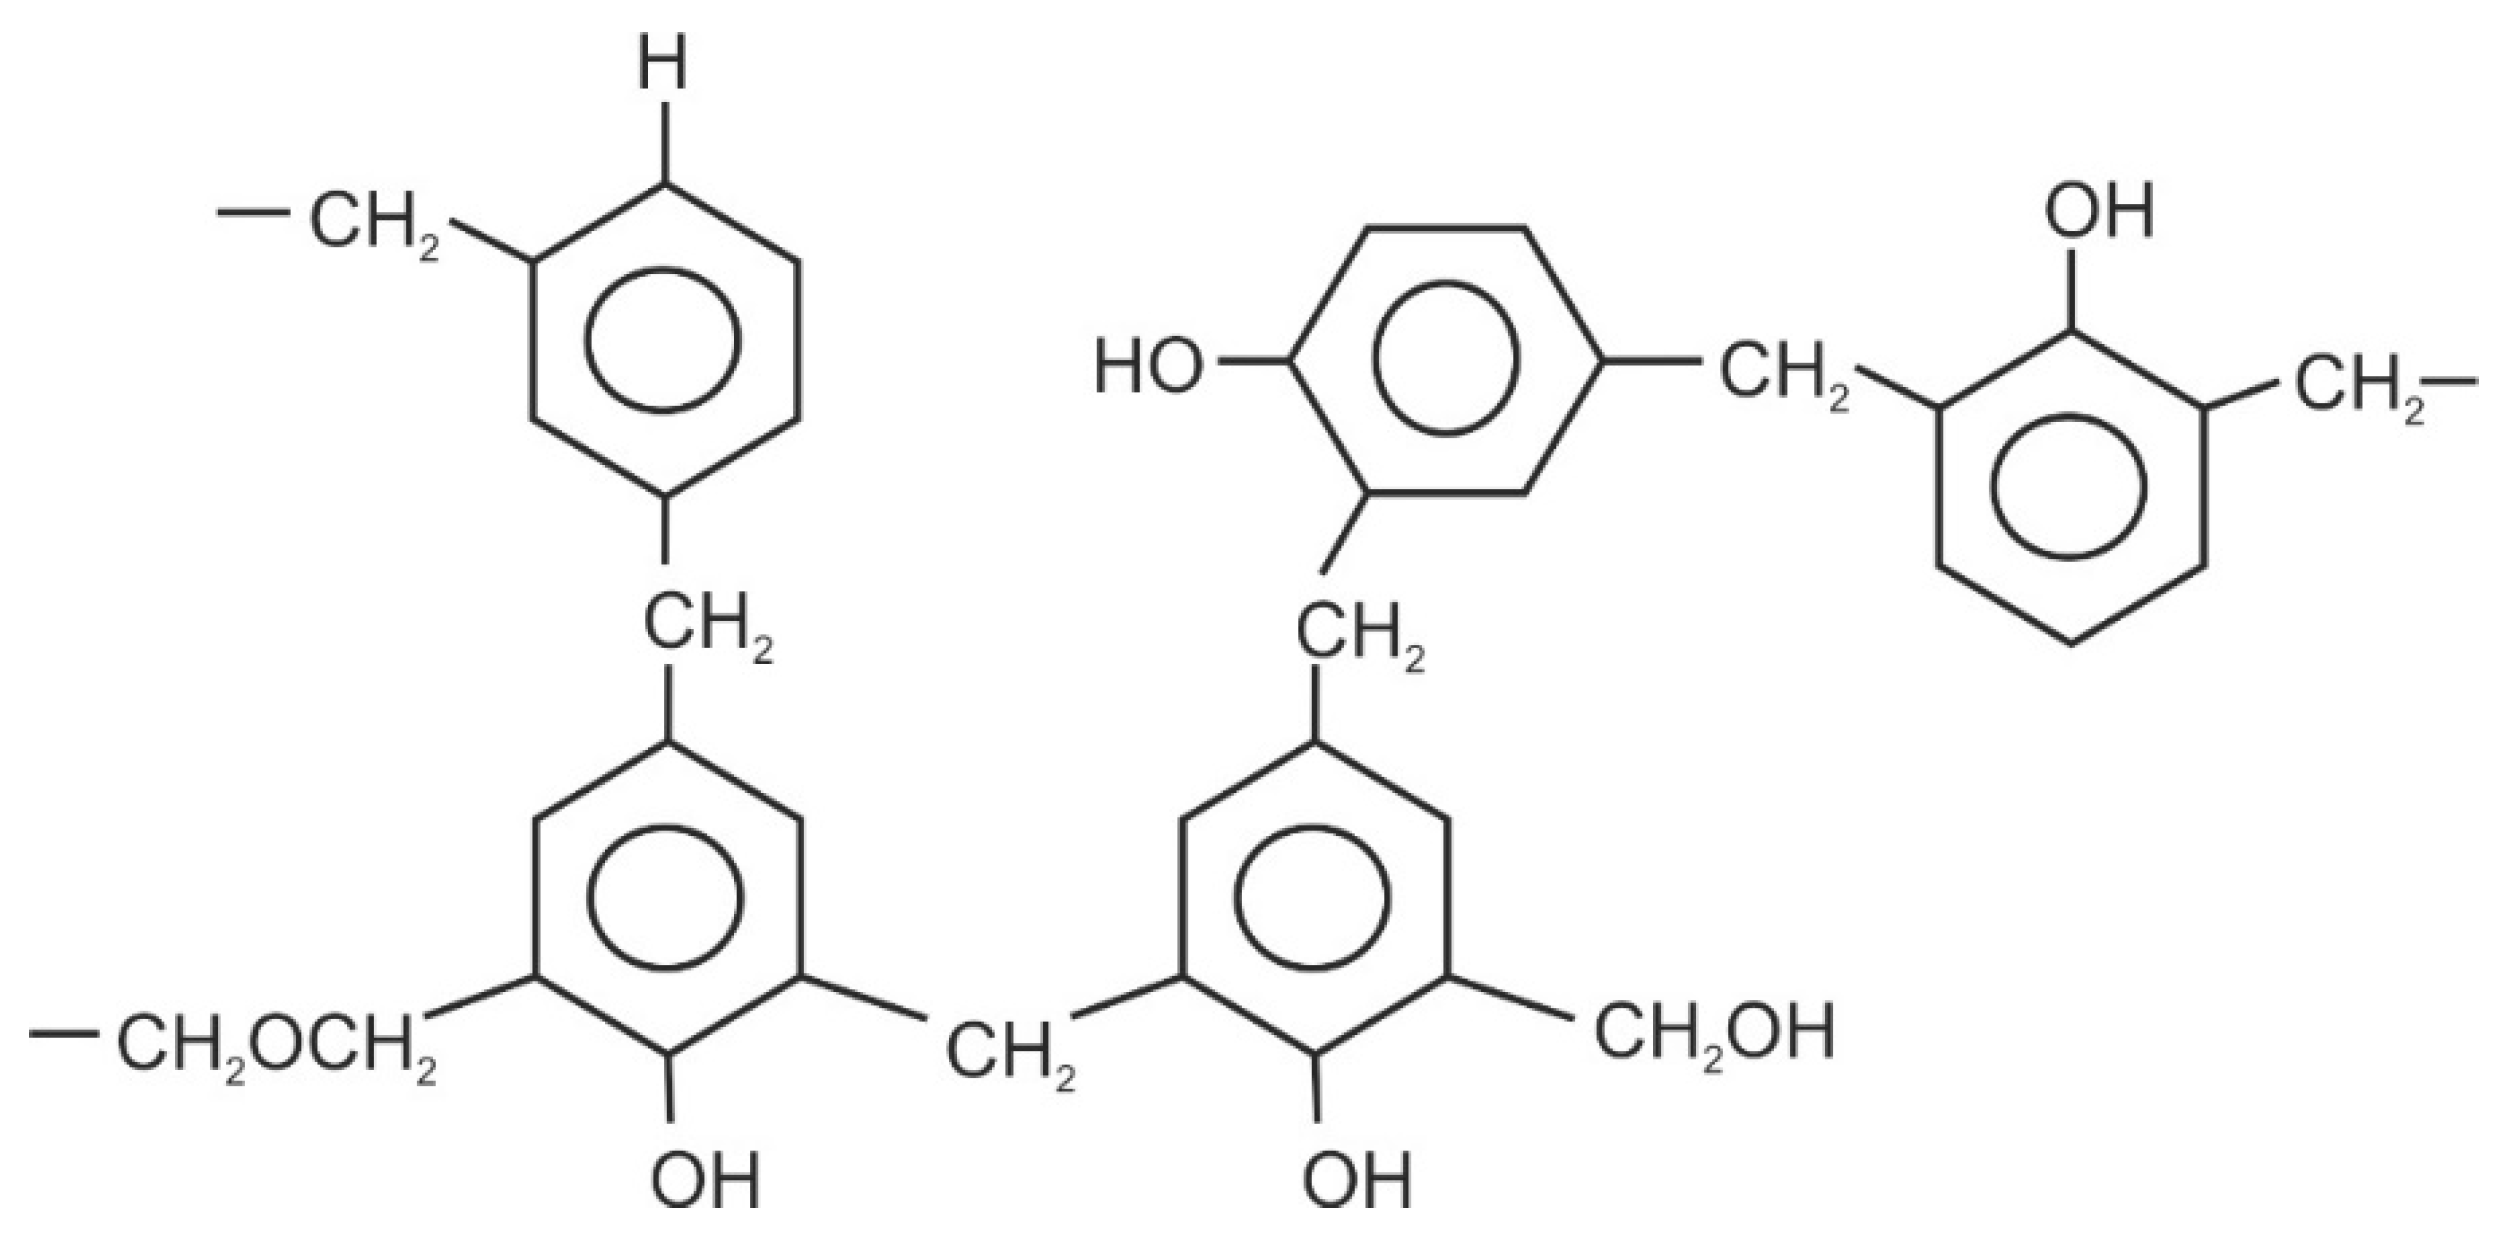
Figure 15 summarizes the chemical structures of selected flame-retardant fibers.
Figure 16 shows the chemical structure of a phenol-formaldehyde resin (novoloid) which is used for the production of flame-retardant Kynol fibers. The chlorine content of flame-retardant modacrylic fibers is obvious. For other flame-retardant fibers, the chemical structure clearly exhibits the aromatic structure, and with the exception of the Kynol resin fiber, also the content of nitrogen. For this reason, Kynol fibers are often promoted as flame-retardant fibers with less toxic smoke formation.
Further, selected properties of those fibers are compared in
Table 3. Especially mentioned here are the LOI values and the maximum temperature of usage T
max. Beside the here listed fire-retardant fibers, also other flame-retardant fibers should be mentioned, which are already presented and discussed in the previous sections of high-strength fibers and chemically stable fibers. Here especially PBO fibers with LOI of 56 to 68 and a T
max between 310 °C to 350 °C, PPS fibers with LOI of 40 and reported T
max in the range of 190 °C to 280 °C and PTFE fibers with LOI value > 90 have to be mentioned [
11,
47].
The EDS spectra of the flame-retardant materials meta-aramid and polyamideimide are compared in
Figure 17. The meta-aramid sample is taken from a non-woven filter material made from Nomex. For recording the EDS-spectrum of polyamideimde here a polymer bullet is used as sample, instead of a fiber material. The bullet material is chosen, because polyamideimide was only available in fiber mixtures, made it quite difficult to separate a single fiber material and identify it clearly. Polyamideimide based fibers are supplied under the brand name Kermel. Similar to Dyneema fibers standing synonymous for HPPE fibers, Kermel fibers as brand represent often polyamideimide fibers [
99]. Compared to other flame-retardant fibers, the LOI value of Kermel fibers is with around 32 only moderate. However, Kermel fibers are quite advantageous for application in flame-retardant clothes, because of non-melting, self-extinguishing and less smoke formation behavior.
The EDS-spectrum of meta-aramid exhibits signals related to the elements carbon, nitrogen and oxygen—as expected by its chemical composition. Meta-aramid and para-aramid show nearly similar EDS-spectra. Also, the EDS-spectrum of polyamideimide shows signals due to carbon, oxygen and nitrogen. However, the detected amount of nitrogen is smaller compared to the amount of oxygen, which is also expected from the chemical composition of the fiber material (compare
Figure 15 and
Table 2).
The EDS spectra of two different polyimide fiber materials are compared in
Figure 18. The first polyimide material is a pure fiber material from the producer Evonik supplied under the brand name P84. As second polyimide material, a non-woven filter material is presented. The EDS spectrum of P84 exhibits clear signals for carbon and oxygen. Due to the small content of nitrogen, the nitrogen related signal is very weak but even also nitrogen can be detected (compare the chemical structure in
Figure 15). It should be remarked that polyimide from the P84 fiber is not the only available polyimide. Also, other polyimide materials with other chemical structure are offered, e.g., Kapton [
100]. For the polyimide filter material, additionally the element fluorine is clearly determined with a concentration of around 2 at-%. This detection of fluorine is probable related to a fluoro-carbon finishing of the non-woven to introduce soil repellent properties to this filter product. This finishing treatment is done to improve cleaning procedures of the filter materials.
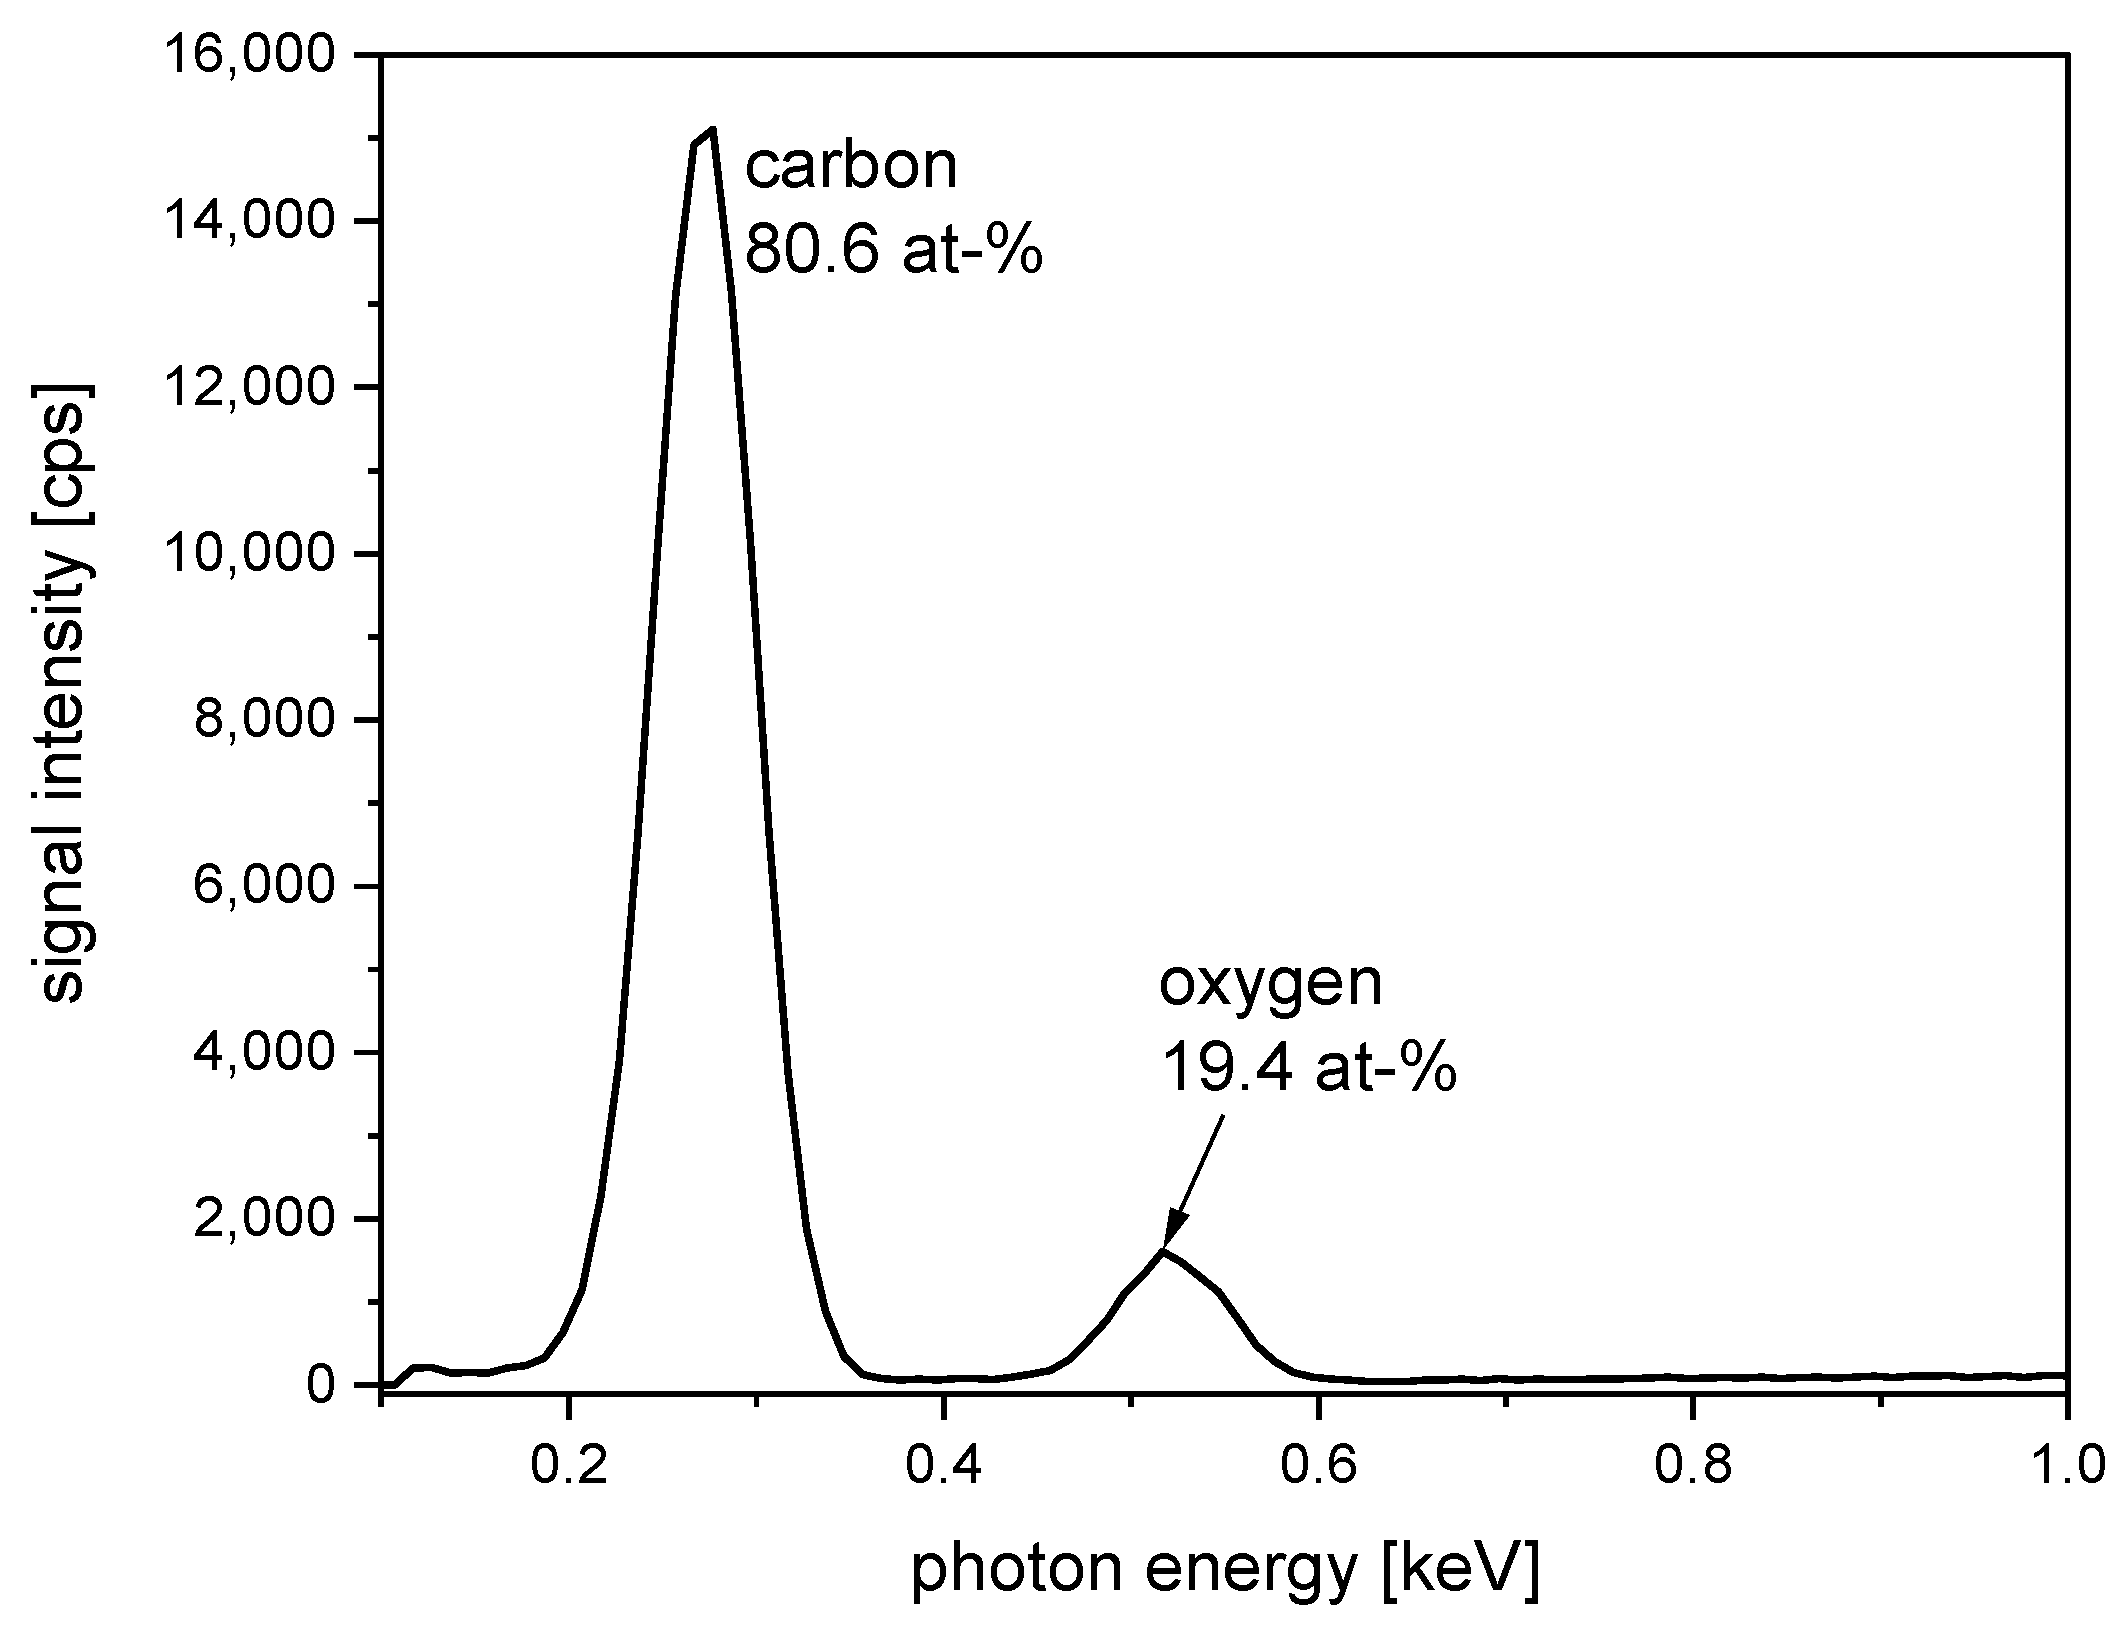
The EDS spectrum of a Kynol fiber material exhibits signals for the two elements carbon and oxygen (
Figure 19). A high carbon content of more than 80 at-% is determined, which is related to the aromatic content of this resin fiber. It has been reported that, by laser treatment, the Kynol fiber can be partly carbonized. Related EDS-spectra show a higher carbon content with an increasing intensity of applied laser treatment [
101].
Panox fibers—also called Preox fibers or preoxidized fibers—are partly pyrolyzed PAN fibers with flame-retardant properties [
102]. This is remarkable, because the original PAN fibers exhibit tremendous burning behavior [
103]. The flame-retardant concept of Panox fibers is different from other flame-retardant fibers. It could be stated that, via the pyrolysis process, the burning processes are performed and finished in a controlled manner. Afterwards, the remaining fiber—as result of pyrolysis—is no longer able to burn. Panox fibers are often also named as intermediate products for the production of carbon fibers from PAN precursor fibers. Meanwhile, Panox fibers are only partly carbonized by the pyrolysis of PAN. This pyrolysis process is done to complete carbonization, if carbon fibers are produced [
102]. Due to the similarity of production processes, companies producing carbon fiber are often also suppliers of Panox fibers.
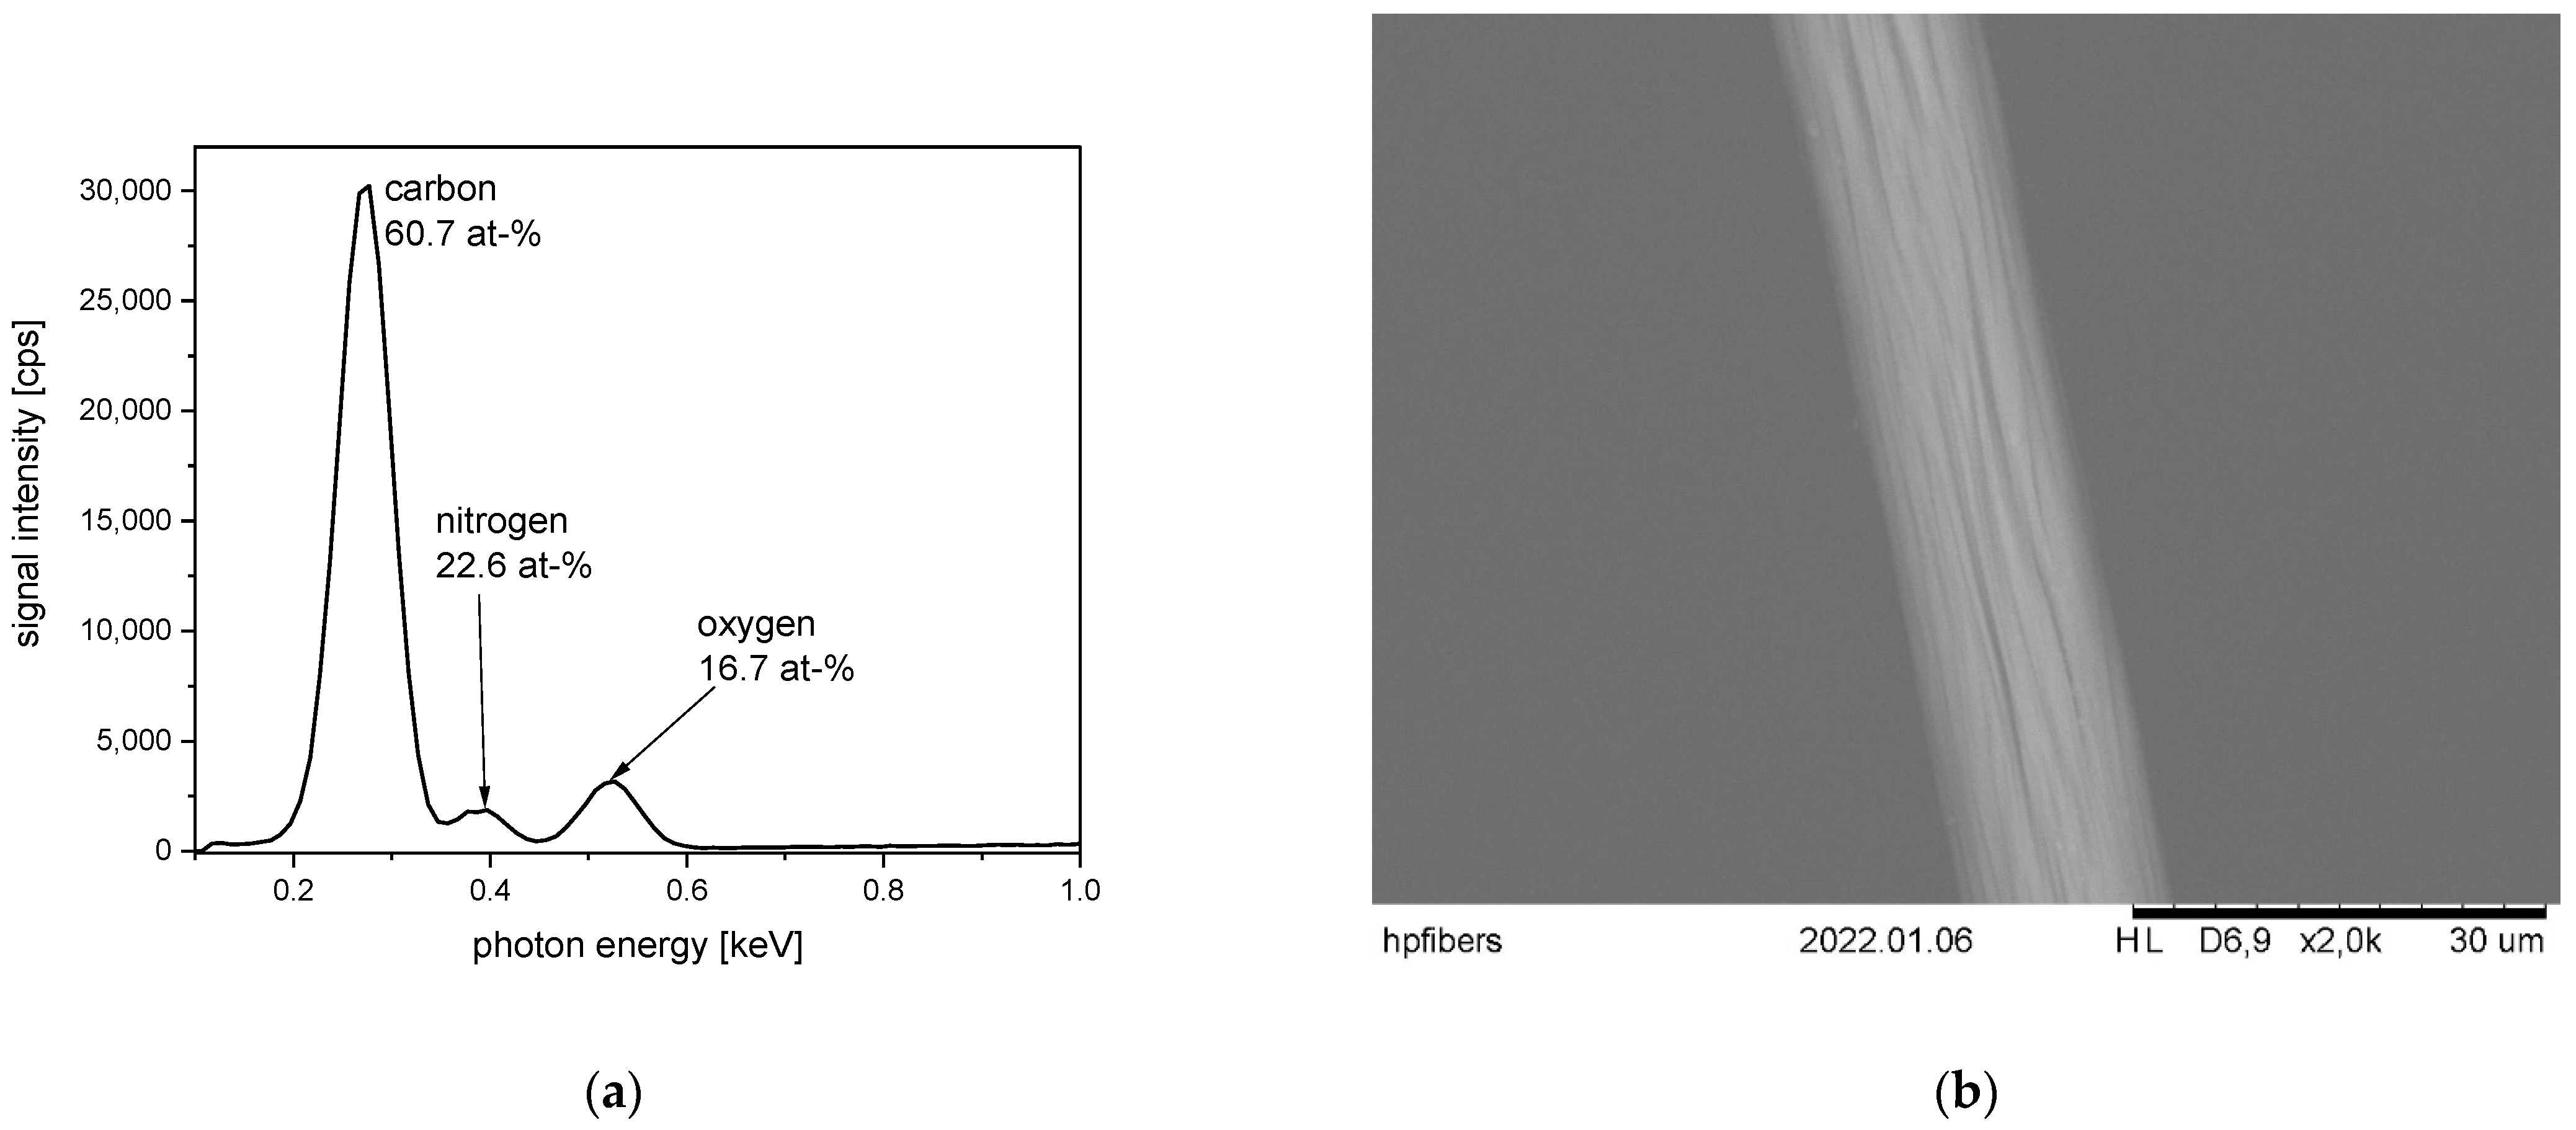
The EDS spectrum and SEM image of a Panox fiber are presented in
Figure 20. Looking at the EDS spectrum, the increased content of oxygen is visible—compared to the EDS spectrum of the PAN homopolymer (see
Figure 11 and compare to
Figure 20). Given this, it is clear that the Panox fiber is an oxidized PAN fiber, so with this background, the name Panox fits very well.
A flame-retardant fiber material with a high economic relevance—especially in the area of home textiles—is intrinsically flame-retardant polyester. Conventional PET fibers exhibit an LOI value of 21/22 and are therefore not as easy to ignite than, for example, cotton. In the case of flame-retardant polyester, this flame-retardant property is enhanced by the addition of phosphorous compounds to the fiber as part of a phosphorous-containing co-monomer [
104]. In the case of the flame contact, the phosphorous-containing part is decomposed and leads to the formation of a char layer, which is isolating the fiber surface from further oxidation processes.
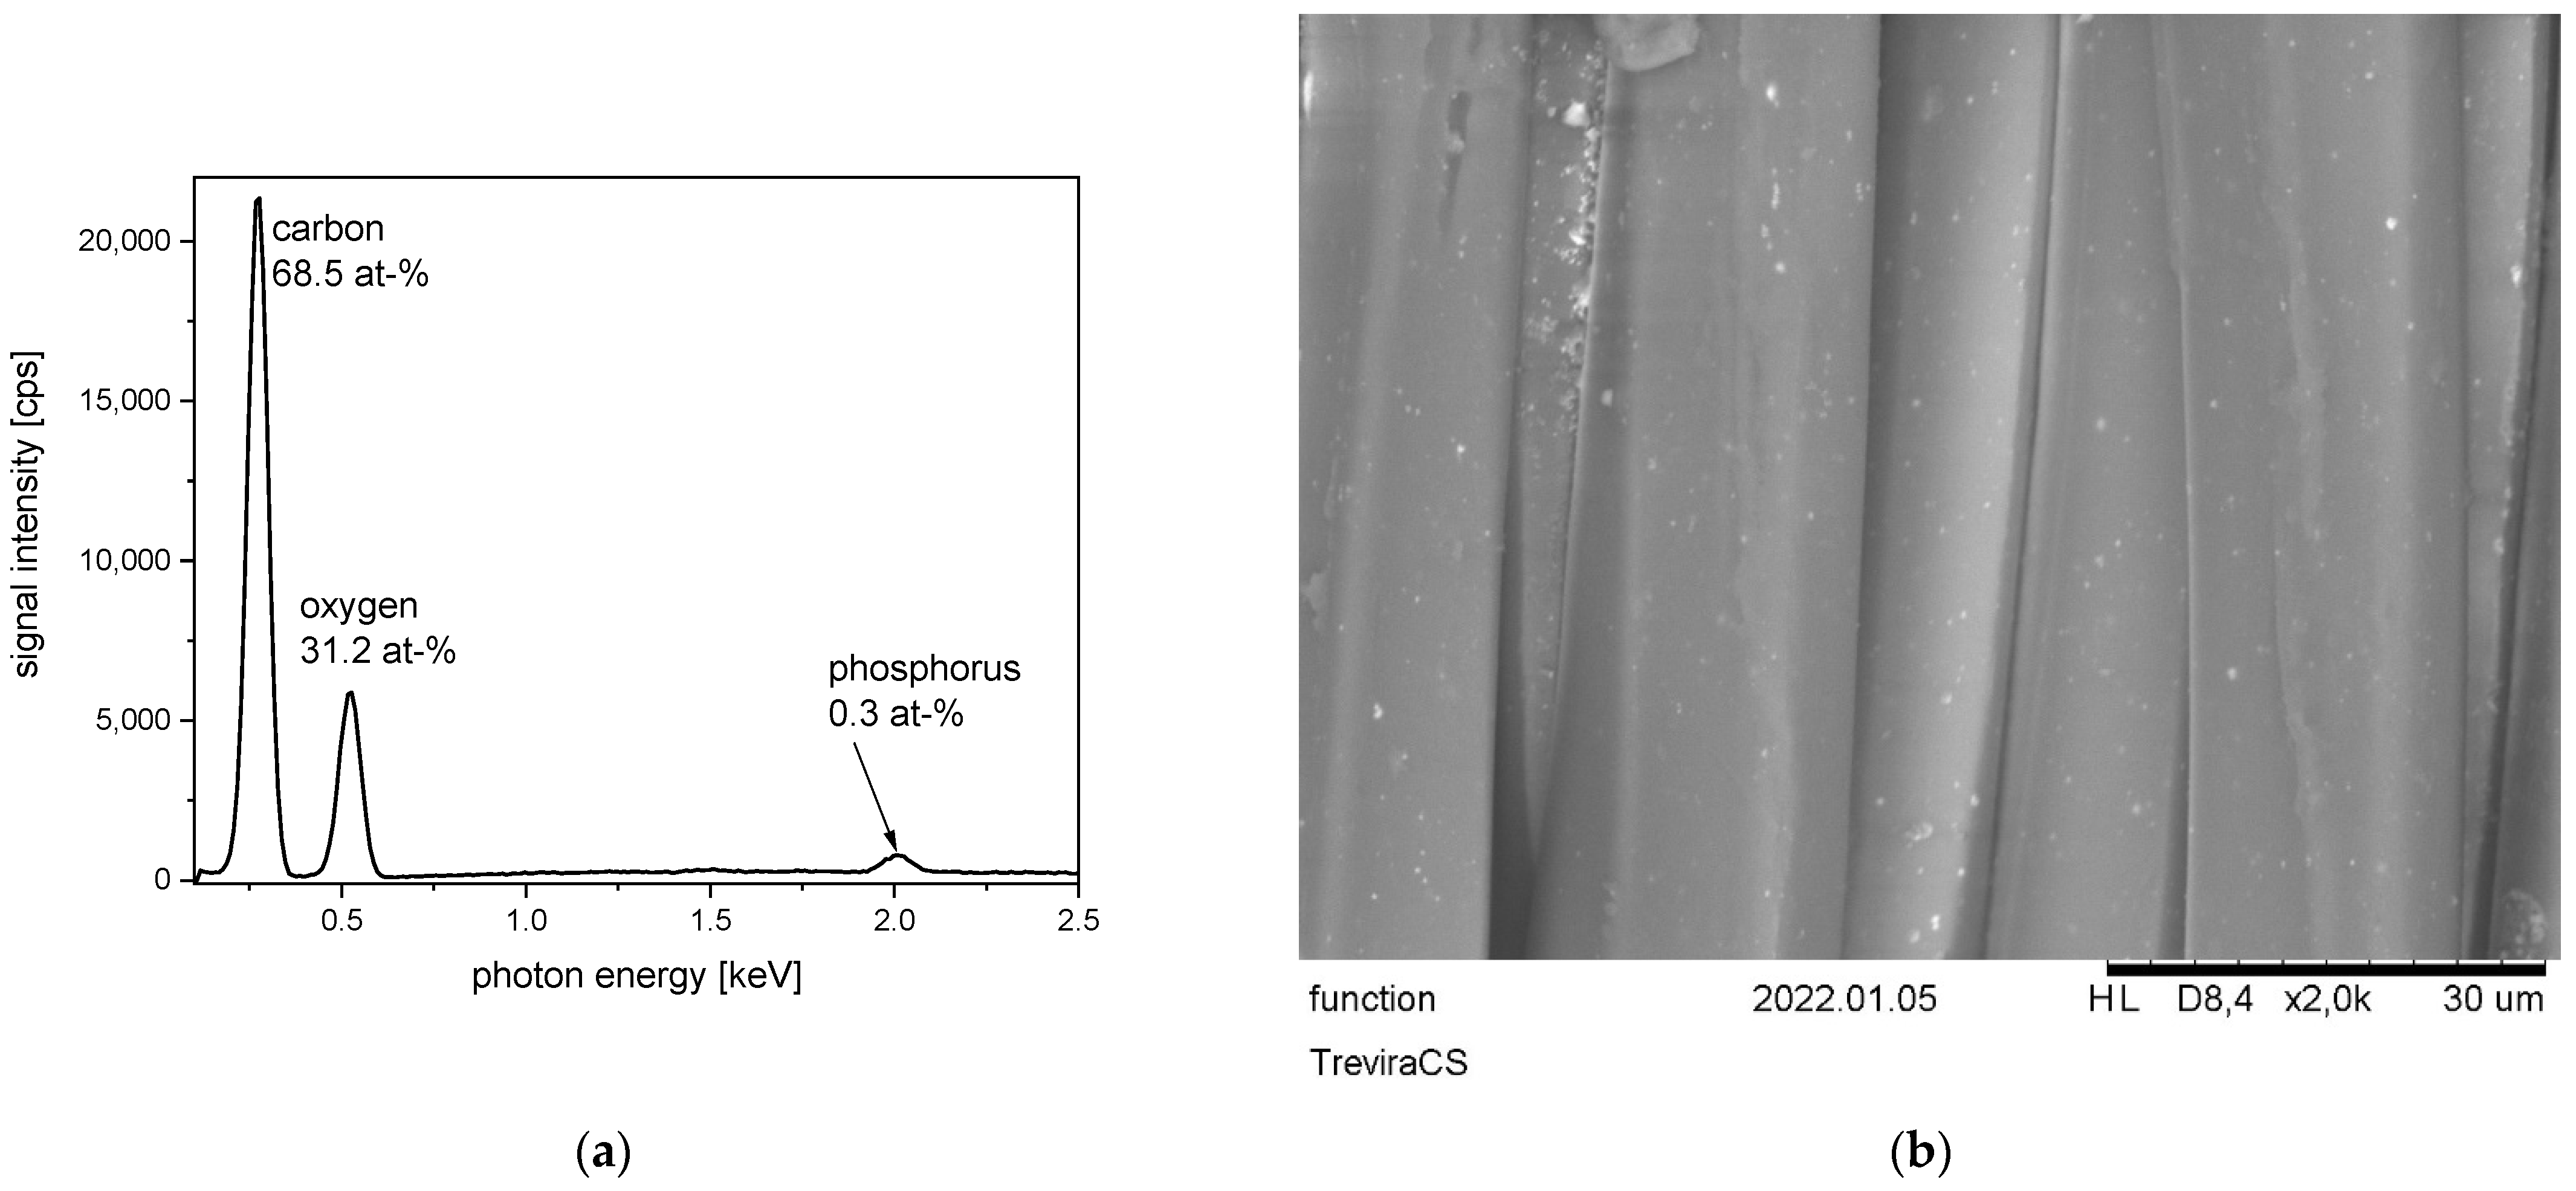
The related SEM image and EDS spectrum for such a functional flame-retardant polyester are presented in
Figure 21. This product is distributed under the brand name Trevira CS. By the EDS, the chemical elements carbon and oxygen—related to the PET structure—are clearly determined. Furthermore, phosphorous can be detected even if the concentration is, with 0.3 at-%, quite low. However, the sensitivity of the EDS method to detect phosphorous is significantly higher compared to the sensitivity for the lighter elements carbon or oxygen. On the SEM image, these functional PET fibers exhibit few white spots. These small and brighter areas are probably related to areas with higher concentrations of phosphorous on the fiber surface.
While polyester fibers are modified with phosphorous compounds to reach flame-retardant properties, regenerated cellulose fibers can be modified with silicon compounds for the same reason [
105,
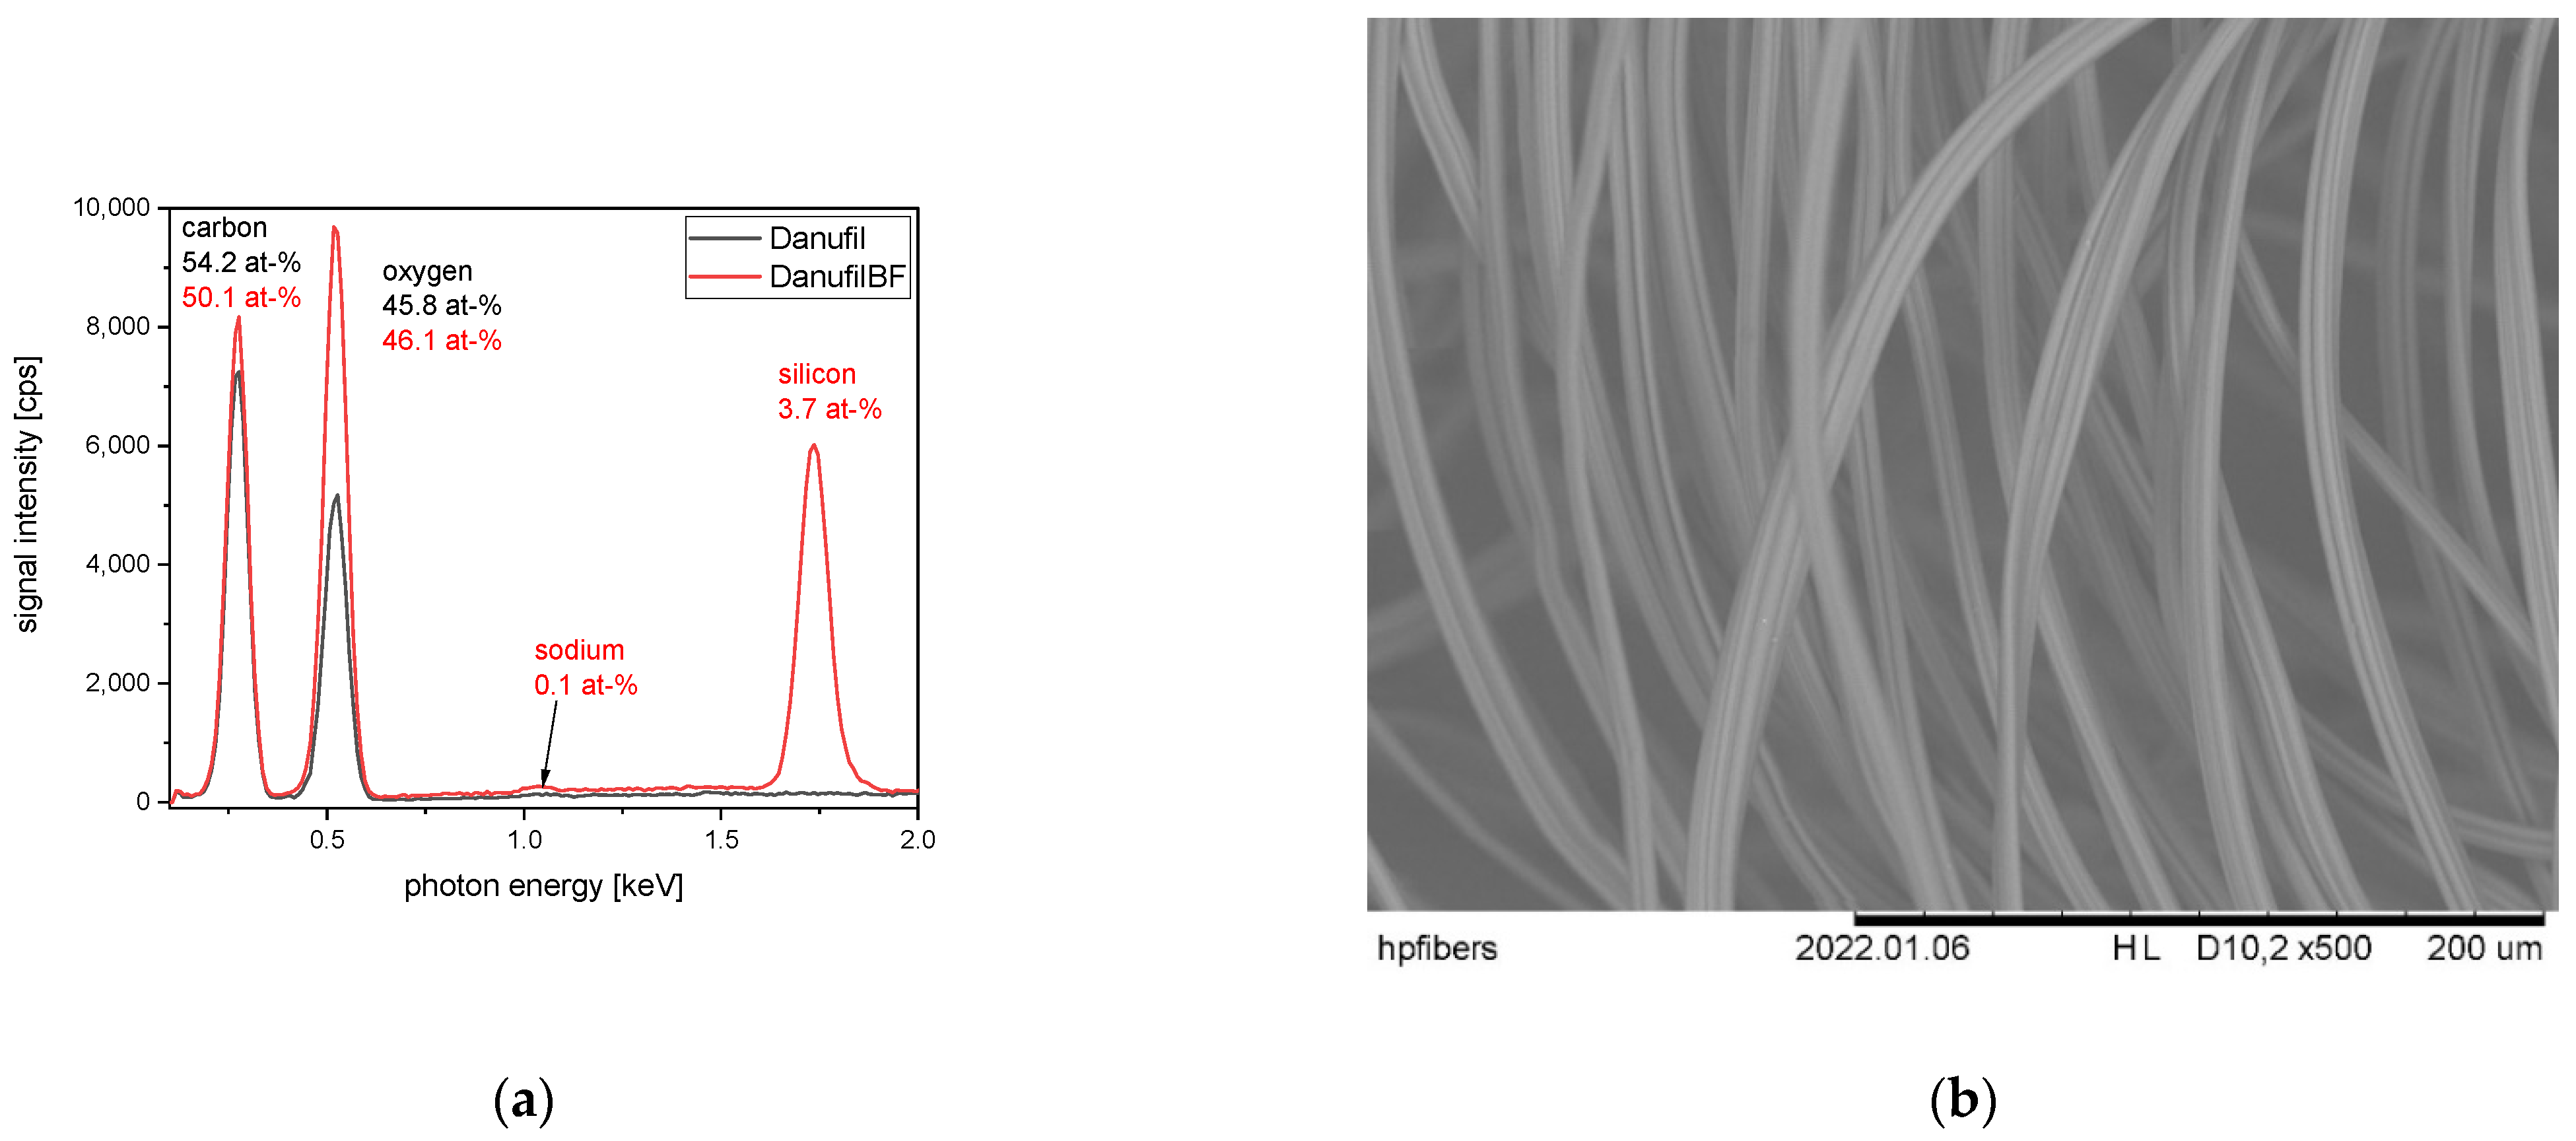
106]. One example of such a product is the fiber Danufil BF supplied by Kelheim Fibers. Compared to the analogous conventional cellulosic fiber from the same producer (type: Danufil), Danufil BF is modified by the addition of a silicon oxide-based component to the spinning mass. Due to the absence of other chemical elements, e.g., nitrogen or chlorine, such fibers are often promoted as flame-retardant fibers following a green concept [
107]. The EDS spectra of Danufil and Danufil BF are compared with each other in
Figure 22. The silicon content is clearly detected by this method. Additionally, a small amount of sodium is determined, which could be there as a residue from the fiber production process. The sodium could be, as counterion Na
+, part of the added silicon oxide compound.
Another example for a flame-retardant cellulose fiber is presented with the Arabon fibers in the
Figure 23 and
Figure 24. Looking at the EDS spectrum of these fibers, a high number of different chemical elements are identified (
Figure 23). It is clear that the silicon component is not the only flame-retardant additive. On the fiber surface, deposited particles are also detected by SEM (
Figure 23 and
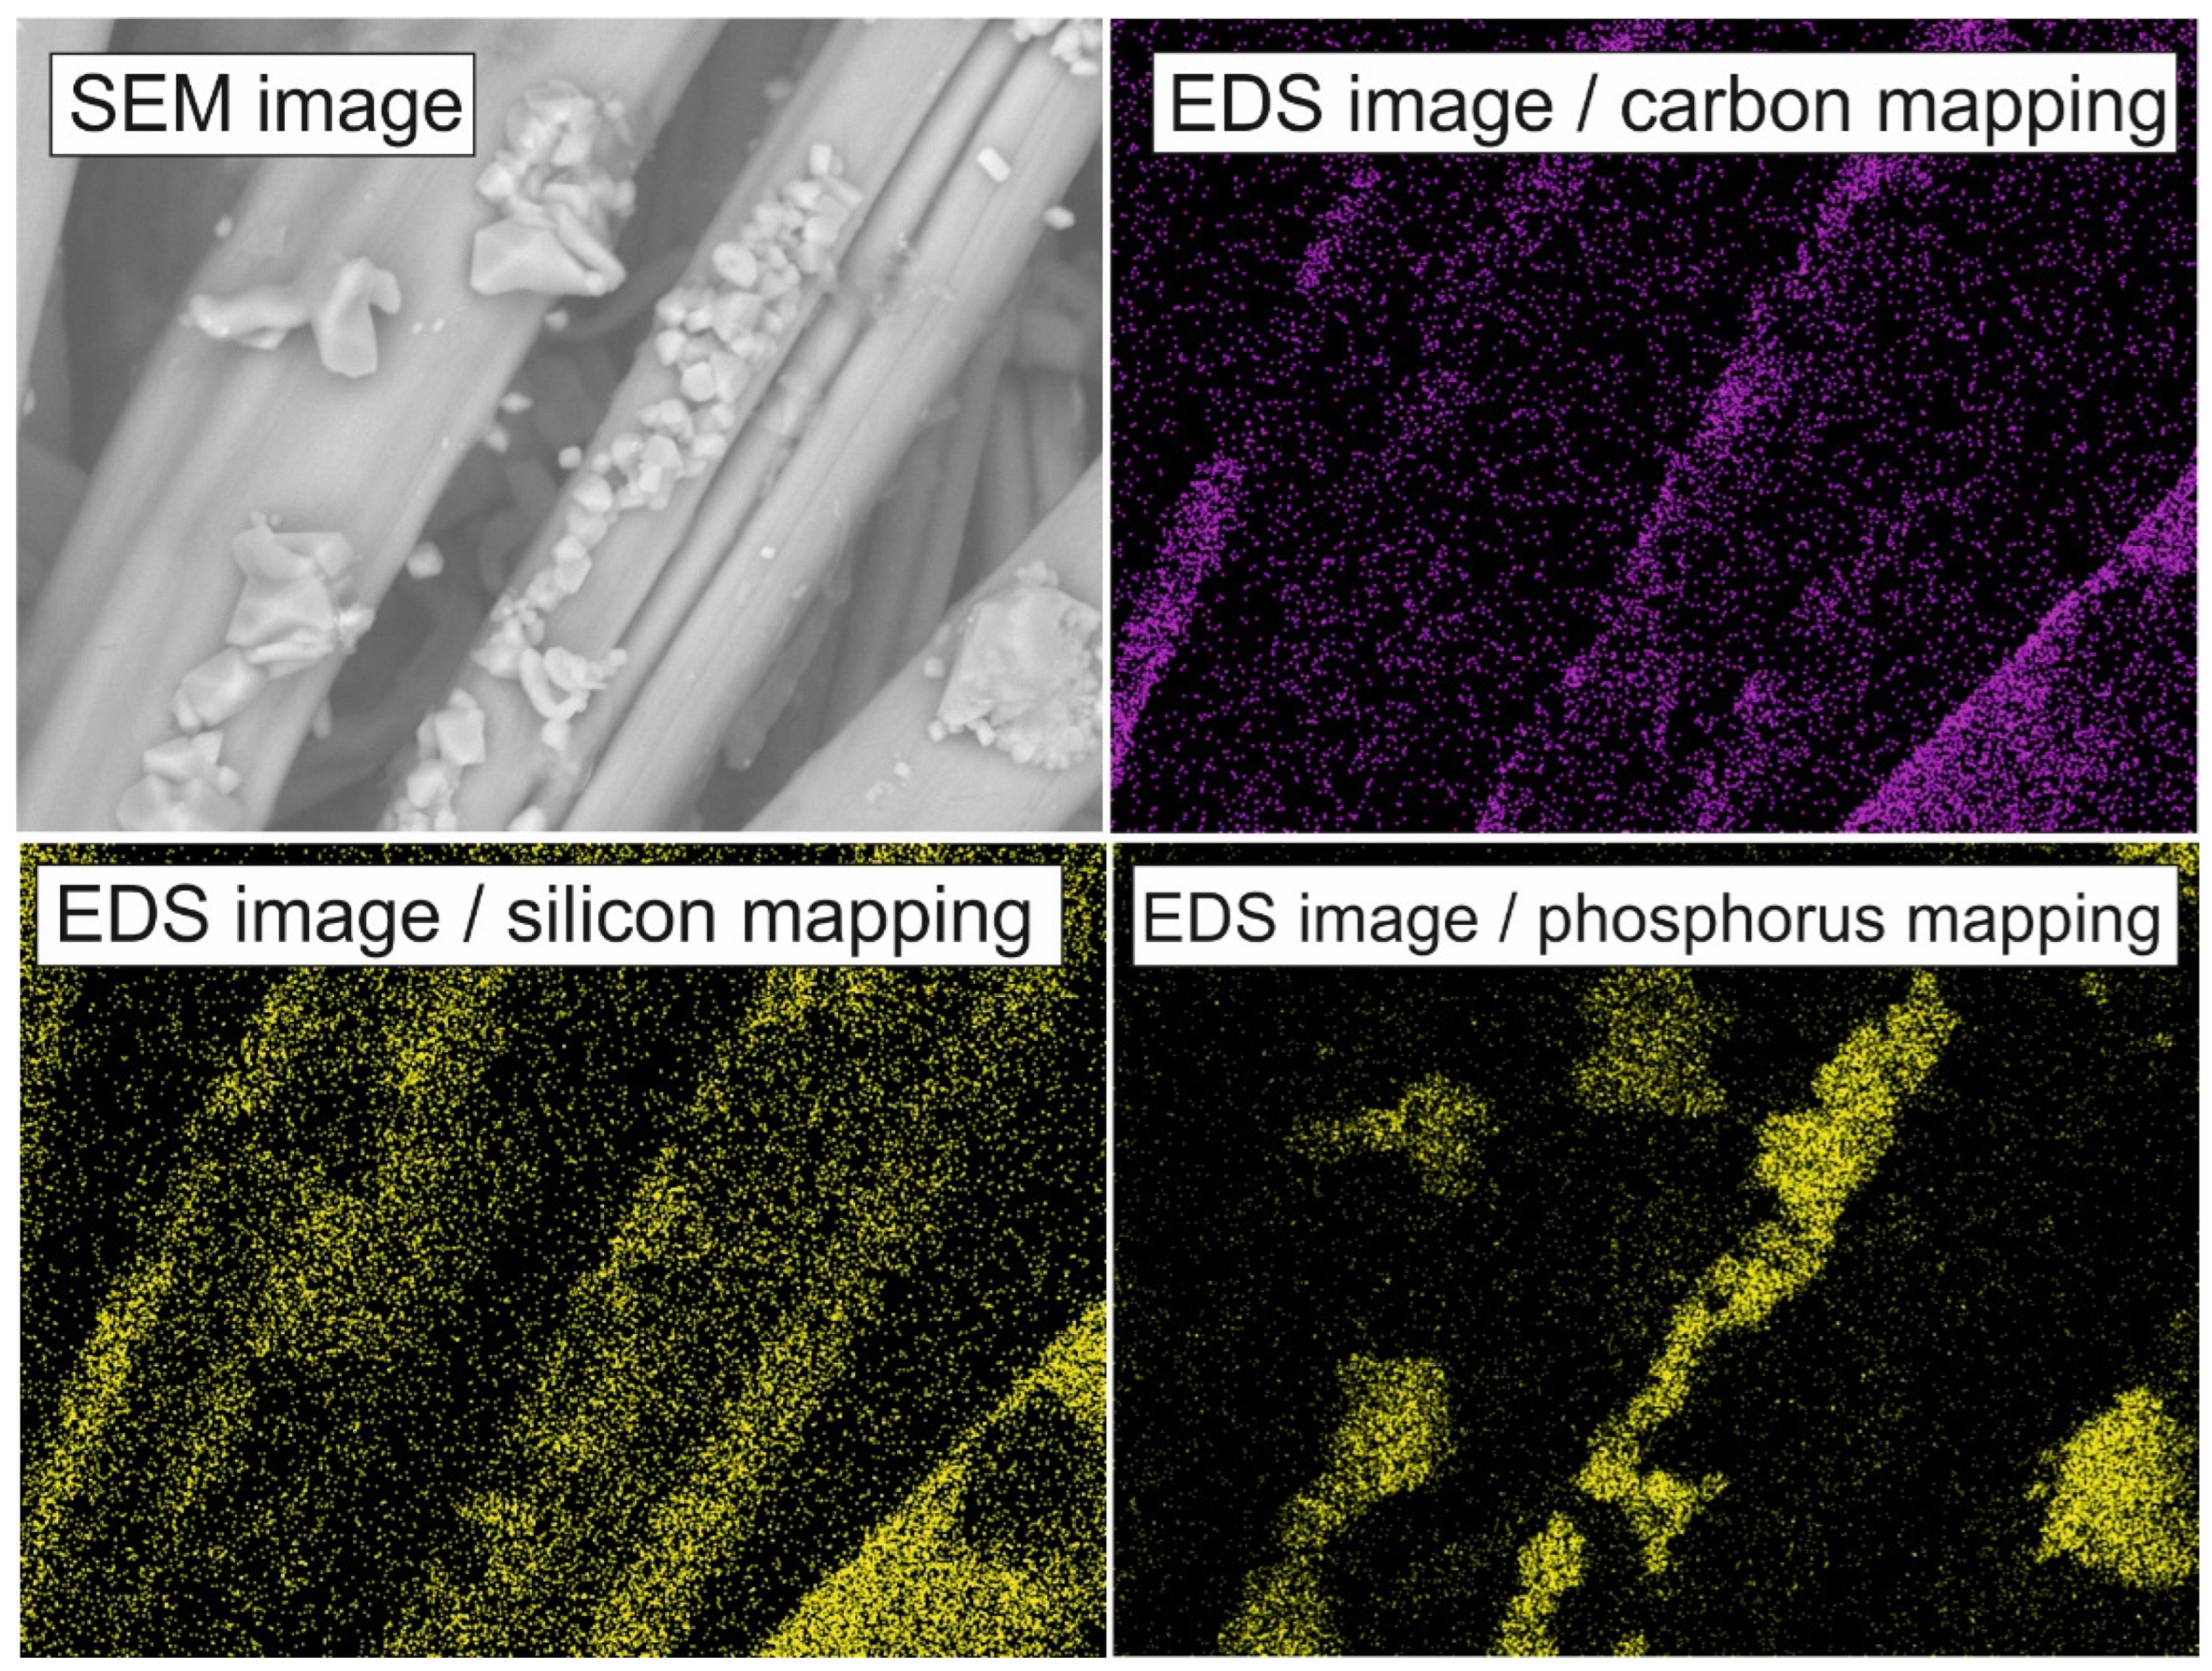
Figure 24). To analyze the composition of these particles and the fibers, EDS mapping is performed (
Figure 24). This EDS mapping enables the detection of a specific chemical element depending on its position on the sample surface. However, such a mapping is mainly limited to elements that have a significant signal intensity in the EDS spectrum. In
Figure 24, the SEM image is compared to the EDS mapping with the three chemical elements carbon, silicon, and phosphorous. It is clear that the elements carbon and silicon are detected at the same surface position related to the main body of the cellulosic fibers. Probably, here, similarly to Danufil BF, a silicon-containing fiber is present. In contrast, phosphorous is only detected in areas wherein the particles are placed on the fabric surface. For this, probable phosphorous-containing flame-retardant pigments are added to the flame-retardant cellulose—for the further improvement of flame-retardant properties.
Cotton as a natural fiber with an LOI value of 18 does not exhibit any flame-retardant property by itself. However, cotton is the most used natural fiber, and there is also a demand for flame-retardant cotton fabrics and clothes. For this reason, flame-retardant finishing agents are developed and applied on cotton, e.g., via the padding process [
108,
109]. The following two examples of cotton with flame-retardant finishes are presented and described with SEM and EDS.
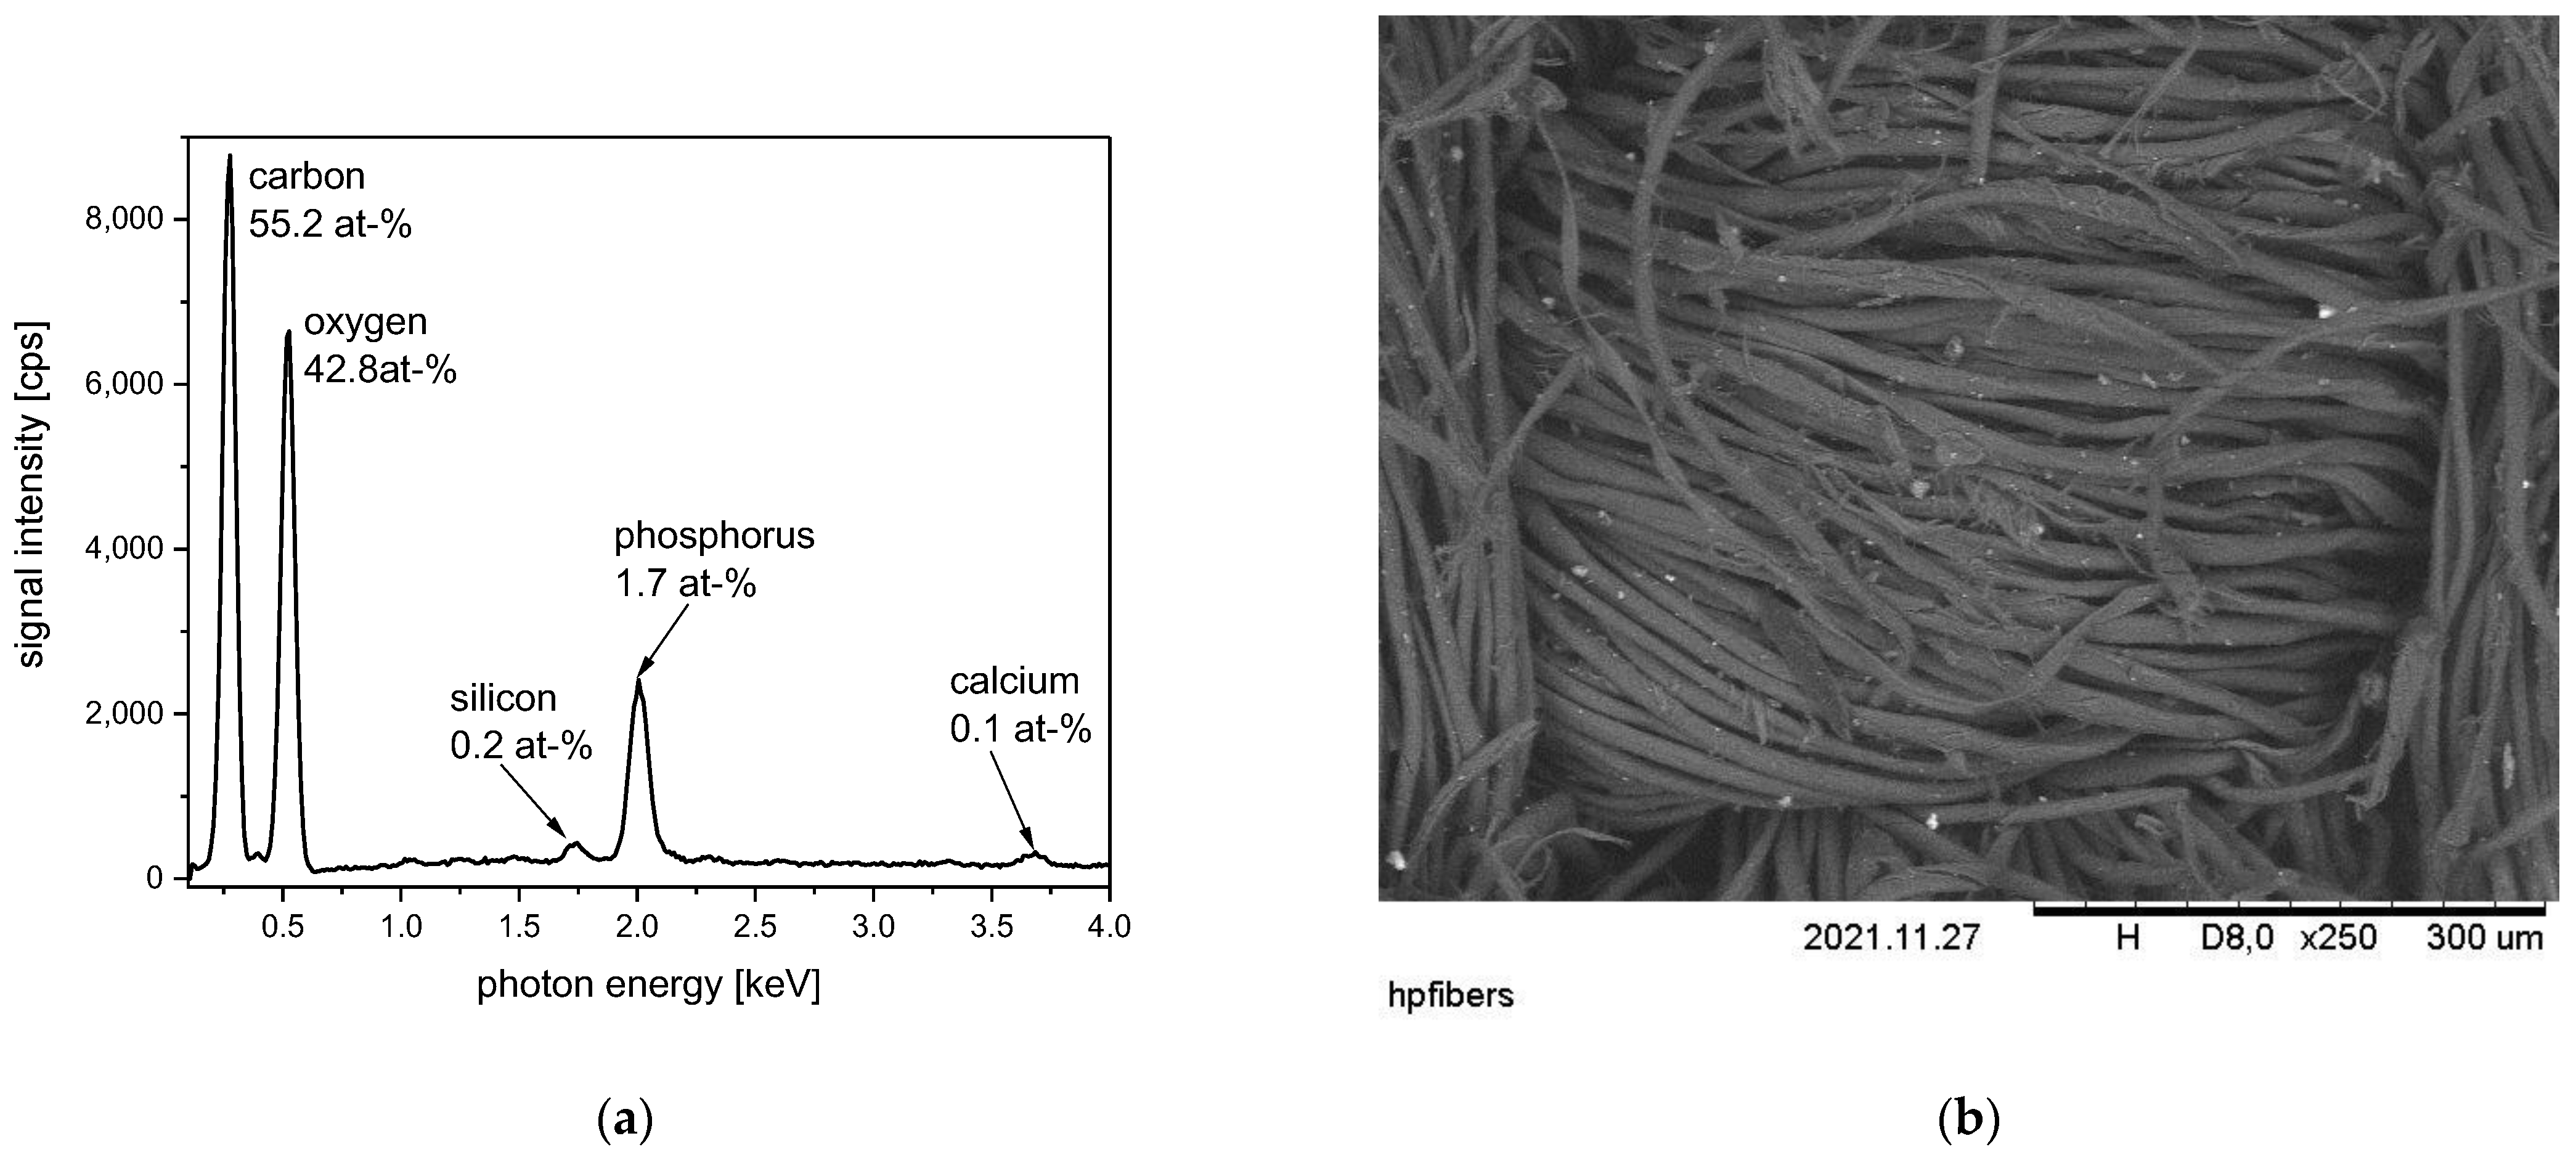
As an example of a commercially available flame-retardant textile, a cotton fabric with flame-retardant finishing is examined by SEM and EDS (
Figure 25). The SEM image clearly shows the structure of the cotton fibers. Additionally, small, deposited particles can be detected that are probably related to the applied flame-retardant finishing agents. The related EDS spectrum of this cotton sample supports the detection of five chemical elements (carbon, oxygen, phosphorous, silicon, and calcium). The highest ratio is clearly taken by carbon and oxygen, which are the elements building up the cotton fibers itself. Moreover, a flame-retardant finishing agent is supposed to contain carbon and oxygen in a certain amount. The determined phosphorous with a surface concentration of 1.7 at-% is clearly related to the application of a phosphorous-based flame-retardant agent. Often, such phosphorous-containing flame-retardant agents contain nitrogen as well [
109,
110,
111,
112]. However, due to the low sensitivity of the EDS method for nitrogen, this element cannot be detected here. Furthermore, small amounts of silicon and calcium are detected. These elements can be part of the flame-retardant agent but can also be residues from washing processes using silicate-containing washing agents.
For example, for a finishing agent applied in a padding process, the product Apyrol from CHT (Tübingen, Germany) is chosen and applied on cotton. The EDS spectrum and SEM image of a cotton fabric treated with the agent Apyrol are presented in
Figure 26. In addition to the chemical elements carbon and oxygen, phosphorous, sulfur and a small content of calcium are determined by EDS. Carbon and oxygen are related to the composition of the cotton fiber itself. The presence of phosphorous and sulfur is probably attributed to the applied flame-retardant agent. The presence of calcium in very small amounts is explained as a residue from the finishing process, where water is used as the main solvent.
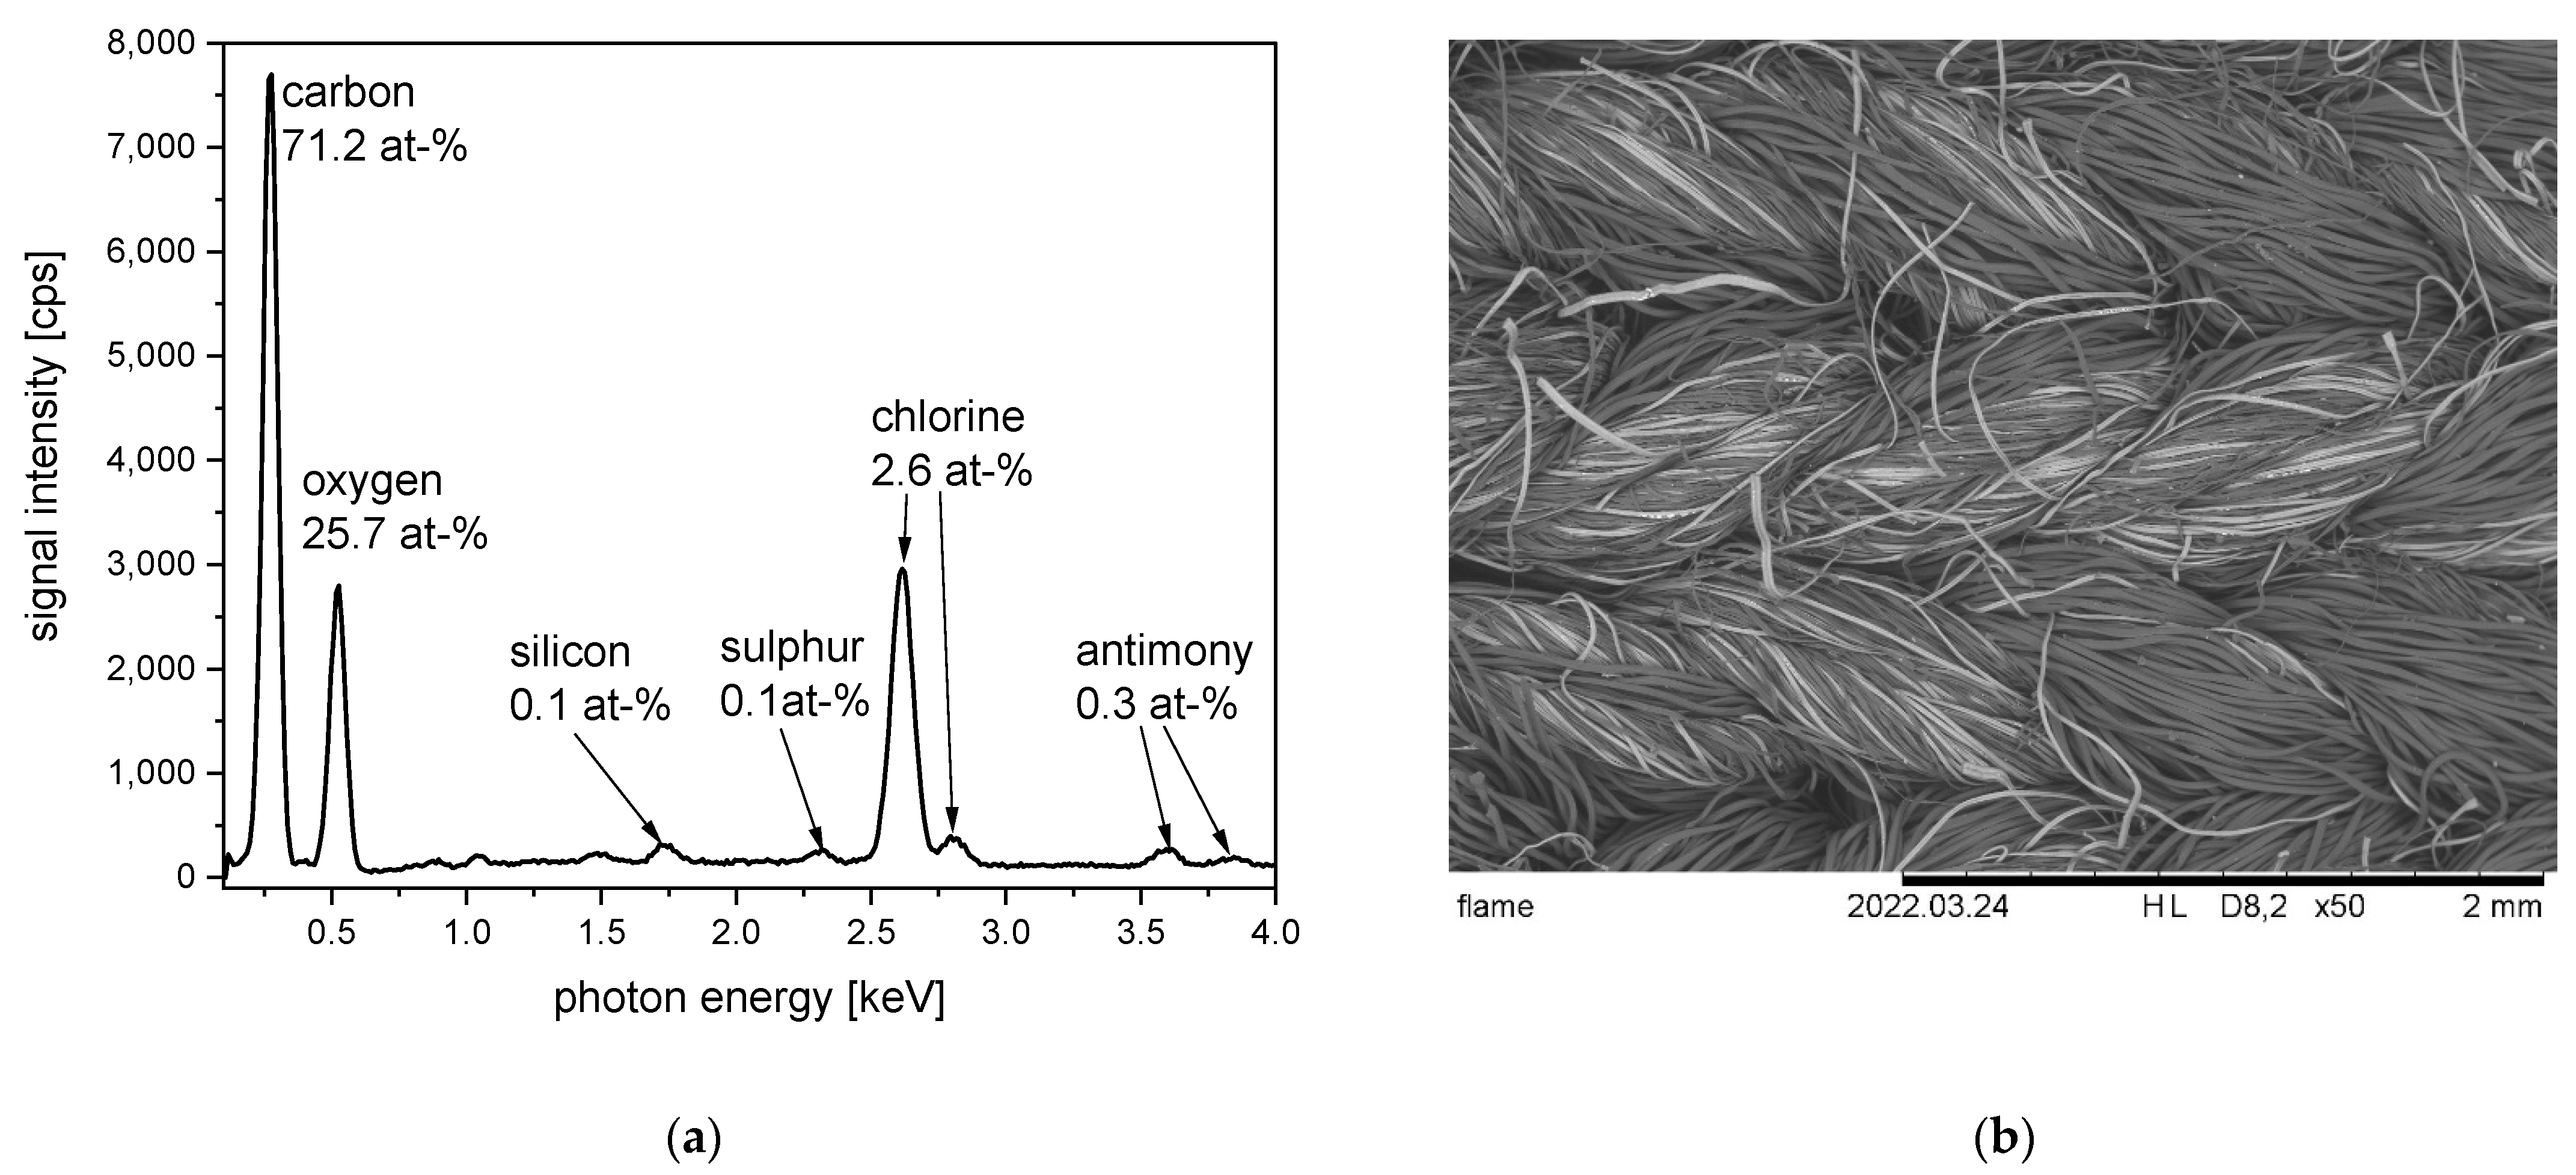
A flame-retardant textile belt supplied from Kübler Workwear is chosen as an example of a fire protective workwear offered for firefighters. According to the supplier information, this belt is made from different fibers—23% modacryl, 19% cotton, and 58% polyester. Due to the fact that conventional modacryl fibers are easy to ignite, it is obvious that the used modarylic fibers for this belt are chlorinated modacrylic fibers with fire-retardant properties similar to Kanecaron fibers [
113]. The EDS spectrum and SEM image of the belt recorded in low magnification are presented in
Figure 27. Additionally, when it comes to the chemical elements carbon and oxygen, chlorine is also determined by EDS with a content of 2.6 at-%. Even if the chlorine concentration is quite small, its EDS signal is even more significant compared to the EDS signal related to oxygen with a content of 25.7 at-%. The sensitivity of the EDS method for the detection of chlorine is significantly higher compared to the sensitivity of oxygen. The detection of chlorine is a clear hint of the presence of chlorinated modacrylic fibers, which can also be estimated by view of the related SEM image. On the SEM image, it is visible that the fabric is made from mixed yarns built up by different fibers. Several fibers exhibit a brighter contrast, which is a hint of the presence of a heavier chemical element such as chlorine. By EDS, small amounts of three further chemical elements are also determined on the flame-retardant belt—silicon, sulfur, and antimony. In particular, the presence of antimony is remarkable, because antimony oxide Sb
2O
5 is known for its use as a synergistic flame-retardant agent improving the properties of chlorinated and brominated flame-retardant agents [
112,
114,
115]. Probable components containing antimony trioxide are added to the fabric as finishing agents to improve the flame-retardant effect of the chlorinated modacrylic fibers. The presence of antimony on a textile material is, in any case, surprising, because antimony-containing substances are in discussion due to their possible hazardous effects [
115].
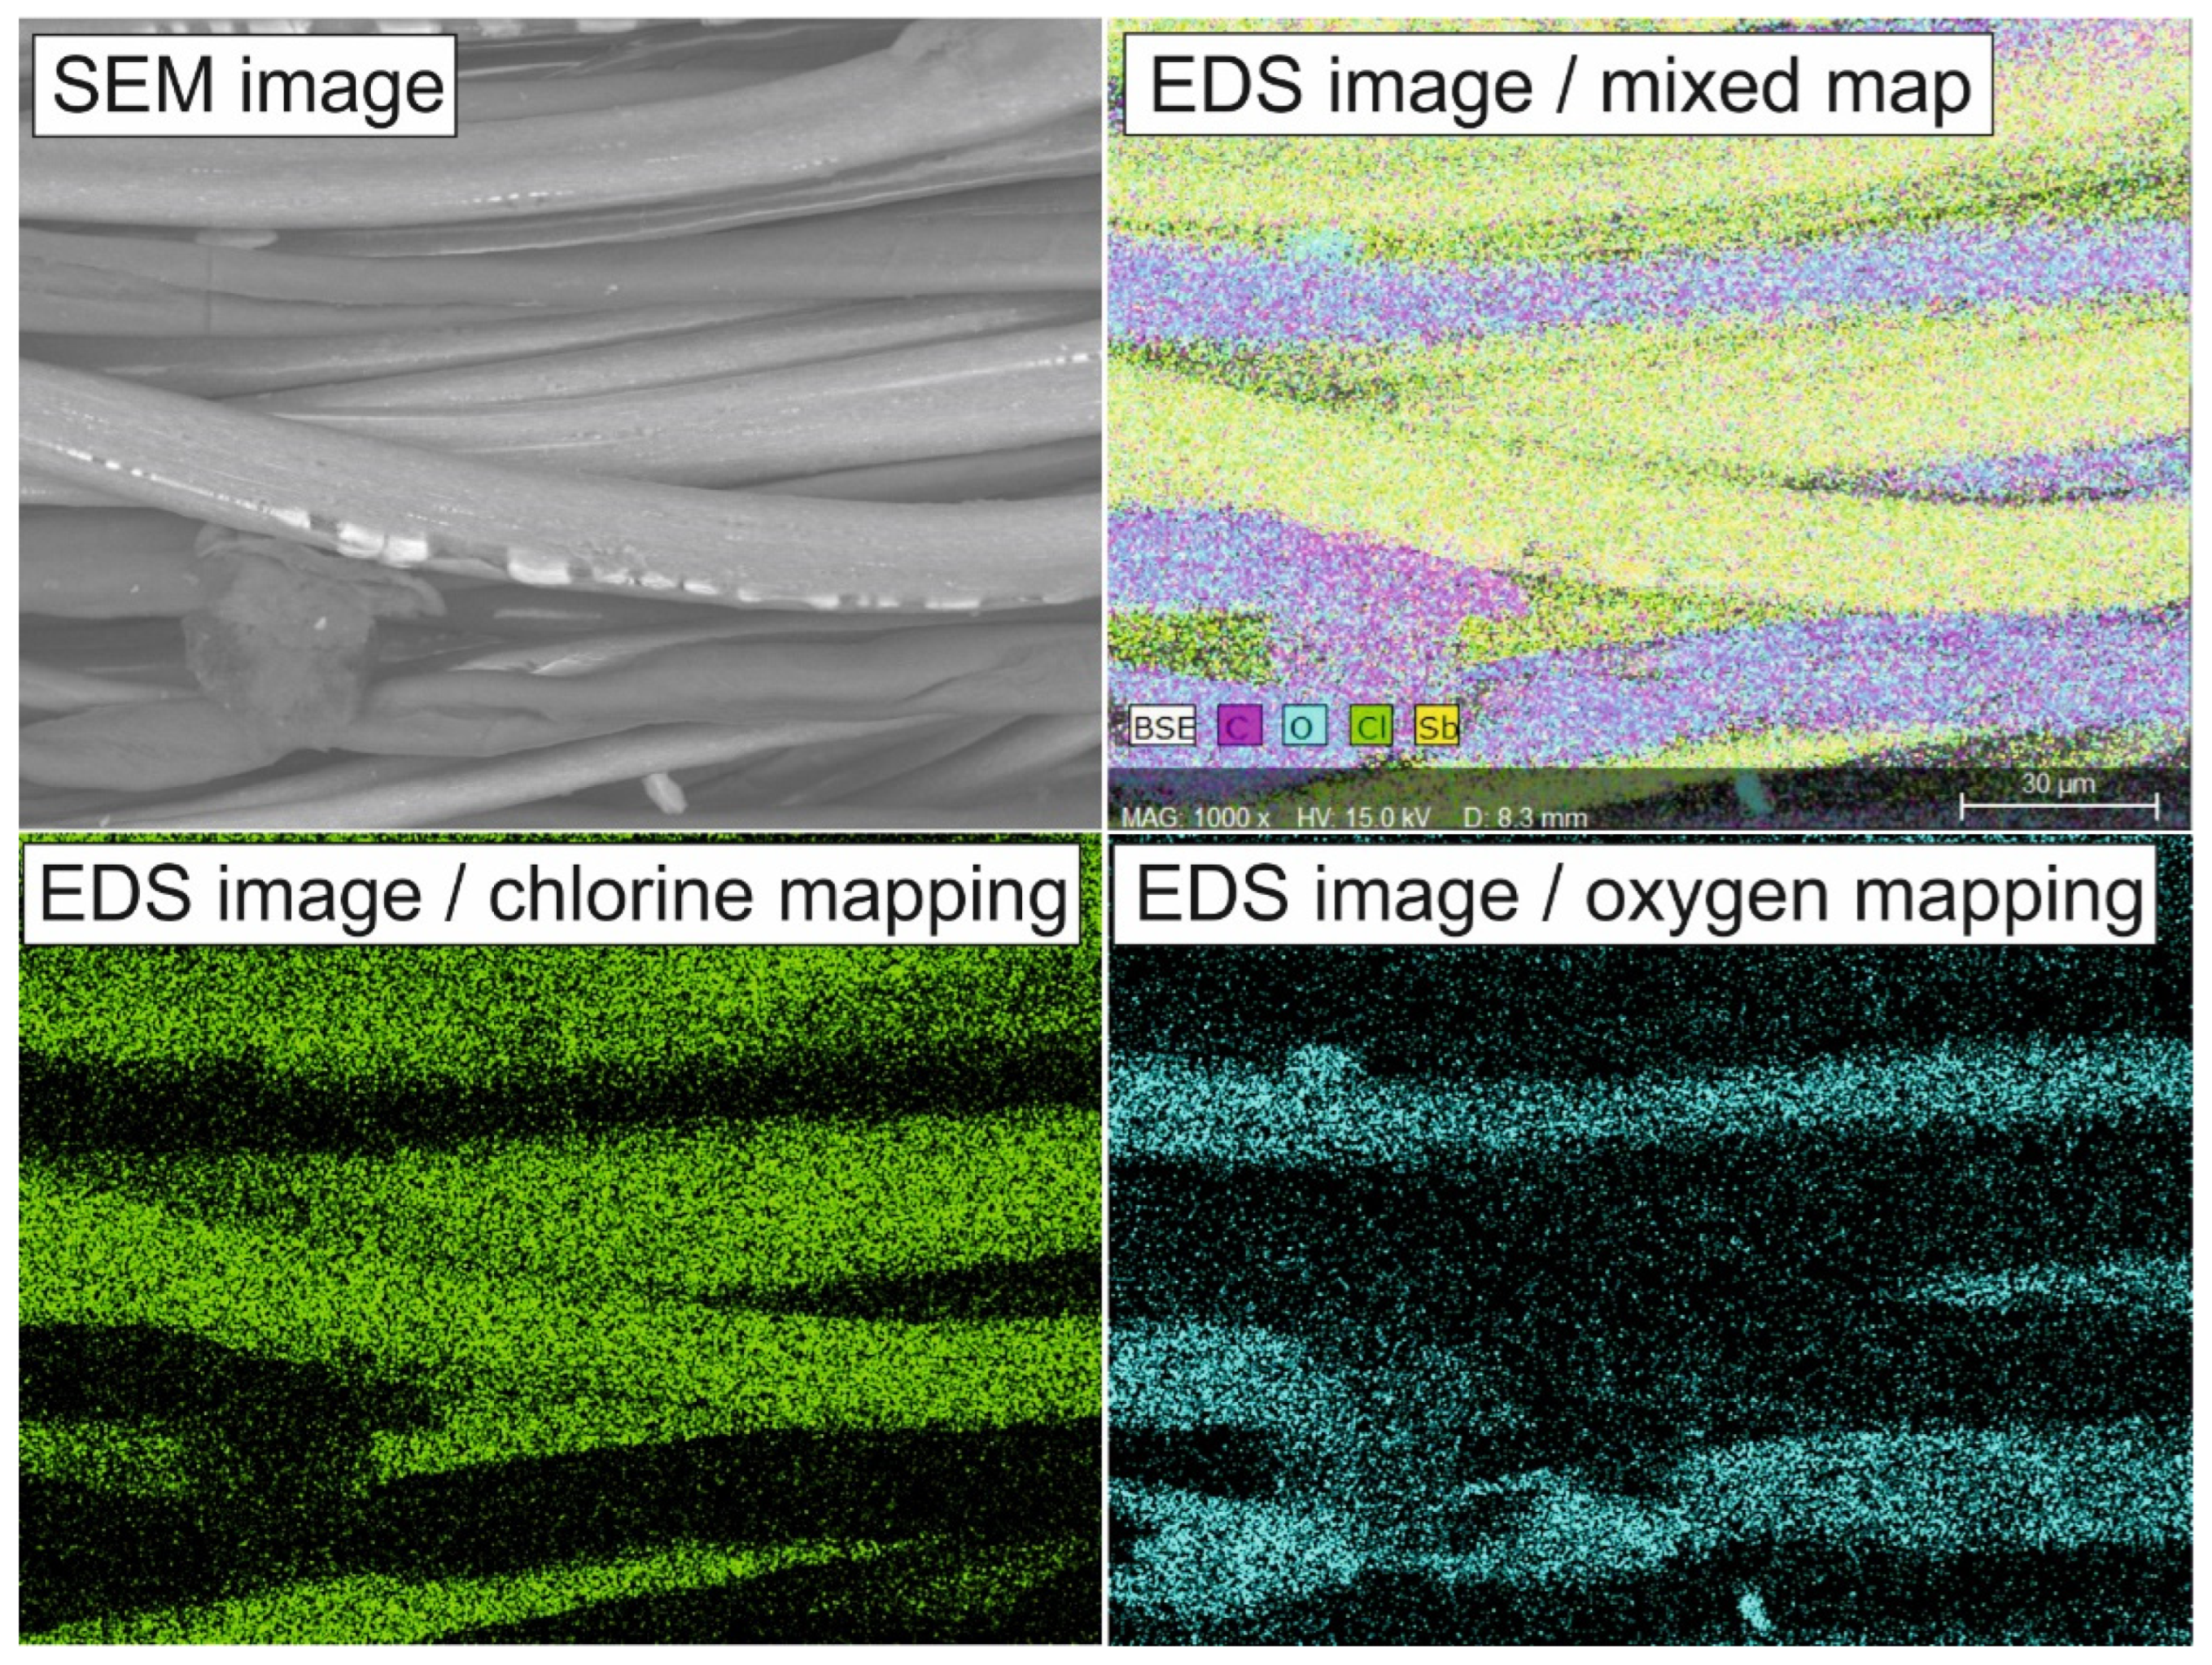
Figure 28 supports a more detailed view with an SEM image and EDS mappings recorded in higher magnifications. By EDS mapping, the chlorinated modacylic fibers can be clearly identified and distinguished from the oxygen-containing cotton and polyester fibers. Moreover, the deposition of antimony-containing areas is indicated.
7. Inorganic Fiber Materials
Inorganic fibers are all fibers made from inorganic materials, in contrast to synthetic organic fibers made from organic polymers [
116,
117]. The definition of the terms “inorganic” and “organic” is based on chemistry nomenclature. “Organic” compounds are based on carbon–hydrogen compounds and “inorganic” compounds do not contain carbon–hydrogen bonds. According to this definition, elemental carbon (in types of graphite and diamond), carbon dioxide, and carbon disulfide are also inorganic compounds [
118]. Following this scientific definition, carbon fibers are also counted as part of the group of inorganic fibers [
116,
117]. Other inorganic materials which often occur as fibers are based on glass, oxidic- and non-oxidic ceramics [
116,
119]. A special type of inorganic fibers are basalt fibers, which are prepared by spinning from a melt of natural volcanic rock [
120,
121,
122]. One main feature of inorganic fibers compared to organic fibers is their high-temperature stability, even in the presence of oxygen. For inorganic fibers, maximum temperatures of usage—T
max—over 1000 °C are possible [
116]. For this, they are often used in applications, where temperature resistance is demanded: these are heat-resistant, flame-resistant, but also cut-resistant clothes. Other applications are found in fiber-reinforced materials, where = extraordinary product design can also be realized [
123].
7.1. Glass Fibers and Basalt Fibers
Glass fibers are produced by spinning from molten glass and are usually amorphous [
124,
125]. The main components building up glass fibers are silica SiO
2 and alumina Al
2O
3. Furthermore, other components occur, such as Na
2O, CaO, or MgO [
125,
126]. Glass fibers with a special stability against alkaline treatment also contain zirconia in the form of ZrO
2 [
127]. Ceramic fibers can also be made from silica and alumina—as so-called oxidic ceramics. Here, one main difference to glass fibers is the crystallinity of ceramic fibers. Other ceramic fibers based on silicon carbide SiC (distributed under the brand name Nicalon) are named non-oxidic ceramic, because of the lack of oxygen in the fiber [
128,
129].
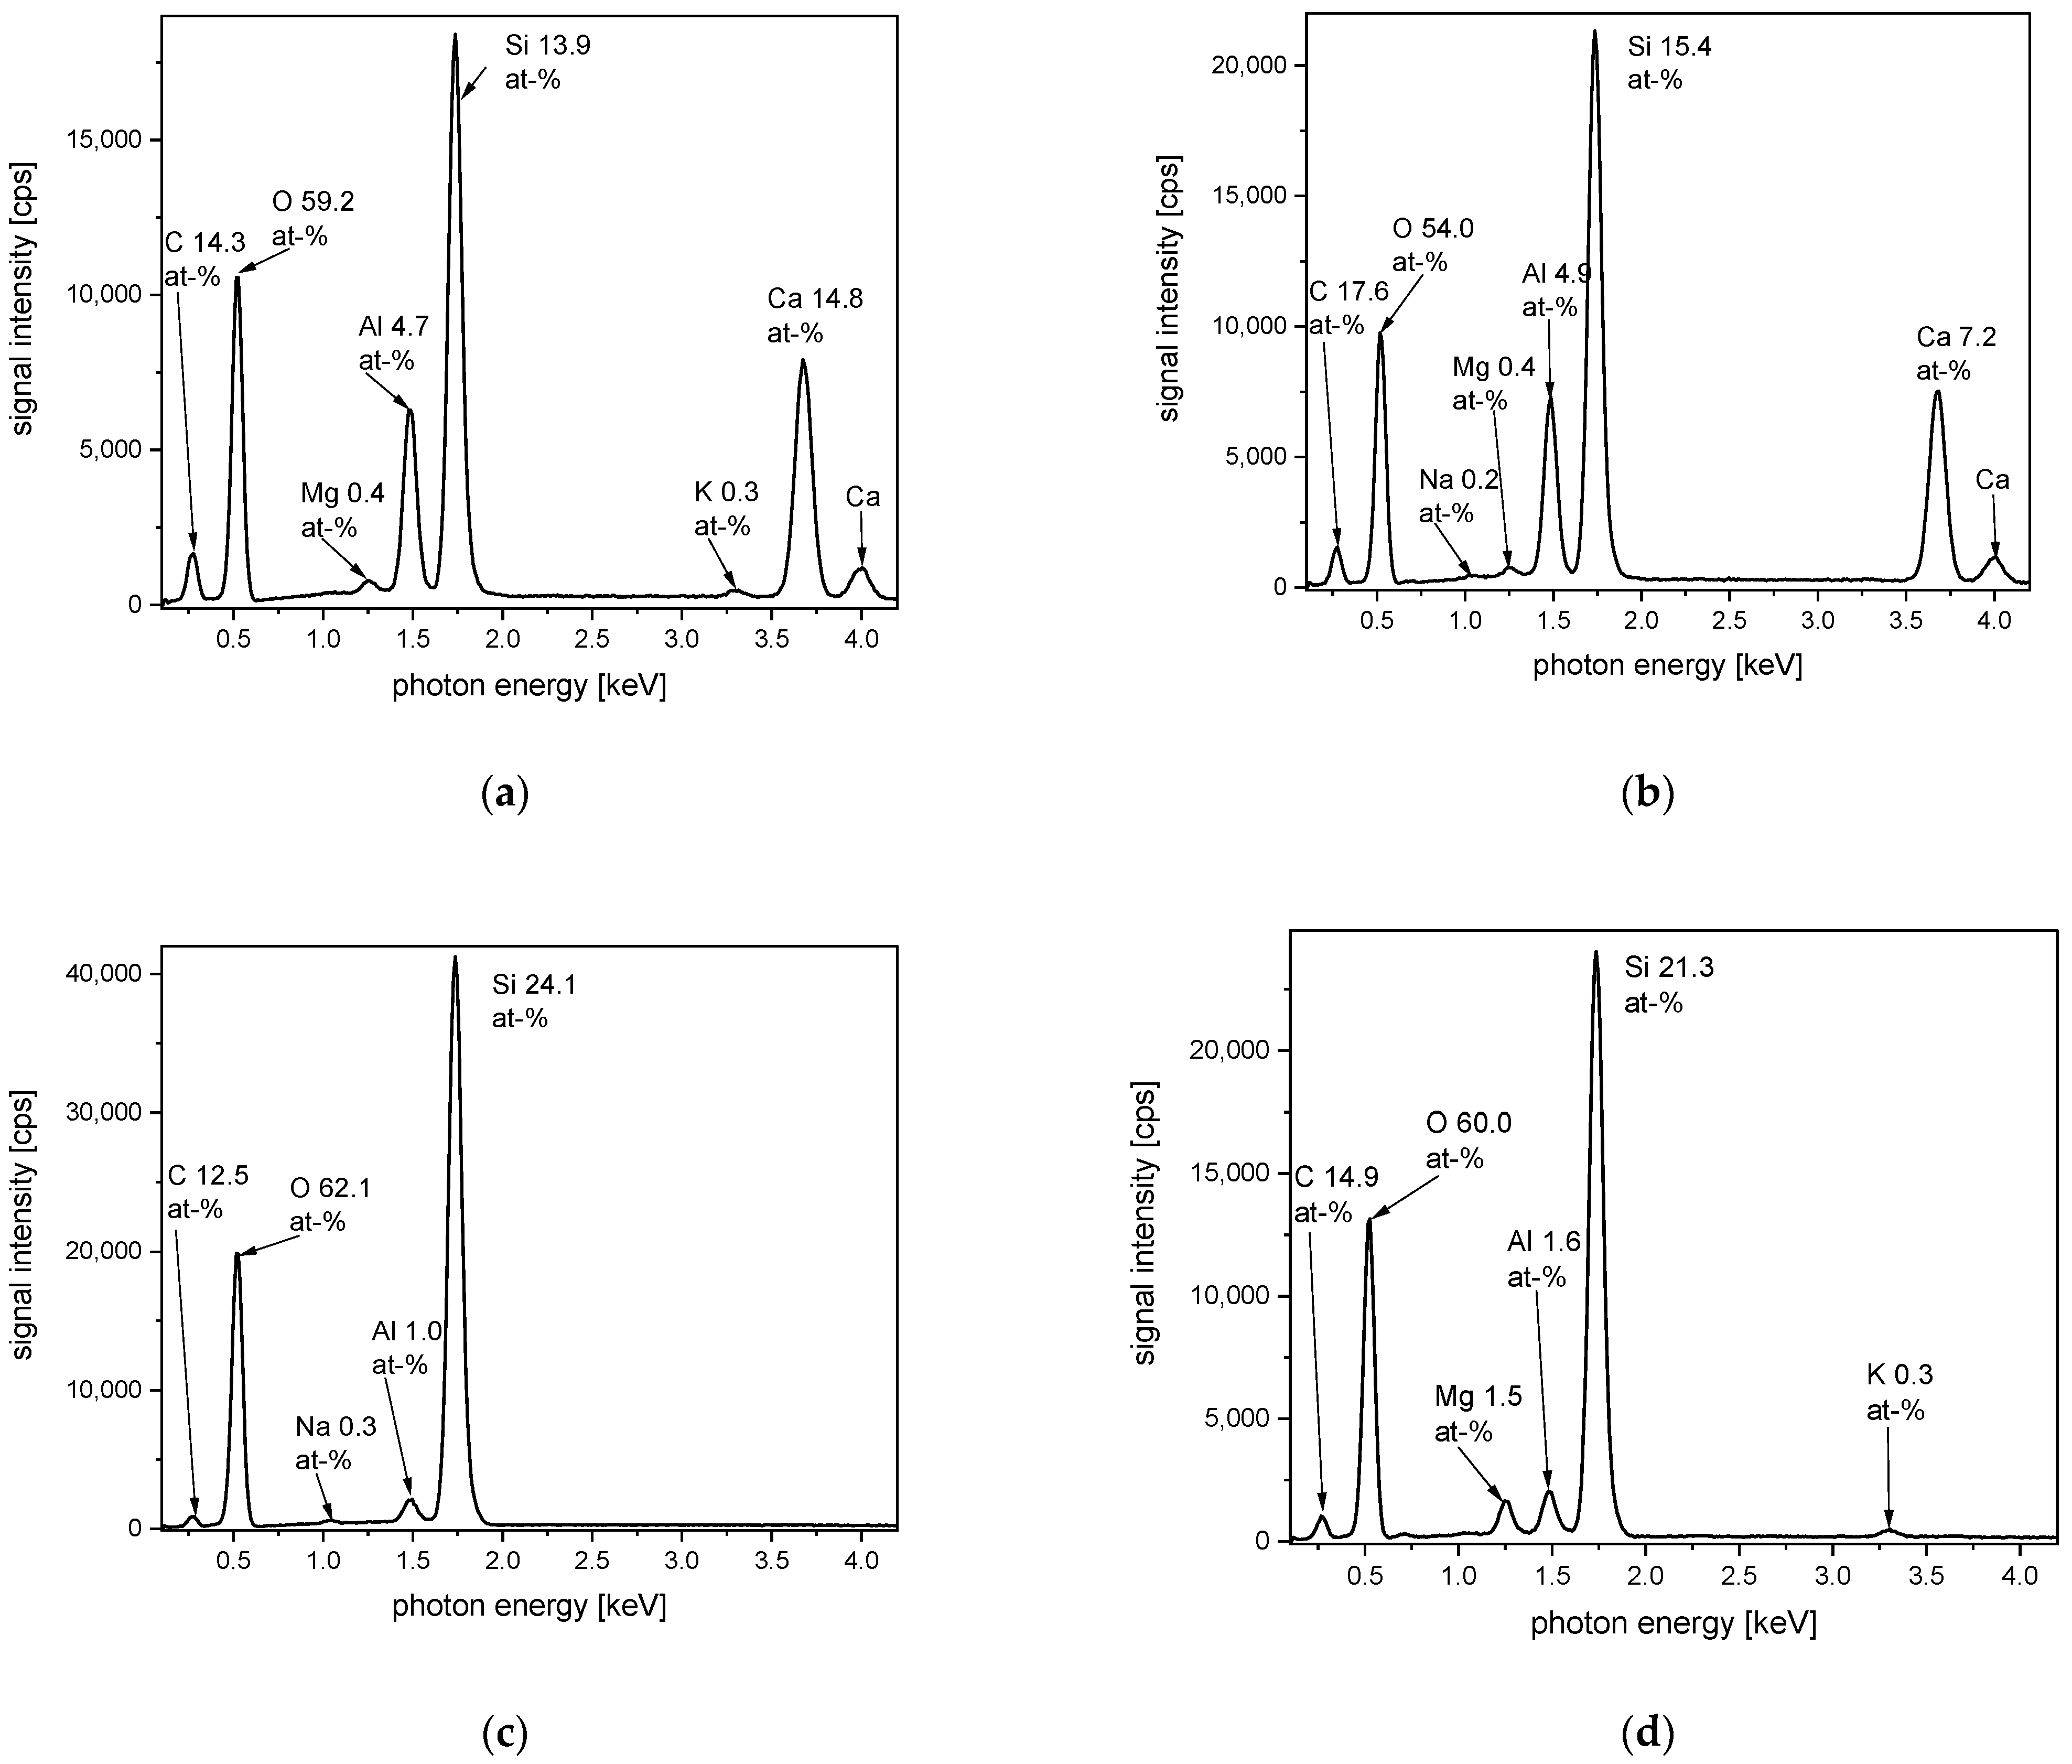
As examples of glass fiber products, the EDS spectra of four different commercially available glass fiber fabrics are compared in
Figure 29. These materials are supplied by the company Culimeta (Bersenbrück, Germany). The first product example is a conventional glass fiber fabric made from e-glass fibers. Oxygen with a content of nearly 60 at-% is the element determined with the highest concentration, due to the fact that glass is made from different metal oxides and silica. Other chemical elements with significant concentration in the e-glass fabric are silicon, calcium, and aluminum. Magnesium and potassium are determined only in small quantities. Surprisingly for an inorganic fiber, carbon is also observed in a significant amount on the fiber surface with around 15 at-%. It should be recalled that, via the EDS method, the surface of the fiber is investigated and the detected elements and concentrations are related to the chemical elements on the fiber surface. The inorganic fiber itself does not contain carbon, but quite often, the surface of glass fibers is treated with organic sizing agents [
130,
131]. These agents are applied to support yarn and fabric production processes. Furthermore, they influence the properties of the final glass fiber fabric. However, these organic agents are more sensitive to temperature influences, so by their use, the maximum temperature of use for the related glass fiber could be reduced drastically down to a temperature range from 150 °C to 300 °C. The second example is a caramelized glass fiber fabric. The term “caramelized” describes the light brown coloration as a result of thermal treatment at moderate temperatures [
132,
133]. By exposure to this temperature, the organic sizing agents are partly pyrolyzed, so a soft brown coloration occurs for the glass fiber fabric. Due to the part-carbonization of the sizing agent, the detected amount of carbon is also slightly increased to values around 18 at-%. However, no carbohydrates are in involved in this process, so the commonly used term is misleading regarding the involved chemistry. The third example is a silica fabric, for which EDS spectra are dominated by two main signals of oxygen and silicon, related to the component silica SiO
2. Furthermore, small amounts of sodium and aluminum are detected. Carbon is determined probable according to the presence of a sizing agent. The last example is a glass fiber fabric modified with vermiculite particles to improve temperature stability. An SEM image of this glass fiber fabric with vermiculite particles is presented above in
Figure 4. The flat plate-like structure of the vermiculite particles is clearly visible. Vermiculites are naturally occurring clay minerals. They are built up by adjacent silicate layers [
134,
135]. In the interlayer between the silicate layer, water and metal ions can be incorporated. In natural vermiculite, often magnesium ions are present in this interlayer [
136]. According to this background, the detection of magnesium by EDS in a concentration of 1.5 at-% can be explained (
Figure 29).
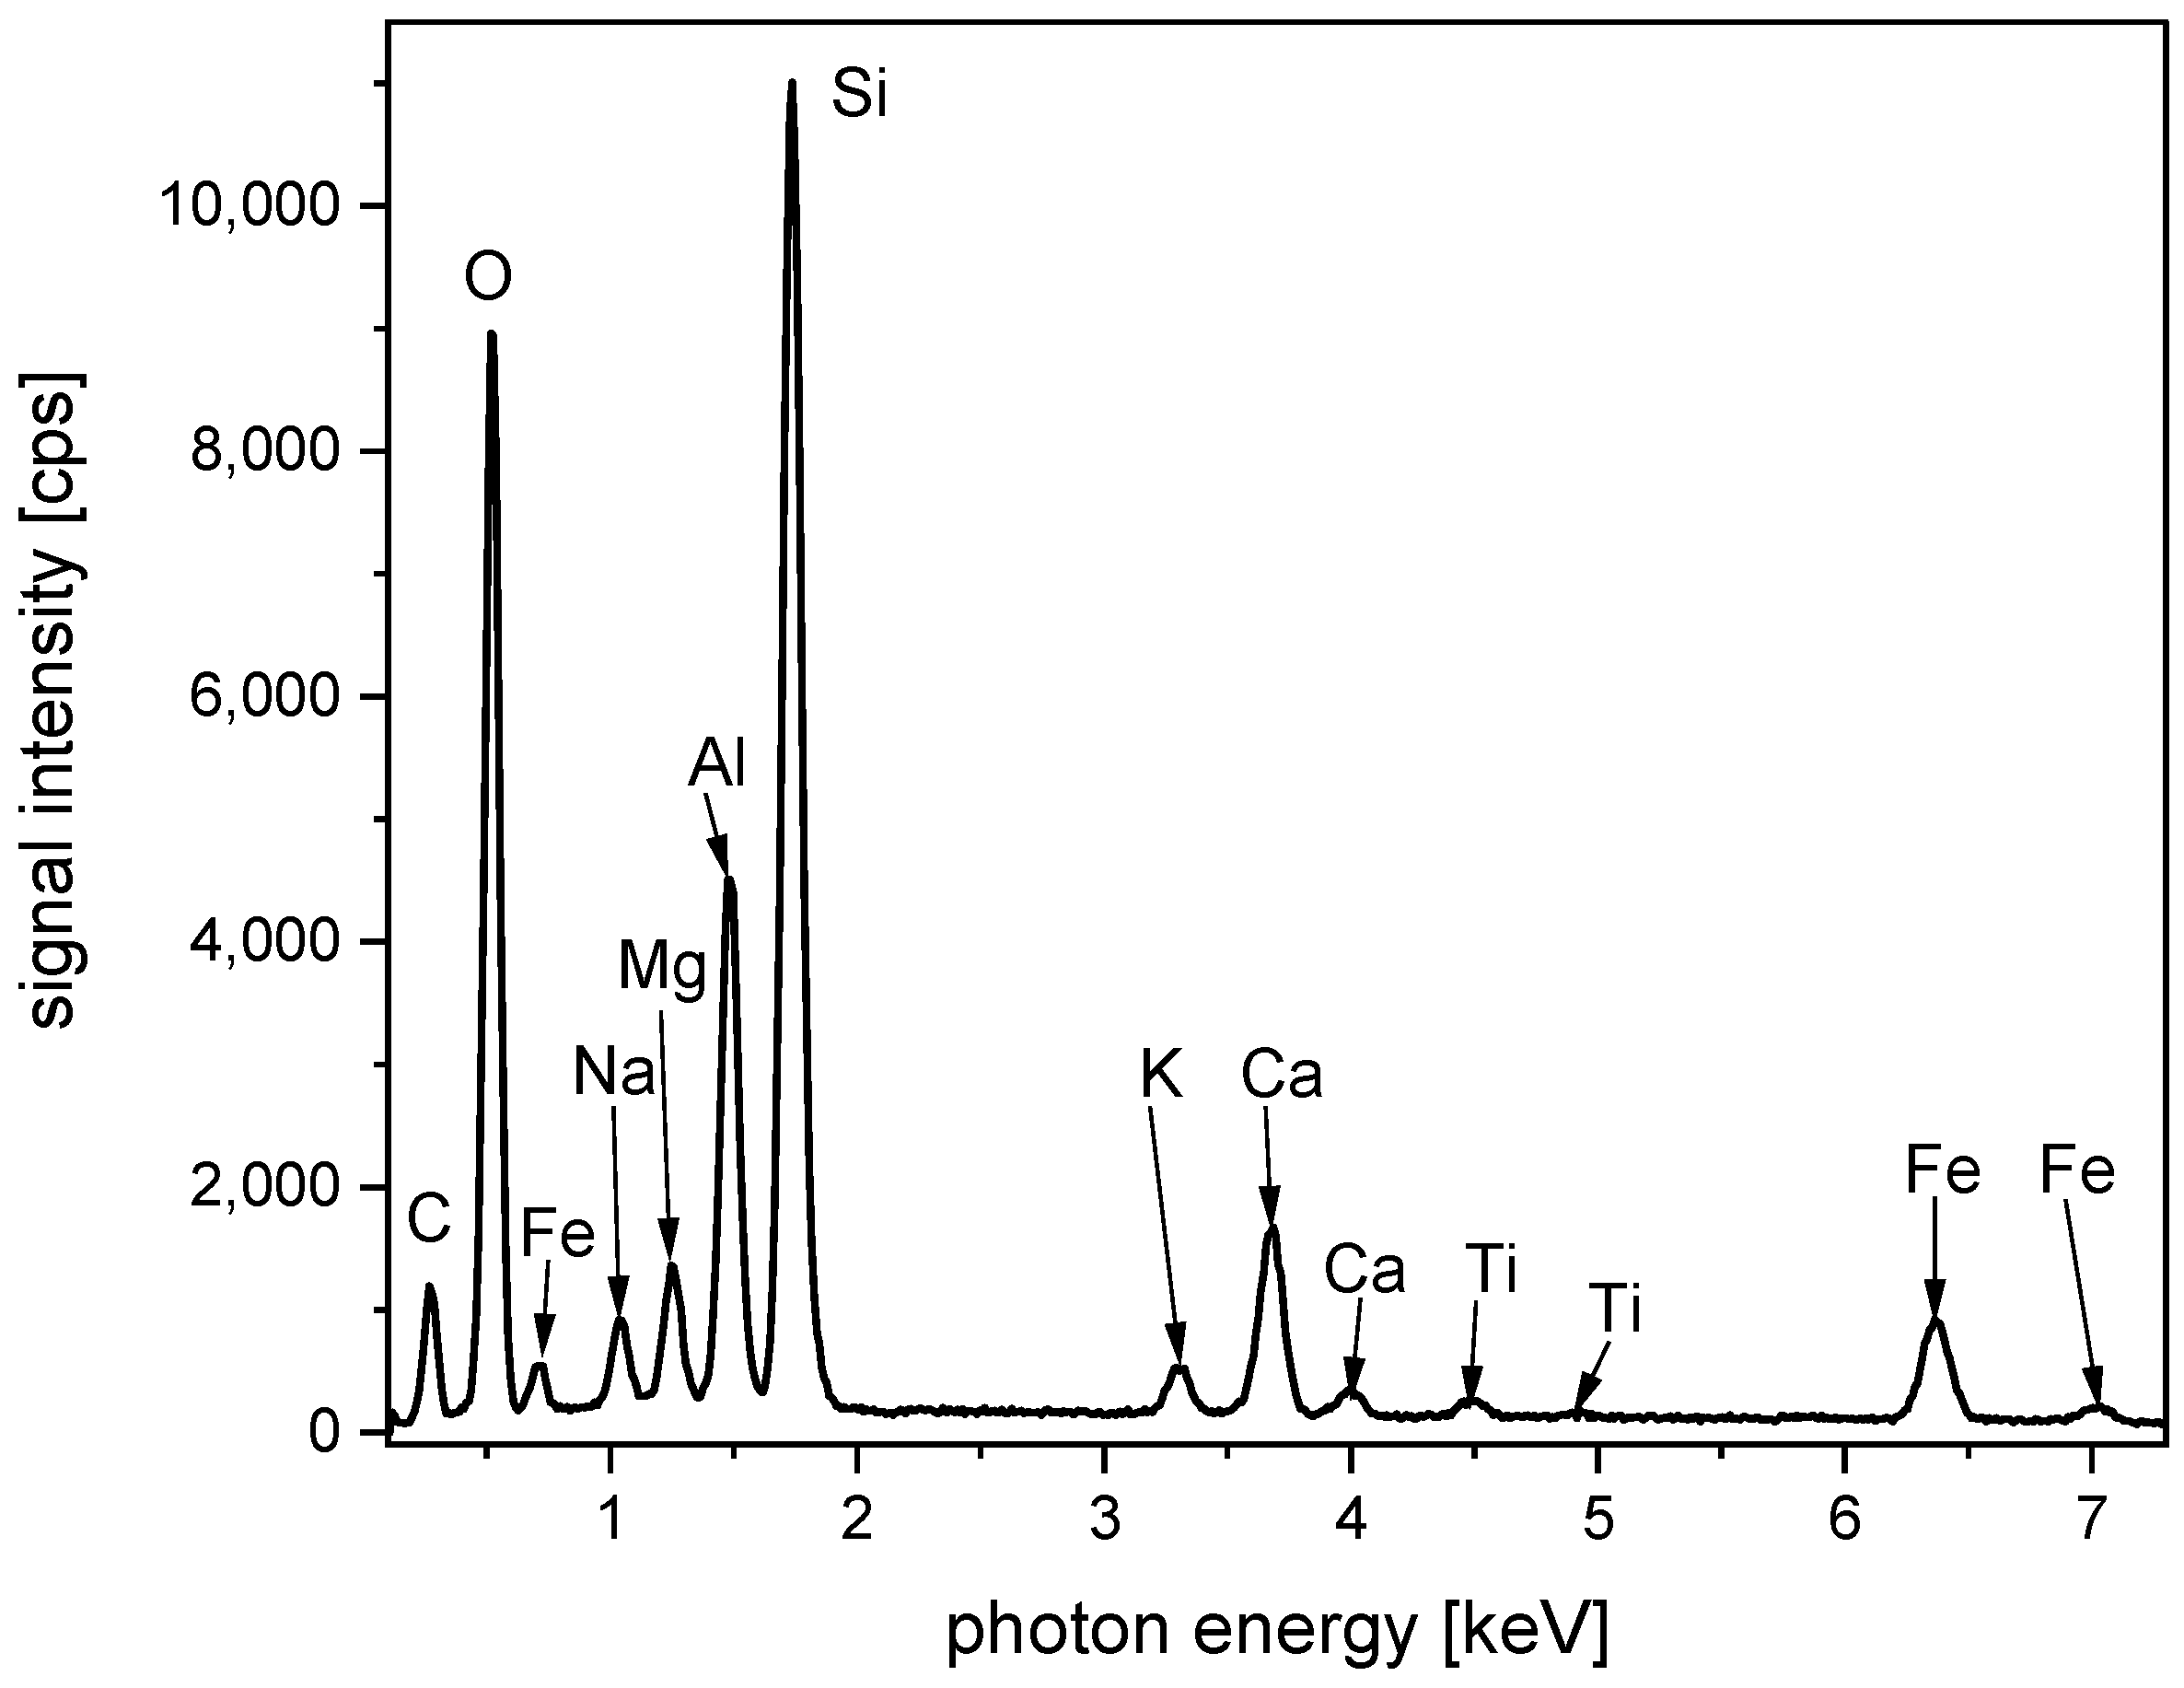
An EDS spectrum taken from a basalt fiber sample is presented in
Figure 30. This fiber sample is taken from a basalt roving (Kamenny Vek/Advanced Basalt Fiber). Additional to the mainly detected elements silicon, aluminum, and oxygen, iron and titanium are also visible in the spectrum. The presence of iron oxide is typical for basalt fibers and, due to the composition of the natural stone, used as material for basalt fiber production. This iron oxide is also responsible for the typical brown coloration of basalt fibers, making it easy to distinguish them visually from other glass and ceramic fibers [
137,
138]. Together with the also present titania as TiO
2, the iron oxide supports UV-protective properties to basalt fiber fabrics or coatings containing basalt fibers as additives [
139]. Furthermore, the presence of iron oxide is often related to protection against heat radiation [
140,
141]. The chemical composition of basalt fibers varies in a broad range depending on the type and supplier of the basalt fiber [
142]. The main reason for this broad variation is the use of natural stones as a source of fiber production. A comparative study of five different basalt fibers reports iron content in the range of 0.2 to 11.1 m% and titanium content in the range of 0.3 to 1.5 m% [
142]. In comparison to these ranges, the actual EDS investigation of the basalt fiber leads to contents of iron and titanium which are in the former reported range, but with low values. In contrast, the determined amount of silicon is higher compared to earlier reported values.
Similar to the EDS spectra of glass fiber fabrics, the EDS spectrum of the basalt fibers also exhibits a signal for carbon. On this basalt fiber sample, carbon is recorded with around 37 at-%, which is a significant surface concentration. The presence of carbon on basalt fibers can be also be explained by the former application of sizing agents. An earlier investigation reports on the thermal and chemical removal of these carbon-containing compounds from the basalt fiber surface [
143]. This former study also provides relevant information on the change in the mechanical properties of basalt fiber after thermal treatment. For basalt fibers, often T
max values of around 700 °C are given, which are related to oxidative processes from FeO to Fe
2O
3. Nevertheless, even a thermal treatment in the range from 400 °C to 500 °C can significantly decrease the mechanical strength of basalt fibers [
143].
7.2. Carbon Fibers
Carbon fibers are mainly built up from the pure carbon of graphite specification [
144]. Usually, they are produced by the pyrolysis of an organic precursor fiber under controlled conditions. Most often used are PAN fibers as precursors for carbon fibers [
145,
146,
147,
148]. However, other precursor fibers are also used, e.g., pitch-based fibers [
149,
150]. The main applications are found as fibers in fiber-reinforced materials. Carbon fibers are used for this purpose, because of their high strength [
151,
152]. However, their price is quite high compared to competing glass fibers or natural fibers, which are used in reinforcement materials as well [
138].
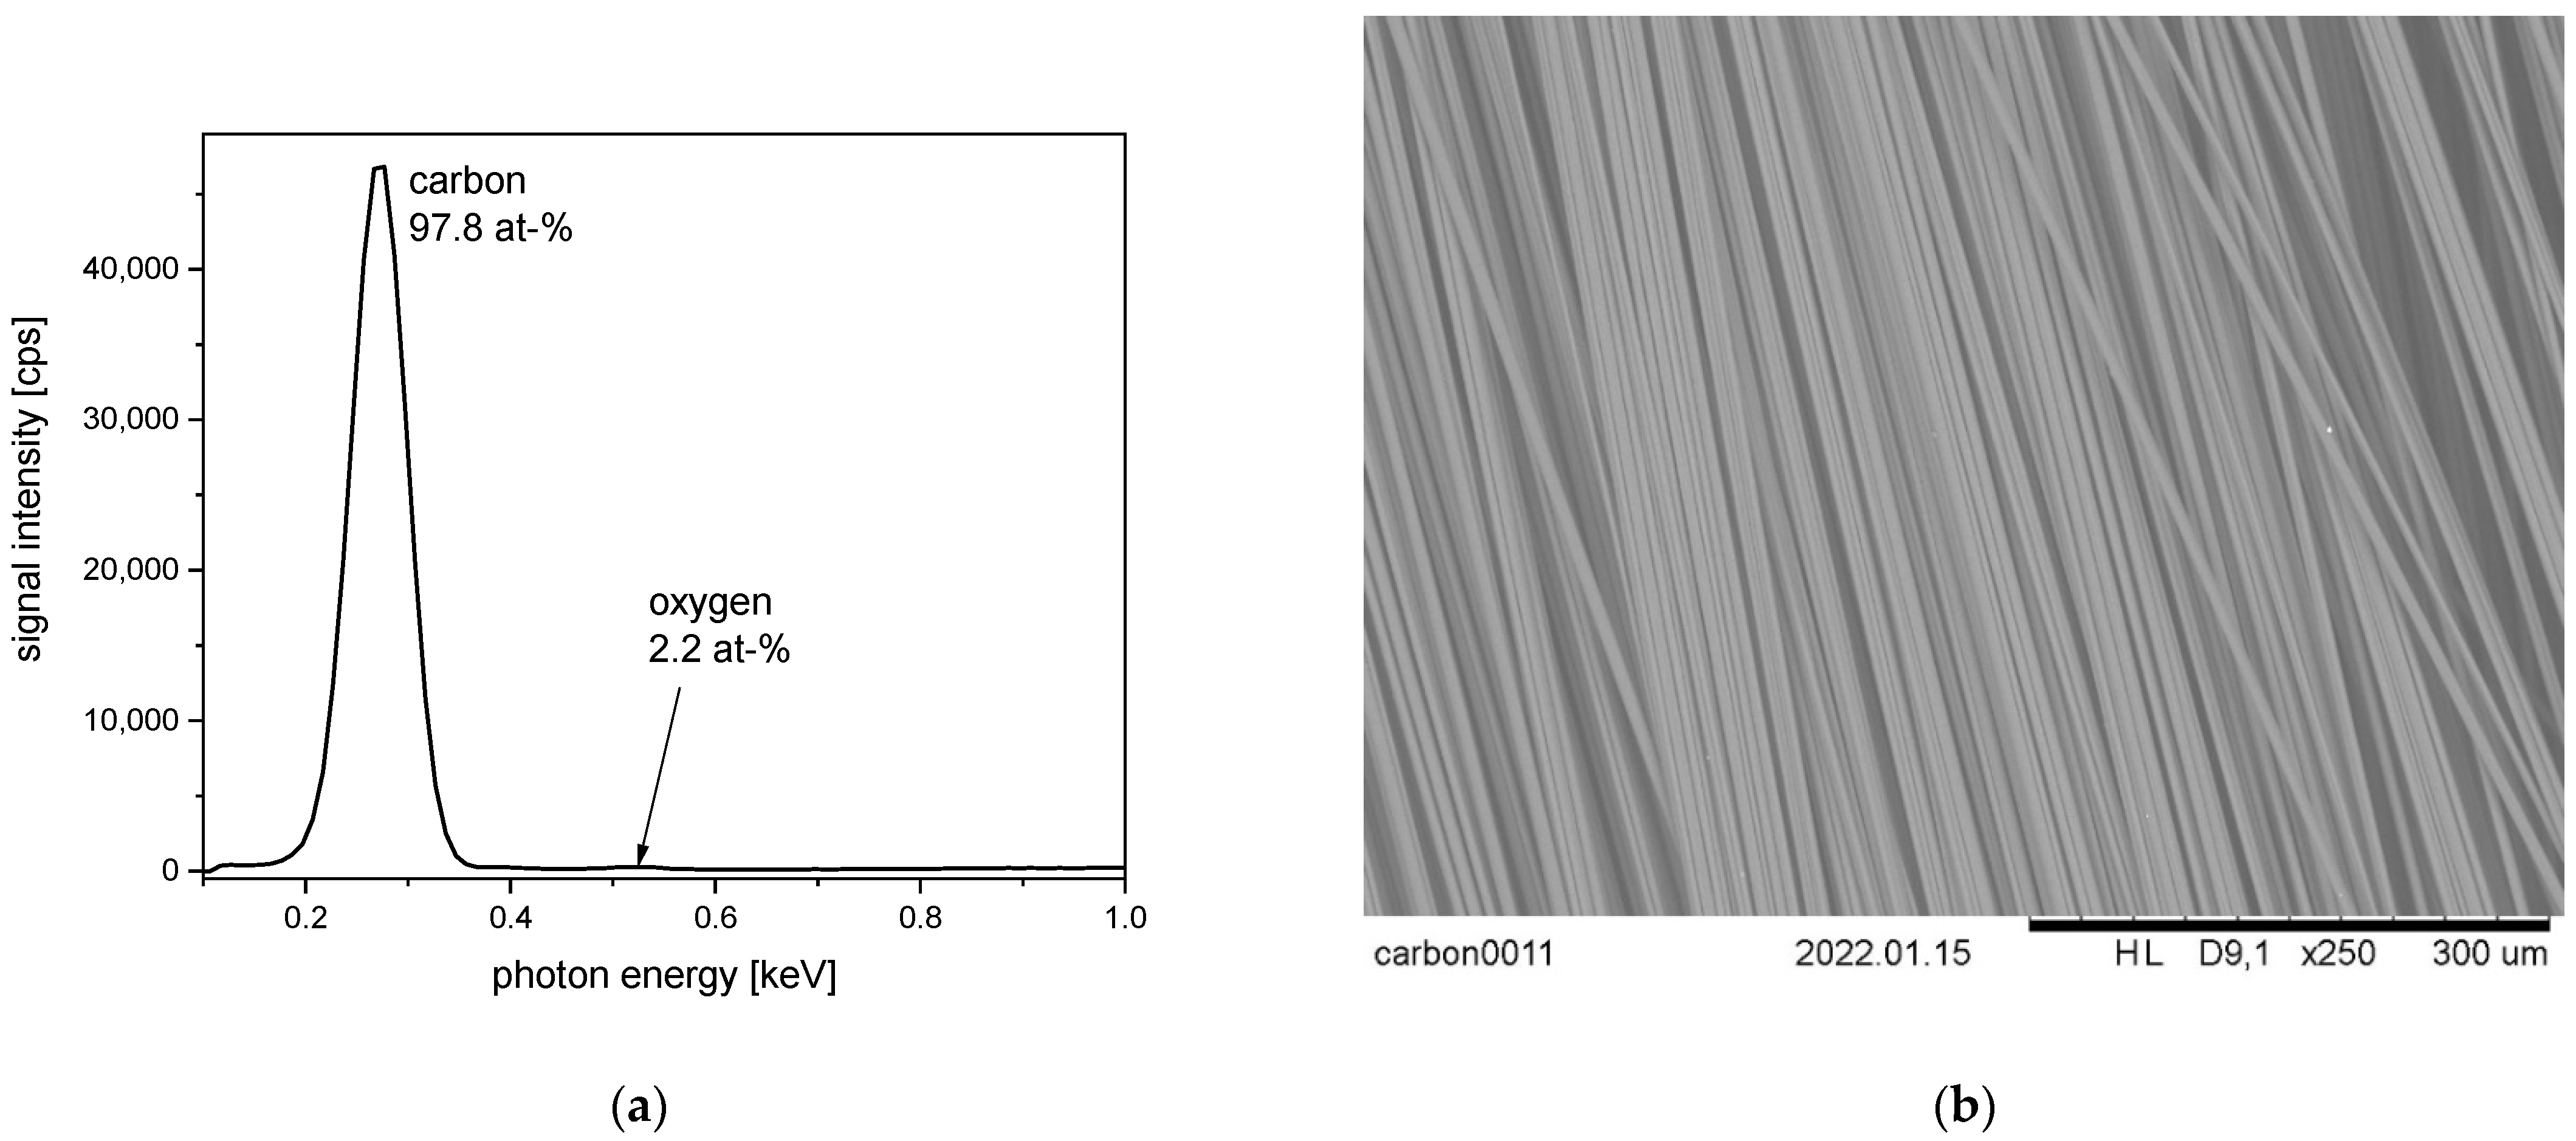
For carbon fibers, two examples are given here, presented in
Figure 31 and
Figure 32. Both samples are supplied by SGL Carbon AG (Wiesbaden, Germany). The first sample is taken from a roving and the other one from a carbon fiber fabric. The roving exhibits nearly a 98 at-% content of carbon, but oxygen also occurs with a concentration of around 2 at-% (
Figure 31). This small content of oxygen can be explained by partial oxidation on the carbon fiber surface or by the application of organic sizing agents [
153,
154]. The electrochemical oxidation of carbon fibers is often used to improve the adhesion of carbon fibers to an epoxy-based matrix in a fiber-reinforced composite material [
155].
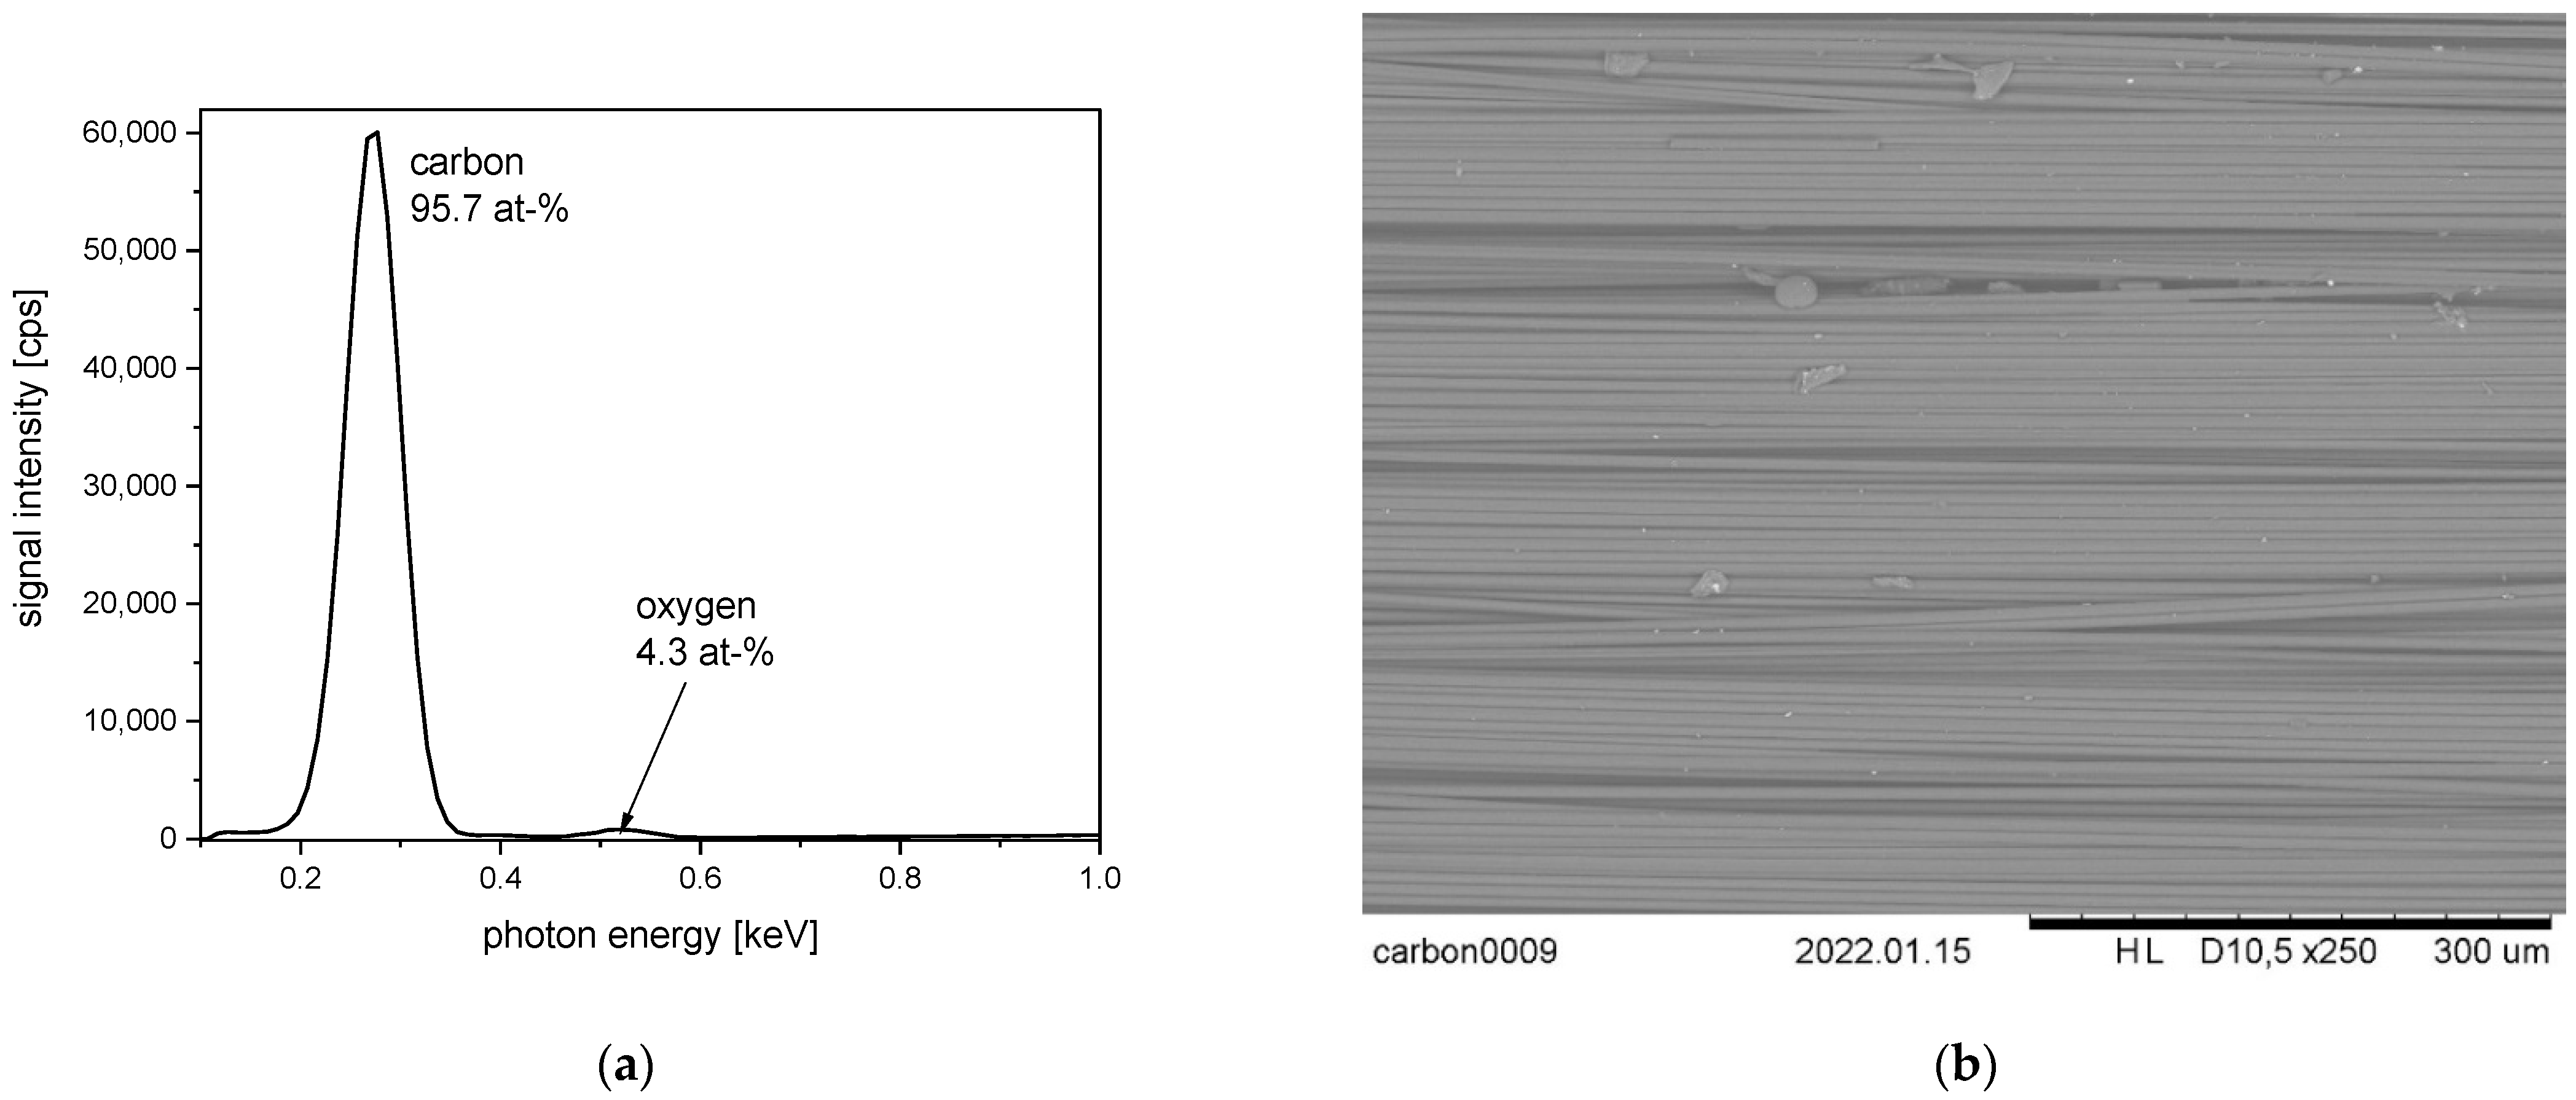
The EDS spectrum taken from the carbon fiber fabric exhibits an increased amount of oxygen, with around 4 at-%. The related SEM image shows beside the carbon fibers also deposited agglomerates and particles which could also be related to the presence of sizing agents (
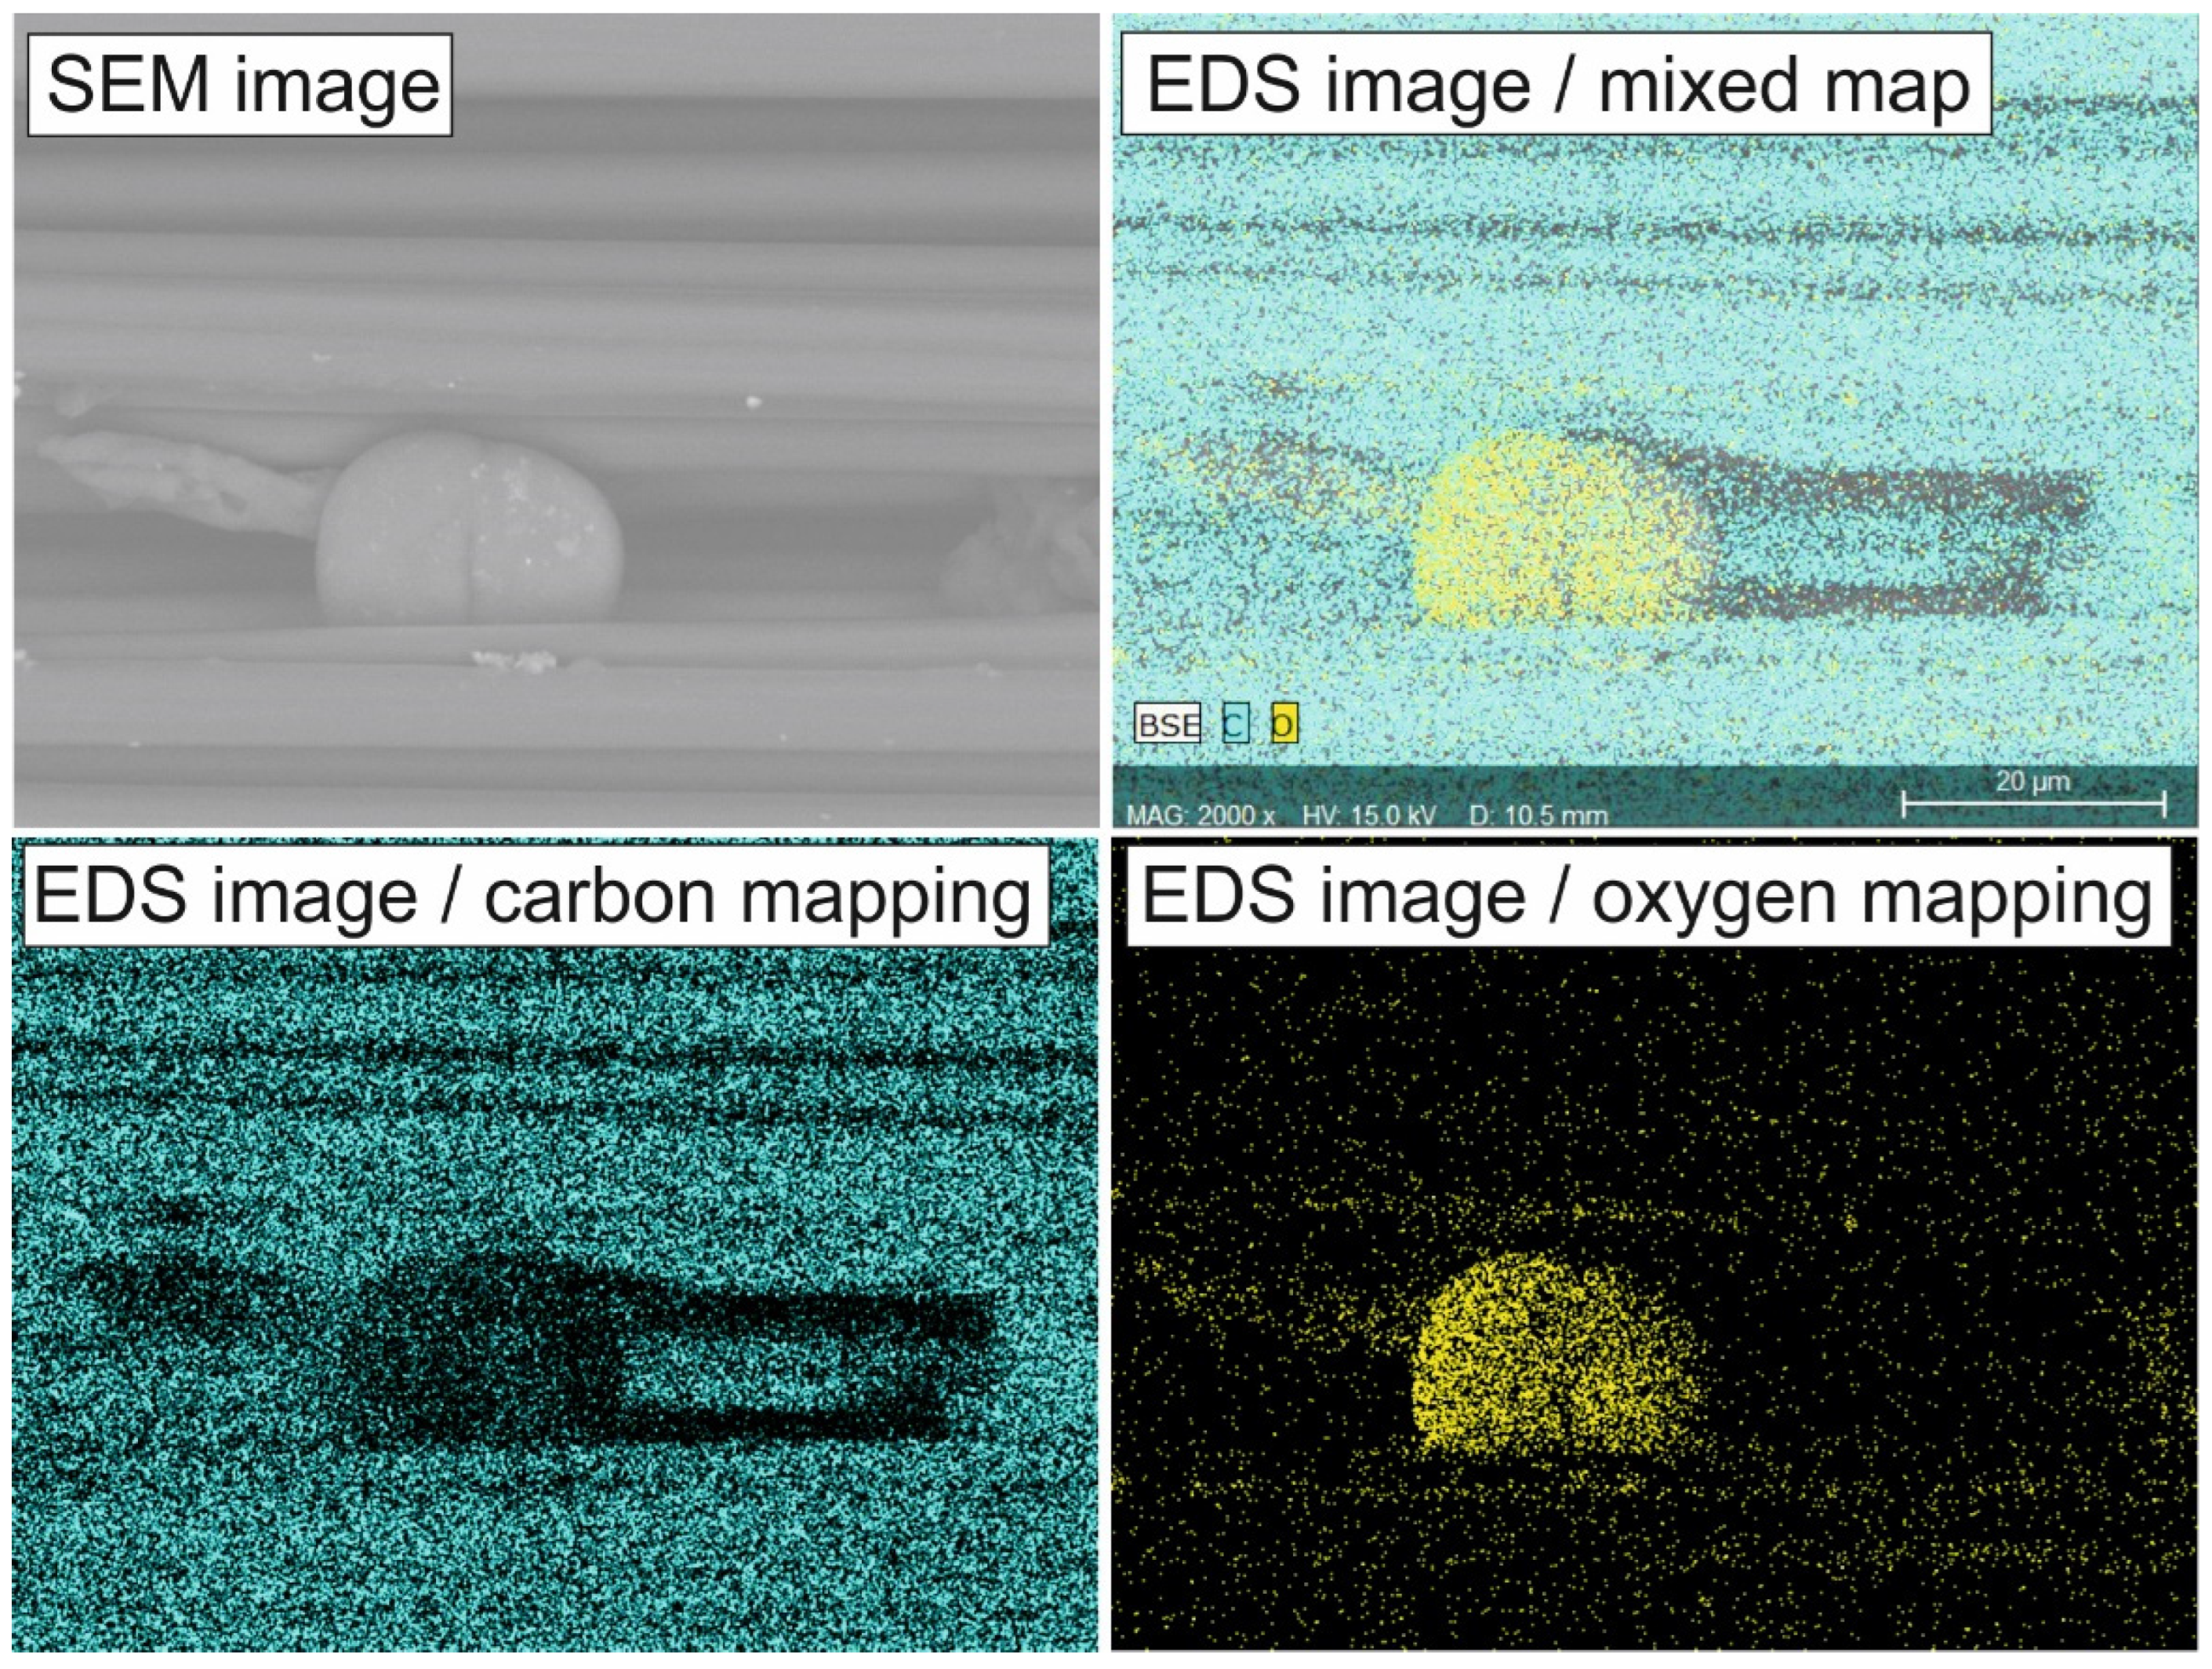
Figure 32). These agglomerates are investigated in higher magnification by SEM and EDS mapping (
Figure 33). By this, it is determined that, especially at surface areas with agglomerates, the oxygen content is high, so these agglomerates are probably related to the application of oxygen-containing sizing agents. Contamination by inorganic, oxidic particles can be excluded, due to the lack of other elements than carbon and oxygen in the spectrum.
8. Metalized Textiles
This introduction should briefly address metalized fibers and textiles, which are probably the most fascinating materials combining the advantageous material properties of metals with textile properties and applications [
156,
157,
158]. Either metal fibers introduced in conventional fabrics or fibers which are coated by metal layers can be used. Moreover, complete textile fabrics can be coated by metal layers [
158,
159]. From both types, several examples are presented here. Another method to realize metalized textiles is the application of coatings with embedded metal effect pigments [
160]. Such metal effects containing coatings are not described, because for this topic, there is already a broad review published [
161]. The metalization of textiles can also be achieved by physical vapor deposition (“sputtering”), usually of noble metals [
158]. Such approaches are rather new and account for a niche of special applications. This can be catalytic functionalization, where noble metals are sputtered on top of a semiconductor nanoparticle finishing on textile fibers [
162].
Applications of metalized textiles are found in areas where metal properties are especially demanded. Mostly, this is related to electric conductivity, antistatic properties, or the shielding of micro or radio waves [
163,
164,
165]. In particular, the shielding of electrosmog is an important market segment [
166]. An innovative field for metalized fibers is products like wearable E-textiles [
167]. Another important application is antimicrobial textiles, mainly based on silver-coated fibers [
168,
169,
170,
171,
172]. However, copper containing textile materials is also offered for antimicrobial purposes [
173,
174]. Membranes from metallized microfibers are also advantageous materials for the filtration of particles [
175].
The first two examples are related to the applications for antimicrobial properties and electrosmog shielding (
Figure 34). In both cases, a silver-coated polyamide fiber is introduced in a conventional fabric. The silver fiber exhibits a clear material contrast in the SEM-image. Because of the higher atomic weight of silver, silver-containing areas appear brighter compared to sample areas containing only light chemical elements, such as carbon, oxygen, and nitrogen.
To investigate such silver fiber products in more detail, SEM images and EDS mappings are recorded at higher magnification (
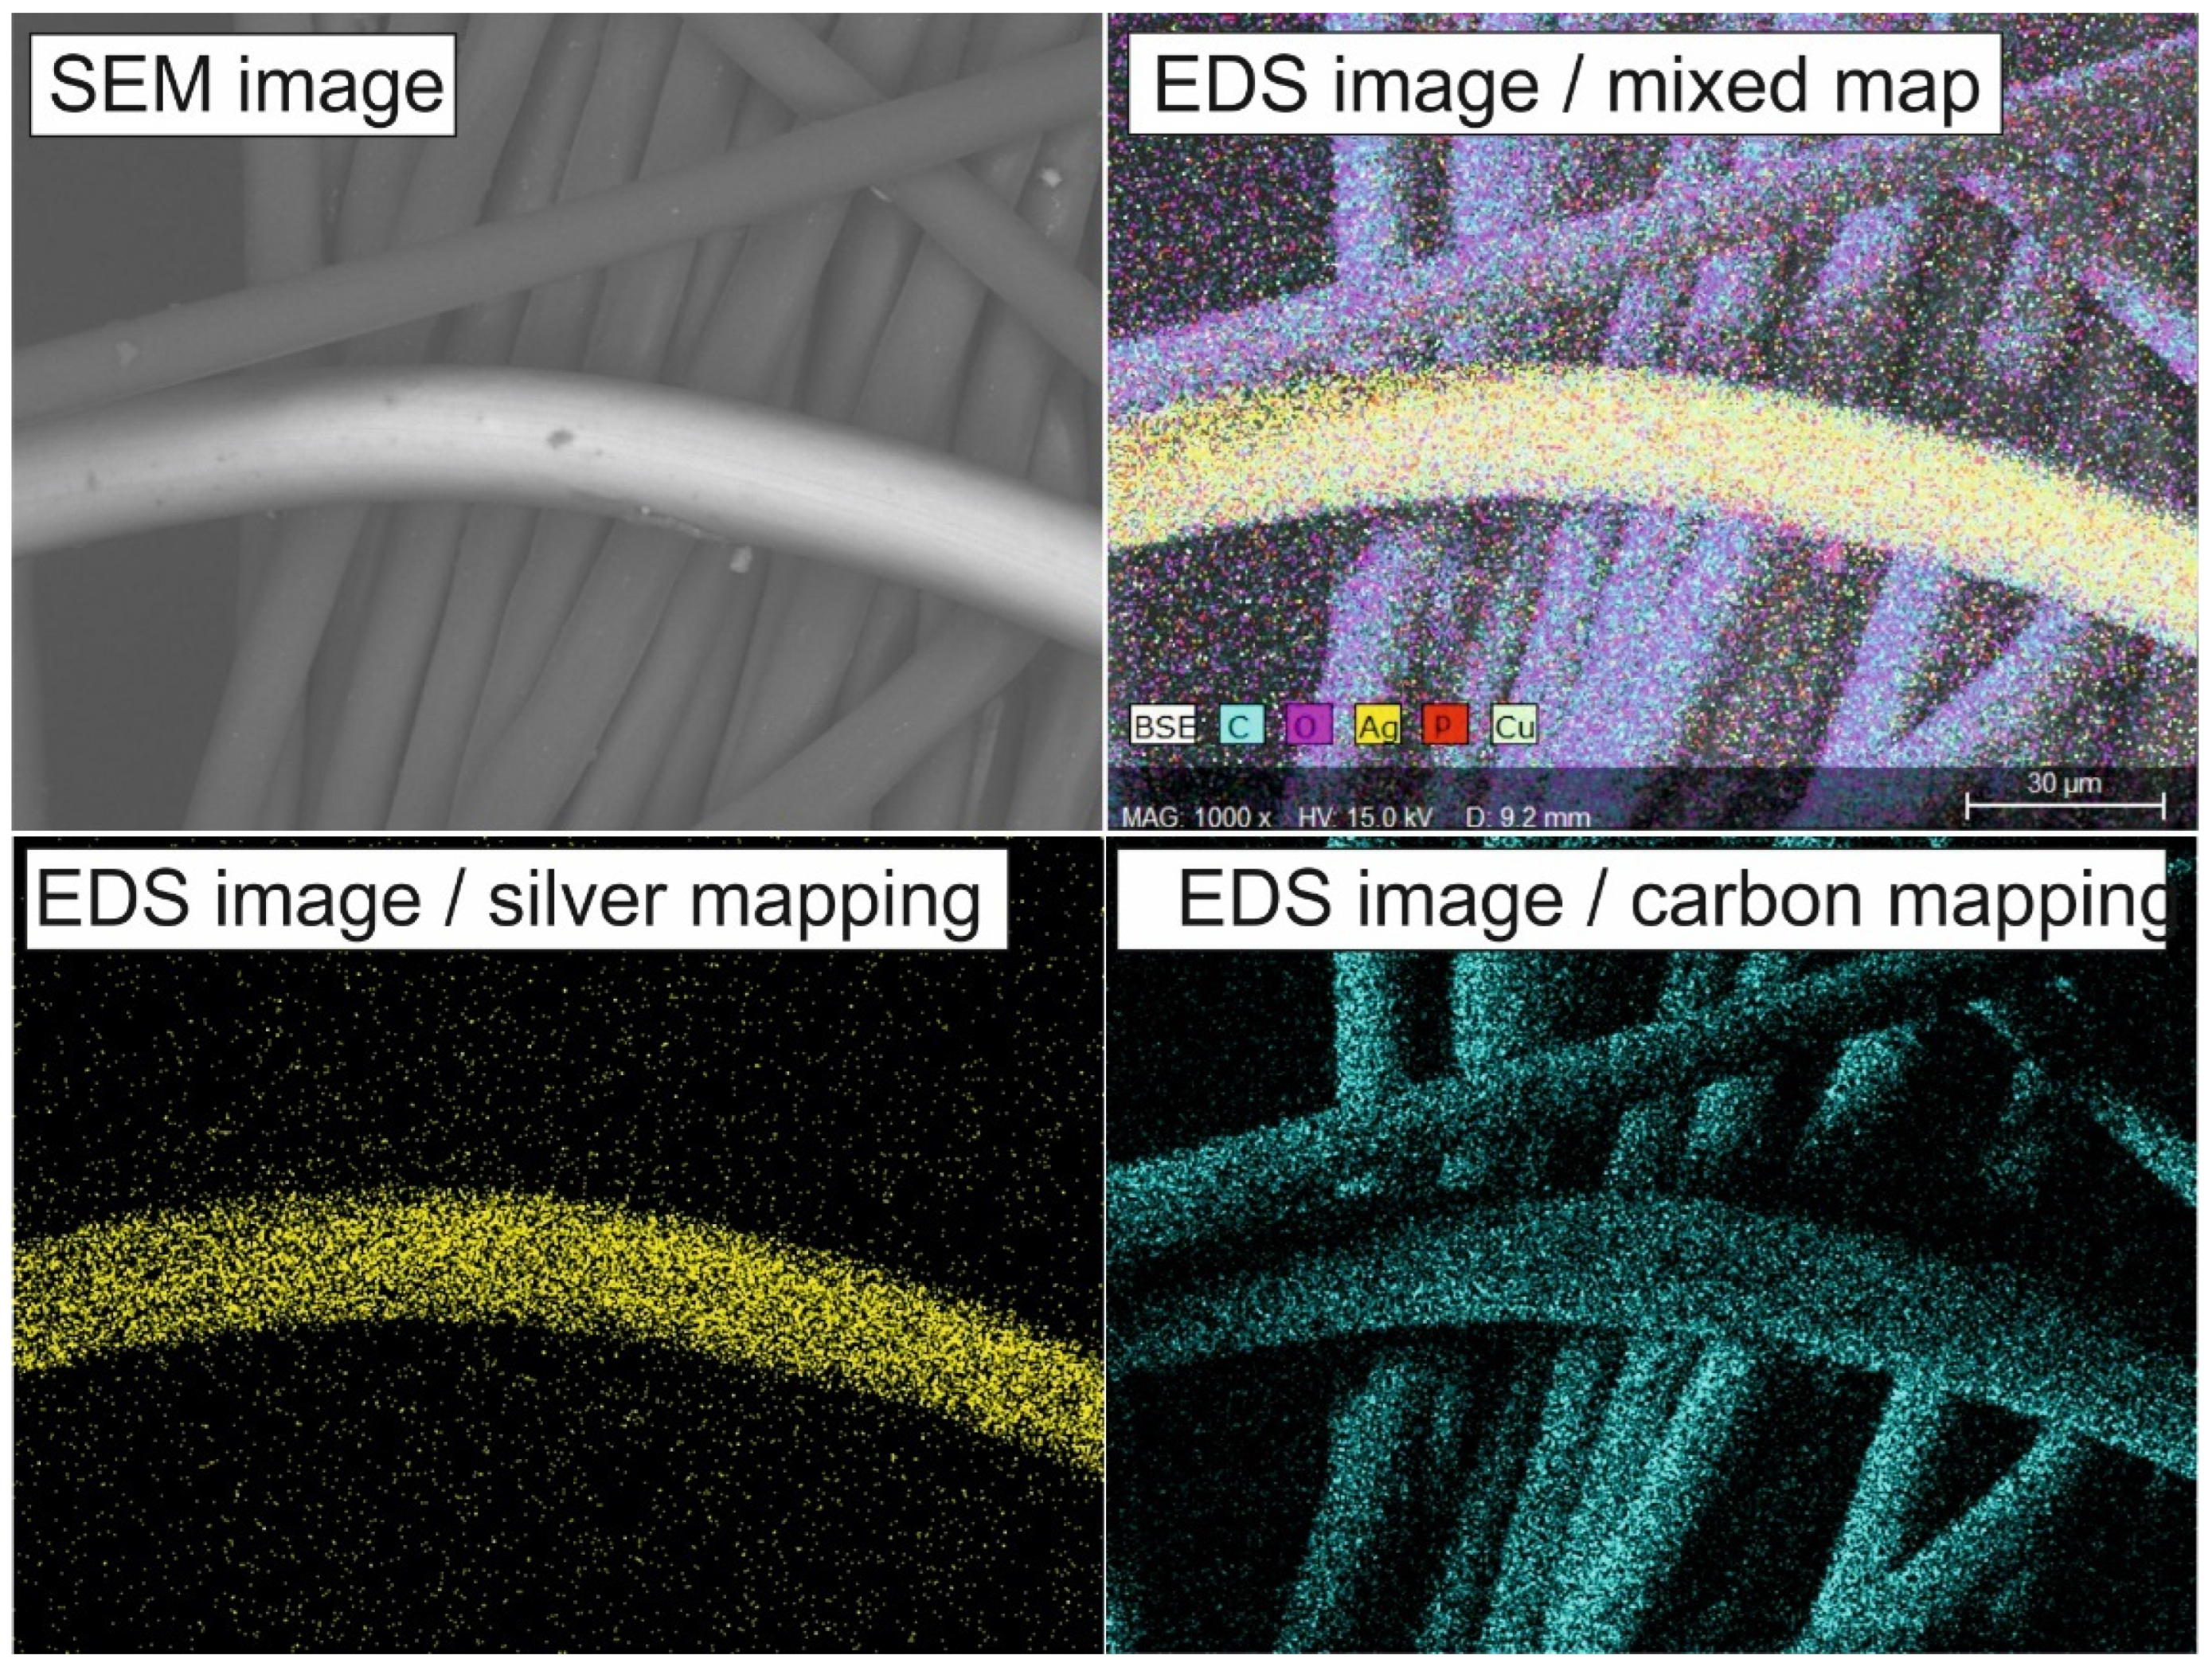
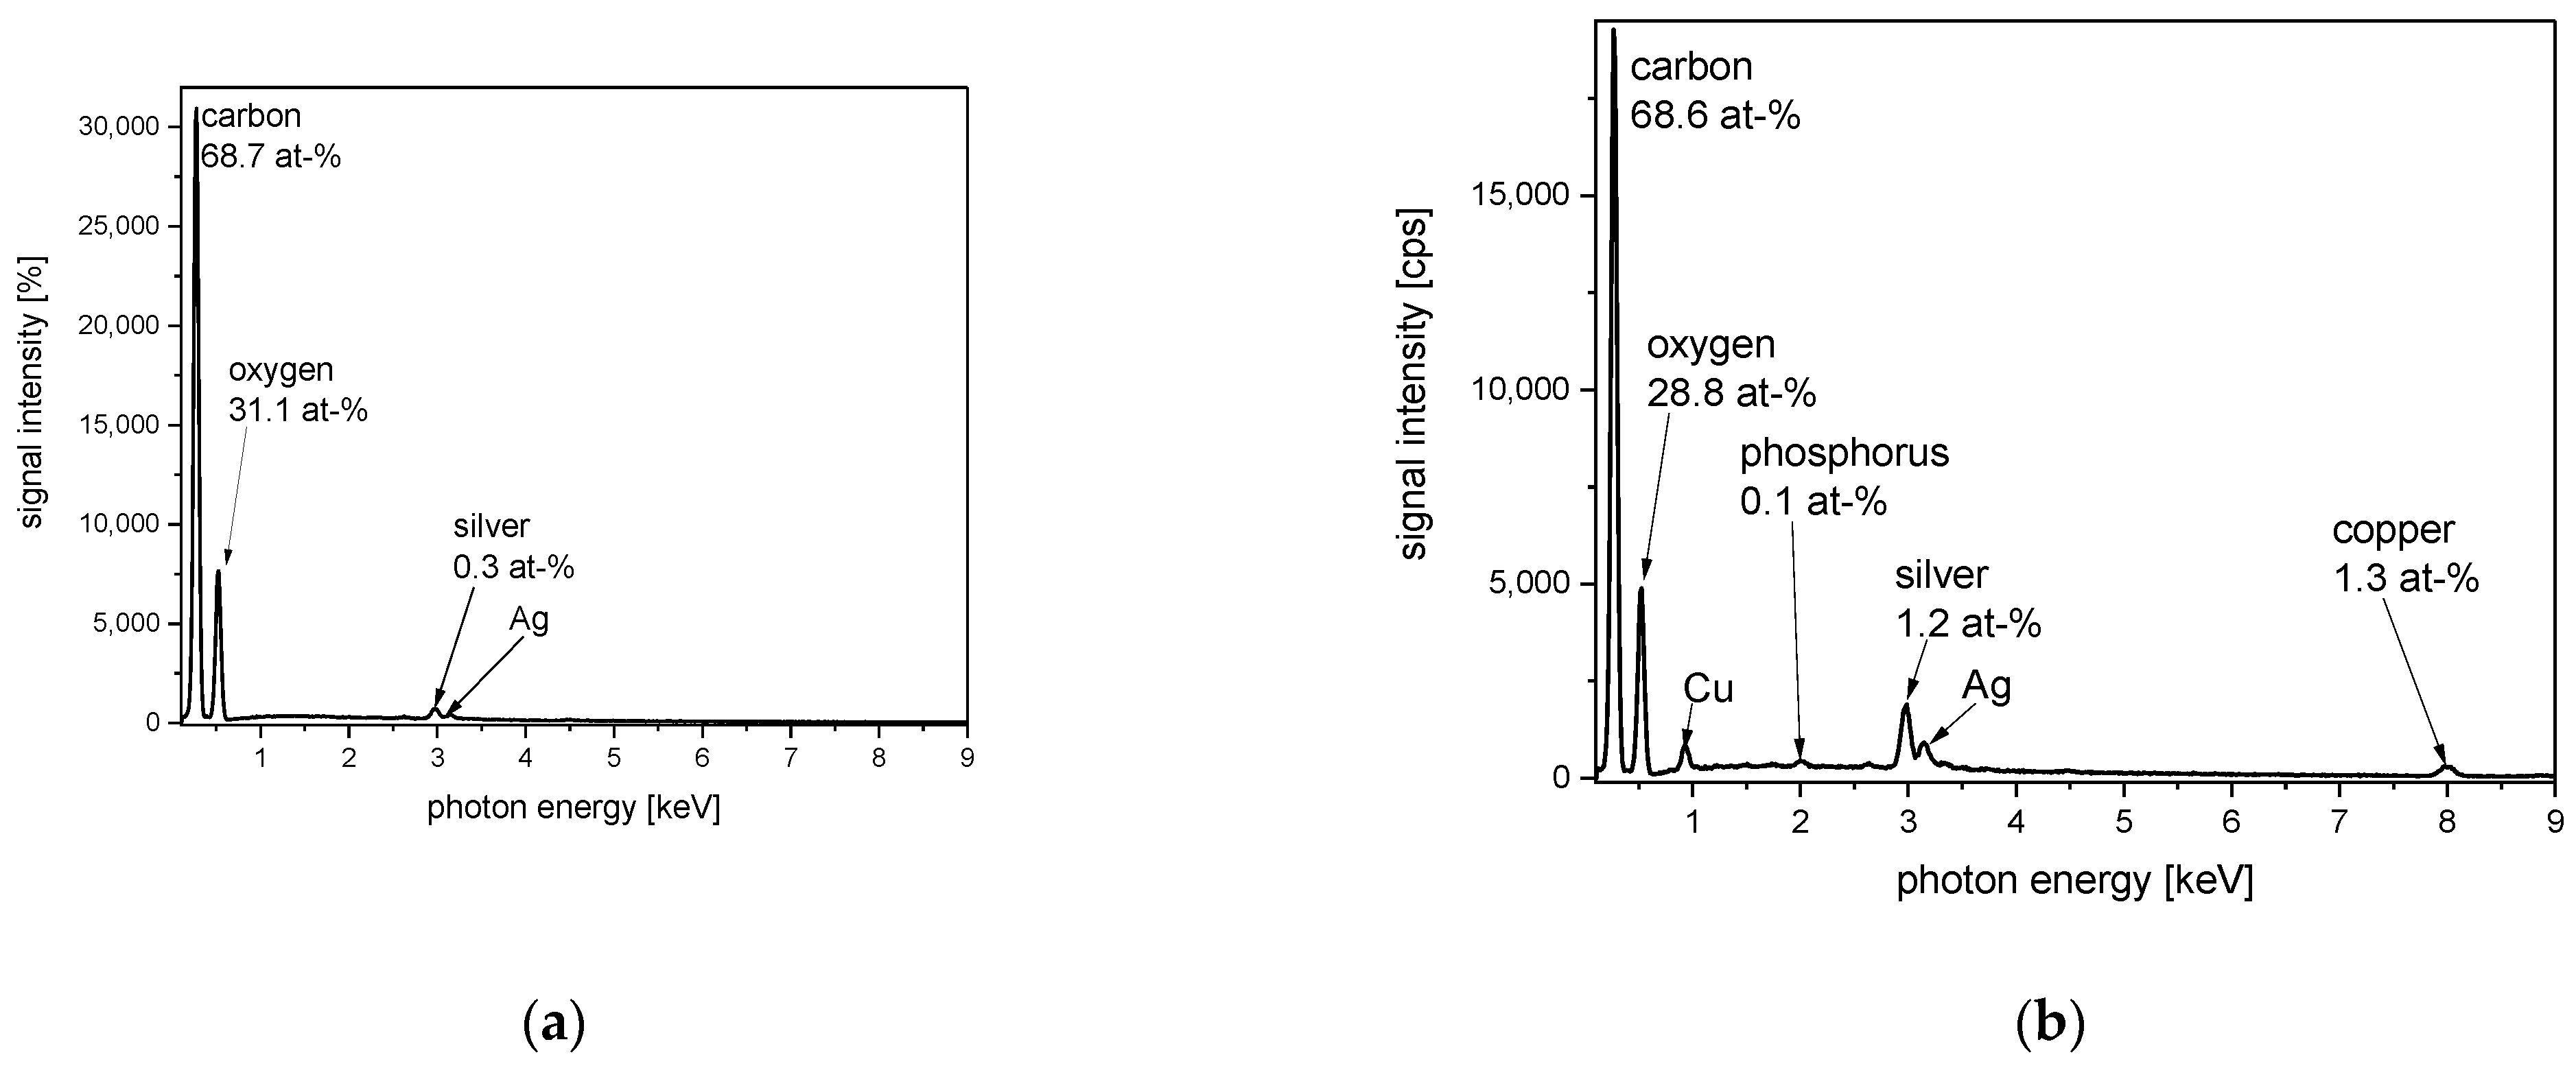
Figure 35). The silver content can be clearly identified on the silver fiber. The according EDS-spectra of both textile samples are taken at a lower magnification of only 50x to obtain an average of the elemental content for a wider surface area (
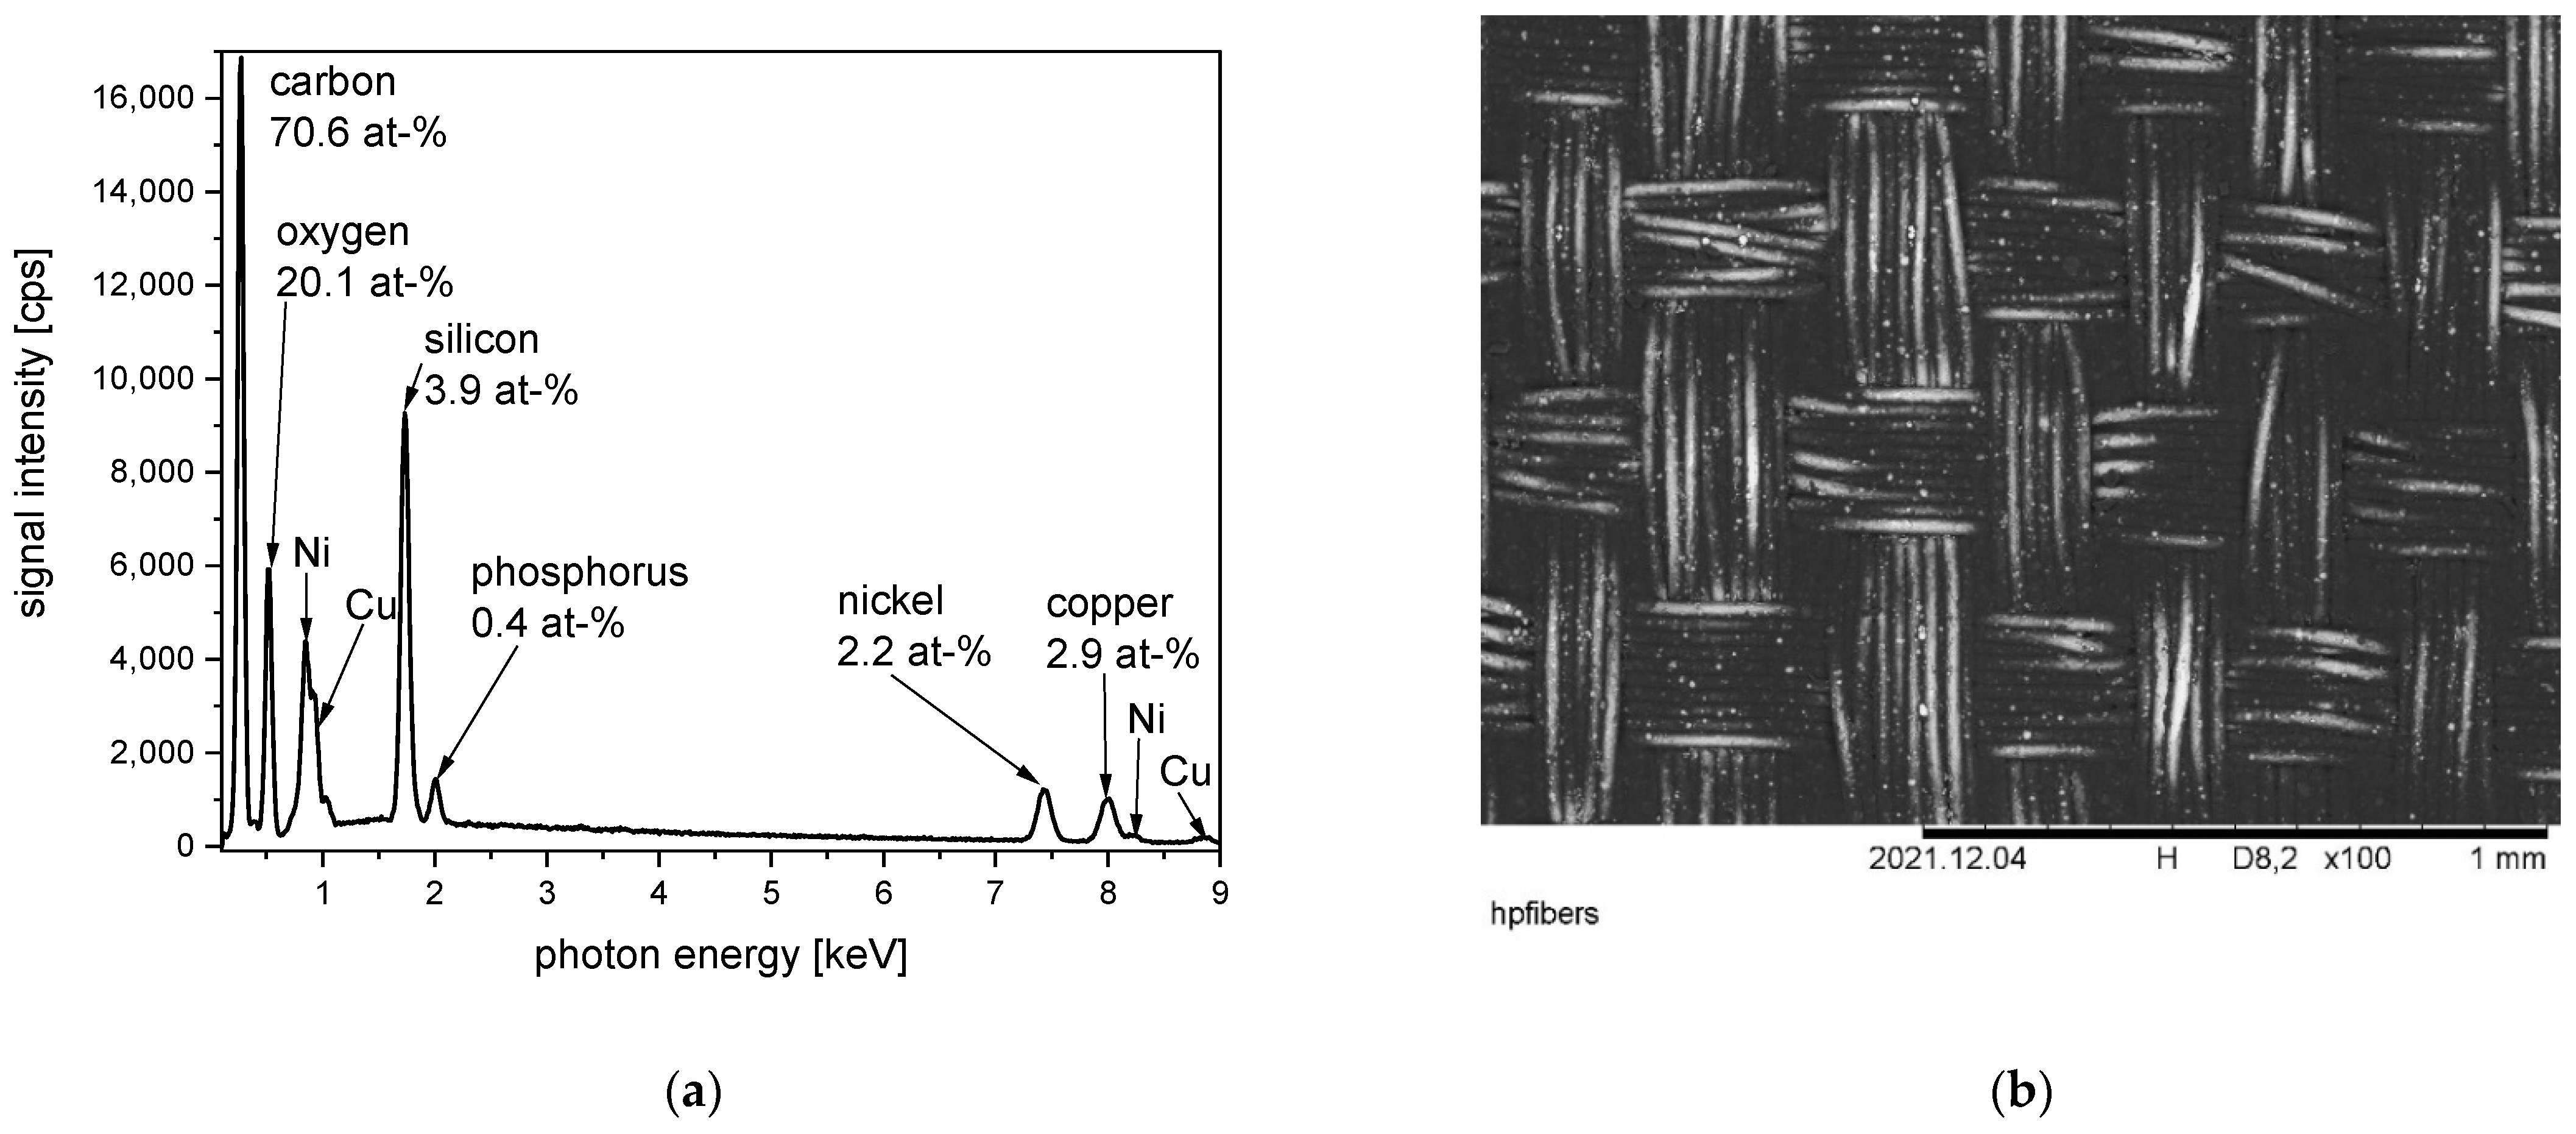
Figure 36). The surface concentration of silver is not high, but due to the good sensitivity of the EDS method for silver, this chemical element can be detected clearly. Besides carbon and oxygen, the antimicrobial textile fabric contains only silver. The presence of silver is related to strong antimicrobial activity [
176]. In comparison, the textile offered for shielding application also contains copper and phosphorous on the sample surface. The presence of copper is most likely due to its high electric conductivity, supporting the shielding of electrosmog. The presence of phosphorous can be related to corrosion protection to prevent the oxidation of the copper-containing coating into non-conductive copper oxide. Furthermore, a modification of the ductility of copper by the addition of phosphorous is reported [
177,
178].
The next product examples are both from the field of electrosmog shielding (
Figure 37 and
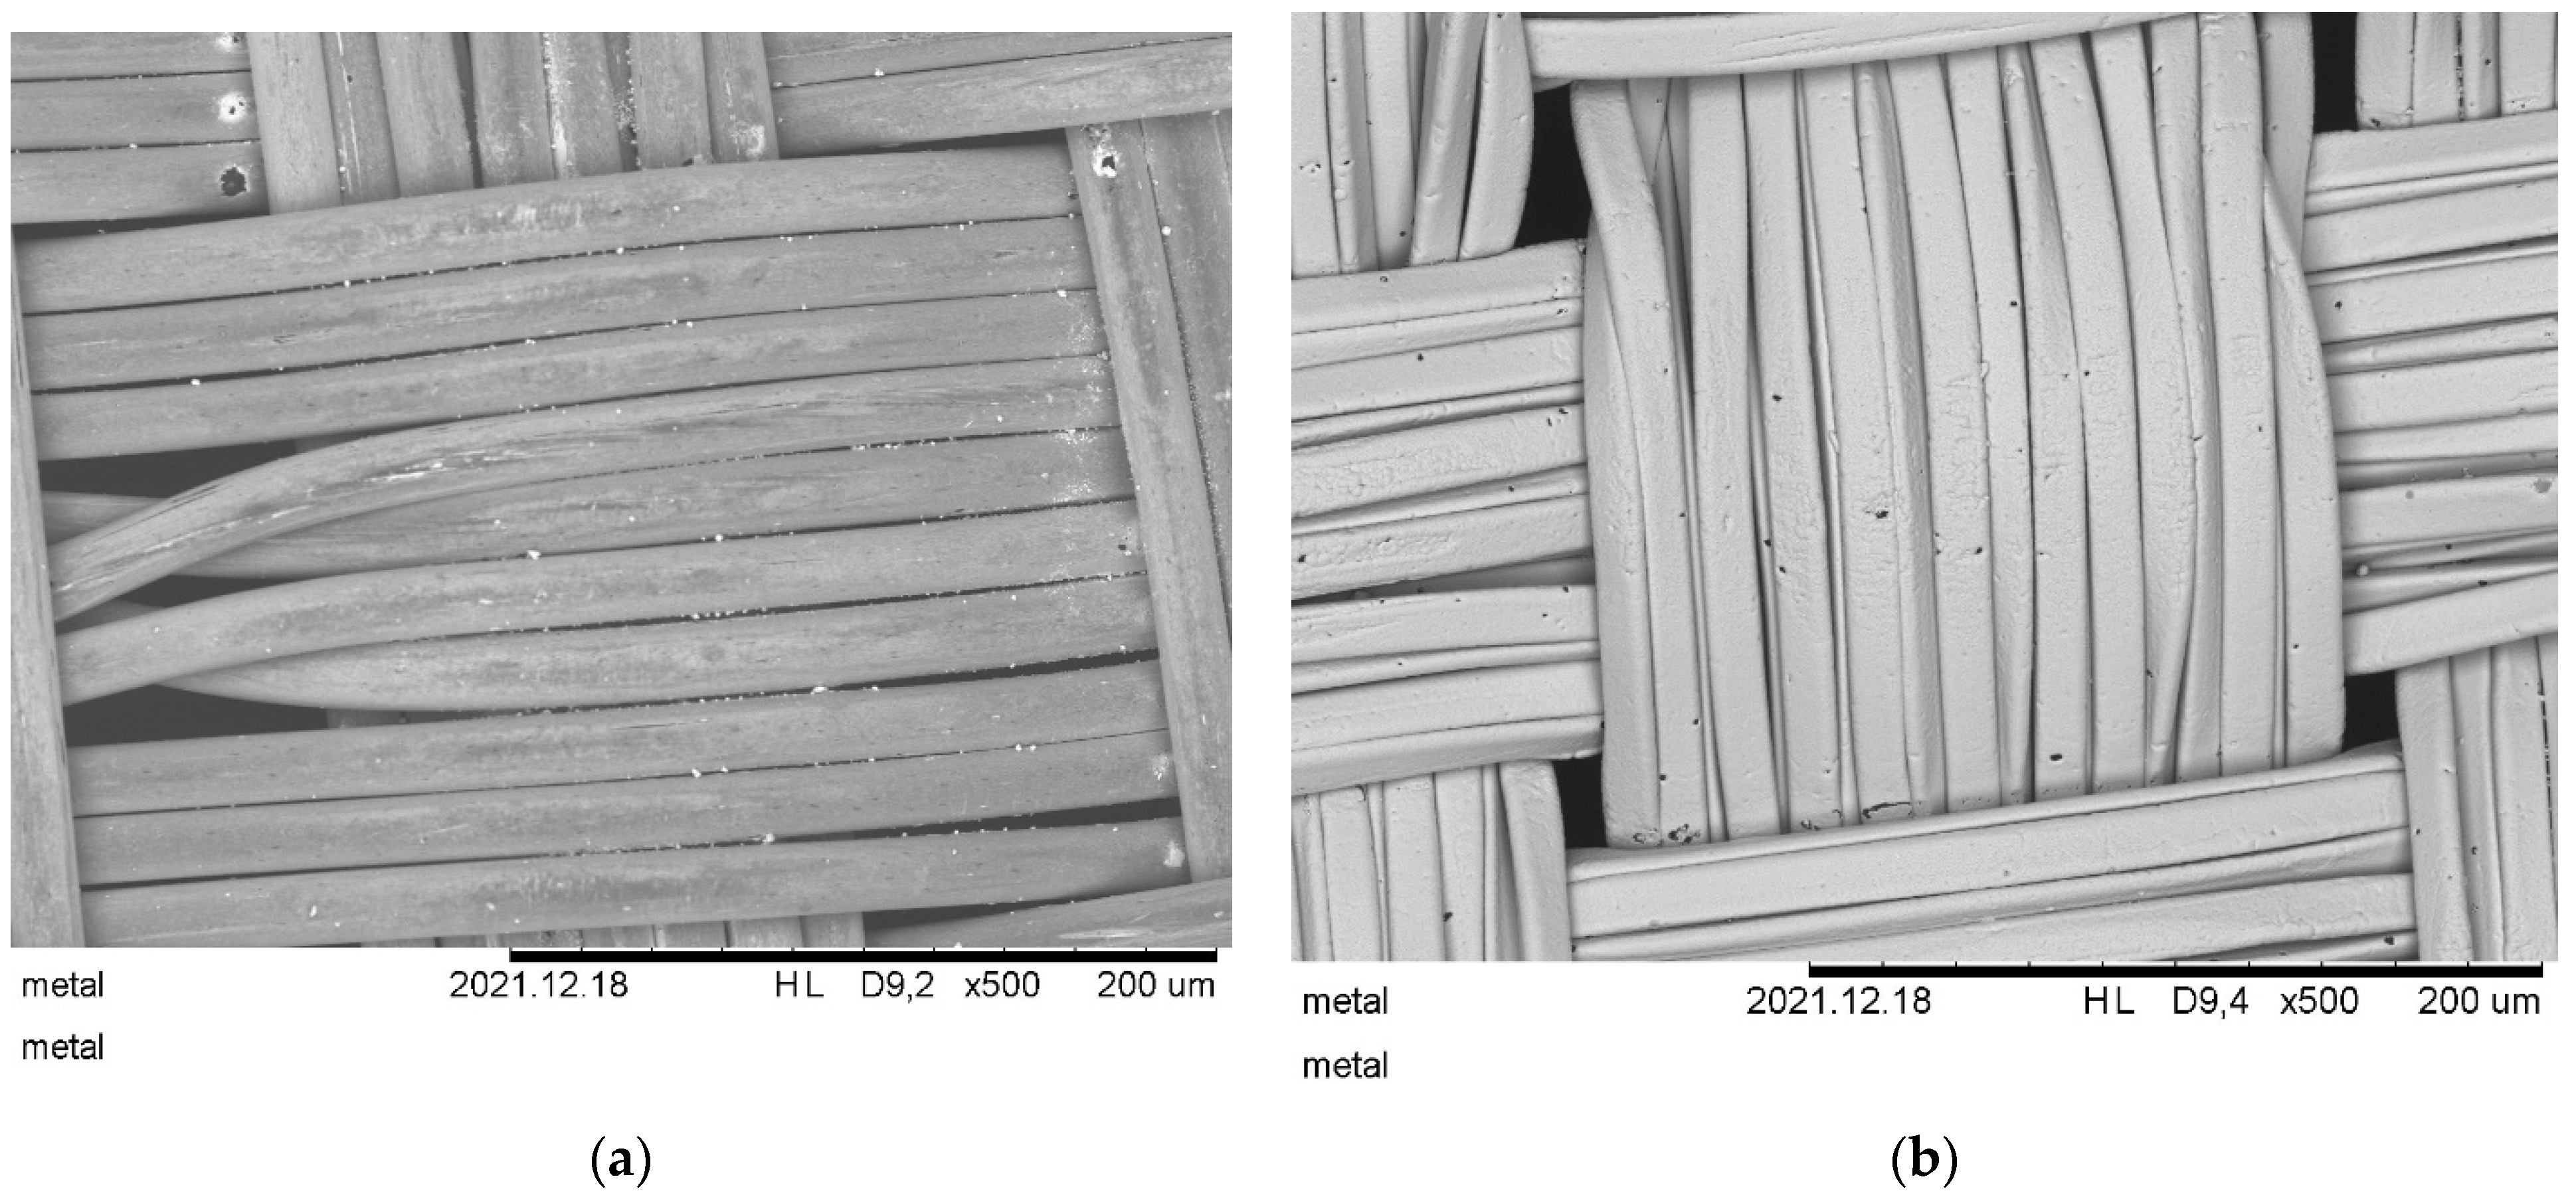
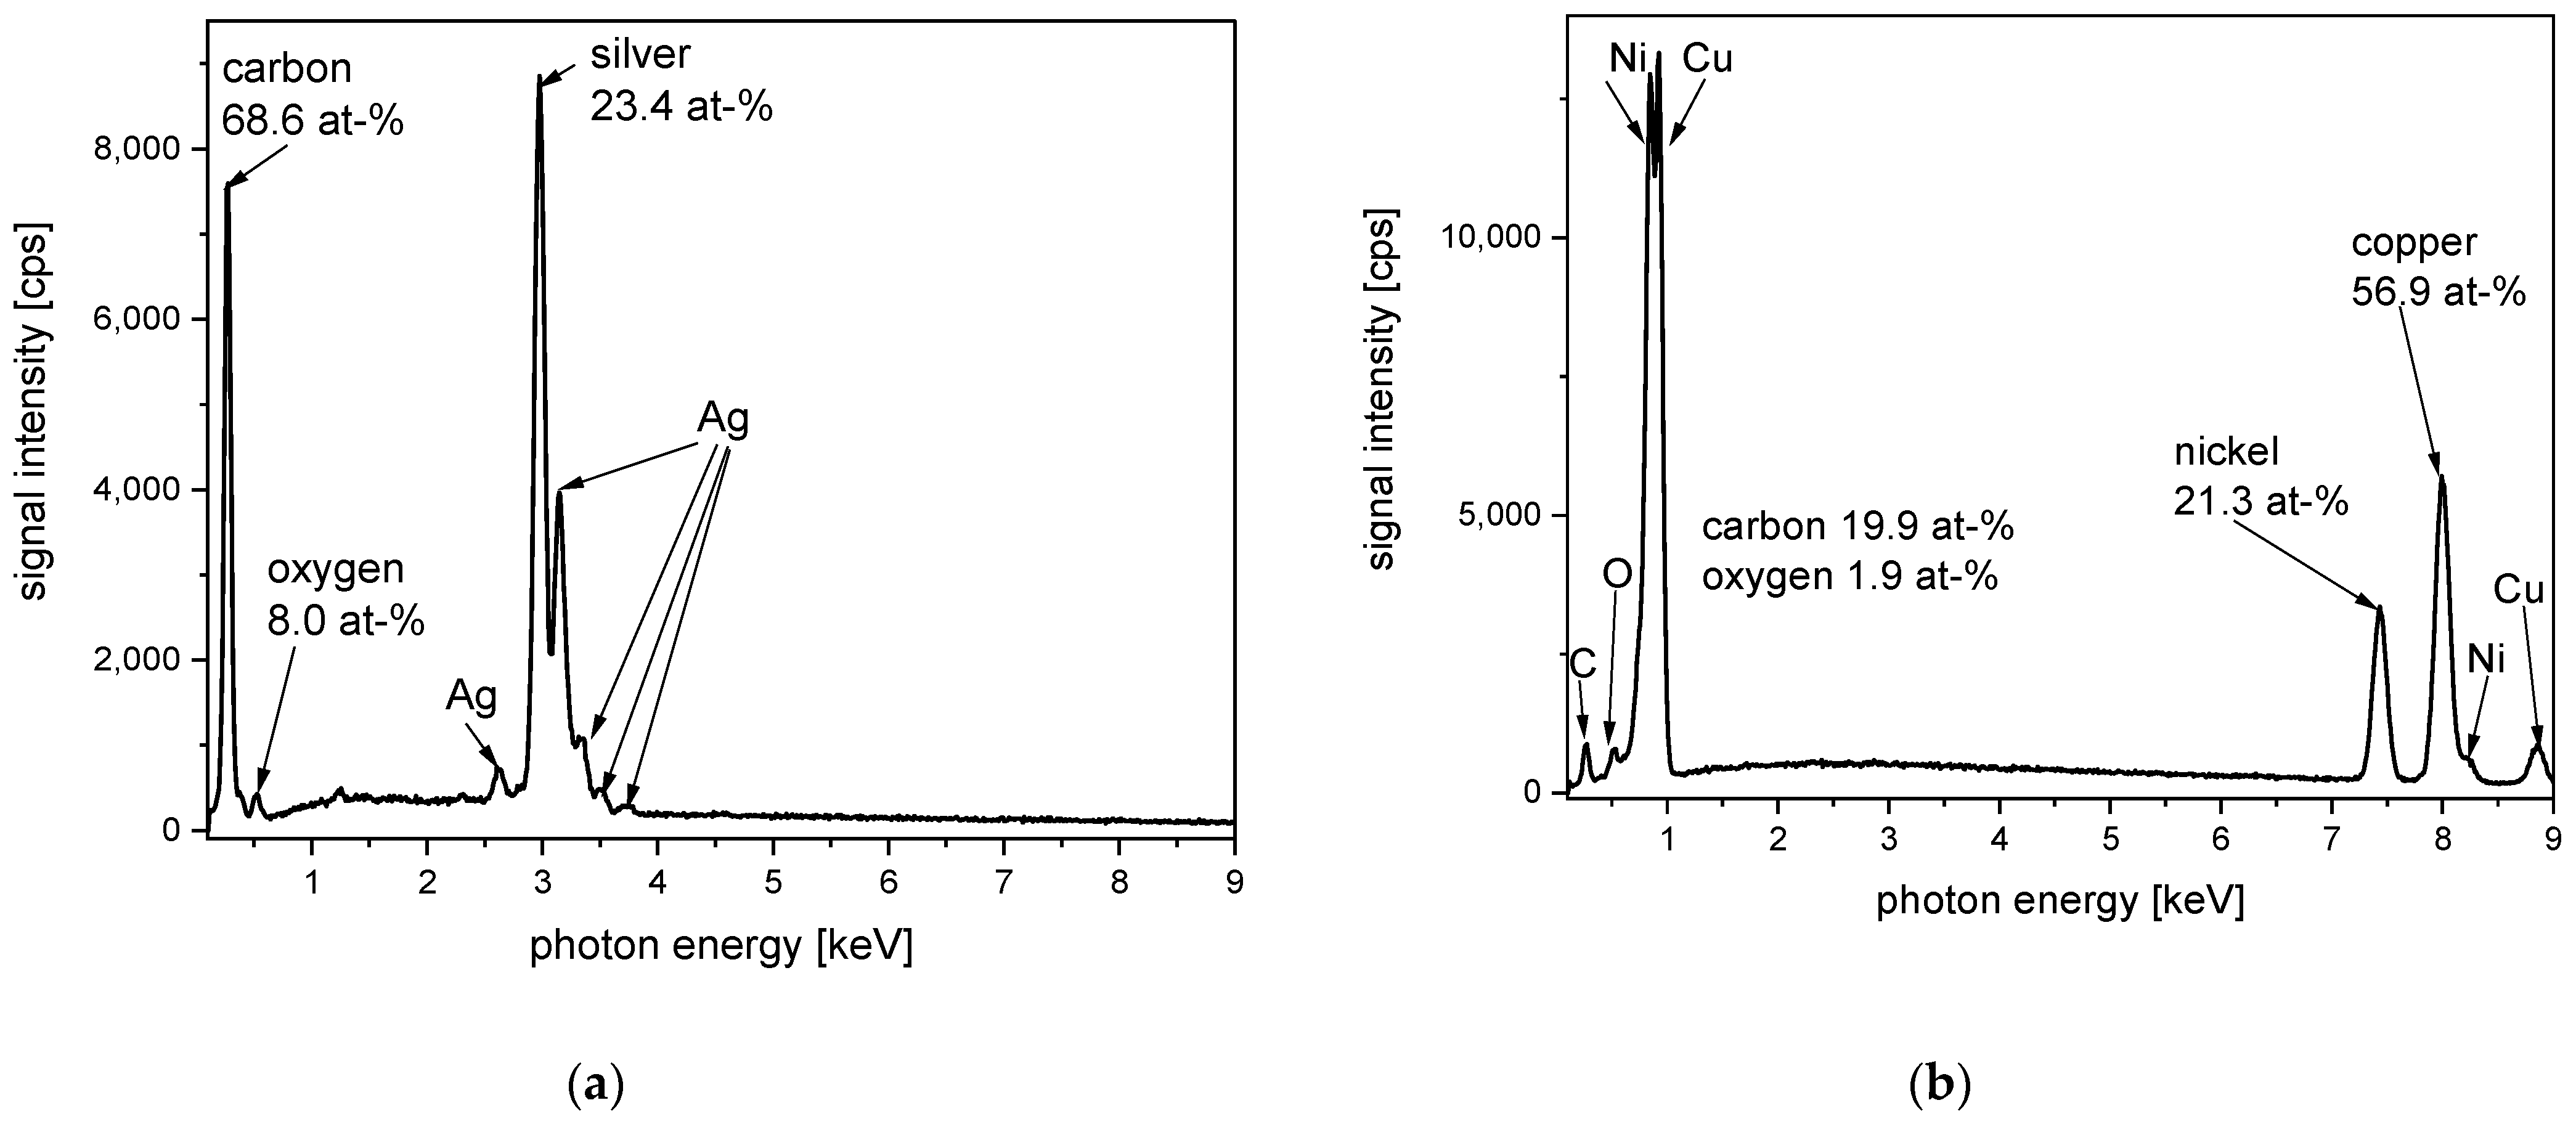
Figure 38). At those samples, the complete fabrics are coated by metal layers of different compositions. With this complete coating, a strong shielding against microwaves up to 80 dB can be reached according to supplier information. As is visible in the SEM images, the metal coating covers the complete fabric evenly (
Figure 37). By view of the EDS spectra, it is clear that the coatings are of different metal compositions (
Figure 38). For sample (a), the coating is completely silver-based. Sample (b) contains a coating from copper and nickel. This coating can be described as an alloy in a certain way, similar to gold bronze materials.
Figure 39 also presents a product example from electrosmog shielding. According to supplier information, this fabric is completely made up of metalized polyamide fibers. However, a polymer coating is also applied in addition to the metalization. This coating also contains silicon-based components. The detected phosphorous can be related to the introduction of flame-retardant properties or as part of a corrosion protective component for the copper/nickel coating.
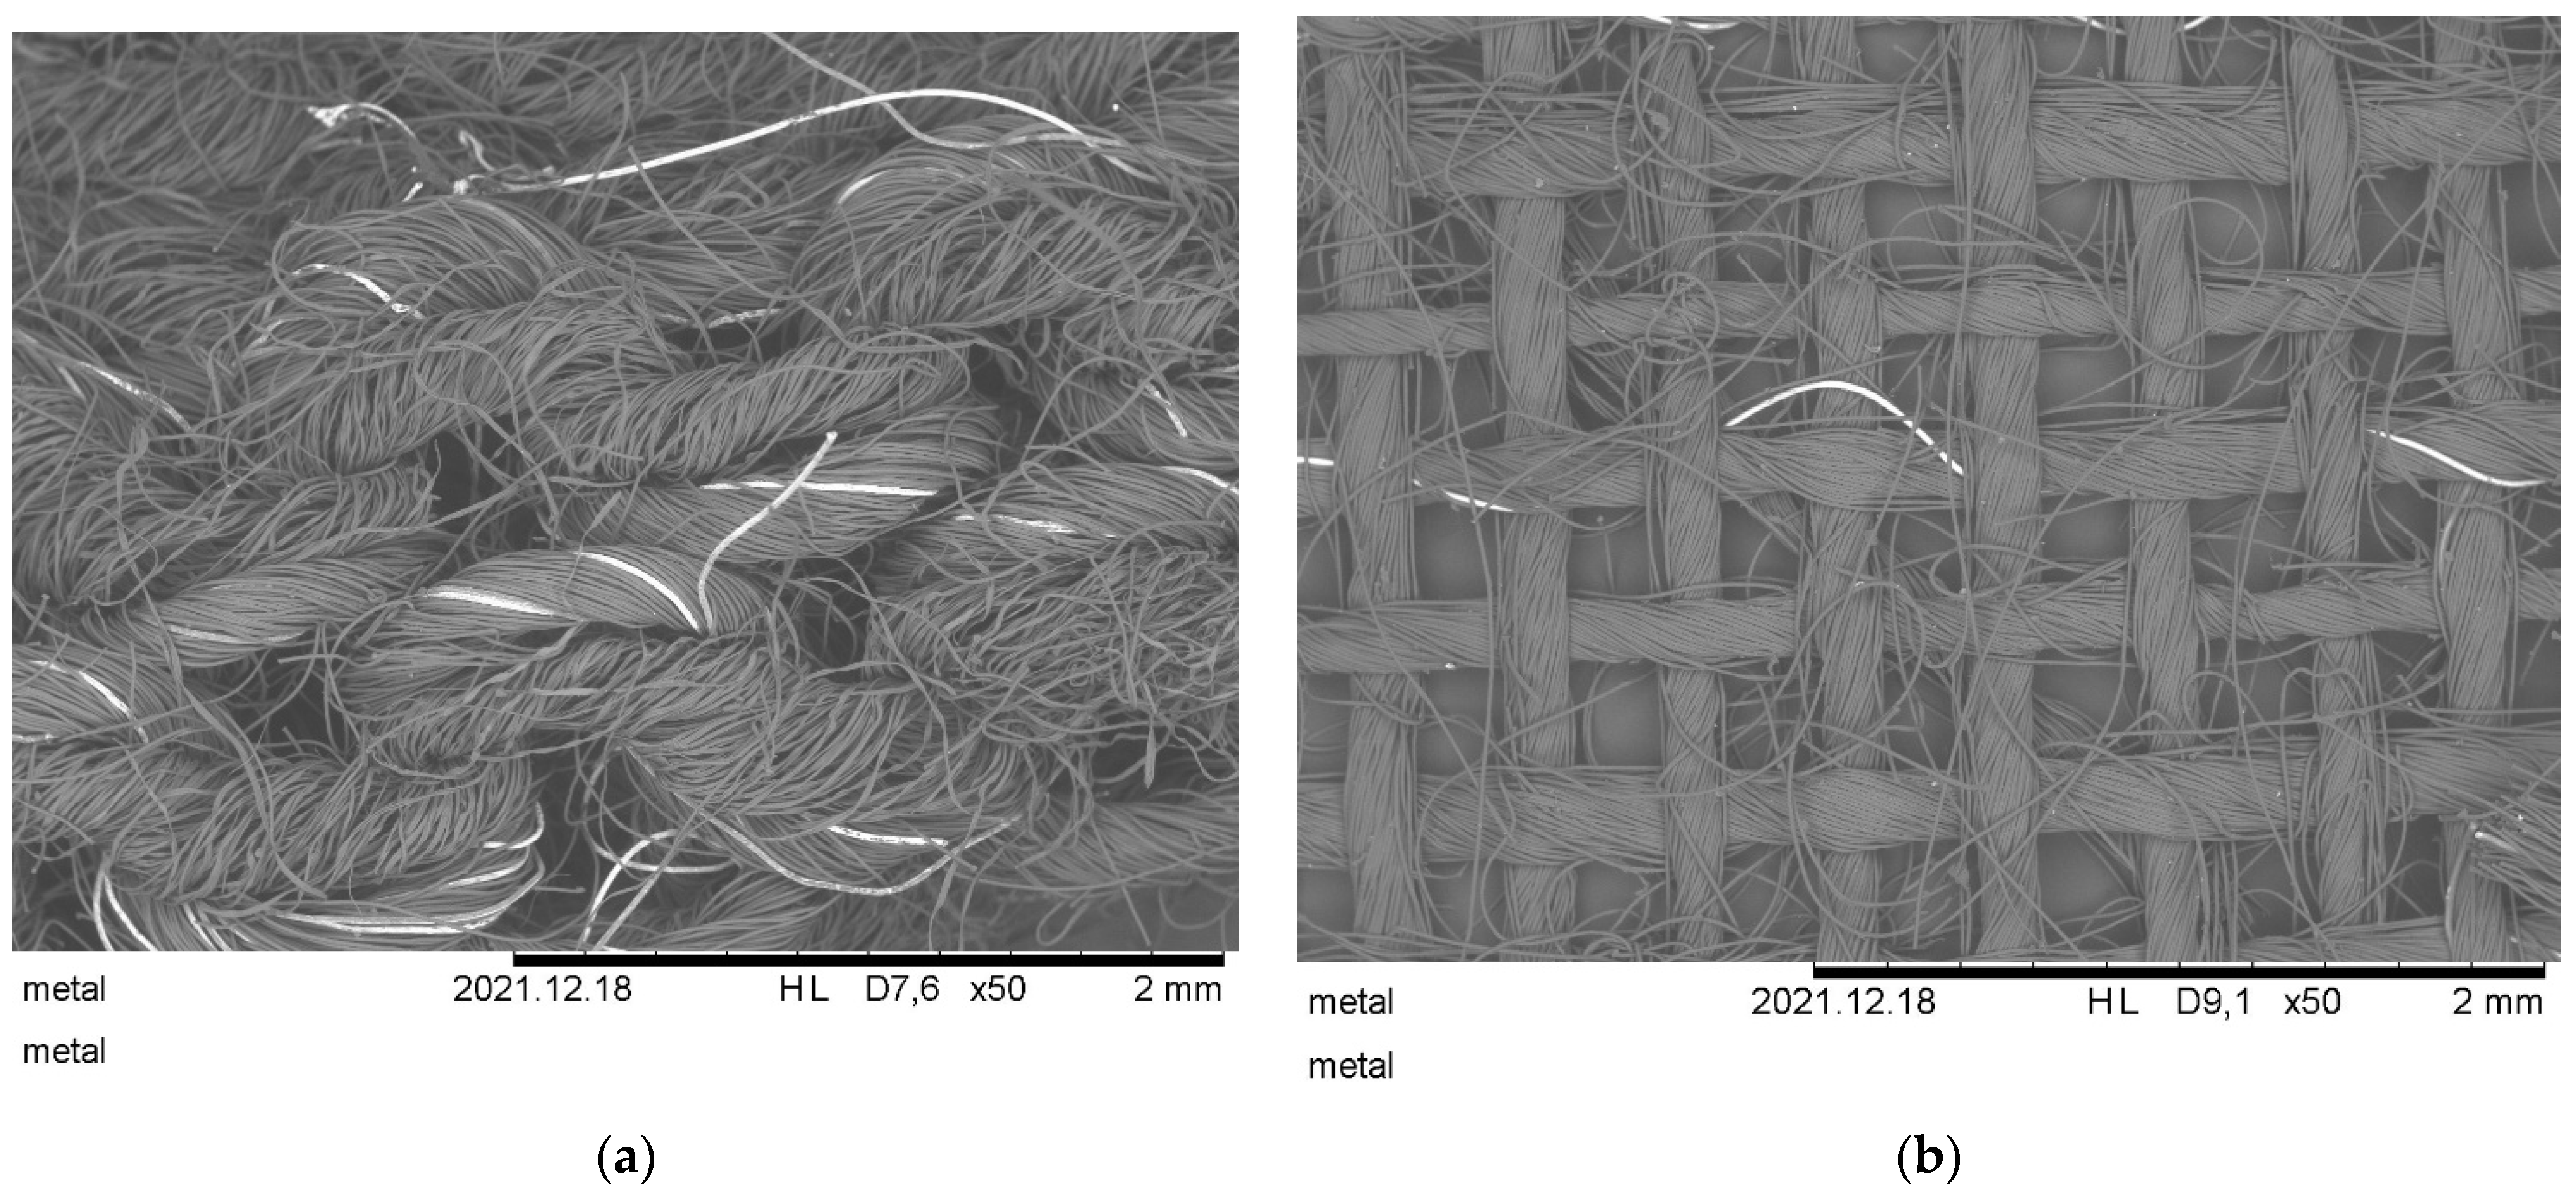
Instead of using coated fibers or fabrics, complete metal fibers can also be introduced in textile fabrics [
156,
179]. For this type of product, an example is given here by a product using steel fibers for the realization of electrosmog shielding (
Figure 40 and
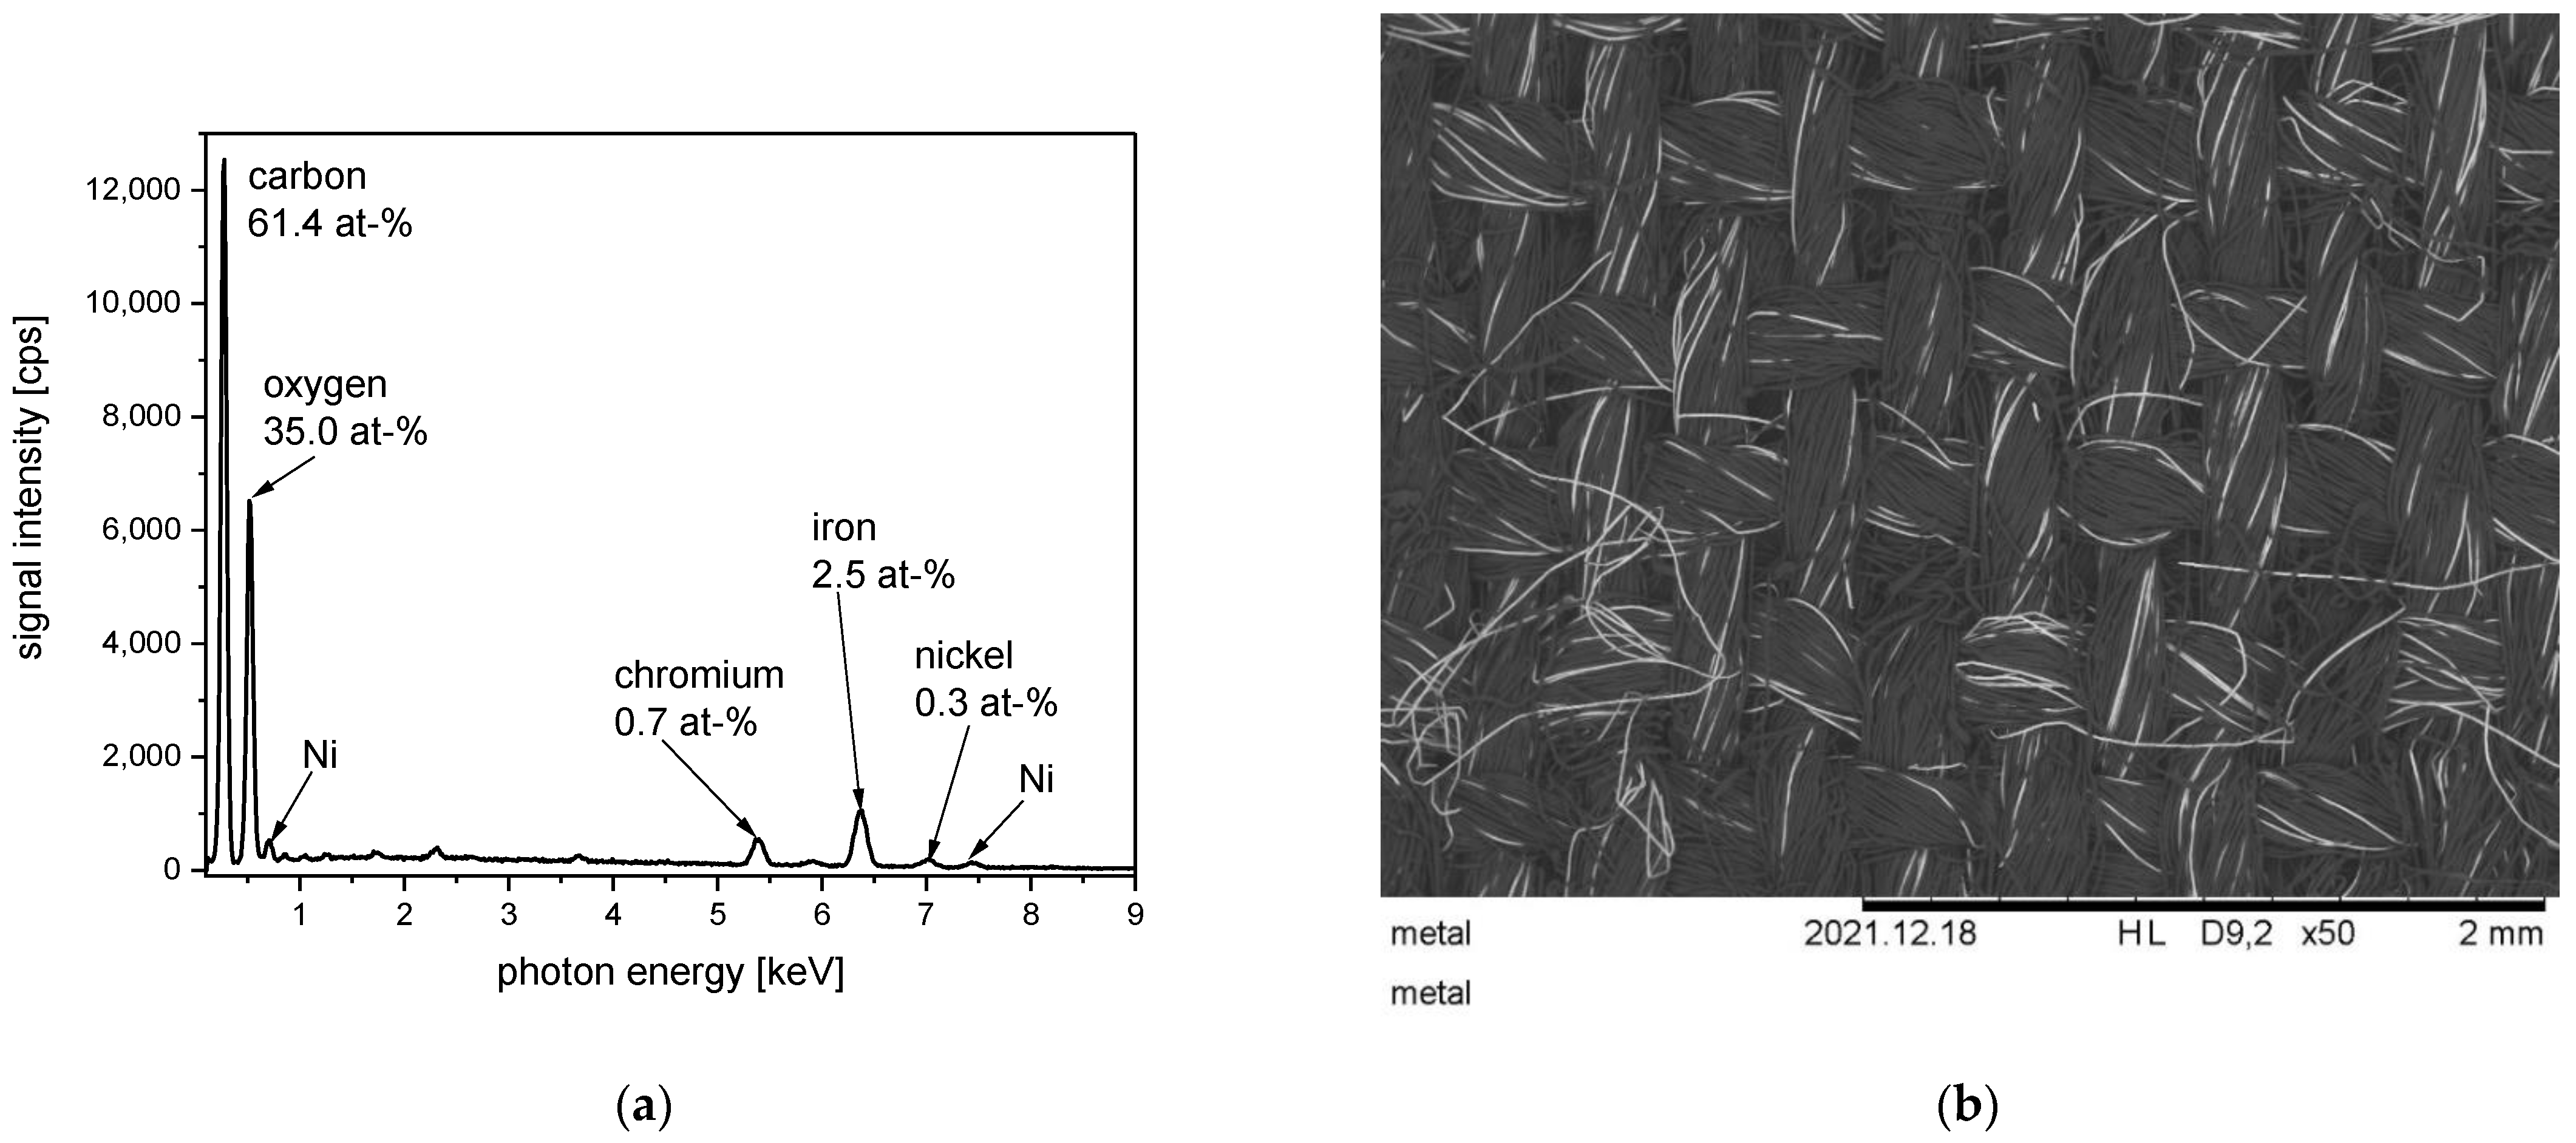
Figure 41). The related EDS spectrum clearly exhibits signals for the three metals iron, chromium, and nickel (
Figure 40). These metals are related to the composition of stainless steel. Furthermore, in the SEM image, these fibers are clearly visible, due to the materials contrast in the SEM-method for elements containing higher atomic weight.
To illustrate the distribution of chemical elements and the material contrast more in detail, SEM images are taken in higher magnification and are compared to EDS mappings (
Figure 41). The difference between iron-containing steel fibers and carbon-containing cotton fibers is demonstrated.
The next product example for metallized textiles is given in
Figure 42 with an aluminum-coated fabric. Such aluminum-coated fabrics are often used for heat management purposes, because of the strong reflectivity of aluminum for visible and infrared light. A window coverage made from such a fabric can avoid the unwished warming of a building by reflecting the heat radiation from the sun [
180]. Besides aluminum, this product also contains phosphorous in small amounts. The phosphorous is probably added to prevent the unintended oxidation of aluminum on the metal surface, which would decrease the reflectivity drastically [
181,
182].
The last example in this review is a catalytic active textile material able to convert CO to CO
2 at room temperature. A polypropylene melt blown is covered with TiO
2 nanoparticles, and the composite material is subsequently coated with gold via a PVD process. The triple interface between the gas phase, TiO
2, and gold is the catalytic active site. In the SEM observation and EDS mapping (
Figure 43), the distribution of titanium and gold is clearly visible and structural differences are evident. The titanium distribution is strongly correlated with the location of the particles visible in the SEM image, raising the suspicion that the particles are agglomerated. However, the local distribution of gold is much more even, which is expected due to the PVD process used to deposit the metal.
Although the resolution of the instrumentation is not sufficient to identify single TiO2 nanoparticles or even the smaller gold depositions, valuable information about the sample composition can be derived from such analytics.
9. Summary and Conclusions
The concurrent evaluation of SEM micrographs and EDS measurements gives valuable information on textile materials and especially high-performance and functional fiber materials. These materials are in fact fascinating and exhibit outstanding properties in the areas of mechanical strength, flame-retardant properties, chemical stability, antimicrobial properties, and electric conductivity. In our modern world, the demand for high-performance and functional materials is high, and will probably increase in the future. Nevertheless, three issues have to be considered that could significantly influence the positive perspective of a certain high-performance material. First, the costs of high-performance and functional materials are significantly higher compared to conventional materials. Only if the benefit is absolutely clear will the consumer accept the costs and use the functional materials. Second, additional to the advantageous properties of high-performance materials, each of those materials also exhibits certain disadvantageous properties. These disadvantageous properties, like the low light stability of aramid fibers, limit the use of these fibers to certain areas. Third and most important, the use of specific fiber materials can be restricted by legal regulations, even if the material properties are excellent. There is probably a serious risk that several functional fiber materials will not be used in the future due to concern for health safety and environmental issues leading to drastic legal restrictions. The current review article reports additionally on selected material properties, and information on sample structure and chemical composition is reported. Although EDS can identify only chemical elements and not their connection among other forming molecules, the correlation of different EDS mappings can give helpful advice to estimate molecular compositions. For example, finding the same spatial distribution of silicon and oxygen but different from the distribution of other elements would place a high amount of suspicion on present SiO2 or related silicates in the sample. For this, the presented paper is a useful tool for persons who are working in fiber analytics, especially in the field of high-performance and functional fiber materials. This conclusion statement is especially valid, because in recent years, there has been a strong development of SEM and EDS devices that can be easily operated. These devices allow even less skilled persons to access records of excellent SEM images and EDS spectra. However, the evaluation and interpretation of the recorded data are often still demanding. With this background, the presented and summarized data on high-performance and functional fiber materials are helpful for the analysis of unknown fiber materials.


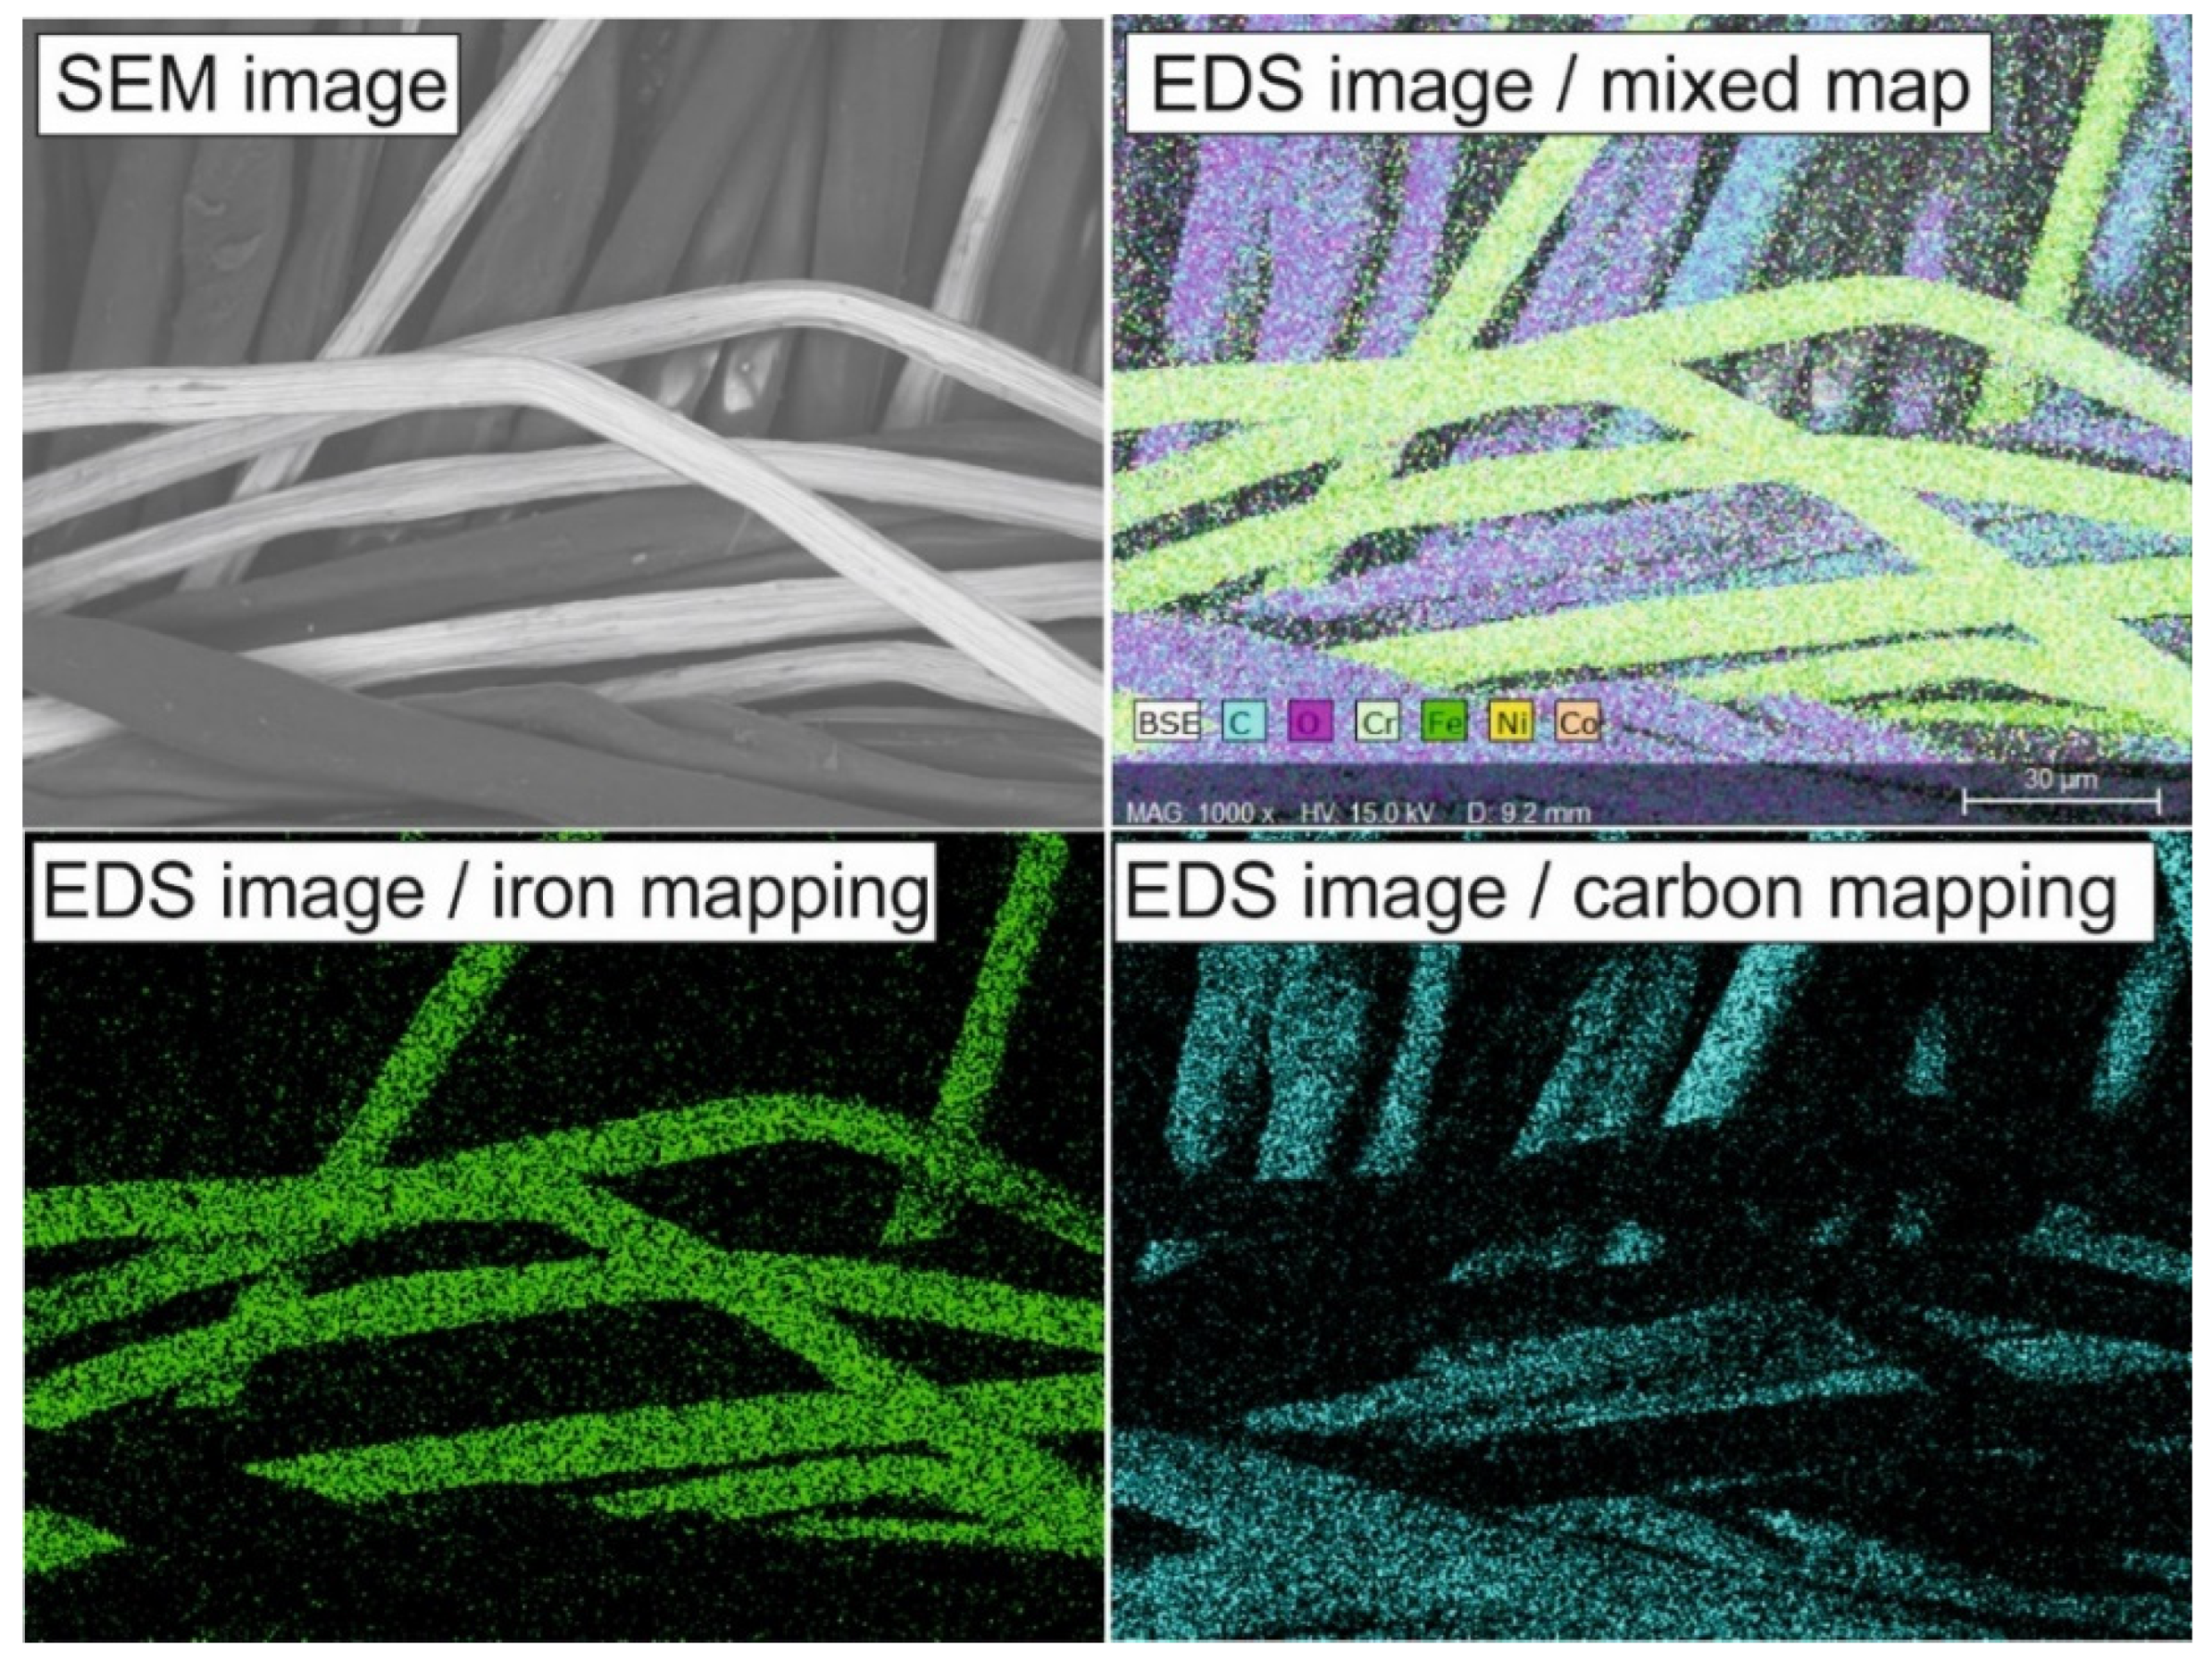
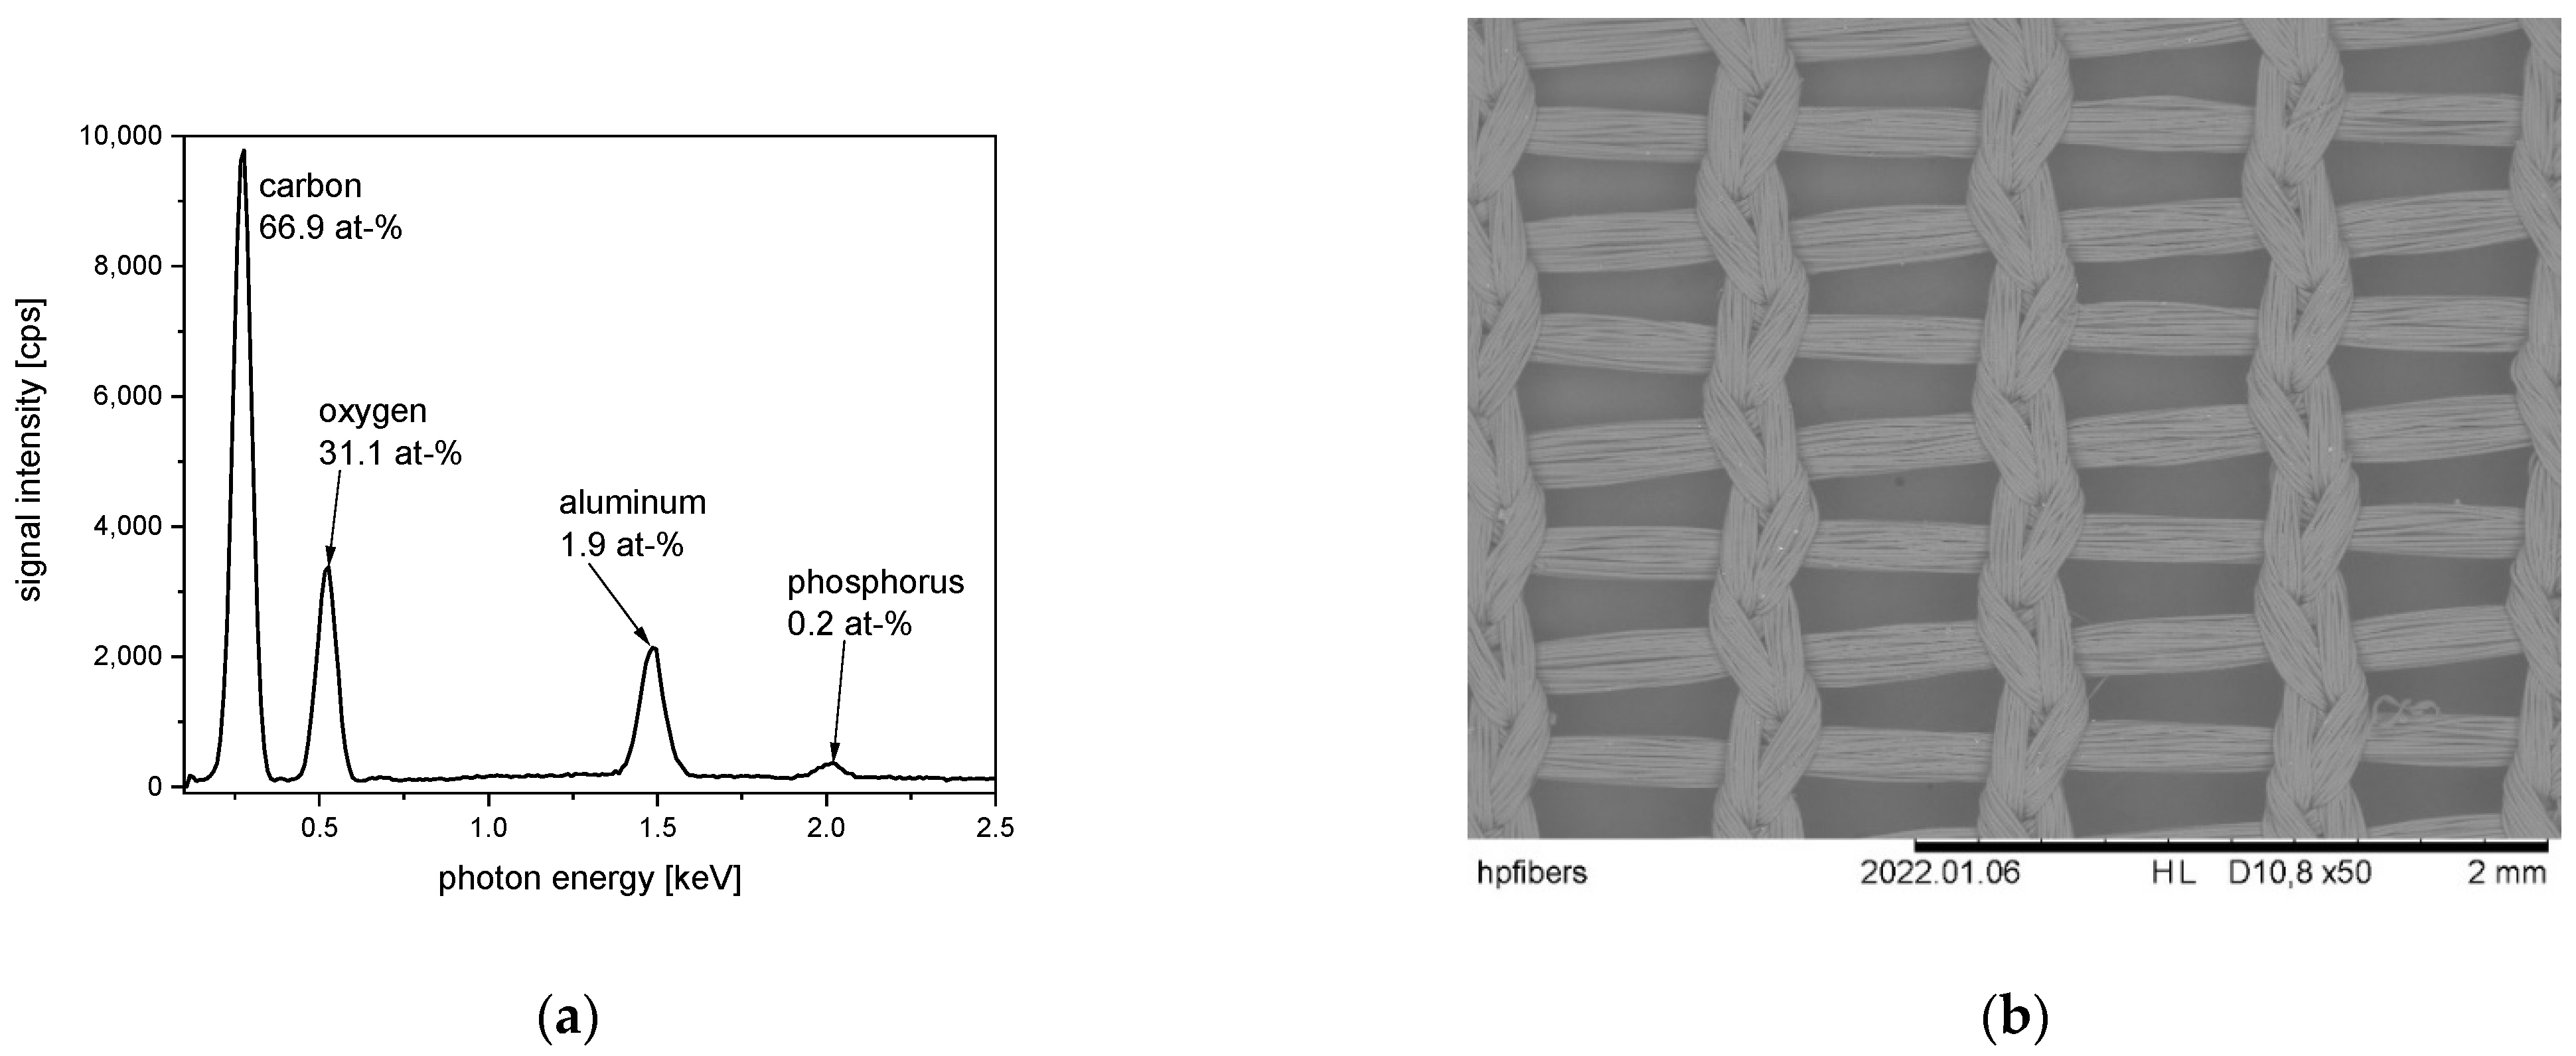
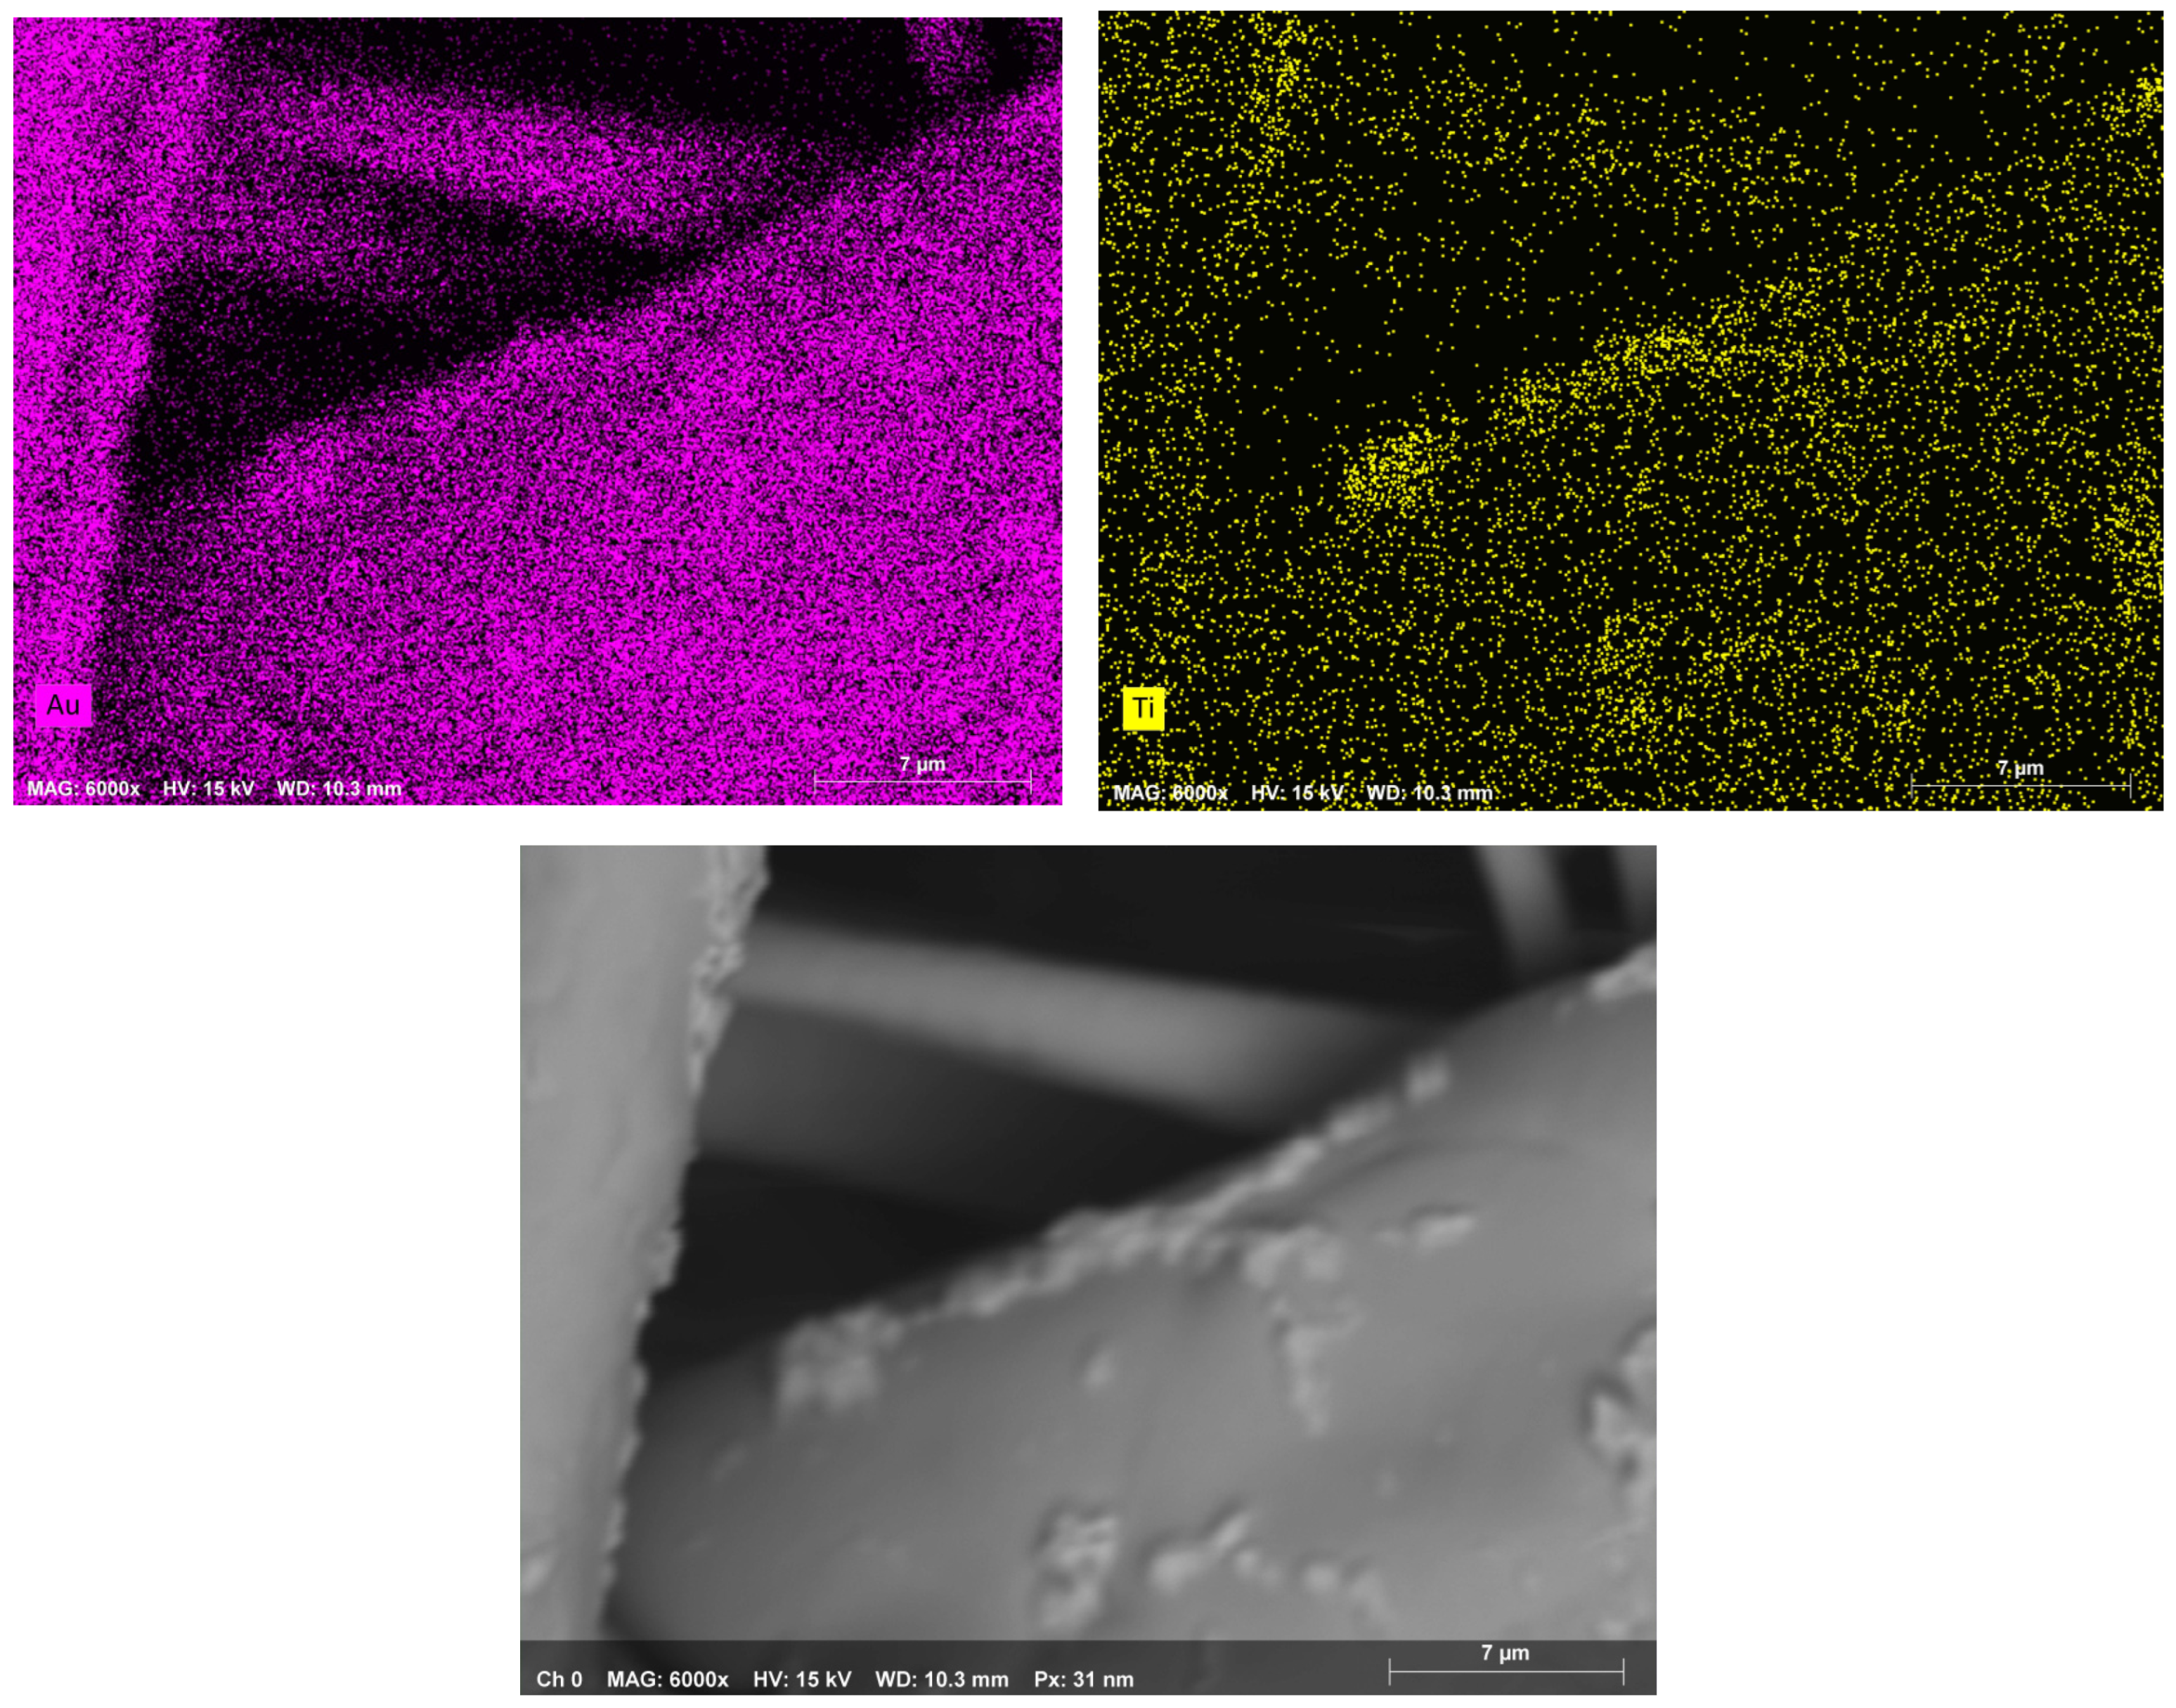