
Forecasting Installation Capacity for the Top 10 Countries Utilizing Geothermal Energy by 2030

1
Department of Electrical and Computer Engineering, Oakland University, Rochester, MI 48306, USA
2
Department of Control Engineering, College of Electronic Technology, Bani Walid 322, Libya
*
Author to whom correspondence should be addressed.
Thermo 2022, 2(4), 334-351; https://0-doi-org.brum.beds.ac.uk/10.3390/thermo2040023
Submission received: 22 August 2022
/
Revised: 1 October 2022
/
Accepted: 5 October 2022
/
Published: 9 October 2022
(This article belongs to the Special Issue Hybrid Energy Recovery, Storage and Utilization in Buildings and Industrial Applications)
Abstract
:Foresight of geothermal energy installation is valuable for energy decision-makers, allowing them to readily identify new capacity units, improve existing energy policies and plans, expand future infrastructure, and fulfill consumer load needs. Therefore, in this paper, an improved grey prediction model (IGM (1,1)) was applied to perform the annual geothermal energy installation capacity prediction for the top 10 countries based on installed power generation capacity evaluated at the end of 2021, namely the United States, Indonesia, Philippines, Turkey, New Zealand, Mexico, Italy, Kenya, Iceland, and Japan, for the next nine years for the period from 2022 through 2030. These data can be used by future researchers in the field. Separately, datasets from 2000 to 2021 were collected for each country’s geothermal energy installation capacity to build a model which can accurately predict the annually geothermal energy installation capacity by 2030. The IGM (1,1) model used a small dataset of 22 data points, with one point denoting one year (i.e., 22 years), to predict the capacity of geothermal energy installations for the next nine years. Following that, the model was implemented for each dataset in MATLAB, where appropriate, and the model accuracy was evaluated. Ten separate geothermal energy installation capacity datasets were used to validate the improved model, and these datasets further demonstrated the overall improved model’s accuracy. The results prove that the prediction accuracy of the IGM (1,1) model outperforms the benchmark conventional GM (1,1) model, thereby enhancing the overall accuracy of the GM (1,1) model. The IGM (1,1) model ensures error reduction, suggesting that it is an effective and promising tool for accurate short-term prediction. The results reveal the 2030 geothermal energy installation capacity rankings.
1. Introduction
Conventional fossil fuel energy production is expensive, limited, and recognized as the primary cause of climate change and air pollution. Thus, switching to clean, renewable energy sources is imperative owing to their significant advantages. These advantages include efficiency, reliability, sustainability, cost-effectiveness, low maintenance, and environmental friendliness as they decrease greenhouse gas emissions. For instance, geothermal energy technology is regarded as one of the most promising renewable energy sources because it relies on the Earth’s relatively constant temperature to drive steam turbines, which in turn generate electricity. In addition, it is available all year and is unaffected by climatic conditions, which typically stabilizes energy output to fulfill the baseload energy demand, unlike other renewable energy sources such as solar, hydro, and wind energy. Furthermore, geothermal energy is less expensive than fossil fuels and even other renewable energy sources [1,2,3,4,5]. Geothermal energy technology can be installed vertically almost anywhere; however, due to the high expense of drilling, which typically goes hundreds of meters below the earth’s surface, geothermal energy technology is more costly to install in dense mediums such as rock or stone mountains. Therefore, it is preferable to choose a suitable geological site with strong thermal and drilling properties, which lowers capital costs. Moreover, it is preferable if it is placed in close proximity to the structure using its energy outputs, saving money on expensive transmission lines that lose energy when traveling long distances. It is worth noting that continuous monitoring and control are important to ensure the system operates efficiently and, therefore, can supply the desired output energy to meet electrical demands. Further improvements in the existing parameters could potentially increase the accelerating production load.
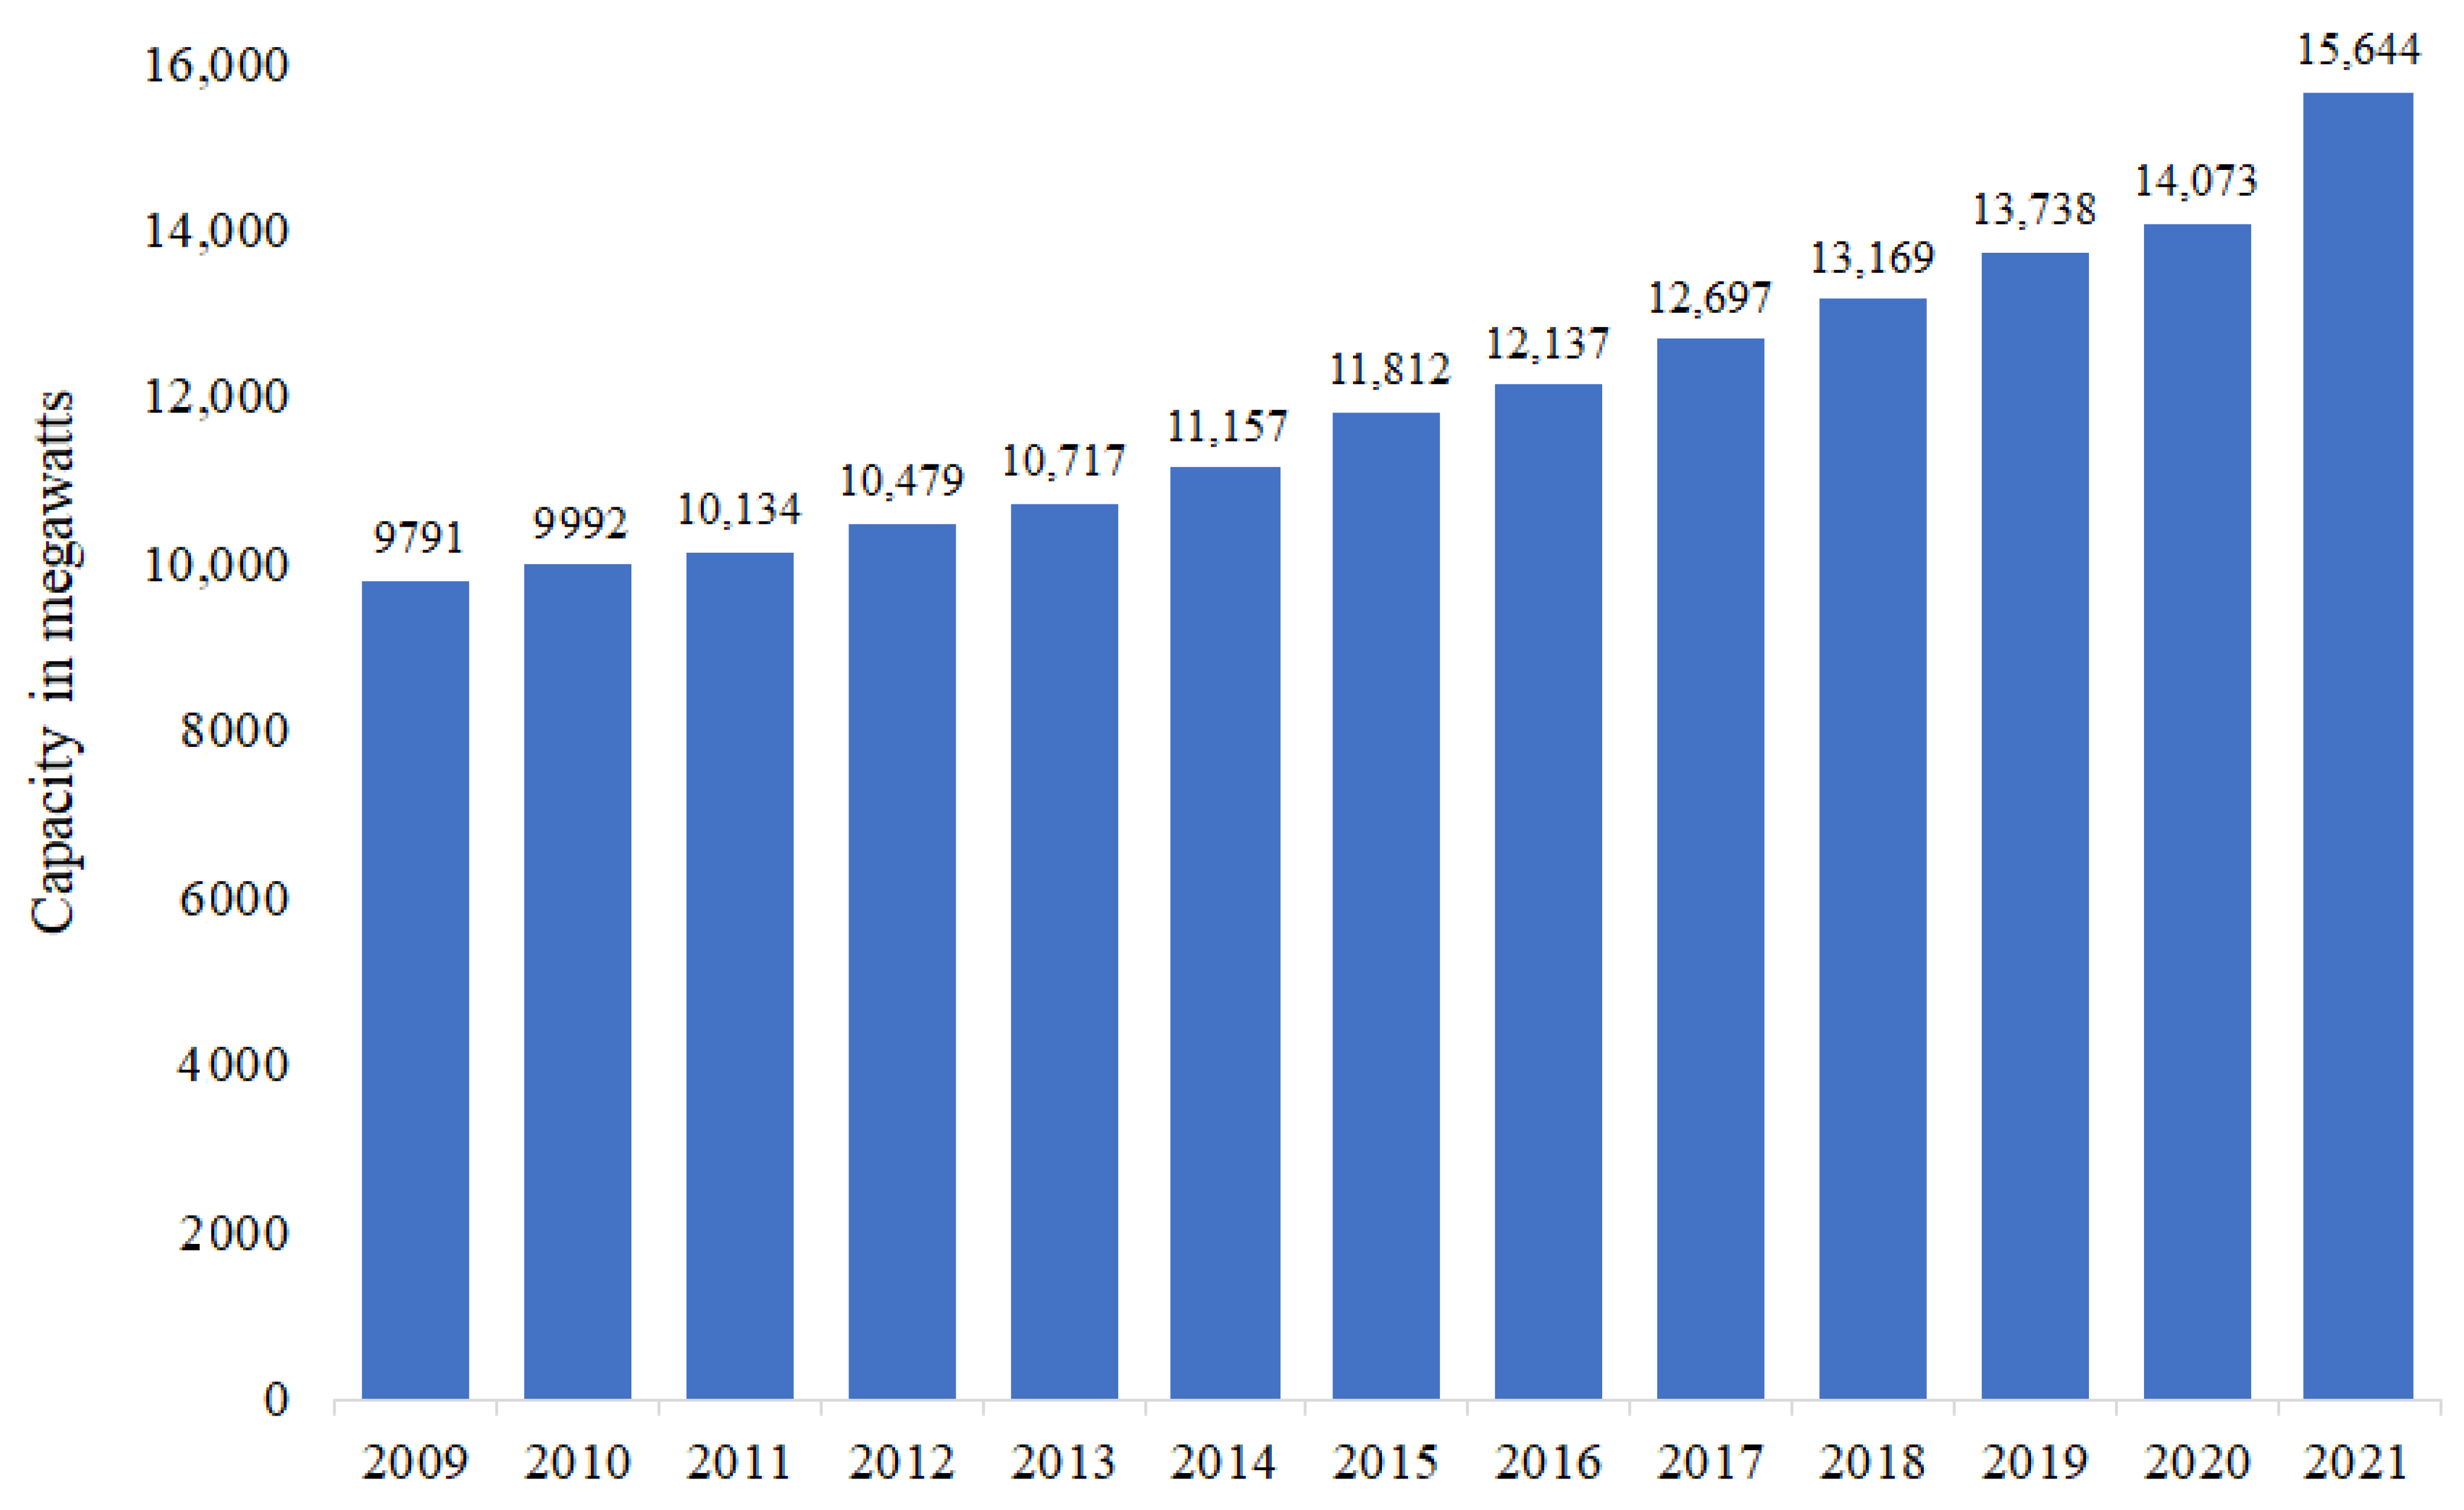
Even though the initial capital cost is relatively high, geothermal utilization has gradually gained global popularity, especially for direct-use applications (i.e., heating, cooling, etc.) and electricity generation. The number of annual geothermal unit installations reflects this growing demand. Since 1913, geothermal energy has been utilized to generate hundreds of megawatts (MW) of electricity, and this production has increased in subsequent decades. Specifically, geothermal energy’s installed capacity has gradually increased over the past 10 years (2009–2021), reaching 15,644 megawatts (MW) in 2021. This usage has been spread across 27 countries, 10 of which account for approximately 94.52% of the total existing capacity. The top 10 countries in 2021 which have the largest installed capacity of geothermal energy (in MW) are the US (3722), Indonesia (2276), Philippines (1918), Turkey (1710), New Zealand (1037), Mexico (963), Italy (944), Kenya (861), Iceland (754), and Japan (603) (see Table 1). Figure 1 demonstrates the geothermal energy installation capacity worldwide from 2009 to 2021 (in MW) [6,7,8,9,10].
Bertani Ruggero [11] forecasted the worldwide geothermal energy power generation installation capacity for 2025, 2030, and 2050, and the anticipated results were found to be 19.10, 51, and 70 GW, respectively. Şahin [12] forecasted Turkey’s total installed capacity of power generation resources, including geothermal, thermal, solar, and wind energy, from 2017 to 2021 using capacity factor estimation. Klein [13] predicted geothermal installation capacity of geothermal power generation in Japan was anticipated to be 0.55 GW in 2030. Zeng et al. [14] applied the diffusion velocity model to predict the installation capacity of geothermal energy worldwide from 2012 to 2030. In addition, Chang and Li [15] proposed a dynamic linear programming model to predict the power generation capacity, 15,156 MW of geothermal energy, that is anticipated to be built between 2010 and 2030. In sum, researchers have utilized numerous methods to forecast the world’s geothermal energy installation capacity.
The grey prediction model (GM) is a mathematical model that can be used to characterize an unknown system behavior using a small data size, which contains a minimum of four data points. The grey prediction model was introduced by Dan in 1982 and remains widely applied in uncertain systems with incomplete information and discrete data for short time series prediction [16]. For the GM () model, represents the order of the differential equation and represents the number of variables that can be predicted. For instance, the GM (1,1) model is a first-order differential equation to predict one variable. The GM (1,1) model is regarded as the most utilized model in grey system theory for short time series prediction because of its significant advantages, simple computation, high computational efficiency, and the capability to characterize an unknown system with small-sized dataset [17,18]. Hence, the GM (1,1) model so far has been applied to several research fields, and it has promising accurate prediction results when it is enhanced [19,20,21,22,23]. The GM (1,1) model relies on the system dataset to make predictions; therefore, the dataset must be free of negatives, randoms, and anomalies, preferably consistent, allowing the model to accurately predict. For instance, Salhein et al. [21] used three different datasets in terms of consistency to validate the IGM (1,1) model accuracy. The results demonstrated that the IGM (1,1) model achieved the best performance when the data were more consistent than others. It is important to note that the model prediction could perform better with a more consistent dataset. The GM (1,1) model has two parameters which are defined as being the developing coefficient and being grey control quantity; they are regarded as critical to its performance.
Since the GM (1,1) model’s prediction accuracy is limited and should be improved, some scholars made the following improvements to increase its accuracy: Hsu [24] improved the prediction accuracy of the GM (1,1) model by using the Markov chain model and Fourier residual model and applied the improved model to predict the global integrated circuit industry. It was found that the improved model increased the prediction accuracy of the original GM (1,1) model. Wang et al. [25] enhanced the prediction accuracy of the traditional GM (1,1) model by optimizing the initial condition. According to the results, the modified GM (1,1) model was more accurate than the traditional GM (1,1) model. Furthermore, Hsu and Chen [26] further improved the GM (1,1) model by combing artificial neural network (ANN) sign estimation with residual modification, which was applied to perform the power demand forecasting of Taiwan. The results showed that the improved model was more accurate than the original GM (1,1) model. The remnant model and L’Hopital’s rule were incorporated into the conventional GM (1,1) model to improve its performance [27]. Wind speed data from Palmerston North, New Zealand, were employed to evaluate the improved model. According to their results, the new model enhanced the prediction validity and performance of the conventional GM (1,1) model by 98% and 9%, respectively. Salhein et al. [21] proposed the improved grey prediction model (IGM (1,1)) which was based on optimizing the current predicted value by subtracting the error between the previous accumulated time response of the GM (1,1) model and the previous background value. The IGM (1,1) model was applied to perform the prediction of the output temperature of the geothermal heat pump systems (GHPSs) at Oklahoma State University, the University Politècnica de València, and Oakland University. The results indicated that the IGM (1,1) model dramatically enhanced the prediction accuracy of the traditional GM (1,1) model and was more accurate than GM (1,1) model for all datasets used. Yao and Wang [28] improved the accuracy of the GM (1,1) model based on restructuring the background value, which was applied to predict electricity consumption in eastern China. The modified model’s prediction accuracy outperformed the traditional GM (1,1) model. An improved transformed grey model based on a genetic algorithm (ITGM (1,1)) was developed by Hsu [29]; the output of the Taiwanese optoelectronics industry dataset was used to verify the ITGM model accuracy. The ITGM model was more accurate than other applied prediction models. Furthermore, Akay and Atak [30] proposed the grey prediction with a rolling mechanism (GPRM) model, which was based on integrating the rolling mechanism with the conventional GM (1,1) model. Li and Zhang [31] improved the GM (1,1) model by transforming the original data sequence and optimizing the background value. Nevertheless, more improvements are required to increase the GM (1,1) model prediction precision.
Predicting the installation capacity of geothermal energy is important for energy decision-makers, allowing them to readily identify new capacity units, improve existing energy policies and plans, expand future infrastructure, and meet particular consumer load needs. More importantly, applying a prediction model that is accurate, reliable, and performs well with limited datasets could provide valuable information that can be used for the above-mentioned objectives. Therefore, the GM model could be appropriate to forecast the short-term installation capacity of geothermal energy.
This paper aims to predict the annual geothermal energy installation capacity for the top 10 countries, namely the United States, Indonesia, Philippines, Turkey, New Zealand, Mexico, Italy, Kenya, Iceland, and Japan, for the next nine years for the period from 2022 to 2030, using the IGM (1,1) model proposed in [21], to provide data can be used by future researchers in the energy field. The simulations were conducted in MATLAB. Ten datasets were used to validate the IGM (1,1) model, and for each dataset, its performance was compared to that of the conventional GM (1,1) model.
2. Material and Methods
2.1. The GM (1,1) Model
The modeling procedure for the traditional GM (1,1) model is as follows:
The original non-negative data sequence is denoted as
where is the length of the raw data sequence, which is specified as .
Next, the first-order accumulated generating operation (1-AGO) is applied to Equation (1) to generate the accumulative sequence , where the sequence of is derived as
The background value array sequence is expressed as follows:
where , . is a weighting factor . It is specified that .
The GM (1,1) model equation is defined as follows:
where is a time point, is a developing coefficient, and is a grey action quantity. Then, the GM (1,1) model’s parameters are estimated by using the least square method, which is given by
where
The following first-order differential equation, called a whitening equation of , is expressed as
The GM (1,1) model predicted sequence is obtained by solving the differential equation in Equation (4) using inverse 1-AGO, as written in Equation (7):
Applying the IAGO to the yields the predicted sequence , where is the predicted time response of the grey prediction model at time and is the accumulated time response of the grey prediction model at time .
2.2. The Improved IGM (1,1)
Due to the GM (1,1) model producing an inaccurate prediction, its accuracy prediction needs to be improved. Thus, the IGM (1,1) model was proposed to reduce prediction error and improve the overall GM (1,1) model performance. The improved IGM (1,1) model was based on optimizing the current predicted value by subtracting the error between the previous accumulated time response of the GM (1,1) model and the previous background value [21]. The IGM (1,1) model guarantees error reduction, implying that it is a promising approach for making accurate predictions. Consequently, the modeling procedure for the improved IGM (1,1) model is detailed as follows:
According to the GM (1,1) model Equation (4), and the predicted sequence Equation (7), the error increases as the background value generates sequences to accumulate the general predicted sequence . So, Equation (8) defines the predicted value’s error.
where is the predicted value’s error at time point , is the accumulated time response of the GM (1,1) model at time point (), and is the previous background value at time point (). Implementing the background value Equation (3) and the general predicted sequence Equation (7) into Equation (8) renders the following:
Substituting the predicted value’s error into Equation (7) renders the IGM (1,1) model predicted sequence expressed as follows:
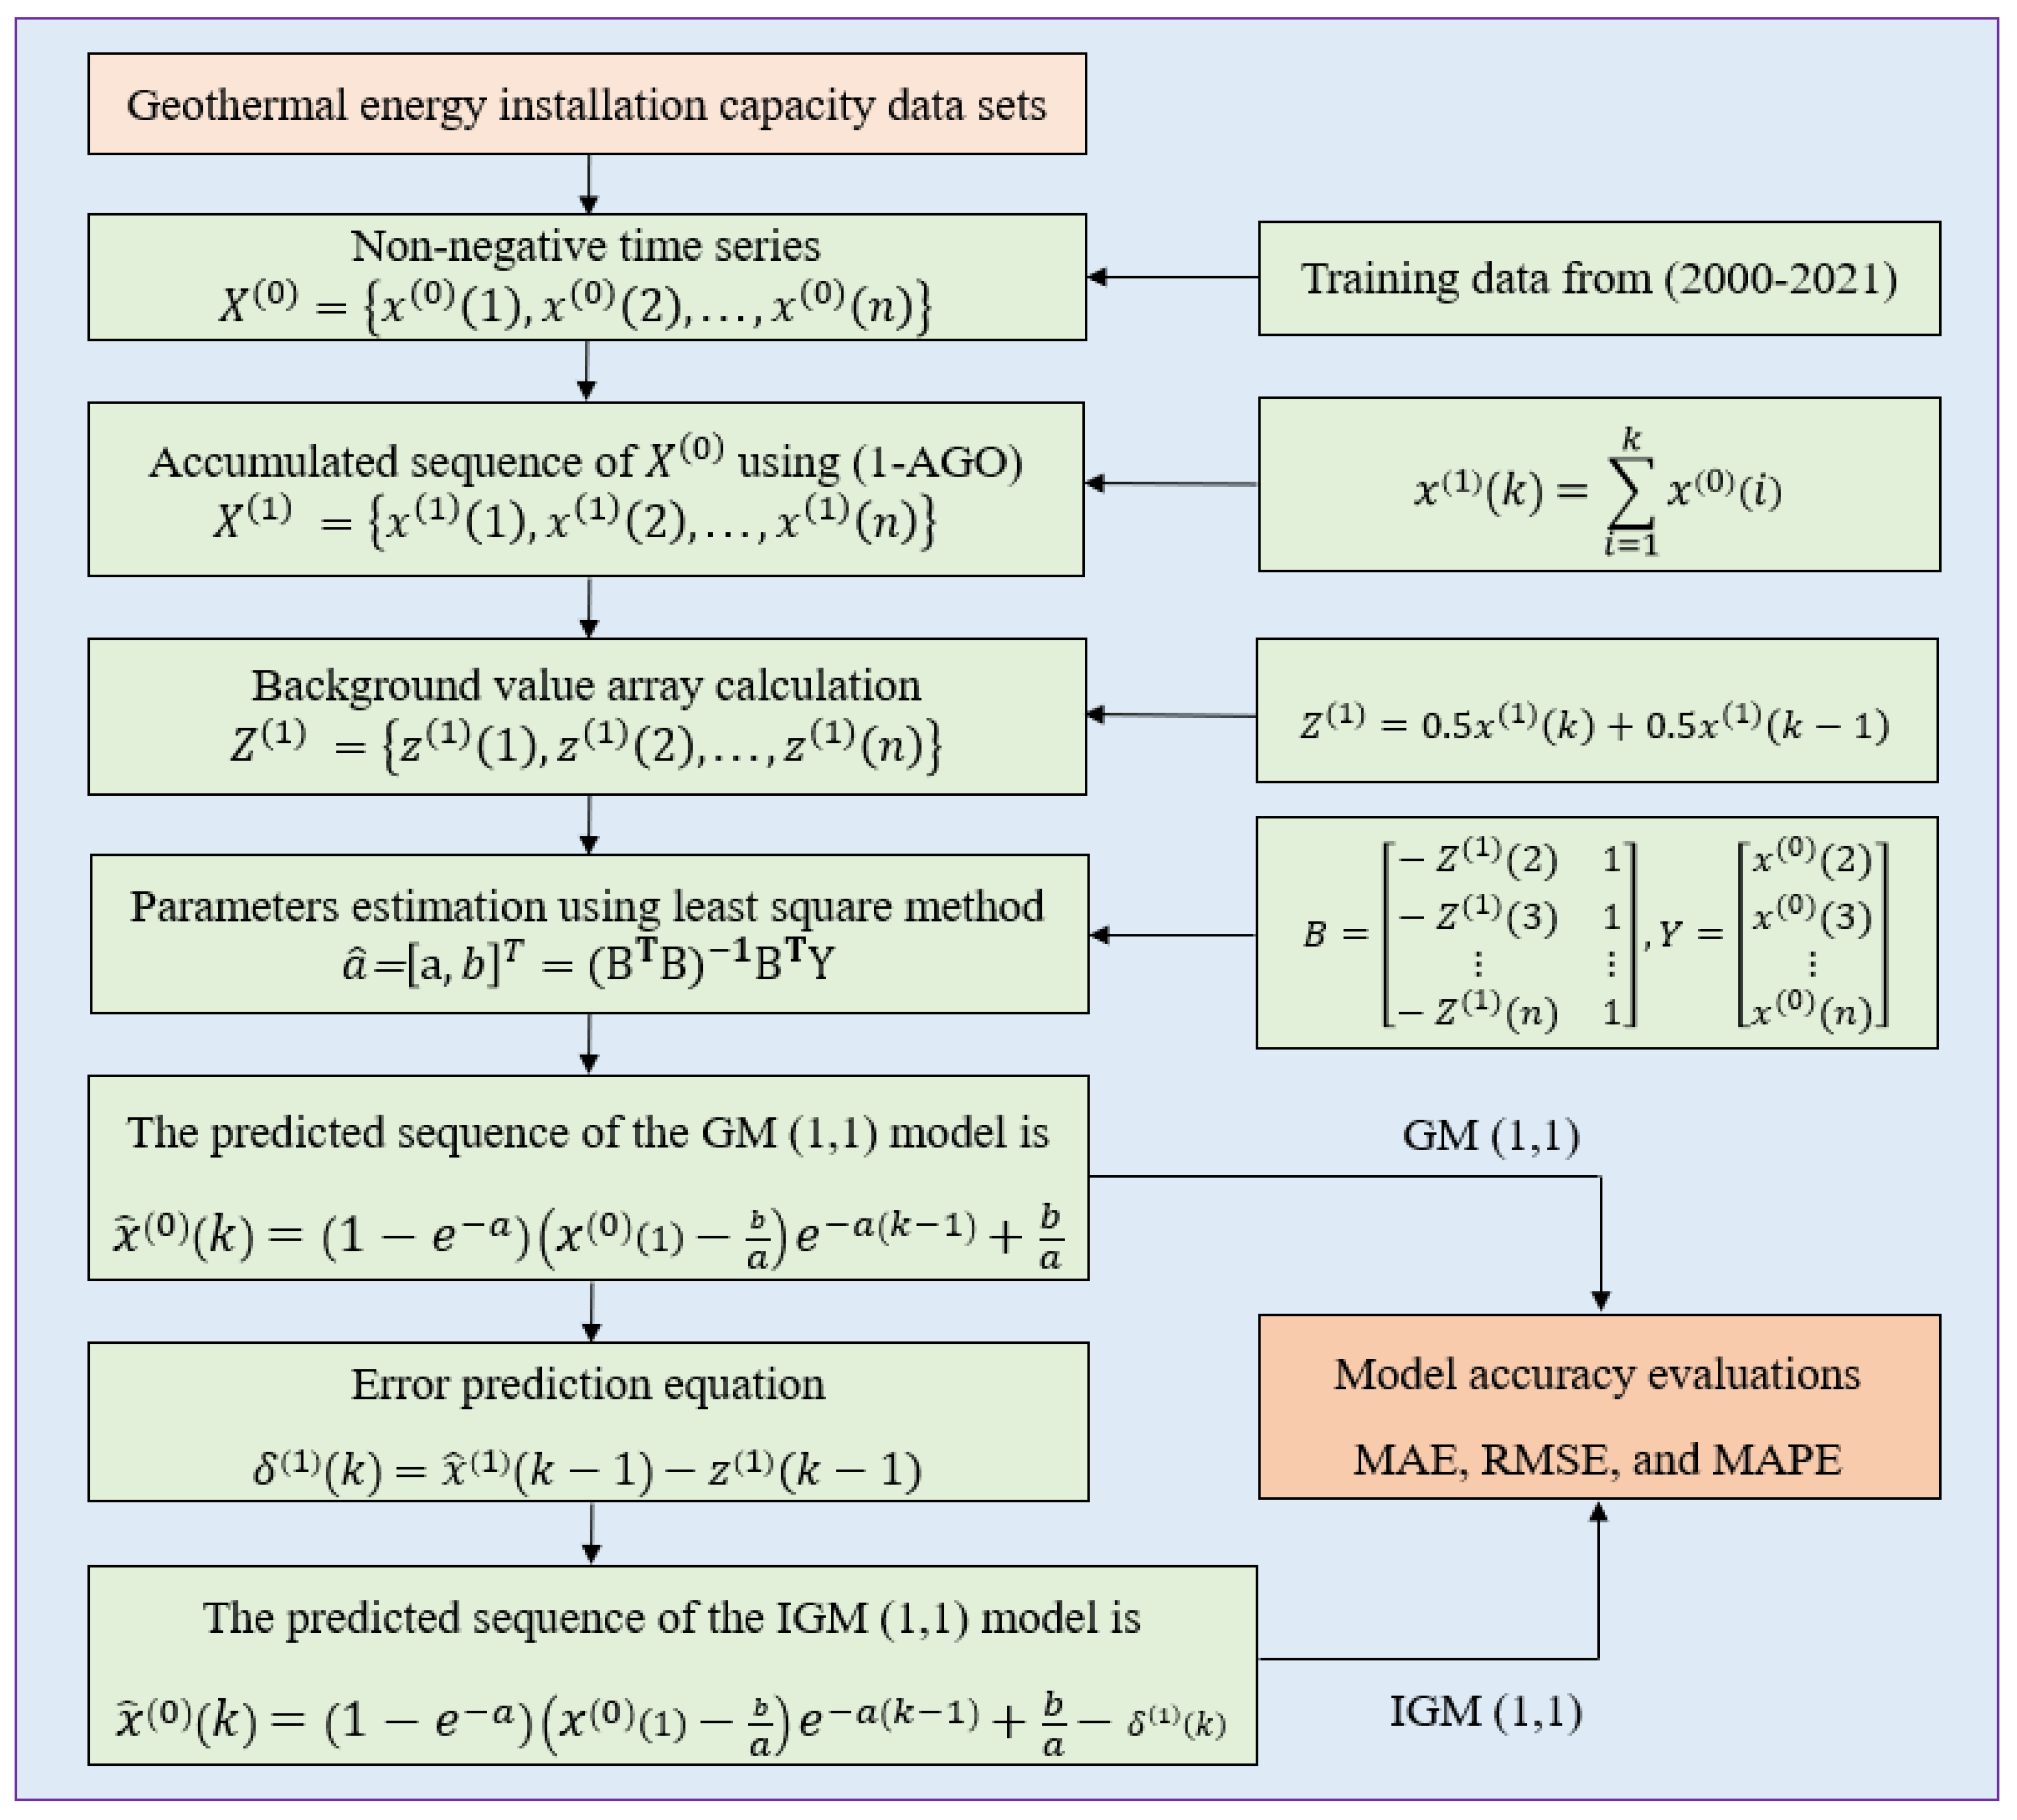
The modeling procedure for the improved IGM (1,1) model is shown in Figure 2.
3. Data Description
In this study, the installation capacity data for the top 10 countries that utilize geothermal energy based on the 2021 report evaluation, namely the United States, Indonesia, Philippines, Turkey, New Zealand, Mexico, Italy, Kenya, Iceland, and Japan, were collected from various references [8,9,10] and were checked for anomalies, negatives, and randomness. The 30 years of data were split into two periods: an in-sample dataset (i.e., training) from 2000 to 2021 and an out-of-sample dataset (i.e., prediction) from 2022 through 2030. Furthermore, the in-sample portion was split into two parts: 75% of the data were used to build the model by training on the dataset behavior from 2000 to 2015 to accurately predict the installation capacity for the following nine years, and the remaining 25% of data from 2016 to 2021 were chosen to assess the accuracy. The prediction model was applied to perform the geothermal energy capacity prediction of each above-mentioned dataset separately, which was implemented using MATLAB (R2021a) software.
4. Model Accuracy Evaluations
In this study, three metrics were used to assess the prediction accuracy of the applied models: mean absolute error (MAE), root mean square error (RMSE), and mean absolute percentage error (MAPE). The calculations for MAE, RMSE, and MAPE are written in Equations (11)–(13), respectively.
where and are the actual and predicted data at time , and is the number of observations. When the model results in lower MAE, RMSE, and MAPE (%) values, it indicates it is performing optimally.
5. Results and Discussions
This section forecasts the annual geothermal energy installation capacity for the top 10 countries utilizing geothermal energy evaluated at the end of 2021, including the US, Indonesia, Philippines, Turkey, New Zealand, Mexico, Italy, Kenya, Iceland, Japan, and the world, separately for the nine years from the period of 2022 through 2030 by applying the IGM (1,1) model described in Section 2. In addition, 10 datasets are used to verify the accuracy of the IGM (1,1) model in comparison to the conventional GM (1,1) model.
Annual Forecasting of the United States’ Geothermal Energy Installation Capacity
The United States’ geothermal energy installed capacity dataset from 2000 to 2021 was used to build the model, which was generated in the following sequence:
The accumulative generated sequence is
The IGM (1,1) was applied to perform United States’ annual geothermal energy installation capacity prediction for the next nine years; thus, the model’s parameters were calculated using Equation (5) as follows:
where
The IGM (1,1) model predicted sequence is calculated based on Equation (10) and is expressed as follows:
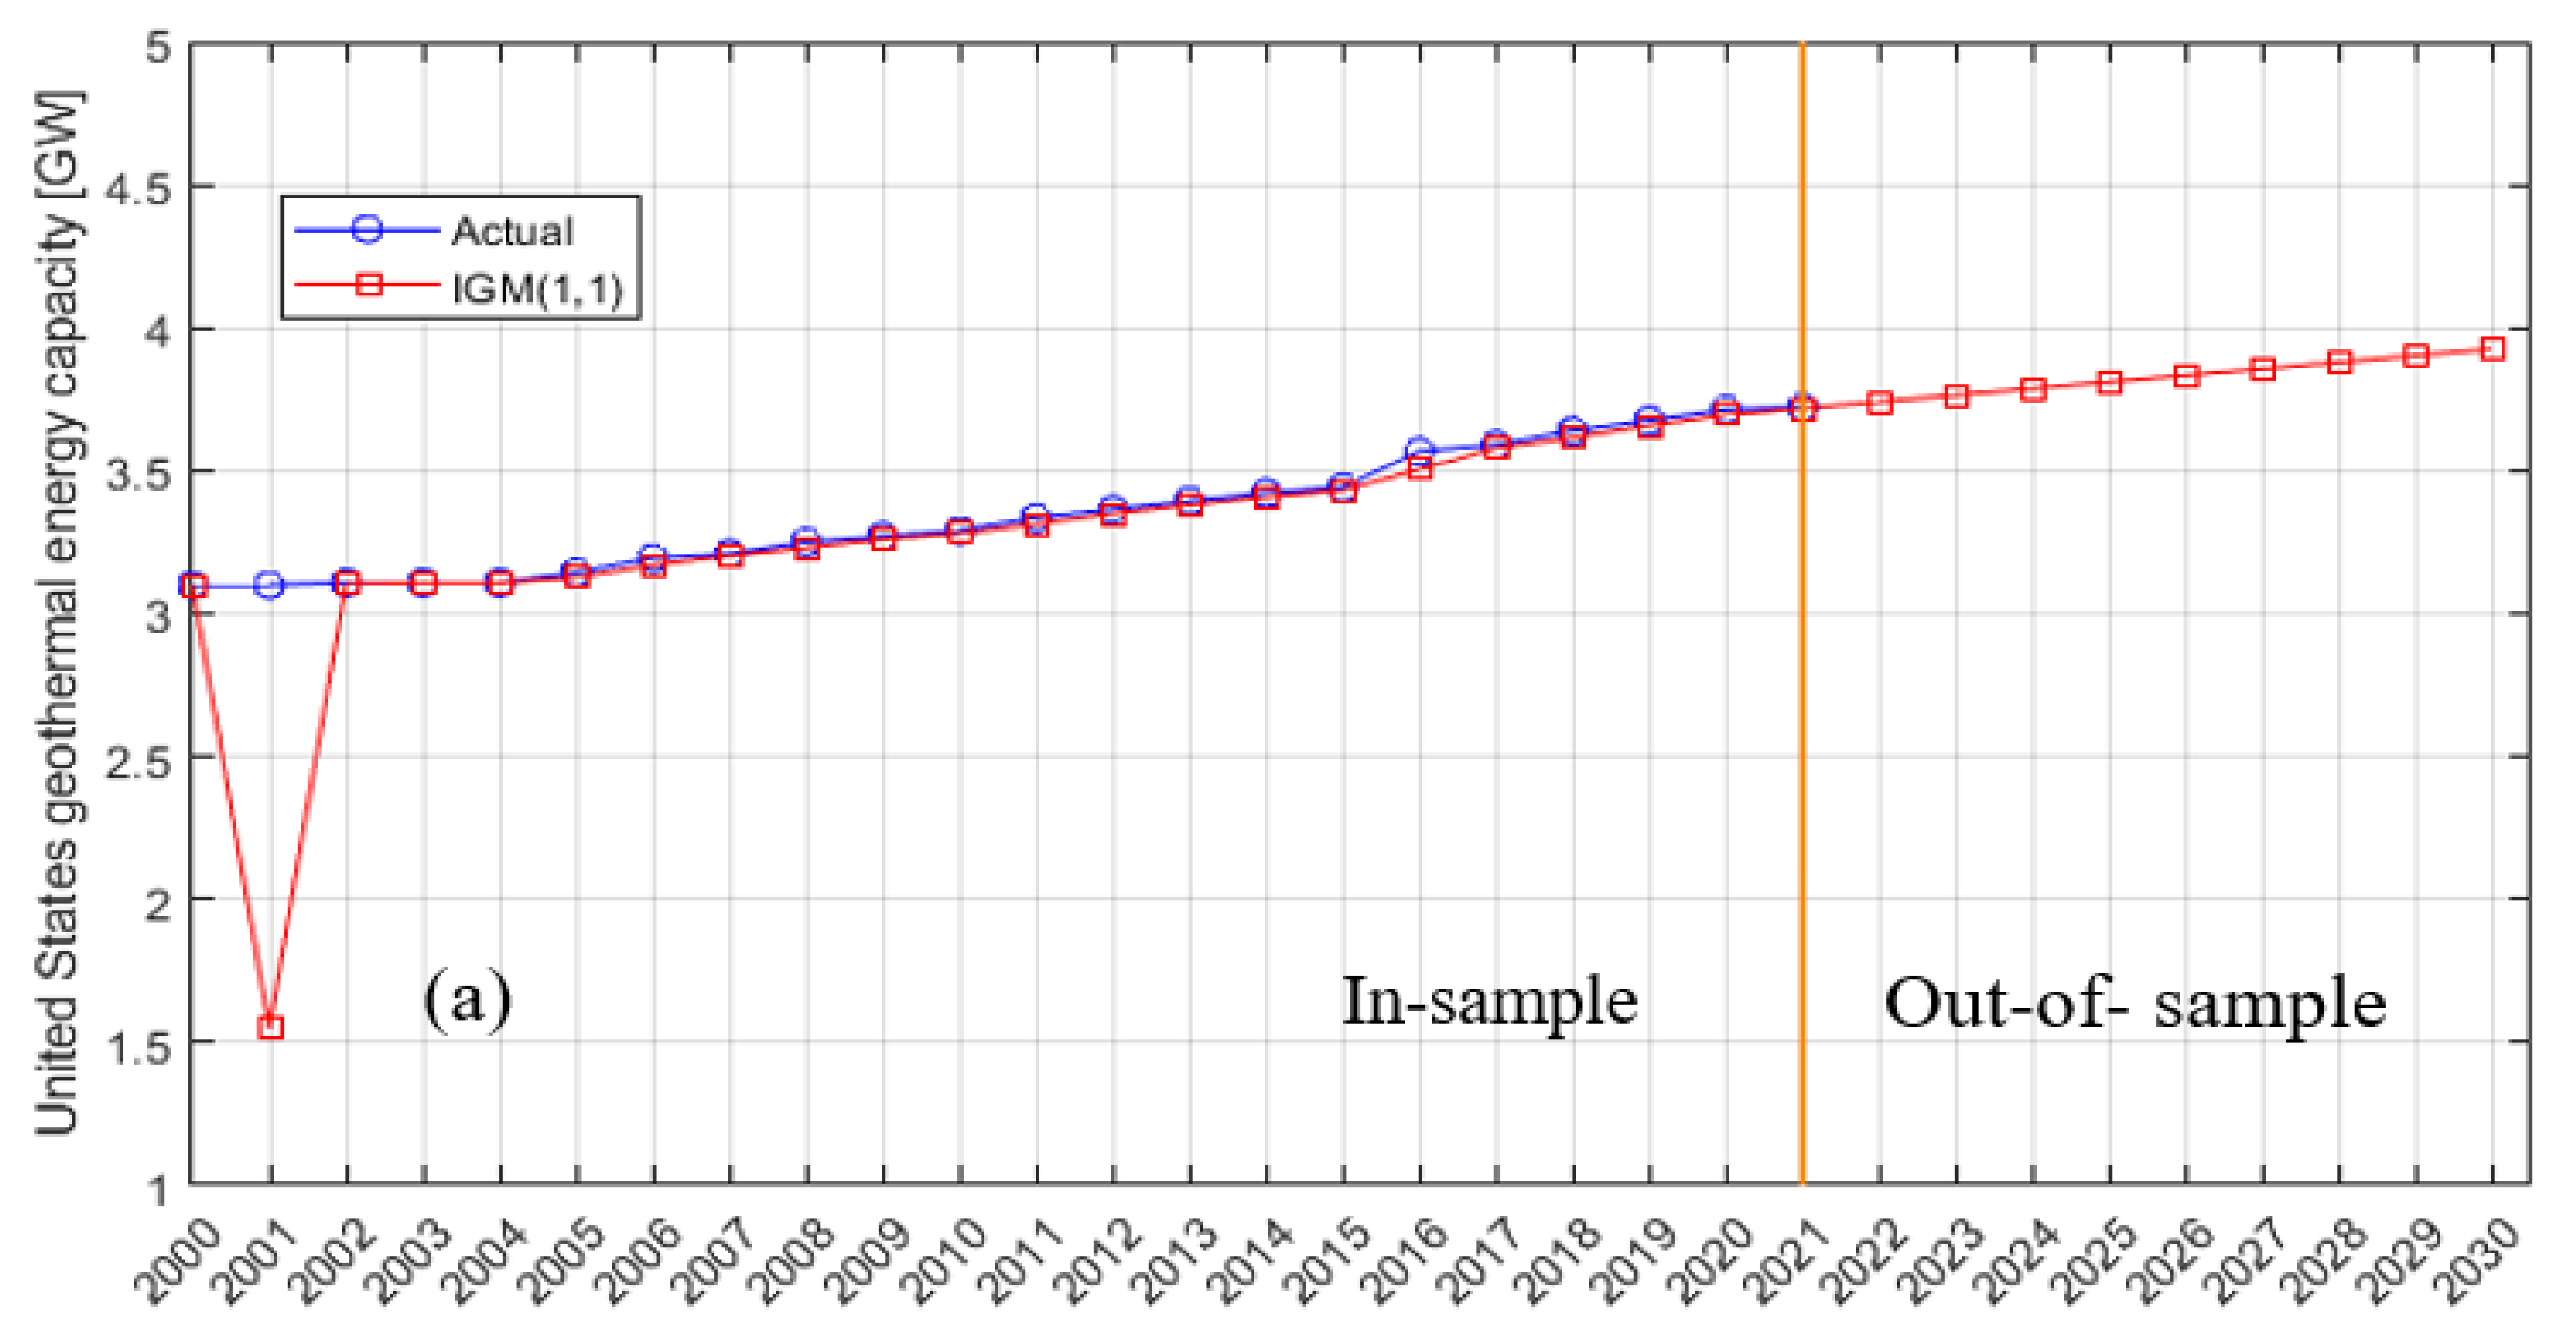
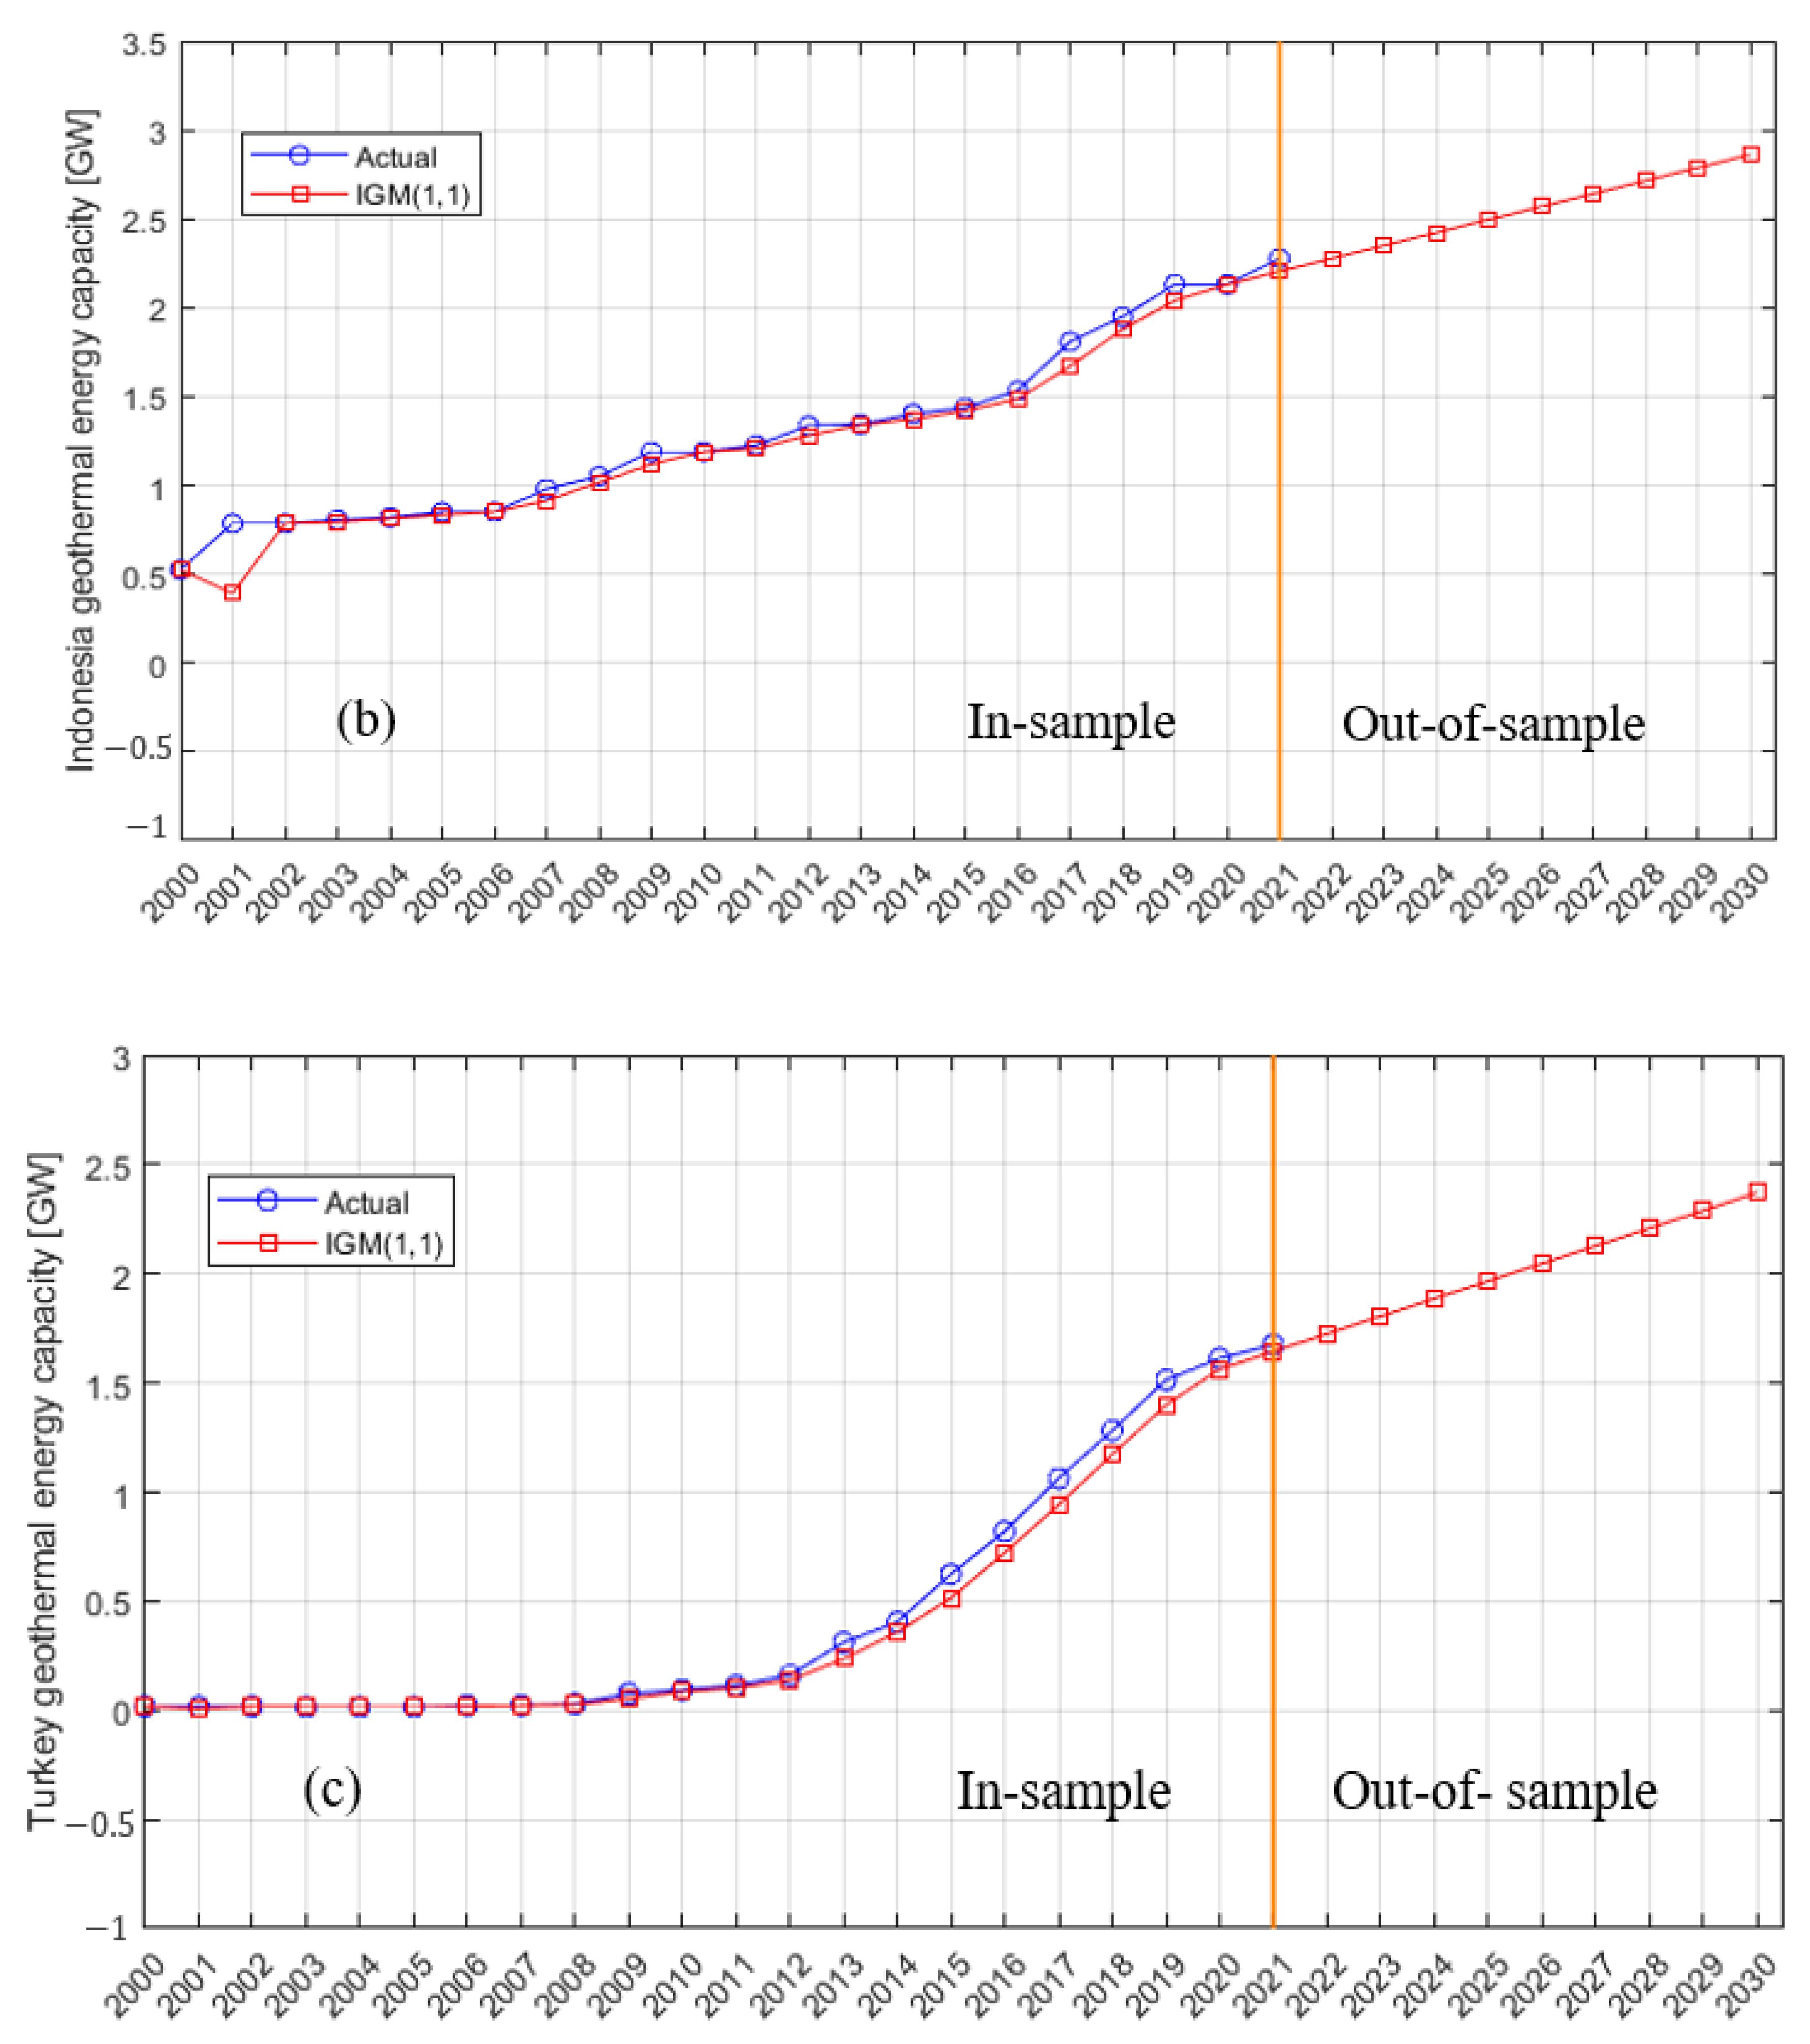
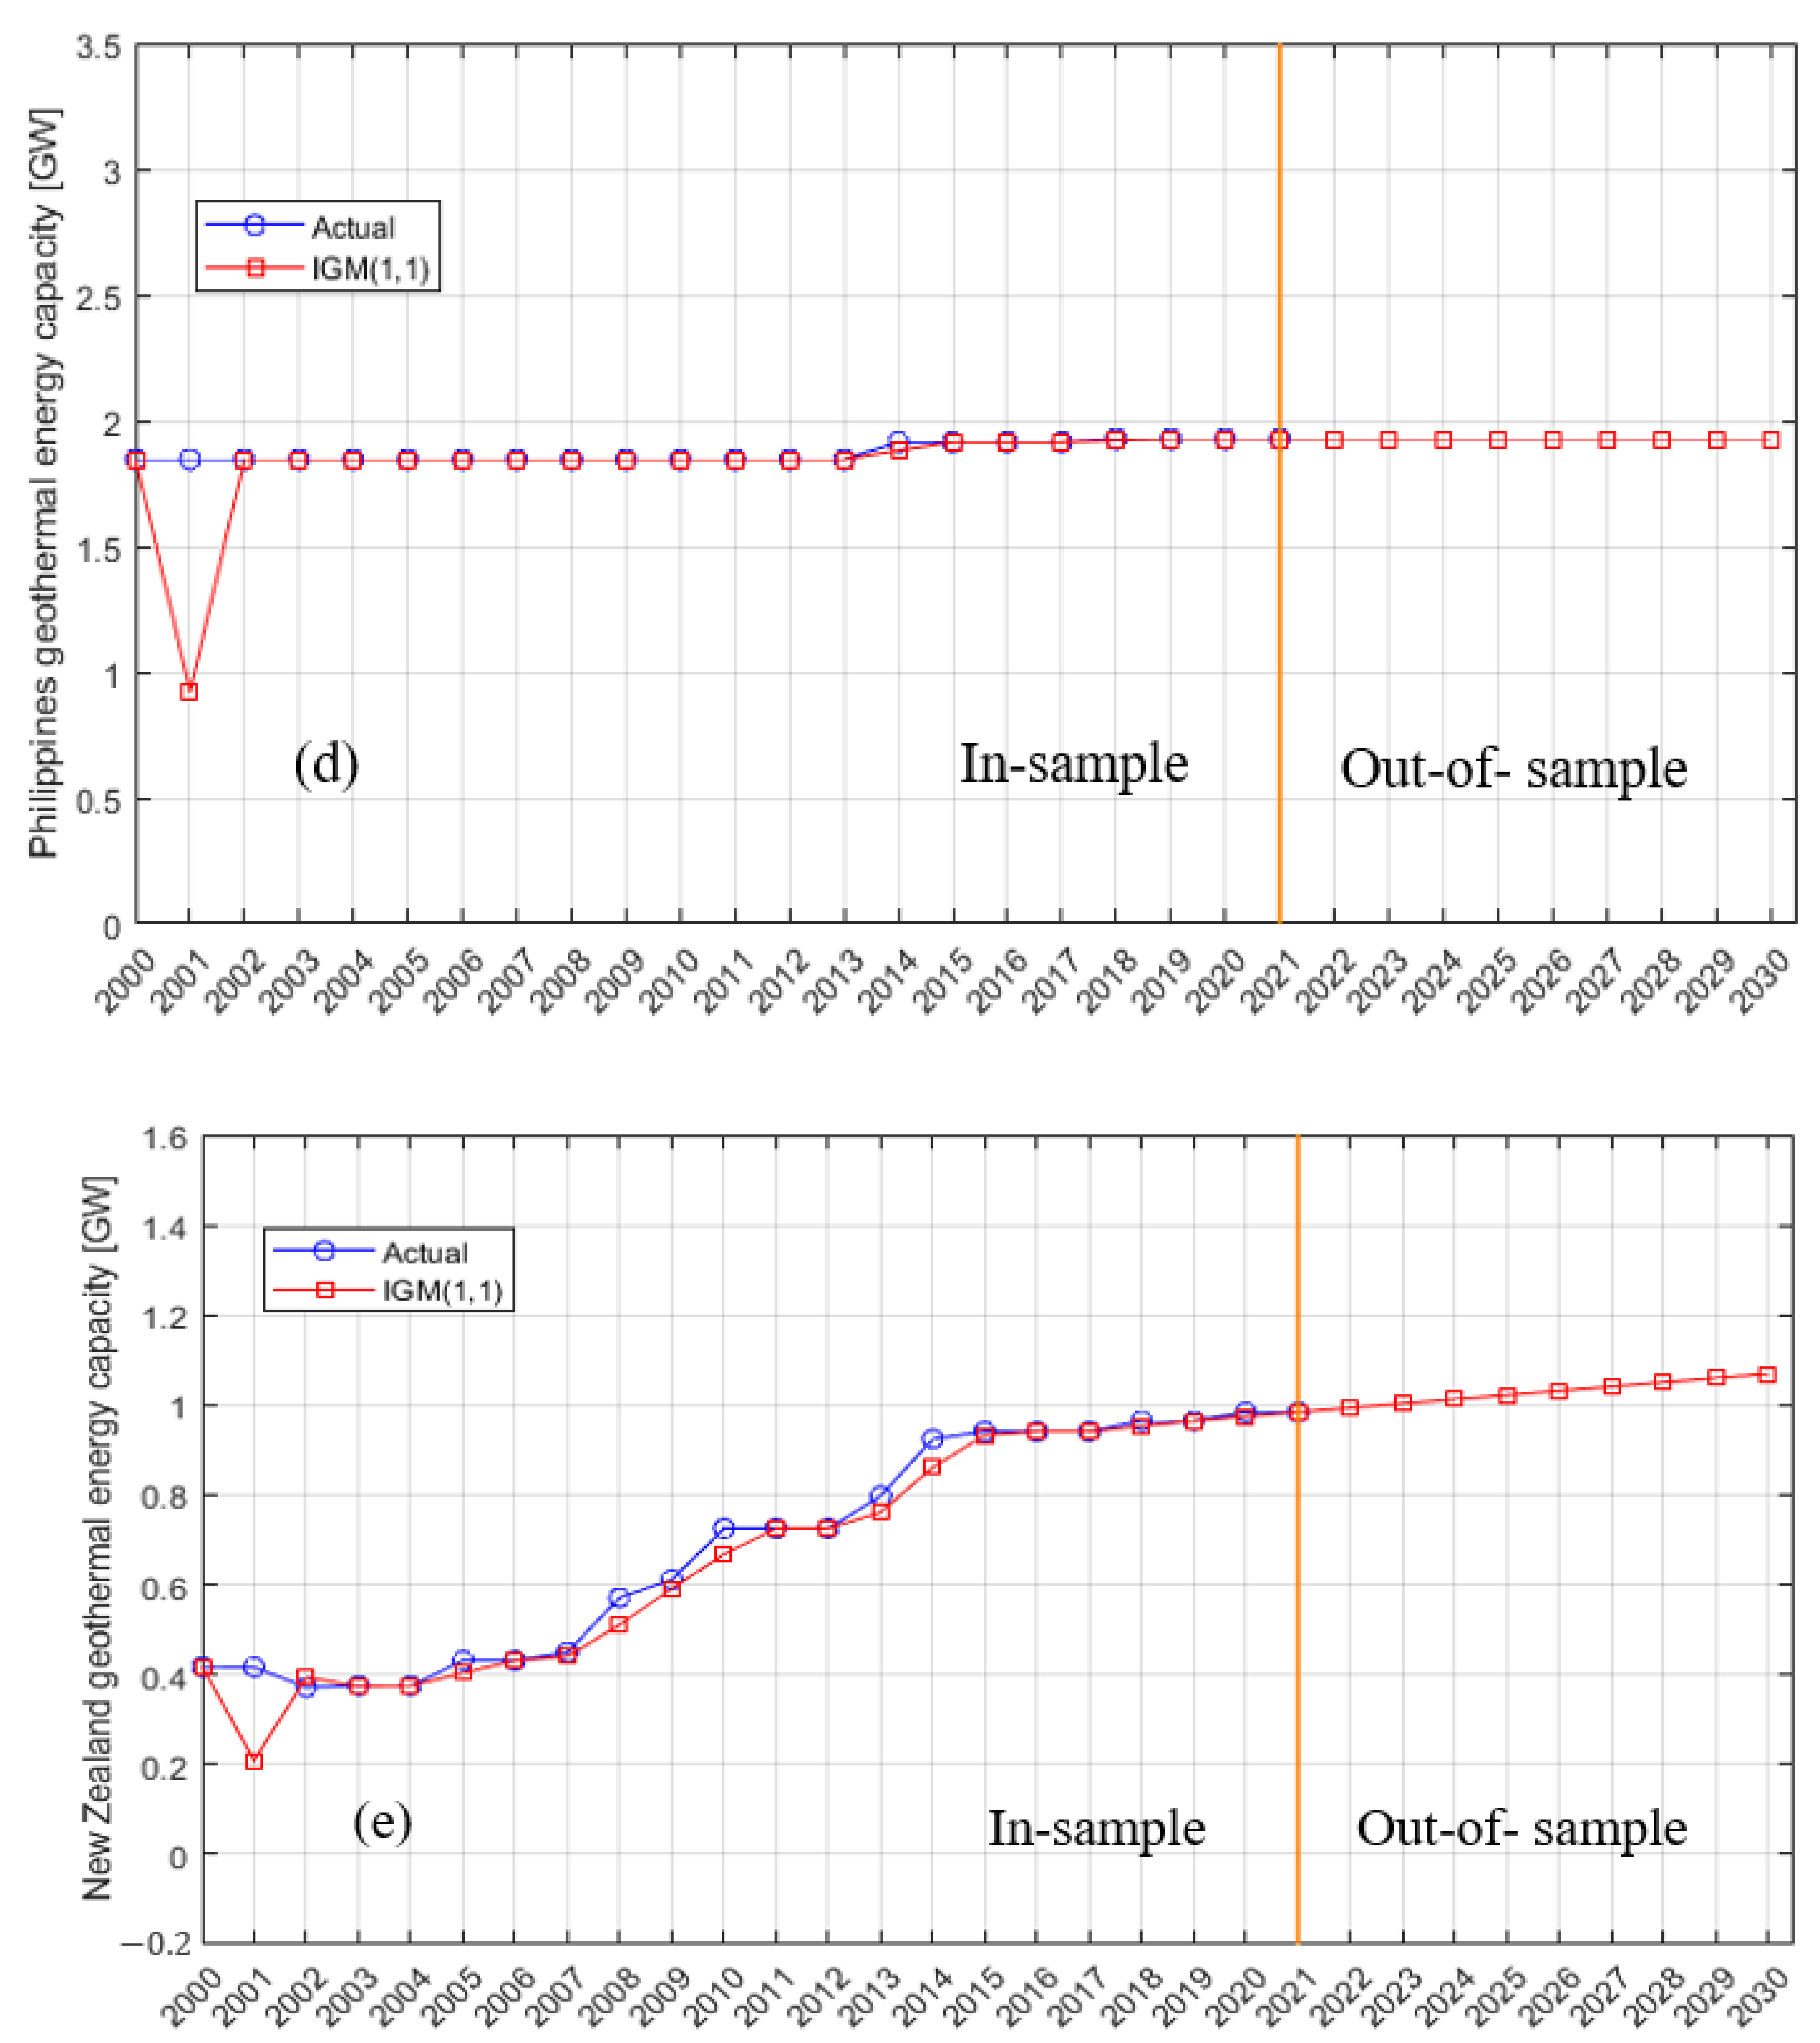
By substituting the values of into the above Equation (14), we obtained the model training (in-sample) and prediction (out-of-sample) results. The prediction results are depicted in Figure 3 and Table 2. According to Figure 3, the IGM (1,1) model is well trained on the in-sample dataset, which reflects its robustness to fit the dataset values much more closely and therefore accurately predicted the United States’ annual geothermal energy capacity in gigawatts (GW) for the next nine years from 2022 to 2030, as follows: 3.741, 3.764, 3.787, 3.81, 3.833, 3.856, 3.879, 3.902, and 3.925 (see Table 2). The capacity is also anticipated to increase by 0.203 GW in just nine years, reaching 3.925 GW by 2030. The prediction accuracy of the IGM (1,1) and GM (1,1) models was assessed using RMSE, MAE, and MAPE (%) and then compared as depicted in Table 3. From Table 3, we can observe that for the United States, the IGM (1,1) model has a lower MAPE (%) value of 0.64 than the GM (1,1) model, which has a value of 0.72. Therefore, this proves that the IGM (1,1) model is more accurate than the GM (1,1) model and has increased the prediction accuracy of the GM (1,1) model.
Then, the improved IGM (1,1) model was applied to predict the annual installed geothermal energy capacity for Indonesia, Philippines, Turkey, New Zealand, Mexico, Italy, Kenya, Iceland, and Japan up to 2030. Consequently, the IGM (1,1) model was implemented in MATLAB, and prediction results for the above-mentioned datasets were observed (depicted in Figure 3 and Table 2). Table 3 shows the evaluation results of the IGM (1,1) and GM (1,1) models.
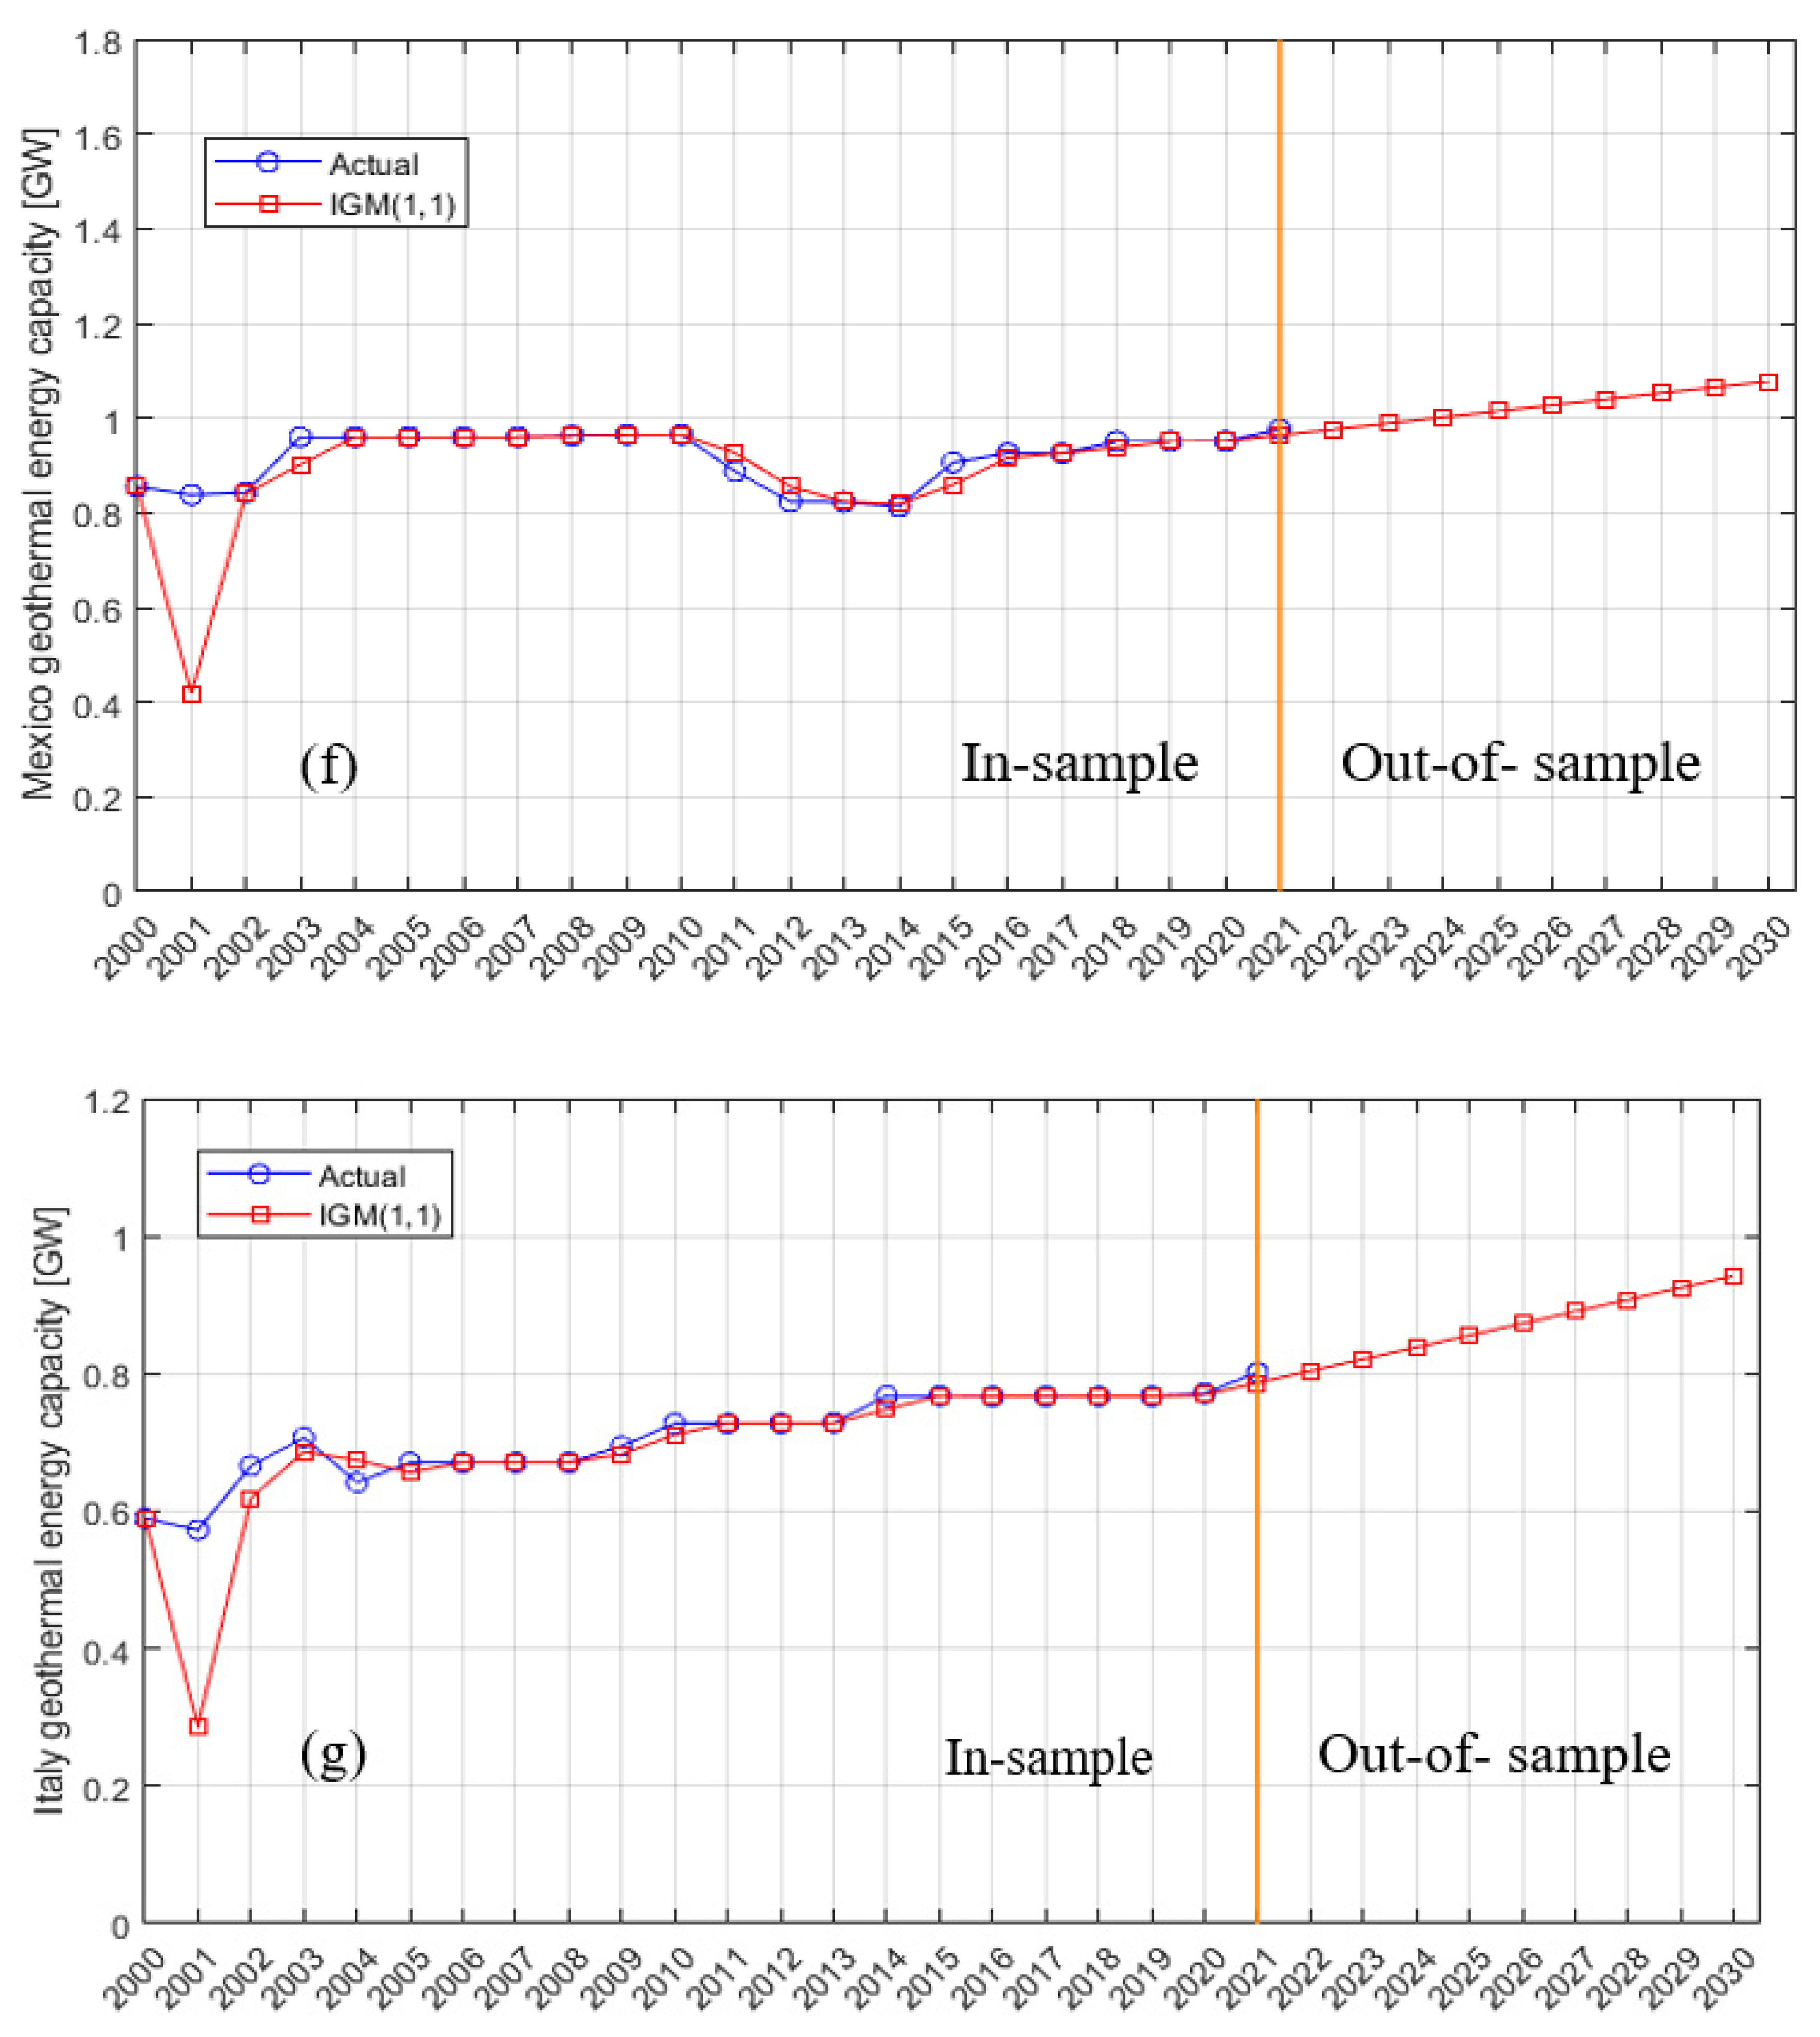
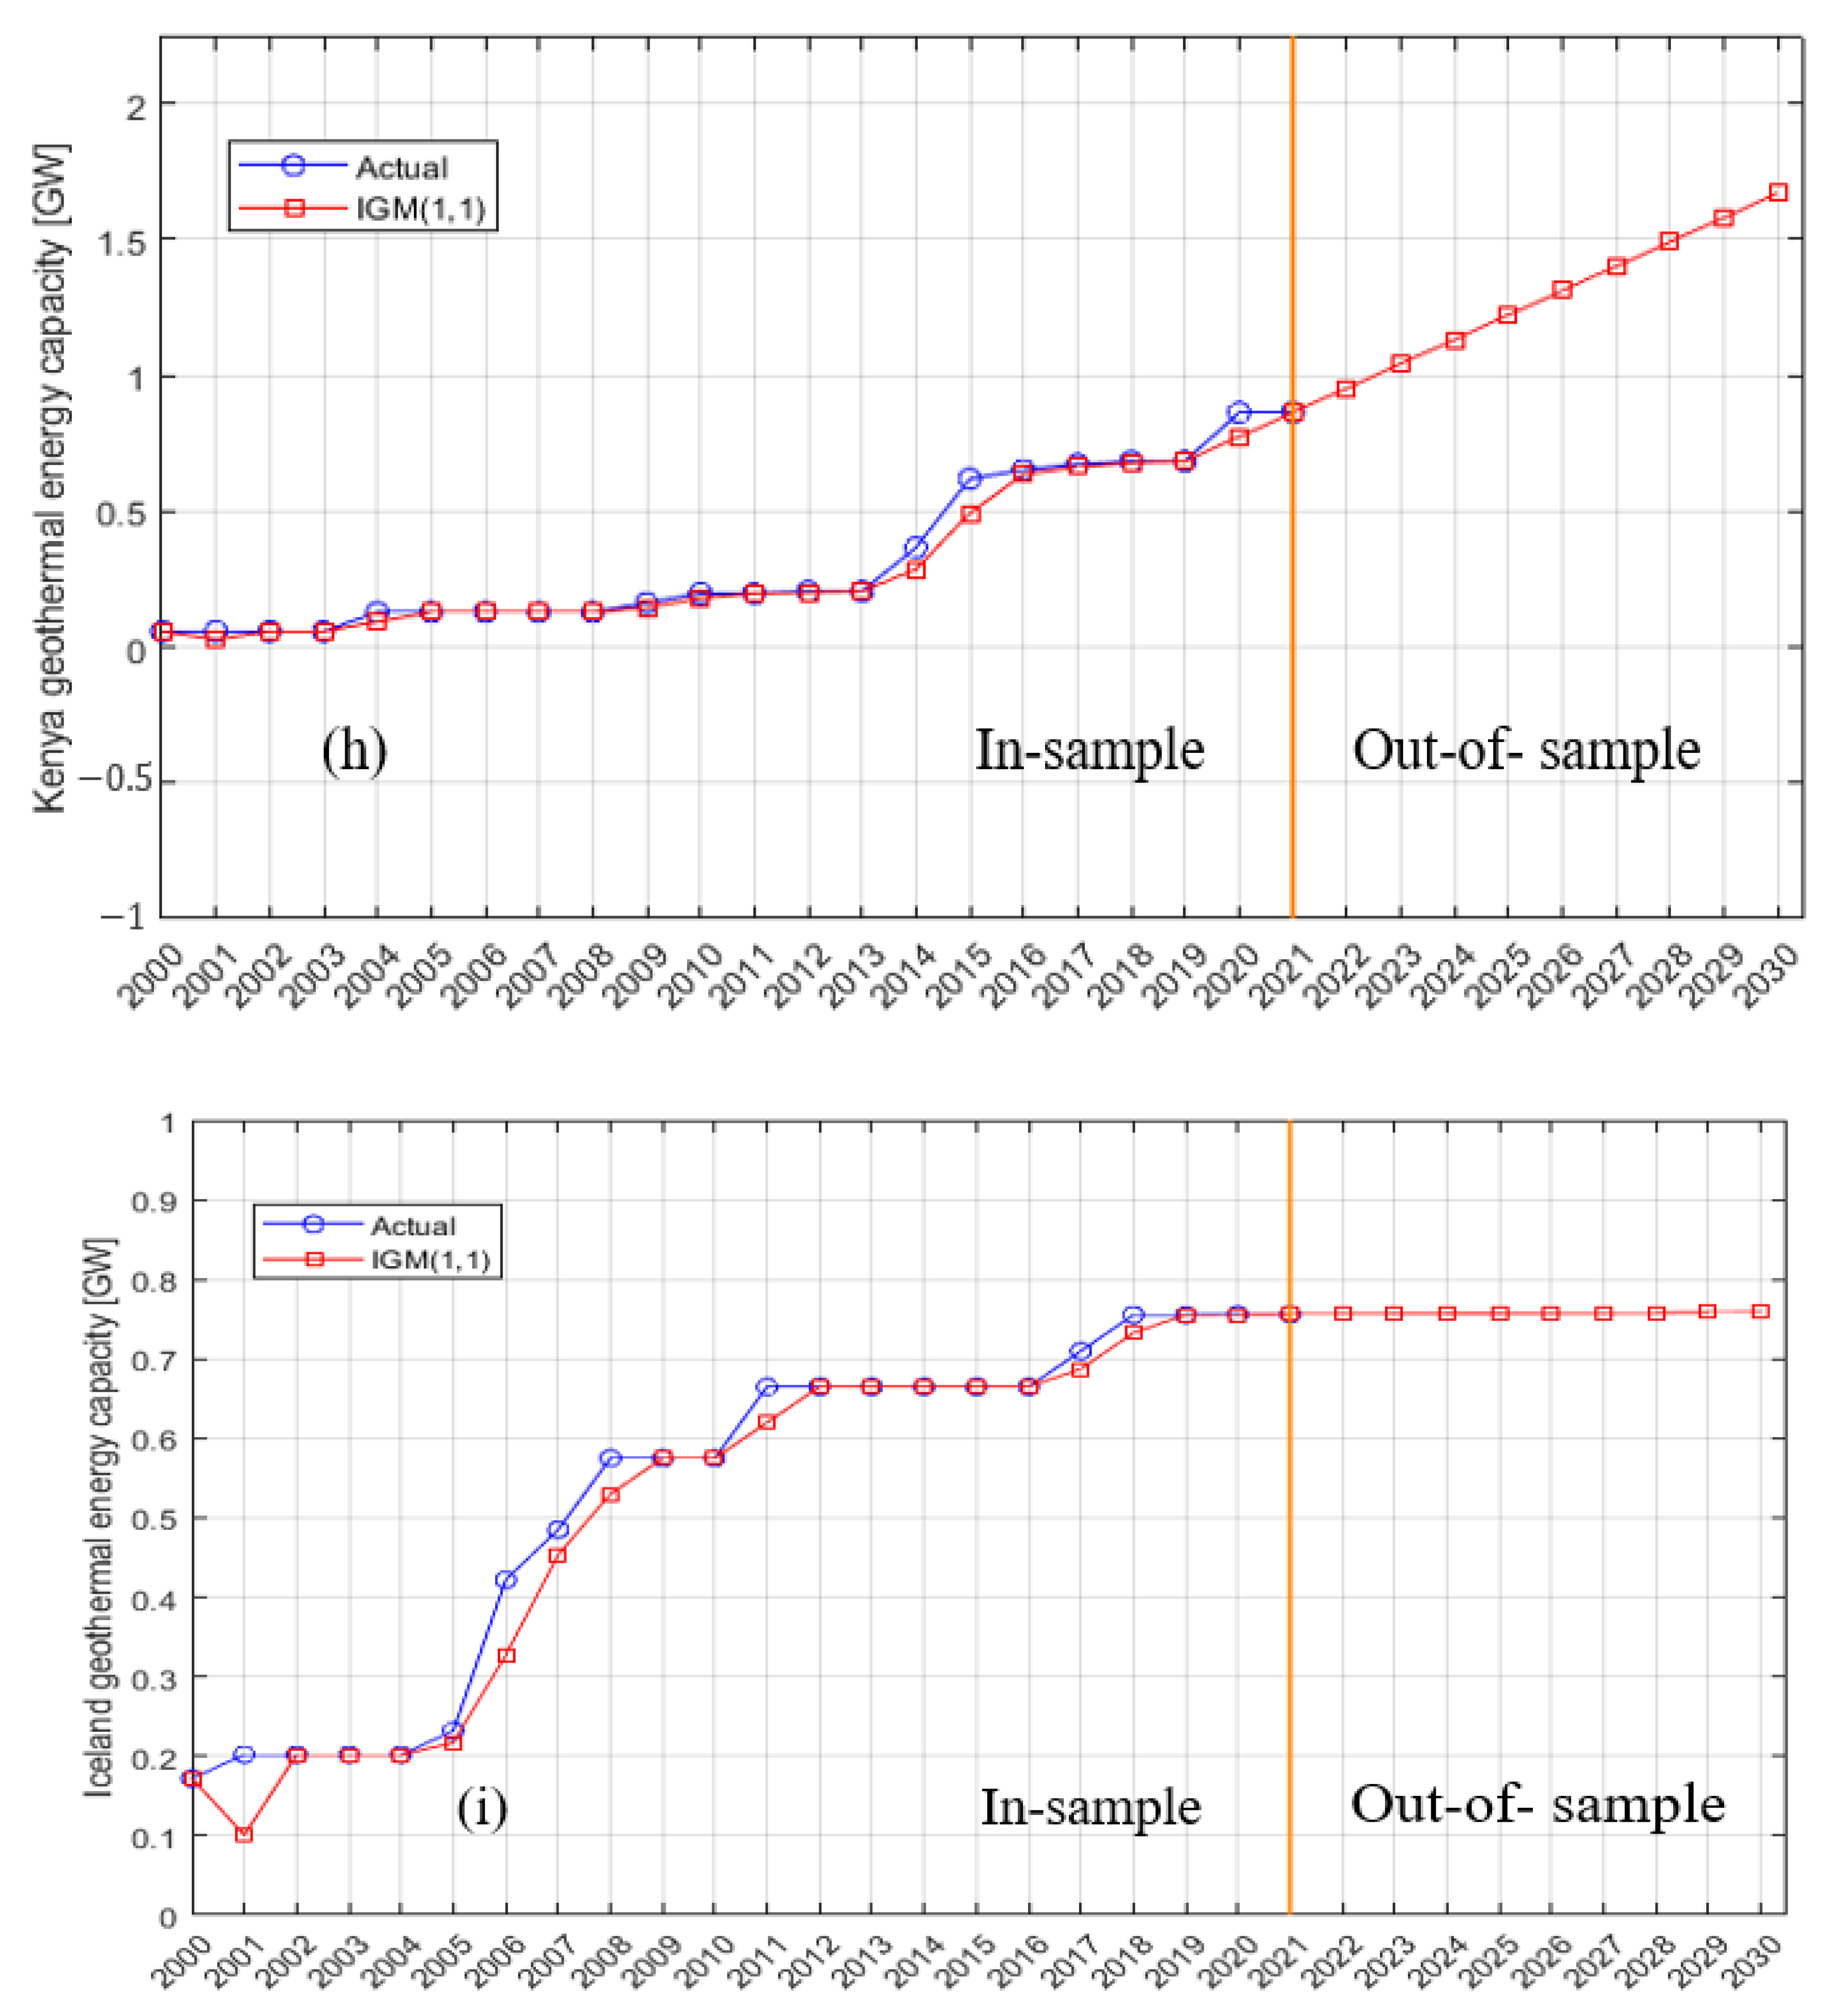
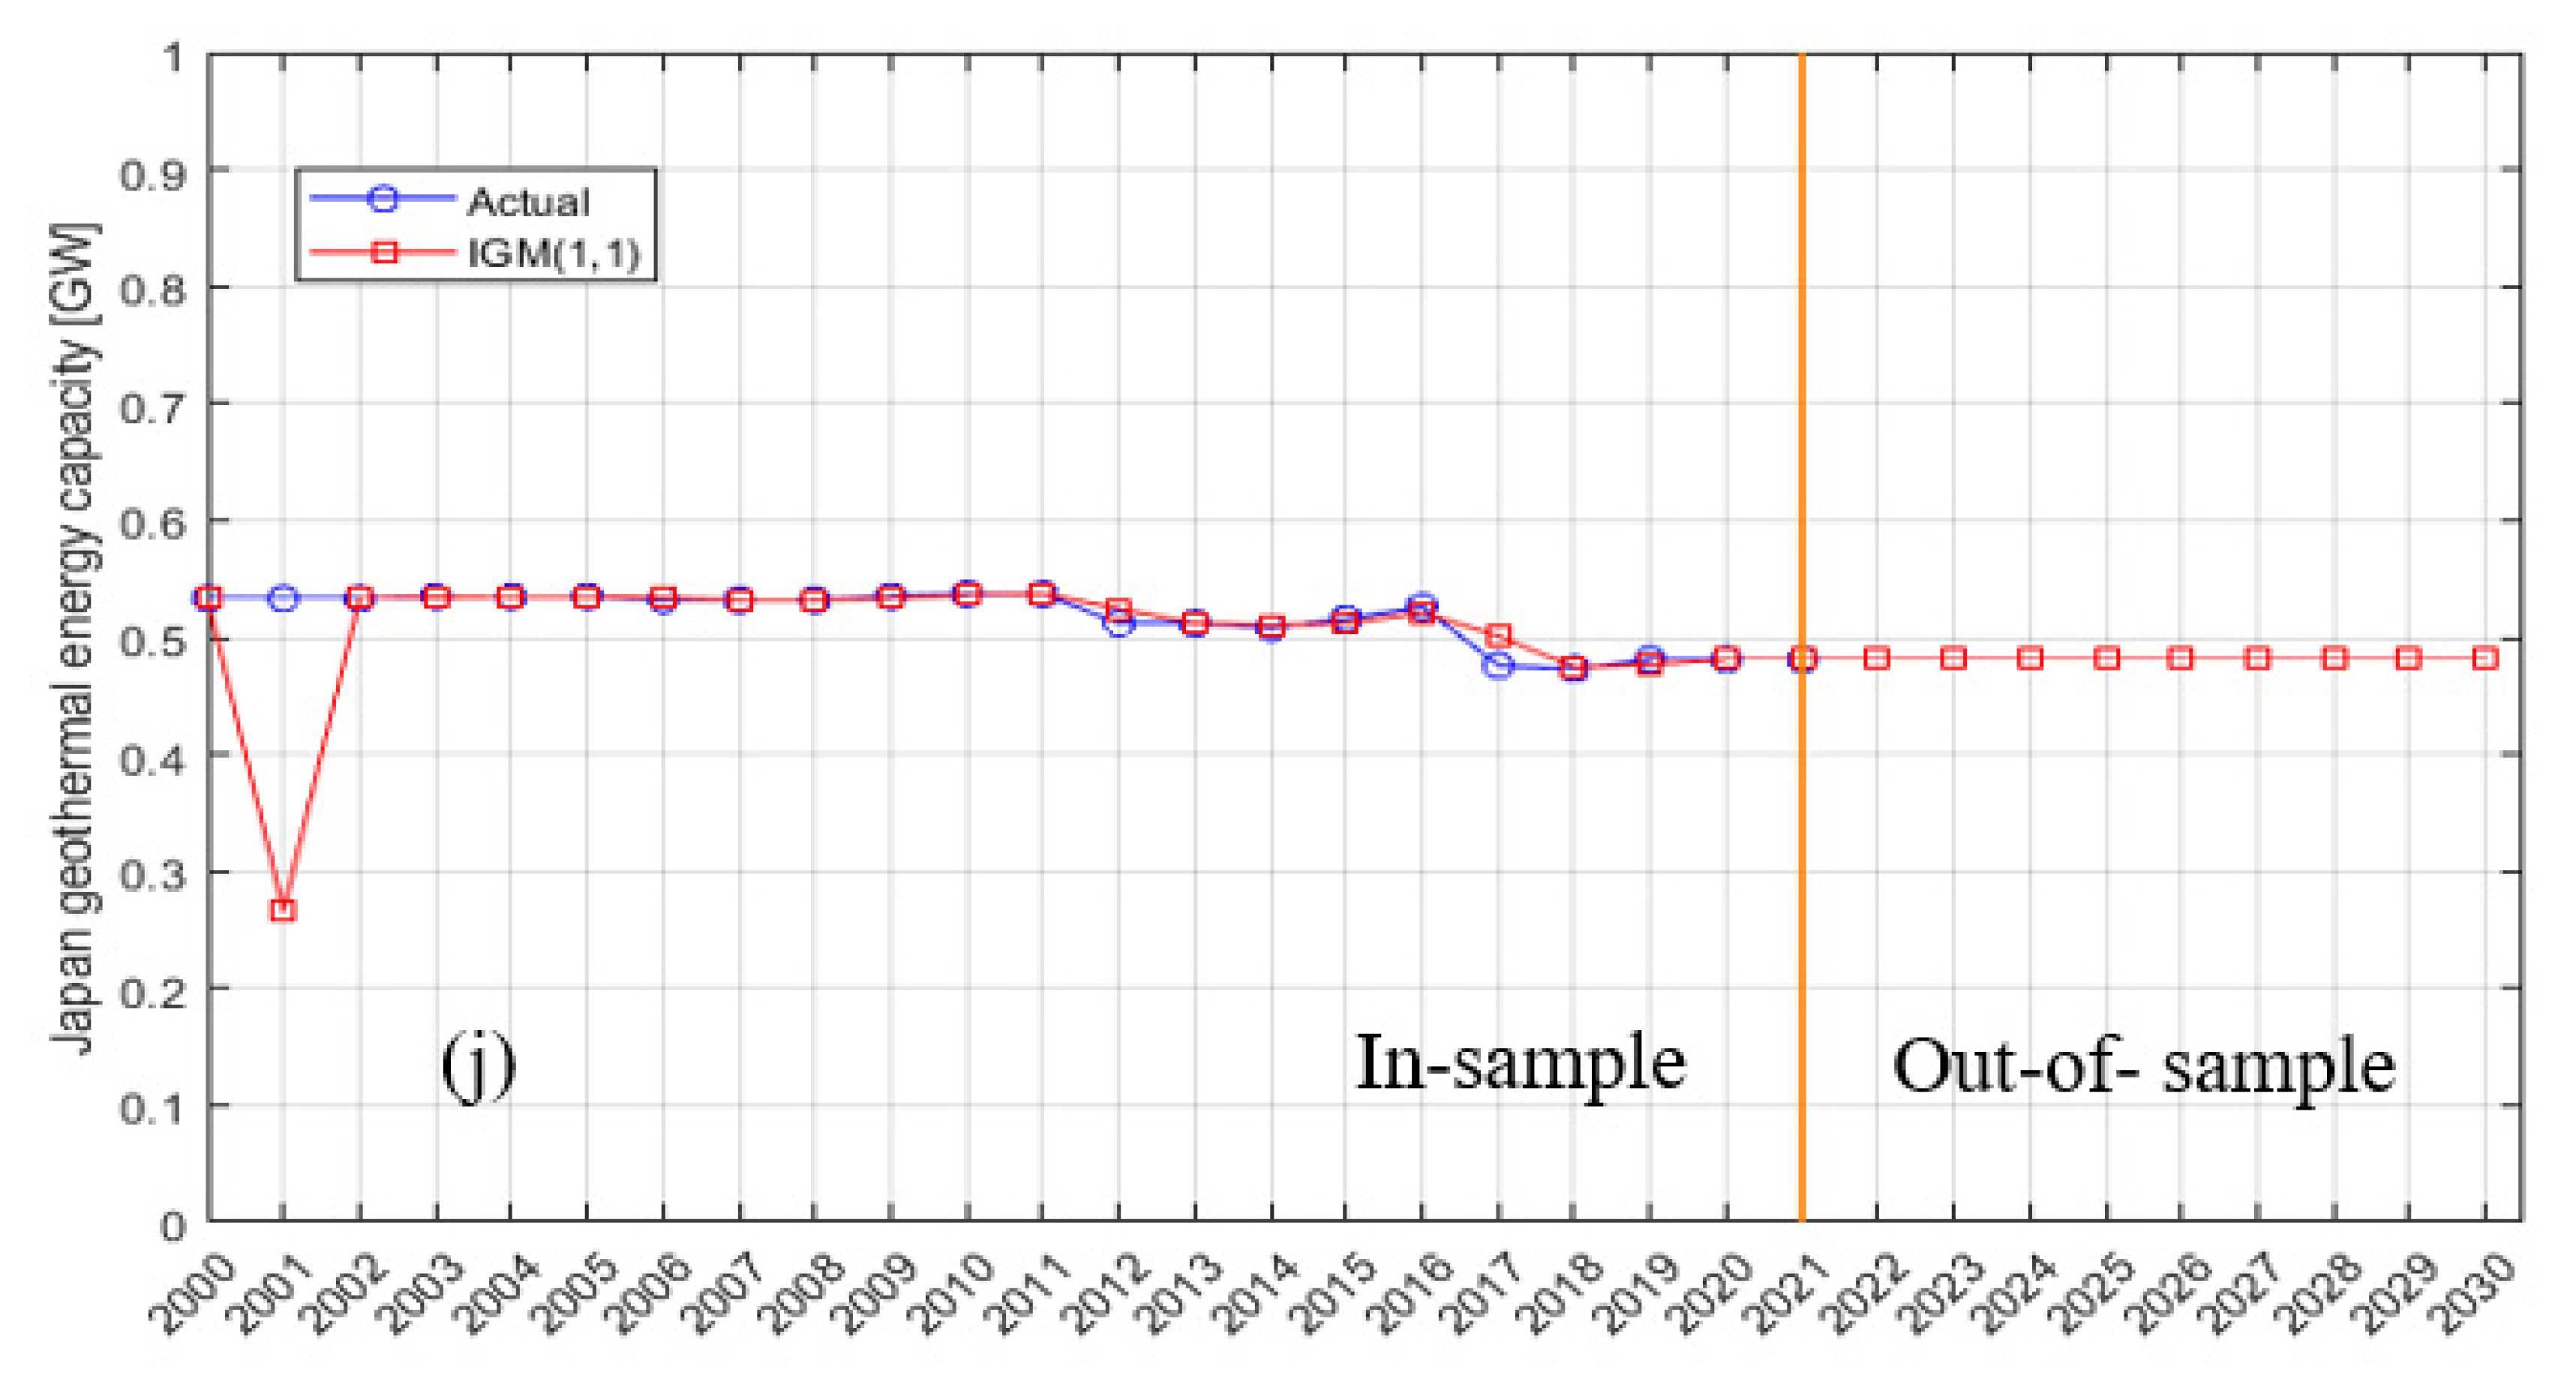
Due to the limitations of the GM (1,1) model, prediction error occurs and increases as the background value generates sequences accumulating the general predicted sequence , resulting in inaccurate predictions. Furthermore, its output differs from the actual dataset values, showing that the model was not properly trained on the dataset, which resulted in incongruities between the model and the data. To address this issue, Salhein et al. [21] proposed the IGM (1,1) model to overcome the weaknesses of the GM (1,1) model and enhance its overall performance by subtracting the error between the previous accumulated time response of the GM (1,1) model and the previous background value . The prediction accuracies of the IGM (1,1) and GM (1,1) models were evaluated using MAE, RMSE, and MAPE (%) based on Equations (11)–(13), and the results are presented in Table 3. The results revealed that the IGM (1,1) model reduced prediction error while significantly enhancing the GM (1,1) model’s prediction accuracy in both in-sample and out-of-sample periods. Furthermore, the IGM (1,1) model had lower RMSE, MAE, and MAPE (%) values than the GM (1,1) model for all datasets used (see Table 3). Thus, the IGM (1,1) model is more accurate than the GM (1,1) model; nevertheless, its accuracy varies from one dataset to another depending on each dataset’s self-behaviors. For instance, the IGM (1,1) model shows lower MAE, RMSE, and MAPE (%) values for the Philippines, New Zealand, and Italy than for the other used countries’ datasets because the Philippines, New Zealand, and Italy datasets were more consistent than others; thus, it was simple for the model to accurately predict the installed capacity for the next nine years. Therefore, the model prediction can perform better with a more consistent dataset.
For the next nine years, geothermal energy installation capacity in the United States, Indonesia, Turkey, New Zealand, Mexico, Italy, and Kenya will increase but at different rates. However, the installed capacities of the other countries—Iceland, Japan, and the Philippines—will remain stable or nearly unchanged. Our findings agreed with Klein [13] in showing that geothermal energy installation capacity in Japan will be approximately 0.55 GW by 2030.
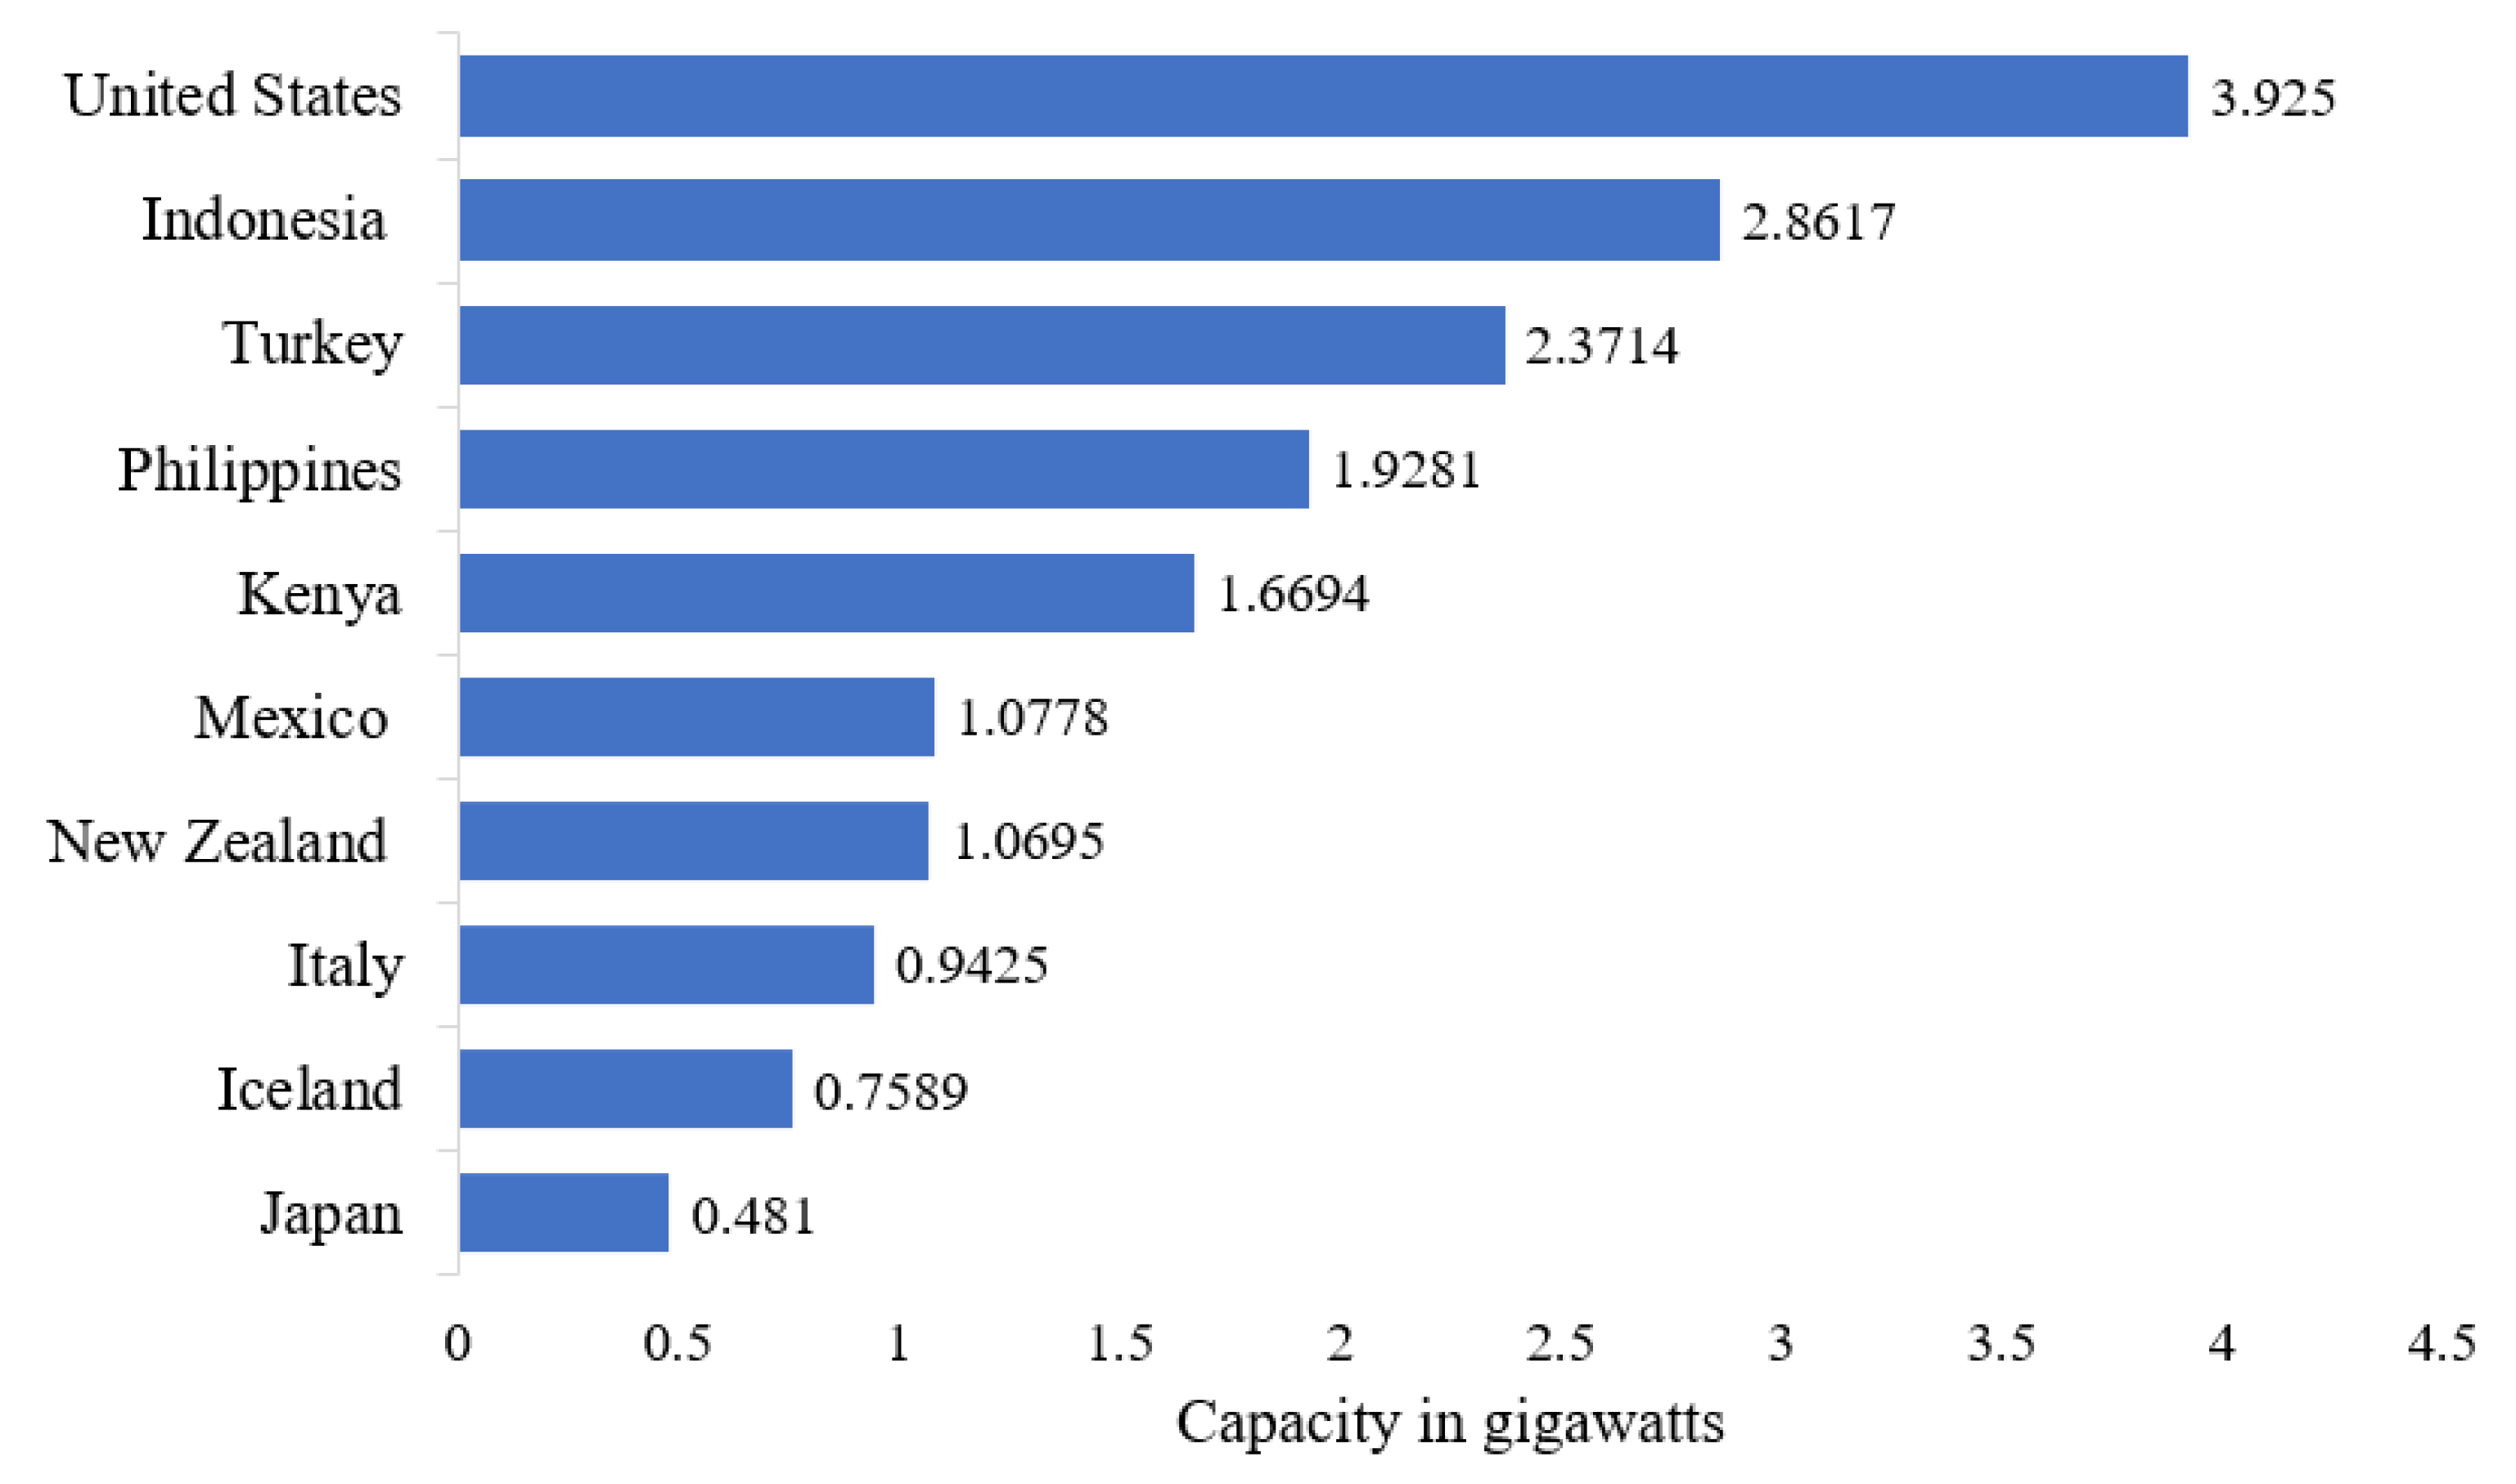
In summary, according to the IGM (1,1) model prediction results, geothermal energy installed capacity in 2030 is anticipated to be ranked as follows: United States, Indonesia, Turkey, Philippines, Kenya, Mexico, New Zealand, Italy, Iceland, and Japan with GW capacities of 3.925, 2.8617, 2.3714, 1.9281, 1.6694, 1.0778, 1.0695, 0.9425, 0.7589, and 0.481, respectively, as shown in Table 4 and Figure 4.
6. Conclusions
In this study, the improved grey prediction model (IGM (1,1)) was applied to predict the annual geothermal energy installation capacity of the top 10 countries that utilize geothermal energy evaluated at the end of 2021, namely the United States, Indonesia, Philippines, Turkey, New Zealand, Mexico, Italy, Kenya, Iceland, and Japan, for the next nine years for the period from 2022 through 2030. The IGM (1,1) model was based on optimizing the current predicted value by subtracting the error between the previous accumulated time response of the GM (1,1) model and the previous background value. Ten geothermal energy installed capacity datasets were utilized to further validate the IGM (1,1) model. Consequently, the IGM (1,1) model enhanced the GM (1,1) model’s prediction accuracy by reducing prediction errors with varying percentages depending on each dataset’s self-behavior. The findings demonstrated that the improved IGM (1,1) model was more accurate than the GM (1,1) model, indicating that it is an effective and promising tool for accurate short-term prediction. According to the IGM (1,1) model prediction results, the current ranking of countries utilizing geothermal energy is expected to change by 2030, reflecting the following rankings: United States (3.925), Indonesia (2.8617), Turkey (2.3714), Philippines (1.9281), Kenya (1.6694), Mexico (1.0778), New Zealand (1.0695), Italy (0.9425), Iceland (0.7589), and Japan (0.481), as depicted in Table 4. Additionally, world usage is estimated to be at 23.4368 GW by 2030, in contrast to 15.644 GW in 2021.
Author Contributions
Conceptualization, K.S.; methodology, K.S.; software, K.S.; validation, K.S., C.J.K. and M.Z.; formal analysis, K.S.; investigation, K.S. and C.J.K.; writing—original draft preparation, K.S.; writing—review and editing, K.S.; visualization, C.J.K.; supervision, M.Z. All authors have read and agreed to the published version of the manuscript.
Funding
This research received no external funding.
Institutional Review Board Statement
Not applicable.
Informed Consent Statement
Not applicable.
Data Availability Statement
Geothermal energy installation capacity datasets are publicly available at Installed electricity capacity by country/area (MW) by Country/area, Technology, Grid connection and Year. PxWeb (irena.org), https://0-www-statista-com.brum.beds.ac.uk/statistics/183452/total-us-geothermal-energy-capacity-from-2000/, Installed geothermal energy capacity, 2020 (ourworldindata.org) (accessed on 2 August 2022).
Conflicts of Interest
The authors declare no conflict of interest.
Nomenclature
| List of abbreviations | |
| AGO | Accumulative generating operation |
| GM | Grey prediction model |
| GM (1,1) | GM with a first-order differential equation to predict one variable |
| IGM (1,1) | Improved grey prediction model |
| 1-AGO | First-order accumulated generating operation |
| Inverse 1-AGO | Inverse first-order accumulated generating operation |
| MAE | Mean absolute error |
| RMSE | Root mean square error |
| MAPE | Mean absolute percentage error |
| GW | Gigawatts |
| MW | Megawatts |
| List of symbols | |
| Developing coefficient | |
| Grey action quantity | |
| A non-negative original data sequence | |
| Accumulated time response of | |
| Background value array | |
| Predicted time response of grey prediction model at time | |
| Accumulated time response of grey prediction model at time | |
| Time point | |
| Number of years of observation | |
| List of greek letters | |
| Weighting factor | |
| Predicted value’s error at time k | |
References
- Geothermal Energy. 14 May 2018. Available online: https://www.encyclopedia.com/science-and-technology/technology/technology-terms-and-concepts/geothermal-energy (accessed on 1 August 2022).
- Renewable Energy World: Geothermal Electricity Production. Available online: https://www.renewableenergyworld.com/types-of-renewable-energy/tech-3/geoelectricity/#gref (accessed on 1 August 2022).
- Hyder, Z. Solar Reviews: Geothermal Energy Pros and Cons. 3 August 2022. Available online: https://www.solarreviews.com/blog/geothermal-energy-pros-and-cons (accessed on 1 August 2022).
- Hitchcock, K. 10 Geothermal Energy Facts and Statistics in 2022. 21 July 2022. Available online: https://housegrail.com/geothermal-energy-statistics/#2_Currently_27_countries_throughout_the_world_generate_geothermal_electricity (accessed on 17 August 2022).
- EIA. Geothermal Explained Use of Geothermal Energy. 18 March 2022. Available online: https://www.eia.gov/energyexplained/geothermal/use-of-geothermal-energy.php (accessed on 17 August 2022).
- Geothermal Energy Association. 2020. Available online: https://web.archive.org/web/20090419054340/http://www.geo-energy.org/publications/reports/Industry_Update_March_Final.pdf (accessed on 2 August 2022).
- Richter, A. Think GeoEnergy. 10 January 2022. Available online: https://www.thinkgeoenergy.com/thinkgeoenergys-top-10-geothermal-countries-2021-installed-power-generation-capacity-mwe/?utm_source=linkedin&utm_medium=social&utm_campaign=news (accessed on 2 August 2022).
- Madhumitha Jaganmohan. Geothermal energy capacity worldwide from 2009 to 2021. Statista. 6 May 2022. Available online: https://0-www-statista-com.brum.beds.ac.uk/statistics/476281/global-capacity-of-geothermal-energy/ (accessed on 2 August 2022).
- International Renewable Energy Agency (IRENA), Abu Dhabi. Available online: https://pxweb.irena.org/pxweb/en/IRENASTAT (accessed on 2 August 2022).
- Our World in Data. Available online: https://ourworldindata.org/grapher/installed-geothermal-capacity?tab=table&time=2000 (accessed on 2 August 2022).
- Bertani, R. Geothermal power generation in the world 2010–2014 update report. Geothermics 2016, 60, 31–43. [Google Scholar] [CrossRef]
- Şahin, U. Forecasting of Turkey’s electricity generation and CO2 emissions in estimating capacity factor. Environ. Prog. Sustain. Energy 2019, 38, 56–65. [Google Scholar] [CrossRef] [Green Version]
- Klein, C. Forecast of the Geothermal Power Generation Capacity Japan 2020–2030. 6 January 2020. Available online: https://0-www-statista-com.brum.beds.ac.uk/statistics/1221023/japan-geothermal-power-generation-capacity-forecast/ (accessed on 16 August 2022).
- Zheng, B.; Xu, J.; Ni, T.; Li, M. Geothermal energy utilization trends from a technological paradigm perspective. Renew. Energy 2015, 77, 430–441. [Google Scholar] [CrossRef]
- Chang, Y.; Li, Y. Power generation and cross-border grid planning for the integrated ASEAN electricity market: A dynamic linear programming model. Energy Strategy Rev. 2013, 2, 153–160. [Google Scholar] [CrossRef]
- Ju-Long, D. Control problems of grey systems. Syst. Control Lett. 1982, 1, 288–294. [Google Scholar] [CrossRef]
- Talafuse, T.P.; Pohl, E.A. Small sample reliability growth modeling using a grey systems model. Qual. Eng. 2017, 29, 455–467. [Google Scholar] [CrossRef]
- Tseng, F.-M.; Yu, H.-C.; Tzeng, G.-H. Applied hybrid grey model to forecast seasonal time series. Technol. Forecast. Soc. Change 2001, 67, 291–302. [Google Scholar] [CrossRef]
- Şahin, U. Forecasting of Turkey’s electricity generation and consumption with grey prediction method. Mugla J. Sci. Technol. 2018, 4, 205–209. [Google Scholar] [CrossRef] [Green Version]
- Yuan, C.; Liu, S.; Fang, Z. Comparison of China’s primary energy consumption forecasting by using ARIMA (the autoregressive integrated moving average) model and GM (1, 1) model. Energy 2016, 100, 384–390. [Google Scholar] [CrossRef]
- Salhein, K.; Ashraf, J.; Zohdy, M. Output temperature predictions of the geothermal heat pump system using an improved grey prediction model. Energies 2021, 14, 5075. [Google Scholar] [CrossRef]
- Li, K.; Zhang, T. Forecasting electricity consumption using an improved grey prediction model. Information 2018, 9, 204. [Google Scholar] [CrossRef] [Green Version]
- Fan, G.-F.; Wang, A.; Hong, W.-C. Combining grey model and self-adapting intelligent grey model with genetic algorithm and annual share changes in natural gas demand forecasting. Energies 2018, 11, 1625. [Google Scholar] [CrossRef] [Green Version]
- Hsu, L.-C. Applying the grey prediction model to the global integrated circuit industry. Technol. Forecast. Soc. Change 2003, 70, 563–574. [Google Scholar] [CrossRef]
- Wang, Y.; Dang, Y.; Li, Y.; Liu, S. An approach to increase prediction precision of GM (1, 1) model based on optimization of the initial condition. Expert Syst. Appl. 2010, 37, 5640–5644. [Google Scholar] [CrossRef]
- Hsu, C.-C.; Chen, C.-Y. Applications of improved grey prediction model for power demand forecasting. Energy Convers. Manag. 2003, 44, 2241–2249. [Google Scholar] [CrossRef]
- Yousuf, M.U.; Al-Bahadly, I.; Avci, E. A modified GM (1, 1) model to accurately predict wind speed. Sustain. Energy Technol. Assess. 2021, 43, 100905. [Google Scholar] [CrossRef]
- Yao, M.; Wang, X. Electricity consumption forecasting based on a class of new GM (1, 1) model. In Mechatronics and Automatic Control Systems; Springer: Berlin, Germany, 2014; pp. 947–953. [Google Scholar]
- Hsu, L.-C. Using improved grey forecasting models to forecast the output of opto-electronics industry. Expert Syst. Appl. 2011, 38, 13879–13885. [Google Scholar] [CrossRef]
- Akay, D.; Atak, M. Grey prediction with rolling mechanism for electricity demand forecasting of Turkey. Energy 2007, 32, 1670–1675. [Google Scholar] [CrossRef]
- Li, K.; Zhang, T. A novel grey forecasting model and its application in forecasting the energy consumption in Shanghai. Energy Syst. 2021, 12, 357–372. [Google Scholar] [CrossRef]
Figure 1.
The installed geothermal energy capacity worldwide from 2009 to 2021 [8].
Figure 1.
The installed geothermal energy capacity worldwide from 2009 to 2021 [8].

Figure 2.
Schematic diagram of the IGM (1,1) model.

Figure 3.
Actual (in-sample) and predicted (out-of-sample) geothermal energy installation capacity values for (a) the United States, (b) Indonesia, (c) Turkey, (d) the Philippines, (e) New Zealand, (f) Mexico, (g) Italy, (h) Kenya, (i) Iceland, and (j) Japan.
Figure 3.
Actual (in-sample) and predicted (out-of-sample) geothermal energy installation capacity values for (a) the United States, (b) Indonesia, (c) Turkey, (d) the Philippines, (e) New Zealand, (f) Mexico, (g) Italy, (h) Kenya, (i) Iceland, and (j) Japan.


Figure 4.
Geothermal energy installation capacity prediction for the top 10 countries utilizing geothermal energy in 2030 using the IGM (1,1) model.
Figure 4.
Geothermal energy installation capacity prediction for the top 10 countries utilizing geothermal energy in 2030 using the IGM (1,1) model.


Table 1.
Geothermal energy installation capacity for the top 10 countries in 2021.
| Country | Capacity in Megawatts (MW) |
|---|---|
| United States | 3722 |
| Indonesia | 2276 |
| Philippines | 1918 |
| Turkey | 1710 |
| New Zealand | 1037 |
| Mexico | 963 |
| Italy | 944 |
| Kenya | 861 |
| Iceland | 754 |
| Japan | 603 |
Table 2.
Predicted annual installation capacity of geothermal energy for the top 10 countries utilizing geothermal energy for the period from 2022 through 2030 using the IGM (1,1) and GM (1,1) models.
Table 2.
Predicted annual installation capacity of geothermal energy for the top 10 countries utilizing geothermal energy for the period from 2022 through 2030 using the IGM (1,1) and GM (1,1) models.
| Country | Predicted Capacity (GW) | 2022 | 2023 | 2024 | 2025 | 2026 | 2027 | 2028 | 2029 | 2030 |
|---|---|---|---|---|---|---|---|---|---|---|
| United States | GM (1,1) | 3.7566 | 3.7952 | 3.8341 | 3.8735 | 3.9132 | 3.9533 | 3.9939 | 4.0349 | 4.0763 |
| IGM (1,1) | 3.741 | 3.764 | 3.787 | 3.81 | 3.833 | 3.856 | 3.879 | 3.902 | 3.925 | |
| Indonesia | GM (1,1) | 2.3824 | 2.5258 | 2.6837 | 2.8483 | 3.023 | 3.2085 | 3.4053 | 3.6143 | 3.836 |
| IGM (1,1) | 2.2769 | 2.35 | 2.4231 | 2.4962 | 2.5693 | 2.6424 | 2.7155 | 2.7886 | 2.8617 | |
| Philippines | GM (1,1) | 1.9337 | 1.9391 | 1.9446 | 1.95 | 1.9555 | 1.961 | 1.9664 | 1.972 | 1.9775 |
| IGM (1,1) | 1.9281 | 1.9281 | 1.9281 | 1.9281 | 1.9281 | 1.9281 | 1.9281 | 1.9281 | 1.9281 | |
| Turkey | GM (1,1) | 8.5189 | 10.5675 | 13.1086 | 16.2608 | 20.1709 | 25.0213 | 31.0381 | 38.5017 | 47.7601 |
| IGM (1,1) | 1.7254 | 1.8062 | 1.8869 | 1.9677 | 2.0484 | 2.1292 | 2.2099 | 2.2907 | 2.3714 | |
| New Zealand | GM (1,1) | 1.1863 | 1.2492 | 1.3154 | 1.3851 | 1.4584 | 1.5357 | 1.6171 | 1.7027 | 1.7929 |
| IGM (1,1) | 0.9935 | 1.003 | 1.0125 | 1.022 | 1.0315 | 1.041 | 1.0505 | 1.06 | 1.0695 | |
| Mexico | GM (1,1) | 0.9301 | 0.9311 | 0.9321 | 0.9331 | 0.9341 | 0.935 | 0.936 | 0.937 | 0.938 |
| IGM (1,1) | 0.9762 | 0.9889 | 1.0016 | 1.0143 | 1.027 | 1.0397 | 1.0524 | 1.0651 | 1.0778 | |
| Italy | GM (1,1) | 0.8118 | 0.8212 | 0.8307 | 0.8403 | 0.85 | 0.8599 | 0.8698 | 0.8799 | 0.8901 |
| IGM (1,1) | 0.8041 | 0.8214 | 0.8387 | 0.856 | 0.8733 | 0.8906 | 0.9079 | 0.9252 | 0.9425 | |
| Kenya | GM (1,1) | 1.2472 | 1.4273 | 1.6333 | 1.869 | 2.1388 | 2.4475 | 2.8007 | 3.205 | 3.6676 |
| IGM (1,1) | 0.9526 | 1.0422 | 1.1318 | 1.2214 | 1.311 | 1.4006 | 1.4902 | 1.5798 | 1.6694 | |
| Iceland | GM (1,1) | 0.9336 | 0.983 | 1.0349 | 1.0896 | 1.1472 | 1.2078 | 1.2717 | 1.3389 | 1.4096 |
| IGM (1,1) | 0.7565 | 0.7568 | 0.7571 | 0.7574 | 0.7577 | 0.7580 | 0.7583 | 0.7586 | 0.7589 | |
| Japan | GM (1,1) | 0.4826 | 0.4797 | 0.4768 | 0.4739 | 0.4711 | 0.4682 | 0.4654 | 0.4626 | 0.4598 |
| IGM (1,1) | 0.481 | 0.481 | 0.481 | 0.481 | 0.481 | 0.481 | 0.481 | 0.481 | 0.481 |
Table 3.
The accuracy evaluation metrics for comparing the GM (1,1), and IGM (1,1) models.
| Country | Accuracy Criteria | GM (1,1) | IGM (1,1) |
|---|---|---|---|
| United States | MAE | 0.026 | 0.023 |
| RMSE | 0.028 | 0.030 | |
| MAPE (%) | 0.72 | 0.64 | |
| Indonesia | MAE | 0.072 | 0.070 |
| RMSE | 0.086 | 0.081 | |
| MAPE (%) | 3.86 | 3.63 | |
| Philippines | MAE | 0.009 | 0.001 |
| RMSE | 0.011 | 0.002 | |
| MAPE (%) | 0.48 | 0.05 | |
| Turkey | MAE | 2.955 | 0.088 |
| RMSE | 3.216 | 0.094 | |
| MAPE (%) | 214.26 | 7.42 | |
| New Zealand | MAE | 0.063 | 0.004 |
| RMSE | 0.077 | 0.006 | |
| MAPE (%) | 6.44 | 0.37 | |
| Mexico | MAE | 0.020 | 0.006 |
| RMSE | 0.025 | 0.008 | |
| MAPE (%) | 2.08 | 0.62 | |
| Italy | MAE | 0.010 | 0.003 |
| RMSE | 0.012 | 0.006 | |
| MAPE (%) | 1.25 | 0.37 | |
| Kenya | MAE | 0.107 | 0.020 |
| RMSE | 0.125 | 0.038 | |
| MAPE (%) | 14.20 | 2.54 | |
| Iceland | MAE | 0.050 | 0.008 |
| RMSE | 0.067 | 0.013 | |
| MAPE (%) | 6.64 | 1.04 | |
| Japan | MAE | 0.015 | 0.006 |
| RMSE | 0.17 | 0.011 | |
| MAPE (%) | 3.10 | 1.23 |
Table 4.
Geothermal energy installation capacity prediction for the top 10 countries utilizing geothermal energy in 2030 using the IGM (1,1) model.
Table 4.
Geothermal energy installation capacity prediction for the top 10 countries utilizing geothermal energy in 2030 using the IGM (1,1) model.
| Country | Capacity in Gigawatts (GW) |
|---|---|
| United States | 3.925 |
| Indonesia | 2.8617 |
| Turkey | 2.3714 |
| Philippines | 1.9281 |
| Kenya | 1.6694 |
| Mexico | 1.0778 |
| New Zealand | 1.0695 |
| Italy | 0.9425 |
| Iceland | 0.7589 |
| Japan | 0.481 |
Publisher’s Note: MDPI stays neutral with regard to jurisdictional claims in published maps and institutional affiliations. |
© 2022 by the authors. Licensee MDPI, Basel, Switzerland. This article is an open access article distributed under the terms and conditions of the Creative Commons Attribution (CC BY) license (https://creativecommons.org/licenses/by/4.0/).
Share and Cite
MDPI and ACS Style
Salhein, K.; Kobus, C.J.; Zohdy, M. Forecasting Installation Capacity for the Top 10 Countries Utilizing Geothermal Energy by 2030. Thermo 2022, 2, 334-351. https://0-doi-org.brum.beds.ac.uk/10.3390/thermo2040023
AMA Style
Salhein K, Kobus CJ, Zohdy M. Forecasting Installation Capacity for the Top 10 Countries Utilizing Geothermal Energy by 2030. Thermo. 2022; 2(4):334-351. https://0-doi-org.brum.beds.ac.uk/10.3390/thermo2040023
Chicago/Turabian StyleSalhein, Khaled, C. J. Kobus, and Mohamed Zohdy. 2022. "Forecasting Installation Capacity for the Top 10 Countries Utilizing Geothermal Energy by 2030" Thermo 2, no. 4: 334-351. https://0-doi-org.brum.beds.ac.uk/10.3390/thermo2040023