
Promoting Sustainable Transport in Developing Countries: A Case Study of University Students in Tehran

Department of Civil Engineering, Sharif University of Technology, Tehran 11155-1639, Iran
*
Author to whom correspondence should be addressed.
Future Transp. 2023, 3(3), 858-877; https://0-doi-org.brum.beds.ac.uk/10.3390/futuretransp3030048
Submission received: 24 March 2023
/
Revised: 8 May 2023
/
Accepted: 29 May 2023
/
Published: 1 July 2023
Abstract
:One of the ways to address the modern traffic-related problems is to encourage people to use sustainable travel modes more regularly. Transportation planners need to find the factors that affect people’s opinions toward using these modes. In this study, we investigated these factors using a case study of a developing country by distributing an online survey among the students of four universities in Tehran. The number of complete responses received was 134 from SUT, 63 for UT, 31 from AUT, and 204 from IUST, summing up to 432 responses. A binomial logistic regression model was used to find the paramount factors affecting the selection of cycling and public transportation. Our model found five and four statistically significant factors affecting preferences toward using bicycle and public transport, respectively. Several novel outcomes resulted from our study. First, expressing prestige to others resulted in the reduction of the preference of students toward cycling by 80%. Second, while a high number of the respondents are not currently using bikes to commute, a noticeable number of them are amongst the ones that will cycle in their daily commutes in an ideal condition. Third, in Iran, a religious approach is present in the society, which results in lower rates of public transport usage among females. Finally, while long commuting distance is the main barrier to cycling, travel time plays a bigger role in the preferences toward using public transportation. In the end, some practical solutions are suggested to encourage the usage of these modes. They include providing safe bicycle lanes and more space in the public transportation systems.
1. Introduction
1.1. Research Background and Literature Review
In the previous decades, with the rise of the population which causes urban sprawl, car ownership rates have increased and people are using private cars more than ever [1]. Many countries around the world are exhibiting this trend. For example in Great Britain, according to their department of transports, the passenger-kilometers traveled by cars in the country were multiplied by 12 between 1952 and 2007 [2]. This universal trend resulted in serious environmental and congestion-related issues in large cities. Transportation sectors account for a large portion of greenhouse gas emissions (GHGs) around the world, and it is the largest contributor with more than 28 percent of total GHG emissions in the USA [3]. Estimates suggest that there are 21,000 premature deaths attributable to air pollution in Canada each year, nearly nine times higher than the number of deaths due to motor vehicle collisions [4]. Looking at the bigger scale, it is shown that outdoor air pollution, mostly by , leads to 3.3 million premature deaths per year worldwide and many other health issues, predominantly in Asia [5,6,7]. In the megacity of Tehran, nearly 4000 people die every year from the ambient air pollution resulting from heavy traffic congestions [8].
Some studies showed that exposure to traffic-related air pollution can increase mortality rates and cause disastrous health issues [9,10]. Short-term exposure to air pollutants is closely related to cough, shortness of breath, asthma, respiratory disease, and high rates of hospitalization. On the other hand, the long-term effects associated with air pollution are chronic asthma, pulmonary insufficiency, cardiovascular diseases, and cardiovascular mortality [11].
Fortunately, increasing car use rates have ceased from growing in some developed countries with high-income economies. For instance in Germany (i.e., a European country with a GDP of over USD 3.3 trillion in 2010), from 1990 through 2010, there was a significant decrease in the growth of passenger-kilometers traveled by private car [12]. Moreover, Japan, an Asian country with a GDP of over USD 5.7 trillion in 2010, has been experiencing a decline in car use since 1999 [12].
The main reason behind this reduction is the policymakers and commuters paying more attention to sustainable transportation [13,14]. Sustainable transportation implies finding a proper balance between current and future environmental, social and economic qualities [15]. Sustainable transportation also fits well within the concept of sustainable development. According to the World Commission on Environment and Development, sustainable development is one that meets the needs of the present without compromising the ability of future generations to meet their own needs [16]. Some examples of sustainable transportation modes include walking, cycling, public transit, carpooling, car sharing, and green vehicles.
Up to now, many studies have focused on the importance of using environmentally friendly travel modes. A few of them focused on the preferences of commuters on using sustainable transportation. In Canada for instance, survey data from the city of Montreal along with a multi-step regression model was used to determine the nature of the factors influencing commuters’ perception of public transport as a reasonable commuting option [17]. In another study conducted in the same city, with the help of a multinomial logistic regression model, the factors preventing commuters from cycling regularly were investigated thoroughly [18]. Results showed that physical effort and lack of safety are the most important barriers for potential cyclists and providing cycle paths increases the frequency of cycling commutes. Ref. [19] also measured the relationship between the cycling frequency of citizens and the joint consideration of energy expenditure, air quality, and safety concerns by gathering data with the help of a cyclist intercept survey in Vancouver, Canada.
The emerging interest in understanding the factors affecting the use of sustainable travel modes in Canada can also be seen around the world. For example, ref. [20] measured the perception of the obstacles for cyclists in Jeddah City in Saudi Arabia by using visual examination along with providing a questionnaire. Their results showed that while a noticeable portion of people in the city preferred using the bicycle to commute, most of the observed bicycle facilities were either out of service or suffered from lack of proper quality.
Some other studies are also concerned with the relationship between economic factors and the tendency of people to use sustainable modes of transport. Ref. [21] conducted a survey that examined the effects of the economic crisis on the promotion of sustainable transportation in the city of Volos, Greece. Their results showed that due to the increased unemployment and the decreased personal income during a four-year economic crisis in Greece, commuters preferred to use public transportation, bicycle, or to walk instead of using private vehicles.
Different from previous studies, Iran is not considered a developed country. Previous research has shown that the need for improvement in transport systems in the less developed and fast-growing cities is much more vital compared to developed countries [22]. People are migrating more and more to metropolitan areas in search of job opportunities and better lives. Therefore, there is an urgent need for urban engineers and policymakers to find pragmatic ways to encourage people to use sustainable travel modes more regularly (Pojani & Stead, 2015) in these areas. However, there are only a few studies present in the literature addressing this emerging issue.
In a study carried out by [23] in Mashhad, one of Iran’s most populated metropolitan areas, using a mixed multinomial logit (MMNL) method, the effects of several predicted factors on the people’s tendency to use bike-sharing systems were investigated. Their results showed that factors such as bicycle fare and separated bicycle lanes significantly influence public preferences toward bike-sharing systems. Additionally, ref. [24] investigated the mode choice of students from twelve different universities located in Shiraz, another metropolitan area of Iran, as the representatives of “Generation Y” or “Millennials”. In this study, a multilevel integrated multinomial logit (MNL) and structural equation model (SEM) approach were used to identify the impacts of key variables in travel mode choice decision making. In contrast to similar studies done outside of Iran, their results showed that most students preferred private cars compared to public transit due to their comfort and prestige. Religious restrictions and the prestige of using personal cars were the two main reasons for this preference.
1.2. Research Questions and Contributions
In this study, our focus is on cycling and public transit. In many cities around the globe, these two modes are being used or considered as the future transportation solutions [25,26]. For example, the City of London has a long history of using the subway system as a prominent travel mode choice. Table 1 gives a general image of the studies relevant to preferences toward using cycling and public transport that we investigated in the literature inside and outside of Iran.
To date, no study have investigated the factors associated with the public’s tendency toward cycling and public transport for the daily commutes in Iran. Iran has unique characteristics which makes it an interesting area for further exploration. It is an Islamic, developing, and low-income country. All the studies done outside of Iran mentioned in Table 1 investigated developed countries with strong economies. The only exception is the work done by [27], which only considered public transport. Among the studies done in Iran, none has investigated the city of Tehran. This is important since Tehran’s population and vastness are significantly higher than the other cities mentioned in Table 1 (e.g., the approximate population of 9 million people in Tehran is roughly 20 times more than Kerman’s population, which is 577,000 [29]). More importantly, none of them focused mainly on public transport and cycling simultaneously.
To fill the aforementioned gap in the literature, we shift our focus solely on the City of Tehran as the capital of an Islamic country that has a low-income economy, investigating public transport and cycling simultaneously. To do so, we distributed a survey among the students of four well-known universities in Tehran. The results drawn from this survey help us find the main factors influencing the choice of the students’ travel mode from their residents to the university and vice versa. With the goal of encouraging the usage of cycling and public transport, we organized our focus on the following research questions:
- (1)
- What are the main factors influencing the public’s choice toward using public transport and cycling?
- (2)
- What role do distance and travel time play in choosing public transport or cycling as the main mode of commute?
- (3)
- What are the major factors behind female commuter’s decisions regarding the usage of these two sustainable modes of transport and what are their concerns?
- (4)
- What practical solutions can be suggested to the local authorities to improve the quality and use rates of public transport and cycling?
The remainder of this article is organized as follows. Section 2 gives a background about the target population and its characteristics. Section 3 describes the survey method and the data resulted from it. Section 4 discusses the fundamentals of the model used in the study (i.e., binomial logistic regression). Section 5 presents the outputs of the model along with its interpretations and describes our proposed practical solutions derived from the numerical results of the binomial logistic regression models. Finally, Section 6 concludes the study and provides recommendations for future research.
2. Study Context
There is a growing urgency among the policy makers and agencies toward shifting to sustainable transport especially in a populated city such as Tehran, the capital of Iran. Tehran suffers from a lot of traffic-related issues and usually experiences high degrees of air pollutants [30]. About 2.4 million private cars are the main emission sources of the city’s air pollution [31]. High volumes of traffic and shortage of adequate public transport systems are accountable for the high level of CO2 in Tehran. In recent years, GHG emissions (i.e., CO2) in Tehran has risen to all-time highs [31]. Currently, based on local data sources, approximately 13 percent of Tehran residents use public transport for their daily commute, and this rate is only 0.3 percent for the ones who cycle on a daily basis [32]. Additionally, considering the significant number of daily commuters in the city, the current levels of service and supply to demand ratios of public transport system are not satisfying [33].
Home-based work trips comprise a large portion of inner-city trips, and university students are one of the major groups of people who commute to their workplace (i.e., university) every day. Tehran has 120 universities, with more than 1,380,000 students and approximately 150,000 professors. Currently (i.e., the year 2021), the population of the city is about 9 million people [29], with this huge body of students making a noticeable portion of it (i.e., more than 15%). Students can play a significant role in shaping the travel patterns of a city such as Tehran and their trips adequately captured real traffic patterns [34,35].
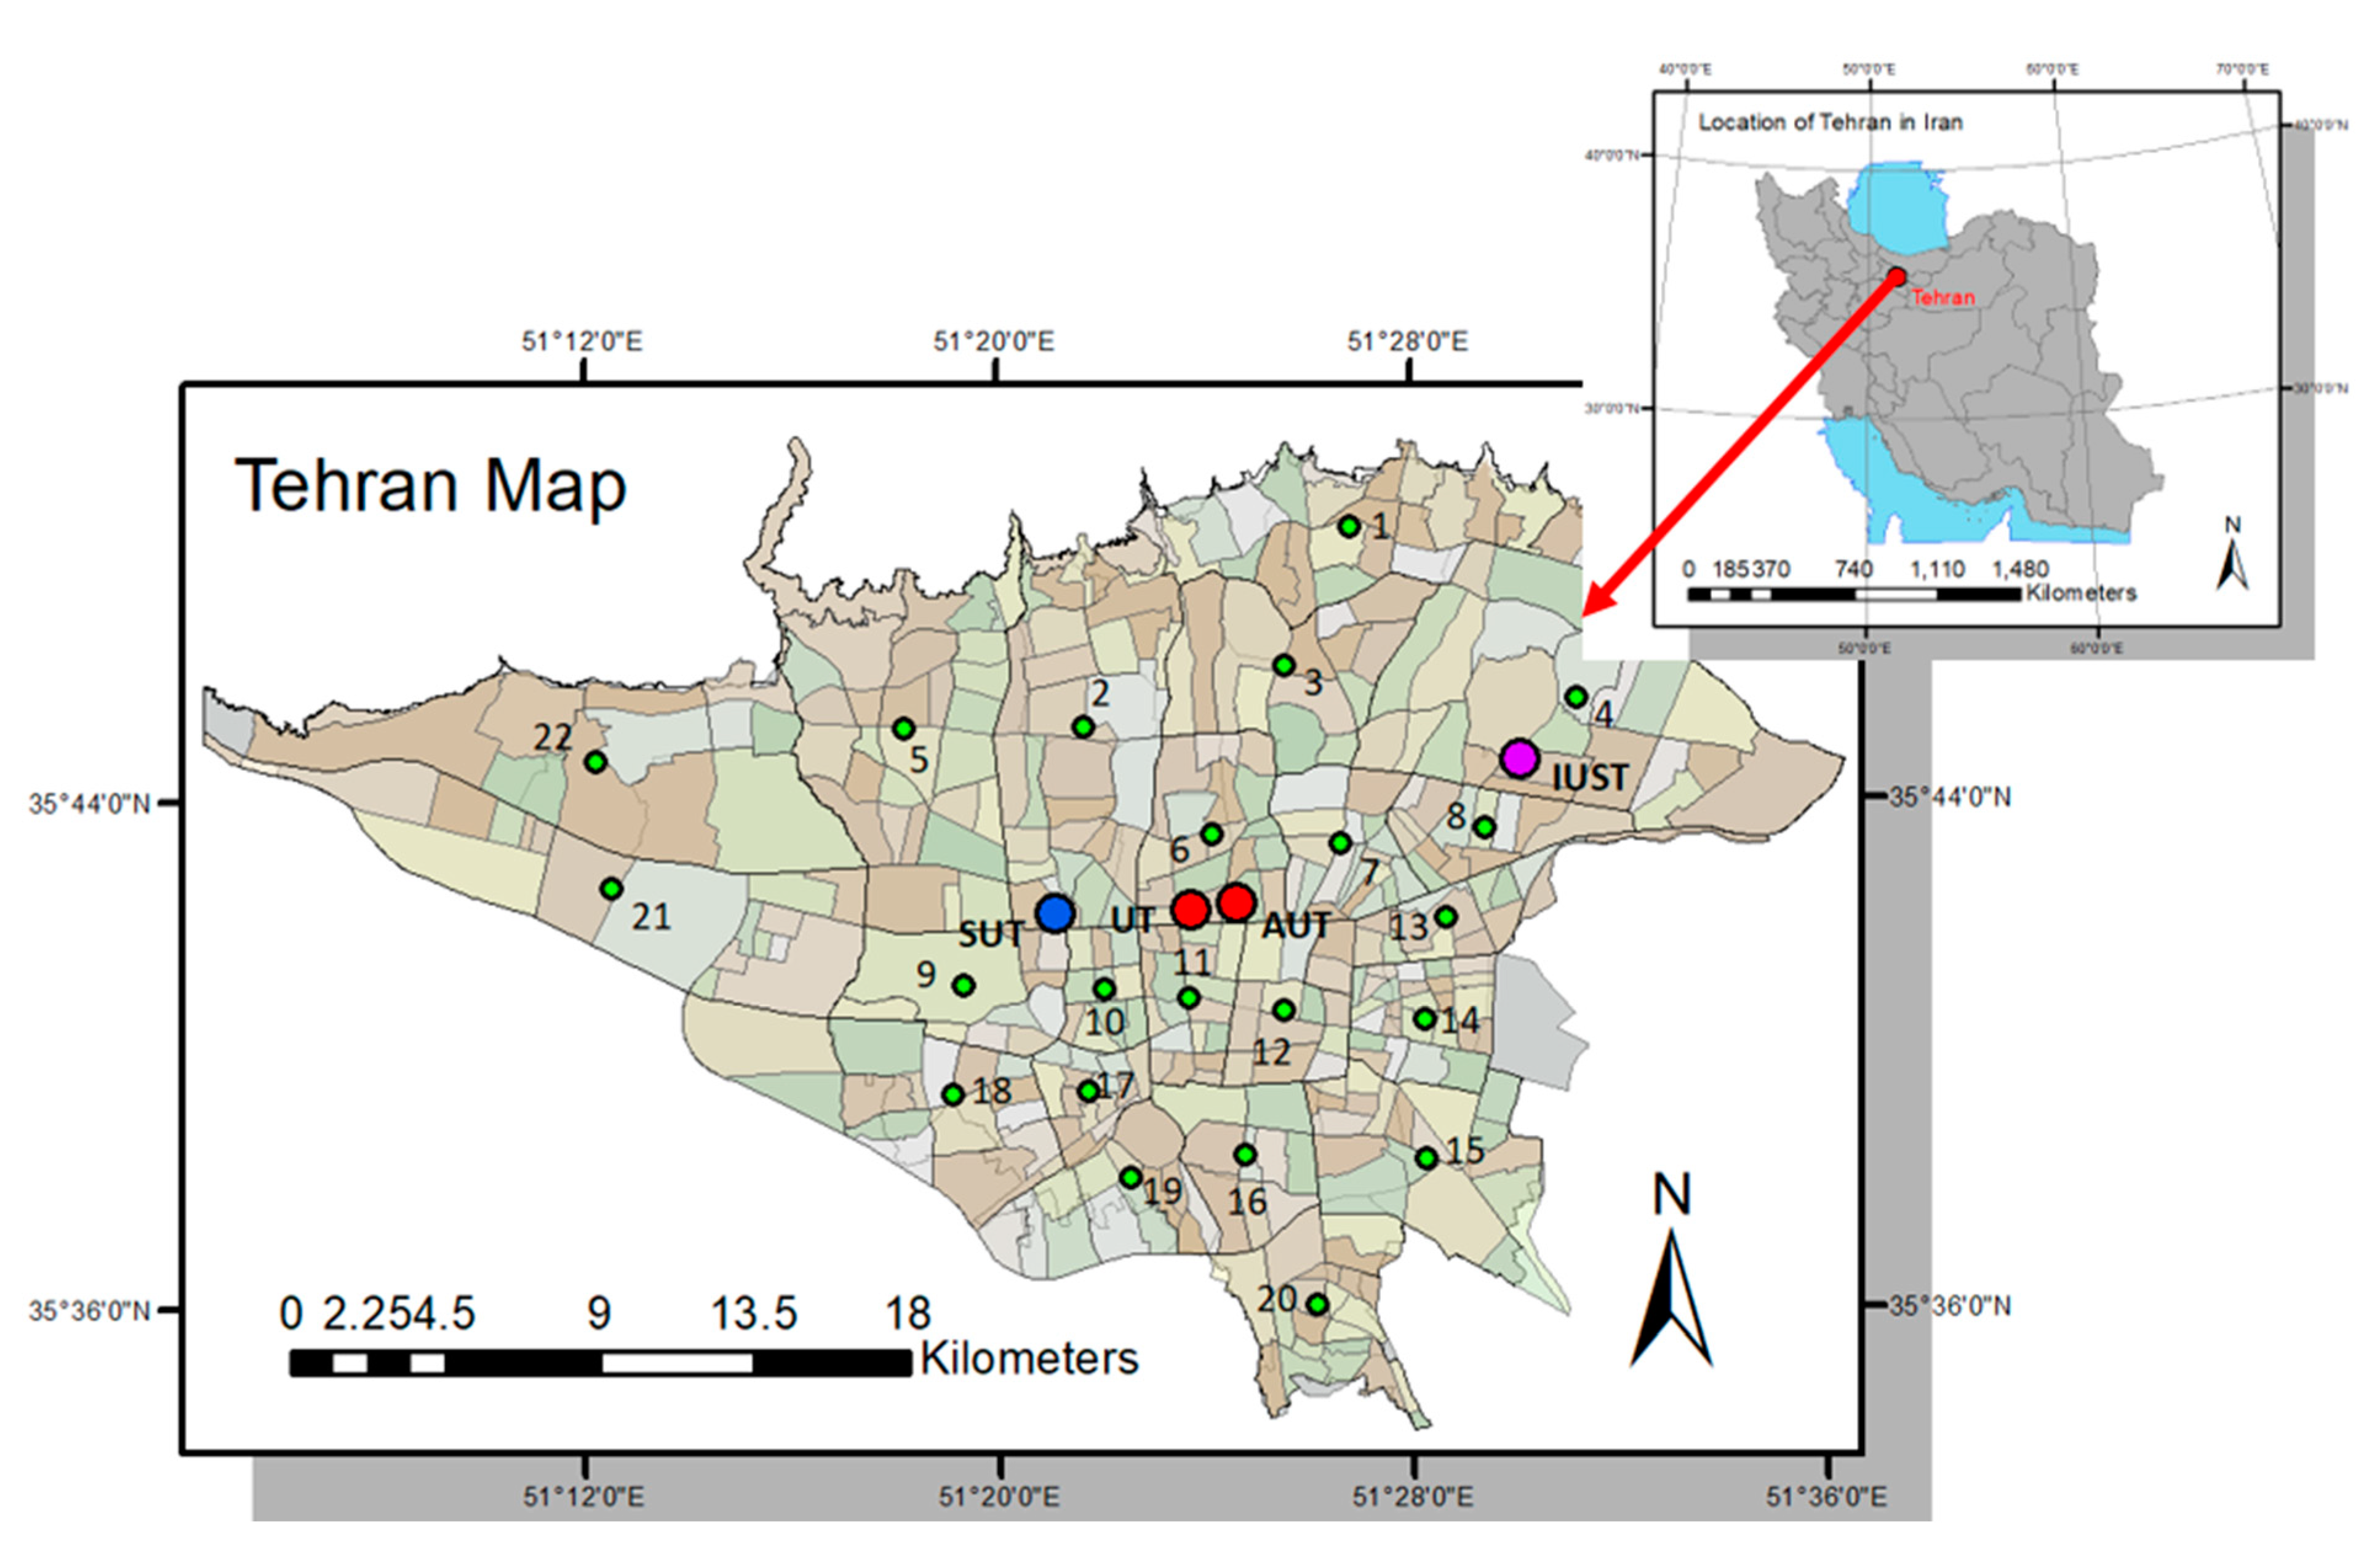
In this study, our focus is on four of the most distinguished universities in Tehran, namely, Sharif University of Technology (SUT), University of Tehran (UT), Amirkabir University of Technology (AUT), and Iran University of Science and Technology (IUST). Each of these four universities is known for its academic reputation and body of intelligent and hard-working students. Based on the websites of the universities, the number of students enrolled at SUT, UT, AUT, and IUST are approximately 12,000, 43,992, 13,400, and 10,840, respectively [36,37,38]. This sums to more than 90,000 students. Another distinguishing characteristic of these four universities is their location compared to each other. While SUT’s location is in the west side of the city, UT and AUT are located downtown, and finally, IUST is in the east side. The unique locations of these four universities along with the availability of public transport facilities and dormitories for a significant number of the students are the reasons that we selected these universities for this study. Figure 1 represents the locations of these four universities in Tehran. Different colors in Figure 1 are various neighborhoods in the city, and the depicted 22 points are the centroids of the main 22 regions in Tehran, which are discussed in more detail in Section 3.3.
3. Survey and Data
3.1. Characteristics of the Survey
In this study, the survey was distributed using online surveying tools. The link for the survey’s website was posted on social media platforms with members from each of the four universities. The number of complete responses received was 134 from SUT, 63 for UT, 31 from AUT, and 204 from IUST, summing up to 432 responses. Due to the online nature of our survey and the common lack of tendency for responding to such surveys, the response rate could not be calculated for our study. The survey contained 38 questions, and these questions were designed to be answered in less than 10 min in a way that the respondents do not feel bored or unwilling during the process of answering them. This resulted in only three incomplete responses. To filter the raw results, these three responses were removed from the initial list. In other words, the number reported (432) does not include these three responses. In addition to the incomplete responses, a total of ten responses were missing some of the questions. It is worth mentioning that our survey was distributed in the early COVID era (i.e., mid-February 2020). At that time, Tehran was in the early stages of preparation for the pandemic, and any long-term impact of COVID on the transportation-related choices of its residents was not showing itself. To further make sure that the pandemic did not have any impact on the survey results, the respondents were asked to consider their travel behavior in a pre-COVID environment.
The first section of the survey was related to the sociodemographic information of the respondents. These questions contained information about gender, educational level, marriage status, and the number of people and cars in their household. Because each university has different campuses, we also asked about the campus that the student is studying on. Some of these campuses named Pardis are built for students who are willing to pay a noticeable amount of tuition for their studies. Therefore, knowing whether the student is a Pardis student can provide us with a dependable indicator of the student’s financial status.
In the second section of the survey, the residential data were gathered from the students. This data included the type of residence (i.e., house/dormitory), the region number in Tehran (out of 22 main regions of Tehran) in which the respondent’s house/dormitory is located. From these answers, the distance between the students’ residences and their universities was determined using Distance Matrix API [39]. This web service is used worldwide to find the duration and distance between two different locations based on the live traffic data. In this study, a platform called Neshan Distance Matrix API was implemented, and to make the distances more realistic, they were measured during the morning peak period, which is the most common time for a vast majority of the students’ commute to the university. The final model containing distance and travel time is discussed in Section 5.3.
In the next section, respondents were asked to specify their current dominant travel mode for daily commute to the university. The available options were gas-powered private cars, taxi, public transit (i.e., subway, bus, etc.), motorcycle, cycling, and walking. Afterward, the same question was repeated with a slight change in the context. Meaning that they were asked to specify their dominant travel mode for daily commute to the university in an ideal condition. Some clarifications were provided at the beginning of this question for the students. According to them, the daily commute to the university meant the trip that the student makes every day to get to the university and then head back home. Trips with other purposes were excluded based on this definition. Furthermore, the dominant travel mode is the mode that the commuter uses the most in his/her daily commute to the university. Additionally, the respondents were given the option to choose the two dominant modes of travel for their daily commutes in present and ideal conditions (e.g., a commuter could select cycling and walking if he/she believed that he/she cycled to a point and walked the remaining distance to the university). More importantly, the definition of ideal was made clear in the survey. According to our definition, the ideal public transportation system has convenient air conditioning, possesses a pleasant density of people, arrives on schedule, is safe against crimes such as pickpocketing, has reasonable ticket pricing, etc. Furthermore, the ideal condition for cycling and walking includes clement weather (i.e., no severe rain or snow), feeling safe against crimes such as mugging, reasonable distance, the existence of separate lanes, etc. We also note that for both modes, we assume that ideal condition encompasses normal inflation and income levels, which was a reasonable assumption during the time of study, considering the general inflation trends in the country.
The remainder of the questions of the survey was designed to identify the impact of several factors on the students’ choice regarding the dominant travel mode in ideal condition. These factors were classified into three groups: (1) ability to use a certain mode of transport, (2) economic factors, (3) personal preferences, including the value of time, security, comfort and physical distance, climate condition, being near to public transportation/cycling facilities or the university, concerns of the respondents about anthropogenic impacts on the environment, effects of social media and other people’s behaviors on the student’s mode choice, and cultural differences resulted from the religious beliefs. The impact of each group was investigated by asking questions about the amount of importance that a matter has to the respondent. For instance, we asked how important is for the student to live in a house located near a subway station. The given options were extremely important, nearly important, neutral, not that important, and not important at all.
3.2. Survey Results
Some of the socio-demographic characteristics of the target population used in the modelling are presented in Figure 2. Based on the data, some insight and observations were made. First of all, unlike other sustainable transportation surveys distributed in Iran (e.g., [24], we have gender diversity in our results, and the male-female ratio is nearly equal to 1. This is worth mentioning that all four universities in this study are mainly technological universities with a high male ratio especially SUT, AUT, and IUST. Here, it seems reasonable to assume there must be a huge difference between the number of male and female responses. The reason behind this contrast can be attributed to the higher interest of females in the topic of our survey. Since the responders were aware of the nature of our survey beforehand, we conclude that environmental concerns and trends toward sustainable transportation are higher in the female body in our sample. Altogether, our male/female ratio is closer to the reality of the population in Tehran, and similar to relevant studies done on bodies of students in other countries [17].
There are some other qualitative results that can be derived from the data as well. For instance, the proportion of undergraduate to graduate students in our sample is roughly equal to 1, and more than 93 percent of the students are single. Furthermore, most of them live in dormitories and have families with four members in them. Additionally, more than 75 percent of the respondents live in the city of Tehran, which is a reasonable number due to the closer distance of their homes to their universities.
To make the raw data ready for modeling, several steps were taken. First, the answers for questions with only two possible outcomes were transformed into binary values, making them suitable for being the input variables of our model. Second, binary values were also assigned to the answer to questions regarding the current and ideal modes of transport. This means if a mode was selected by a respondent, the value of one was assigned to it. Finally, the answers describing the importance of several parameters were changed into five values. More specifically, extremely important, nearly important, neutral, not that important, and not important at all were set to 1, 0.75, 0.5, 0.25, and 0 respectively. A summary statistic of the variables used for the modelling is provided in Table 2. One of the initial results that can be derived from this summary is the fact that while a high number of the respondents are not currently using bikes to commute, a noticeable number of them are amongst the ones that will cycle in their daily commutes in an ideal condition.
3.3. Finding Distances and Travel Time Using Distance Matrix API
Prior to developing the model, two additional variables were needed to be obtained. These variables were the distance and travel time for each of the respondents. Using ArcGIS, we found the centroid for each of the 22 regions in the city of Tehran. By knowing the specific region of living for each of the respondents, we assigned the centroid of that region to the respondents as his/her origin of commute. The destinations were classified into three groups. These groups were the locations of SUT, IUST, and AUT/UT. Since AUT and UT are adjacent to each other, we assumed them as one destination, and the location of this destination was calculated accordingly. Figure 3 presents the respondents’ travel flows between their residential address and universities. In this figure, the thickness of the arrows has a direct relation with the number of students commuting between the two ends of them.
After determining the OD matrix which consists of 22 origins and 3 destinations, we used Distance Matrix API to find the real-time distance and travel time between each of these locations. Distance Matrix API is a service that provides travel distance and time for a matrix of origins and destinations, based on the definition provided by Google ([40] Google Developers, accessed on 14 February 2021). The API returns information based on the recommended route between start and endpoints, as calculated by the Google Maps API. The achieved values are vehicular distance and travel times. An Iranian version of this web service is the Neshan Platform, which we used in this study ([41] Neshan Platform, accessed on 14 February 2021). The output of the web service was achieved during the morning peak period, which is like a typical daily commute for students on a normal workday. Afterward, values of distance and travel time were assigned to each of the respondents based on their origin and destination. Figure 4 shows the frequency of distance and travel time of commuters for each of the three destinations, resulted from the Distance Matrix API.
Some interpretations can be made from these plots. Focusing on travel times, for instance, students who commute to AUT/UT experience higher travel times on average during their daily commute compared with SUT and IUST. This observation is reasonable since these two universities are in the center of Tehran, which is the most populated area of the city during common workdays. Therefore, these students spend more time in traffic compared to students of SUT and IUST. Regarding the distances, AUT/UT possesses students from nearly every region of Tehran, traveling a wide range of distances with a near-uniform distribution. On the other hand, most of SUT and IUST’s students commute shorter distances, indicating the closeness of their residence to their universities. In other words, IUST mostly attracts students from the east side since it is located on the east side, and SUT has more students from the west side of the city based on its location.
4. Modeling
In this study for the modeling, a binomial logistic regression was adopted. Logistic regression is a statistical model that uses a logistic function to model a binary dependent variable (DV). This model, though simple, fits perfectly well with our goals. It is broadly used in the literature to find the extent of relationships between possible cause and effect variables. As a recent example, ref. [17] used this model to investigate the factors influencing travelers’ perception of public transport as a reasonable commuting option. Furthermore, in our case study, few observations were available to conduct a meaningful multi-level analysis.
Mathematically, a binomial logistic model has a DV with two possible values, such as yes/no, which is usually showed by “0” and “1” and is represented by independent variables (IV). More specifically, this type of analysis can help predict the likelihood of an event happening or a choice being made, and it is one of the pragmatic ones among its kind.
Equation (1) provides the basis of calculating the probability of the student saying “yes” to a yes/no question (i.e., y = 1) based on his/her responses to other questions.
where
- is the probability of the binary response variable y being equal to 1, given the values of the predictor variables , ,…, .
- , , ,…, are the coefficients (also known as weights or parameters) of the logistic regression model.
This equation is used to model the probability of a binary outcome (y = 1 or y = 0) based on a set of predictor variables. The logistic regression model estimates the coefficients , , ,…, based on the training data, and then uses these coefficients to predict the probability of the outcome variable for new observations.
In the first step, we used the logistic regression model to find the factors that influenced the selection of cycling as the vehicle for daily commute to the university by the students in an ideal condition described in the survey. In the second step, we carried out the same modeling approach to find the factors responsible for choosing public transportation in ideal condition. The impact of distance and travel time on people’s decisions was investigated next. In the next step, we analyzed the answers of female commuters to the survey along with their concerns regarding these two travel modes. It should be noted that in all the modeling steps, we analyzed the correlation factors between the independent variables to make sure that their correlation factors were negligible. Finally, we suggested practical solutions for promoting the usage of bicycles and public transportation in Tehran.
5. Results and Discussion
5.1. Using Bicycle in an Ideal Condition
The results of the model developed for using a bicycle in an ideal condition are given in Table 3. The factors with a high impact on the respondent’s usage of the bicycle as the main mode to commute were extracted based on having a significance level (i.e., p-value) lower than 0.05, which shows that the parameter is statistically significant in our modeling. Therefore, five statistically significant variables resulted from the model sorted by the highest significance are (1) knowing how to bike, (2) expressing prestige to others, (3) house being near to bike-sharing station, (4) caring for health benefits of cycling, (5) currently using bicycle to commute, respectively.
Table 3 also gives the odds ratio (OR) and upper and lower confidence interval (CI) for each IV. OR represents the odds that an outcome will occur given a particular circumstance, compared to the odds of the outcome occurring in the absence of that circumstance [42]. An OR greater than 1 results in higher odds of an outcome happening. Additionally, the 95% CI is used to estimate the precision of the OR. A large CI indicates a low level of precision of the OR, whereas a small CI indicates a higher precision of the OR. If the CI for the OR includes the number 1 then the calculated OR would not be considered statistically significant [42]. It can be seen from Table 3 that all the significant variables do not include the number 1, proving the significance of the ORs.
Some interpretations can be derived from the ORs of the five significant variables. For example, students who “know how to bike” have approximately nine times higher probability of choosing bicycle as their main mode in an ideal condition. Expectedly, “expressing prestige to others” has an extreme impact on reducing the preference of students toward cycling, which is almost an 80% reduction. This outcome is similar to the results of a study done in the city of Shiraz by [24] regarding the high attention of students to express prestige to others. Not surprisingly, when a student cares about “living near to the bike-sharing stations” while buying/renting a house, he/she has a higher probability of selecting cycling as the main mode of commute to the university. Moreover, it is seen that a lot of people who are looking to use a bicycle in ideal conditions look at it as a way to work out and maintain a healthy physical status (i.e., caring for the health benefits of cycling). Finally, the fifth significant variable (i.e., currently using bicycle to commute) shows that people who are currently using bicycle as their main mode have a higher probability of using it in an ideal scenario, which is an expected result.
Additionally, three of the variables have p-values lower than 0.1 that can be described as significant at the 90% confidence level, which are: (1) currently walking to the university, (2) caring about saving travel time, and (3) caring about the security of public transport. The first IV has an OR of 2.3, meaning that students who usually walk to their university have a 2.3 times higher probability of using bicycle in an ideal condition. This OR seems reasonable since people who walk are more active commuters and will probably prefer using a bicycle in comparison with other travel modes due to their active nature and higher speed of cycling comparing to walking. The second IV has an odds ratio of roughly 0.25, meaning that those students who care a lot about travel time are less inclined toward using bicycle even in an ideal condition. The third IV shows that people who are concerned about their safety in public transportation are also interested in cycling in case of the existence of a safe cycling environment.
Table 4 shows the final performance of our model. Our model possesses a total accuracy of 72.3%, which is promising, considering the nature of our input data which is from a survey designed to catch the various behaviors of students in Tehran.
5.2. Using Public Transportation in an Ideal Condition
Table 5 shows the result of the binomial logistic regression model developed to determine the deciding factors involved in choosing public transport as the main mode for daily commutes. In our study, public transport comprises of bus and subway, and if a respondent chose either of these two, it was counted as selecting public transport. Akin to the previous section, the order of the four most significant variables based on having p-values lower than 0.05 are: (1) currently using the subway, (2) house being near to public transport station, (3) the number of cars owned by the family, and (4) house being near to bike-sharing station.
Expectedly, people who are currently using the subway have a three times higher probability of choosing public transport in an ideal condition. Moreover, the students who prefer to live close to the public transport stations have a nine times higher probability of selecting public transport. In addition, as the number of car ownership rises, the probability of selecting public transport in an ideal world diminishes drastically. Another interesting observation of this study is the fact that if a student prefers living near a bike-sharing station, he will have an 80 percent lower probability of using public transport in an ideal condition.
Other variables with p-values lower than 0.1 (significant at the 90% confidence level) are (1) marital status, (2) gender, and (3) currently using taxi. Our results show that people who are married have 66 lower probabilities of using public transport. This outcome is reasonable since single people are more mobile and care less about privacy and distance from other people. Moreover, male students are more likely to use public transportation in an ideal condition. This also is a reasonable outcome due to cultural and gender differences in the country. In Iran, a conservative and religious approach is present in the society, which results in lower rates of public transport usages among females. Meaning that female students prefer to use other modes of transport (e.g., taxi, private car) instead of public transportation. Finally, commuters who use taxi in the current condition have a 100% higher probability of using public transport in an ideal condition.
Table 6 shows the final performance of our model for public transportation. This model possesses a total accuracy of 77.5%. Based on Table 6, the ability of our model to predict the “Yes” answers with more than 90%, but its performance is less efficient while predicting “No” answers. This might be caused by the fact that a larger number of people are willing to use public transportation in comparison with cycling, leading to more reliable data for the “Yes” predictor of the model built for public transport. The overall accuracy of this regression is nearly 5% higher than the model for predicting cycling interests. Akin to the previous model, this overall accuracy is promising for a logistic regression model considering the nature of the input data.
5.3. Impacts of Distance and Travel Time
Up to this point, all of the questions used in the models were answered by all of the respondents. The two remaining groups of questions were not answered by all the students. These were the questions regarding the respondent’s region of living and two additional questions designed for female respondents. The results of the first question led to finding the distance and travel time of each student, and the other two questions were used to address the current situation of the travel behavior of females.
To investigate the effects of distance and travel time on using bicycle and public transportation, we built two separate binomial regression models based on adding variables that yield p-values lower than 0.05. After building these two models, we added the distance and travel time as two additional IVs. Table 7 shows the results of this procedure for choosing cycling in an ideal condition. Based on Table 7, the distance of the trip p-value is lower than 0.05 and is considered a significant parameter on cycling in an ideal condition. Expectedly, increasing the trip distance will lower the probability of using bicycle. However, travel time cannot be considered a statistically significant variable based on its p-value. One interpretation is that the trip distance and the physical burden caused by it during cycling are more important in the minds of students than the travel time.
Table 8 presents the results of the logistic regression model built for choosing public transport in an ideal condition considering the distance and travel time of commuters. In contrast to cycling, p-values of distance and travel time are extremely high in the model built for choosing public transport in the ideal condition and these variables are not statistically significant. Nonetheless, and unlike the previous interpretation for cycling, higher travel time will lead to a reduction in the probability of choosing public transport. Understandably in this scenario, students care about their travel time and want to spend a lower time on public transportation in an ideal condition.
5.4. Female Commuters
Following the same procedure, we added two exclusive variables from the female commuters’ answers to the initial regression models built for using bicycle and public transportation in an ideal condition. Table 9 shows the results of the new model after adding these two questions. In contradiction to all the previous models developed in this study, which had a sample size of 432 students, this model used the 200 responses from the female students. The results show that being immune to verbal and physical harassment is statistically significant in the modeling. More specifically, when a female student cares about the absence of this type of harassment, she possesses 14 times higher probability of choosing cycling. Moreover, female commuters do not care about public opinion about their dressing while cycling. This represents self-confidence in female students in Iran that they are willing to break down the current barriers in using this mode of transportation. It should be noted that the status of cycling for females has always been in a gray area in countries such as Iran. There is no specific law that clearly forbids females from cycling, but various government organizations and authorized groups have different opinions on this topic which makes it a controversial issue.
Table 10 shows the result of the binomial logistic regression model for choosing public transportation in an ideal condition among female commuters. We can see that “Lack of other people’s harassment on dressing” factor is statistically significant in this model. However, it is shown that female commuters who have concerns about this issue are extremely opposed to using public transport. An OR of 0.277 shows that the females who are concerned about harassment have approximately 80 percent less probability of using public transportation. This outcome is in contrast with the results of the model for cycling. Meaning that while females with concerns about harassment are more interested in using bicycle as their travel mode, females with similar concerns prefer not to use public transport. It can be explained by the fact that any type of harassment is always more present in other modes compared to the time that the female commuter uses a bicycle [43].
5.5. Practical Solutions
Based on the results, a few solutions for policy makers and local authorities are provided in this section. These solutions are placed into two categories. The first category contains ideas for promoting the usage of bicycles in Tehran, while the second category includes solutions regarding more efficient planning for public transport.
Solutions to build a bicycle-friendly city:
- (1)
- Based on the results, the most important factor leading to the usage of bicycles is that the person knows how to use a bicycle. Therefore, municipalities can hold classes for the adults who are not familiar with cycling and train them how to use bicycles properly in cities.
- (2)
- Right now, many people in Tehran see cycling as a non-classy mode of transportation. By means of various platforms, including social media, these groups of people can learn that in contrast to what they think, cycling is one of the most prestigious modes of travel in many modern societies, especially European megacities. Other platforms can also play a role in persuading people to more often use bicycles to commute to their workplace.
- (3)
- Building exclusive cycling paths that provide the commuters with a fast and safe trip should also be placed among the main priorities. Based on our results, a noticeable number of commuters do not cycle due to time concerns. In addition, people who are concerned about their safety stated that they are willing to cycle in an ideal condition, showing that being safe is a contributing factor in their mode of choice. Finally, based on the results from the model built for cycling considering distance and travel time, decreasing the commute distance can be another idea to encourage more usage of bicycles. This can be accomplished by building exclusive cycling paths in a way that consist of noticeably lower distances compared to the streets for the students’ daily commute.
- (4)
- Our results show that a significant number of commuters who use public transit can be swayed to cycling mode. Tehran’s public transportation system usually operates with a demand that is far higher than its capacity. Therefore, appropriate policies and the development of cycling infrastructure can lower the demand for public transportation by swaying a part of public transport users to cycling.
It should be noted that at this moment, in the year 2021, the city of Tehran is not by any means a city suitable for cycling. The lack of cycling infrastructure (i.e., bike lanes, the absence of bike-sharing stations, etc.) and the unhealthy condition of Tehran’s air quality on most days of the year are only the first ones among numerous obstacles for cycling in this city. Nonetheless, if carried out carefully, the above solutions can solve numerous problems in Tehran.
Solutions to make public transportation more efficient:
Currently, many daily commutes in Tehran are done by public transport. About 541 million inner-city trips were done using bus lines in 2017, and the total trips done by the subway lines at 2017, were 723 million [32]. However, these numbers do not suggest that people are satisfied with the public transport system in the city. They use public transport mainly because of its affordability and due to the lack of other alternatives. As a result, our solutions to promote the efficiency of public transportation are more aligned with increasing the level of satisfaction for the commuters using this mode of transport. Since our results show that commuters who currently use public transport (i.e., specifically subway) have more than three times higher probability of using this mode in an ideal condition, the local authorities should improve public transport facilities to convince current customers to continue using this mode of transport. Some of these ideas and improvements are given below.
- (1)
- Our results indicate that the social environment inside subway and bus spaces is a deciding factor in people’s minds when they decide to use/not to use public transport. This social environment has some key elements. First, based on our results, married people are less inclined to use public transport, providing a safer environment for families can revamp the subway and bus systems of Tehran. Second, our results also show that females have a lower probability of using public transport. Therefore, providing a stable and secure environment for females can be a priority as well. At this moment, there are separate spaces in buses and subway system for females, but other than that places public transport extremely uncomfortable for females. This lack of comfort is the result of the high density and the overall social interactions between opposite genders. By advertising moral standards and by providing more space these problems can be solved.
- (2)
- Privacy is also a prominent factor in using public transport. Our results showed that in contrast to people who currently use taxis, TNC users are not willing to use public transport in an ideal condition. Therefore, by providing a more sense of privacy in public transport, TNC users can also be swayed to commuting with public transport. To do this, the first act can be similarly increasing the space and adding more seats. Moreover, there can be special offers for frequent users of public transport (e.g., yearly pass holders) that they can reserve a seat before their trip [44].
- (3)
- Like cycling, using public transportation can be advertised on different platforms. However, there should be a change in public transportation infrastructure prior to this advertisement to persuade people to change their travel mode.
6. Conclusions
In this study, the factors that had the most impact on people’s decisions regarding the usage of cycling and public transport in their daily commute were investigated in the city of Tehran. This was done by distributing a survey among the students of four well-known universities in the city. Here, two separate binomial logistic regression models were used to measure the effect of various factors on cycling and public transport. Our results showed that the students who want to express prestige to others are not among the ones who prefer cycling in an ideal condition. Moreover, female commuters generally prefer not to use public transport in Tehran. In the next part of the study, the role of distance and travel time of daily commutes in the public’s decision regarding the usage of cycling and public transport were investigated. The results showed that long travel distances can decrease the likelihood of cycling for the daily commute, while travel time had a bigger effect on the public’s decision regarding using public transport systems. Then, female commuters’ choice of mode was studied more thoroughly. More specifically, by developing separate logistic regression models, females’ concerns and preferences in this matter were analyzed. Results of this model showed that overall, cycling is a preferable choice among the female commuters who have concerns and are worried about the existence of any kind of harassment on them.
Finally, practical solutions for policymakers and local authorities were given, providing them with practical ideas derived from our results. Based on these results, offering free training programs for people to learn how to use bicycles, using various platforms to encourage people that cycling and public transport do not represent any lack of prestige, and providing safe environments for both of these modes can lead to increasing their usage.
Overall, the results of this study can be generalized to megacities in developing countries such as Tehran. However, these kinds of studies are sensitive to individual contexts, especially due to geographical and cultural differences. Therefore, detailed studies should be done, investigating other metropolitan areas around the world. The use of more advanced modeling techniques and investigating their suitability and impacts on the results should be focused as a topic of further study [45,46]. Finally, it should be noted that cities such as Tehran are still in the early stages of moving toward sustainability (e.g., sustainable transport systems), and numerous steps are required before reaching this end. We should know that although we need a systematic design and comprehensive plan to achieve sustainability goals, the actual design should be done gradually and leave room for future construction in cities [47].
Author Contributions
Conceptualization, A.K. (Ali Kazemeini) and A.K. (Amirhassan Kermanshah); methodology, A.K. (Ali Kazemeini) and A.K. (Amirhassan Kermanshah); software, A.K. (Ali Kazemeini); validation, A.K. (Ali Kazemeini) and A.K. (Amirhassan Kermanshah); formal analysis, A.K. (Ali Kazemeini) and A.K. (Amirhassan Kermanshah).; investigation, A.K. (Ali Kazemeini) and A.K. (Amirhassan Kermanshah); resources, A.K. (Ali Kazemeini) and A.K. (Amirhassan Kermanshah); data curation, A.K. (Ali Kazemeini); writing—original draft preparation, A.K. (Ali Kazemeini) and A.K. (Amirhassan Kermanshah); writing—review and editing, A.K. (Ali Kazemeini) and A.K. (Amirhassan Kermanshah); visualization, A.K. (Ali Kazemeini); supervision, A.K. (Amirhassan Kermanshah); project administration, A.K. (Ali Kazemeini) and A.K. (Amirhassan Kermanshah); funding acquisition, A.K. (Amirhassan Kermanshah). All authors have read and agreed to the published version of the manuscript.
Funding
This research received no external funding.
Institutional Review Board Statement
Not applicable.
Informed Consent Statement
Informed consent was obtained from all subjects involved in the study.
Data Availability Statement
The data presented in this study are available on request from the corresponding author. The data are not publicly available due to maintaining the privacy of survey responders.
Conflicts of Interest
The authors declare no conflict of interest.
References
- Jones, P. The evolution of urban mobility: The interplay of academic and policy perspectives. IATSS Res. 2014, 38, 7–13. [Google Scholar] [CrossRef] [Green Version]
- Mackett, R.L. Reducing car use in urban areas. In Transport and Sustainability; Emerald Group Publishing Ltd.: Bingley, UK, 2012; Volume 3, pp. 211–230. [Google Scholar] [CrossRef]
- Kermanshah, A.; Baroud, H.; Abkowitz, M. Cyber-Physical technologies in freight operations and sustainability: A case study of smart GPS technology in trucking. Sustain. Cities Soc. 2020, 55, 102017. [Google Scholar] [CrossRef]
- Brauer, M.; Reynolds, C.; Hystad, P. Traffic-related air pollution and health in Canada. Can. Med. Assoc. J. 2013, 185, 1557–1558. [Google Scholar] [CrossRef] [PubMed] [Green Version]
- Kermanshah, A.; Sotoudeheian, S.; Tajrishy, M. Satellite and ground-based assessment of Middle East meteorological pa-rameters impact on dust activities in western Iran. Sci. Iran. 2016, 23, 2478–2493. [Google Scholar] [CrossRef] [Green Version]
- Lelieveld, J.; Evans, J.S.; Fnais, M.; Giannadaki, D.; Pozzer, A. The Contribution of Outdoor Air Pollution Sources to Premature Mortality on a Global Scale. Nature 2015, 525, 367–371. [Google Scholar] [CrossRef]
- Sotoudeheian, S.; Jalilvand, E.; Kermanshah, A. Using High-Resolution Climate Models to Identify Climate Change Hotspots in the Middle East: A Case Study of Iran. Climate 2022, 10, 161. [Google Scholar] [CrossRef]
- Heger, M.; Sarraf, M. Air Pollution in Tehran: Health Costs, Sources, and Policies; World Health Organization: Geneva, Switzerland, 2018. [Google Scholar]
- Hoek, G.; Krishnan, R.M.; Beelen, R.; Peters, A.; Ostro, B.; Brunekreef, B.; Kaufman, J.D. Long-term air pollution exposure and cardio- respiratory mortality: A review. In Environmental Health: A Global Access Science Source; BioMed Central: London, UK, 2013; Volume 12, p. 43. [Google Scholar] [CrossRef] [Green Version]
- Peters, A.; Von Klot, S.; Mittleman, M.; Meisinger, C.; Hörmann, A.; Kuch, B.; Wichmann, H.E. Triggering of acute myocardial infarction by different means of transportation. Eur. J. Prev. Cardiol. 2013, 20, 750–758. [Google Scholar] [CrossRef]
- Manisalidis, I.; Stavropoulou, E.; Stavropoulos, A.; Bezirtzoglou, E. Environmental and Health Impacts of Air Pollution: A Review. In Frontiers in Public Health; Frontiers: Lausanne, Switzerland, 2020; Volume 8, p. 14. [Google Scholar] [CrossRef] [Green Version]
- Dender, V. Recent Trends in Car Usage in Advanced Economies—Slower Growth Ahead? International Transportation Forum: Andre Pascal, Paris, 2013. [Google Scholar]
- Goldman, T.; Gorham, R. Sustainable urban transport: Four innovative directions. Technol. Soc. 2006, 28, 261–273. [Google Scholar] [CrossRef]
- Jones, L.R.; Cherry, C.R.; Vu, T.A.; Nguyen, Q.N. The effect of incentives and technology on the adoption of electric motorcycles: A stated choice experiment in Vietnam. Transp. Res. Part A Policy Pract. 2013, 57, 1–11. [Google Scholar] [CrossRef]
- Steg, L.; Gifford, R. Sustainable transportation and quality of life. J. Transp. Geogr. 2005, 13, 59–69. [Google Scholar] [CrossRef]
- Report of the World Commission on Environment and Development: Our Common Future towards Sustainable Development 2. Part II. Common Challenges Population and Human Resources 4. 1987. Available online: https://sustainabledevelopment.un.org/content/documents/5987our-common-future.pdf (accessed on 23 March 2021).
- Deweese, J.; El-Geneidy, A. Commuters’ Assessment of Public Transport as a “Reasonable” Option in Montreal, QC. Transp. Res. Rec. J. Transp. Res. Board 2020, 2674, 351–362. [Google Scholar] [CrossRef]
- Manaugh, K.; Boisjoly, G.; El-Geneidy, A. Overcoming barriers to cycling: Understanding frequency of cycling in a University setting and the factors preventing commuters from cycling on a regular basis. Transportation 2017, 44, 871–884. [Google Scholar] [CrossRef]
- Bigazzi, A.Y.; Gehrke, S.R. Joint consideration of energy expenditure, air quality, and safety by cyclists. Transp. Res. Part F Traffic Psychol. Behav. 2018, 58, 652–664. [Google Scholar] [CrossRef]
- Aljoufie, M. Examining the Challenges of Bicycle Use in Jeddah City. Procedia Environ. Sci. 2017, 37, 269–281. [Google Scholar] [CrossRef]
- Galanis, A.; Botzoris, G.; Siapos, A.; Eliou, N.; Profillidis, V. Economic crisis and promotion of sustainable transportation: A case survey in the city of Volos, Greece. Transp. Res. Procedia 2017, 24, 241–249. [Google Scholar] [CrossRef]
- Khisty, C.J. Sustainable Transport Development in Developing; Springer: Boston, MA, USA, 1997; pp. 67–72. [Google Scholar] [CrossRef]
- Abolhassani, L.; Afghari, A.P.; Borzadaran, H.M. Public preferences towards bicycle sharing system in developing countries: The case of Mashhad, Iran. Sustain. Cities Soc. 2019, 44, 763–773. [Google Scholar] [CrossRef]
- Etminani-Ghasrodashti, R.; Paydar, M.; Hamidi, S. University-related travel behavior: Young adults’ decision-making in Iran. Sustain. Cities Soc. 2018, 43, 495–508. [Google Scholar] [CrossRef]
- Mallett, W.J. Trends in public transportation ridership: Implications for federal policy. In Transportation: Congressional Issues, Financing and Improvements; Congressional Research Service: Washington, DC, USA, 2019. [Google Scholar]
- Shaheen, S.A.; Guzman, S.; Zhang, H. Bikesharing in Europe, the Americas, and Asia: Past, Present, and Future. Transp. Res. Rec. J. Transp. Res. Board 2010, 2143, 159–167. [Google Scholar] [CrossRef] [Green Version]
- Susilo, Y.O.; Joewono, T.B.; Santosa, W. An Exploration of Public Transport Users’ Attitudes and Preferences towards Various Policies in Indonesia: Some Preliminary Results. J. East. Asia Soc. Transp. Stud. 2010, 8, 1230–1244. [Google Scholar] [CrossRef]
- Bahreini, A.; Mirzan, H.; Moeinaddini, M.; Asadi-Shekari, Z.; Shah, M.Z.; Sultan, Z. Evaluating significant factors that influence public transport usage in Kerman, Iran. Plan. Malays. J. 2016. [Google Scholar] [CrossRef]
- World Population Review. Tehran Population 2021 (Demographics, Maps, Graphs). 2021. Available online: https://worldpopulationreview.com/world-cities/tehran-population (accessed on 23 March 2021).
- Sotoudeheian, S.; Arhami, M. Estimating ground-level PM2.5 concentrations by developing and optimizing machine learning and statistical models using 3 km MODIS AODs: Case study of Tehran, Iran. J. Environ. Health Sci. Eng. 2021, 19, 1–21. [Google Scholar] [CrossRef] [PubMed]
- Kakouei, A.; Vatani, A.; Bin Idris, A.K. An estimation of traffic related CO2 emissions from motor vehicles in the capital city of, Iran. Iran. J. Environ. Health Sci. Eng. 2012, 9, 13. [Google Scholar] [CrossRef] [PubMed] [Green Version]
- Mojtehedzadeh, M. Assessment of Urban Transport System in Tehran. Suti Report. 2019. Available online: https://www.unescap.org/sites/default/files/Tehran.pdf (accessed on 23 March 2021).
- Allen, H. An Integrated Approach to Public Transport, Tehran. Global Report on Human Settlements. 2013. Available online: https://nanopdf.com/download/an-integrated-approach-to-public-transport-tehran-un_pdf (accessed on 2 August 2022).
- Giacomin, D.J.; Levinson, D.M. Road network circuity in metropolitan areas. Environ. Plan. B Plan. Des. 2015, 42, 1040–1053. [Google Scholar] [CrossRef] [Green Version]
- Kermanshah, A.; Derrible, S.; Berkelhammer, M. Using Climate Models to Estimate Urban Vulnerability to Flash Floods. J. Appl. Meteorol. Clim. 2017, 56, 2637–2650. [Google Scholar] [CrossRef]
- AUT Facts and Figures. (n.d.). AUT Facts and Figures—Amirkabir University of Technology. Available online: https://aut.ac.ir/content/93/AUT-Facts-and-Figures (accessed on 23 March 2021).
- Sharif University of Technology Introduction. (n.d.). Sharif University of Technology—Introduction. Retrieved. Available online: http://www.sharif.ir/web/en/10 (accessed on 23 March 2021).
- University of Tehran Facts and Figures. (n.d.). Facts and Figures—University of Tehran. Retrieved. Available online: https://ut.ac.ir/en/page/756/facts-and-figures (accessed on 23 March 2021).
- Snap to Roads|Roads API|Google Developers. Available online: https://developers.google.com/maps/documentation/roads/snap (accessed on 31 December 2020).
- Overview|Distance Matrix API|Google Developers. (n.d.). Retrieved. Available online: https://developers.google.com/maps/documentation/distance-matrix/overview (accessed on 14 February 2021).
- Neshan Platform—Distance Matrix API. (n.d.). Retrieved. Available online: https://developers.neshan.org/api/distance-matrix/ (accessed on 14 February 2021).
- Szumilas, M. Explaining odds ratios. J. Can. Acad. Child Adolesc. Psychiatry 2010, 19, 227–229. Available online: http://www.csm-oxford.org.uk/ (accessed on 15 February 2021). [PubMed]
- Ceccato, V. Women’s transit safety: Making connections and defining future directions in research and practice. Crime Prev. Community Saf. 2017, 19, 276–287. [Google Scholar] [CrossRef] [Green Version]
- Nishiuchi, H.; King, J.; Todoroki, T. Spatial-Temporal Daily Frequent Trip Pattern of Public Transport Passengers Using Smart Card Data. Int. J. Intell. Transp. Syst. Res. 2013, 11, 1–10. [Google Scholar] [CrossRef]
- Nuzzolo, A.; Comi, A. Individual utility-based path suggestions in transit trip planners. IET Intell. Transp. Syst. 2016, 10, 219–226. [Google Scholar] [CrossRef]
- Russo, F.; Comi, A. Restocking in Touristic and CBD Areas: Deterministic and Stochastic Behaviour in the Decision-making Process. Transp. Res. Procedia 2016, 12, 53–65. [Google Scholar] [CrossRef]
- Derrible, S. Urban Engineering for Sustainability; The MIT Press: Cambridge, MA, USA, 2019; Available online: https://mitpress.mit.edu/books/urban-engineering-sustainability (accessed on 2 January 2021).
Figure 1.
Locations of the four target universities in Tehran.

Figure 2.
Socio-demographic results of the survey.

Figure 3.
Respondents travel flows between their residential address and universities.


Figure 4.
Distribution of respondents’ commute distance and travel time between their residence and university.
Figure 4.
Distribution of respondents’ commute distance and travel time between their residence and university.


Table 1.
Literature on preferences toward cycling and public transport.
| Study Area | Study | City | Developing Country? | Cycling or Public Transport? | Data | Method |
|---|---|---|---|---|---|---|
| Global | [17] | Montreal | No | Public Transport | University Survey | Multi-Level Logistic Regression |
| [18] | Montreal | No | Cycling | University Survey | Multinomial Logit Model | |
| [19] | Vancouver | No | Cycling | Cyclist Survey | Structural Equation Model | |
| [20] | Jeddah City | No | Cycling | Survey | Visual Assessment | |
| [21] | Volos | No | Public Transport + Cycling + Walking | Personal Interviews | Statistical Analysis | |
| [27] | Jakarta, Bandung and Yogyakarta | Yes | Public Transport | Interview and Travel Diary Survey | Statistical Analysis | |
| Iran | [23] | Mashhad | Yes | Cycling | Stated Choice Experiment (SCE) Survey | Multinomial Logit and Mixed Multinomial Logit |
| [24] | Shiraz | Yes | General Mode Choice Behavior | University Survey | Integrated Multinomial Logit and Structural Equation Models | |
| [28] | Kerman | Yes | Public Transport | Questionnaire and Observation | Statistical Analysis | |
| Our research | Tehran | Yes | Cycling + Public Transport | University Survey | Logistic Regression |
Table 2.
Summary statistic of the variables used in the modelling process.
| Characteristics | Description of Variable | N | % | Mean | Max | Min | Number of Answers |
|---|---|---|---|---|---|---|---|
| Gender | Male (=1) | 233 | 53.8 | 0.538 | 1 | 0 | 433 |
| Female (=0) | 200 | 46.2 | |||||
| Marriage status | Married (=1) | 26 | 6.3 | 0.937 | 1 | 0 | 426 |
| Single (=0) | 400 | 93.7 | |||||
| Number of people in the family | 1 | 9 | 2.1 | 3.76 | 6 | 1 | 434 |
| 2 | 39 | 8.9 | |||||
| 3 | 96 | 22 | |||||
| 4 | 202 | 46.2 | |||||
| 5 | 77 | 17.6 | |||||
| 6 and higher | 11 | 2.5 | |||||
| Current dominant travel mode | Subway | 265 | 34.6 | NA | NA | NA | 435 |
| Bus | 140 | 18.3 | |||||
| Car | 92 | 12 | |||||
| Taxi | 81 | 10.6 | |||||
| Snapp (Iranian TNC) | 72 | 9.4 | |||||
| Motorcycle | 9 | 1.2 | |||||
| Bicycle | 20 | 2.6 | |||||
| Walk | 87 | 11.4 | |||||
| Ideal dominant travel mode | Subway | 246 | 31.5 | NA | NA | NA | 435 |
| Bus | 111 | 14.2 | |||||
| Car | 73 | 9.3 | |||||
| Taxi | 31 | 4 | |||||
| Snapp (Iranian TNC) | 35 | 4.5 | |||||
| Motorcycle | 17 | 2.2 | |||||
| Bicycle | 198 | 25.4 | |||||
| Walk | 70 | 9 | |||||
| Knowing how to bike? | Yes (=1) | 387 | 89 | 0.890 | 1 | 0 | 435 |
| No (=0) | 48 | 11 | |||||
| Having a driver’s license | Yes (=1) | 228 | 52.4 | 0.524 | 1 | 0 | 435 |
| No (=0) | 207 | 47.6 | |||||
| Number of cars owned by the family | 0 | 57 | 13.1 | 1.34 | 4 | 0 | 435 |
| 1 | 218 | 50.1 | |||||
| 2 | 126 | 29 | |||||
| 3 | 25 | 5.7 | |||||
| 4 | 9 | 2.1 | |||||
| Student of Pardis? | Yes (=1) | 33 | 7.6 | 0.076 | 1 | 0 | 435 |
| No (=0) | 402 | 92 |
* NA: Not applicable.
Table 3.
Logistic regression modelling: choosing cycling to commute in an ideal condition.
| Question Type | Independent Variable (IV) | Significance | OR | 95% C.I. for OR | |
|---|---|---|---|---|---|
| Lower | Upper | ||||
| Sociodemographic | Number of people in the family | 0.551 | 1.091 | 0.819 | 1.455 |
| Student of Pardis? (yes = 1) | 0.726 | 1.159 | 0.508 | 2.648 | |
| Marital status (married = 1) | 0.756 | 1.194 | 0.389 | 3.664 | |
| Gender (male = 1) | 0.915 | 0.972 | 0.575 | 1.642 | |
| Current dominant travel mode | Currently using bicycle ** | 0.037 | 9.584 | 1.141 | 80.502 |
| Currently walking to the university * | 0.082 | 2.300 | 0.901 | 5.872 | |
| Currently using the bus | 0.191 | 0.605 | 0.285 | 1.284 | |
| Currently using Snapp (Iranian TNC) | 0.235 | 0.618 | 0.280 | 1.366 | |
| Currently using motorcycle | 0.365 | 0.409 | 0.059 | 2.827 | |
| Currently using car | 0.548 | 0.769 | 0.326 | 1.813 | |
| Currently using taxi | 0.609 | 0.816 | 0.375 | 1.777 | |
| Currently using the subway | 0.624 | 1.188 | 0.598 | 2.360 | |
| Ability to use a certain mode of transport | Knowing how to bike (yes = 1) ** | 0.000 | 9.328 | 3.143 | 27.681 |
| Having a driver’s license | 0.359 | 1.299 | 0.743 | 2.270 | |
| Personal preferences | Expressing prestige to others ** | 0.000 | 0.209 | 0.088 | 0.495 |
| House being near to bike-sharing station ** | 0.004 | 4.473 | 1.625 | 12.309 | |
| Caring for the health benefits of cycling ** | 0.029 | 5.781 | 1.200 | 27.842 | |
| Caring about saving travel time * | 0.087 | 0.256 | 0.048 | 1.371 | |
| Caring about the security of public transport * | 0.093 | 8.557 | 0.603 | 121.483 | |
| Caring about the security of cycling | 0.205 | 5.517 | 0.393 | 77.526 | |
| Following social media trends | 0.338 | 1.810 | 0.538 | 6.094 | |
| Caring for the environment | 0.395 | 0.525 | 0.119 | 2.314 | |
| Benefiting from AC during daily commute | 0.435 | 0.556 | 0.127 | 2.428 | |
| Benefiting from heater during daily commute | 0.443 | 0.548 | 0.118 | 2.541 | |
| Experiencing minimum cold weather | 0.459 | 0.617 | 0.172 | 2.214 | |
| Number of cars owned by the family | 0.466 | 1.125 | 0.820 | 1.542 | |
| Experiencing minimum rainfall | 0.478 | 1.427 | 0.534 | 3.809 | |
| House being near to public transport station | 0.498 | 0.647 | 0.183 | 2.283 | |
| Experiencing minimum sunburn | 0.563 | 1.447 | 0.414 | 5.060 | |
| Caring about using less fuel | 0.740 | 0.860 | 0.354 | 2.094 | |
| House being near to the university | 0.991 | 1.006 | 0.350 | 2.891 | |
| Constant | 0.000 | 0.002 | |||
* Significant at the 90% confidence level; ** Significant at the 95% confidence level.
Table 4.
Performance of the model developed for bike use.
| Model Performance | Predicted | Percentage Correct | ||
|---|---|---|---|---|
| No | Yes | |||
| Observed | No | 163 | 60 | 73.1 |
| Yes | 54 | 134 | 71.3 | |
| Overall: 72.3 | ||||
Table 5.
Logistic regression modelling: choosing public transport to commute in an ideal condition.
| Question Type | Independent Variable (IV) | Significance | OR | 95% C.I. for OR | |
|---|---|---|---|---|---|
| Lower | Upper | ||||
| Sociodemographic | Marital status (married = 1) * | 0.068 | 0.335 | 0.103 | 1.085 |
| Gender (male = 1) * | 0.092 | 1.614 | 0.924 | 2.819 | |
| Number of people in the family | 0.357 | 1.147 | 0.857 | 1.534 | |
| Student of Pardis? (yes = 1) | 0.670 | 1.225 | 0.482 | 3.116 | |
| Current dominant travel mode | Currently using the subway ** | 0.000 | 3.287 | 1.708 | 6.326 |
| Currently using taxi * | 0.095 | 1.954 | 0.850 | 4.493 | |
| Currently using Snapp (Iranian TNC) | 0.151 | 0.570 | 0.265 | 1.227 | |
| Currently walking to the university | 0.255 | 0.593 | 0.241 | 1.458 | |
| Currently using the bus | 0.368 | 1.420 | 0.661 | 3.051 | |
| Currently using motorcycle | 0.441 | 0.505 | 0.089 | 2.868 | |
| Currently using car | 0.626 | 1.232 | 0.532 | 2.857 | |
| Currently using bicycle | 0.643 | 1.330 | 0.398 | 4.447 | |
| Ability to use a certain mode of transport | Knowing how to bike (yes = 1) | 0.318 | 0.626 | 0.250 | 1.569 |
| Having a driver’s license | 0.612 | 0.859 | 0.479 | 1.544 | |
| Personal preferences | House being near to public transport station ** | 0.001 | 9.480 | 2.549 | 35.261 |
| Number of cars owned by the family ** | 0.002 | 0.603 | 0.439 | 0.827 | |
| House being near to bike-sharing station ** | 0.007 | 0.240 | 0.086 | 0.672 | |
| Following social media trends | 0.120 | 2.625 | 0.778 | 8.856 | |
| Caring about the security of public transport | 0.154 | 4.595 | 0.564 | 37.459 | |
| Experiencing minimum sunburn | 0.158 | 2.553 | 0.694 | 9.387 | |
| Experiencing minimum cold weather | 0.188 | 0.354 | 0.090 | 1.397 | |
| House being near to the university | 0.218 | 0.493 | 0.160 | 1.517 | |
| Caring for distance from others in public transport | 0.422 | 0.482 | 0.081 | 2.860 | |
| Caring for the health benefits of cycling | 0.318 | 0.294 | 0.065 | 1.328 | |
| Expressing prestige to others | 0.529 | 0.756 | 0.317 | 1.805 | |
| Experiencing minimum rainfall | 0.650 | 1.267 | 0.456 | 3.516 | |
| Caring about using less fuel | 0.679 | 0.825 | 0.331 | 2.055 | |
| Benefiting from heater during daily commute | 0.682 | 0.716 | 0.145 | 3.532 | |
| Caring for isolation from others in daily commute | 0.720 | 1.218 | 0.414 | 3.581 | |
| Caring for the environment | 0.769 | 0.798 | 0.178 | 3.586 | |
| Benefiting from AC during daily commute | 0.835 | 1.170 | 0.266 | 5.150 | |
| Caring for having enough sits in public transport | 0.945 | 1.048 | 0.274 | 4.008 | |
| Caring about saving travel time | 0.989 | 0.988 | 0.189 | 5.172 | |
| Constant | 0.515 | 2.563 | |||
* Significant at the 90% confidence level; ** Significant at the 95% confidence level.
Table 6.
Performance of the model developed for public transit use.
| Model Performance | Predicted | Percentage Correct | ||
|---|---|---|---|---|
| No | Yes | |||
| Observed | No | 59 | 70 | 45.7 |
| Yes | 22 | 257 | 92.1 | |
| Overall: 77.5 | ||||
Table 7.
Logistic regression modelling: choosing cycling considering the distance and travel time.
| Independent Variable (IV) | Significance | OR | 95% C.I. for OR | |
|---|---|---|---|---|
| Lower | Upper | |||
| Knowing how to bike (yes = 1) ** | 0.000 | 9.095 | 3.020 | 27.386 |
| House being near to bike-sharing station ** | 0.000 | 7.615 | 3.217 | 18.025 |
| Expressing prestige to others ** | 0.002 | 0.260 | 0.111 | 0.609 |
| Currently using bicycle ** | 0.007 | 16.655 | 2.181 | 127.207 |
| Distance traveled ** | 0.034 | 0.930 | 0.870 | 0.995 |
| Caring about the security of cycling ** | 0.035 | 8.042 | 1.156 | 55.928 |
| Travel time experienced | 0.139 | 1.028 | 0.991 | 1.066 |
| Constant | 0.000 | 0.009 | ||
* Significant at the 90% confidence level; ** Significant at the 95% confidence level.
Table 8.
Logistic regression modelling: choosing public transport considering the distance and travel time.
Table 8.
Logistic regression modelling: choosing public transport considering the distance and travel time.
| Independent Variable (IV) | Significance | OR | 95% C.I. for OR | |
|---|---|---|---|---|
| Lower | Upper | |||
| Currently using the subway ** | 0.000 | 3.546 | 2.030 | 6.193 |
| Number of cars owned by the family ** | 0.014 | 0.691 | 0.514 | 0.929 |
| Currently using taxi ** | 0.017 | 2.420 | 1.174 | 4.987 |
| Currently using the bus ** | 0.019 | 2.040 | 1.126 | 3.695 |
| House being near to public transport station ** | 0.040 | 3.717 | 1.062 | 13.009 |
| Distance traveled | 0.695 | 1.014 | 0.945 | 1.088 |
| Travel time experienced | 0.845 | 0.996 | 0.959 | 1.034 |
| Constant | 0.746 | 0.808 | ||
* Significant at the 90% confidence level; ** Significant at the 95% confidence level.
Table 9.
Logistic regression modelling: cycling by female commuters.
| Independent Variable (IV) | Significance | OR | 95% C.I. for OR | |
|---|---|---|---|---|
| Lower | Upper | |||
| Knowing how to bike (yes = 1) ** | 0.000 | 7.644 | 2.597 | 22.503 |
| House being near to bike-sharing station ** | 0.001 | 6.862 | 2.091 | 22.521 |
| Currently using bicycle ** | 0.008 | 14.635 | 2.372 | 124.146 |
| Expressing prestige to others ** | 0.037 | 0.278 | 0.084 | 0.923 |
| Lack of other people’s harassment on dressing ** | 0.039 | 14.102 | 1.139 | 174.608 |
| Caring about the security of cycling | 0.481 | 6.389 | 0.037 | 1106.122 |
| Caring for public opinion on dressing | 0.811 | 0.879 | 0.306 | 2.525 |
| Constant | 0.008 | 0.001 | ||
* Significant at the 90% confidence level; ** Significant at the 95% confidence level.
Table 10.
Logistic regression: choosing the public transport by female commuters.
| Independent Variable | Significance | Odds Ratio | 95% C.I. for Odds Ratio | |
|---|---|---|---|---|
| Lower | Upper | |||
| Currently using the subway ** | 0.004 | 2.694 | 1.376 | 5.272 |
| Currently using the bus ** | 0.011 | 2.669 | 1.258 | 5.663 |
| Currently using taxi * | 0.066 | 2.123 | 0.951 | 4.739 |
| House being near to public transport station * | 0.069 | 4.375 | 0.892 | 21.464 |
| Lack of other people’s harassment on dressing | 0.182 | 0.277 | 0.042 | 1.820 |
| Number of cars owned by the family | 0.300 | 0.815 | 0.553 | 1.200339 |
| Caring for public opinion on dressing | 0.837 | 1.107 | 0.421 | 2.909 |
| Constant | 0.614 | 1.782 | ||
* Significant at the 90% confidence level; ** Significant at the 95% confidence level.
Disclaimer/Publisher’s Note: The statements, opinions and data contained in all publications are solely those of the individual author(s) and contributor(s) and not of MDPI and/or the editor(s). MDPI and/or the editor(s) disclaim responsibility for any injury to people or property resulting from any ideas, methods, instructions or products referred to in the content. |
© 2023 by the authors. Licensee MDPI, Basel, Switzerland. This article is an open access article distributed under the terms and conditions of the Creative Commons Attribution (CC BY) license (https://creativecommons.org/licenses/by/4.0/).
Share and Cite
MDPI and ACS Style
Kazemeini, A.; Kermanshah, A. Promoting Sustainable Transport in Developing Countries: A Case Study of University Students in Tehran. Future Transp. 2023, 3, 858-877. https://0-doi-org.brum.beds.ac.uk/10.3390/futuretransp3030048
AMA Style
Kazemeini A, Kermanshah A. Promoting Sustainable Transport in Developing Countries: A Case Study of University Students in Tehran. Future Transportation. 2023; 3(3):858-877. https://0-doi-org.brum.beds.ac.uk/10.3390/futuretransp3030048
Chicago/Turabian StyleKazemeini, Ali, and Amirhassan Kermanshah. 2023. "Promoting Sustainable Transport in Developing Countries: A Case Study of University Students in Tehran" Future Transportation 3, no. 3: 858-877. https://0-doi-org.brum.beds.ac.uk/10.3390/futuretransp3030048