Communication

Assessment of Genetic Diversity of Rice in Registered Cultivars and Farmers’ Fields in Burkina Faso

1
INERA, Institut de l’Environnement et de Recherches Agricoles du Burkina Faso, Station de Farako-Bâ, Bobo-Dioulasso BP 910, Burkina Faso
2
Institut du Développement rural, Laboratoire des Systèmes naturels, Agrosystèmes et Ingénierie de l’Environnement (SyNAIE), University Nazi Boni, Bobo-Dioulasso BP 910, Burkina Faso
3
PHIM Plant Health Institute of Montpellier, University Montpellier, IRD, CIRAD, INRAE, Institut Agro, F-34394 Montpellier, France
4
DIADE, University Montpellier, CIRAD, IRD, F-34394 Montpellier, France
*
Author to whom correspondence should be addressed.
These authors contributed equally to this work.
Submission received: 21 September 2021 / Revised: 26 October 2021 / Accepted: 29 October 2021 / Published: 3 November 2021

Abstract

:
The genetic diversity of cultivated rice in farmers’ fields remains understudied in West Africa despite the importance of rice for food security in this region. In this study, we genotyped rice samples from Burkina Faso using the C6AIR SNP (Single Nucleotide Polymorphism) array (IRRI), including 27 registered cultivars and 50 rice samples collected in rice fields from three geographical zones in western Burkina Faso. Most of the registered cultivars clustered with the indica genetic group, except seven assigned to japonica and one admix. All but one of the rice samples from farmers’ fields belonged to the indica group. The other field sample, which unexpectedly clustered with the Aus genetic group, originated from a rainfed lowland site known to differ in terms of agronomic practices, and which revealed to be highly differentiated from the five other sites. Apart from this peculiar site, the rice grown in irrigated areas did not differ from rice sampled in rainfed lowlands. Finally, obtained genetic data confirmed the high frequency of one cultivar, in congruence with farmers’ interviews. We argue on the importance to document and preserve the high agro-biodiversity observed in rice from Burkina Faso as a prerequisite to face the current challenges of growing rice demand and global change.

1. Introduction

Crop genetic diversity is a component of agro-biodiversity, with high value for nutrition and adaptation to biotic and abiotic stresses [1], particularly in the context of global changes [2]. It contributes rendering farming systems more stable, robust and sustainable. On the other hand, the development, dissemination and adoption of improved cultivars is a pathway to increasing crop productivity and aligning this with market demands. A deep knowledge of registered cultivars at a genomic level, as well as crop genetic diversity actually grown locally, are important pieces of information to take into account for plant diversity management and crop improvement.
Rice is rapidly becoming a staple food in the African diet. In West Africa, the average annual production is 10.1 million tons (milled equivalent, 2009–2019 period, [3]), and the average annual growth of production (2009–2019) is higher than 10% [3]. However, it still does not meet the demand, with imports representing 46% of rice consumption on average annually over the 2009–2019 period [3]. Efforts have consequently been pursued to increase rice production in a sustainable manner in order to decrease the gap between production and consumption.
Two rice species are cultivated in West Africa: the African rice Oryza glaberrima Steud. and the Asian rice Oryza sativa L. The second of these is, nowadays, by far the most cultivated in West African farming fields, with O. glaberrima being restricted to small areas, grown in places that are unsuitable for O. sativa and maintained mainly for social reasons [4]. African rice is known for its resistance to biotic and abiotic stresses and was consequently included in O. sativa genetic improvement programs, led by AfricaRice (Africa Rice Center). This resulted to the creation of improved cultivars named NERICA (New Rice for Africa) and some of the cultivars named ARICA (Advanced Rice for Africa), both being groups of elite cultivars specifically adapted to rice production in Africa [5,6].
Research aimed at describing rice genetics in West Africa remain rare. The number of genetic markers used (less than 100; [7,8,9]) limited the impact of various studies, but two notable exceptions exist. First, Ndjiondjop et al. [6] used a panel of 27,560 SNPs (Single Nucleotide Polymorphisms) to characterize 330 rice genotypes widely used in Africa, including NERICA and ARICA cultivars, and found two highly differentiated genetic groups corresponding to the different rice growing systems: lowland (primarily indica and lowland NERICAs) and upland (japonica and upland NERICAs). Second, Diop et al. [10] analyzed a set of 280 samples (landraces from Casamance/Senegal and other cultivars from West Africa in general) by genotyping-by-sequencing (GBS). Analyzed samples belonged to four genetic subpopulations: O. glaberrima, O. sativa japonica, O. sativa indica Group 1 and O. sativa indica Group 2, with high genetic diversity within the majority group O. sativa indica.
Focusing on Burkina Faso in particular, research projects aiming to describe the genetic diversity from rice landraces began with a prospection all over the country by Moussa Sié in 1983–1984 [11,12]. Then, a new sampling was performed in 2008 by Honoré Kam in 59 villages from four regions in western Burkina Faso, including 47 O. glaberrima samples among the 330 collected accessions, with a characterization of agro-morphological diversity [13] and genetic diversity using 23 microsatellites markers [14]. As expected, considering that upland ecology is not very common in Burkina Faso, only 11 accessions were assigned to the O. sativa japonica genetic group; the indica group was, consequently, by far the most abundant and could be subdivided into three genetic groups [14].
Considering the recent rise in areas cultivated in rice in Burkina Faso (three-fold between 2006 and 2016, FAOSTAT), and the intensification of rice cultivation [15], it is likely that the genetic diversity of rice in the fields is rapidly evolving as well, requiring a more up to date picture of rice genetic diversity in this country to be obtained.
Among the four rice production systems existing in West Africa (rainfed upland, rainfed lowland, irrigated and mangrove swamps [16,17]), two are important in Burkina Faso. First, rainfed lowland rice represents the largest rice growing area in the country (67% between 1984 and 2009, [18]). Second, irrigated rice represents less than 30% of harvest areas (FAOSTAT), but constitutes more than half of the total paddy rice produced [18]. Rice is grown in Burkina Faso over all 13 regions, but most of the production comes from the Hauts Bassins, Centre-Est, Boucle du Mouhoun and Cascades regions [18,19].
Because rice genomics is important for agro-biodiversity characterization and the objective of rice self-sufficiency in a country with a fast-growing population [20], it is timely to provide an update on the genetic characterization of rice cultivars available, and rice actually cultivated, in Burkina Faso. To this purpose, we selected two sets of samples for genotyping: (1) a set of cultivars registered in Burkina Faso or West Africa, and (2) a set of samples from farmers’ fields located in six study sites in western Burkina Faso. We addressed the following questions: (i) What is the genetic diversity of rice from Burkina Faso compared to worldwide rice diversity? (ii) What is the genetic diversity and differentiation of rice actually grown by the smallholder rice farmers in irrigated and rainfed lowland sites in western Burkina Faso? (iii) What is the correspondence between registered cultivars, genetic assignation of field samples and cultivars’ names as known by the farmers?

2. Materials and Methods
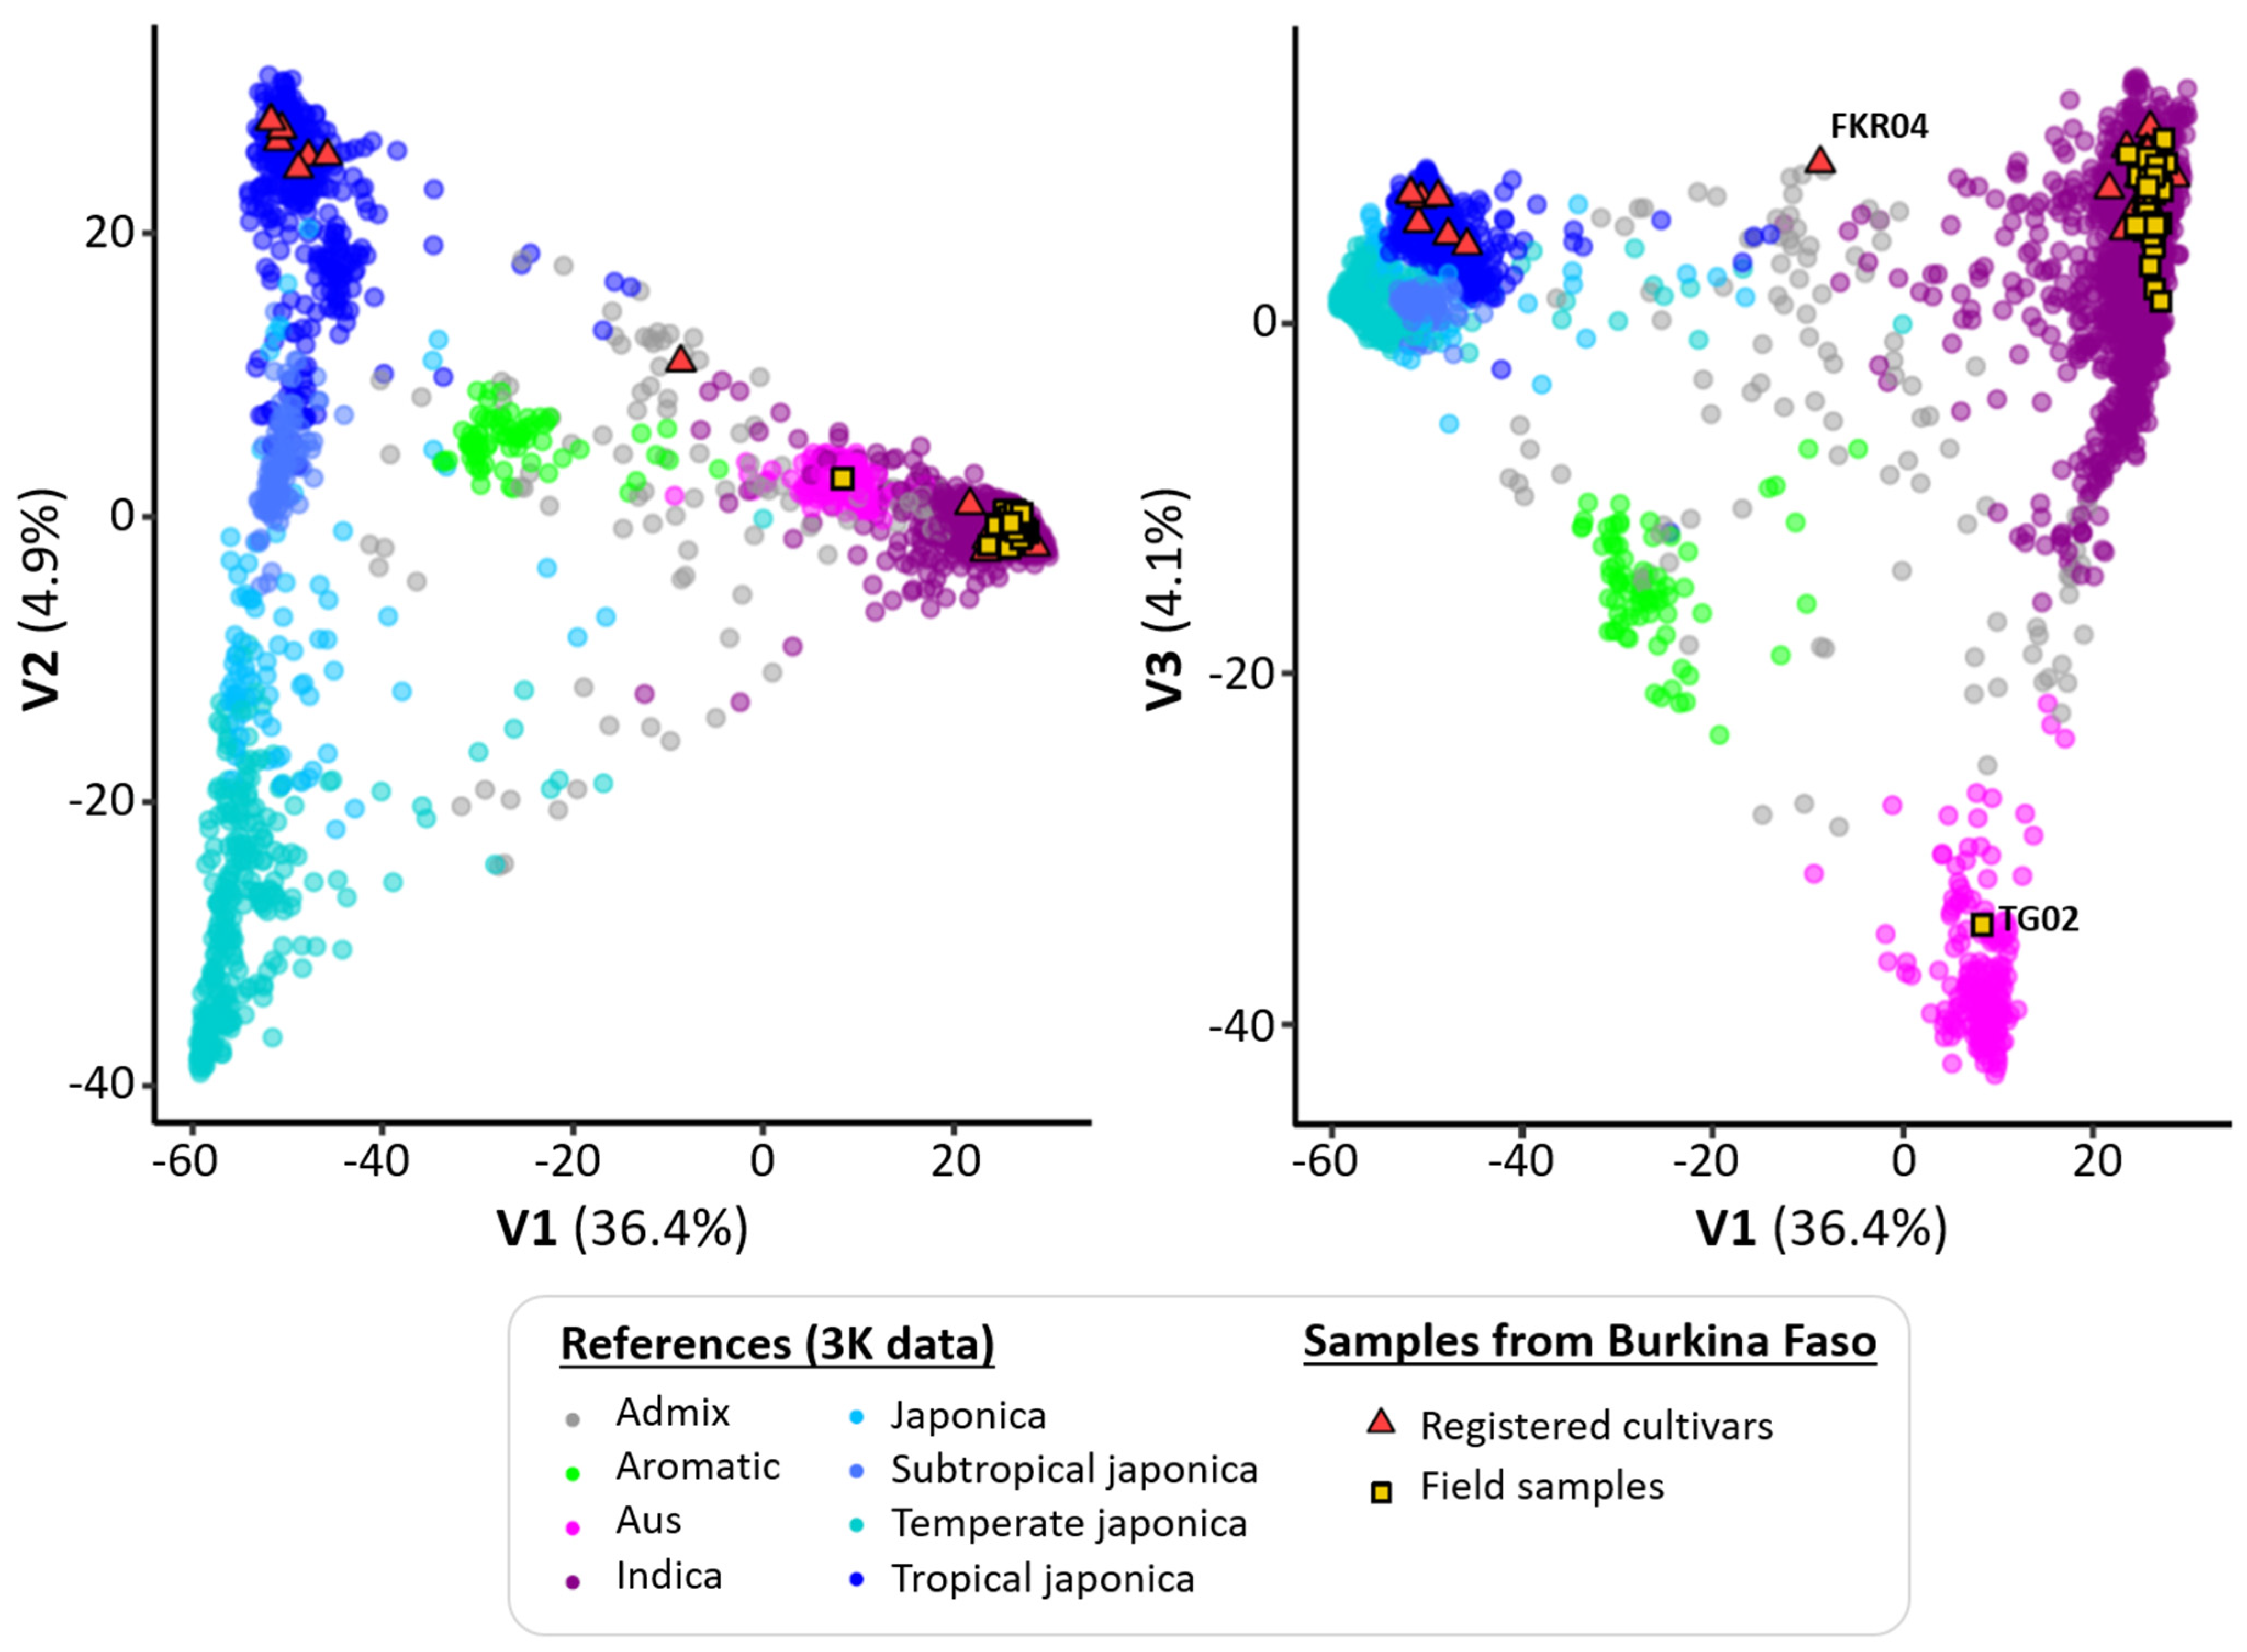
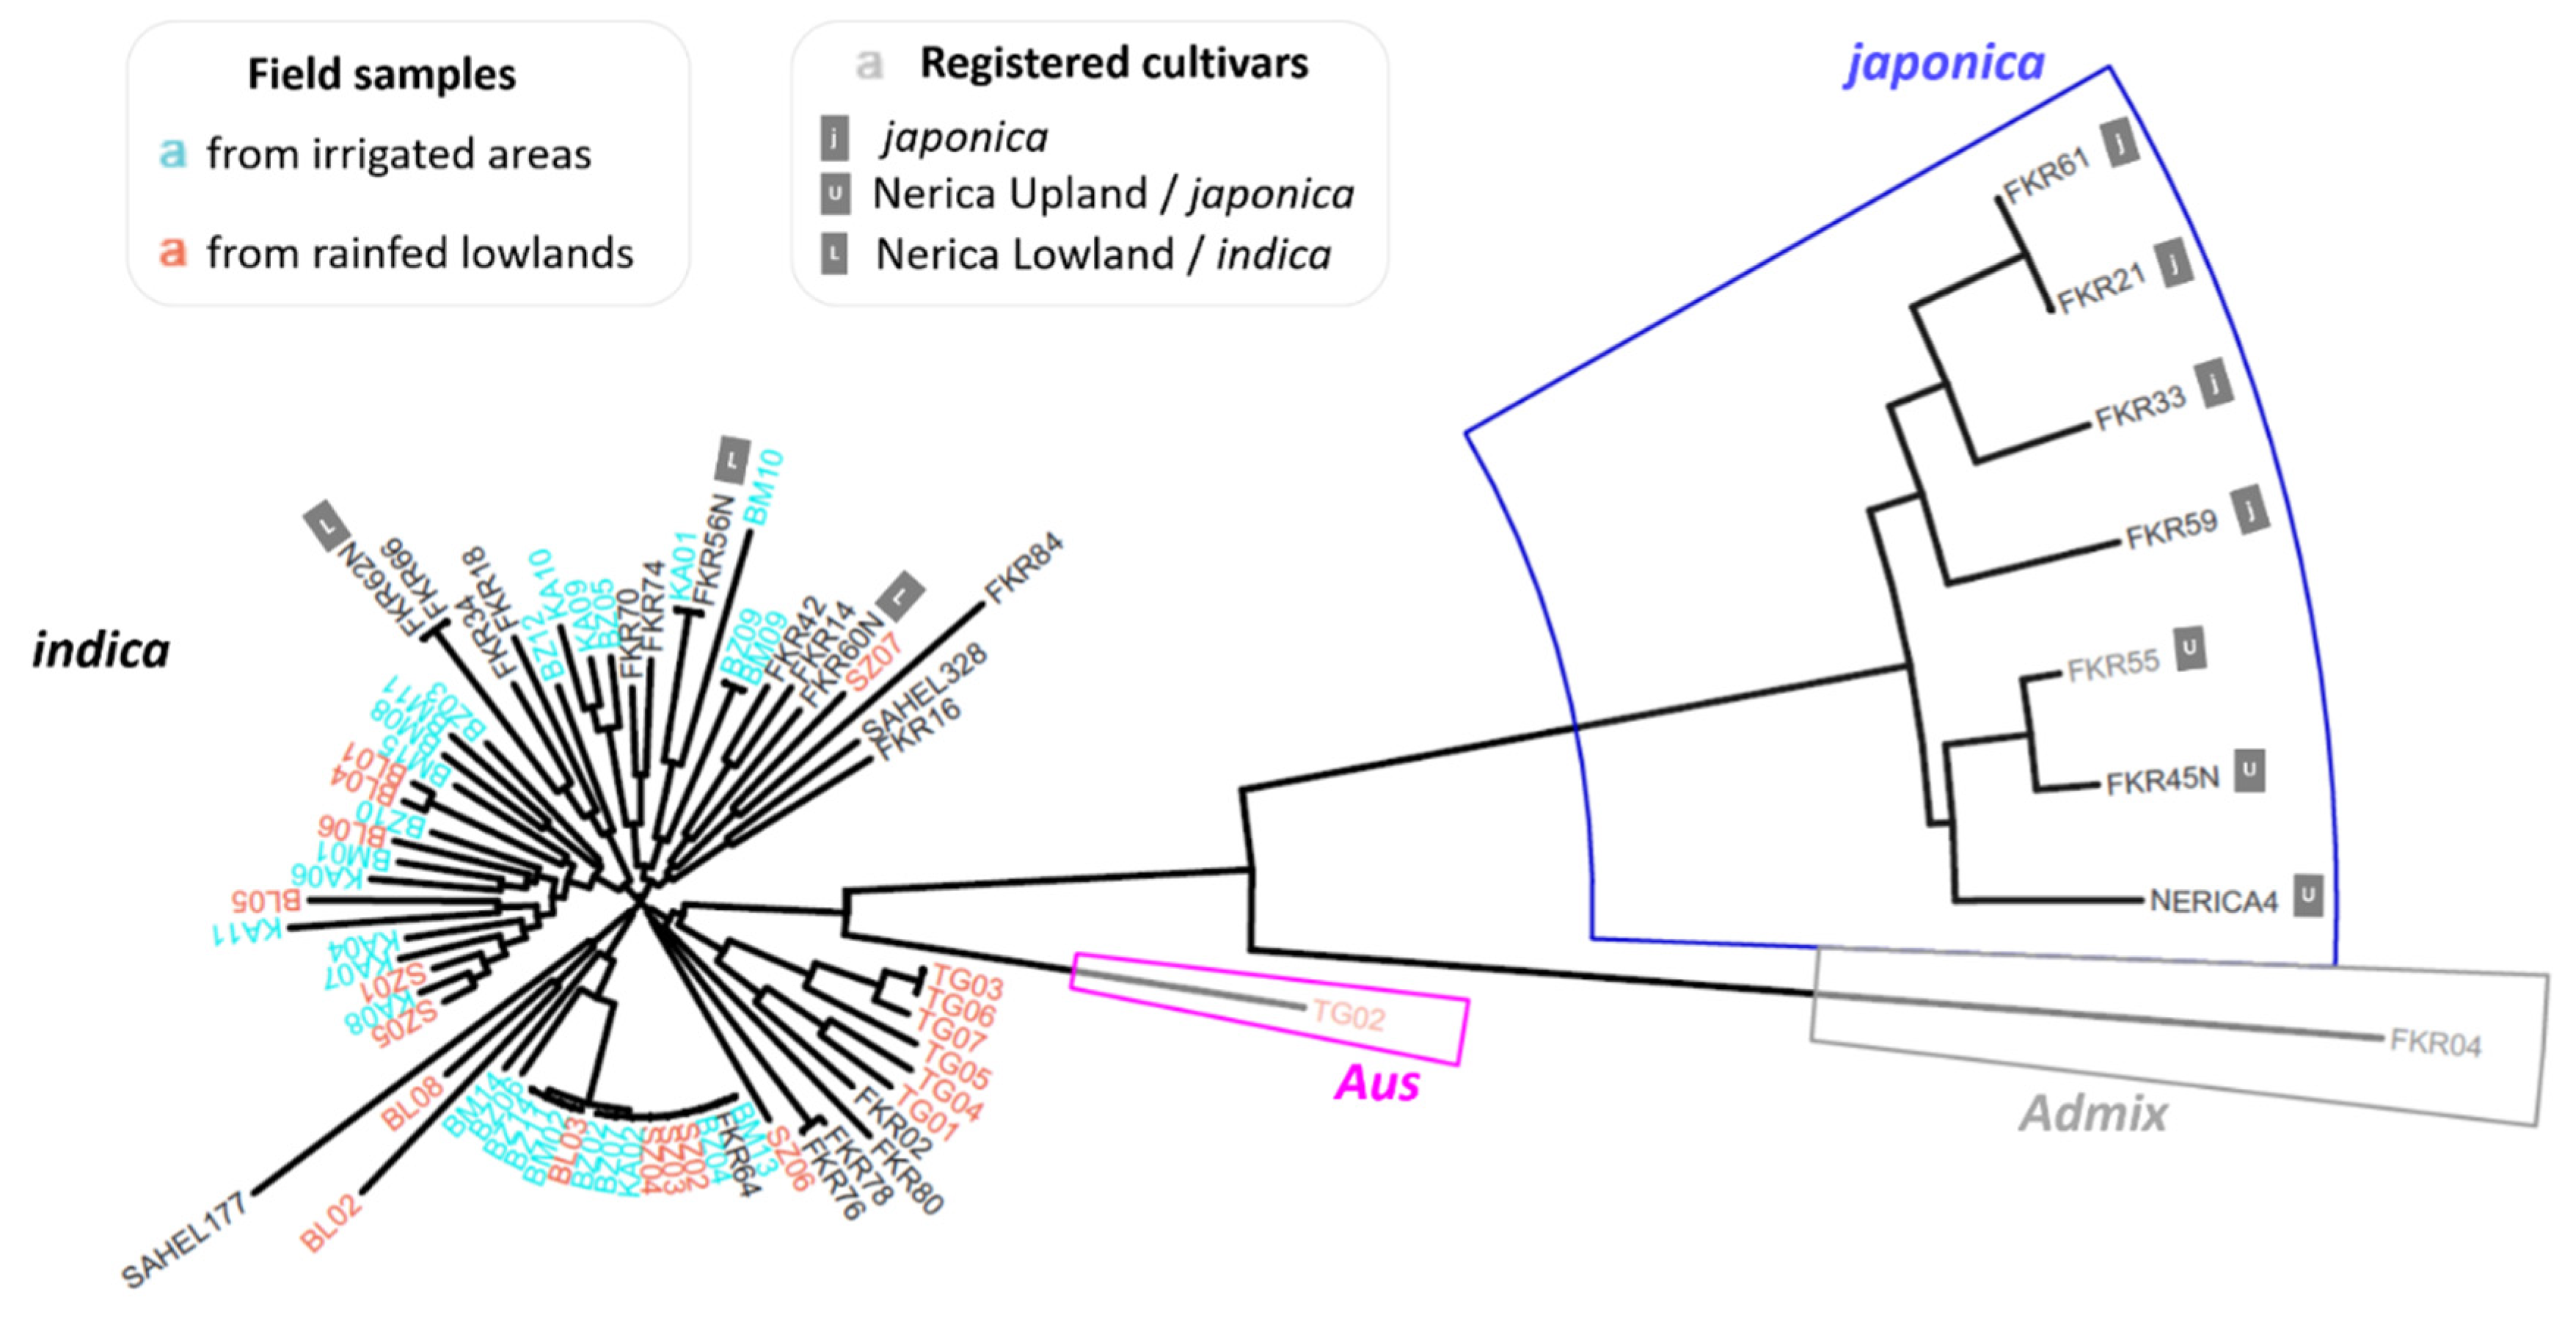
We selected 27 registered cultivars, including some already adopted by the farmers in Burkina Faso, and recent elite varieties from African breeding programs. The information related to each of them appears in Table 1.
In addition, we took advantage of a sampling previously performed in six sites located in western Burkina Faso [23]. These six sites are located in three geographical zones (Bama, Banzon and Karfiguela, see Figure 1a), each zone comprising one irrigated area and a neighboring rainfed lowland. The present study focused on 50 fields visited in 2018 (7–11 fields per site, 8.33 on average, see Table 2).
Each sample corresponded to one rice leaf per field and was collected between September and December 2018. In 40 out of the 50 fields (80%), we interviewed the farmer and asked for the rice cultivar grown. We also performed farmers’ interviews at the same sites in the two previous years (2016–2017) and the subsequent year (2019) [23]. A synthesis of obtained responses (annual frequencies of cultivars grown over the four-year period) are reported in Figure 1b and detailed information is available at https://dataverse.ird.fr/dataset.xhtml?persistentId=doi:10.23708/8FDWIE (accessed on 22 April 2021). In every case, we obtained permission from the farmers to work in their fields, and the management of the entire project followed the guidelines of the Nagoya protocol regarding access and benefit sharing.
Wet lab work (both DNA extraction and SNP genotyping) was performed at the Genotyping Services Lab at the International Rice Research Institute (IRRI). DNA fingerprinting approach used the Illumina Infinium rice 6K chip (C6AIR) [24], a set of SNPs designed to characterize the diversity within O. sativa species. This chip has already been used in rice diversity studies, for example, to characterize rice samples from Bangladesh [25]. SNP genotyping data table was provided by the genotyping platform and used for subsequent analysis.
In order to place the rice diversity from Burkina Faso in the global context of Asian rice diversity, we downloaded the 29 mio SNP datasets from the 3K genome data available at https://snp-seek.irri.org/ (accessed on 31 March 2021). Obtained PLINK binary files were converted to VCF using PLINK software v1.9 [26], enabling the keep-allele-order option. SNPs’ positions corresponding to the C6AIR were extracted from the VCF file using bcftools v1.9 [27], then imported within the R software v4.1.0 [28], as well as the genotyping table from accessions from Burkina Faso. Datasets from the chip genotyping and from the 3K genome data were merged prior to applying genomic filters. In order to keep best-quality SNPs, we applied the following filters SNPwise: less than 15% of missing data considering only the accessions from Burkina Faso, less than 10% missing data considering the whole dataset and an additional filter on heterozygosity, which removed positions with more than 45% heterozygosity. We ended up with a final dataset including 5247 SNPs.
We first conducted a Principal Component Analysis (PCA) using LEA3.1 R package [29]. Graphical display of obtained PCA (Figure 2) was made using ggplot2 R package v3.3.5 [30]. Datasets were converted to the genind format from the adegenet R package v2.1.3 [31] and analyzed both with adegenet and hierfstat R package v0.5-7 [32]. A Discriminant Analyses on Principal Components (DAPC) was performed, using the 3K diversity groups as reference, to assign accessions from Burkina Faso to these groups (Figure S1). We then focused our analysis on the accessions from this study (samples from Burkina Faso) and first computed a genetic tree within these samples (Figure 3). Genetic distances between the accessions were computed using the dist.gene function and the resulting Neighbor-Joining tree was computed using the ape R package v5.5 [33]. Graphical representation was made using the ‘fan’ option of the ggtree R package v3.1.2 [34]. A PCA was then computed considering only the field genotypes (with or without a peculiar accession, Figure 4 and Figure S2) with the dudi.pca function of ade4 R package v1.7-17 [35]. Finally, basic population genetics descriptive statistics (gene diversity and populations pairwise FST), considering different levels of hierarchy, were computed using hierfstat (Table 2, Table 3 and Table S1).

3. Results

The PCA analysis including both this study’s samples and the global reference of rice genomes (Figure 2), as well as the DAPC analysis (Figure S1), showed that the vast majority of the samples correspond to the O. sativa indica group. This result corresponds to the expectations, as none of the samples came from upland growing systems, where japonica are generally found [6]. Moreover, Diop et al. [10] found that indica was the most widely cultivated type of lowland rice in West Africa, with very few of their samples revealed as japonica.
On the other hand, seven reference cultivars (FKR21, FKR33, FKR45N, FKR55, FKR59, FKR61, NERICA4) were attributed to the japonica group (Figure 2 and Figure 3). These cultivars were known to be japonica or NERICA upland (Table 1, Figure 3) so that this result is congruent with expectations. The japonica group does not contain any of the analyzed samples from farmers’ fields (Figure 2 and Figure 3). We noticed that the NERICA cultivars, resulting from O. sativa–O. glaberrima crosses, do not cluster together, likely a consequence of the genotyping method. Indeed, the C6AIR SNP array [24] was designed to maximize within-species diversity for O. sativa and may not target the small parts of the NERICA genomes originating from O. glaberrima.
The cultivar FKR04, a cultivar introduced from Casamance (Senegal) in 1960 (Table 1) belonged to admix (Figure 2 and Figure 3). Finally, one field sample, from the field labelled ‘TG02′, belonged to the Aus group (Figure 2 and Figure 3). The Aus genetic group does not seem to be common in West Africa in general, as it does not appear in the two studies cited previously [6,10], whereas Sié et al. [12] reported the presence of two Aus rice samples in a previous sampling performed in Burkina Faso.
Global gene diversity estimated in the 27 registered cultivars from Burkina Faso was 0.282. It represented various genetic groups (indica, japonica and admix, Figure 2). Within-group diversity was also apparent as we noticed the registered cultivars from Burkina Faso are not so closed from each other’s within the indica and japonica diversity groups (Figure 2). Our results, however, show that the diversity used for the registered cultivars in Burkina Faso could still be enlarged by mobilizing more genetic diversity of the rice worldwide germplasm.
Global gene diversity estimated in the 50 analyzed field samples from Burkina Faso was 0.137, and within-site genetic diversity was the highest at the Tengrela site (0.132; Table 2). On the other hand, the Banzon irrigated site presented the lowest genetic diversity (0.108; Table 2). Tengrela was also involved in all of the highest pairwise genetic differentiation values (Table 3 and Table S1). The highest between site genetic differentiation was between the Tengrela rainfed lowland and Banzon irrigated perimeter sites (FST = 0.328 (0.311–0.347)). Such a specificity of the site of Tengrela, compared to the five other study sites, is likely related to social reasons. Indeed, it is congruent with the data obtained for farmers’ interviews, showing that, in this site specifically, rice was mostly grown by women for self-consumption only, with low frequency of chemical fertilization but often the use of manure from household waste [23].
Tengrela was also the only site where a sample was attributed to a group other than indica, namely the Aus group (Figure 2 and Figure S2). According to farmers’ interviews [23], this was the only site among the six where only landraces were grown (no use of registered cultivars, Figure 1b). The farmer named the cultivar from the field TG02 (attributed to Aus group) ‘Samperema’, while other cultivars’ names from this site included ETP, Bedankaki, Bandakadi/Debale and Tchombiais. These six samples from Tengrela, although assigned to the indica group, were, however, differentiated from the samples found in the five other sites (Figure 3, and see the point aspect in Figure 4 and Figure S2). They likely derive from hybridization between the locally grown landrace belonging to the Aus diversity group and introduced indica varieties, as suggested by their affinity with TG02 in the PCA (Figure S2).
In terms of rice growing systems, we note that the samples from irrigated areas and rainfed lowlands (respectively in blue and orange in Figure 3) do not specifically differ from each other, with the exception of Tengrela village, as previously mentioned (sample names beginning with ‘TG’ in Figure 3). Rainfed lowlands considered as a whole (three sites) had a higher gene diversity (0.149) compared to irrigated areas (0.125). The genetic differentiation between all rainfed lowland fields and all the fields located in irrigated areas was estimated to be FST = 0.030 (0.027–0.034). This is likely due to the peculiarity of the Tengrela site, as we note that the FST obtained between rainfed lowlands and irrigated areas from the geographic zones of Banzon and Bama did not differ from zero (Table 3 and Figure S2).
In the phylogenetic tree (Figure 3), as well as PCA analyses (Figure 4 and Figure S2), we also note that many field samples (from five sites: Senzon, Banzon, Karfiguela, Badala, Bama) are identical to each other’s and to the reference cultivar FKR64 (commonly named TS2 in Burkina Faso, see Table 1). This cultivar, originating from Taïwan (Table 1), was frequently mentioned by the farmers from all sites, except in the peculiar site of Tengrela (Figure 1b). Consequently, genetic data and farmers’ responses were in agreement in that this rice cultivar was the most frequently grown in the vast majority of the studied sites from western Burkina Faso. However, Figure 4 and Figure S2, which present the cultivar given names according to farmers’ interviews as label color, show that at the field level, the genetic assignation of samples did not always correspond to a farmer’s information. This likely reflects the dynamics of rice genetic diversity in a farmer’s field and illustrates that the genetic pool is not fixed but is still evolving.

4. Conclusions

Understanding the present genetic diversity and distribution of crops is crucial for in situ agro-biodiversity conservation programs as well as for crop improvement, with the selection of parents with diverse genetic background.
Our results firstly offer a picture of rice genetic diversity in six sites, furthermore characterized in terms of agricultural practices and the levels of major diseases [23], representing irrigated areas and rainfed lowlands in western Burkina Faso. We confirmed that indica rice is by far the most frequently grown, but we also identified a sample from the Aus genetic group. We found no major differences between rice cultivated in lowlands vs irrigated areas, except for the lowland site of Tengrela (TG), where rice is grown traditionally (low input) by women using traditional landraces. We confirmed the predominance of one registered cultivar (registered as FKR64, and named TS2 by the farmers) in the five other sites. These results encourage further research to encompass rice agro-biodiversity actually grown in this country and in West Africa in general. To add to this perspective, we propose to include more registered varieties and to extend the geographic areas to cover all important rice production areas in Burkina Faso, including, for example, the Boucle du Mouhoun region that was shown to present the highest rice genetic diversity in a previous study [13]. In addition, it could be interesting to include rainfed upland rice, although this rice production system is minor in Burkina Faso (only 10% of the rice land area and 5% of national rice production [18]). Rice cultivated in upland fields likely includes japonica rice that was not found in the farmers’ fields visited in this study but was represented in the set of registered cultivars, offering the farmers a diversity of rice cultivars adapted to various rice growing systems of the country. Finally, deciphering potential within-field rice genetic diversity is also an interesting research question for future work, which was not addressed in our study where only one plant sample from each field was analyzed.
We also documented the genetic diversity of 27 registered cultivars, including indica, japonica and NERICA. This may offer the perspective (not straightforward though) to try to design easy-to-use genetic markers (see [36] for markers discriminant for rice species) useful for quality control and seed certification. The apparent discrepancies observed here in Burkina Faso between genetic assignations and naming of the cultivars by the farmers illustrate the importance to strengthen these aspects. Combining the study of rice genetic diversity with human and social science in West Africa would be a way to understand further the rationale behind rice farmers’ seed choice (see for example [37] in Benin). Such an integrative approach including breeders, geneticists and social scientists would deliver useful information to design suitable strategies for crop genetic diversity management.
Indeed, while genetic improvement is very important to increase yield and fight poverty and food insecurity [38], it is also critical to preserve agro-biodiversity and to include landraces, especially those preferred by farmers and consumers, in breeding programs and dissemination projects. Farmer rice cultivars in West Africa were shown to be tolerant of suboptimal conditions [39], illustrating the crucial role of crop genetic diversity for a robust food security system able to adapt to the dynamic nature of biotic and abiotic stresses, particularly with the current global changes.

Supplementary Materials

The following are available online at https://0-www-mdpi-com.brum.beds.ac.uk/article/10.3390/crops1030013/s1, Figure S1: Discriminant Analyses on Principal Components (DAPC) based on SNP data for the rice reference data for worldwide diversity (3K genomes) and this study’s 77 samples from Burkina Faso, Figure S2: Principal Component Analysis (PCA) based on SNP data for the 50 samples from farmers’ fields in Burkina Faso. The color of the labels indicate the cultivar as named by the farmer during the interview. The labels are the field’s identifier, with two letters reflecting the site: BL: Badala, BM: Bama, BZ: Banzon, KA: Karfiguela, SZ: Senzon TG: Tengrela. The aspect of the point indicates the sampling site: the shape corresponding to the geographical zone and the color reflecting the rice growing system, Table S1: Confidence interval on pairwise FST matrix between the six studied sites using 100 bootstrap. Above diagonal = upper limit, below diagonal = lower limit.

Author Contributions

I.W., K.A.K., A.G. and C.T. coordinated the project with advice from F.S. and L.A.; M.B., A.I.K., I.W. and C.T. coordinated the sampling in farmers’ fields; M.B. and A.I.K. performed the sampling. I.S. and G.B. supervised the PhD work of M.B. with the help of I.W. and C.T.; A.I.K., I.W., H.K. and M.S. chose and prepared the registered cultivars. P.C., C.T. and M.B. analyzed the data. C.T. and P.C. wrote the manuscript and M.B., I.W., M.S., G.B., L.A. and F.S. edited previous versions of the manuscript. All authors have read and agreed to the published version of the manuscript.

Funding

This work was publicly funded by the CGIAR Research Program on Rice Agri-food Systems (RICE) and the ANR (the French National Research Agency) under «Investissements d’avenir» programme with the reference ANR-10-LABX-001-01 Labex Agro (RiPaBIOME project), coordinated by Agropolis Fondation under the frame of I-SITE MUSE (ANR-16-IDEX-006). The funders had no role in study design, data collection and analysis, decision to publish, or preparation of the manuscript.

Institutional Review Board Statement

Not applicable.

Informed Consent Statement

Not applicable.

Data Availability Statement

Field data are available on IRD platform DataSuds: https://dataverse.ird.fr/dataset.xhtml?persistentId=doi:10.23708/8FDWIE (accessed on 22 April 2021). Genotyping data and R script used to analyze the data and perform the figures are available on GitHub: https://github.com/Africrop/divrice_bf (accessed on 31 July 2021).

Acknowledgments

This work was performed thanks to the facilities of the ‘International joint Laboratory LMI PathoBios: Observatory of plant pathogens in West Africa: biodiversity and biosafety’ (www.pathobios.com, accessed on 30 October 2021; twitter.com/PathoBios). We are very grateful to Abdoul Kader Guigma, Sylvain Zougrana, Yacouba Kone, Edouard Kabore, Daouda Hema, Momouni Traoré and Roméo Dabire for their contributions to the fieldwork in Burkina Faso. We thank the rice farmers from Badala, Bama, Senzon, Banzon, Tengrela and Karfiguela for their kind collaboration. We are grateful to Siaka Bagoyogo for his help with registered cultivars, Martine Bangratz for testing some DNA extractions, and to Maria Ymber V. Reveche at IRRI Service Laboratories—Genotyping Services Lab (GSL) for her help in receiving the samples and genotyping. We thank Alexandre Soriano who inserted the data in the rice genome hub (https://rice-genome-hub.southgreen.fr/ (accessed on 30 October 2021)), and Eugénie Hebrard for helpful comments on an earlier version of the manuscript.

Conflicts of Interest

The authors declare no conflict of interest.

References

  1. Zimmerer, K.S.; de Haan, S.; Jones, A.D.; Creed-Kanashiro, H.; Tello, M.; Carrasco, M.; Meza, K.; Plasencia Amaya, F.; Cruz-Garcia, G.S.; Tubbeh, R.; et al. The biodiversity of food and agriculture (Agrobiodiversity) in the anthropocene: Research advances and conceptual framework. Anthropocene 2019, 25, 100192. [Google Scholar] [CrossRef]
  2. Pironon, S.; Etherington, T.R.; Borrell, J.S.; Kühn, N.; Macias-Fauria, M.; Ondo, I.; Tovar, C.; Wilkin, P.; Willis, K.J. Potential adaptive strategies for 29 sub-Saharan crops under future climate change. Nat. Clim. Chang. 2019, 9, 758–763. [Google Scholar] [CrossRef]
  3. Soullier, G.; Demont, M.; Arouna, A.; Lancon, F.; del Villar, P.M. The state of rice value chain upgrading in West Africa. Glob. Food Secur.-Agric. Policy Econ. Environ. 2020, 25, 100365. [Google Scholar] [CrossRef]
  4. Linares, O.F. African rice (Oryza glaberrima): History and future potential. Proc. Natl. Acad. Sci. USA 2002, 99, 16360. [Google Scholar] [CrossRef] [PubMed] [Green Version]
  5. Sarla, N.; Swamy, B.P.M. Oryza glaberrima: A source for the improvement of Oryza sativa. Curr. Sci. 2005, 89, 955–963. [Google Scholar]
  6. Ndjiondjop, M.N.; Semagn, K.; Sow, M.; Manneh, B.; Gouda, A.C.; Kpeki, S.B.; Pegalepo, E.; Wambugu, P.; Sie, M.; Warburton, M.L. Assessment of Genetic Variation and Population Structure of Diverse Rice Genotypes Adapted to Lowland and Upland Ecologies in Africa Using SNPs. Front. Plant Sci. 2018, 9, 446. [Google Scholar] [CrossRef] [PubMed] [Green Version]
  7. Chen, C.; He, W.; Nassirou, T.Y.; Nsabiyumva, A.; Dong, X.; Adedze, Y.M.N.; Jin, D. Molecular characterization and genetic diversity of different genotypes of Oryza sativa and Oryza glaberrima. Electron. J. Biotechnol. 2017, 30, 48–57. [Google Scholar] [CrossRef]
  8. Luther, Z.; Akromah, R.; Nyadanu, D.; Tokpah, D.; Page, Z.; Voor, V.; Kwaloe, A. Evaluation of genetic diversity in rice (Oryza sativa and Oryza glaberrima) germplasm from Liberia and Ghana using simple sequence repeat (SSR) markers. Afr. J. Biotechnol. 2017, 16, 1990–1996. [Google Scholar]
  9. Yelome, O.I.; Audenaert, K.; Landschoot, S.; Dansi, A.; Vanhove, W.; Silue, D.; Van Damme, P.; Haesaert, G. Analysis of population structure and genetic diversity reveals gene flow and geographic patterns in cultivated rice (O. sativa and O. glaberrima) in West Africa. Euphytica 2018, 214, 215. [Google Scholar] [CrossRef]
  10. Diop, B.; Wang, D.R.; Drame, K.N.; Gracen, V.; Tongoona, P.; Dzidzienyo, D.; Nartey, E.; Greenberg, A.J.; Djiba, S.; Danquah, E.Y.; et al. Bridging old and new: Diversity and evaluation of high iron-associated stress response of rice cultivated in West Africa. J. Exp. Bot. 2020, 71, 4188–4200. [Google Scholar] [CrossRef] [Green Version]
  11. Sié, M.; Zongo, J.D.; Dona Dakouo, D. Prospection des cultivars traditionnels de riz du Burkina Faso. Rev. CAMES Sci. Médecine 1998, 00, 21–27. [Google Scholar]
  12. Sié, M.; Ghesquière, A.; Miezan, K. Structure génétique des variétés traditionnelles de riz (Oryza sp.) du Burkina Faso. Agron. Afr. 1999, 11, 57–71. [Google Scholar]
  13. Kam, H.; Ndjiondjop, M.; Sanou, J.; Sow, M.; Ouédraogo, I.; Laing, M. Diversity assessment and geographical variability of rice landraces collected from Burkina Faso. Int. J. Dev. Sustain. 2017, 6, 479–496. [Google Scholar]
  14. Kam, H.; Ndjiondjop, M.; Laing, M.; Ahmadi, N. Molecular characterization and diversity analysis of Burkina Faso rice landraces using 23 microsatellite markers and establishment of a core collection. Int. J. Curr. Res. 2017, 9, 56222–56232. [Google Scholar]
  15. Demont, M.; Ndour, M.; Zossou, E. Can local African rice be competitive? An analysis of quality-based competitiveness through experimental auctions. Cah. Agric. 2013, 22, 345–352. [Google Scholar] [CrossRef]
  16. Cotonou, B. Boosting Africa’s Rice Sector: A Research for Development Strategy 2011–2020; AfricaRice: Bouaké, Cote D’Ivoire, 2011; p. 77. [Google Scholar]
  17. Katic, P.G.; Namara, R.E.; Hope, L.; Owusu, E.; Fujii, H. Rice and irrigation in West Africa: Achieving food security with agricultural water management strategies. Water Resour. Econ. 2013, 1, 75–92. [Google Scholar] [CrossRef]
  18. MAHRH—Ministère de l’Agriculture, de l’Hydraulique et des Ressources Halieutiques (Ministry of Agriculture, Hydraulics and Fisheries Resources in Burkina Faso). Burkina Faso National Rice Development Strategy (NRDS). 2011. Available online: https://riceforafrica.net/images/stories/PDF/burkina_faso_en.pdf (accessed on 30 October 2021).
  19. DGPER—Direction Générale de la Promotion de l’Economie Rurale (General Direction for the Promotion of Rural Economy in Burkina Faso). Résultats Définitifs de la Campagne Agricole et de la Situation Alimentaire et Nutritionnelle 2009/2010. 2010. Available online: http://cns.bf/IMG/pdf/masa_rdepa_2009-2010.pdf (accessed on 30 October 2021).
  20. McCouch, S.; Wing, R.; Semon, M.; Venuprasad, R.; Atlin, G.; Sorrells, M.; Jannink, J. Making Rice Genomics Work for Africa. In Realizing Africa’s Rice Promise; Wopereis, M., David Johnson, D., Ahmadi, N., Tollens, E., Jalloh, A., Eds.; CABI: Wallingford, UK, 2013; pp. 108–129. [Google Scholar]
  21. Semagn, K.; Ndjiondjop, M.N.; Cissoko, M. Microsatellites and agronomic traits for assessing genetic relationships among 18 New Rice for Africa (NERICA) varieties. Afr. J. Biotechnol. 2006, 5, 800–810. [Google Scholar]
  22. Bocco, R.; Lorieux, M.; Seck, P.A.; Futakuchi, K.; Manneh, B.; Baimey, H.; Ndjiondjop, M.N. Agro-morphological characterization of a population of introgression lines derived from crosses between IR 64 (Oryza sativa indica) and TOG 5681 (Oryza glaberrima) for drought tolerance. Plant Sci. 2012, 183, 65–76. [Google Scholar] [CrossRef]
  23. Barro, M.; Kassankogno, A.I.; Wonni, I.; Sereme, D.; Somda, I.; Kaboré, K.H.; Bena, G.; Brugidou, C.; Tharreau, D.; Tollenaere, C. Spatiotemporal Survey of Multiple Rice Diseases in Irrigated Areas Compared to Rainfed Lowlands in the Western Burkina Faso. Plant Dis. 2021. [Google Scholar] [CrossRef]
  24. Thomson, M.J. High-Throughput SNP Genotyping to Accelerate Crop Improvement. Plant Breed. Biotechnol. 2014, 2, 195–212. [Google Scholar] [CrossRef]
  25. Kretzschmar, T.; Mbanjo, E.G.N.; Magalit, G.A.; Dwiyanti, M.S.; Habib, M.A.; Diaz, M.G.; Hernandez, J.; Huelgas, Z.; Malabayabas, M.L.; Das, S.K.; et al. DNA fingerprinting at farm level maps rice biodiversity across Bangladesh and reveals regional varietal preferences. Sci. Rep. 2018, 8, 14920. [Google Scholar] [CrossRef] [PubMed] [Green Version]
  26. Chang, C.C.; Chow, C.C.; Tellier, L.C.A.M.; Vattikuti, S.; Purcell, S.M.; Lee, J.J. Second-generation PLINK: Rising to the challenge of larger and richer datasets. GigaScience 2015, 4, 7. [Google Scholar] [CrossRef]
  27. Danecek, P.; Bonfield, J.K.; Liddle, J.; Marshall, J.; Ohan, V.; Pollard, M.O.; Whitwham, A.; Keane, T.; McCarthy, S.A.; Davies, R.M.; et al. Twelve years of SAMtools and BCFtools. GigaScience 2021, 10, giab008. [Google Scholar] [CrossRef] [PubMed]
  28. R Core Team. R: A Language and Environment for Statistical Computing; R Foundation for Statistical Computing: Vienna, Austria, 2018; Available online: www.r-project.org/about.html (accessed on 30 October 2021).
  29. Gain, C.; François, O. LEA 3: Factor models in population genetics and ecological genomics with R. Mol. Ecol. Resour. 2021, 1–11. [Google Scholar] [CrossRef]
  30. Wickham, H. ggplot2: Elegant Graphics for Data Analysis; Springer: New York, NY, USA, 2016; ISBN 978-3-319-24277-4. Available online: https://ggplot2.tidyverse.org (accessed on 21 April 2021).
  31. Jombart, T. adegenet: A R package for the multivariate analysis of genetic markers. Bioinformatics 2008, 24, 1403–1405. [Google Scholar] [CrossRef] [Green Version]
  32. Goudet, J.; Jombart, T. Hierfstat: Estimation and Tests of Hierarchical F-Statistics. R Package Version 0.5-7. 2020. Available online: https://CRAN.R-project.org/package=hierfstat (accessed on 21 July 2021).
  33. Paradis, E.; Schliep, K. ape 5.0: An environment for modern phylogenetics and evolutionary analyses in R. Bioinformatics 2019, 35, 526–528. [Google Scholar] [CrossRef] [PubMed]
  34. Yu, G. Using ggtree to Visualize Data on Tree-Like Structures. Curr. Protoc. Bioinform. 2020, 69, e96. [Google Scholar] [CrossRef] [PubMed]
  35. Dray, S.; Dufour, A.-B. The ade4 Package: Implementing the Duality Diagram for Ecologists. J. Stat. Softw. 2007, 22, 1–20. [Google Scholar] [CrossRef] [Green Version]
  36. Ndjiondjop, M.N.; Semagn, K.; Zhang, J.W.; Gouda, A.C.; Kpeki, S.B.; Goungoulou, A.; Wambugu, P.; Drame, K.N.; Bimpong, I.K.; Zhao, D.L. Development of species diagnostic SNP markers for quality control genotyping in four rice (Oryza L.) species. Mol. Breed. 2018, 38, 131. [Google Scholar] [CrossRef] [Green Version]
  37. Loko, Y.L.E.; Ewedje, E.E.; Orobiyi, A.; Djedatin, G.; Toffa, J.; Gbemavo, C.D.S.J.; Tchakpa, C.; Gavoedo, D.; Sedah, P.; Sabot, F. On-farm management of rice diversity, varietal preference criteria, and farmers’ perceptions of the African (Oryza glaberrima Steud.) versus Asian rice (Oryza sativa L.) in the Republic of Benin (West Africa): Implications for breeding and conservation. Econ. Bot. 2021, 75, 1–29. [Google Scholar] [CrossRef]
  38. Arouna, A.; Lokossou, J.C.; Wopereis, M.C.S.; Bruce-Oliver, S.; Roy-Macauley, H. Contribution of improved rice varieties to poverty reduction and food security in sub-Saharan Africa. Glob. Food Secur. 2017, 14, 54–60. [Google Scholar] [CrossRef]
  39. Mokuwa, A.; Nuijten, E.; Okry, F.; Teeken, B.; Maat, H.; Richards, P.; Struik, P.C. Robustness and Strategies of Adaptation among Farmer Varieties of African Rice (Oryza glaberrima) and Asian Rice (Oryza sativa) across West Africa. PLoS ONE 2013, 8, e34801. [Google Scholar] [CrossRef]
Figure 1. Information on the studied sites: geographic location, rice growing systems and rice cultivars grown according to interviewed farmers. (a) Map of the rice sampling locations: Up right: location of Burkina Faso in Africa (from https://upload.wikimedia.org/wikipedia/commons/d/d0/Location_map_of_Burkina_Faso_in_Africa.svg, accessed on 14 April 2021). Up left: location of the three studied geographic zones in western Burkina Faso, each comprising an irrigated perimeter (square) and neighboring rainfed site (triangle). The location of all rice fields and irrigated areas from the Burkina Faso land occupation database (https://www.ignfi.fr/fr/portfolio-item/occupation-des-terres-burkina-fao/, accessed on 12 May 2021) appears in green on the map. Down: location of the studied fields within each of the three zones (Bama, Banzon and Karfiguela, satellite Google Earth images). Irrigated studied fields (BZ: Banzon; KA: Karfiguela; BM: Bama) are represented in blue, while fields in rainfed lowlands (SZ: Senzon; TG: Tengrela, BL: Badala) are in orange. The number of fields per site is indicated in brackets. (b) Frequency of rice cultivars, according to farmers’ interviews, in the six study sites and the different years (2016–2019 dataset). Each plot corresponds to one site and each bar to a particular year, while the colors correspond to the rice cultivars cited by the farmers.
Crops 01 00013 g001
Figure 2. Principal Component Analysis (PCA) based on SNP data for the rice reference data for worldwide diversity (3K genomes) and this study’s 77 samples from Burkina Faso. The reference samples represented as colored points according to the genetic group. The samples from Burkina Faso (this study) are shown: with registered cultivars represented with orange triangles and samples from farmers’ fields with yellow squares. The left-hand side of the figure presents the first and second axes of the PCA, while the first and third axes are shown on the right. Among the 77 analyzed samples, two (the registered cultivar FKR04 and the landrace from Tengrela site TG02) were revealed as being very different from the rest of the samples, and they are labelled on the right-hand side of the figure.
Crops 01 00013 g002
Figure 3. Unrooted Neighbor-Joining tree based on distances computed from SNP data for the 77 samples from Burkina Faso. Samples from farmers’ fields begin with two letters reflecting the sampling site and appear in blue when sampled in irrigated areas (BZ: Banzon, KA: Karfiguela, BM: Bama) and in red/orange from rainfed lowlands (SZ: Senzon, TG: Tengrela, BL: Badala). On the other hand, registered cultivars appear in grey. Most of the samples (68/77 = 88.3%) are from indica genetic groups, surrounded in purple. The other genetic groups are indicated with colored shapes: blue for japonica, pink for Aus and grey for admix (same color scheme as in Figure 2).
Crops 01 00013 g003
Figure 4. Principal Component Analysis (PCA) based on SNP data for the 49 samples from farmers’ fields in Burkina Faso assigned to the genetic group indica. The color of the labels indicate the cultivar as named by the farmer during the interview. The labels are the field’s identifier, with two letters reflecting the site: BL: Badala, BM: Bama, BZ: Banzon, KA: Karfiguela, SZ: Senzon TG: Tengrela. The aspect of the point indicates the sampling site: the shape corresponding to the geographical zone and the color reflecting the rice growing system.
Crops 01 00013 g004
Table 1. List of registered cultivars from INERA/Burkina Faso analyzed in this study.
CultivarSynonymOriginIntroduction DateTime to MaturityGroup
FKR02GAMBIAKAGambia1970145indica
FKR04SINTANE DIOFORSenegal (Casamance)1960120-
FKR144418Inde1976125indica
FKR164456Inde1976120indica
FKR18SC 27Burkina Faso1980135indica
FKR21ITA 257IITA/Nigeria198798japonica
FKR331195-5-2Burkina Faso198298japonica
FKR34RP 1125-1526-2Inde1984129indica
FKR42IR64IRRI/Philippines1989123indica
FKR45NWAB880-1-38
NERICA 12
AfricaRice199995japonica
(NERICA upland)
FKR55WAB450-I-BL-1-736-HB
NERICA8
AfricaRice/INERA-75–95japonica
(NERICA upland)
FKR56NWSA 161-B-9-3
NERICA L-41
AfricaRice1999116indica
(NERICA, lowland)
FKR59WAB9984AfricaRice200990japonica
FKR60NWAS122-IDSA-1
NERICA L-20
AfricaRice1999115Indica
(NERICA, lowland)
FKR61WAB C1 65AfricaRice200990japonica
FKR62NWAS 122-IDSA-1
NERICA L-19
AfricaRice1999118Indica
(NERICA, lowland)
FKR64TS2Taiwan DGPV/INERA-120indica
FKR66WAT1046-B43AfricaRice2010125indica
FKR70IR 75-884-12-12AfricaRice2009130indica
FKR74WAB 2094-WAC2-TGR2-B
ARICA1
AfricaRice/INERA-101indica
(ARICA lowland)
FKR76F6-36DGPV/INERA201290indica
FKR78F6-41DGPV/INERA201297indica
FKR80F6-49DGPV/INERA201298indica
FKR84ORYLUX 6AfricaRice/INERA-100–105indica
NERICA4WAB450-I-B-P-91-HBAfricaRice/INERA-95–100japonica
(NERICA upland)
SAHEL177WAS 197-B-6-3-11AfricaRice/Saint-Louis-122indica
SAHEL328WAS 197-B-4-1-5ISRA/AfricaRice-116indica
For each cultivar, we indicate the potential synonym (with usual name in bold), the country or organism of origin, the date of introduction in Burkina Faso, the time to maturity (in days) and the genetic group based on a priori knowledge. Most of the cultivars’ names begin with ‘FKR’, which stands for ‘Farako-Bâ Riz’. Further information (pedigrees and/or agro-morphological information) can be found in [21,22].
Table 2. Obtained data for each of the six study sites: characteristics, GPS coordinates, number of analyzed samples and gene diversity.
Geographical ZoneSiteRice Production SystemLatitudeLongitudeN SamplesGene Diversity
BamaBadala (BL)RL11.368−4.37370.1250.117
Bama (BM)IR11.390−4.41090.131
BanzonSenzon (SZ)RL11.288−4.82970.1130.124
Banzon (BZ)IR11.335−4.796110.108
KarfiguelaTengrela (TG)RL10.648−4.83870.1550.132
Karfiguela (KA)IR10.678−4.81390.130
Average 0.1310.124
Global 500.137
Table 3. Pairwise FST matrix between the six study sites.
BamaBanzonKarfiguela
Geographical ZoneStudy SiteBadala
(BL)
Bama
(BM)
Senzon
(SZ)
Banzon
(BZ)
Tengrela
(TG)
Karfiguela
(KA)
BamaBadala (BL)-
Bama (BM)0.0018-
BanzonSenzon (SZ)0.0123−0.0194-
Banzon (BZ)0.0563−0.0129−0.0194-
KarfiguelaTengrela (TG)0.29490.25310.28340.3288-
Karfiguela (KA)0.03100.01180.04080.10740.2615-
Publisher’s Note: MDPI stays neutral with regard to jurisdictional claims in published maps and institutional affiliations.

