Article

Short-Term Effect of Green Waste and Sludge Amendment on Soil Microbial Diversity and Volatile Organic Compound Emissions

1
Environmental Science Department, Sorbonne Université UPMC, 75006 Paris, France
2
INRAE, UMR ECOSYS, INRAE, AgroParisTech, Université Paris-Saclay, 78850 Thiverval-Grignon, France
3
INRAE, UMR AgroEcologie, AgroSup Dijon, BP 87999, CEDEX, 21079 Dijon, France
*
Author to whom correspondence should be addressed.
Now working at: Umweltchemie und Luftrinhaltunz, Technische Universität Berlin, Straße des 17. Juni 135, 10623 Berlin, Germany.
Submission received: 21 April 2021 / Revised: 28 May 2021 / Accepted: 2 June 2021 / Published: 9 June 2021

Abstract

:
Soil amendments with organic waste products (OWPs) have been widely supported in Europe to improve soil fertility, causing wide changes in the microbial community structure and diversity, especially in the short-term period. Those changes are known to affect the volatile organic compound (VOC) emissions by soil. This work aimed to characterize, in terms of quantity and composition, the effect of green waste and sludge (GWS) application on soil VOC emissions and microbial community 49 h after the last GWS application. Two different soil samples were compared to test the effect of the soil history on VOC emissions and microbial communities. For this reason, we chose a soil that received GWS input for 20 years (GWS sample) and one that did not receive any organic input during the same period (CN sample). Furthermore, samples were manipulated to generate three microbial dilution diversity gradients (low, medium, and high). Results showed that Bacteroidetes phyla took advantage of the GWS application in all samples, increasing their relative abundance by 22% after 49 h, while the Proteobacteria phylum was penalized by the GWS amendment, passing from 58% to 49% relative abundance 49 h after the GWS application. Microbial structure differences between microbial diversity dilution levels remained even after the GWS application. GWS amendment induced a change in the emitted VOC profiles, especially in samples used to receiving GWS. GWS amendment doubled the VOC emissions from samples used to receiving GWS after 49 h. Finally, the microbial community was strongly correlated to the VOC emissions. Firmicutes, Proteobacteria, Actinobacteria, and Crenarchaeota were positively correlated (Pearson coefficient > 0.6), while other phyla, such as Bacteroidetes and Verrucomicrobia, were found to be negatively correlated (Pearson coefficient < −0.6) to the VOC emissions. After the addition of GWS, these correlations shifted from positive to negative and from negative to positive.

1. Introduction

The recycling of organic matter via amendment with organic waste products (OWPs) is an extensively used agronomic practice to increase soil fertility. Lately, this practice has been supported in Europe (European Commission, 2010) to contrast the decrease of soil organic matter content due to intensive agricultural practices [1] and improve waste recycling. OWPs are possible nutrient sources for plants, partially substituting mineral fertilizers [2]. The use of OWPs affects several chemical and physical properties and thus the microbial structure and activity in soil [3,4,5]. The effects of the OWPs amendment on soil chemical and physical characteristics and the microbial community depend on the duration of the OWPs amendment to the soil and the type of OWP [6]. Among the most used OWPs are green waste and sludge (GWS). GWS is a co-compost made of 70% of green waste and 30% sewage sludge, and it is widely used as fertilizer since mixing sewage sludge with green waste reduces the risks of environmental contaminations, promoting decreases in the levels of heavy metals and pathogens compared to sewage sludge OWP [7]. Furthermore, repeated GWS amendments over several years help preserve soil fertility and crop yields; they also have more persistent impacts on soil characteristics, plant growth [8], and microbial diversity [9,10] than punctual GWS amendment. GWS amendments also have several non-negligible impacts on soil characteristics and consequently on microorganisms [11]. The latest studies have reported that changes in the microbial structure also impact the VOC emissions from soil [12,13,14,15]. Seewald et al. (2010) [16] reported also that sludge-containing composts altered the VOC emissions from soils more than organic composts without sludge.
Until now, it has been shown that the most significant structural shift of the microbial community due to OWP amendments occurs in the short-term period [11,17]. Experiments on the short-term perturbation effect of OWP reported that 3 days after the amendment, both fungal and bacterial communities suffered a rapid change [4]. Previous studies on GWS amendments, microbial diversity, and VOC also reported that changes in the microbial community and structure have consequences on the VOC emissions rate from soil [11,15]. The emission of VOCs from soil and microorganisms gained attention because of their contribution to the global biogenic VOC emissions and their impact on the secondary organic aerosol (SOA) and ozone formation [18,19,20]. Furthermore, VOC from soil are released as intermediate or end products of the microbial metabolic pathways [16,21,22]. The direct monitoring of these VOC provides several insights about soil functionality and soil quality [23,24]. VOC from soil are highly responsive to changes in the microbial metabolic status, and they can be used as an evaluation for the soil’s biological health [23]. The characterization of the VOC profiles from soil have been widely studied during the last decades, even though changes in the VOC profile due to amendment with OWP and the consequent microbial perturbation have not been reported yet.
Abis et al. (2020) [15] showed that VOC emissions from the microbial community are also linked to the microbial diversity in soil. Dilution of the microbial diversity in the soil led to an increase of the VOC emissions from the soil of up to 2–3 times more than soil with high diversity levels [15]. These authors also observed that the effect of the GWS amendments on VOC emissions by soil was less important compared to the influence of the microbial diversity dilution levels.
In this context, this study aims at characterizing the short-term effects (within 49 h) of the GWS amendment to soils, with varying microbial dilution levels, on microbial structure and VOC emissions. This study analyzes, for the first time, several factors together: (I) the effect of the GWS amendment on the microbial structure 49 h after the amendment, (II) how the microbial structure impacts the VOC emissions from soil, and finally, (III) the microbial diversity in soil and its impact on the VOC emissions rate from the soil. We further compared the response of a microbial community used to receiving OWPs with a microbial community that had never received organic waste input to GWS amendment. The VOC emissions measurements were performed under controlled laboratory conditions using a dynamic chamber approach for 36 microcosms with three different microbial dilution levels (high, medium, and low) and two types of soil (CN and GWS). The VOC emissions from the microcosms were detected with the PTR-QiTOF-MS technique. Microbial community changes due to the GWS amendment were pictured by a high throughput sequencing approach targeting 16S ribosomal genes. Our findings help understand the microbial structural changes after the GWS amendment, while also describing the consequences on the VOC emissions.

2. Materials and Methods

2.1. Sampling and Site Description

The collection of the samples was performed in the QualiAgro site, located at Feucherolles, which is a station of the SOERE-PRO-network (https://www6.inra.fr/qualiagro_eng/Nos-partenaires/The-SOERE-PRO-network, accessed on 9 June 2021). The characteristics of this site have been already described by Abis et al. (2018). In the Feucherolles site, a long-term experiment has been running since 1998. The long-term experiment consists of amending the site every two years, in a randomized block design, with 4 different organic waste products: BIOW (bio-waste compost derived from the co-composting of green wastes and source-separated organic fractions of municipal solid wastes), GWS (compost derived from the co-composting of green wastes with sewage sludge), FYM (farmyard manure), and MSW (municipal solid waste compost derived from the composting of residual solid wastes after removing dry and clean packaging); plus a control without organic input (CN).
For this experiment, the collection of the samples has been performed in 2 plots of the site (GWS and CN). For each plot, we randomly collected five soil cores (0–30 cm depth) in early September 2016, one year following the last amendment (~4 t C ha−1 of every OWP). For each plot, a composite soil sample was made from a pool of five soil cores.

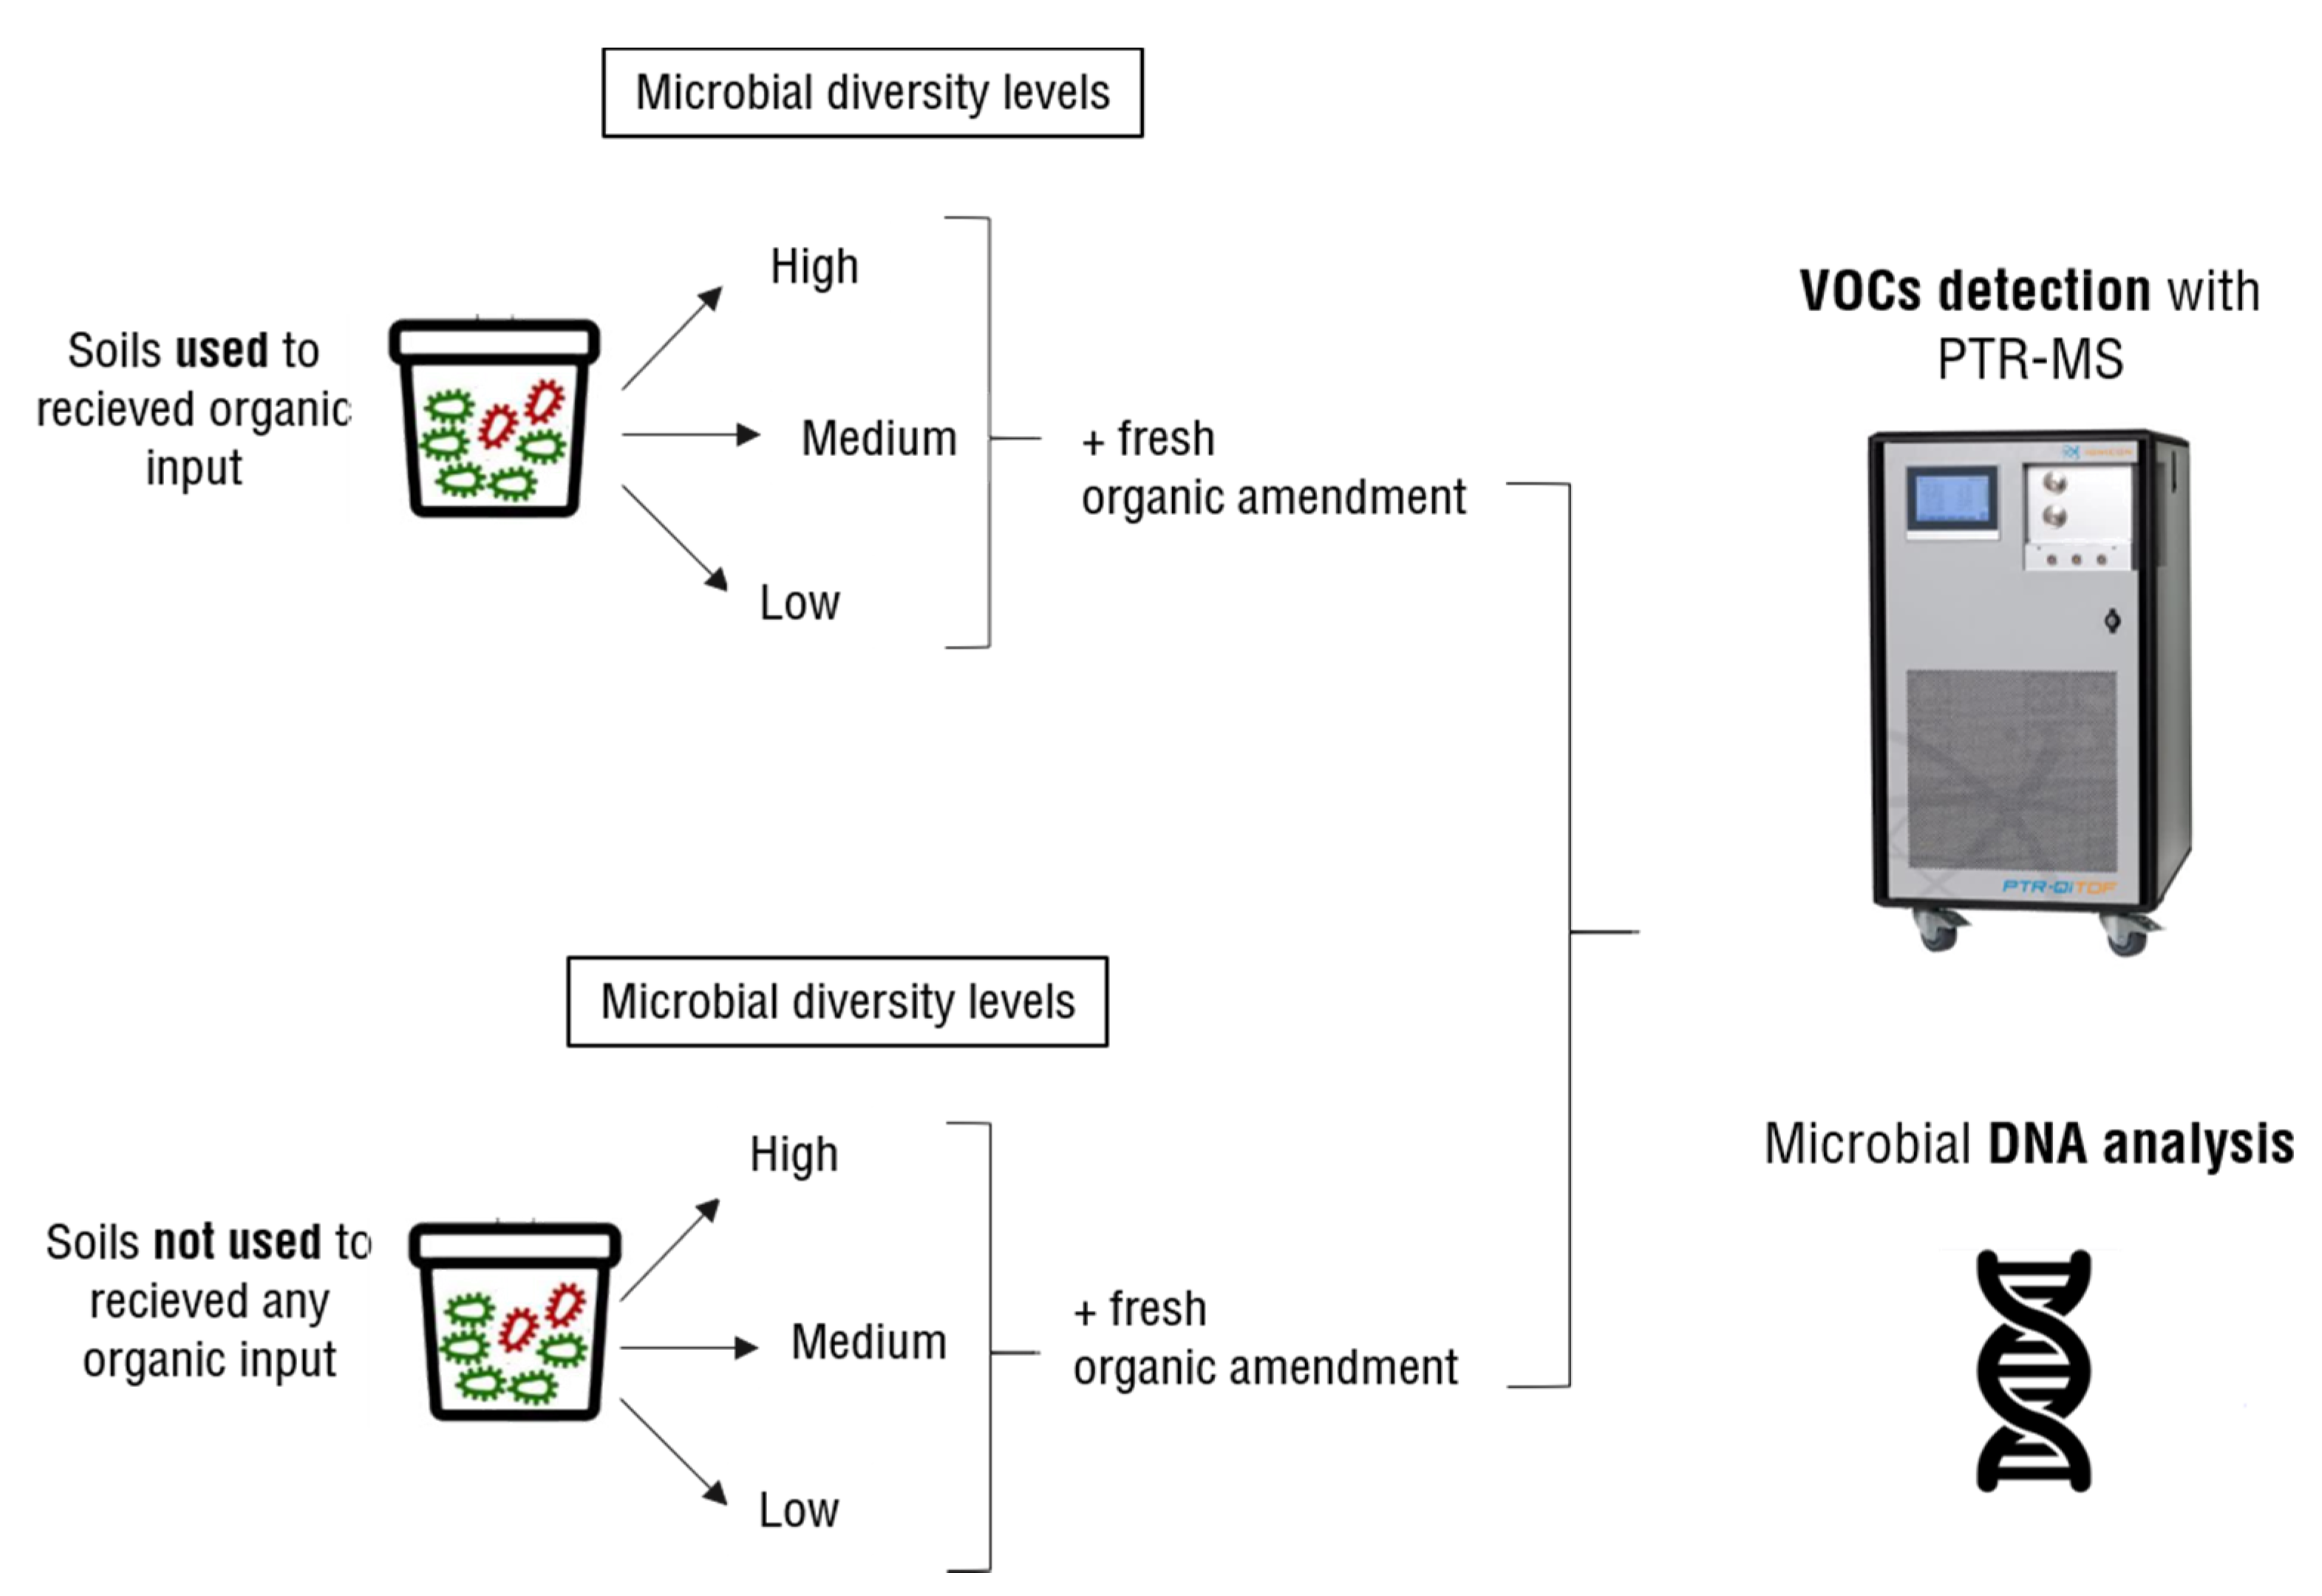
2.2. Microcosms Preparation

After collection, samples were then mixed and homogenized by passing them through a 4 mm sieve to remove above-ground plant debris, roots, and stones. A portion of each soil was air-dried at room temperature for physico-chemical analysis. Particle size distribution, pH, soil organic matter, soil organic carbon, soil total nitrogen (N), soil C/N ratio, Olsen P, and Cation Exchange Capacity (CEC) were determined by the Soil Analysis Laboratory at INRA Arras, France (http://www.lille.inra.fr/las, accessed on 9 June 2021, Table 1). The rest of the sieved soils were used for incubation. Sieved soil samples were sterilized by gamma ray (35 kGy; Conservatome, Dagneux, France). The sterility of the irradiated soil was verified by spreading the soil onto nutrient agar plates. After the sterilization process, the soils were inoculated with a diluted soil suspension prepared with the same soil before sterilization (Wertz et al., 2006) [25]. The soil suspension, obtained by a mix of 30 g of soil with 90 mL of sterilized water, was used pure (D0 = 1), diluted with water 103 times (D1 = 1:103 water/soil suspension ratio), and finally, diluted 105 times (D2 = 1:105 water/soil suspension ratio). Microcosms were set up by placing 30 g of dry sterile soil in a 150 mL plasma flask. The three levels of dilution of the soil suspension were used as inoculum to create a gradient of diversity as follows: low, for samples inoculated with D0 soil suspension; medium, for samples inoculated with D1 soil suspension; and high, for samples inoculated with D2 soil suspension. The soil moisture was fixed at 60% of the water holding capacity (WHC). Microcosms were at first sealed hermetically with a rubber plug and pre-incubated at 20 °C in the dark. Once a week for six weeks the microcosms have been aerated, keeping the soil moisture constant at 60% of the WHC. One week before the measurement with the PTR-QiTOF-MS, the rubber plug was substituted with a Teflon plug to reduce the VOC emissions released from the plug. After six weeks of incubation at 20 °C, GWS amendment was thoroughly mixed with 18 of the 36 CN and GWS samples, in its dry form (dose equivalent to 4 t C ha−1). The main characteristics of the GWS amendment are reported in Table 2.
After the addition of GWS amendment, those 18 samples were renamed as CN+GWS and GWS+GWS, respectively. The remaining 18 CN and GWS samples were lyophilized and stored at −40 °C until the soil DNA extraction had been performed. CN+GWS and GWS+GWS samples were then incubated for 49 h in the dark at 20 °C to ensure proper biomass activation. After 49 h incubation, CN and GWS samples were sacrificed for microbial molecular analyses. In Table S1 we summarize the performed analysis for each type of sample.

Timing of the VOCs Measurements

During the 49 h incubation for samples receiving GWS addition (CN+GWS and GWS+GWS), 10 VOC measurements with the PTR-QiTOF-MS were carried out. The first VOC measurement has been performed immediately before the GWS amendment (T0). 1 h after the GWS amendment (T1), the second VOC measurement was performed. The next 8 VOCs measurements were done at the following times: 3 h (T2), 6 h (T3), 9 h (T4), 25 h (T5), 27 h (T6), 30 h (T7), 33 h (T8), and 49 h (T9) after the addition of GWS amendment.

2.3. PTR-QiTOF-MS Measurement Set Up

Two PEEK tubes were inserted in the plug of every flask, one connected to the PTR-QiTOF-MS and the other one connected to a bottle of dry synthetic air (Alphagaz 1 Air: 80% nitrogen, 20% oxygen, 99.9999%, Air Liquide®, Paris, France). VOC detection lasted 180 s for every microcosm. The PTR-QiTOF-MS detection system and the equation used to calculate the VOC fluxes were the same as in Abis et al. (2018) [13], except for the airflow, which was set at 0.3 L min−1. Between each VOC measurement, the microcosms were incubated in a 20 °C chamber. After the last VOC measurement, the flasks were cleaned, and the soil transferred into a −40 °C chamber to wait for the DNA extraction.

2.4. Microbial Analyses

For the microbial analysis, three steps were performed: (i) the DNA extraction, (ii) the high throughput sequencing of 16S rRNA gene sequences, and (iii) the bioinformatic analysis of 16S rRNA gene sequences. DNA extraction protocol followed during this experiment has been already described in Abis et al. (2020 [15]). To obtain the prokaryotic biodiversity, we amplified a 440 base 16S rRNA from each DNA sample. The primers used for the amplifications were the same as in Tardy et al. (2014) [26]. The amplification of the DNA was performed during a 25 µL PCR (with 5 ng of DNA for each sample) under the following set up conditions: 94 °C for 2 min, 35 cycles of 30 s at 94 °C, 52 °C for 30 s and 72 °C for 1 min, followed by 7 min at 72 °C. The full description of the followed protocol has already been reported by Abis et al. (2020) [15]. The bioinformatics analysis was performed to erase artifacts that might have been produced during the gene sequencing step. All raw sequences were checked and discarded if: (i) they contained any ambiguous base (Ns), (ii) if their length was less than 350 nucleotides for 16S reads or 300 nucleotides for 18S reads, (iii) if the exact primer sequences were not found (for the distal primer, the sequence can be shorter than the complete primer sequence, but without ambiguities). The detailed protocol has been already reported by Abis et al. (2020) [15]. Figure 1 resume the experimental procedure explained in the previous paragraphs.

2.5. Statistical Analysis

2.5.1. VOCs Statistical Analyses

The dataset before the statistical analysis was made of 754 variables (number of peaks detected) and 36 samples. To select the most representative variables of the dataset, several statistical tests were performed using R software (Version 1.0.153—© 2009–2017 RStudio), following the same steps already reported by Abis et al. (2018, 2020) [13,15].
Moreover, correlated masses that are closer than the resolution of the PTR-QiTOF-MS were removed to avoid counting the same peak twice. Then, we performed the ANOVA test to analyze the statistical differences among the different timing and dilution levels. The performed ANOVAs were always followed by the Tukey post hoc test.

2.5.2. Microbial Statistical Analyses

Microbial biomass, the relative abundance of prokaryotes in the microbial composition, and microbial diversity Index (Shannon) were analyzed by the ANOVA test. With the ANOVA test, we also evaluated the effect of the GWS on the microbial community for the different microbial dilution levels. All significant effects were assessed by Tukey’s Honestly Significant Difference (HSD) post hoc test (p < 0.05).

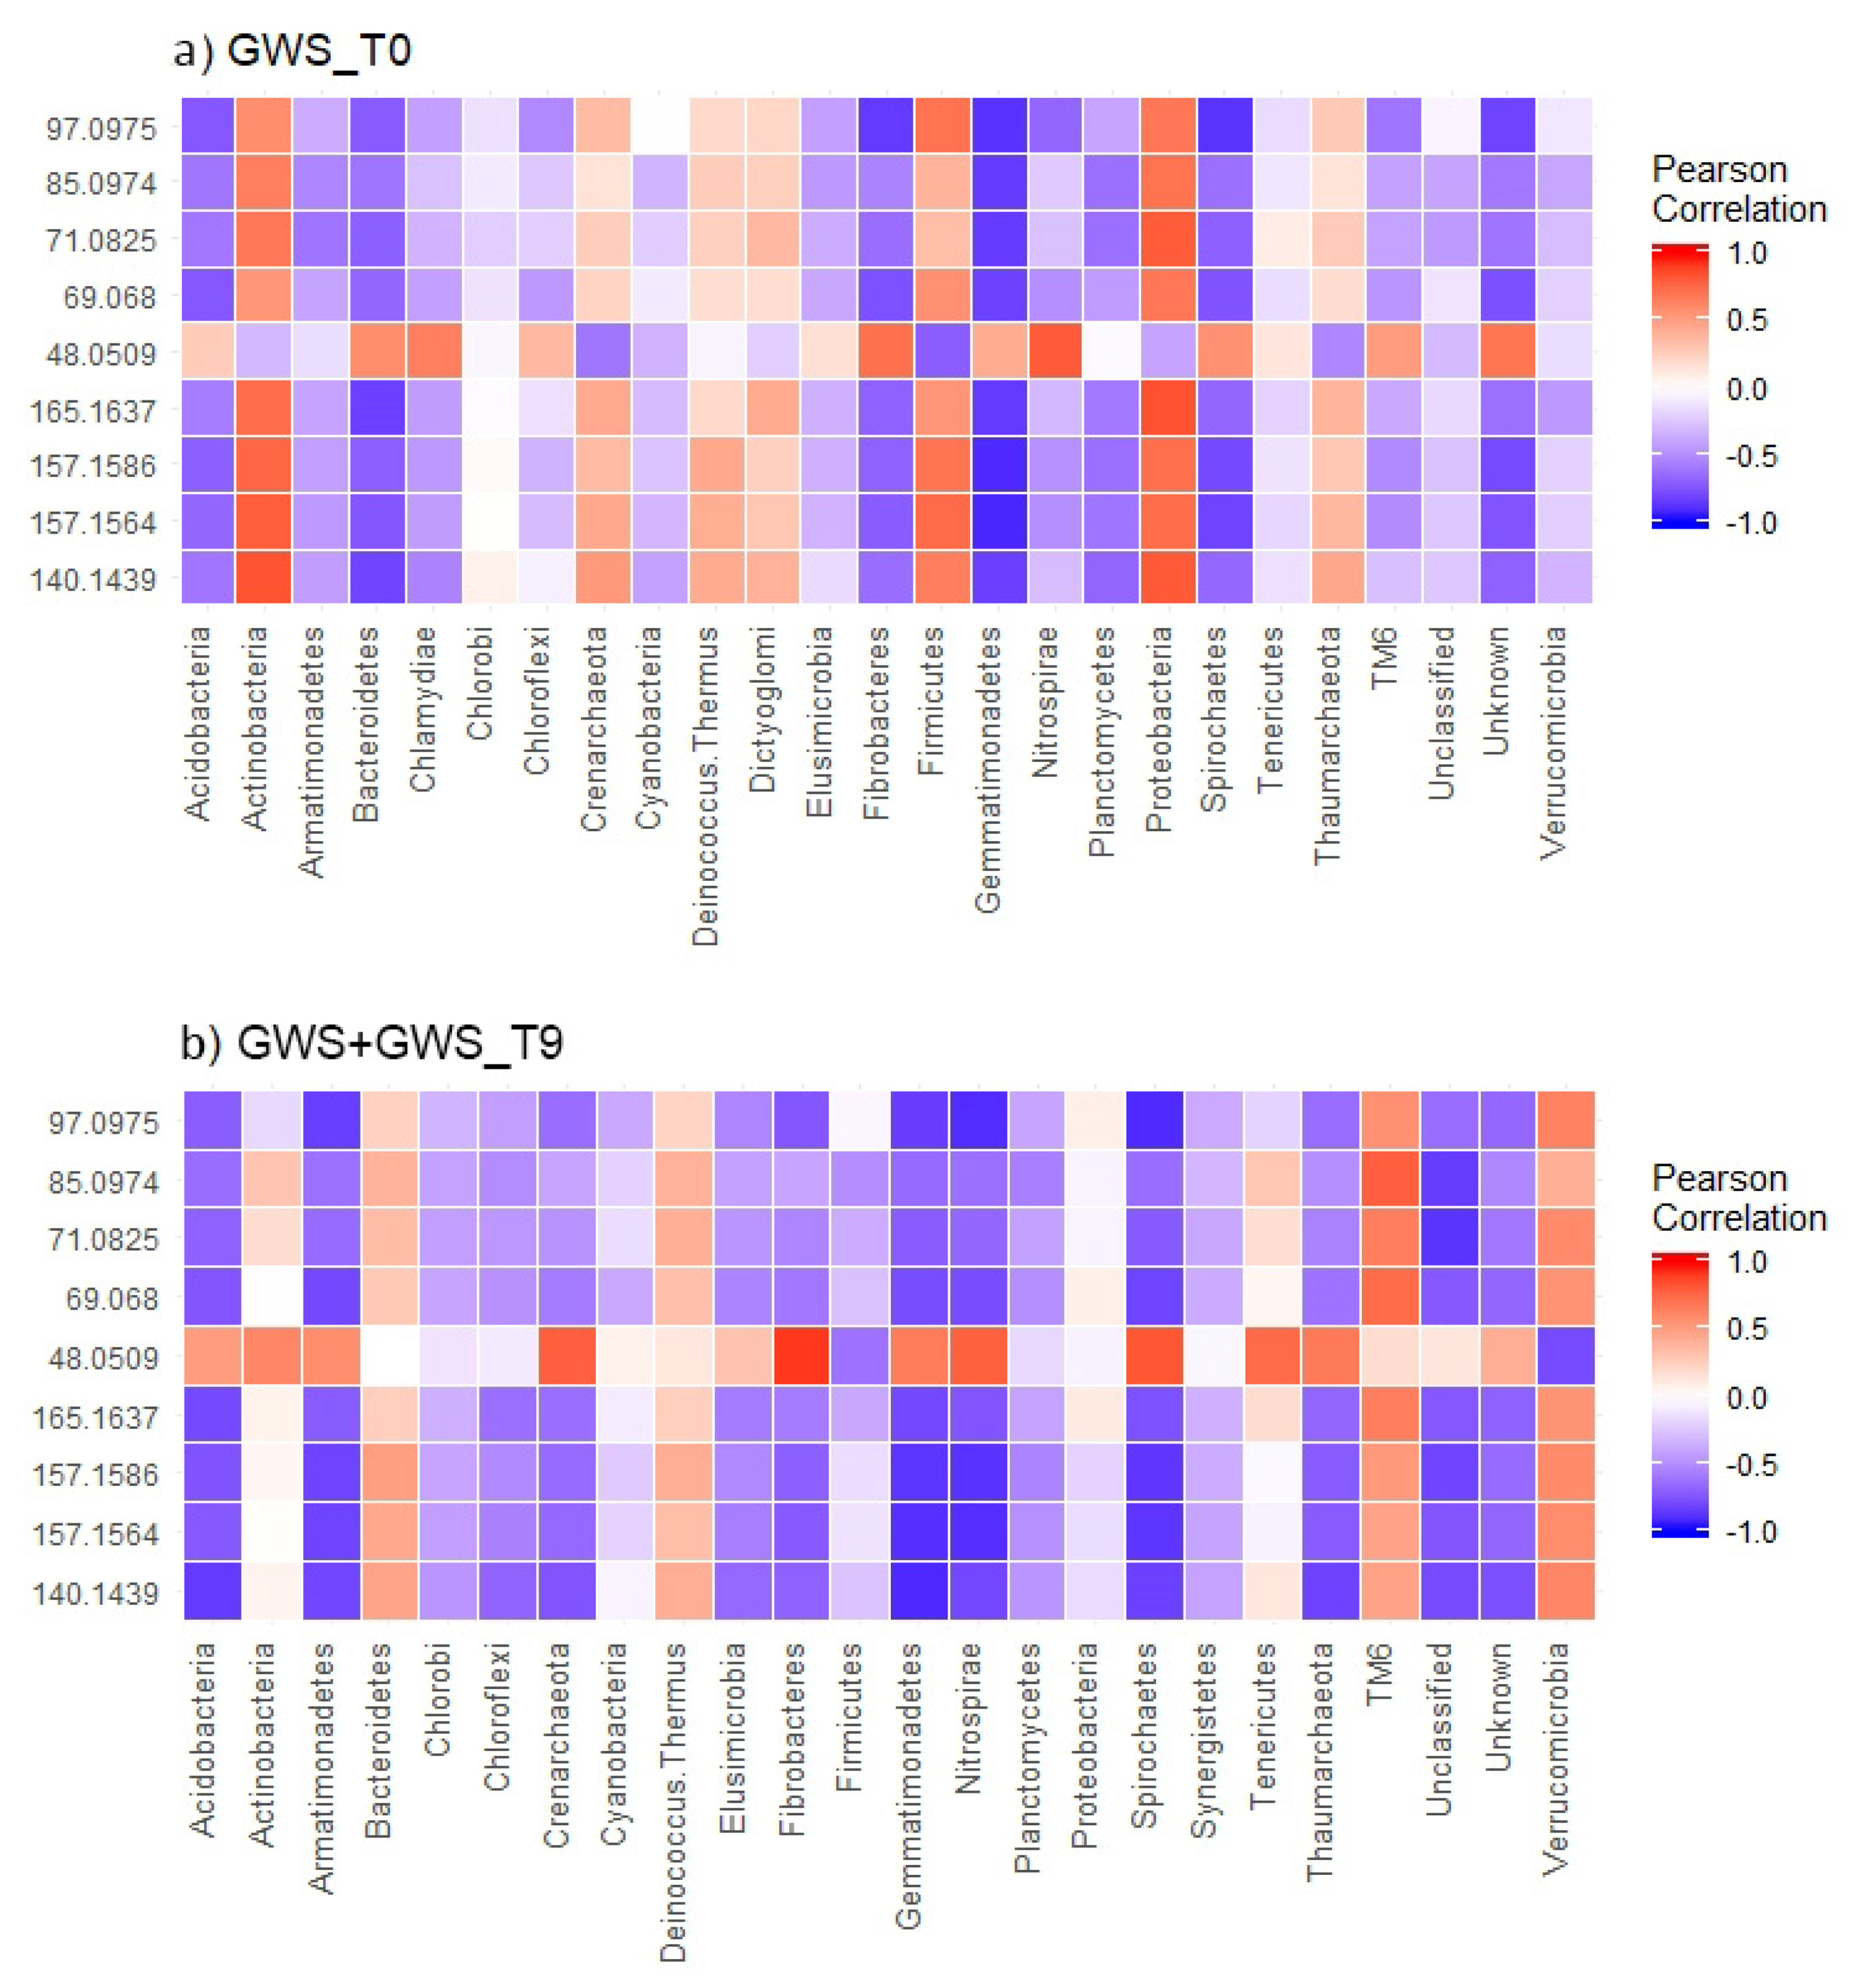
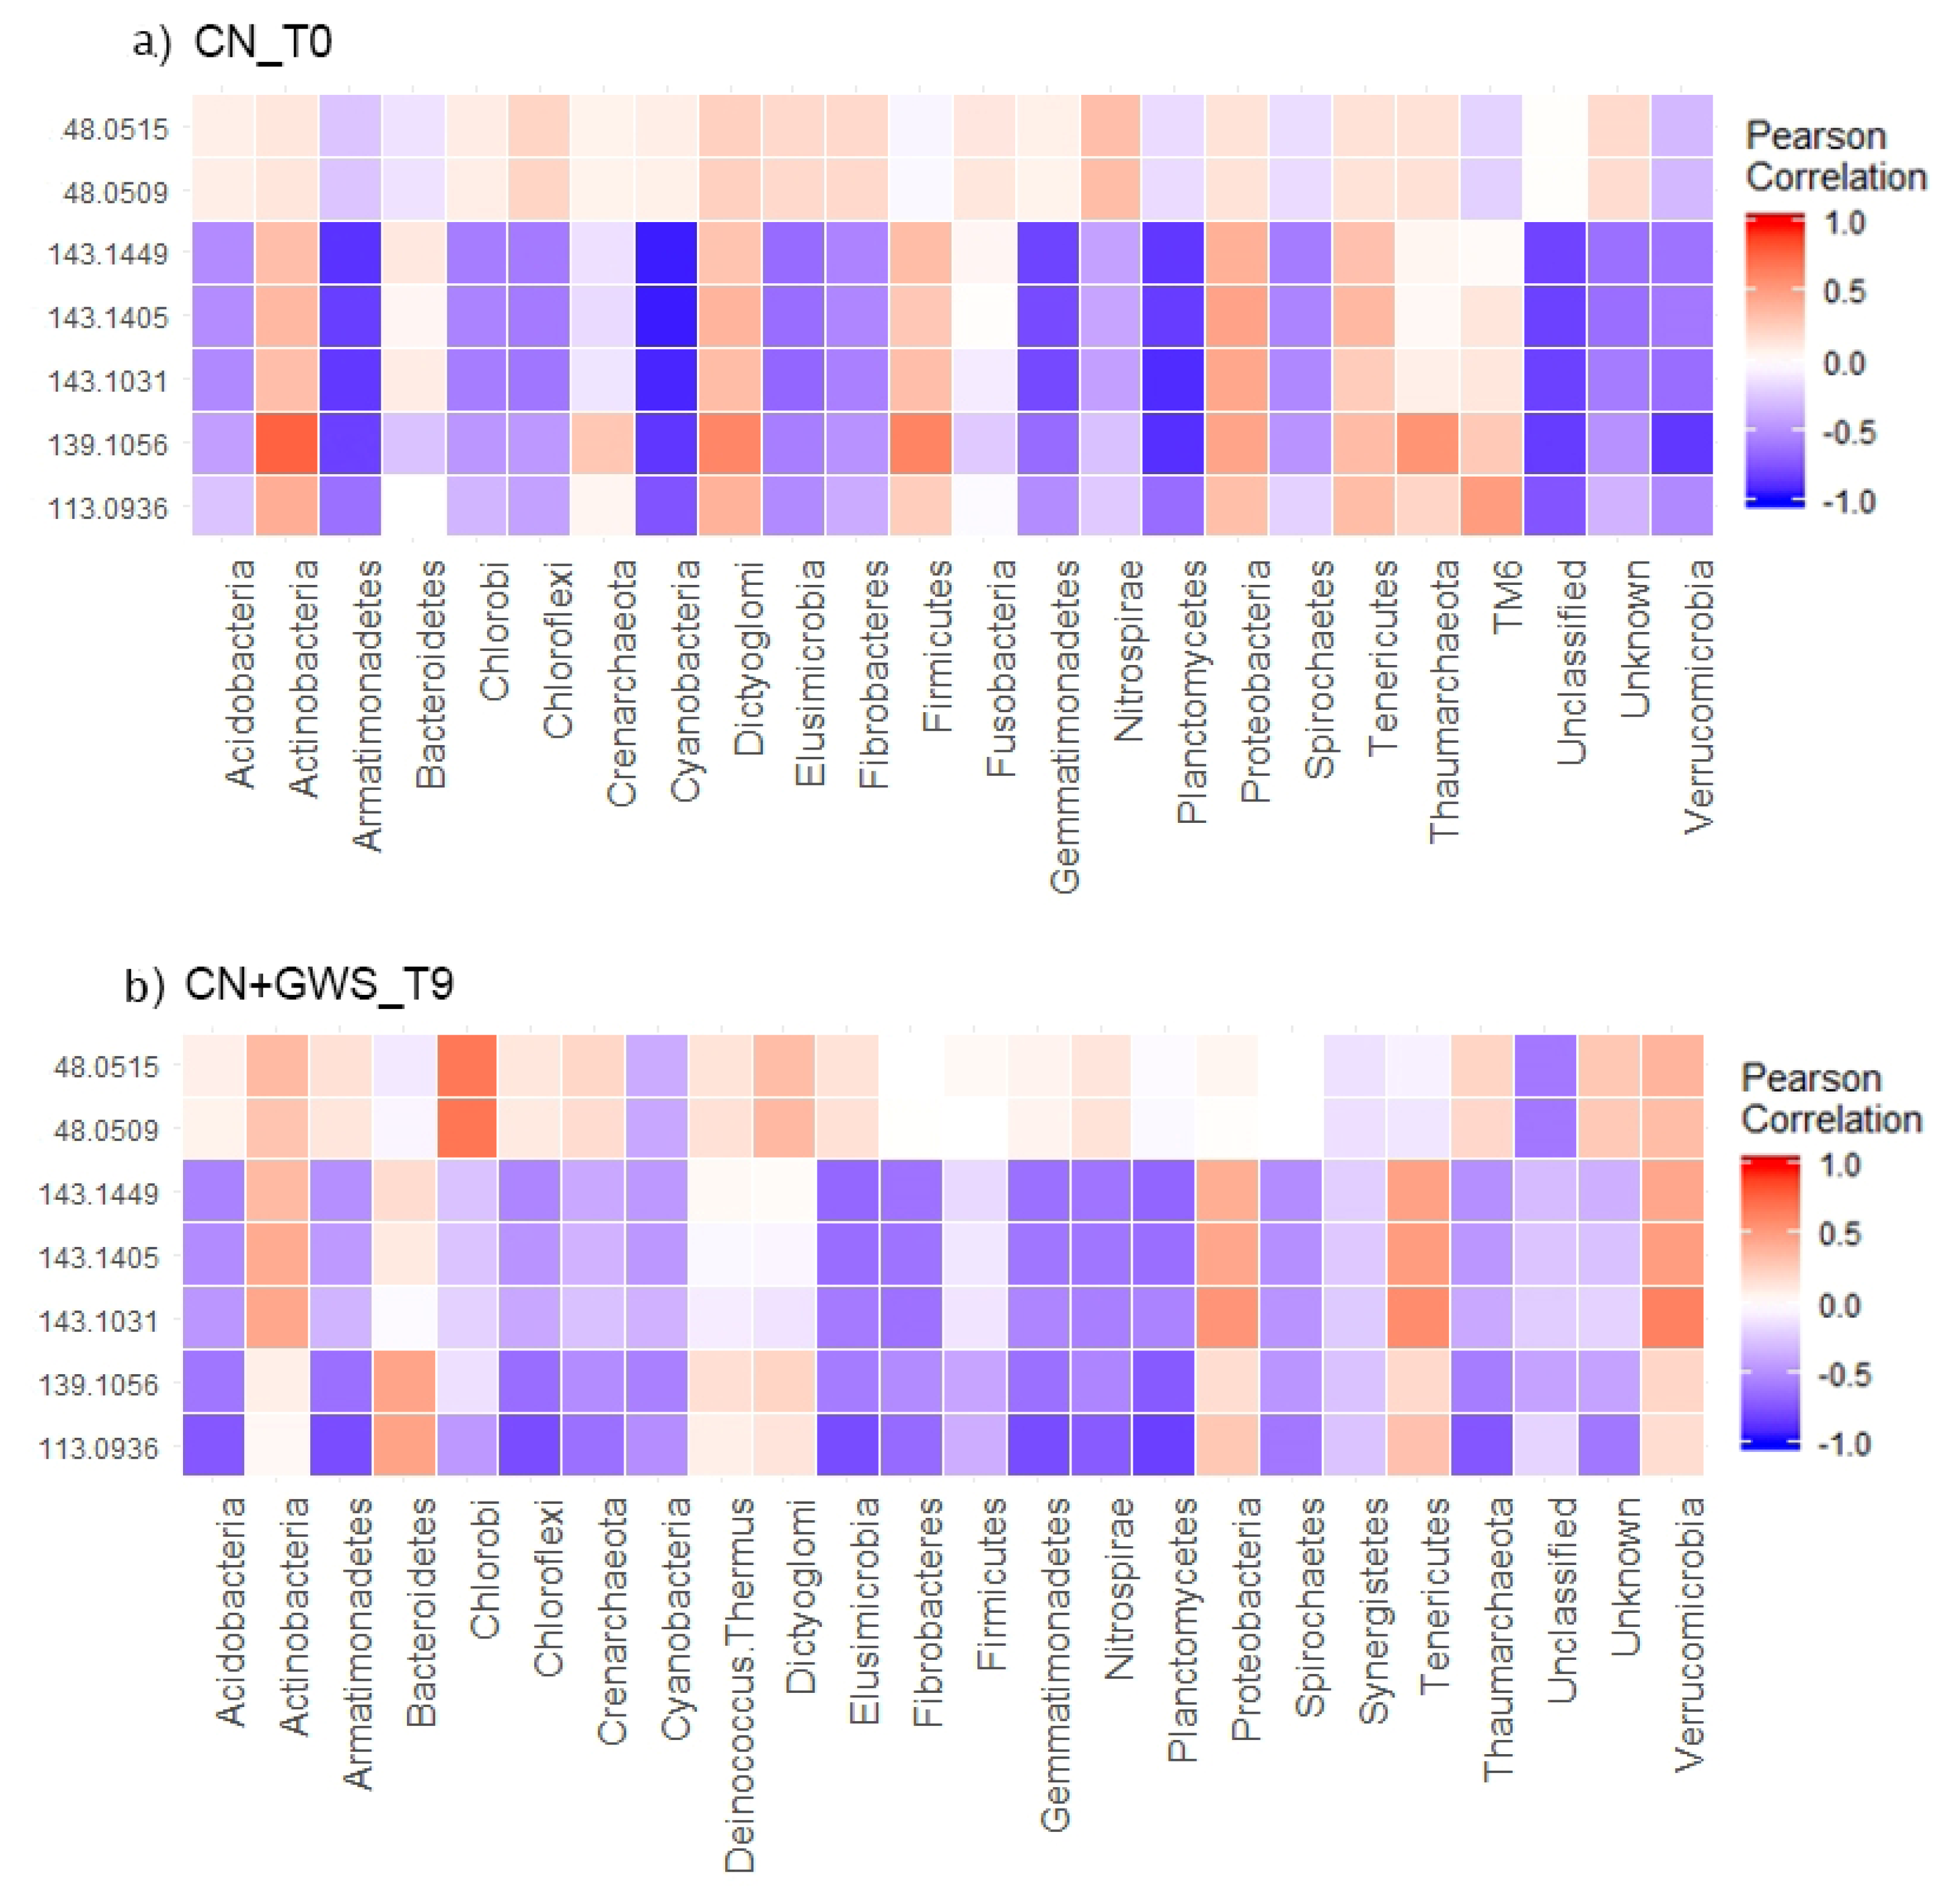
2.5.3. VOC and Phyla Correlation Analysis

The correlation between the summed VOC emissions and the microbial relative abundance was performed using the package Boruta of R studio. The Boruta function helped to select the most important and representative variables within our large dataset. This method allowed us to visualize a short number of variables (9 for the GWS samples and 7 for the CN samples) and to avoid redundant information. After the selection of the most important variables, we correlated them with the microbial relative abundance using the package corrplot. For the correlation of the different VOCs with the microbial relative abundance, we choose the Pearson correlation as a method for the calculation of the correlation coefficient.

3. Results

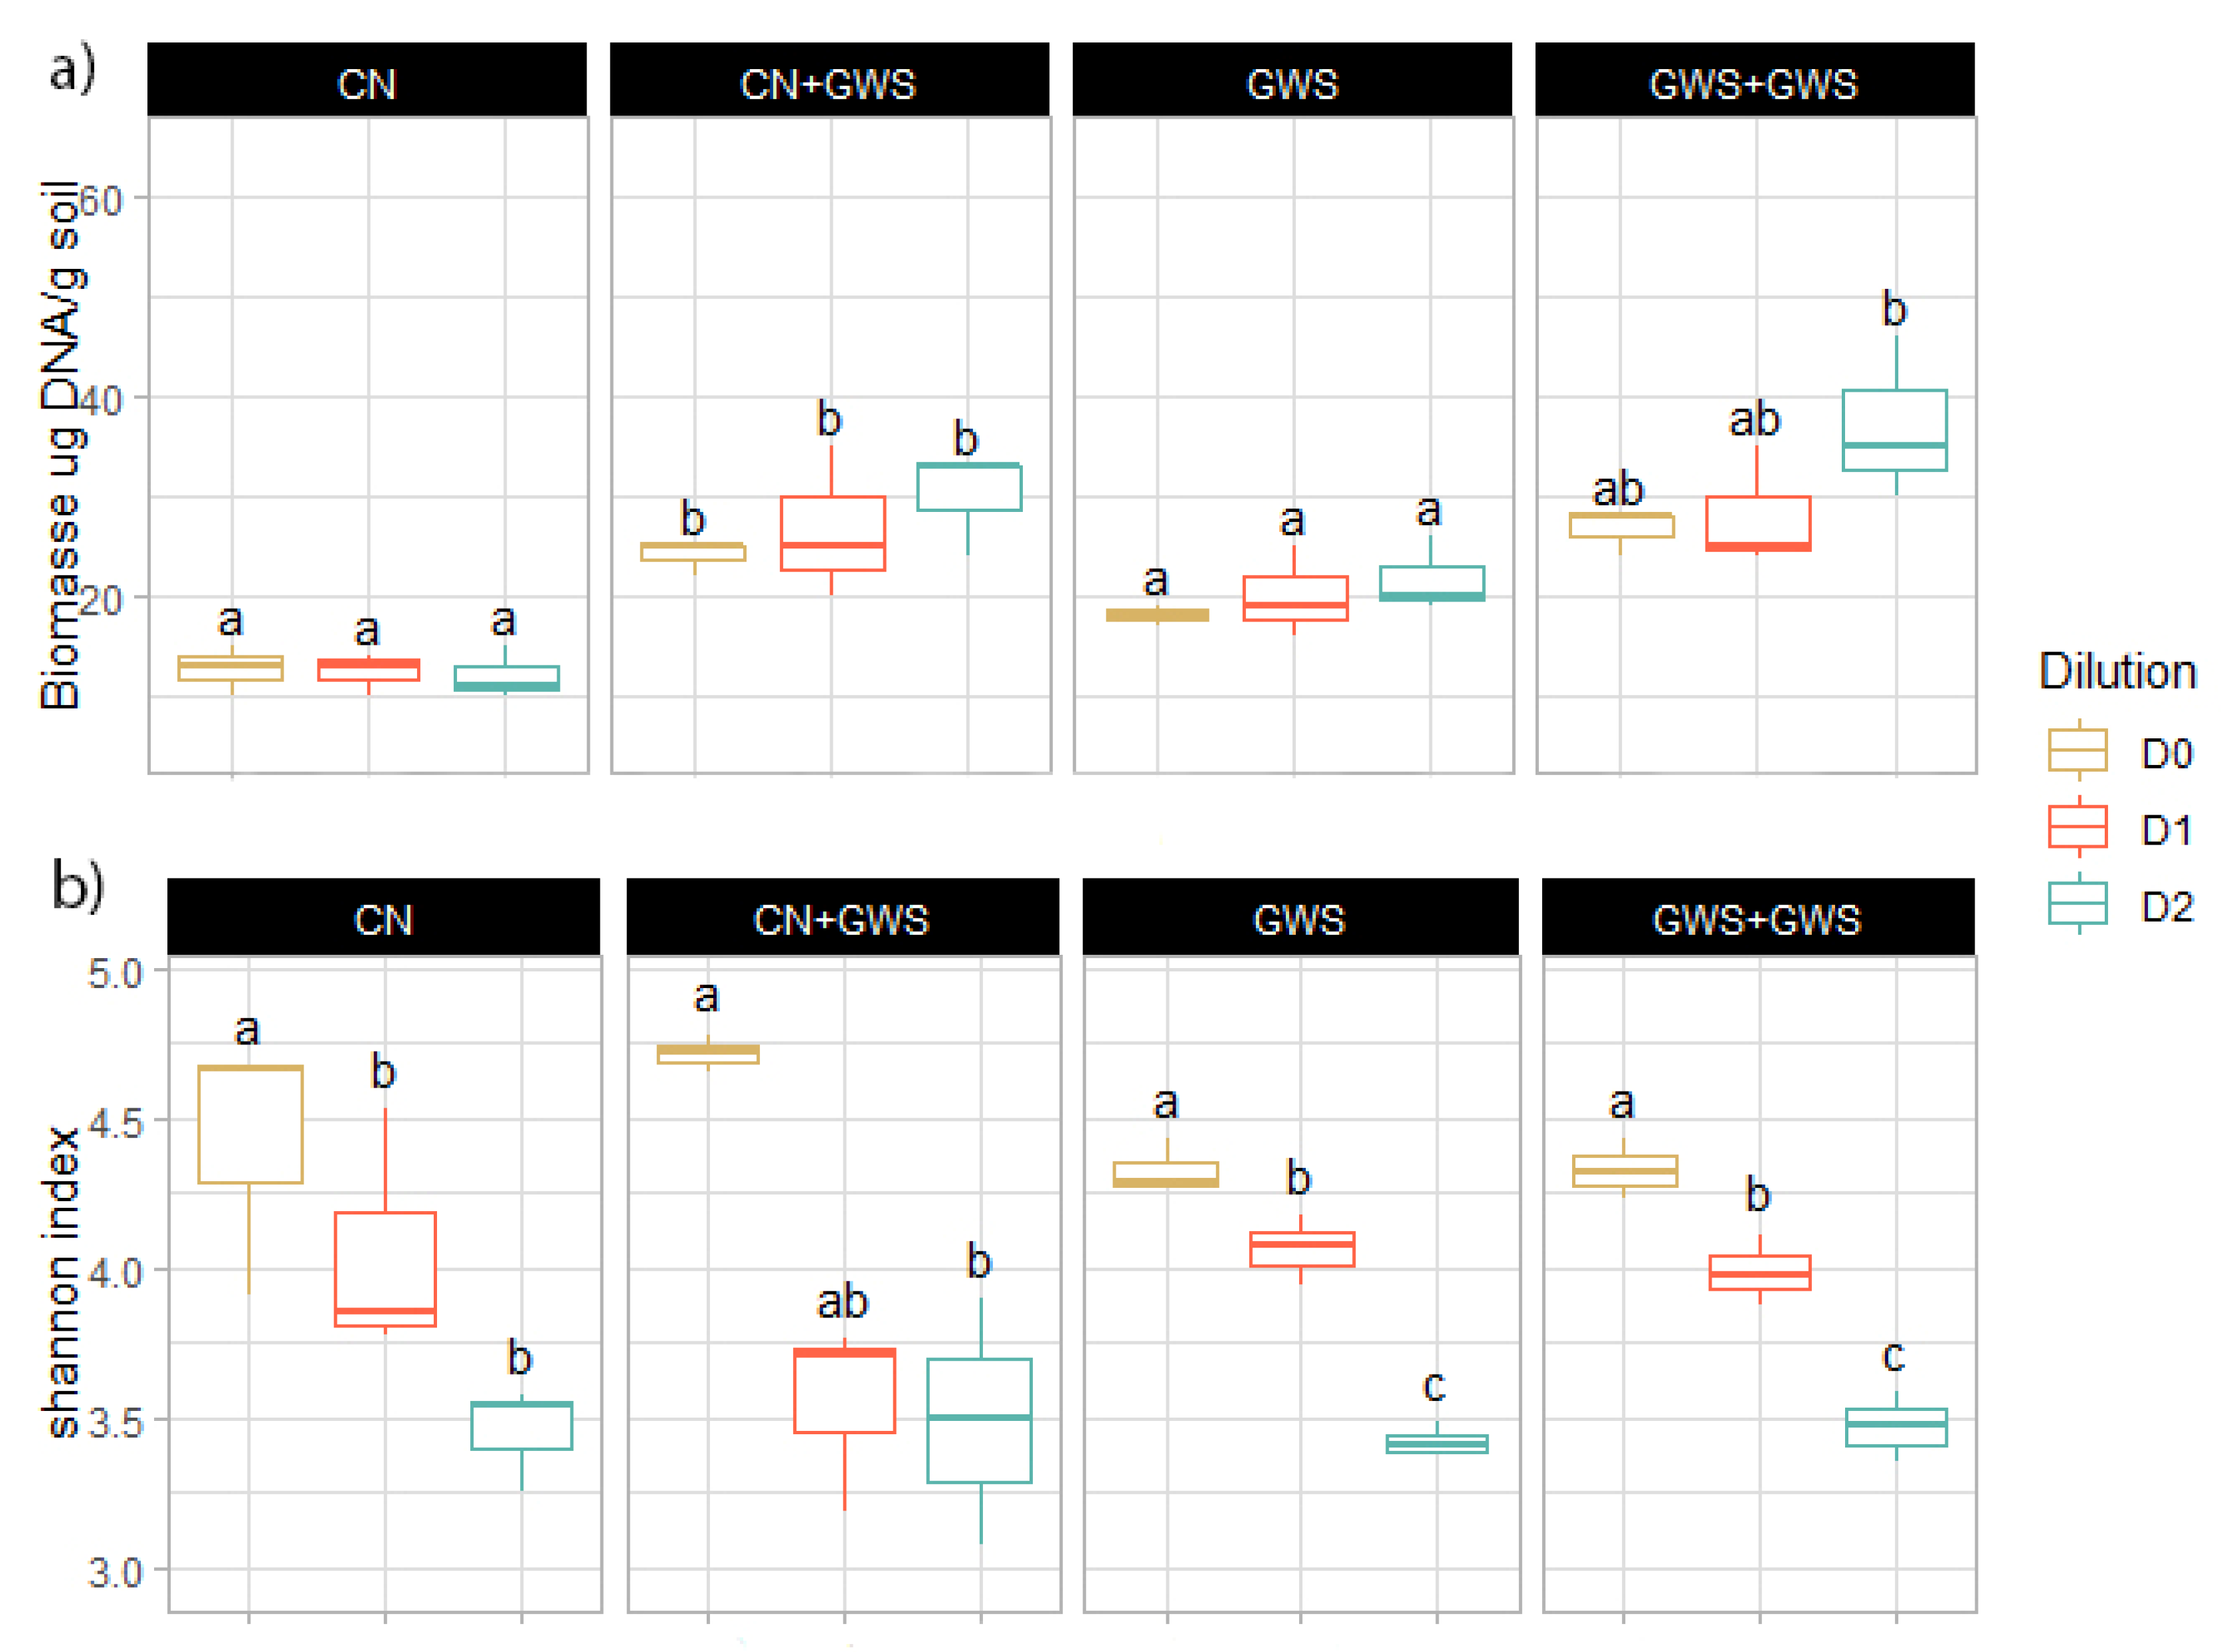
3.1. Microbial Biomass and Diversity

After six weeks of incubation, microbial biomass, as expected, was not significantly different among the three different microbial diversity levels (Figure 2a). Furthermore, samples that received the GWS amendment had biomass significantly higher compared to samples that did not receive the GWS amendment. This was particularly true for the CN soil type. The Shannon index showed a significant decrease along with the different microbial diversity levels (p value < 0.05) (Figure 2b). The Shannon index and the microbial biomass results confirmed the efficiency of the microbial diversity manipulation (Figure 2).

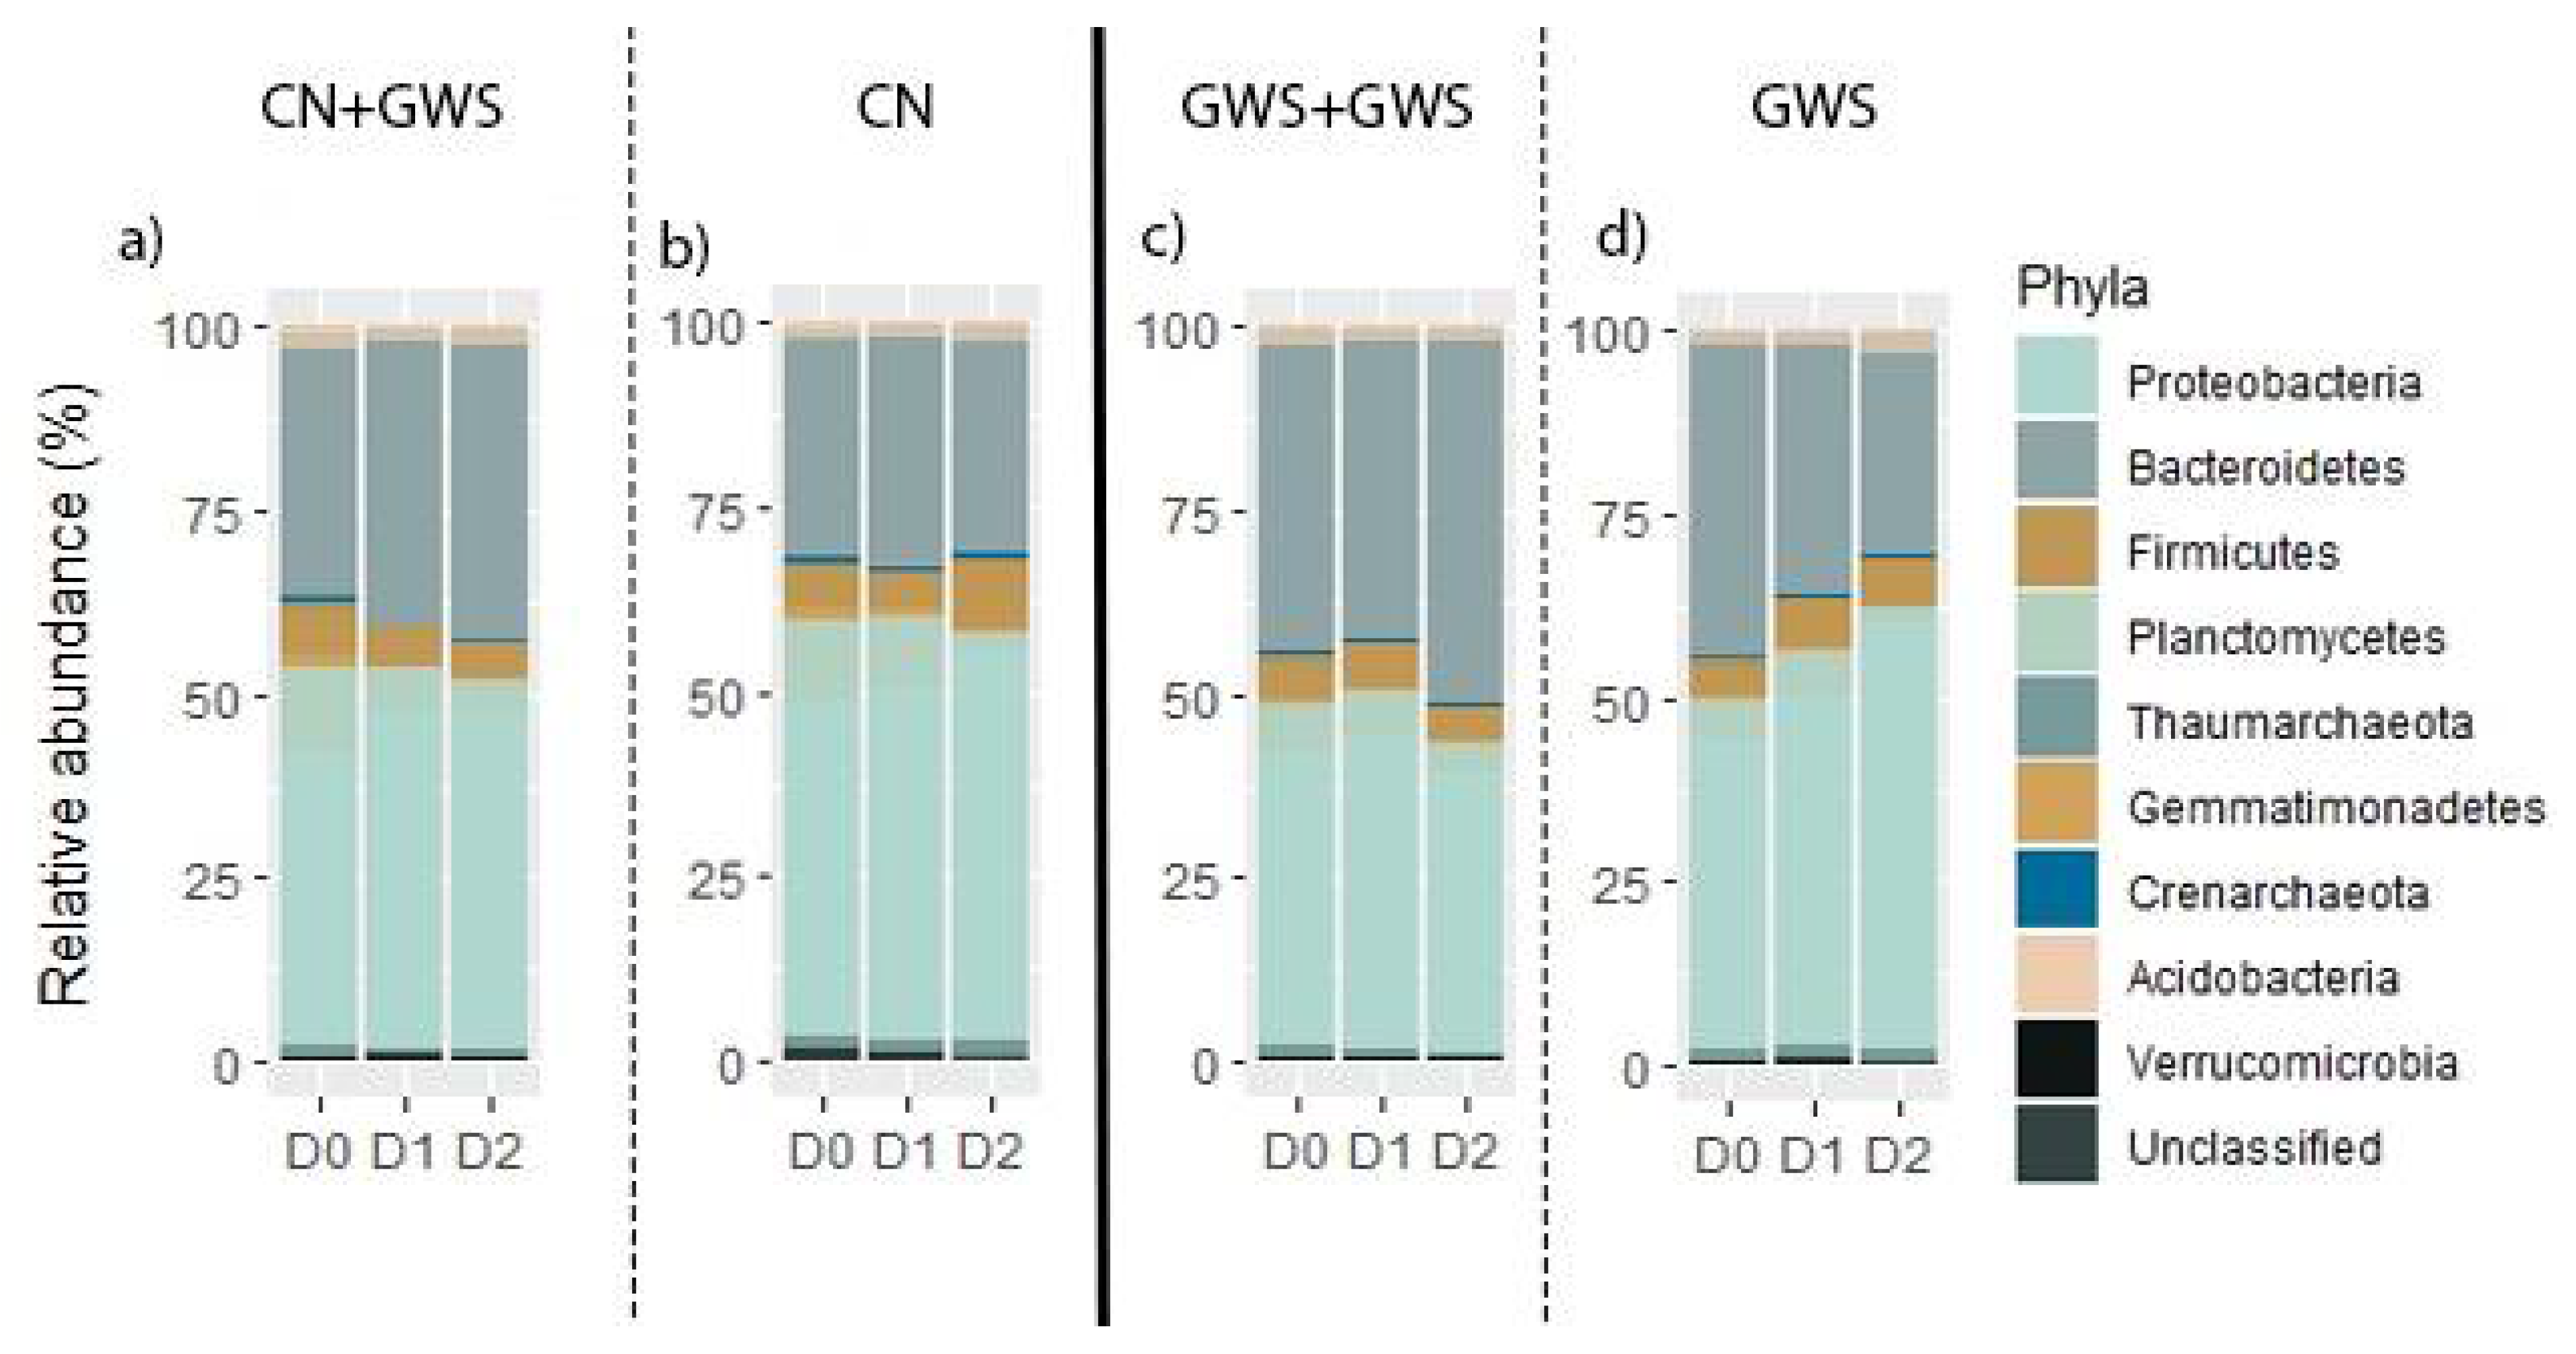
3.2. Prokaryotic Relative Abundance

The colonization from the different phyla within the microcosms showed a shift in the microbial community composition when the GWS was incorporated in both soil types (CN and GWS) (Figure 3). According to the Tukey test, this shift was statistically different in the microcosms D2 for Bacteroidetes and Proteobacteria phyla. The relative abundance of the Bacteroidetes statistically increased in sample D2, passing from 27% in sample D2-GWS to 49% in samples D2-GWS+GWS. For CN soil, the relative abundance of the Bacteroidetes in samples D2 was around 28%, while for D2-CN+GWS samples, the relative abundance increased up to 40%. Proteobacteria relative abundance statistically decreased in the high microbial dilution levels (D2) for samples CN+GWS (45%) and samples GWS+GWS (49%) compared to the relative abundance recorded in D2 CN (53%) and D2 GWS (58%), respectively. Furthermore, a higher presence of Bacteroidetes was found in CN+GWS and GWS+GWS than in CN and GWS, respectively, for all the dilution levels. Firmicutes phylum decreased in samples that were amended with the fresh GWS amendment. For the other phyla, no statistical shifts concerning the microbial relative abundance were reported after the addition of GWS amendment. The prokaryotic structure shift caused by the OWPs amendment was confirmed by PCA (Figures S1 and S2).

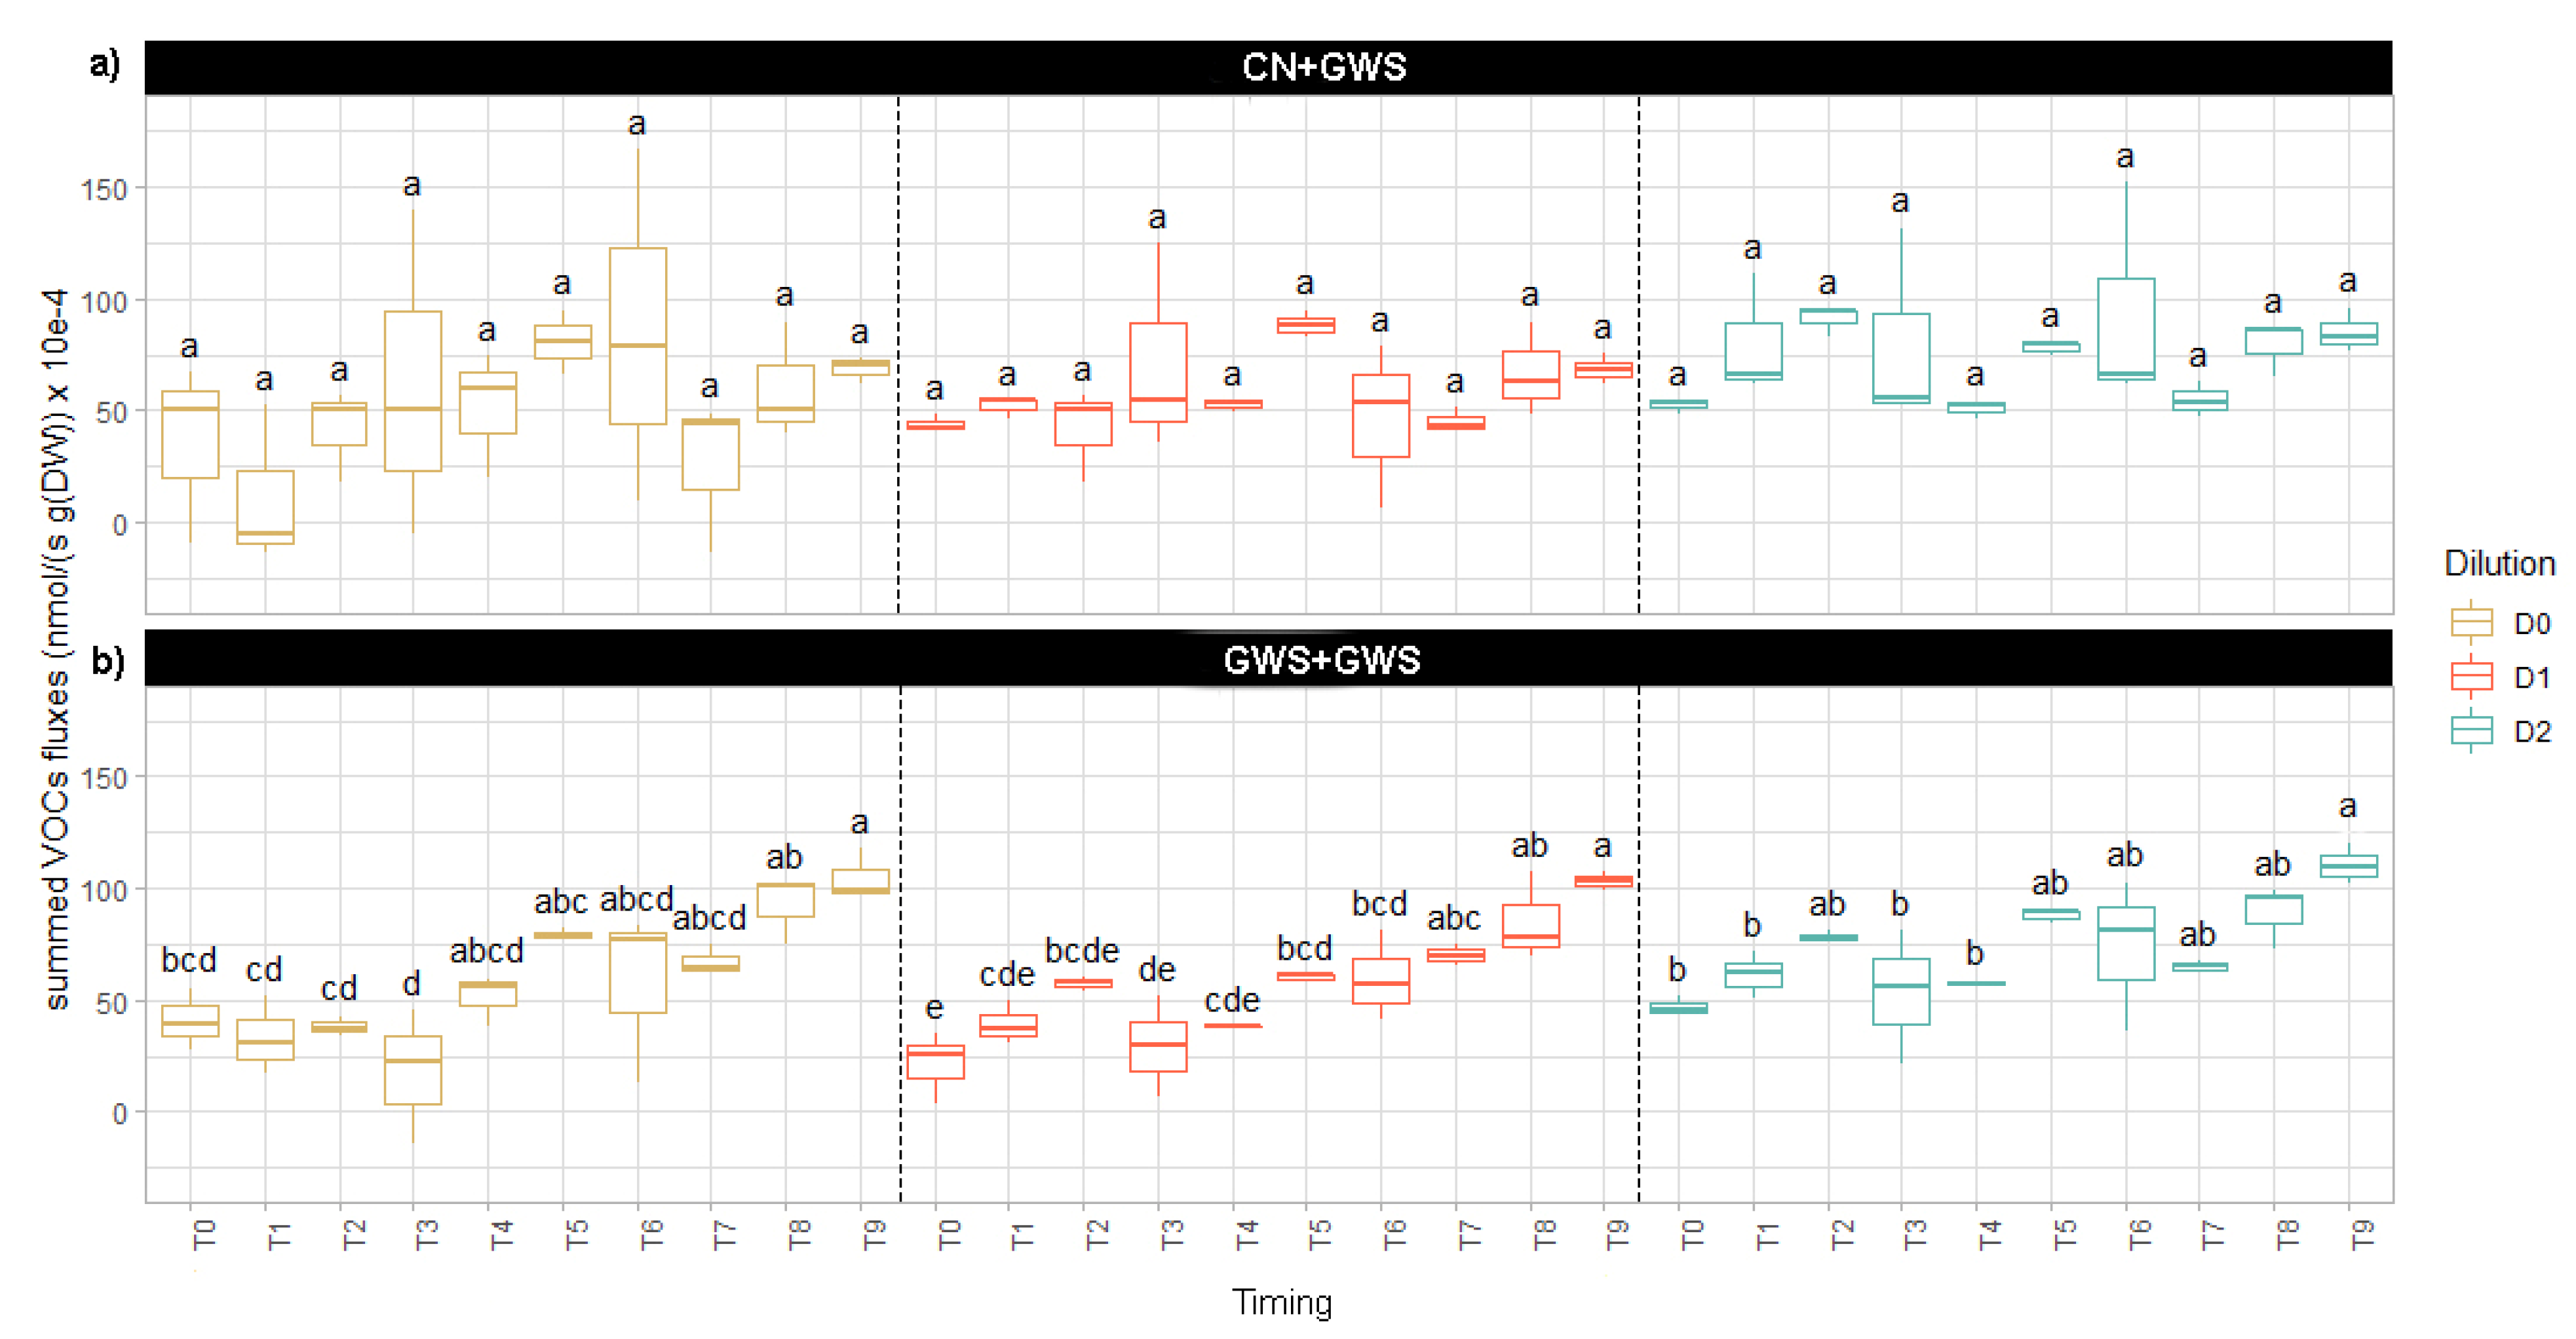
3.3. VOC Emissions from the Microcosms

According to an ANOVA and the post-hoc Tukey test, no difference on the cumulated summed VOC fluxes 49 h after the GWS amendment was found comparing the three dilution levels for GWS+GWS samples. A statistical difference was, however, observed between the D0 and D2 summed VOCs emissions for CN+GWS samples (Figure 4).
We further measured a statistical increase in summed VOC emissions during the two days (from T0 to T9) following amendment for GWS+GWS (Figure 5), (Tukey test, p-value < 0.05), while it remained almost constant for CN+GWS among the dilution levels from T0 to T9 (Figure 5). The statistical increase of the summed VOC emissions for samples GWS+GWS was true for all the microbial dilution levels from T0 to T9.
The individual correlation between the VOC and the phylum abundance (Figure 6) in GWS samples showed that phyla that were positively correlated with the VOC emissions before the GWS fresh amendment (GWS_T0), such as Firmicutes, Proteobacteria, and Crenarchaeota, changed their trend two days after the GWS addition (GWS+GWS_T9), becoming negatively correlated with the VOC emissions. Other phyla, such as Bacteroidetes, TM6, and Verrucomicrobia, were negatively correlated with the VOC emissions before the GSW fresh amendment (GWS_T0) and become positively correlated two days after the amendment (GWS+GWS_T9). This trend is true for all the masses except for the mass 48.0509 m/z, which has been tentatively identified as CH5NO. For this mass, the emission trend seems to be the opposite compared to the other VOCs for almost all phyla. Actinobacteria were positively correlated in samples GWS_T0 and showed no correlation with VOC emissions in samples GWS+GWS_T9. For the CN samples, the correlation between VOC and phyla reported changes from before (CN_T0) and after the amendment (CN+GWS_T9) for Verrucomicrobia, Thaurmachaeota, Crenarchaeota, and Firmicutes phyla (Figure 7). Verrucomicrobia and Thaurmachaeota were positively correlated with the VOC emissions before the GSW fresh amendment (CN_T0) and became negatively correlated two days after the amendment (CN+GWS_T9). Crenarchaeota and Firmicutes were negatively correlated with the VOC emissions before the GSW fresh amendment (CN_T0) and became positively correlated two days after the amendment (CN+GWS_T9). As for the GWS samples, masses 48.0509 m/z and 48.0515 m/z show an opposite trend compared to the other VOCs emitted.
The PCA (Figure 8) shows the differences in the VOC emissions profiles due to the fresh addition of GWS. Sample emissions profiles are similar for samples that received fresh GWS amendment (CN+GWS_T9 and GWS+GWS_T9). CN_T0 and GWS_T0 samples have similar VOC emissions profiles and very different profiles from the samples that received fresh GWS amendment. The 20 most emitted compounds for each type of sample, reported in Tables S1–S4, were similar for all the soil samples. The three most emitted compounds were 121.0983 m/z, 93.0682 m/z, and 107.0872 m/z.

4. Discussion

4.1. Microbial Diversity Manipulation

The microbial biomass was constant among the three different dilution levels, indicating that after 6 weeks of incubation, the microbial biomass was not affected by the dilution diversity manipulation performed (Figure 2a). The Shannon index, calculated for CN, GWS, and CN+GWS, and GWS+GWS, indicated a decrease of the microbial diversity in the higher dilution level for all samples (Figure 2b). Thus, the Shannon index confirmed successful microbial diversity dilution, which was even increased following GWS amendment. Similar results have been reported also by Abis et al. (2020) [15]. The difference in the microbial structure leading to the loss of microbial diversity is driven by r-strategist microorganisms such as Proteobacteria, Bacteroidetes, and Firmicutes phyla [21,27]. R-strategist microorganisms are known as pioneer species able to colonize a substrate after a perturbation faster than microorganisms with slower growth (K-strategist microorganisms) [21,22,27,28]. D2 samples always reported an increase in the relative abundance of the r-strategist phyla compared to the D0 samples; thus, the reduced competition in D2 samples favored the growth of Proteobacteria, Bacteroidetes, and Firmicutes phyla, reducing the diversity in the D2 samples.

4.2. Effect of the GWS Amendment on the Microbial Community

Our results highlighted that GWS amendment induced, after 49 h of incubation, an increase of soil microbial biomass, particularly in soil that had never received GWS before (CN). Previous soil incubation studies had already reported a microbial biomass increase 10 days after the addition of OWP [11,17]. However, the difference of results obtained between CN and GWS soils could be explained by the native soil organic matter content, which was lower before the incubation in CN (16.20 g/kg) than in GWS (26.33 g/kg) soil. Indeed, as reported by Yanardag et al. (2017) [29], native soil organic matter affects the microbial community response to external inputs, and thus, soils with lower organic matter are more inclined to increase microbial biomass and change the structure of the microbial community.
The results concerning the soil’s prokaryotic composition showed that Bacteroidetes phylum took advantage of the addition of the fresh GWS amendment whatever the history of the soil (CN and GWS soils). This result is in line with Simmons et al. (2014) [30], which reported an increase of the Bacteroidetes phylum in soil amended with organic amendment compared to soil that did not receive any organic amendment. Lupwayi et al. (2018) [31] explained that the relative abundance of Bacteroidetes increased linearly with increasing N rate. Since GWS is a source of N (see Table 2), we can hypothesize that the increase of the Bacteroidetes’ relative abundance might be due to the increase of the N content in the microcosms.
Results concerning Proteobacteria showed that it was the most dominant phylum in all the microcosms and as suggested by Kuppusamy et al. (2016) [32], this might be because functionally diverse groups of bacteria fall within this phylum. We also found that Proteobacteria decreased in the sample that received fresh GWS amendment. Bastida et al. (2015) [33] reported that the abundance of Proteobacteria was higher in compost-treated samples than in sludge-treated samples. Since our samples have been amended with GWS amendment that contains 30% sludge, the development of the Proteobacteria might have been negatively influenced by the type of substrate added. Furthermore, Bello et al. (2020) [34] reported a negative correlation between Proteobacteria abundance and N content. Since the GWS amendment increases the N content in soil [24,31], this might be another reason for the Proteobacteria relative abundance decrease in soil that received fresh GWS amendment. However, in samples not receiving the fresh GWS amendment (CN and GWS), Proteobacteria increased their relative abundance among the dilution levels, which suggests that Proteobacteria are great colonizers when conditions, due to low competitive substrates, give them advantages and when N content is low [21,24,27,31,35].
Previous studies showed that carbon additions appear to strongly stimulate organisms within the Firmicutes clades [31,35]. The increased abundance of organisms within the Firmicutes phylum suggested that members of this phyla (i.e., Bacillus sp., Lactobacillus agilis, Streptococcus, Saccharococcus thermophylus) promptly react to the organic matter added to the soil, and as a consequence, soil respiration rapidly increases [31,35]. This was not observed in the present study, where Firmicutes phyla decreased after the fresh GWS addition, which increases the C content in the soil. The difference of results observed could be due to the substrate, where the toxicity of the VOC released from the GWS itself or other competitive phyla would have a negative impact on this phylum. The authors of [31,36] reported that soil amended with green waste released benzaldehyde, which is a known harmful compound for the growth of the Firmicutes [32,37]. In this study, benzaldehyde was detected as one of the 20 most emitted compounds (Tables S1–S4). Benzaldehyde was emitted the most in CN+GWS D2 samples where we reported the lowest relative abundance of Firmicutes. Figure 6 and Figure 7 shows that Firmicutes phylum has a positive correlation with VOC emissions before the addition of the GWS, while, after the GWS addition, the correlation with VOC emissions is negative. This is true for both soil types, CN and GWS. It is known that organic amendment induces enzymatic changes affecting nutrient cycles involving microorganisms [33,38] and inducing the interruption of microbial communication (intra- and inter-species) through hydrolysis and sorption signaling molecules [34,39], and those mechanisms might have changed the correlation of the Firmicutes with the VOC emissions in this study.

4.3. Effect of the GWS Amendment on the Summed VOC Emissions

The VOC detection from the microcosms was performed 10 times during 49 h. Summed VOC emissions of the GWS+GWS samples constantly increased during the incubation hours for all the microbial dilution levels (Figure 5), whereas no difference between the summed VOC emissions was reported when comparing different microbial dilution levels (Figure 4). Summed VOC emissions doubled during the 49 h for the samples GWS+GWS. For the CN+GWS samples, statistical differences on the cumulated summed VOC emissions after the GWS amendment are reported (Figure 4), while no differences on the summed VOC emissions are reported from T0 (before the addition of the fresh GWS) and T9 (49 h after the addition of the GWS amendment) for every microbial dilution level (Figure 5). In a previous work on similar soil samples, it was reported that the larger the organic content in the soil was, the larger were the VOC emissions [13]. Abis et al. (2018) [13] further reported larger VOC summed emissions in soil samples receiving GWS amendment than in soil that never received GWS amendments. Those results are in line with the results of this study, since CN samples have a lower organic matter content with a lower VOC summed emissions rate compared to GWS samples. This was in accordance also with a previous study highlighting that soils harboring distinct microbial community structures, as is the case of the GWS and CN samples, responded differently to OWP amendment, leading to different patterns and rates of greenhouse gas emissions [11]. Furthermore, Kästner and Mahro (1996) [40] highlighted the importance of the microorganisms already present in the compost, which increased the degradation efficiency in soil. The different degradation efficiency due to the different microbial communities in the soil might increase the VOC emissions in samples already used to degrading the GWS.
The most abundant phyla in the microcosm are known to take advantage not only of the addition of the fresh GWS (i.e., Bacteroidetes phylum) [36,41] but also of the type of VOC emitted (i.e., Proteobacteria, Firmicutes) [36,41], using them as carbon sources and thus reducing the emissions [37,42]. The relative abundance of those phyla is greater in samples GWS+GWS than in CN+GWS samples. In GWS+GWS, we reported an increase of the summed VOC emission along with the microbial dilution level over time. Similar results have been reported also by Abis et al. (2020) [15], confirming the trend that when the microbial diversity is reduced in soil samples, the emissions are increased. From this previous study, we added new evidence that the addition of GWS in samples used to receiving GWS amendment quickly increase VOC emissions, while for samples not used to receiving GWS amendment (CN samples), VOC emissions did not increase after 49 h incubation, but only increased when the microbial diversity was lower. These results underline the importance of the VOC emissions detection from different soils to predict the effect of the microbial community after a perturbation and the possible consequences of the VOC emissions. The samples GWS+GWS doubled their VOC emissions after the GWS addition, passing from an average of 48 nmol s−1 g−1 (DW) × 10−4 to 100 nmol s−1 g−1 (DW) × 10−4. Furthermore, this study adds evidence that the effect of repeated perturbation (i.e., soil used to receiving GWS applications) on the summed VOC is stronger than the effect of the microbial diversity dilution (Figure 4); in fact, no statistical differences were reported between the summed VOC of the microbial diversity dilution levels after the GWS addition on GWS samples. Furthermore, repeated applications of GWS amendment changed the soil properties compared to soil that never received any organic amendment (see Table 1), leading to higher pH value and organic matter content in soil used to receiving GWS amendment. The organic matter content and the pH were found to be positively correlated with the VOC summed emission [13,22]. In this study, GWS samples reported a higher pH and organic matter content. We can hypothesize that the physio-chemical properties of the soil also played an important role on the GWS+GWS summed VOC emissions.

4.4. Prokaryotic VOC Emissions Profile Evolution after the Fresh GWS Amendment

Organic amendment inputs in soils can change VOC emissions profiles, and those emissions differ with the type of organic amendment in soil [12,13]. The GWS amendment has a specific emissions profile that differs from other organic amendments [13]. These differences in the soil emissions can be due to the shift in the microbial structure after the GWS addition [11,12]. It is known that starting from the third day after the organic amendment, VOC emissions from soil show significant changes [12]. In this study, we demonstrate that changes in the VOC emissions can be detected right after the GWS amendment. We detected changes in quantity and quality of VOC emissions profiles starting from 1 h after the addition of fresh GWS. The difference between VOC emission profiles of samples that did not receive any organic input and samples that received the fresh GWS amendment was stronger after 49 h from the fresh addition (Figure 8). At the same time, the most important changes in the microbial community in soil happen within three days after the organic amendments [4]. We could thus hypothesize that the changes in the microbial community are strongly related to the changes in the VOC emissions profiles. Figure 6 and Figure 7 reported several differences in the VOC emission–phylum abundance correlation. Firmicutes, Proteobacteria, Actinobacteria, and Crenarchaeota were positively correlated with the VOCs, probably because the VOC were promoting their growth or they were directly producing the VOCs [15]. After 49 h, those phyla that were positively correlated with the VOC emissions decreased their relative abundance in the microcosms (Figure 3), probably penalized by the increased colonization of the Bacteroidetes phylum. Bactroidetes phylum was negative correlated with the VOC emission before the addition of the fresh GWS amendment, and they turned out to be positively correlated with the VOC emission 49 h after the fresh addition of the GWS amendment. At the same time, Bacteroidetes’ relative abundance increased after fresh GWS addition. We can hypothesize that the increased abundance of the Bacteroidetes phylum led to larger VOC emissions from this phylum, whereas the competition would have affected the phyla that are negatively correlated with the VOC emissions.

4.5. Metabolic Pathways of the Most Emitted VOCs

The three most emitted VOCs from all the samples were the mass 121.09, tentatively identified as propylbenzene, cumene, mesytilene, 1,3,5, trimethybenzene or phenilacetaldheyde; mass 93.06, tentatively identified as toluene; and mass 107.08, tentatively identified as ethylbenzene, which in total contributed to 70% of the summed VOC emissions. These compounds can be classified as aromatic. Microorganisms emit aromatic compounds through the shikimate pathway, which is responsible for amino acid production [43]. Toluene has been already detected by other studies performed on soil receiving organic amendment [16,39,44]. In this study, toluene contributed up to 50% of the total VOC emissions, while in the other studies, it contributed up to 1.2%. The results from this study do not allow us to understand the mechanisms behind these emissions; however, we can hypothesize that part of the toluene emissions are released by the GWS amendment itself, since other studies have reported toluene emissions from green and sludge composts [39,45]. Microorganisms are known to degrade aromatic compounds such as benzene and toluene [46]. For this reason, right after the addition of the GWS amendment, we detected a higher toluene emission rate compared to the other studies where the VOC emissions were detected 1 and 2 years after the amendment. Within this period, microorganisms could have progressively degraded the aromatic compounds.

5. Conclusions

The most important shift in the microbial community happens within three days from the addition of any organic amendment. The changes in the microbial community and diversity are known to affect the VOC emissions. For those reasons, this work aimed to characterize in terms of VOC emissions and microbial structure the effect of GWS amendment on soil samples used to receiving GWS amendment and soils that did not receive any organic input with different microbial diversity levels. This work was focused on the short-term period following amendment (49 h). Our results show that the GWS amendment boosted Bacteroidetes growth while penalizing Proteobacteria, most probably because of the increased N content brought by the fresh amendment. Furthermore, the amendment of fresh GWS in soils increased VOC emissions from soils used to receiving GWS amendments, but not from soils that never received organic input. We hypothesize that the microbial community in soils historically receiving GWS was more efficient for degrading new organic inputs compared to soils that never received GWS.
This study also demonstrated how the microbial community composition and the VOC emissions are strongly correlated. Several phyla such as Firmicutes, Proteobacteria, Actinobacteria, and Crenarchaeota were found to be positively correlated with VOC emissions before GWS amendments, whereas two days after the amendment, these correlations were found to be negative. For phyla such as Bacteroidetes, TM6, and Verrucomicrobia, opposite correlations were found. These results showed how the shift in the microbial community structure also changes the balance of emitted VOC. Correlations between emitted VOC and microbial relative abundance are representative of several biological mechanisms already summarized by Abis et al. (2020) [15]. In this study, we further show that the organic input leads to a short-term change of the microbial community that leads to changes in quantity and profile of emitted VOC from soils.

Supplementary Materials

The following are available online at https://0-www-mdpi-com.brum.beds.ac.uk/article/10.3390/applmicrobiol1010010/s1, Figure S1: Comparison of the microbial structure before (CN samples) and after GWS amendment (CN+GWS). (a) Microbial community structure of CN samples. (b) Microbial structure for the CN+GWS. D0 = microbial dilution diversity equal to 1, D1 = microbial dilution diversity equal to 10-3, D2 = microbial dilution diversity equal to 10−5. Figure S2: Comparison of the microbial structure before (GWS samples) and after GWS amendment (GWS+GWS). (a) Microbial community structure of GWS samples. (b) Microbial structure for the GWS+GWS. D0 = microbial dilution diversity equal to 1, D1 = microbial dilution diversity equal to 10−3, D2 = microbial dilution diversity equal to 10−5. Table S1. Type of samples and perform analysis. CN = control without organic inputs, CN+GWS = control without organic input with the addition of GWS amendment, GWS = green waste and sludge samples, GWS+GWS = green waste and sludge samples with the addition. Table S2. List of the 20 most emitted compound before the amendment with fresh GWS on CN soil samples, ND = not detected. Table S3. List of the 20 most emitted compound 49 h after the amendment with fresh GWS on CN soil samples. Table S4. List of the 20 most emitted compound before the amendment with fresh GWS on GWS soil samples. Table S5. List of the 20 most emitted compound 49 h after the amendment with fresh GWS on GWS soil samples.

Author Contributions

Conceptualization, L.A., R.C., P.A.M. and B.L. (Benjamin Loubet); data curation, L.A. and B.L. (Benjamin Lebrun); formal analysis, L.A.; funding acquisition, S.S.-B. and B.L. (Benjamin Loubet); investigation, R.C. and F.L.; methodology, S.S.-B., V.N., J.T., S.H., F.L. and B.L. (Benjamin Loubet); project administration, S.S.-B. and B.L. (Benjamin Loubet); supervision, B.L. (Benjamin Loubet); writing—original draft, L.A.; writing—review and editing, L.A., S.S.-B., R.C., S.H. and B.L. (Benjamin Loubet). All authors have read and agreed to the published version of the manuscript.

Funding

ANAEE-France provided the PTR-QiTOF-MS, ADEME partially funded this study through the projects COV3ER (n°1562C0032) and DICOV (n°1662C0020).

Data Availability Statement

Not applicable.

Acknowledgments

We gratefully acknowledge the QualiAgro site conducted in partnership with Veolia forms part of the SOERE-PRO, integrated as a service of the infrastructure AnaEE-France, overseen by the French National Research Agency (ANR-11-INBS-0001). The QualiAgro field experiment forms part of the SOERE-PRO (network of long-term experiments dedicated to the study of impacts of organic waste product recycling) certified by ALLENVI (Alliance Nationale de Recherche pour l’Environnement).

Conflicts of Interest

The authors declare no conflict of interest.

References

  1. Chan, K.Y.; Heenan, D.P.; Oates, A. Soil Carbon Fractions and Relationship to Soil Quality under Different Tillage and Stubble Management. Soil Tillage Res. 2002, 63, 133–139. [Google Scholar] [CrossRef]
  2. Chalhoub, M.; Garnier, P.; Coquet, Y.; Mary, B.; Lafolie, F.; Houot, S. Increased Nitrogen Availability in Soil after Repeated Compost Applications: Use of the PASTIS Model to Separate Short and Long-Term Effects. Soil Biol. Biochem. 2013, 65, 144–157. [Google Scholar] [CrossRef] [Green Version]
  3. Blagodatskaya, E.V.; Blagodatsky, S.A.; Anderson, T.-H.; Kuzyakov, Y. Priming Effects in Chernozem Induced by Glucose and N in Relation to Microbial Growth Strategies. Appl. Soil Ecol. 2007, 37, 95–105. [Google Scholar] [CrossRef]
  4. Federici, E.; Massaccesi, L.; Pezzolla, D.; Fidati, L.; Montalbani, E.; Proietti, P.; Nasini, L.; Regni, L.; Scargetta, S.; Gigliotti, G. Short-Term Modifications of Soil Microbial Community Structure and Soluble Organic Matter Chemical Composition Following Amendment with Different Solid Olive Mill Waste and Their Derived Composts. Appl. Soil Ecol. 2017, 119, 234–241. [Google Scholar] [CrossRef]
  5. Sadet-Bourgeteau, S.; Houot, S.; Dequiedt, S.; Nowak, V.; Tardy, V.; Terrat, S.; Montenach, D.; Mercier, V.; Karimi, B.; Chemidlin Prévost-Bouré, N.; et al. Lasting Effect of Repeated Application of Organic Waste Products on Microbial Communities in Arable Soils. Appl. Soil Ecol. 2018, 125, 278–287. [Google Scholar] [CrossRef]
  6. Obriot, F.; Stauffer, M.; Goubard, Y.; Cheviron, N.; Pérès, G.; Eden, M.; Revallier, A.; Vieublé Gonod, L.; HOUOT, S. Multi-Criteria Indices to Evaluate the Effects of Repeated Organic Amendment Applications on Soil and Crop Quality. Agric. Ecosyst. Environ. 2016, 232, 165–178. [Google Scholar] [CrossRef]
  7. Khalil, A.; Hassouna, S.; Ashqar, H.; Al-Absi, M. Changes in Physical, Chemical and Microbial Parameters during the Composting of Municipal Sewage Sludge. World J. Microbiol. Biotechnol. 2011, 27, 2359–2369. [Google Scholar] [CrossRef]
  8. Clark, C.M.; Cleland, E.E.; Collins, S.L.; Fargione, J.E.; Gough, L.; Gross, K.L.; Pennings, S.C.; Suding, K.N.; Grace, J.B. Environmental and Plant Community Determinants of Species Loss Following Nitrogen Enrichment. Ecol. Lett. 2007, 10, 596–607. [Google Scholar] [CrossRef] [PubMed]
  9. Francioli, D.; Schulz, E.; Lentendu, G.; Wubet, T.; Buscot, F.; Reitz, T. Mineral vs. Organic Amendments: Microbial Community Structure, Activity and Abundance of Agriculturally Relevant Microbes Are Driven by Long-Term Fertilization Strategies. Front. Microbiol. 2016, 7. [Google Scholar] [CrossRef] [Green Version]
  10. Zhong, W.; Gu, T.; Wang, W.; Zhang, B.; Lin, X.; Huang, Q.; Shen, W. The Effects of Mineral Fertilizer and Organic Manure on Soil Microbial Community and Diversity. Plant Soil 2010, 326, 511–522. [Google Scholar] [CrossRef]
  11. Sadet-Bourgeteau, S.; Houot, S.; Karimi, B.; Mathieu, O.; Mercier, V.; Montenach, D.; Morvan, T.; Sappin-Didier, V.; Watteau, F.; Nowak, V.; et al. Microbial Communities from Different Soil Types Respond Differently to Organic Waste Input. Appl. Soil Ecol. 2019, 143, 70–79. [Google Scholar] [CrossRef]
  12. Potard, K.; Monard, C.; Le Garrec, J.-L.; Caudal, J.-P.; Le Bris, N.; Binet, F. Organic Amendment Practices as Possible Drivers of Biogenic Volatile Organic Compounds Emitted by Soils in Agrosystems. Agric. Ecosyst. Environ. 2017, 250, 25–36. [Google Scholar] [CrossRef]
  13. Abis, L.; Loubet, B.; Ciuraru, R.; Lafouge, F.; Dequiedt, S.; Houot, S.; Maron, P.A.; Bourgeteau-Sadet, S. Profiles of Volatile Organic Compound Emissions from Soils Amended with Organic Waste Products. Sci. Total Environ. 2018. [Google Scholar] [CrossRef]
  14. Monard, C.; Jeanneau, L.; Le Garrec, J.-L.; Le Bris, N.; Binet, F. Short-Term Effect of Pig Slurry and Its Digestate Application on Biochemical Properties of Soils and Emissions of Volatile Organic Compounds. Appl. Soil Ecol. 2020, 147, 103376. [Google Scholar] [CrossRef]
  15. Abis, L.; Loubet, B.; Ciuraru, R.; Lafouge, F.; Houot, S.; Nowak, V.; Tripied, J.; Dequiedt, S.; Maron, P.A.; Sadet-Bourgeteau, S. Reduced Microbial Diversity Induces Larger Volatile Organic Compound Emissions from Soils. Sci. Rep. 2020, 10, 6104. [Google Scholar] [CrossRef] [Green Version]
  16. Seewald, M.S.A.; Singer, W.; Knapp, B.A.; Franke-Whittle, I.H.; Hansel, A.; Insam, H. Substrate-Induced Volatile Organic Compound Emissions from Compost-Amended Soils. Biol Fertil Soils 2010, 46, 371–382. [Google Scholar] [CrossRef] [Green Version]
  17. Pezzolla, D.; Marconi, G.; Turchetti, B.; Zadra, C.; Agnelli, A.; Veronesi, F.; Onofri, A.; Benucci, G.M.N.; Buzzini, P.; Albertini, E.; et al. Influence of Exogenous Organic Matter on Prokaryotic and Eukaryotic Microbiota in an Agricultural Soil. A Multidisciplinary Approach. Soil Biol. Biochem. 2015, 82, 9–20. [Google Scholar] [CrossRef]
  18. Bachy, A.; Aubinet, M.; Schoon, N.; Amelynck, C.; Bodson, B.; Moureaux, C.; Heinesch, B. Are BVOC Exchanges in Agricultural Ecosystems Overestimated? Insights from Fluxes Measured in a Maize Field over a Whole Growing Season. Atmos. Chem. Phys. 2016, 16, 5343–5356. [Google Scholar] [CrossRef] [Green Version]
  19. Bachy, A.; Aubinet, M.; Amelynck, C.; Schoon, N.; Bodson, B.; Moureaux, C.; Delaplace, P.; De Ligne, A.; Heinesch, B. Methanol Exchange Dynamics between a Temperate Cropland Soil and the Atmosphere. Atmos. Environ. 2018, 176, 229–239. [Google Scholar] [CrossRef]
  20. Mancuso, S.; Taiti, C.; Bazihizina, N.; Costa, C.; Menesatti, P.; Giagnoni, L.; Arenella, M.; Nannipieri, P.; Renella, G. Soil Volatile Analysis by Proton Transfer Reaction-Time of Flight Mass Spectrometry (PTR-TOF-MS). Appl. Soil Ecol. 2015, 86, 182–191. [Google Scholar] [CrossRef]
  21. Isidorov, V.; Jdanova, M. Volatile Organic Compounds from Leaves Litter. Chemosphere 2002, 48, 975–979. [Google Scholar] [CrossRef]
  22. Asensio, D.; Peñuelas, J.; Filella, I.; Llusià, J. On-Line Screening of Soil VOCs Exchange Responses to Moisture, Temperature and Root Presence. Plant Soil 2007, 291, 249–261. [Google Scholar] [CrossRef]
  23. Brown, R.W.; Bull, I.D.; Journeaux, T.; Chadwick, D.R.; Jones, D.L. Volatile Organic Compounds (VOCs) Allow Sensitive Differentiation of Biological Soil Quality. Soil Biol. Biochem. 2021, 156, 108187. [Google Scholar] [CrossRef]
  24. Giagnoni, L.; Taiti, C.; León, P.; Costa, C.; Menesatti, P.; Espejo, R.; Gómez-Paccard, C.; Hontoria, C.; Vázquez, E.; Benito, M.; et al. Volatile Organic Compound Emission and Biochemical Properties of Degraded Ultisols Ameliorated by No Tillage and Liming. Pedosphere 2020, 30, 597–606. [Google Scholar] [CrossRef]
  25. Wertz, S.; Degrange, V.; Prosser, J.I.; Poly, F.; Commeaux, C.; Freitag, T.; Guillaumaud, N.; Roux, X.L. Maintenance of Soil Functioning Following Erosion of Microbial Diversity. Environ. Microbiol 2006, 8, 2162–2169. [Google Scholar] [CrossRef]
  26. Tardy, V.; Mathieu, O.; Lévêque, J.; Terrat, S.; Chabbi, A.; Lemanceau, P.; Ranjard, L.; Maron, P.-A. Stability of Soil Microbial Structure and Activity Depends on Microbial Diversity. Environ. Microbiol. Rep. 2014, 6, 173–183. [Google Scholar] [CrossRef] [PubMed]
  27. Fierer, N.; Bradford, M.A.; Jackson, R.B. Toward an Ecological Classification of Soil Bacteria. Ecology 2007, 88, 1354–1364. [Google Scholar] [CrossRef] [PubMed]
  28. Song, H.-K.; Song, W.; Kim, M.; Tripathi, B.M.; Kim, H.; Jablonski, P.; Adams, J.M. Bacterial Strategies along Nutrient and Time Gradients, Revealed by Metagenomic Analysis of Laboratory Microcosms. FEMS Microbiol. Ecol. 2017, 93. [Google Scholar] [CrossRef] [PubMed]
  29. Yanardağ, I.H.; Zornoza, R.; Bastida, F.; Büyükkiliç-Yanardağ, A.; García, C.; Faz, A.; Mermut, A.R. Native Soil Organic Matter Conditions the Response of Microbial Communities to Organic Inputs with Different Stability. Geoderma 2017, 295, 1–9. [Google Scholar] [CrossRef]
  30. Simmons, C.W.; Claypool, J.T.; Marshall, M.N.; Jabusch, L.K.; Reddy, A.P.; Simmons, B.A.; Singer, S.W.; Stapleton, J.J.; VanderGheynst, J.S. Characterization of Bacterial Communities in Solarized Soil Amended with Lignocellulosic Organic Matter. Appl. Soil Ecol. 2014, 73, 97–104. [Google Scholar] [CrossRef]
  31. Lupwayi, N.Z.; May, W.E.; Kanashiro, D.A.; Petri, R.M. Soil Bacterial Community Responses to Black Medic Cover Crop and Fertilizer N under No-Till. Appl. Soil Ecol. 2018, 124, 95–103. [Google Scholar] [CrossRef]
  32. Kuppusamy, S.; Thavamani, P.; Megharaj, M.; Venkateswarlu, K.; Lee, Y.B.; Naidu, R. Pyrosequencing Analysis of Bacterial Diversity in Soils Contaminated Long-Term with PAHs and Heavy Metals: Implications to Bioremediation. J. Hazard. Mater. 2016, 317, 169–179. [Google Scholar] [CrossRef]
  33. Bastida, F.; Selevsek, N.; Torres, I.F.; Hernández, T.; García, C. Soil Restoration with Organic Amendments: Linking Cellular Functionality and Ecosystem Processes. Sci. Rep. 2015, 5, 15550. [Google Scholar] [CrossRef] [PubMed] [Green Version]
  34. Bello, A.; Han, Y.; Zhu, H.; Deng, L.; Yang, W.; Meng, Q.; Sun, Y.; Egbeagu, U.U.; Sheng, S.; Wu, X.; et al. Microbial Community Composition, Co-Occurrence Network Pattern and Nitrogen Transformation Genera Response to Biochar Addition in Cattle Manure-Maize Straw Composting. Sci. Total Environ. 2020, 721, 137759. [Google Scholar] [CrossRef]
  35. Cleveland, C.C.; Nemergut, D.R.; Schmidt, S.K.; Townsend, A.R. Increases in Soil Respiration Following Labile Carbon Additions Linked to Rapid Shifts in Soil Microbial Community Composition. Biogeochemistry 2007, 82, 229–240. [Google Scholar] [CrossRef]
  36. Kumar, A.; Alaimo, C.P.; Horowitz, R.; Mitloehner, F.M.; Kleeman, M.J.; Green, P.G. Volatile Organic Compound Emissions from Green Waste Composting: Characterization and Ozone Formation. Atmos. Environ. 2011, 45, 1841–1848. [Google Scholar] [CrossRef]
  37. Tahir, H.A.S.; Gu, Q.; Wu, H.; Niu, Y.; Huo, R.; Gao, X. Bacillus Volatiles Adversely Affect the Physiology and Ultra-Structure of Ralstonia Solanacearum and Induce Systemic Resistance in Tobacco against Bacterial Wilt. Sci. Rep. 2017, 7, 40481. [Google Scholar] [CrossRef]
  38. Yang, C.; Qian, H.; Li, X.; Cheng, Y.; He, H.; Zeng, G.; Xi, J. Simultaneous Removal of Multicomponent VOCs in Biofilters. Trends Biotechnol. 2018, 36, 673–685. [Google Scholar] [CrossRef]
  39. Zhu, Y.; Zheng, G.; Gao, D.; Chen, T.; Wu, F.; Niu, M.; Zou, K. Odor Composition Analysis and Odor Indicator Selection during Sewage Sludge Composting. J. Air Waste Manag. Assoc. 2016, 66, 930–940. [Google Scholar] [CrossRef]
  40. Kästner, M.; Mahro, B. Microbial Degradation of Polycyclic Aromatic Hydrocarbons in Soils Affected by the Organic Matrix of Compost. Appl. Microbiol. Biotechnol. 1996, 44, 668–675. [Google Scholar] [CrossRef]
  41. Yuan, J.; Zhao, M.; Li, R.; Huang, Q.; Raza, W.; Rensing, C.; Shen, Q. Microbial Volatile Compounds Alter the Soil Microbial Community. Environ. Sci. Pollut. Res. 2017, 24, 22485–22493. [Google Scholar] [CrossRef]
  42. Owen, S.M.; Clark, S.; Pompe, M.; Semple, K.T. Biogenic Volatile Organic Compounds as Potential Carbon Sources for Microbial Communities in Soil from the Rhizosphere of Populus Tremula. FEMS Microbiol. Lett. 2007, 268, 34–39. [Google Scholar] [CrossRef] [PubMed] [Green Version]
  43. Floss, H.G. The Shikimate Pathway—An Overview. In The Shikimic Acid Pathway; Conn, E.E., Ed.; Recent Advances in Phytochemistry; Springer: Boston, MA, USA, 1986; pp. 13–55. ISBN 978-1-4684-8056-6. [Google Scholar]
  44. Ramirez, K.S.; Lauber, C.L.; Fierer, N. Microbial Consumption and Production of Volatile Organic Compounds at the Soil-Litter Interface. Biogeochemistry 2010, 99, 97–107. [Google Scholar] [CrossRef] [Green Version]
  45. El Fels, L.; Lemee, L.; Ambles, A.; Hafidi, M. Identification and Biotransformation of Lignin Compounds during Co-Composting of Sewage Sludge-Palm Tree Waste Using Pyrolysis-GC/MS. Int. Biodeterior. Biodegrad. 2014, 92, 26–35. [Google Scholar] [CrossRef]
  46. Ruiz, O.N.; Radwan, O.; Striebich, R.C. GC-MS Hydrocarbon Degradation Profile Data of Pseudomonas Frederiksbergensis SI8, a Bacterium Capable of Degrading Aromatics at Low Temperatures. Data Brief 2021, 35, 106864. [Google Scholar] [CrossRef]
Figure 1. Scheme of the experimental procedure.
Applmicrobiol 01 00010 g001
Figure 2. (a) Microbial biomass for the different dilution levels. (b) Shannon index of the prokaryotic diversity. Bold line = median, boxes = interquartile, whiskers = minimum and maximum. Letters represent the significant differences according to the Tukey test p-value > 0.05.
Applmicrobiol 01 00010 g002
Figure 3. The prokaryotic relative abundance of (a) CN+GWS = control without organic input and green waste and sludge amendment microcosms receiving a GWS amendment for the three dilution levels (b) CN = control without organic input and, (c) GWS+GWS = green waste and sludge receiving GWS amendment and (d) GWS = green waste and sludge for the three different microbial diversity levels.
Applmicrobiol 01 00010 g003
Figure 4. Cumulated summed VOCs fluxes 49 h after the GWS amendment per soil treatment and dilution rate. D0 = microbial diversity pure or 1, D1 = microbial dilution diversity equal to 10−3, D2 = microbial dilution diversity equal to 10−5. Black vertical bars = standard deviation, black points = outliers, bold line = median, boxes = interquartile. Letters represent the statistical differences according to a Tukey test.
Applmicrobiol 01 00010 g004
Figure 5. Summed VOC fluxes among the incubation hours after fresh amendment with GWS for the three microbial diversity levels and the two soils. (a) CN+GWS = control without organic input and green waste and sludge amendment (b) GWS+GWS = green waste and sludge receiving GWS amendment for the three different microbial diversity levels. D0 = microbial diversity equal to 1, D1 = microbial dilution diversity equal to 10−3, D2 = microbial dilution diversity equal to 10−5. Letters represent the statistical differences obtained by the Tukey test.
Applmicrobiol 01 00010 g005
Figure 6. Pearson correlation coefficients between VOC emission rates and phyla abundance for GWS samples. VOCs are named as ion mass-to-charge ratios (m/z). VOCs selected with the Boruta features selection method are shown. (a) GWS_T0 = green waste and sludge before receiving GWS amendment and (b) GWS+GWS_T9 = green waste and sludge 49 h after receiving GWS amendment for the three different microbial diversity levels.
Applmicrobiol 01 00010 g006
Figure 7. Pearson correlation coefficients between VOC emission rates and phyla abundance for CN samples. VOCs are named as ion mass-to-charge ratios (m/z). VOCs selected with the Boruta features selection method are shown. (a) CN_T0 = control without organic input and before receiving the GWS amendment (b) CN+GWS_T9 = control without organic input 49h after receiving GWS amendment for the three different microbial diversity levels.
Applmicrobiol 01 00010 g007
Figure 8. Effect of fresh GWS amendment on VOCs emissions by soil. The percentage of the variance explained by the first two components is shown on each axis. CN_T0 = soil samples that never received organic waste input before receiving fresh GWS amendment, CN+GWS_T9 = CN soil samples 49 h after receiving fresh GWS amendment, GWS_T0 = soil samples that received GWS amendment in the past before receiving fresh GWS amendment, GWS+GWS_T9 = GWS soil samples after receiving fresh GWS amendment. Arrows show the time shift of the pattern between T0 and T9.
Applmicrobiol 01 00010 g008
Table 1. Soil physico-chemical parameters of the control (CN) and amended (GWS) plots of Feucherolles long-term observatory.
Soil Characteristic and UnitCNGWS
Clay (<2 µm) g/kg199
Fine silt (2/20 µm) g/kg263
Coarse silt (20/20 µm) g/kg442
Fine sand (50/200 µm) g/kg87
Coarse sand (200/2000 µm) g/kg9
Organic Carbon g/kg9.3615.2
Total N g/kg0.921.55
C/N10.19.82
Organic Matter g/kg16.226.3
pH6.907.04
CEC cmol+/kg9.5211.3
P2O5 g/100 g0.060.21
Table 2. Main characteristics of the organic waste products used for the amendments. GWS = green waste and sludge. DM = dry matter.
GWS Characteristic and UnitValue
Dry Matter (DM)%67.2 ± 1.3
Organic Carbong kg−1 DM257 ± 2
Total Ng kg−1 DM22.5 ± 0.5
P2O5 (Olsen)g kg−1 DM0.8 ± 0.1
C/N 13.2 ± 0.5
pH (water) 7.7 ± 0.1
Molecular Biomassµg of DNA g−1 of soil54.9 ± 19.1
Publisher’s Note: MDPI stays neutral with regard to jurisdictional claims in published maps and institutional affiliations.

